Article

Monitoring Rainfed Alfalfa Growth in Semiarid Agrosystems Using Sentinel-2 Imagery

by
Andrés Echeverría
1,
Alejandro Urmeneta
2,
María González-Audícana
3 and
Esther M González
1,*
1
Department of Science, Institute for Multidisciplinary Research in Applied Biology—IMAB, Public University of Navarra, 31006 Pamplona, Spain
2
Information Center of Natural Park and Biosphere Reserve of Bardenas Reales, San Marcial 19, 31500 Tudela, Spain
3
Department of Engineering, Institute on Innovation and Sustainable Development in Food Chain—ISFOOD, Public University of Navarra, 31006 Pamplona, Spain
*
Author to whom correspondence should be addressed.
Remote Sens. 2021, 13(22), 4719; https://doi.org/10.3390/rs13224719
Submission received: 22 September 2021 / Revised: 10 November 2021 / Accepted: 19 November 2021 / Published: 22 November 2021
(This article belongs to the Special Issue Remote Sensing of Agro-Ecosystems)

Abstract

:
The aim of this study was to assess the utility of Sentinel-2 images in the monitoring of the fractional vegetation cover (FVC) of rainfed alfalfa in semiarid areas such as that of Bardenas Reales in Spain. FVC was sampled in situ using 1 m2 surfaces at 172 points inside 18 alfalfa fields from late spring to early summer in 2017 and 2018. Different vegetation indices derived from a series of Sentinel-2 images were calculated and were then correlated with the FVC measurements at the pixel and parcel levels using different types of equations. The results indicate that the normalized difference vegetation index (NDVI) and FVC were highly correlated at the parcel level (R2 = 0.712), whereas the correlation at the pixel level remained moderate across each of the years studied. Based on the findings, another 29 alfalfa plots (28 rainfed; 1 irrigated) were remotely monitored operationally for 3 years (2017–2019), revealing that location and weather conditions were strong determinants of alfalfa growth in Bardenas Reales. The results of this study indicate that Sentinel-2 imagery is a suitable tool for monitoring rainfed alfalfa pastures in semiarid areas, thus increasing the potential success of pasture management.

1. Introduction

Grain forage legumes are present in approximately 15% of the world’s cultivated land, and are one of the most important protein sources both in the human diet (33%) and animal feed [1]. Legumes in symbiosis with soil Rhizobium bacteria fix nitrogen, which naturally minimizes the use of mineral fertilizers, making legumes environmentally sustainable crops [2]. Among grain forage legumes, the perennial species, alfalfa (Medicago sativa), which is cultivated in more than 80 countries, accounting for 35 million hectares, is considered one of the most important foraged crops [3]. Compared with grain legumes, alfalfa is considered a drought-tolerant species [4]. As a temperate legume that usually grows in arid and semiarid regions, alfalfa can reach deep soils to obtain water through its well-developed root system [5,6]. In this context, Medicago species, such as alfalfa, have been promoted in countries, such as the United States, Canada, Australia, and New Zealand, in order to improve and reduce the feeding of herds in rainfed areas [7]. In Spain, several initiatives have been successfully conducted which extend alfalfa cultivation to large areas of arid and semiarid land for grazing use [8]. In 2016, the Governing Board of Bardenas Reales, a semiarid area (41.818 ha) in the north of Spain, aimed to explore the ecological utility of an alfalfa–wheat cropping system and the nutritional value of rainfed alfalfa as a perennial forage crop for seasonal sheep grazing. Thus, 28 plots (~48 ha extension) of this crop were sown in this territory.
The global crop yield is estimated to decrease by approximately 70% due to the fact of environmental stresses, with drought as the main environmental stress in agriculture [9]. Alfalfa can adapt to water-limited regions, but a water deficit negatively affects the productivity of this crop [10]. Hence, rainfed alfalfa monitoring at different times of its annual cycle is important for evaluating the possibilities of this crop in the Bardenas Reales area.
Fractional vegetation cover (FVC) is a useful indicator of crop growth status, representing the ratio of the vertical projected area of vegetation to the total surface area, and it is widely used to indirectly determine crop photosynthesis, transpiration, and water-use efficiency.
Traditionally, in situ field inspections are the method used to estimate the FVC of a crop and to analyze its growth [11], which are time consuming and expensive [12]. Remote sensing has proven to be an effective tool for monitoring the growth of crops both spatially and temporally (or for monitoring the growth of crops during cultivation campaigns) [12]. Over the last few years, the availability of high spatial and temporal resolution satellite images has increased, which makes it possible to periodically monitor crop growth [13,14,15,16]. The Sentinel-2A and Sentinel-2B satellites, included in the Europe’s Monitoring for Environment and Security (GMES) program [17], were launched on the 23rd of June 2015 and 7th of March 2017, respectively. The Sentinel-2 satellites provide global coverage every 5 days in several spectral bands in the visible, red-edge, NIR, and SWIR regions, with resolutions from 10 to 60 m. Several authors have explored the potential of Sentinel-2 imagery for the monitoring of different crops such as alfalfa [3], maize [15,18], potato [14,18], and sisal [19]. Thus, sorghum, pearl millet, and cowpea production have been temporally monitored using Sentinel-2 data [20]. Veloso et al. (2017) analyzed the evolution of different winter and summer crops (wheat, rapeseed, maize, soybean, and sunflower) using Sentinel-2 imagery [21].
The observation of vegetation has traditionally been carried out through the use of vegetation indices (VIs) derived from multispectral images. These indices relate to a few spectral bands with biophysical properties of vegetation, such as greenness, photosynthetic activity, and water content, while minimizing the soil and atmospheric effects [18,19,20,22,23].
The normalized difference vegetation index (NDVI) has been widely used to identify and monitor areas covered with vegetation [24,25]. This index exploits the fact that green, healthy vegetation displays contrast-reflecting behavior between the red and near-infrared spectral bands, providing a good indication of the vegetation “greenness” [26]. Different authors have shown the correlation of NDVI with FVC [27,28] and with leaf area index (LAI) [16,22,29,30,31,32]. Although the phenological development, yield, LAI, and height of alfalfa have also been monitored using remote sensing techniques [3,33,34,35,36,37,38], there is a lack of information on the FVC assessment of alfalfa using satellite images; more specifically, there is a lack of this information on semiarid agrosystems.
Soil background conditions exert considerable influence on partial canopy spectra when using NDVI [39], and to minimize this factor, other VIs, such as soil adjusted VI (SAVI) and perpendicular VI (PVI), have been proposed [39,40]. The green normalized difference VI (GNDVI) presents band variations to NDVI and uses green reflectance instead of red reflectance, reporting high efficiency in crop monitoring [41]. The normalized difference water index (NDWI) and the specific leaf area VI (SLAVI), which use SWIR regions and are directly related to leaf water content, are highly recommended for semiarid areas [42,43]. Recently, concerns have increasingly been raised regarding the red-edge region, which was introduced to increase the sensitivity of biomass estimation, leading to the development of several VIs: Sentinel-2 LAIgreen (SeLI) [44], NDVI705 [45], MERIS terrestrial chlorophyll index (MTCI) [46], and the modified chlorophyll absorption in ratio index (MCARI) [47]. For VIs that use the red-edge region, there has been reported a significant improvement in indices using the saturated bands in the red [44]. Recently, a new kernel-based NDVI (kNDVI) has been shown to improve accuracy in monitoring key vegetation parameters such as LAI or gross primary productivity [48].
The aim of this study was to assess Sentinel-2 images for their suitability in the monitoring of the FVC of rainfed alfalfa in semiarid areas. Together with some cereal crops, rainfed alfalfa participates in the rotation system used for cattle grazing in this type of environment.
The natural reserve of Bardenas Reales, Spain, is a typical semiarid environment used for cattle grazing, and it was selected as the study area. The relationships established between FVC field measurements and several vegetation indices derived from Sentinel-2 data were used to produce time series over the cultivation period in twenty-eight experimental rainfed alfalfa fields throughout the study area.

2. Material and Methods
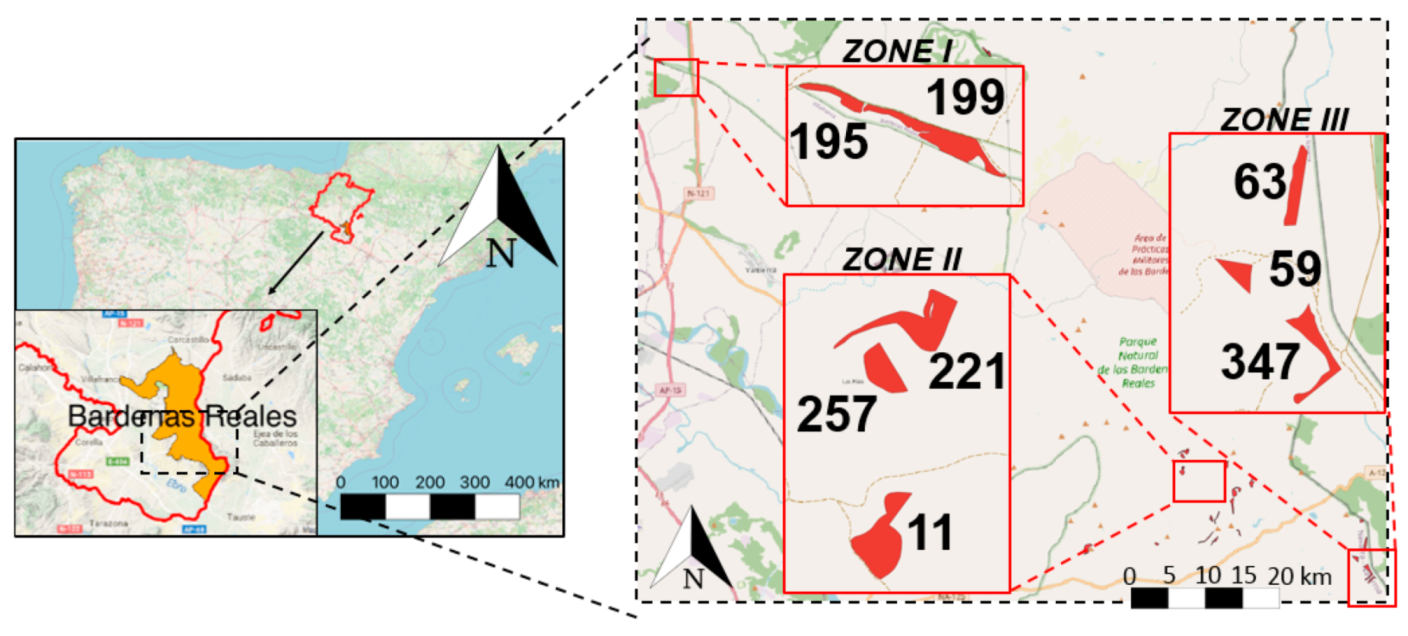
2.1. Study Area

Bardenas Reales comprises 41,845 ha located in the Ebro Basin (NE Spain, SW Navarra) (Figure 1). The climate is Mediterranean with an average annual precipitation of 427.5 mm. This area is characterized by a 3 month dry season from June to August (74.4 mm) with a mean annual temperature of 13.3 °C and sharp contrasts between winter (5.7 °C) and summer (21.5 °C) [49].
The main land use is for sheep grazing, and approximately half of the area is cultivated by dryland farming [50]. Dry grasslands, garrigues, and scrub are among the natural habitats in this area [51]. Bardenas Reales is a fragile, unique area that is quite sensitive to environmental changes due to the fact of its erodible materials and water stress conditions [52]. Therefore, it has been an MAB Biosphere Reserve since 2000.
In the first experiment (E1), eight rainfed alfalfa plots were selected in the area of Bardenas Reales (195, 199, 221, 257, 11, 63, 59, and 347). These plots reported differences in slope and orientation. In the second experiment (E2), 28 rainfed alfalfa plots and 1 irrigated alfalfa plot were monitored (Table 1).

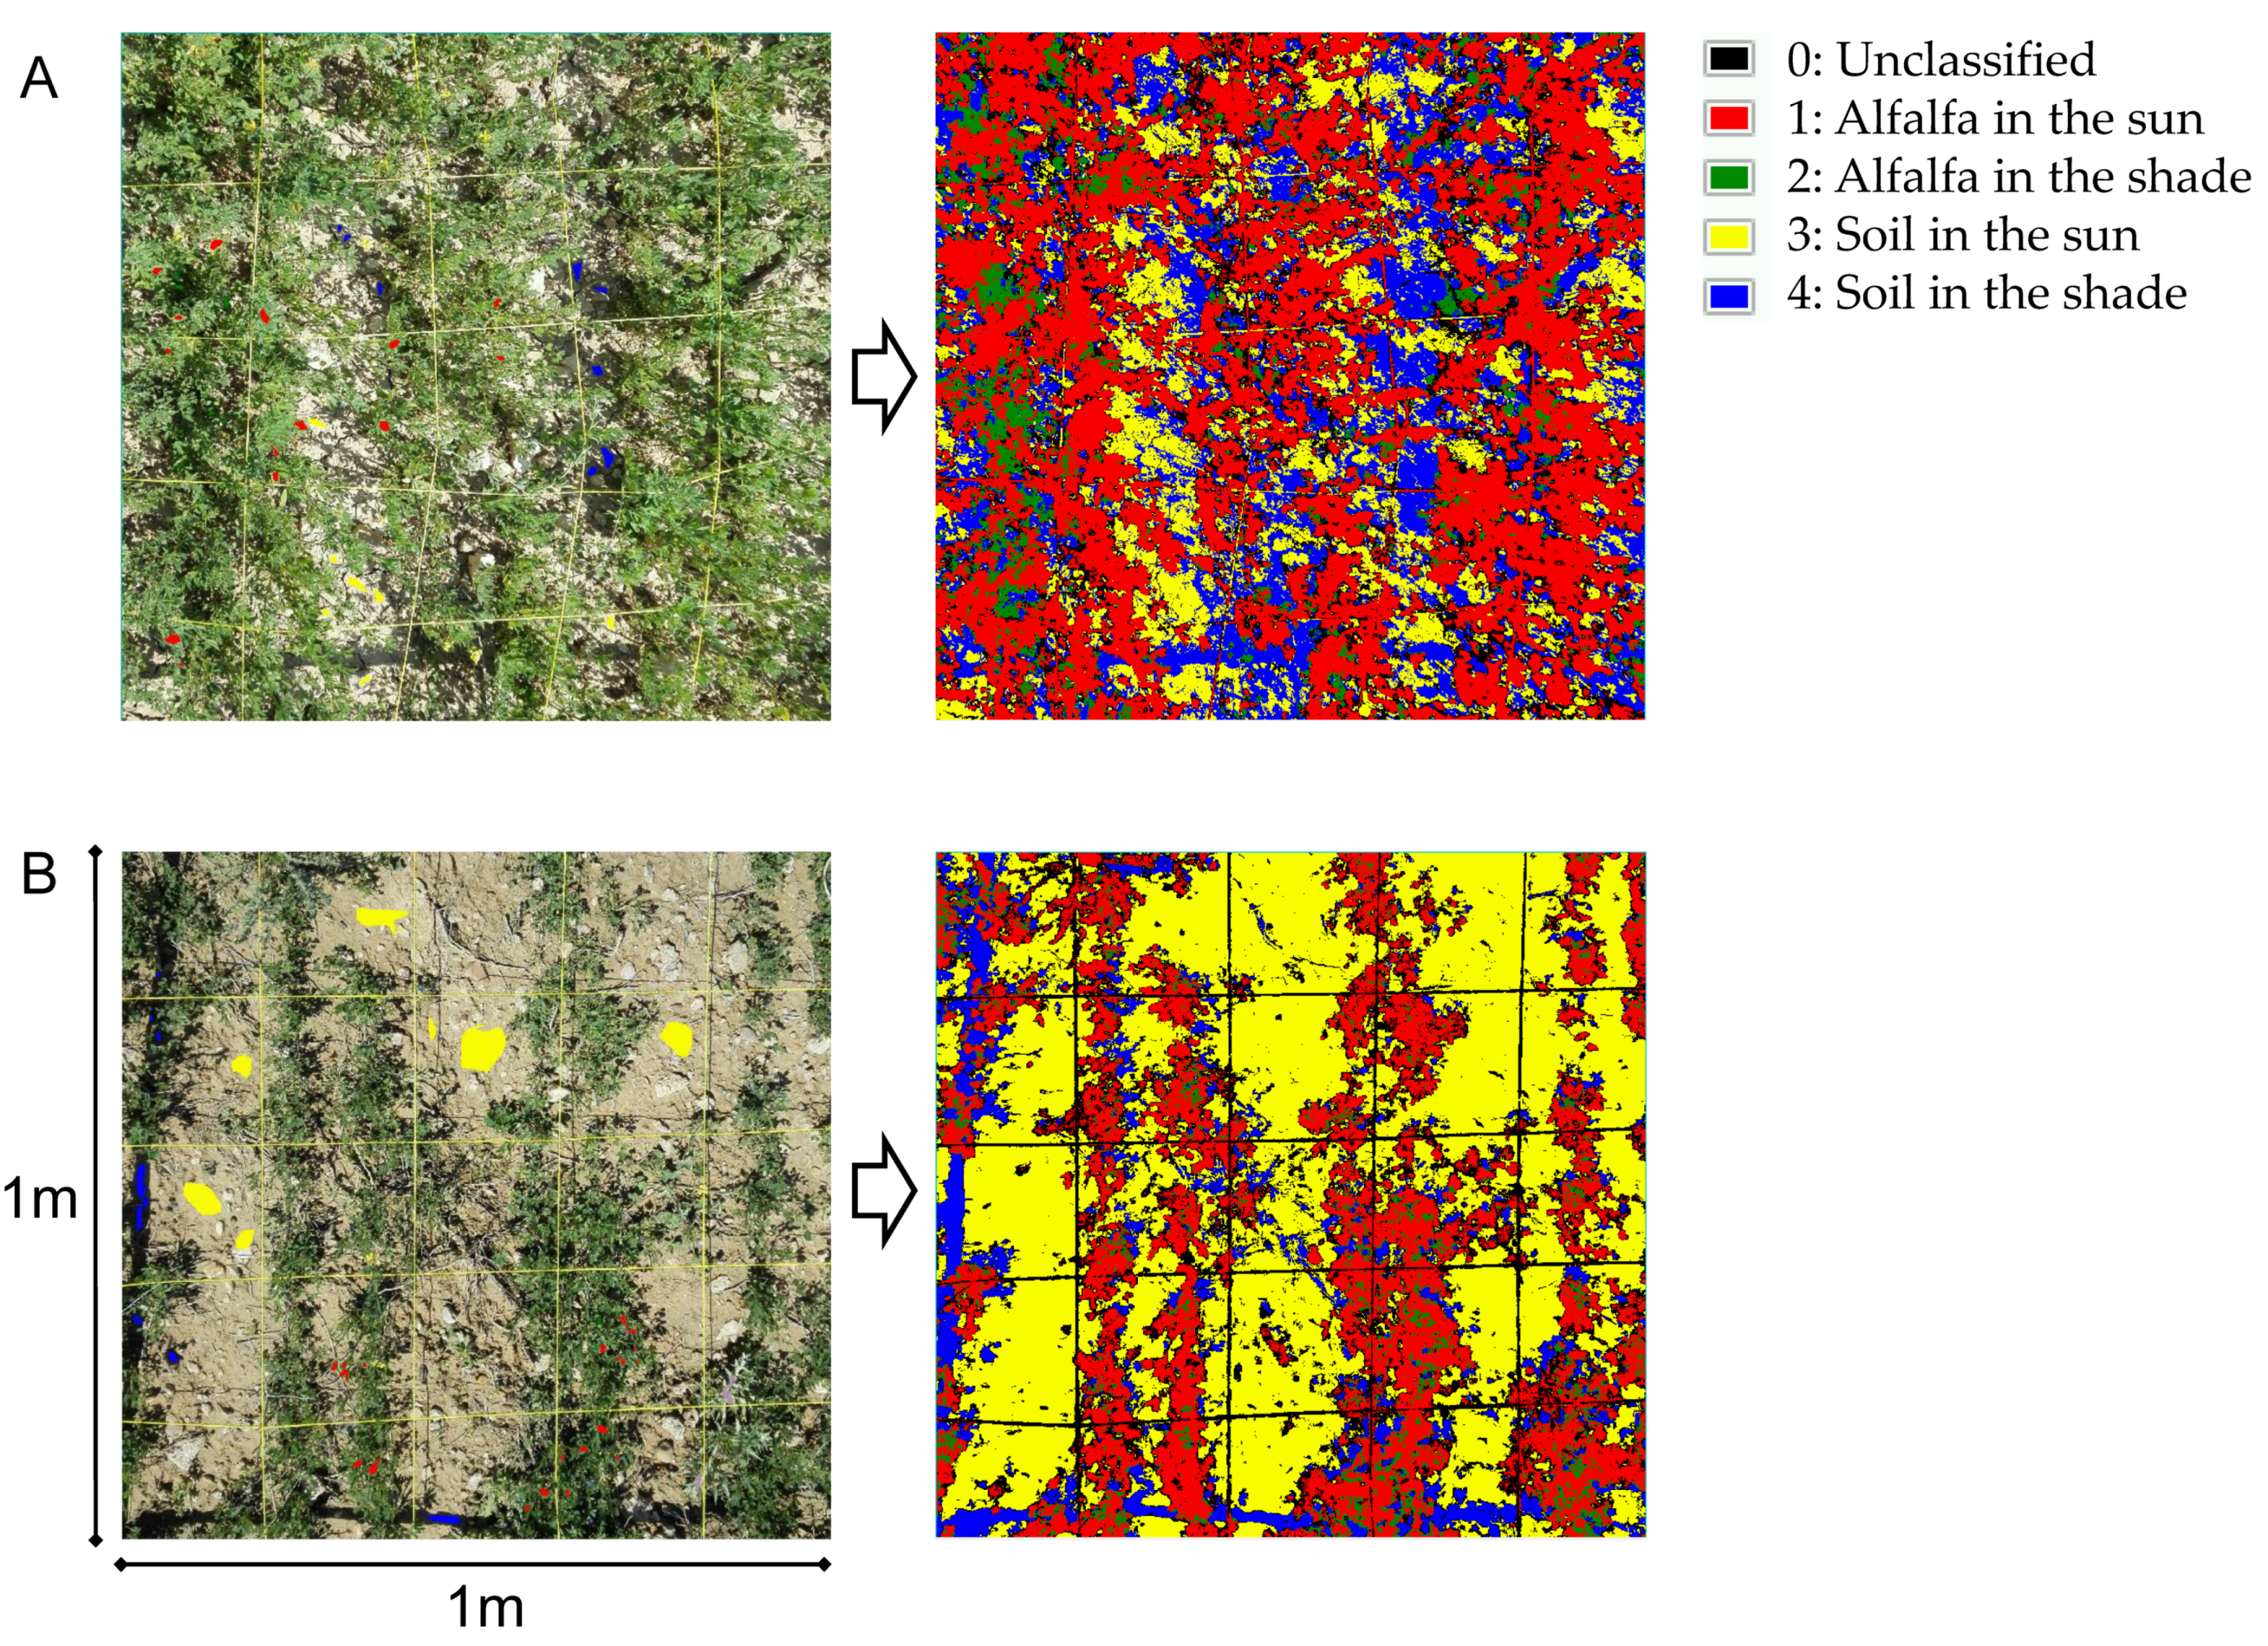
2.2. In Situ FVC Measurement

To estimate the on-field FVC of the experimental parcels, an average of 3–4 sampling points in each parcel, representative of the plot average vegetation density, were visually selected in each. In the most heterogeneous plots, 4–5 sampling points were visually selected, while in the most homogeneous plots, 2–3 points were selected in each. In total, 172 measurements were made inside the eight selected plots in Experiment 1.
The FVC of each sampling point was measured over a square meter quadrant, using nadiral images acquired with a 13 megapixel mobile camera from a height of 1 m above the ground. The fieldwork was carried out on three different days in 2017 and three days in 2018, coinciding with different rainfed alfalfa phenological cycle stages. After the data were acquired, the images were cropped at the edge of the sampling plot using the PhotoscapeX imaging software.
A supervised image classification procedure was applied to measure the area covered by alfalfa in the nadiral image taken at each sampling point. Taking into account that the spectral separability between the green vegetation and the background soil was high in these images, a simple maximum likelihood algorithm was selected to carry out this classification. This algorithm was trained using several aleatory defined training areas in each image by photointerpretation, which corresponded to the different categories, for classification: alfalfa in the sun, alfalfa in the shade, soil in the sun, soil in the shade, and unclassified. Training areas represented between 3% and 5% of the total area and were defined specifically for each image (Figure 2).
The classified accuracy assessment was carried out using validation areas, defined by photointerpretation and representing between 1% and 2% of the total area of each image. The overall accuracy was between 95.9% and 99.47% for all plots, and the kappa coefficient was above 0.94.
FVC represents the total area of alfalfa, which is the result of the total alfalfa in the shade and alfalfa in the sun in each of the 1 m2 sampling points, expressed in percentage. Parcel FVC was assessed by the mean of the different individual FVCs inside each parcel.

2.3. Sentinel-2 Data

Sentinel-2 provides high-resolution imagery that is available from the European Space Agency (ESA) for free. With a 290 km field of view, its MultiSpectral Instrument (MSI) carries 13 spectral bands ranging from the visible and near-infrared to short-wave infrared (Table 2). Depending on the spectral band, the spatial resolution ranges from 10 to 60 m. This unique combination of high spatial resolution, wide field of view, and broad spectral coverage, together with their free availability as ready-to-use products in an atmospherically corrected reflectance mode, has opened up a new window in operational ecosystem monitoring [53,54]. Table 3 provides an overview of the Sentinel-2 images available for the study site during 2016–2019.
Surface spectral reflectance data were used to calculate twelve vegetation indices: NDVI [55]; SAVI [39]; RVI [56]; PVI [40]; GNDVI [41], kNDVI [48]; NDWI [42]; SLAVI [43]; MCARI [47]; MTCI [46]; SeLI [44]; NDVI705 [45]. The VIs were computed in SNAP ESA’s software using the equations shown in Table 4. Prior to the study, squared plots were selected to obtain representative VI values in each plot, especially in small plots. Furthermore, a 5 m buffer was applied, reducing its variability and eliminating the border effect.

2.4. Data Analysis

The FVC values at the pixel or parcel level were calculated as described in Section 2.2. The VI values at the pixel or parcel level were calculated from Sentinel-2 images as described in Section 2.3.
In the first experiment (E1), FVC values from the 1 m2 sampling points were compared with the VI values derived from Sentinel-2 images at the parcel level. Eight plots (195, 199, 221, 11, 257, 59, 63, and 347) were used to check the correlation obtained between the in situ FVC measurements and VI values (Table 5; Figure 3A). At the pixel level, the correlation between FVC and NDVI data derived from the Sentinel-2 satellite multispectral images was calculated considering the data for each year (i.e., 2017 and 2018) separately and both years together (Figure 3B). The accuracy of each index was specifically analyzed with linear (f(x) = ax + b), polynomial of second order (f(x) = ax2 + bx + c), and exponential fitting (f(x) = a × exp(bx)). At both the parcel and pixel levels, the coefficient of determination (R2) was selected as the indicator of the accuracy of the statistical estimation models. The main steps of the procedure for the assessment and in situ analysis of remote sensing vegetation indices are provided in Supplementary Materials Figure S1.
During the second experiment (E2), the temporal evolution of the average NDVI values was assessed between July 2016 and April 2019 for the three different areas (I, II, and III) (Figure 4A) and from January 2017 to May 2019 for the 29 alfalfa plots (28 rainfed; 1 irrigated) in the Bardenas Reales area (Figure 4B).

3. Results and Discussion

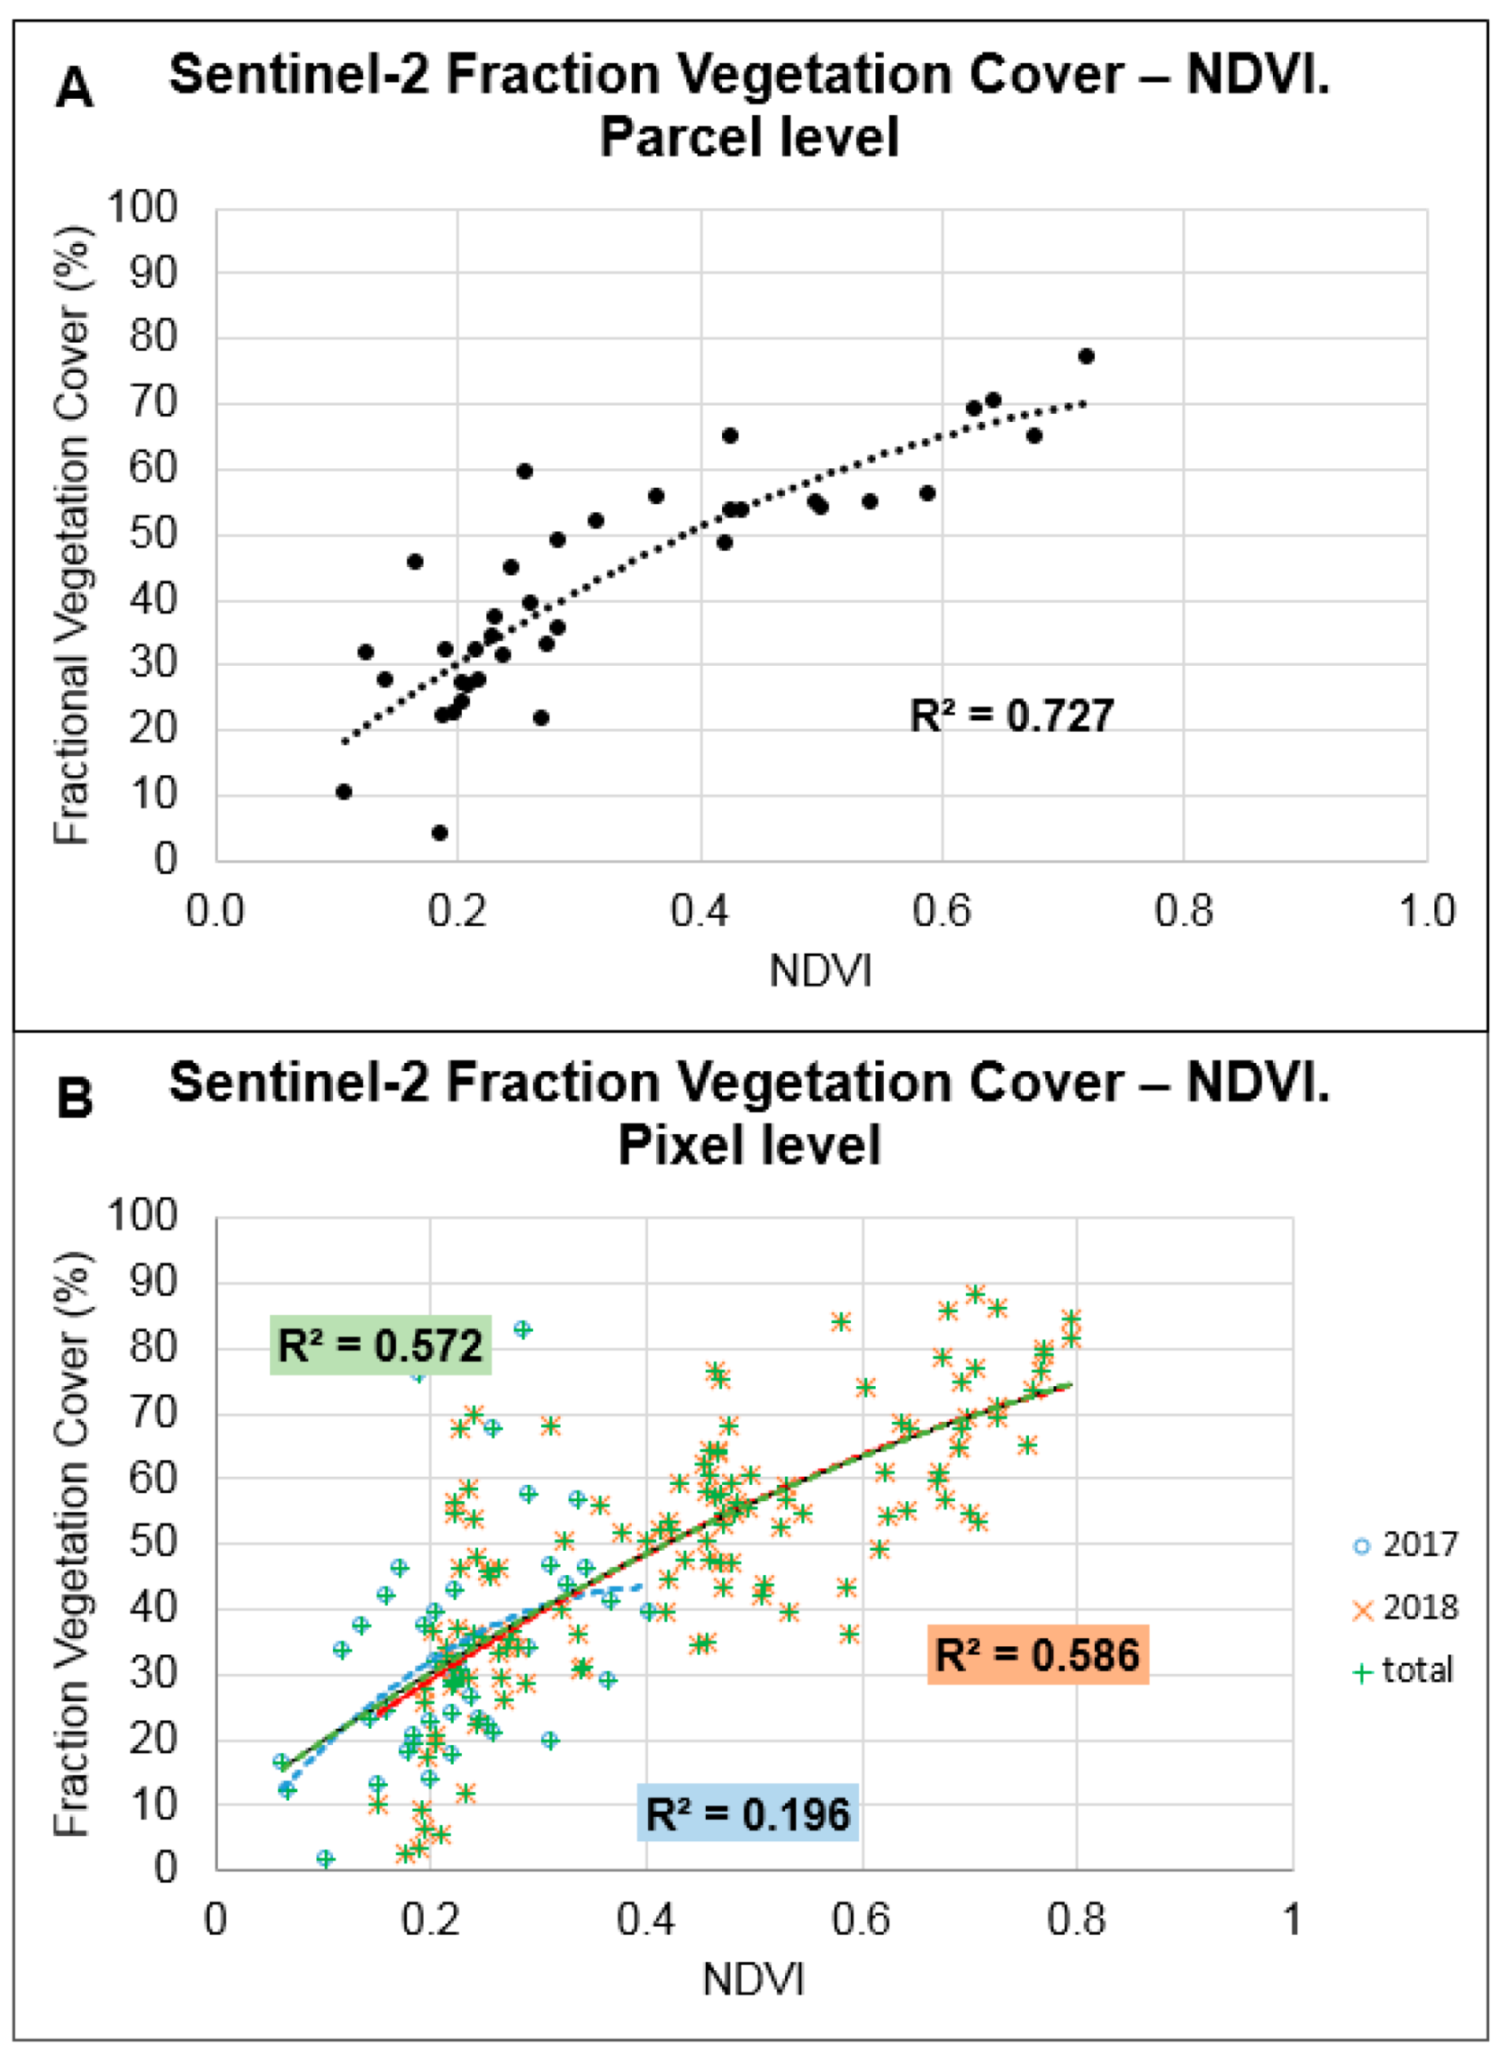
3.1. FVC–NDVI Correlation

The examination of the correlations between the FVC and the different spectral indices used in this study indicated that polynomial fitting reported the best correlations followed by linear fitting correlation values, while exponential fitting correlations showed lower values for all indexes. Furthermore, NDVI resulted in the highest correlation values among all the indices, both for polynomial and for lineal fitting (Table 5). Similar results have been reported in previous studies [11,14,15,57].
Figure 3A,B show the correlation between the in situ FVC values and NDVI values derived from Sentinel-2 images at the parcel and pixel levels, respectively. At the parcel level, R2 = 0.727 (Figure 3A; Table 5), while at the pixel level, the correlation was higher in 2018 (R2 = 0.586) than in 2017 (R2 = 0.196) (Figure 3B).
Plots where alfalfa was not sufficiently developed may influence the correlations between in situ FVC measurements and NDVI values from Sentinel-2A images, as Figure 3A shows a higher dispersion in these areas, where FVC seemed underestimated. High spatial resolution images are essential when working with yield or FVC values. Thus, the 10 m spatial resolution Sentinel-2 images in red, green, blue, and NIR wavelengths, defined in bands 2, 3, 4, and 8, respectively, are interesting when working with small plots as in the present study.
Another key advantage of the Sentinel-2 satellite is the 5 day revisit period, which is especially relevant for temporal monitoring studies in cloudy areas [58]. In addition, ESA free-access imagery represents an advantage in economic terms when working with remote sensing satellite data in contrast to SPOT or Quickbird-2 on-demand remote sensing data.

3.2. Temporal Analysis

Regarding the rainfed alfalfa temporal development, Figure 4A shows the NDVI average value evolution in three different zones of Bardenas Reales, characterized as (I) high, (II) regular, and (III) good quality (Figure 1), and the average values for a total of 28 rainfed alfalfa plots analyzed between July 2016 and April 2019. The rainfed alfalfa crops in the Bardenas Reales were sown in May 2016. During the first year, we checked the in situ crop establishment in plots 195, 199, 221, 257, 11, 59, 63, and 347. We also checked the NDVI values from Sentinel-2, which showed a basal development of the crop (approximately 0.15 in July 2016). The alfalfa crop implantation improved progressively over the following years and, thus, in the 2017 season, the NDVI values reached approximately 0.25–0.35 in the three zones. In the 2018 season, NDVI reached its maximum values of 0.30 for zone I, 0.55 for zone II, and over 0.70 in zone III.
Overall, it should be remarked that an important variation in FVC was observed over the different years (Figure 4A). While 2019 was the third year of the alfalfa crop plantation, which is important for better establishing the crop, rain during the spring season was very limited; thus, crop growth remained quite slow (358, 375, 598, and 188 L per m2 in the 2016, 2017, 2018, and 2019 seasons, respectively). As can be observed, the NDVI values strongly increased in all zones from May to June in 2018, while in the same period of 2019, the NDVI showed an overall decrease due to the drought period in the Bardenas Reales area. It can also be inferred that the alfalfa crops in zone III developed earlier than those in zone II and zone I for all years studied. Thus, for example, in May 2018, the NDVI values were 0.72, 0.58, and 0.40 for zones III, II, and I, respectively. The advanced development in zone III may be related to the higher altitude of the plots in this zone compared to those in zone II and zone I (Table 1), which would contribute to the better establishment of the crop year by year.
To evaluate the differences in development between the rainfed plots, the irrigated alfalfa NDVI average values of one irrigated plot (UTMX: 614734; UTMY: 4678413), adjacent to the area of Bardenas Reales, was assessed between January 2017 and May 2019. The NDVI value for the irrigated plot was compared to the average value of the 28 rainfed plots spread along Bardenas Reales (Figure 4B). The NDVI values of the irrigated alfalfa plot were much higher than those observed in the rainfed alfalfa plots as previously expected. It should be remarked that the irrigated alfalfa reached maximum development between February and June. The different NDVI minimum peaks observed in the irrigated alfalfa plots may be the consequence of consecutive harvests during the year (Figure 4B). Conversely, the stability of the rainfed alfalfa NDVI values indicated that there was no harvesting activity in these plots. Contrary to the use of forage production associated with the irrigated alfalfa plots, the rainfed alfalfa plots are intended for in situ sheep feeding. Thus, the use of remote sensing data for detecting mowing or grazing practices [59,60,61,62] represents a great opportunity for crop management compared to cattle feeding, especially in scenarios where it is difficult to access the plots, which is the case in some areas of Bardenas Reales.

4. Conclusions

In this work, we explored the suitability of Sentinel-2 imagery for the monitoring of rainfed alfalfa crop establishment in the semiarid Bardenas Reales area. For this purpose, 172 in situ FVC samples were compared with different VI values derived from Sentinel-2 imagery. In situ images of an area of one square meter were processed using a maximum likelihood supervised algorithm in order to calculate the FVC of each sample. The non-destructive methodology of this study represents an advantage compared to other studies that used a destructive methodology, where estimations were only possible during the harvesting period [14,57]. Furthermore, FVC estimation using multitemporal Sentinel-2 images makes it possible to monitor crop growth, assisting farmers in making well-informed management decisions [13].
Sentinel-2 imagery is useful for assessing the rainfed alfalfa establishment in Bardenas Reales. The NDVI showed the best correlation (R2 = 0.727) between FVC and VI at the parcel level.
We detected that the parcels in zone III, located to the south at a higher altitude (540 m), exhibited the best altitude for the optimum development of alfalfa crop compared to the plots in the north and middle zone of Bardenas Reales. Therefore, we conclude that NDVI values derived from Sentinel-2 images are suitable for monitoring rainfed alfalfa plots in a semiarid area, such as Bardenas Reales, and allows for good decisions to be made in traditional practices such as crop and cattle feeding management.
The improvements in Sentinel-2 imagery in terms of accessibility (i.e., free), spectral range, and spatial and temporal resolution make it a very interesting option for crop monitoring, especially over high-extension areas. Sentinel-2 effectivity estimated alfalfa FVC in Bardenas Reales at the parcel level, reporting a good accuracy, and may help farmers monitor rainfed alfalfa growth in semiarid areas. Accurate observation of alfalfa crop yields will enhance decision making on agricultural management and ecosystem services for transhumant cattle feeding management in the semiarid agrosystem of Bardenas Reales.

Supplementary Materials

The following are available online at https://www.mdpi.com/article/10.3390/rs13224719/s1.

Author Contributions

Conceptualization, E.M.G., A.U. and A.E.; methodology, E.M.G., M.G.-A. and A.E.; software, M.G.-A. and A.E.; validation, E.M.G., M.G.-A. and A.E.; formal analysis, A.E.; investigation, E.M.G., M.G.-A., A.U. and A.E.; resources, A.U.; data curation, A.E.; writing—original draft preparation, A.E.; writing—review and editing, E.M.G. and M.G.-A.; visualization, E.M.G., M.G.-A., A.U. and A.E.; supervision, E.M.G. and M.G.-A.; project administration, E.M.G.; funding acquisition, E.M.G. and M.G.-A. All authors have read and agreed to the published version of the manuscript.

Funding

Andres Echeverria was supported by a predoctoral fellowship from the Government of Navarra. This work was supported by the knowledge transfer contract 2018020023 UPNA-Bardenas Reales Committee with partial collaboration of the project PID2019-107386RB-I00/AEI/10.13039/501100011033 (MINECO/FEDER-UE).

Data Availability Statement

Data is contained within the article or Supplementary Material.

Acknowledgments

We would like to thank the technicians at the Bardenas Reales Interpretation Centre for their technical assistance, F. Javier Peralta for his expert advice regarding the in situ samplings of vegetation cover in the Bardenas Reales area and and J. Blanco for critical reading and helpful suggestions during the writing of the manuscript.

Conflicts of Interest

The authors declare that they have no known competing financial interests or personal relationship that could have influenced the work reported in this paper.

References

  1. Vance, C.P.; Graham, P.H.; Allan, D.L. Biological nitrogen fixation: Phosphorus—A critical future need? In Nitrogen Fixation: From Molecules to Crop Productivity; Pedrosa, O., Hungria, M., Yates, M., Newton, W., Eds.; Kluwer Academic Publishers: Dordrecht, The Netherlands, 2000; pp. 509–514. [Google Scholar]
  2. Graham, P.H.; Vance, C.P. Legumes: Importance and constraints to greater use. Plant Physiol. 2003, 131, 872–877. [Google Scholar] [CrossRef] [PubMed] [Green Version]
  3. Kayad, A.G.; Al-gaadi, K.A.; Tola, E.; Madugundu, R. Assessing the Spatial Variability of Alfalfa Yield Using Satellite Imagery and Ground-Based Data. PLoS ONE 2016, 11, e0157166. [Google Scholar] [CrossRef] [PubMed]
  4. Kang, Y.; Han, Y.; Torres-Jerez, I.; Wang, M.; Tang, Y.; Monteros, M.; Udvardi, M. System responses to long-term drought and re-watering of two contrasting alfalfa varieties. Plant J. 2011, 68, 871–889. [Google Scholar] [CrossRef]
  5. Araújo, S.S.; Beebe, S.; Crespi, M.; Delbreil, B.; González, E.M.; Gruber, V.; Lejeune-Henaut, I.; Link, W.; Monteros, M.J.; Prats, E.; et al. Abiotic stress responses in legumes: Strategies used to cope with environmental challenges. Crit. Rev. Plant Sci. 2015, 34, 237–280. [Google Scholar] [CrossRef]
  6. Quan, W.; Liu, X.; Wang, H.; Chan, Z. Comparative physiological and transcriptional analyses of two contrasting drought tolerant alfalfa varieties. Front. Plant Sci. 2016, 6, 1256. [Google Scholar] [CrossRef] [PubMed] [Green Version]
  7. Webber, G.D.; Cocks, P.S.; Jeffries, B.C. Farming Systems in South Australia; Department of Agriculture and Fisheries: Adelaide, Australia, 1976.
  8. Delgado, I.; Mu, F. Uso de leguminosas forrajeras en las alternativas de cultivo en secano de aragón. In Proceedings of the VII Congress SEAE, Zaragoza, Spain, 18–23 September 2006. [Google Scholar]
  9. Cattivelli, L.; Rizza, F.; Badeck, F.W.; Mazzucotelli, E.; Mastrangelo, A.M.; Francia, E.; Marè, C.; Tondelli, A.; Stanca, A.M. Drought tolerance improvement in crop plants: An integrated view from breeding to genomics. Field Crop. Res. 2008, 105, 1–14. [Google Scholar] [CrossRef]
  10. Zhang, C.; Shi, S.; Liu, Z.; Yang, F.; Yin, G. Drought tolerance in alfalfa (Medicago sativa L.) varieties is associated with enhanced antioxidative protection and declined lipid peroxidation. J. Plant Physiol. 2019, 232, 226–240. [Google Scholar] [CrossRef]
  11. Zha, Y.; Gao, J.; Ni, S.; Liu, Y.; Jiang, J.; Wei, Y. A spectral reflectance-based approach to quantification of grassland cover from Landsat TM imagery. Remote Sens. Environ. 2003, 87, 371–375. [Google Scholar] [CrossRef]
  12. Tsakmakis, I.D.; Gikas, G.D.; Sylaios, G.K. Integration of Sentinel-derived NDVI to reduce uncertainties in the operational field monitoring of maize. Agric. Water Manag. 2021, 255, 106998. [Google Scholar] [CrossRef]
  13. Punalekar, S.M.; Verhoef, A.; Quaife, T.L.; Humphries, D.; Bermingham, L.; Reynolds, C.K. Application of Sentinel-2A data for pasture biomass monitoring using a physically based radiative transfer model. Remote Sens. Environ. 2018, 218, 207–220. [Google Scholar] [CrossRef]
  14. Al-gaadi, K.A.; Hassaballa, A.A.; Tola, E.; Kayad, A.G.; Madugundu, R.; Alblewi, B.; Assiri, F. Prediction of Potato Crop Yield Using Precision Agriculture Techniques. PLoS ONE 2016, 11, e0162219. [Google Scholar]
  15. Battude, M.; Al Bitar, A.; Morin, D.; Cros, J.; Huc, M.; Sicre, C.M.; Le Dantec, V.; Demarez, V. Estimating maize biomass and yield over large areas using high spatial and temporal resolution Sentinel-2 like remote sensing data. Remote Sens. Environ. 2016, 184, 668–681. [Google Scholar] [CrossRef]
  16. Zhang, M.; Su, W.; Fu, Y.; Zhu, D.; Xue, J.-H.; Huang, J.; Wang, W.; Wu, J.; Yao, C. Super-resolution enhancement of Sentinel-2 image for retrieving LAI and chlorophyll content of summer corn. Eur. J. Agron. 2019, 111, 125938. [Google Scholar] [CrossRef]
  17. ESA GMES Overview. Available online: http://www.esa.int/esaLP/SEMRRI0DU8E_LPgmes_0. (accessed on 6 September 2017).
  18. Ibrahim, E.S.; Rufin, P.; Nill, L.; Kamali, B.; Nendel, C.; Hostert, P. Mapping crop types and cropping systems in nigeria with sentinel-2 imagery. Remote Sens. 2021, 13, 3523. [Google Scholar] [CrossRef]
  19. Vuorinne, I.; Heiskanen, J.; Pellikka, P.K.E. Assessing leaf biomass of agave sisalana using sentinel-2 vegetation indices. Remote Sens. 2021, 13, 233. [Google Scholar] [CrossRef]
  20. Karlson, M.; Ostwald, M.; Bayala, J.; Bazié, H.R.; Ouedraogo, A.S.; Soro, B.; Sanou, J.; Reese, H. The Potential of Sentinel-2 for Crop Production Estimation in a Smallholder Agroforestry Landscape, Burkina Faso. Front. Environ. Sci. 2020, 8, 85. [Google Scholar] [CrossRef]
  21. Veloso, A.; Mermoz, S.; Bouvet, A.; Le Toan, T.; Planells, M.; Dejoux, J.F.; Ceschia, E. Understanding the temporal behavior of crops using Sentinel-1 and Sentinel-2-like data for agricultural applications. Remote Sens. Environ. 2017, 199, 415–426. [Google Scholar] [CrossRef]
  22. Delegido, J.; Verrelst, J.; Alonso, L.; Moreno, J.; Clevers, J.; Kooistra, L.; van den Brande, M. Evaluation of sentinel-2 red-edge bands for empirical estimation of green LAI and chlorophyll content. Sensors 2011, 11, 7063–7081. [Google Scholar] [CrossRef] [Green Version]
  23. Chang, J.; Shoshany, M. Mediterranean Shrublands Biomass Estimation Using Sentinel-1 and Sentinel-2. In Proceedings of the IGARSS 2016—2016 IEEE International Geoscience and Remote Sensing Symposium, Beijing, China, 10–15 July 2016; pp. 5300–5303. [Google Scholar]
  24. Kasampalis, D.A.; Alexandridis, T.K.; Deva, C.; Challinor, A.; Moshou, D.; Zalidis, G. Contribution of remote sensing on crop models: A review. J. Imaging 2018, 4, 52. [Google Scholar] [CrossRef] [Green Version]
  25. Fan, X.; Liu, Y. Multisensor Normalized Difference Vegetation Index Intercalibration. IEEE Geosci. Remote Sens. Mag. 2018, 6, 23–45. [Google Scholar] [CrossRef]
  26. Delegido, J.; Verrelst, J.; Rivera, J.P.; Ruiz-Verdú, A.; Moreno, J. Brown and green LAI mapping through spectral indices. Int. J. Appl. Earth Obs. Geoinf. 2015, 35, 350–358. [Google Scholar] [CrossRef]
  27. Song, W.; Mu, X.; Ruan, G.; Gao, Z.; Li, L.; Yan, G. Estimating fractional vegetation cover and the vegetation index of bare soil and highly dense vegetation with a physically based method. Int. J. Appl. Earth Obs. Geoinf. 2017, 58, 168–176. [Google Scholar] [CrossRef]
  28. Gitelson, A.A. Remote estimation of crop fractional vegetation cover: The use of noise equivalent as an indicator of performance of vegetation indices. Int. J. Remote Sens. 2013, 34, 6054–6066. [Google Scholar] [CrossRef]
  29. Clevers, J.; Kooistra, L.; van den Brande, M. Using Sentinel-2 Data for Retrieving LAI and Leaf and Canopy Chlorophyll Content of a Potato Crop. Remote Sens. 2017, 9, 405. [Google Scholar] [CrossRef] [Green Version]
  30. Frampton, W.J.; Dash, J.; Watmough, G.; Milton, E.J. Evaluating the capabilities of Sentinel-2 for quantitative estimation of biophysical variables in vegetation. ISPRS J. Photogramm. Remote Sens. 2013, 82, 83–92. [Google Scholar] [CrossRef] [Green Version]
  31. Herrmann, I.; Pimstein, A.; Karnieli, A.; Cohen, Y.; Alchanatis, V.; Bonfil, D.J. LAI assessment of wheat and potato crops by VENμS and Sentinel-2 bands. Remote Sens. Environ. 2011, 115, 2141–2151. [Google Scholar] [CrossRef]
  32. Xie, Q.; Dash, J.; Huete, A.; Jiang, A.; Yin, G.; Ding, Y.; Peng, D.; Hall, C.C.; Brown, L.; Shi, Y.; et al. Retrieval of crop biophysical parameters from Sentinel-2 remote sensing imagery. Int. J. Appl. Earth Obs. Geoinf. 2019, 80, 187–195. [Google Scholar] [CrossRef]
  33. Masialeti, I.; Egbert, S.; Wardlow, B. A comparative analysis of phenological curves for major crops in Kansas. GISci. Remote Sens. 2010, 47, 241–259. [Google Scholar] [CrossRef]
  34. Payero, J.O.; Neale, C.M.U.; Wright, J.L. Comparision of eleven vegetation indices for estimating plant height of alfalfa and grass. Appl. Eng. Agric. 2004, 20, 385–394. [Google Scholar] [CrossRef] [Green Version]
  35. Baxter, L.L.; West, C.P.; Brown, C.P.; Green, P.E. Comparing nondestructive sampling techniques for predicting forage mass in alfalfa–tall wheatgrass pasture. Agron. J. 2017, 109, 2097–2106. [Google Scholar] [CrossRef]
  36. Houborg, R.; McCabe, M.F. Daily retrieval of NDVI and LAI at 3 m resolution via the fusion of CubeSat, Landsat, and MODIS data. Remote Sens. 2018, 10, 890. [Google Scholar] [CrossRef] [Green Version]
  37. González-Sanpedro, M.C.; Le Toan, T.; Moreno, J.; Kergoat, L.; Rubio, E. Seasonal variations of leaf area index of agricultural fields retrieved from Landsat data. Remote Sens. Environ. 2008, 112, 810–824. [Google Scholar] [CrossRef] [Green Version]
  38. Patil, V.C.; Al-Gaadi, K.A.; Madugundu, R.; Tola, E.H.M.; Marey, S.; Aldosari, A.; Biradar, C.M.; Gowda, P.H. Assessing agricultural water productivity in desert farming system of Saudi Arabia. IEEE J. Sel. Top. Appl. Earth Obs. Remote Sens. 2015, 8, 284–297. [Google Scholar] [CrossRef]
  39. Huete, A.R. A soil-adjusted vegetation index (SAVI). Remote Sens. Environ. 1988, 25, 295–309. [Google Scholar] [CrossRef]
  40. Richardson, A.J.; Wiegand, C.L. Distinguishing Vegetation from Soil Background Information. Photogramm. Eng. Remote Sens. 1977, 43, 1541–1552. [Google Scholar]
  41. Gitelson, A.A.; Kaufman, Y.J.; Merzlyak, M.N. Use of a green channel in remote sensing of global vegetation from EOS-MODIS. Remote Sens. Environ. 1996, 58, 289–298. [Google Scholar] [CrossRef]
  42. Cibula, W.G.; Zetka, E.F.; Rickman, D.L. Response of thematic mapper bands to plant water stress. Int. J. Remote Sens. 1992, 13, 1869–1880. [Google Scholar] [CrossRef]
  43. Lymburner, L.; Beggs, P.J.; Jacobson, C.R. Estimation of Canopy-Average Surface-Specific Leaf Area using Landsat TM Data. Photogramm. Eng. Remote Sens. 2000, 66, 183–191. [Google Scholar]
  44. Pasqualotto, N.; Delegido, J.; Van Wittenberghe, S.; Rinaldi, M.; Moreno, J. Multi-crop green LAI estimation with a new simple sentinel-2 LAI index (SeLI). Sensors 2019, 19, 904. [Google Scholar] [CrossRef] [PubMed] [Green Version]
  45. Sims, D.A.; Gamon, J.A. Relationships between leaf pigment content and spectral reflectance across a wide range of species, leaf structures and developmental stages. Remote Sens. Environ. 2002, 81, 337–354. [Google Scholar] [CrossRef]
  46. Dash, J.; Jeganathan, C.; Atkinson, P.M. The use of MERIS Terrestrial Chlorophyll Index to study spatio-temporal variation in vegetation phenology over India. Remote Sens. Environ. 2010, 114, 1388–1402. [Google Scholar] [CrossRef]
  47. Daughtry, C.S.T.; Walthall, C.L.; Kim, M.S.; De Colstoun, E.B.; McMurtrey, J.E. Estimating Corn Leaf Chlorophyll Concentration from Leaf and Canopy Reflectance. Remote Sens. Environ. 2000, 74, 229–239. [Google Scholar] [CrossRef]
  48. Camps-Valls, G.; Campos-Taberner, M.; Moreno-Martínez, Á.; Walther, S.; Duveiller, G.; Cescatti, A.; Mahecha, M.D.; Muñoz-Marí, J.; García-Haro, F.J.; Guanter, L.; et al. A unified vegetation index for quantifying the terrestrial biosphere. Sci. Adv. 2021, 7, eabc7447. [Google Scholar] [CrossRef] [PubMed]
  49. Gobierno de Navarra Meteorología y Climatología de Navarra. Available online: http://meteo.navarra.es/climatologia/fichasclimaticasaut_estacion.cfm?IDestacion=31 (accessed on 2 February 2020).
  50. Desir, G.; Marin, C.; Guerrero, J. Badlands and talus flatirons in the Bardenas Reales region. In Field Trips Guides, Proceedings of the Sixth International Conference on Geomorphology, Zaragoza, Spain, 7–11 September 2005; Desir, G., Gutierrez, F., Gutierrez, M., Eds.; Kronos: Deerfield Beach, FL, USA, 2005; Volume 1, pp. 55–95. [Google Scholar]
  51. Elosegui, J.; Ursua, C. Las Bardenas Reales; Gobierno de Navarra: Pamplona, Spain, 1990; ISBN 8423509311.
  52. Sancho, C.; Peña, J.L.; Muñoz, A.; Benito, G.; McDonald, E.; Rhodes, E.J. Holocene Alluvial Morphopedosedimentary Record and Environmental Changes in the Bardenas Reales Natural Park (NE Spain). Catena 2008, 73, 225–238. [Google Scholar] [CrossRef]
  53. European Space Agency (ESA). Available online: https://www.esa.int/ESA (accessed on 5 August 2019).
  54. Karydas, C.G. Optimization of multi-scale segmentation of satellite imagery using fractal geometry. Int. J. Remote Sens. 2020, 41, 2905–2933. [Google Scholar] [CrossRef]
  55. Rouse, J.W.; Haas, R.W.; Schell, J.A.; Deering, D.W.; Harlan, J.C. Monitoring the Vernal Advancement and Retrogradation (Greenware Effect) of Natural Vegetation; NASA Goddard Space Flight Center: Greenbelt, MD, USA, 1974.
  56. Birth, G.S.; McVey, G.R. Measuring the Color of Growing Turf with a Reflectance Spectrophotometer1. Agron. J. 1968, 60, 640. [Google Scholar] [CrossRef]
  57. Xu, B.; Yang, X.C.; Tao, W.G.; Qin, Z.H.; Liu, H.Q.; Miao, J.M.; Bi, Y.Y.; Yang, X.C.; Tao, W.G.; Qin, Z.H.; et al. MODIS—Based remote sensing monitoring of grass production in China. Int. J. Remote Sens. 2008, 29, 5313–5327. [Google Scholar] [CrossRef]
  58. ESA Sentinel-2 Mission and Space Segment Overview 2011. Available online: https://sentinel.esa.int/web/sentinel/missions/sentinel-2. (accessed on 20 September 2021).
  59. Lopes, M.; Fauvel, M.; Ouin, A.; Girard, S. Spectro-temporal heterogeneity measures from dense high spatial resolution satellite image time series: Application to grassland species diversity estimation. Remote Sens. 2017, 9, 993. [Google Scholar] [CrossRef] [Green Version]
  60. Lopes, M.; Fauvel, M.; Girard, S.; Sheeren, D. Object-based classification of grasslands from high resolution satellite image time series using Gaussian mean map kernels. Remote Sens. 2017, 9, 688. [Google Scholar] [CrossRef] [Green Version]
  61. Dusseux, P.; Gong, X.; Corpetti, T.; Hubert-Moy, L.; Corgne, S. Contribution of radar images for grassland management identification. In Proceedings of the SPIE 8531, Remote Sensing for Agriculture, Ecosystems, and Hydrology XIV, Edimburgh, UK, 24–27 September 2012. [Google Scholar]
  62. Dusseux, P.; Gong, X.; Hubert-Moy, L.; Corpetti, T. Identification of grassland management practices from leaf area index time series. J. Appl. Remote Sens. 2014, 8, 083559. [Google Scholar] [CrossRef]
Figure 1. Chartered community of the situation of Navarra in the Iberian Peninsula. The reserve of Bardenas Reales is located in the southern area of Navarra. Location of the Experiment 1 plots (195, 199, 11, 221, 257, 59, 63, and 347) in the Bardenas Reales area.
Remotesensing 13 04719 g001
Figure 2. FVC assessment in a high-FVC image (A) and low-FVC image (B) for 257 and 195 plots, respectively, on the 25th of May 2018. The images on the left show the definition of different categories in some areas: alfalfa in the sun (red), alfalfa in the shade (green), soil in the sun (yellow), and soil in the shade (blue). After the classification of the maximum likelihood supervised algorithm, the images on the right show the classification of the total pixels of the images in the different categories. Unclassified pixels are shown in black.
Remotesensing 13 04719 g002
Figure 3. Second-order polynomial correlations between FVC and NDVI at the parcel level (A). The second-order polynomial correlations between FVC and NDVI derived from the Sentinel-2 images at the pixel level in 2017 (blue), 2018 (red), and 2017–2018 (green) (B). These data belong to Experiment 1 in which plots 195, 199, 221, 11, 257, 59, 63, and 347 were analyzed. The maximum gap between the in situ sampling and the Sentinel-2 images was 5 days.
Remotesensing 13 04719 g003
Figure 4. (A) Evolution of the NDVI alfalfa plots in different areas of Bardenas Reales: zone I included 195 and 199 high-soil-quality plots in a low-altitude area; zone II comprised 11, 221, and 257 plots, described as regular-quality areas in a medium altitude territory; zone III consisted of 59, 63, and 347 good soil quality plots in a high-elevation area. Finally, the average NDVI evolution of the 28 rainfed alfalfa in the territory is also shown. The data are from Experiment 2, which was conducted between July 2016 and April 2019. (B) The NDVI evolution between January 2017 and May 2019 for the 28 rainfed alfalfa plots compared to an irrigated alfalfa plot in the Bardenas Reales area from Experiment 2.
Remotesensing 13 04719 g004
Table 1. Bardenas Reales rainfed alfalfa plots included in the study from July 2016 to April 2019. A quality label was assigned depending on the soil characteristics of the different plots and following the ranking established by Bardenas Reales. Area (ha), altitude (m), and slope (degrees). The orientations of 0, 90, 180, and 270 represent north-, east-, south-, and west-facing, respectively. The altitude was defined by the centroid of the polygon. The column E (experiments) indicates the plots employed for Experiment 1 and/or Experiment 2 as explained in Section 2. The records in bold represent the parcels that were used in both Experiments 1 and 2.
IDQualityArea (ha)Altitude (m)OrientationSlope (Degrees)E
195High1.06301.089810.151–2
199High1.42302.67998.011–2
221Regular1.34424.421473.051–2
257Regular2.60419.361654.191–2
11Regular2.67417.461913.661–2
63Good3.13546.481732.321–2
59Good1.98544.631552.481–2
347Good4.19538.861822.541–2
126High1.40430.712068.842
129High1.18433.642023.702
8Regular0.29416.491783.932
188Regular1.28418.502848.532
193Regular1.22407.481767.842
228Regular0.94421.242578.872
231Regular1.03421.431226.782
232Regular0.26427.561623.512
313Regular3.01421.711684.952
355Good0.74405.13729.582
30Regular2.41440.091713.642
66Regular1.04425.551573.352
67Regular0.27427.951473.692
71Regular3.33428.911513.052
157Regular2.56431.061755.232
187Regular5.15379.182319.222
494Regular0.86376.181853.832
253Regular0.27475.8726.022
58Good0.97563.191942.842
74Good1.34534.071712.772
Table 2. Sentinel-2 bands’ setting.
Band NumberFunctionCentral Wavelength (nm)Spatial Resolution (m)
1Coastal aerosol44360
2Blue49010
3Green56010
4Red66510
5Red edge70520
6Red edge74020
7Red edge78320
8NIR84210
8aRed edge86520
9Water vapor94560
10SWIR138060
11SWIR161020
12SWIR219020
Table 3. Overview of the Sentinel-2 images available for the study site during the 2016–2019 seasons: Experiment 1 (E1; marked in black) analyzed the images corresponding to 3–4 days in the spring of 2018 and 2017, respectively. Experiment 2 (E2) analyzed the images for all of the dates from July 2016 to May 2019.
DateE1E2DateE1E2DateE1E2DateE1E2
14/05/2019 X03/07/2018 X26/10/2017 X10/03/2017 X
29/04/2019 X28/06/2018 X16/10/2017 X19/01/2017 X
30/03/2019 X23/06/2018XX06/10/2017 X10/11/2016 X
05/03/2019 X19/05/2018XX17/08/2017XX21/10/2016 X
13/02/2019 X04/05/2018 X28/07/2017XX01/10/2016 X
30/11/2018 X24/04/2018 X18/07/2017XX11/09/2016 X
16/10/2018 X19/04/2018 X18/06/2017XX22/08/2016 X
01/09/2018 X29/01/2018 X19/04/2017 X12/08/2016 X
02/08/2018 X04/01/2018 X09/04/2017 X02/08/2016 X
28/07/2018XX30/12/2017 X30/03/2017 X03/07/2016 X
23/07/2018 X05/12/2017 X20/03/2017 X
Table 4. Equations described for the different vegetation indices evaluated in the present study. ρ represents reflectance values; l represents the leaf area index defined as 0.5; a represents the angle between the soil line and the NIR axis in degrees and is established in 49°.
Vegetation IndexEquationReference
Normalized difference VI N D V I = ρ 8 ρ 4 ρ 8 + ρ 4 Rouse et al. (1974)
Soil adjusted VI S A V I = ( ρ 8 ρ 4 ) ( ρ 8 + ρ 4 + l ) ( 1 + l ) Huete (1988)
Ratio VI R V I = ρ 8 ρ 4 Birth and McVey (1968)
Perpendicular VI P V I = sin a   ρ 8 cos a   ρ 4 Richardson and Wiegand (1977)
Green normalized difference VI G N D V I = ρ 8 ρ 3 ρ 8 + ρ 3 Gitelson et al. (1996)
Kernel-based NDVI k N D V I = t a n H   ( N D V I 2 ) Camps-Valls et al. (2021)
Normalized difference water index N D W I = ρ 8 ρ 12 ρ 8 + ρ 12 Cibula et al. (1992)
Specific leaf area vegetation index S L A V I = ρ 8 ρ 12 + ρ 4 Lymburner et al. (2000)
Modified chlorophyll absorption in ratio index M C A R I = [ ( ρ 5 ρ 4 ) 0.2 ( ρ 5 ρ 3 ) ] ( ρ 5 ρ 4 ) Daughtry et al. (2000)
MERIS terrestrial chlorophyll Index M T C I = ρ 6 ρ 5 ρ 5 ρ 4 Dash et al. (2010)
NDVI705 N D V I 705 = ρ 7 ρ 5 ρ 7 + ρ 5 Sims (2002)
Sentinel-2 LAI index S e L I = ρ 8 ρ 5 ρ 8 + ρ 5 Pasqualotto et al. (2019)
Table 5. Statistics obtained with a linear, polynomial of second order, and exponential order fitting for each index. Thirty-eight sample points were used for the FVC calculation in this experiment. The best fitting is represented in bold.
IndexLinear FittingPolynomial Fitting,
Second Order
Exponential Fitting
NDVI0.7130.7270.463
PVI0.7000.7050.437
kNDVI0.6590.7050.400
SAVI0.6950.7000.431
RVI0.6060.6860.350
SeLI0.6800.6800.570
NDVI7050.6780.6800.600
MCARI0.6530.6700.437
GNDVI0.6580.6580.497
SLAVI0.6140.6520.345
NDWI0.6280.6280.468
MTCI0.5060.5100.518
Publisher’s Note: MDPI stays neutral with regard to jurisdictional claims in published maps and institutional affiliations.

