
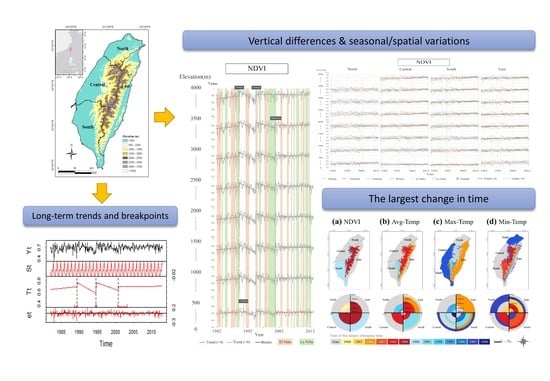
Vertical Differences in the Long-Term Trends and Breakpoints of NDVI and Climate Factors in Taiwan


Abstract
:
1. Introduction
2. Materials and Methods
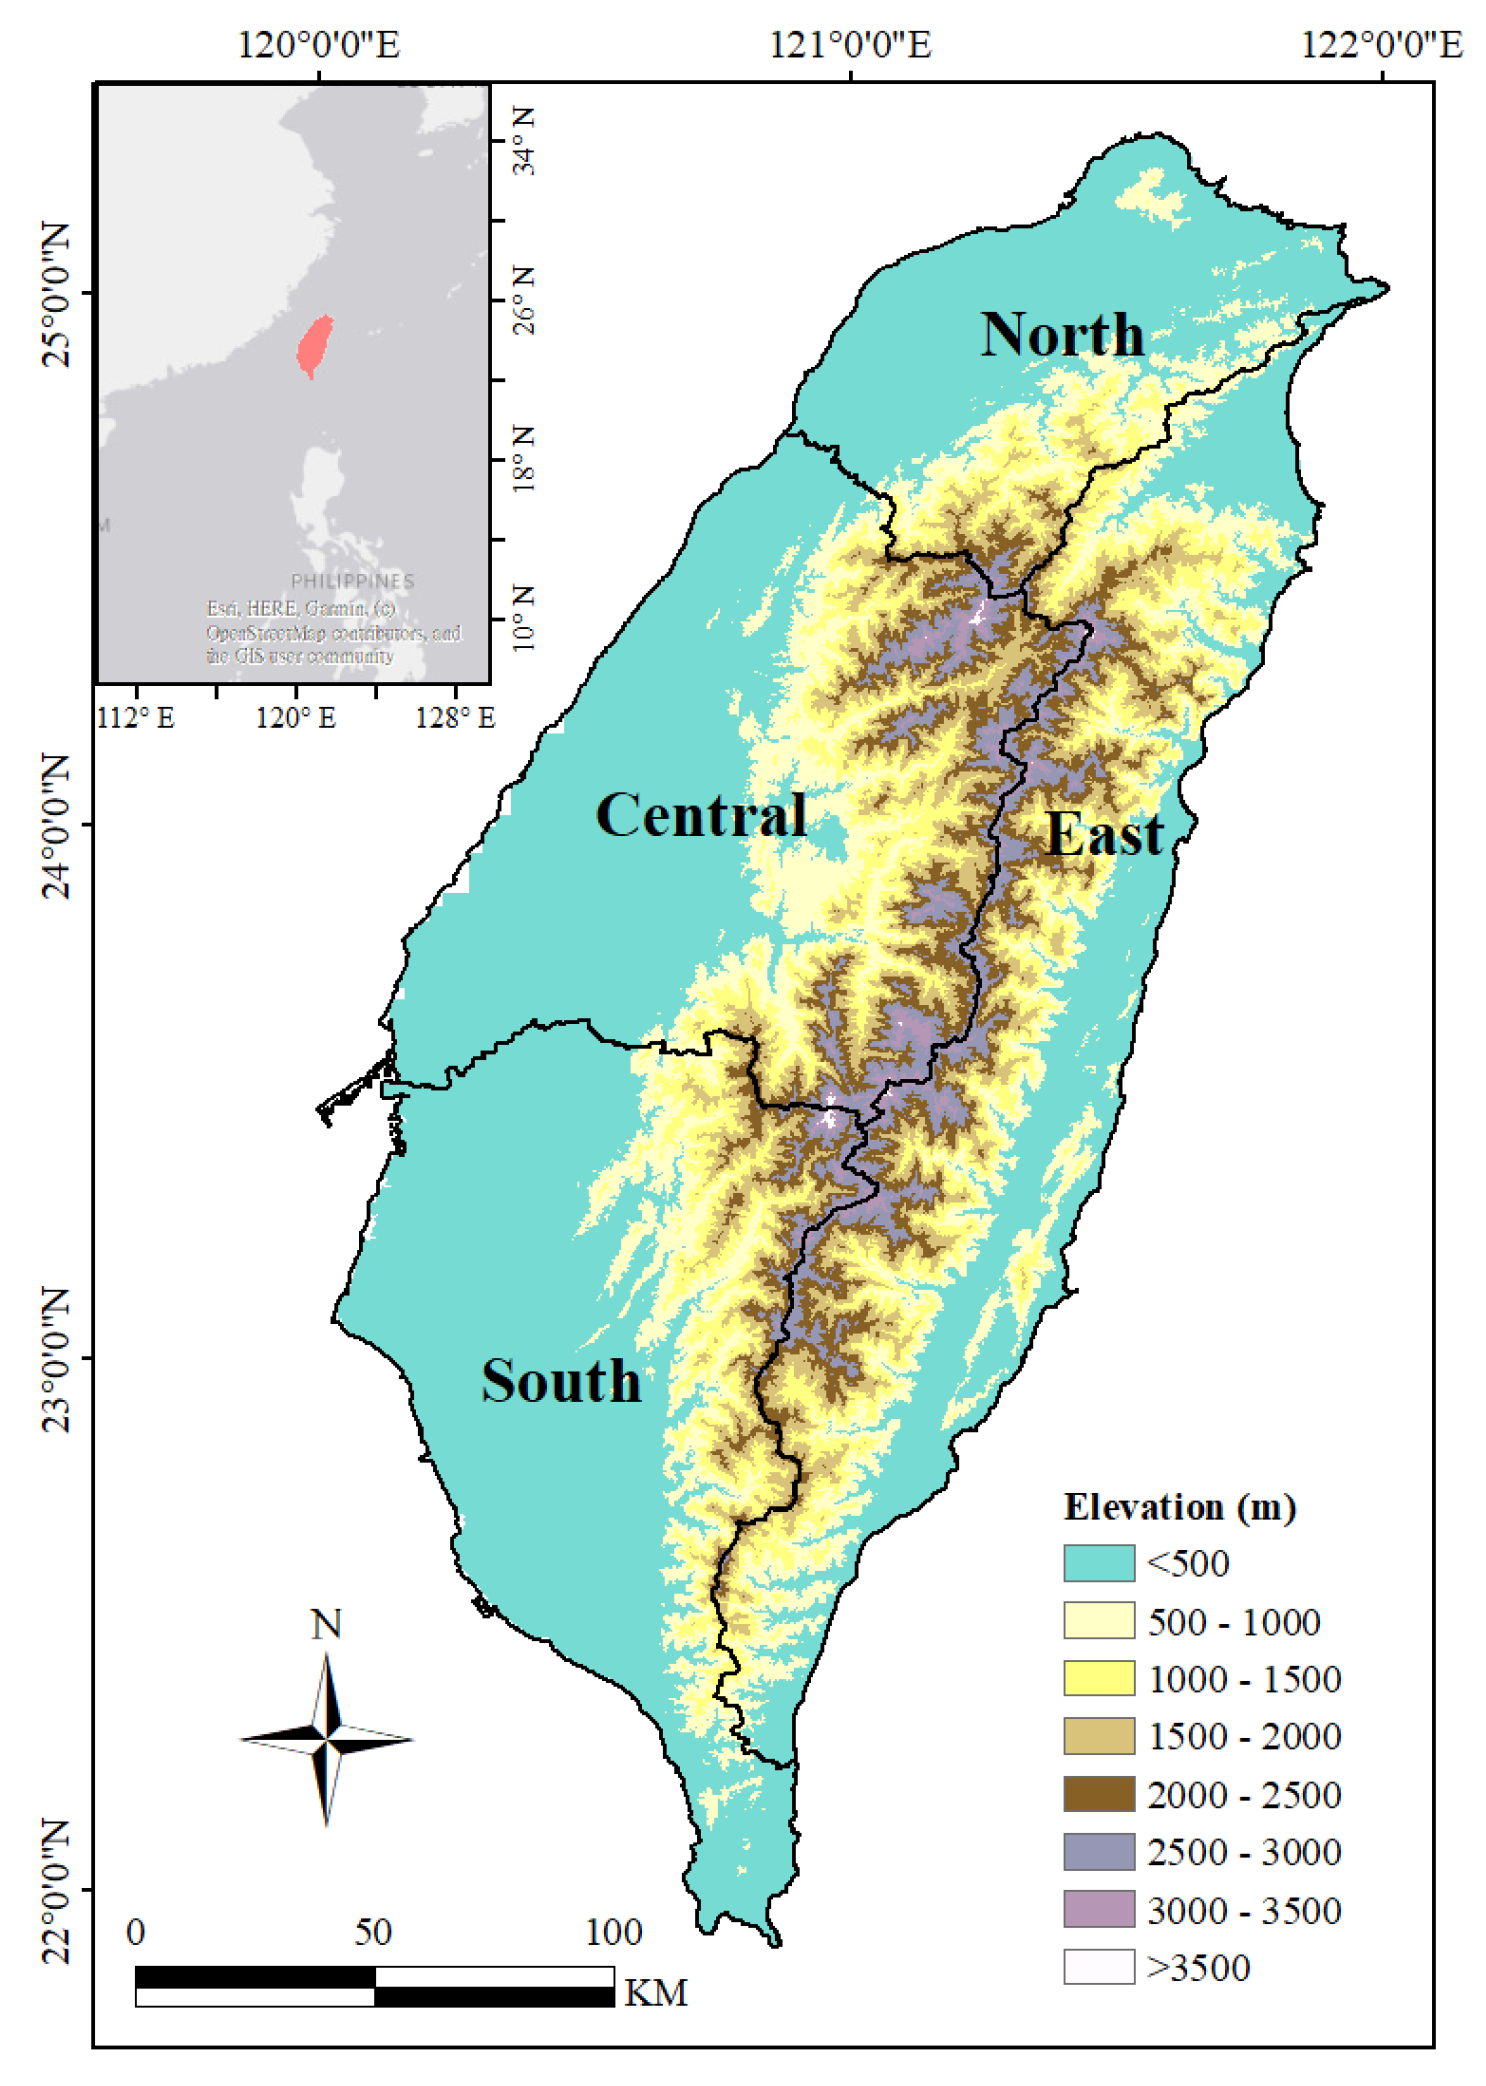
2.1. Study Area
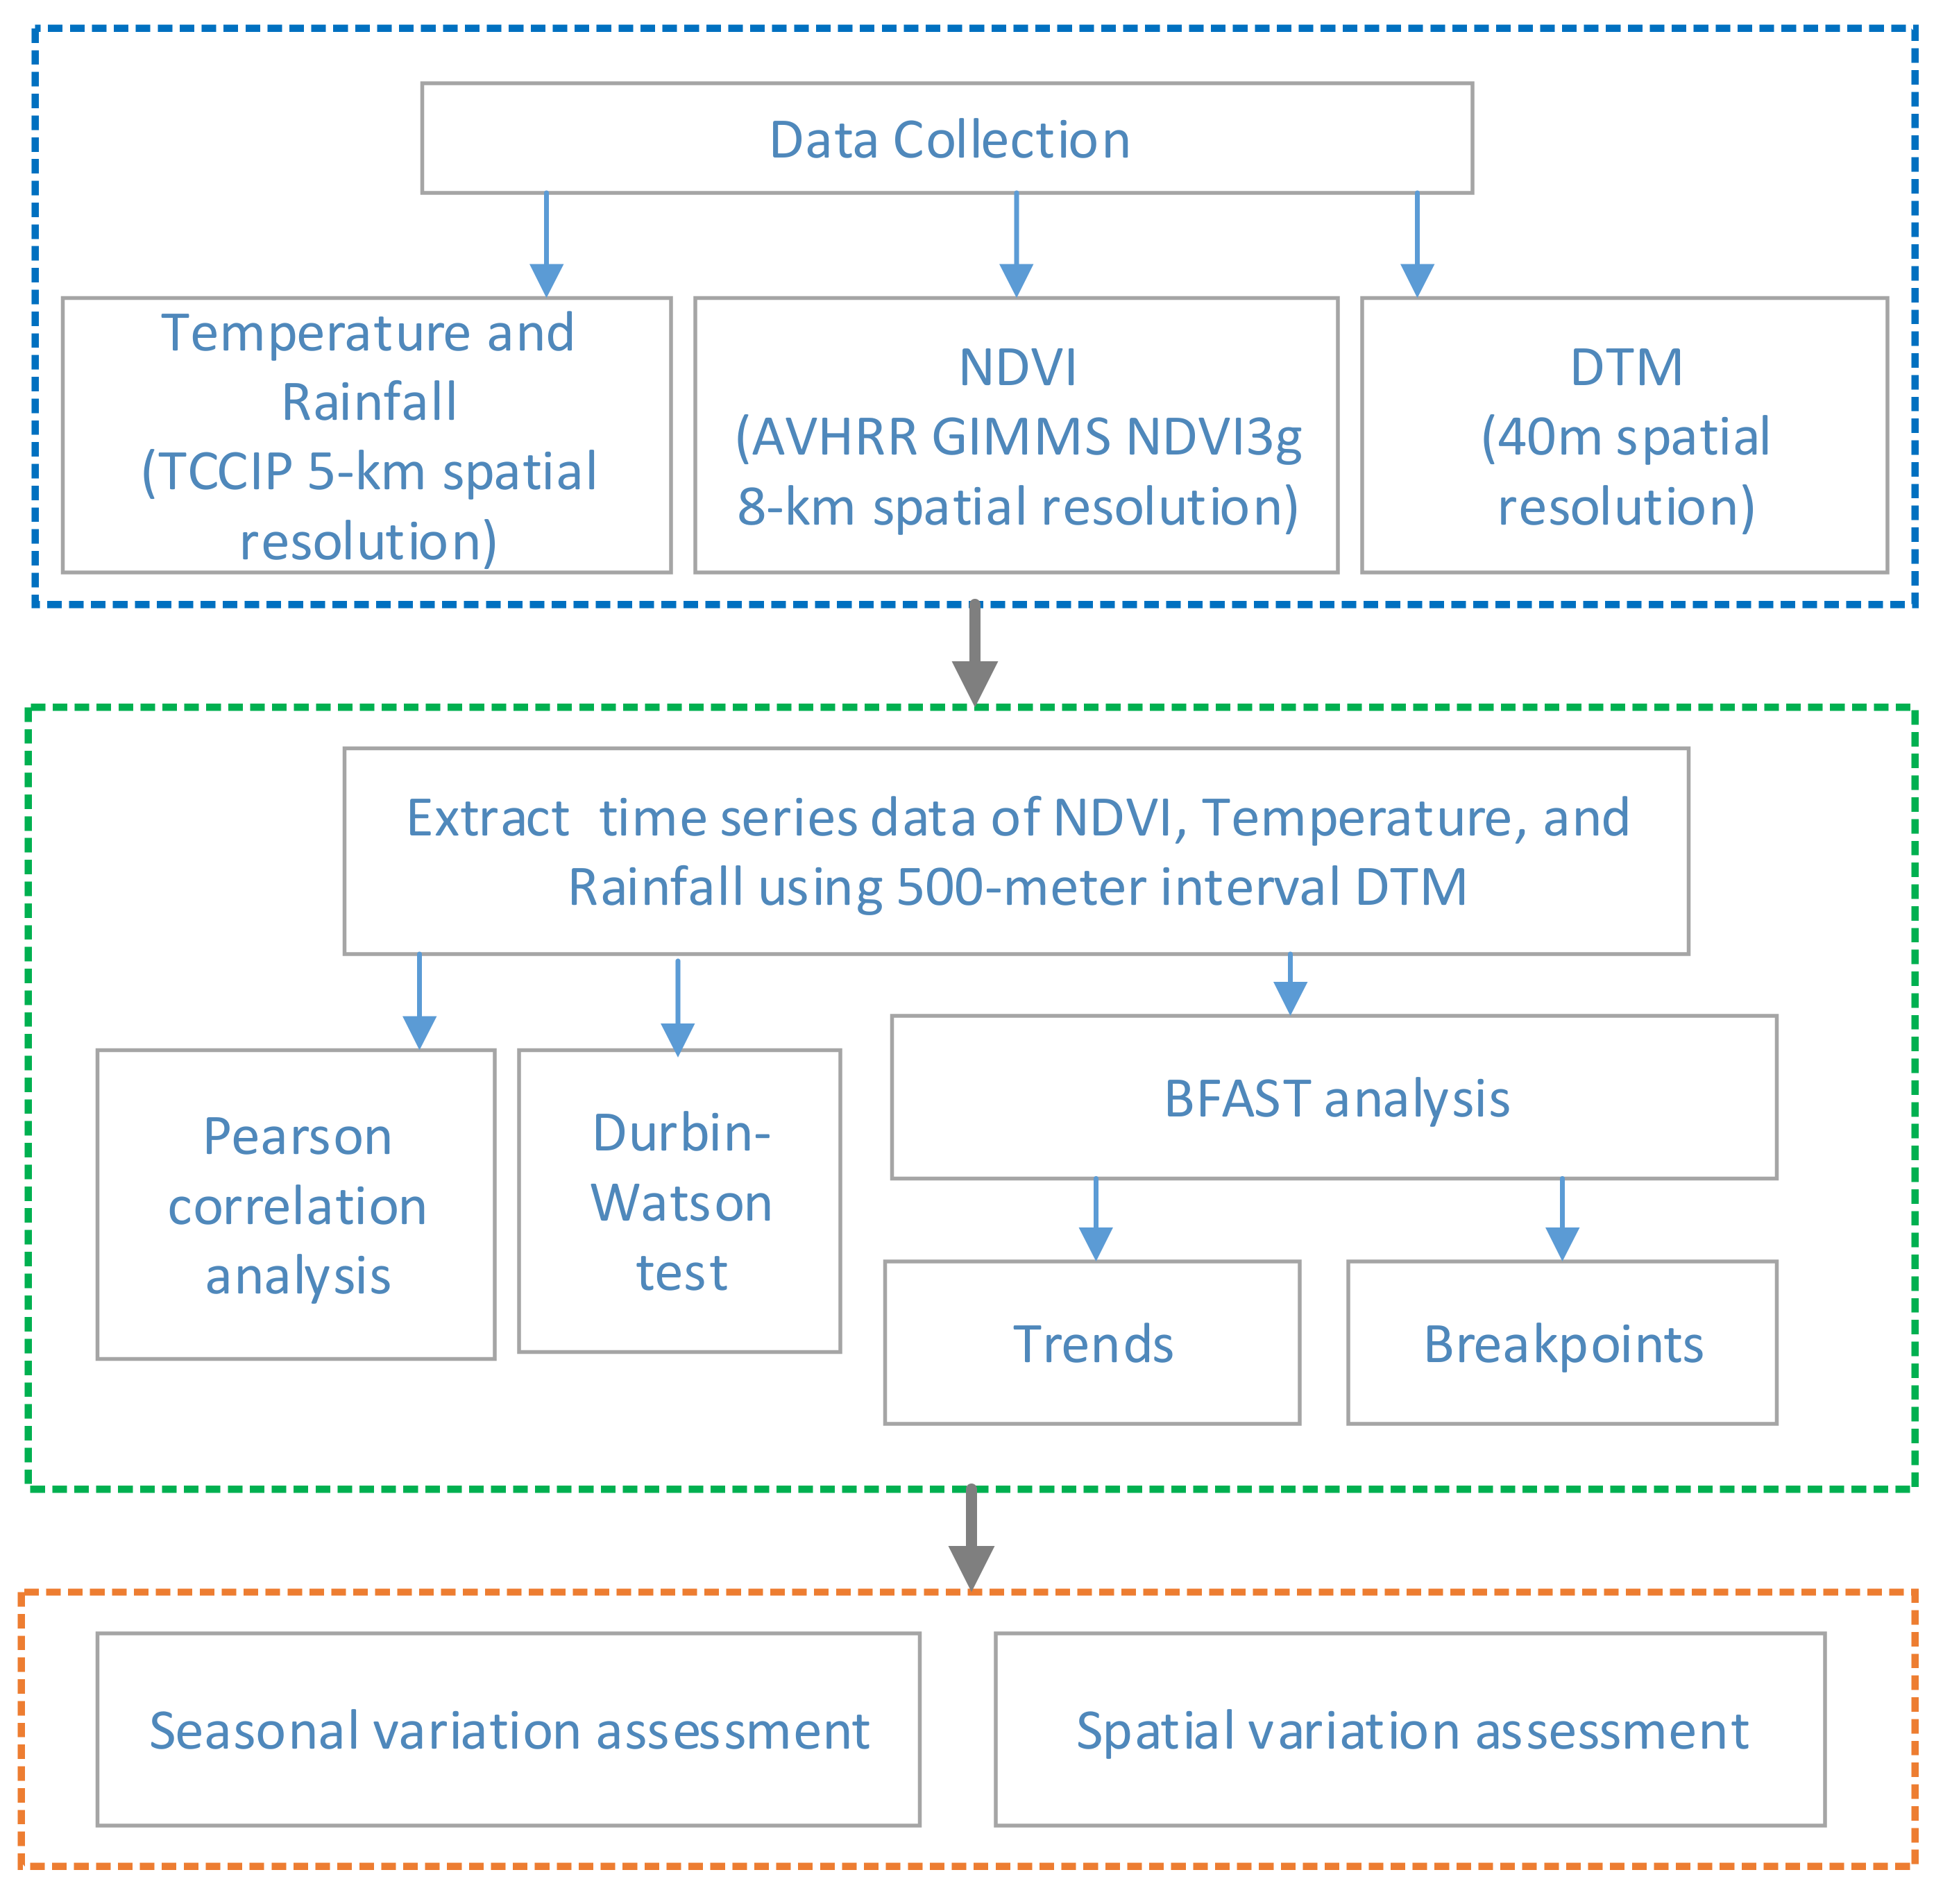
2.2. Research Flow
2.3. The Normalized Difference Vegetation Index (NDVI)
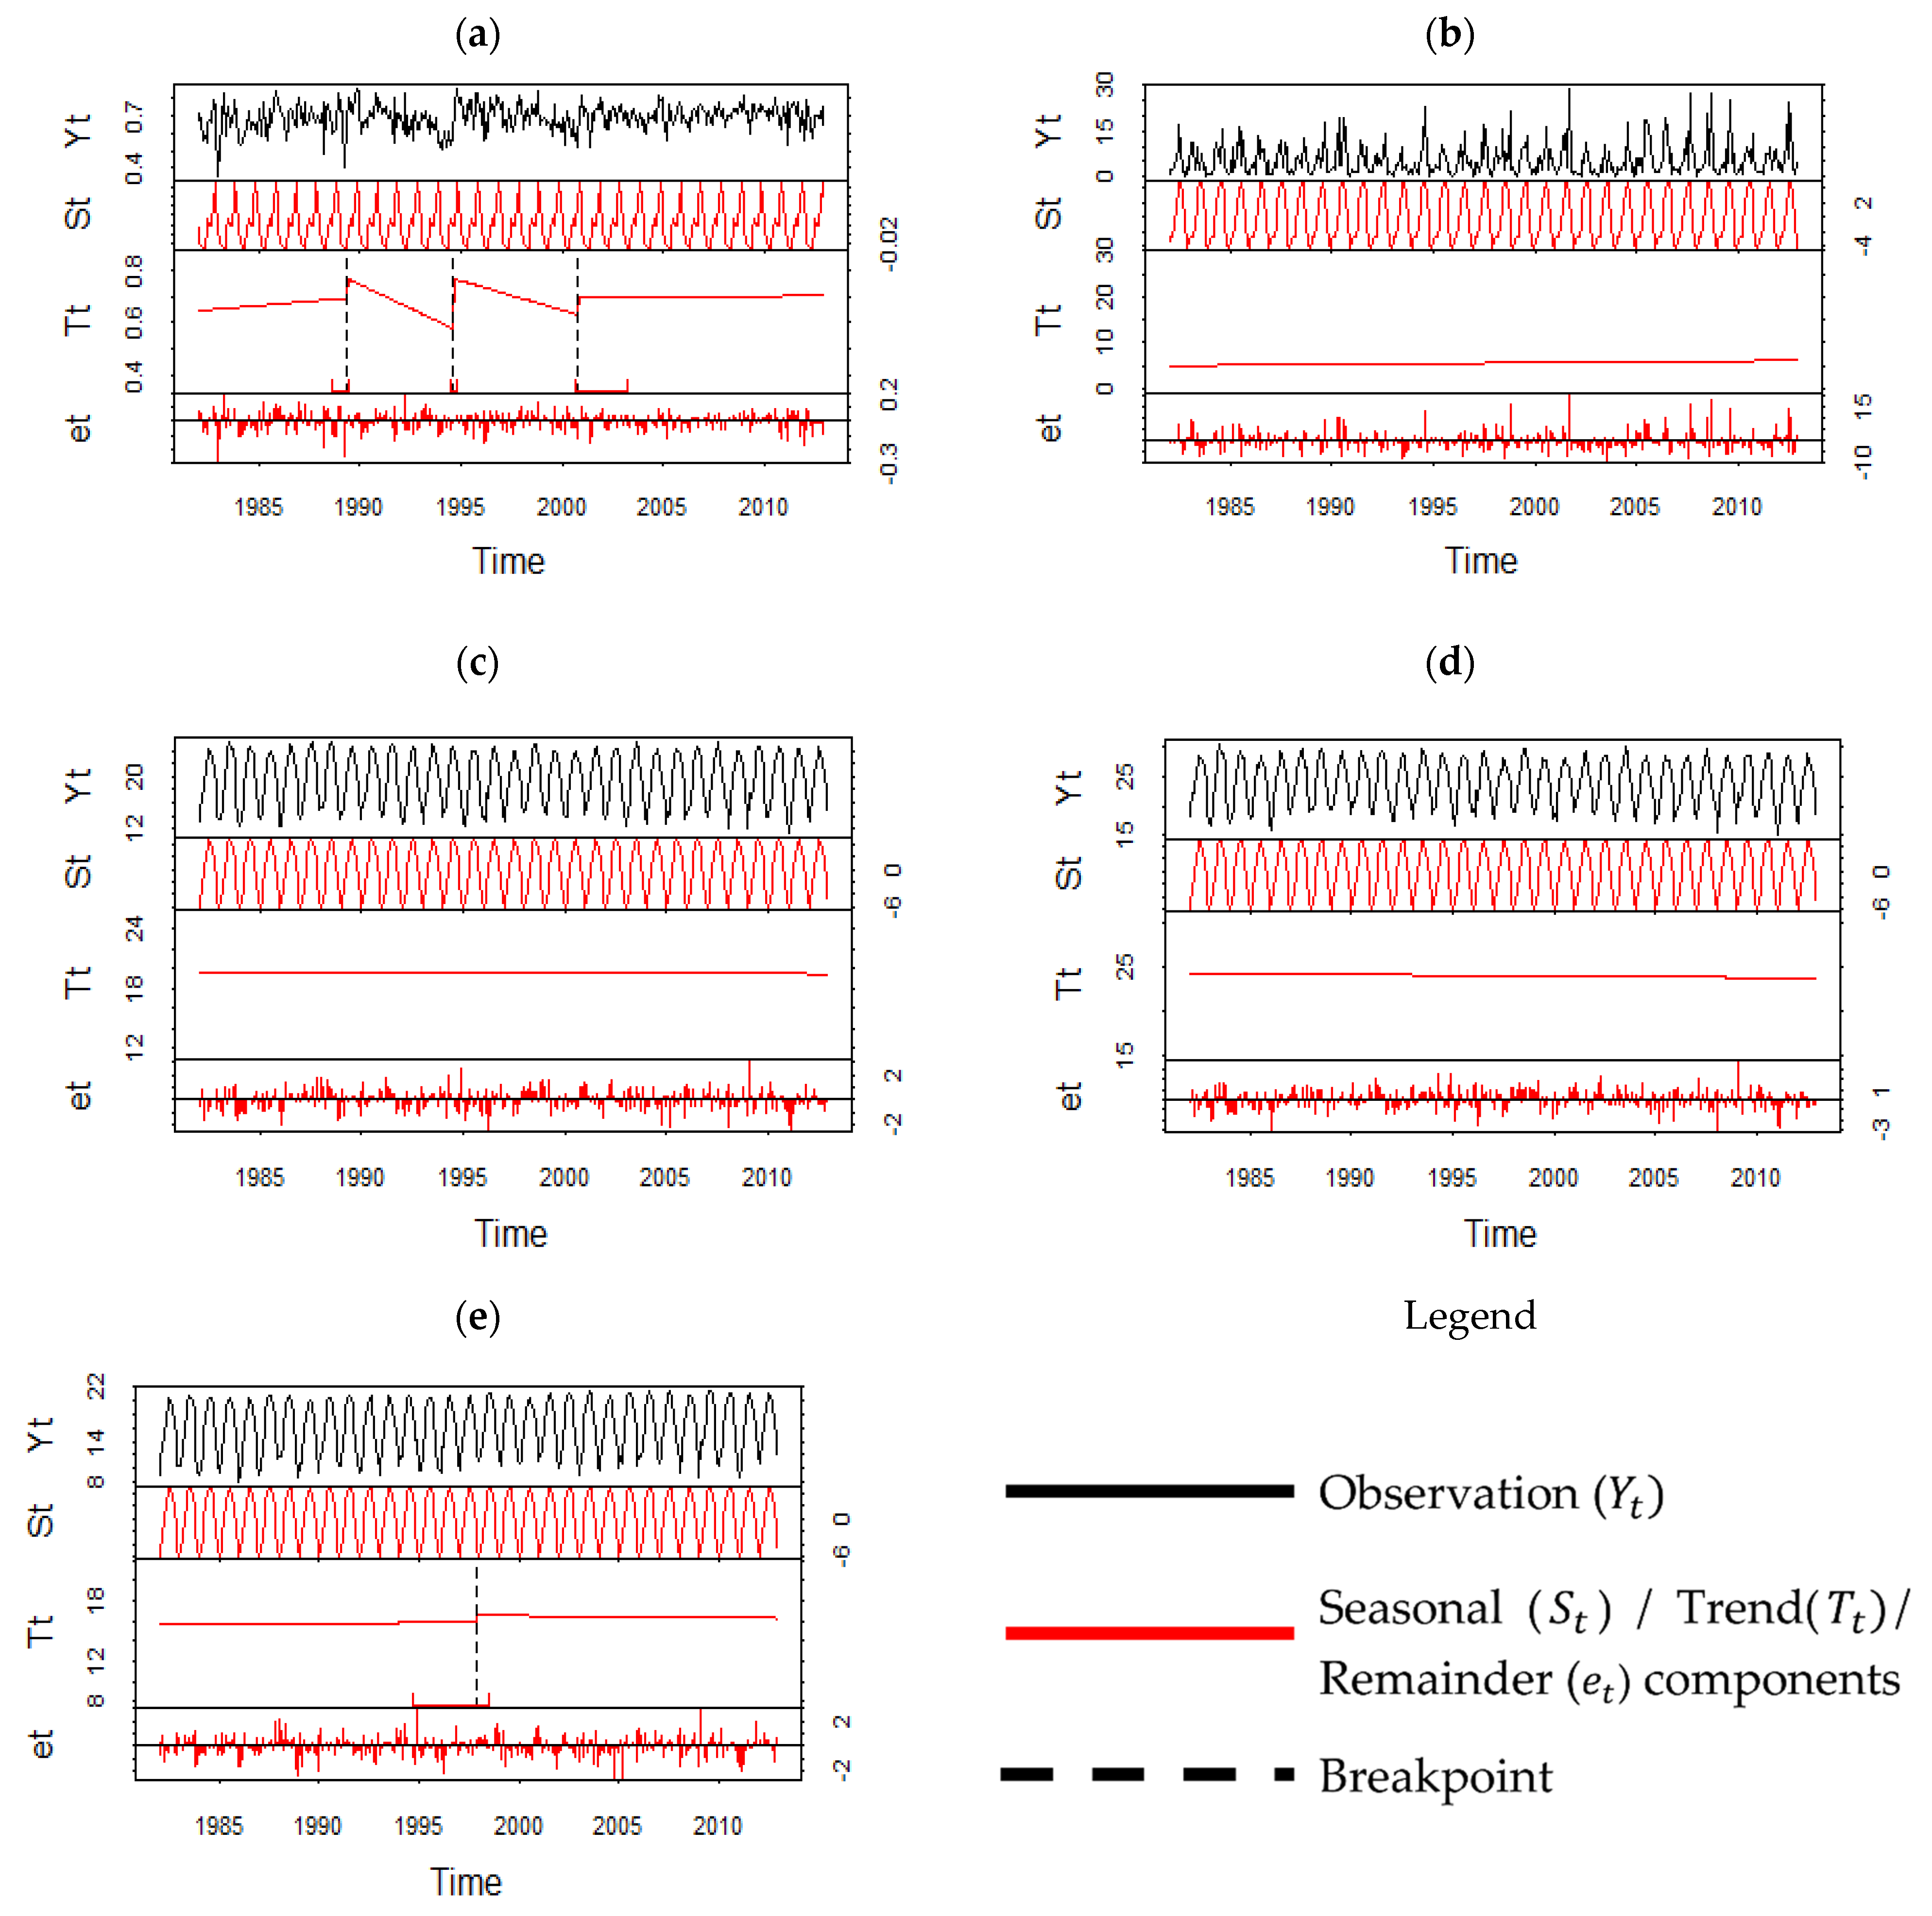
2.4. Break for Additive Seasonal and Trend (BFAST)
2.5. Pearson’s Product–Moment Correlation Coefficient and Serial Autocorrelation
3. Results and Discussion
3.1. Temporal Variation of NDVI, Rainfall, and Temperature in Taiwan
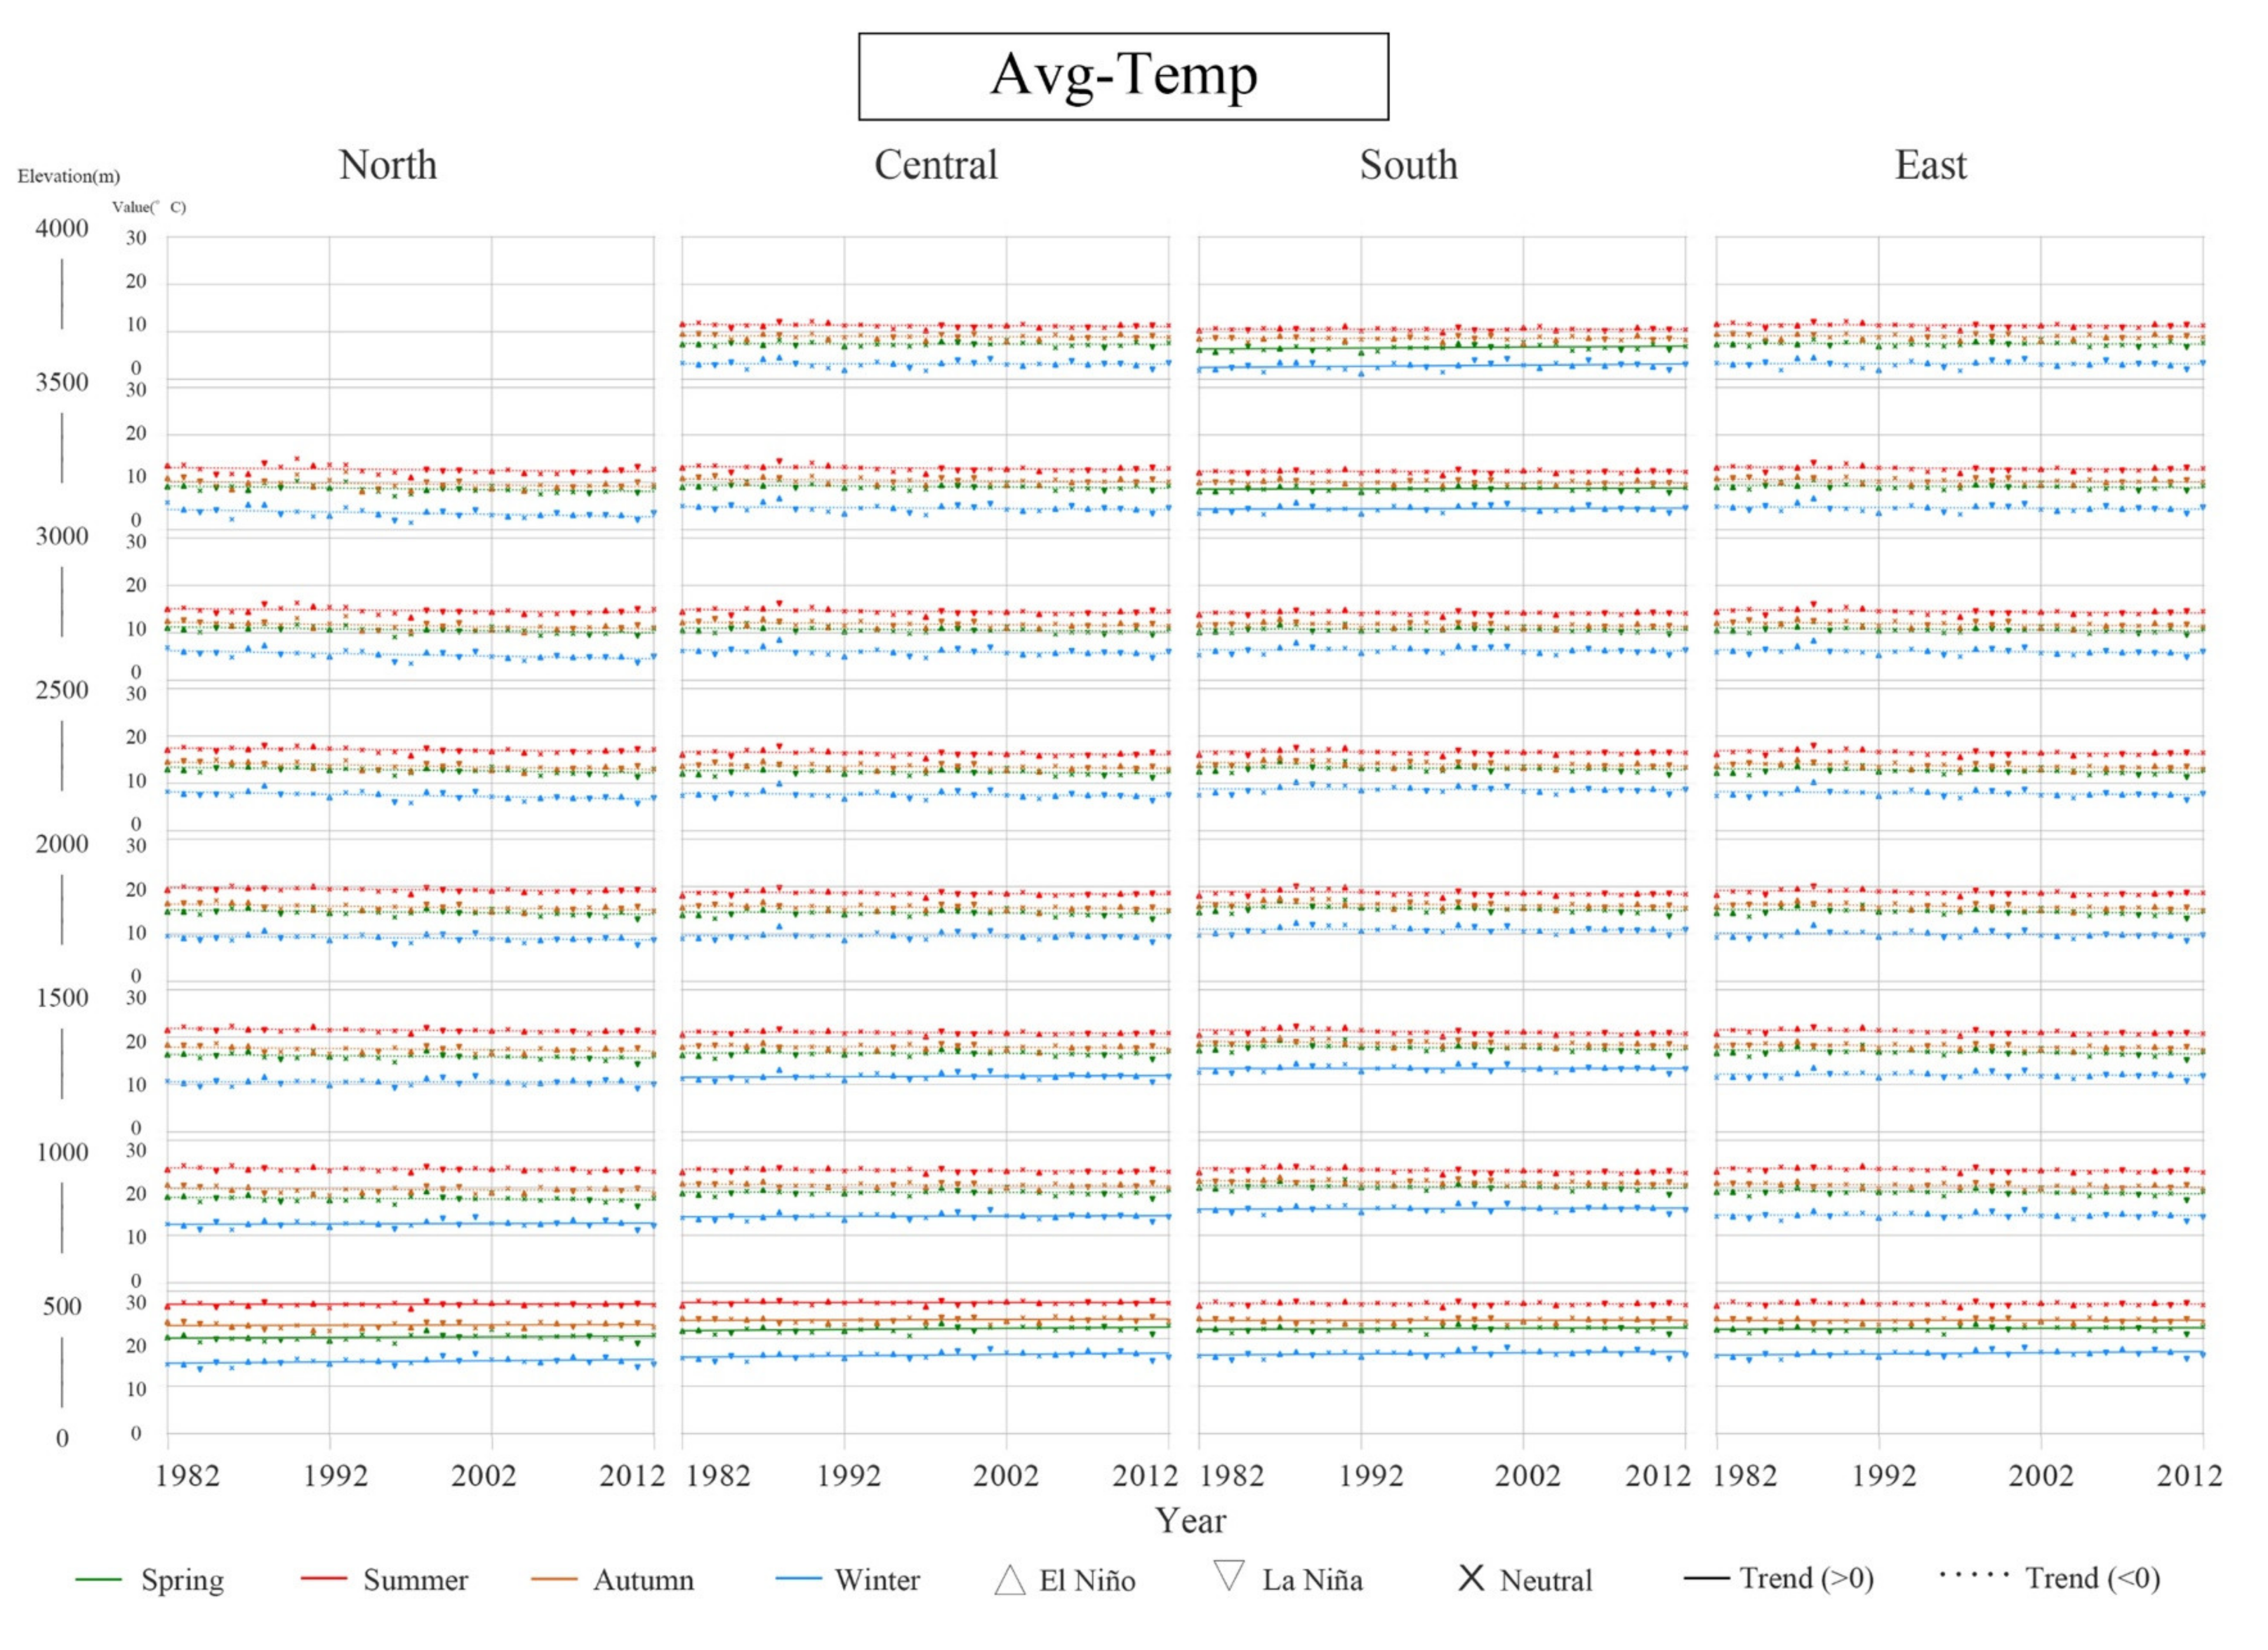
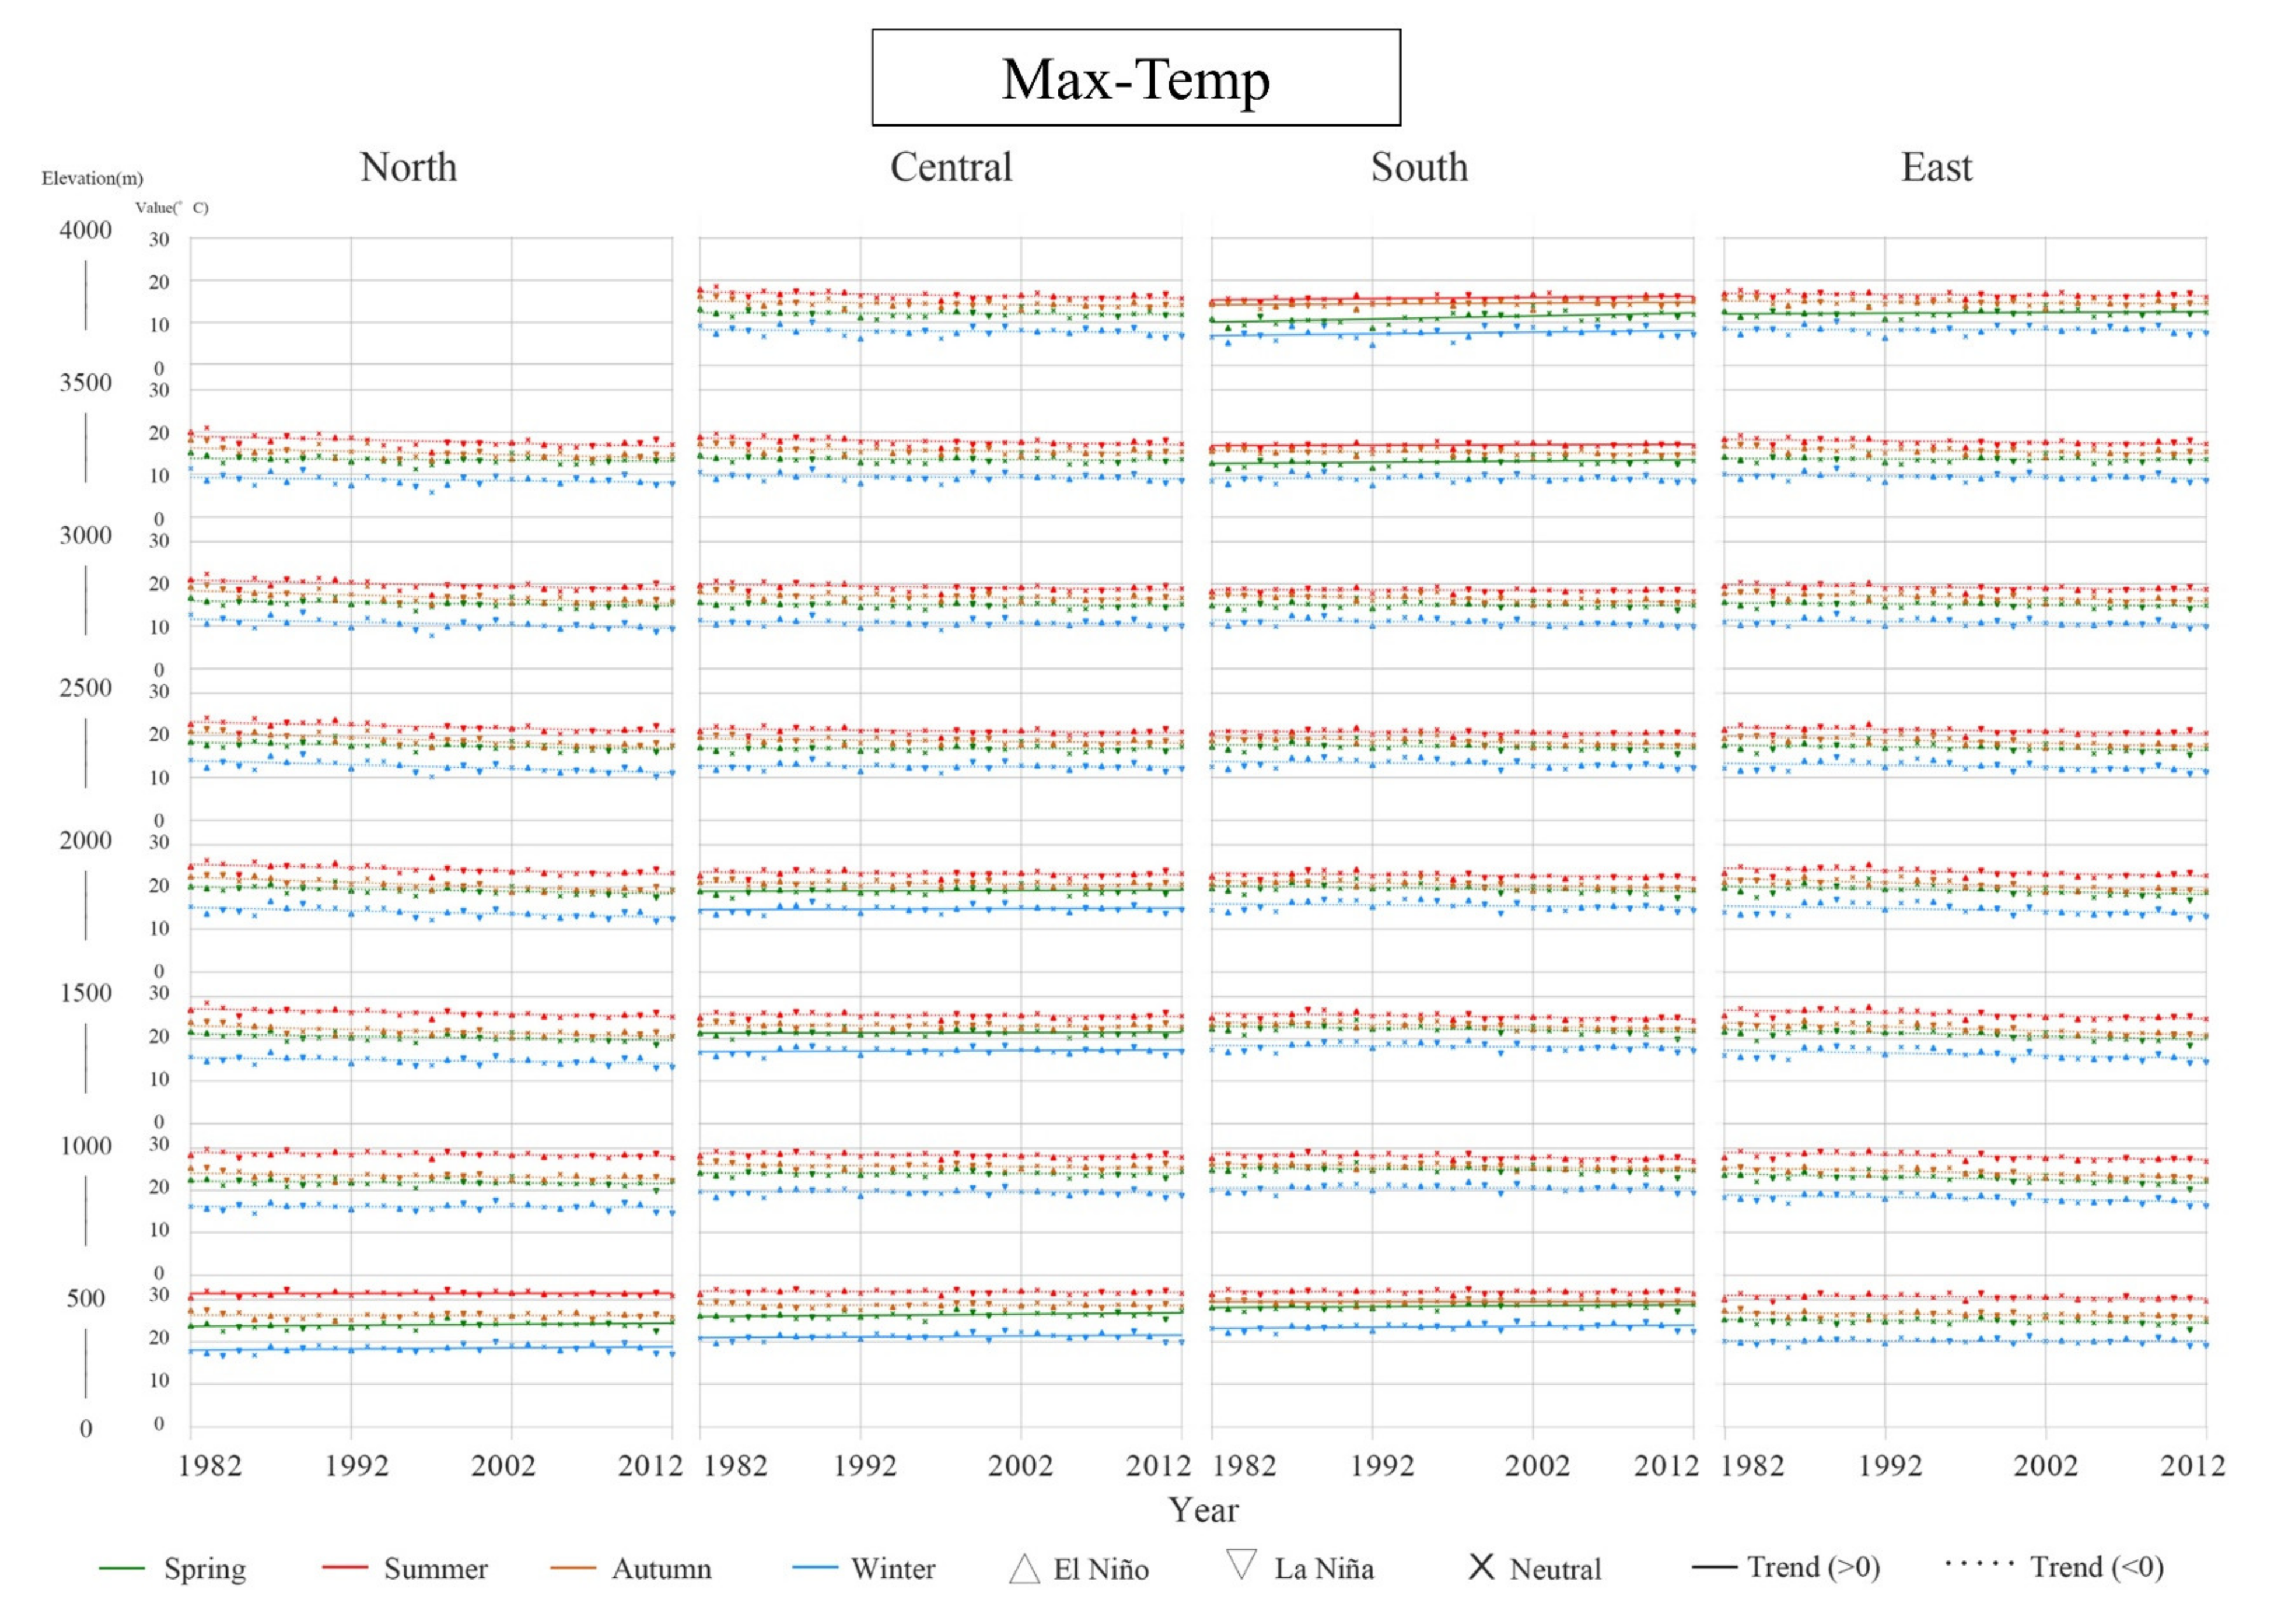
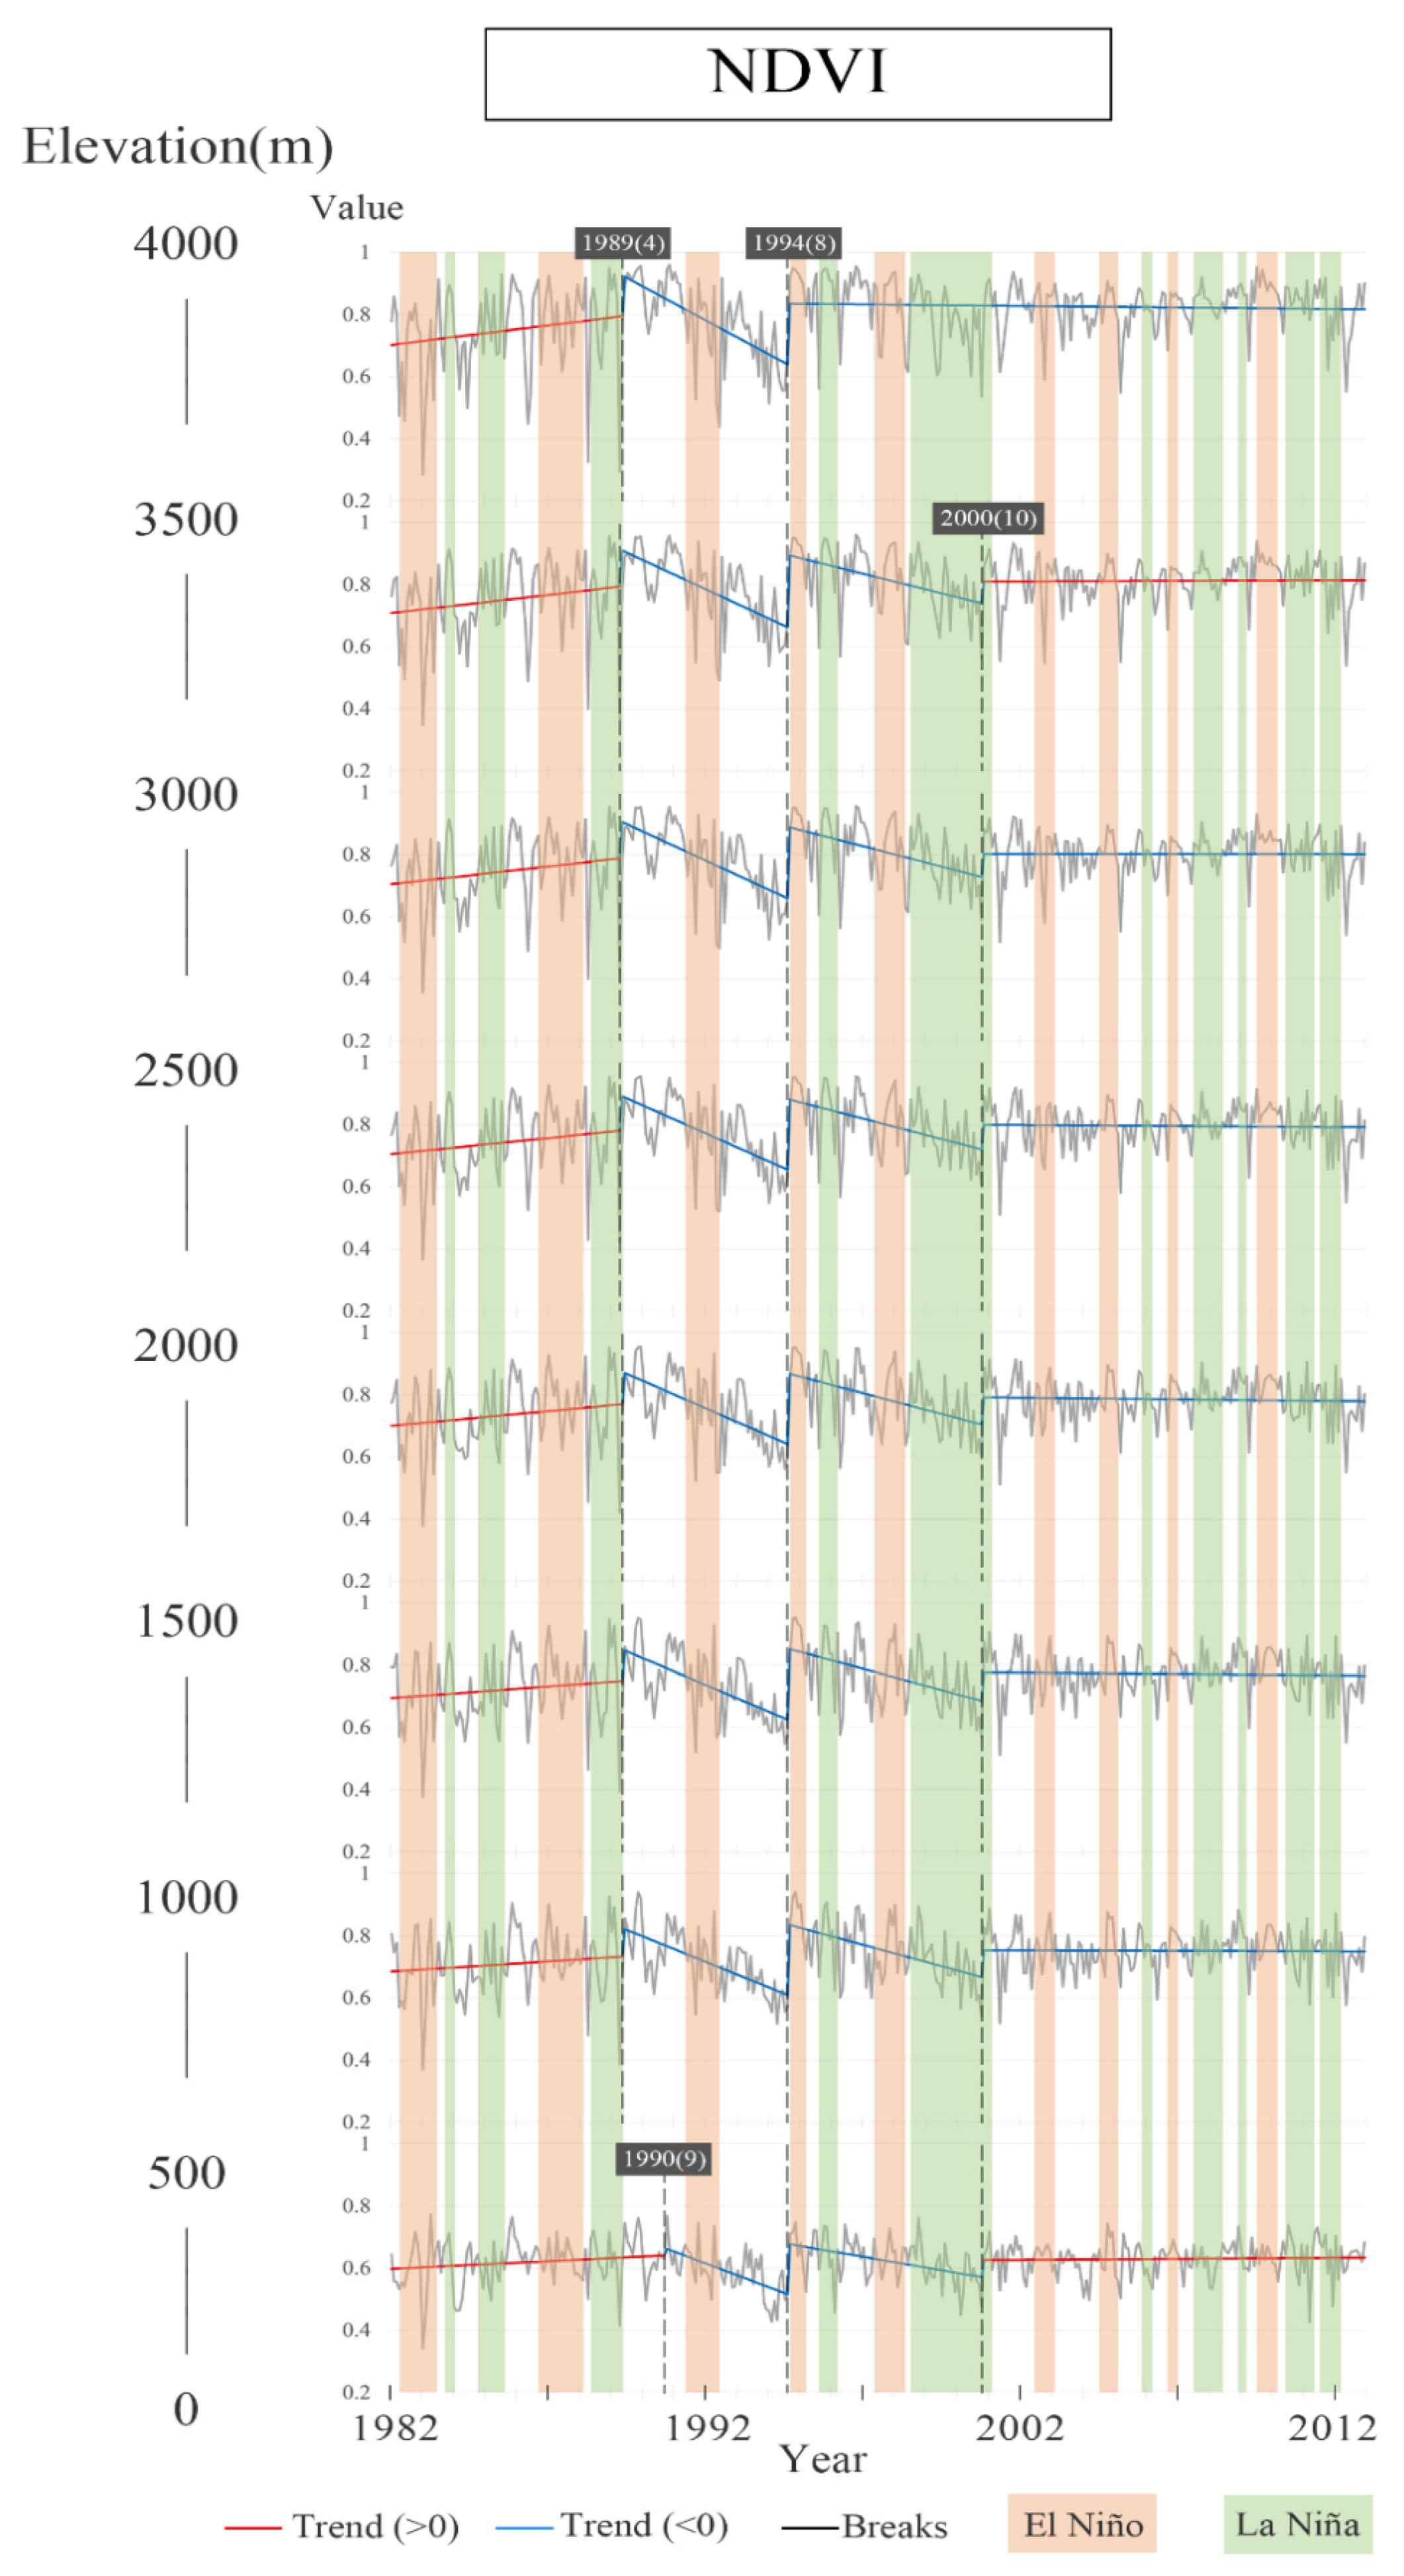
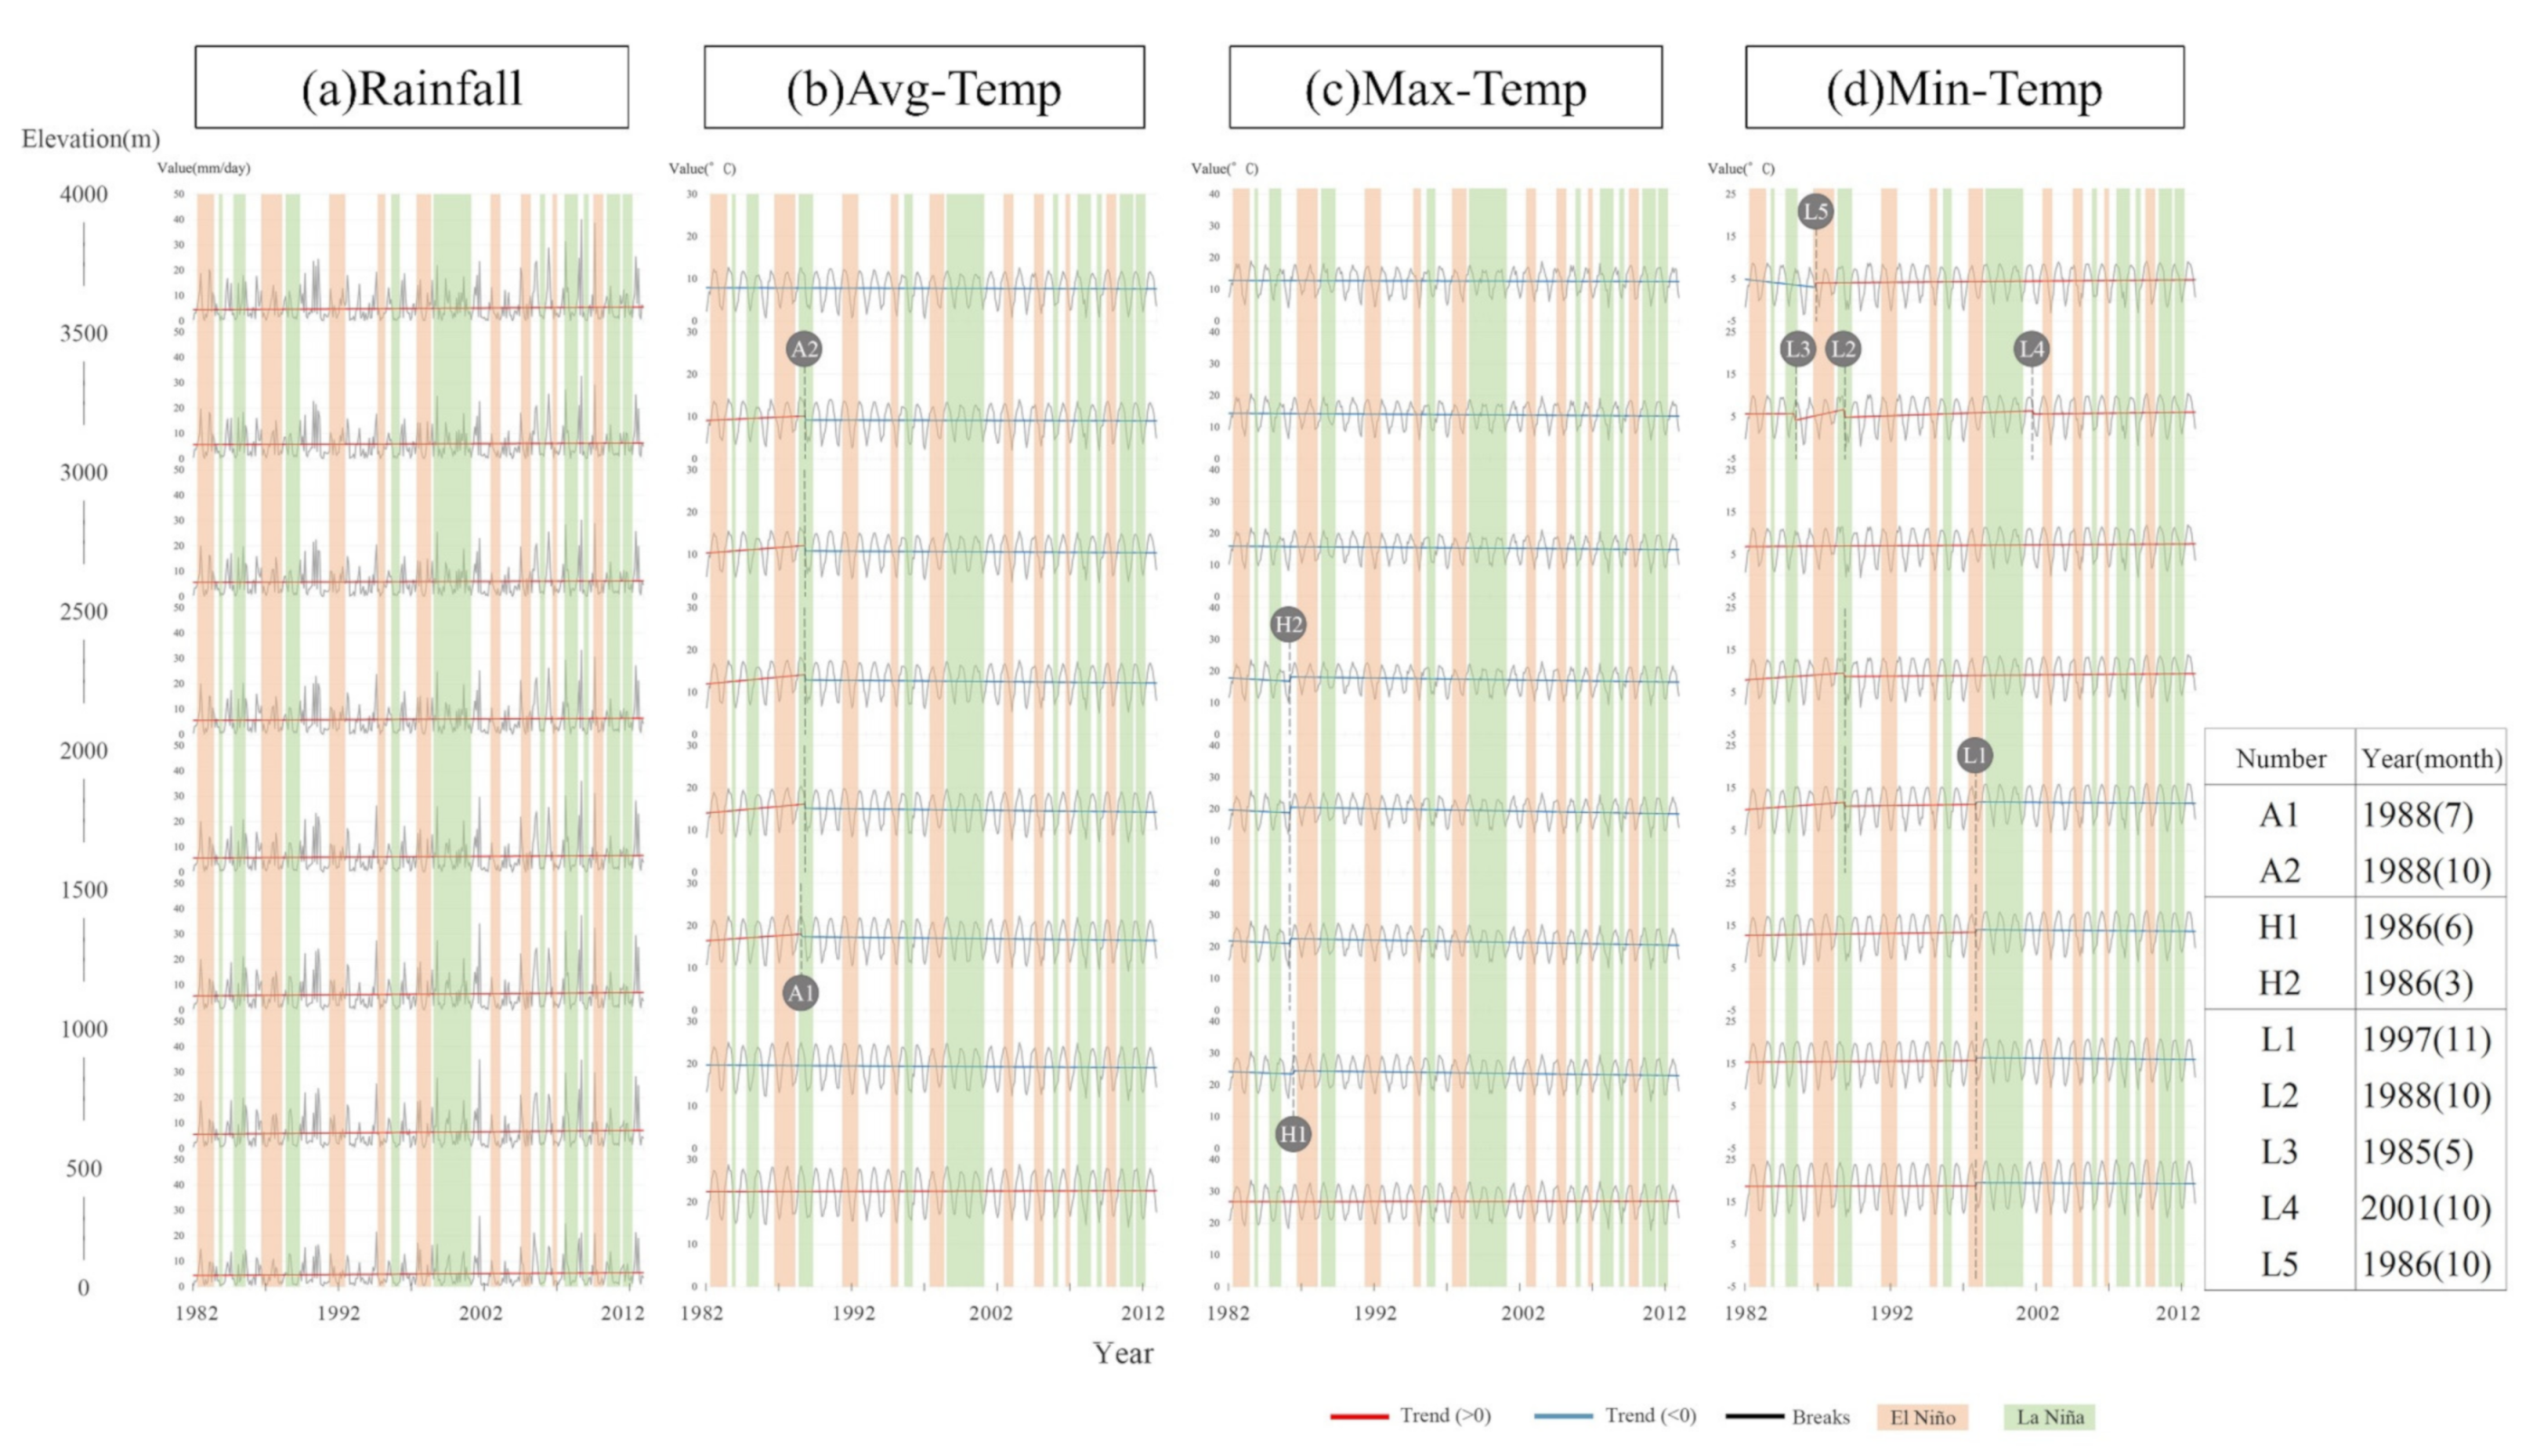
3.2. Temporal Variations of NDVI, Rainfall, and Temperature in Taiwan at Varied Elevations
3.3. Regional Variations of NDVI, Rainfall, and Temperature in Taiwan at Varied Elevations
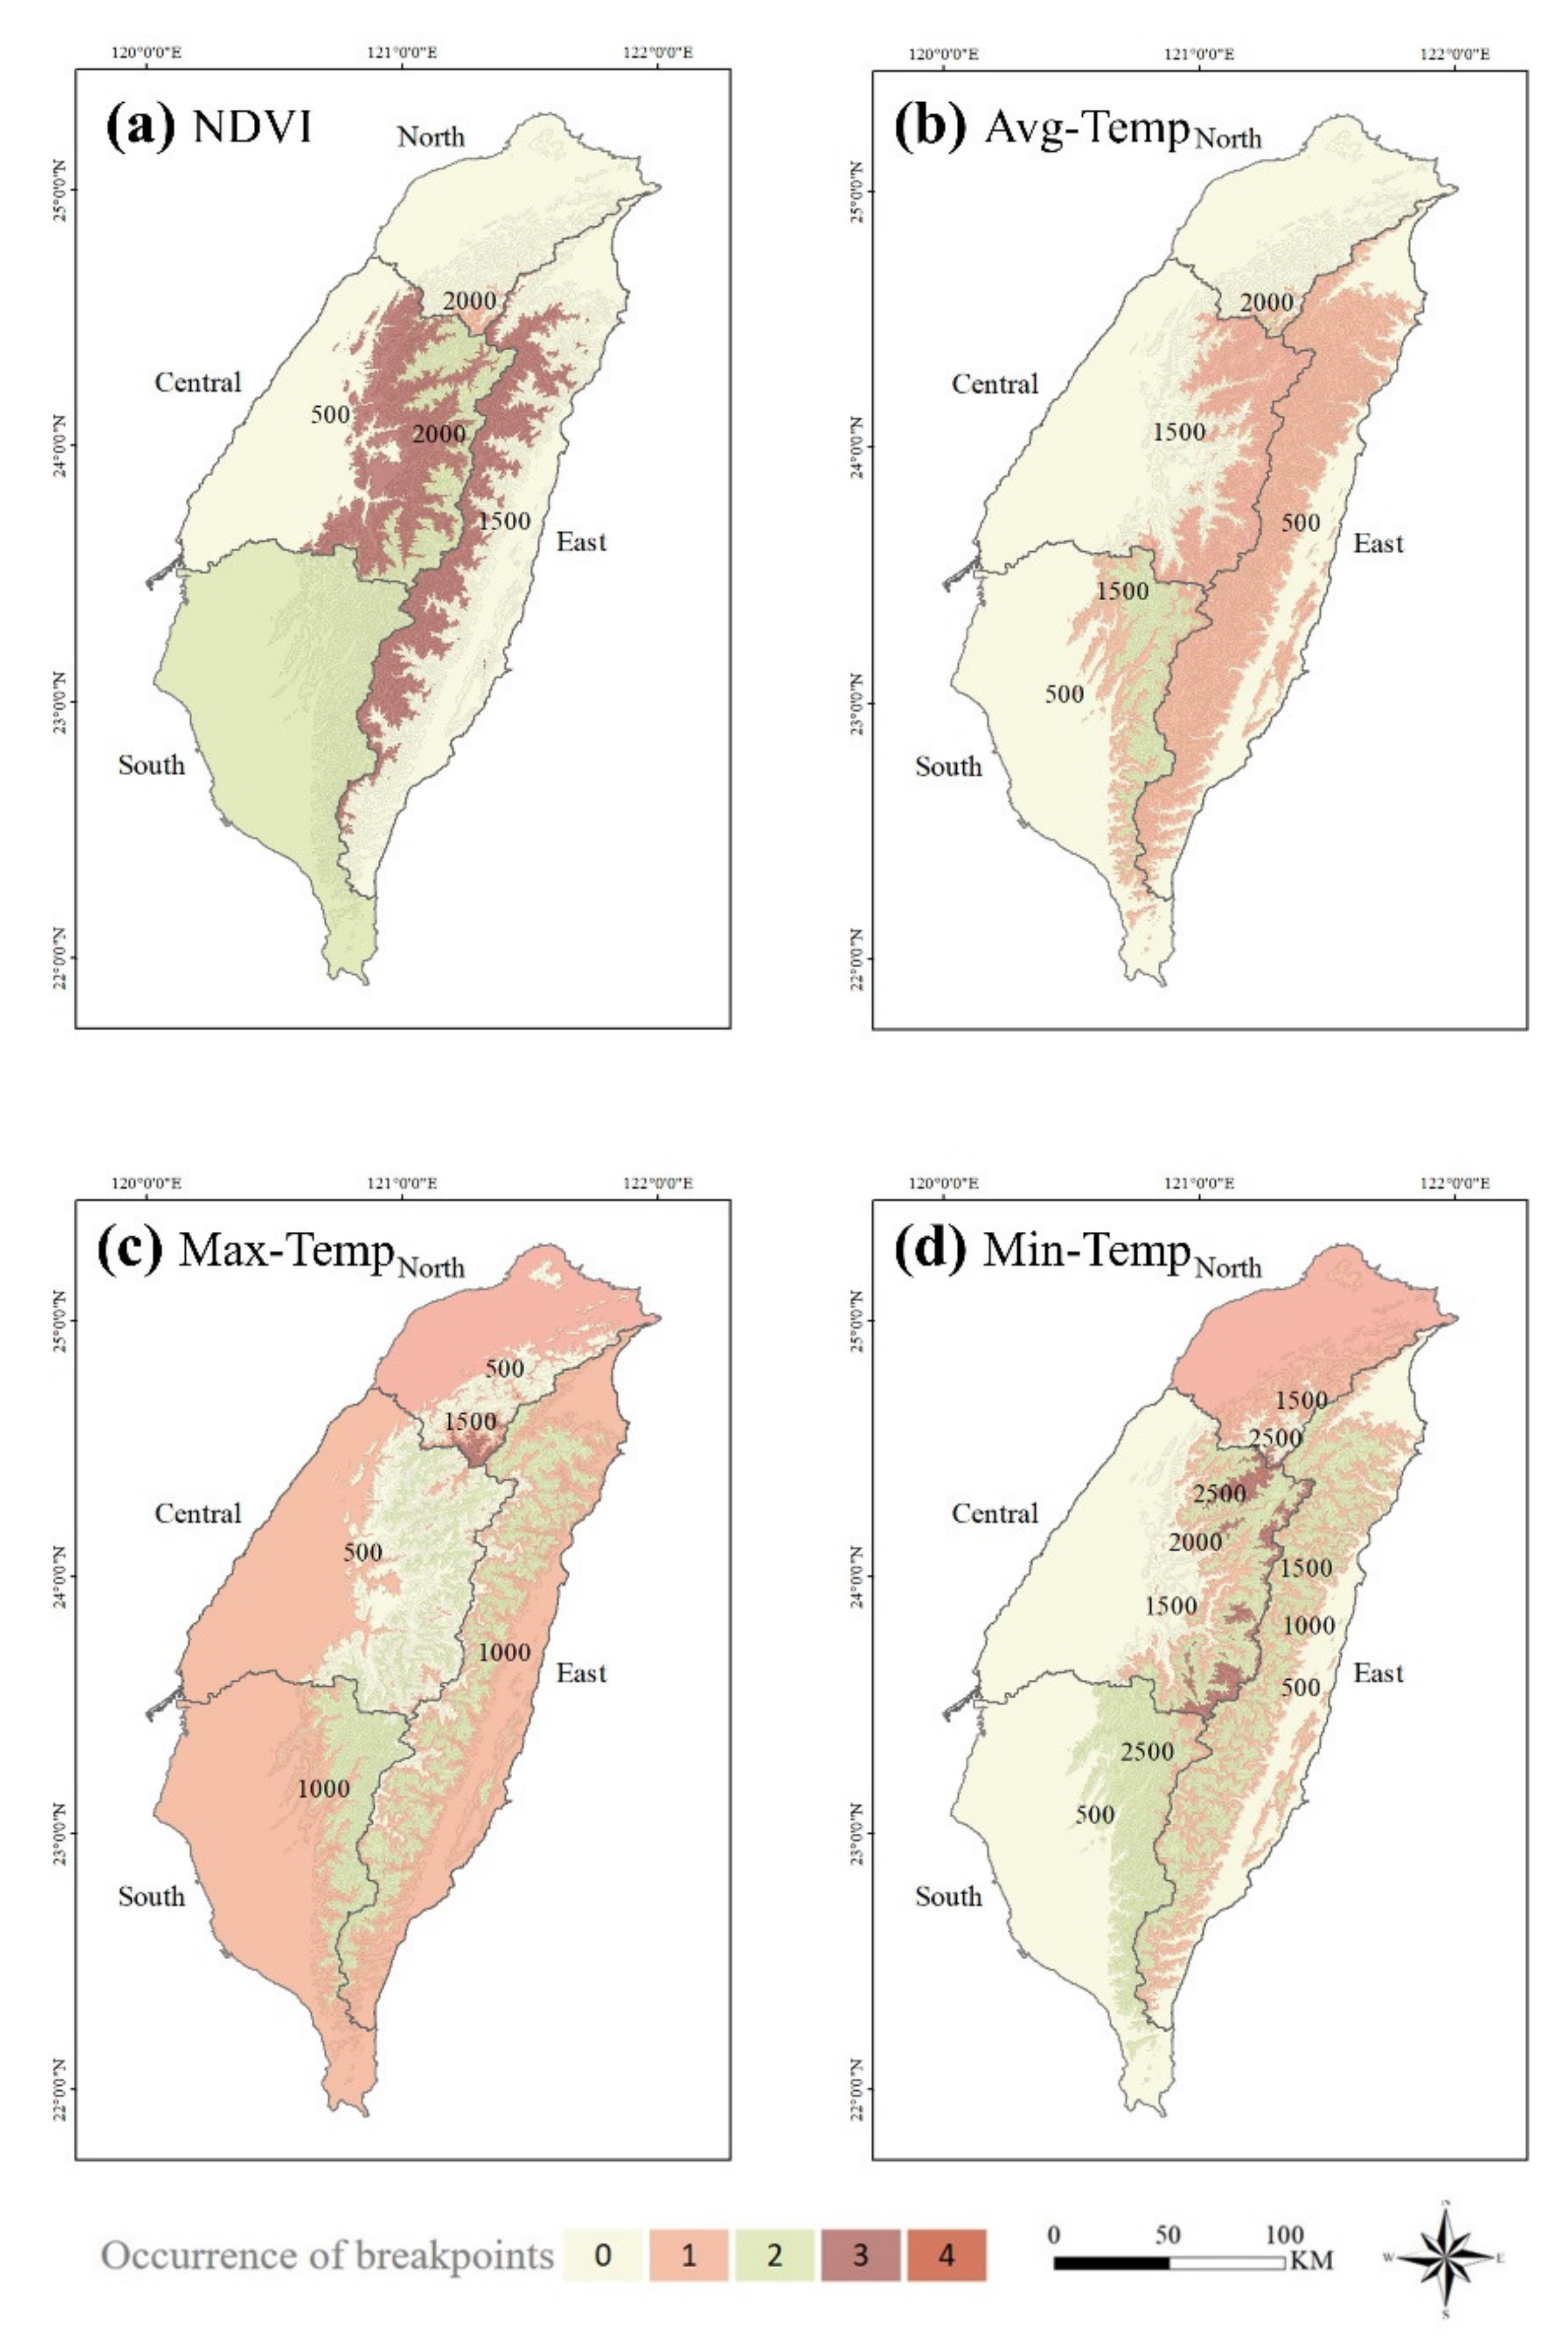
3.3.1. Occurrence of Breakpoints
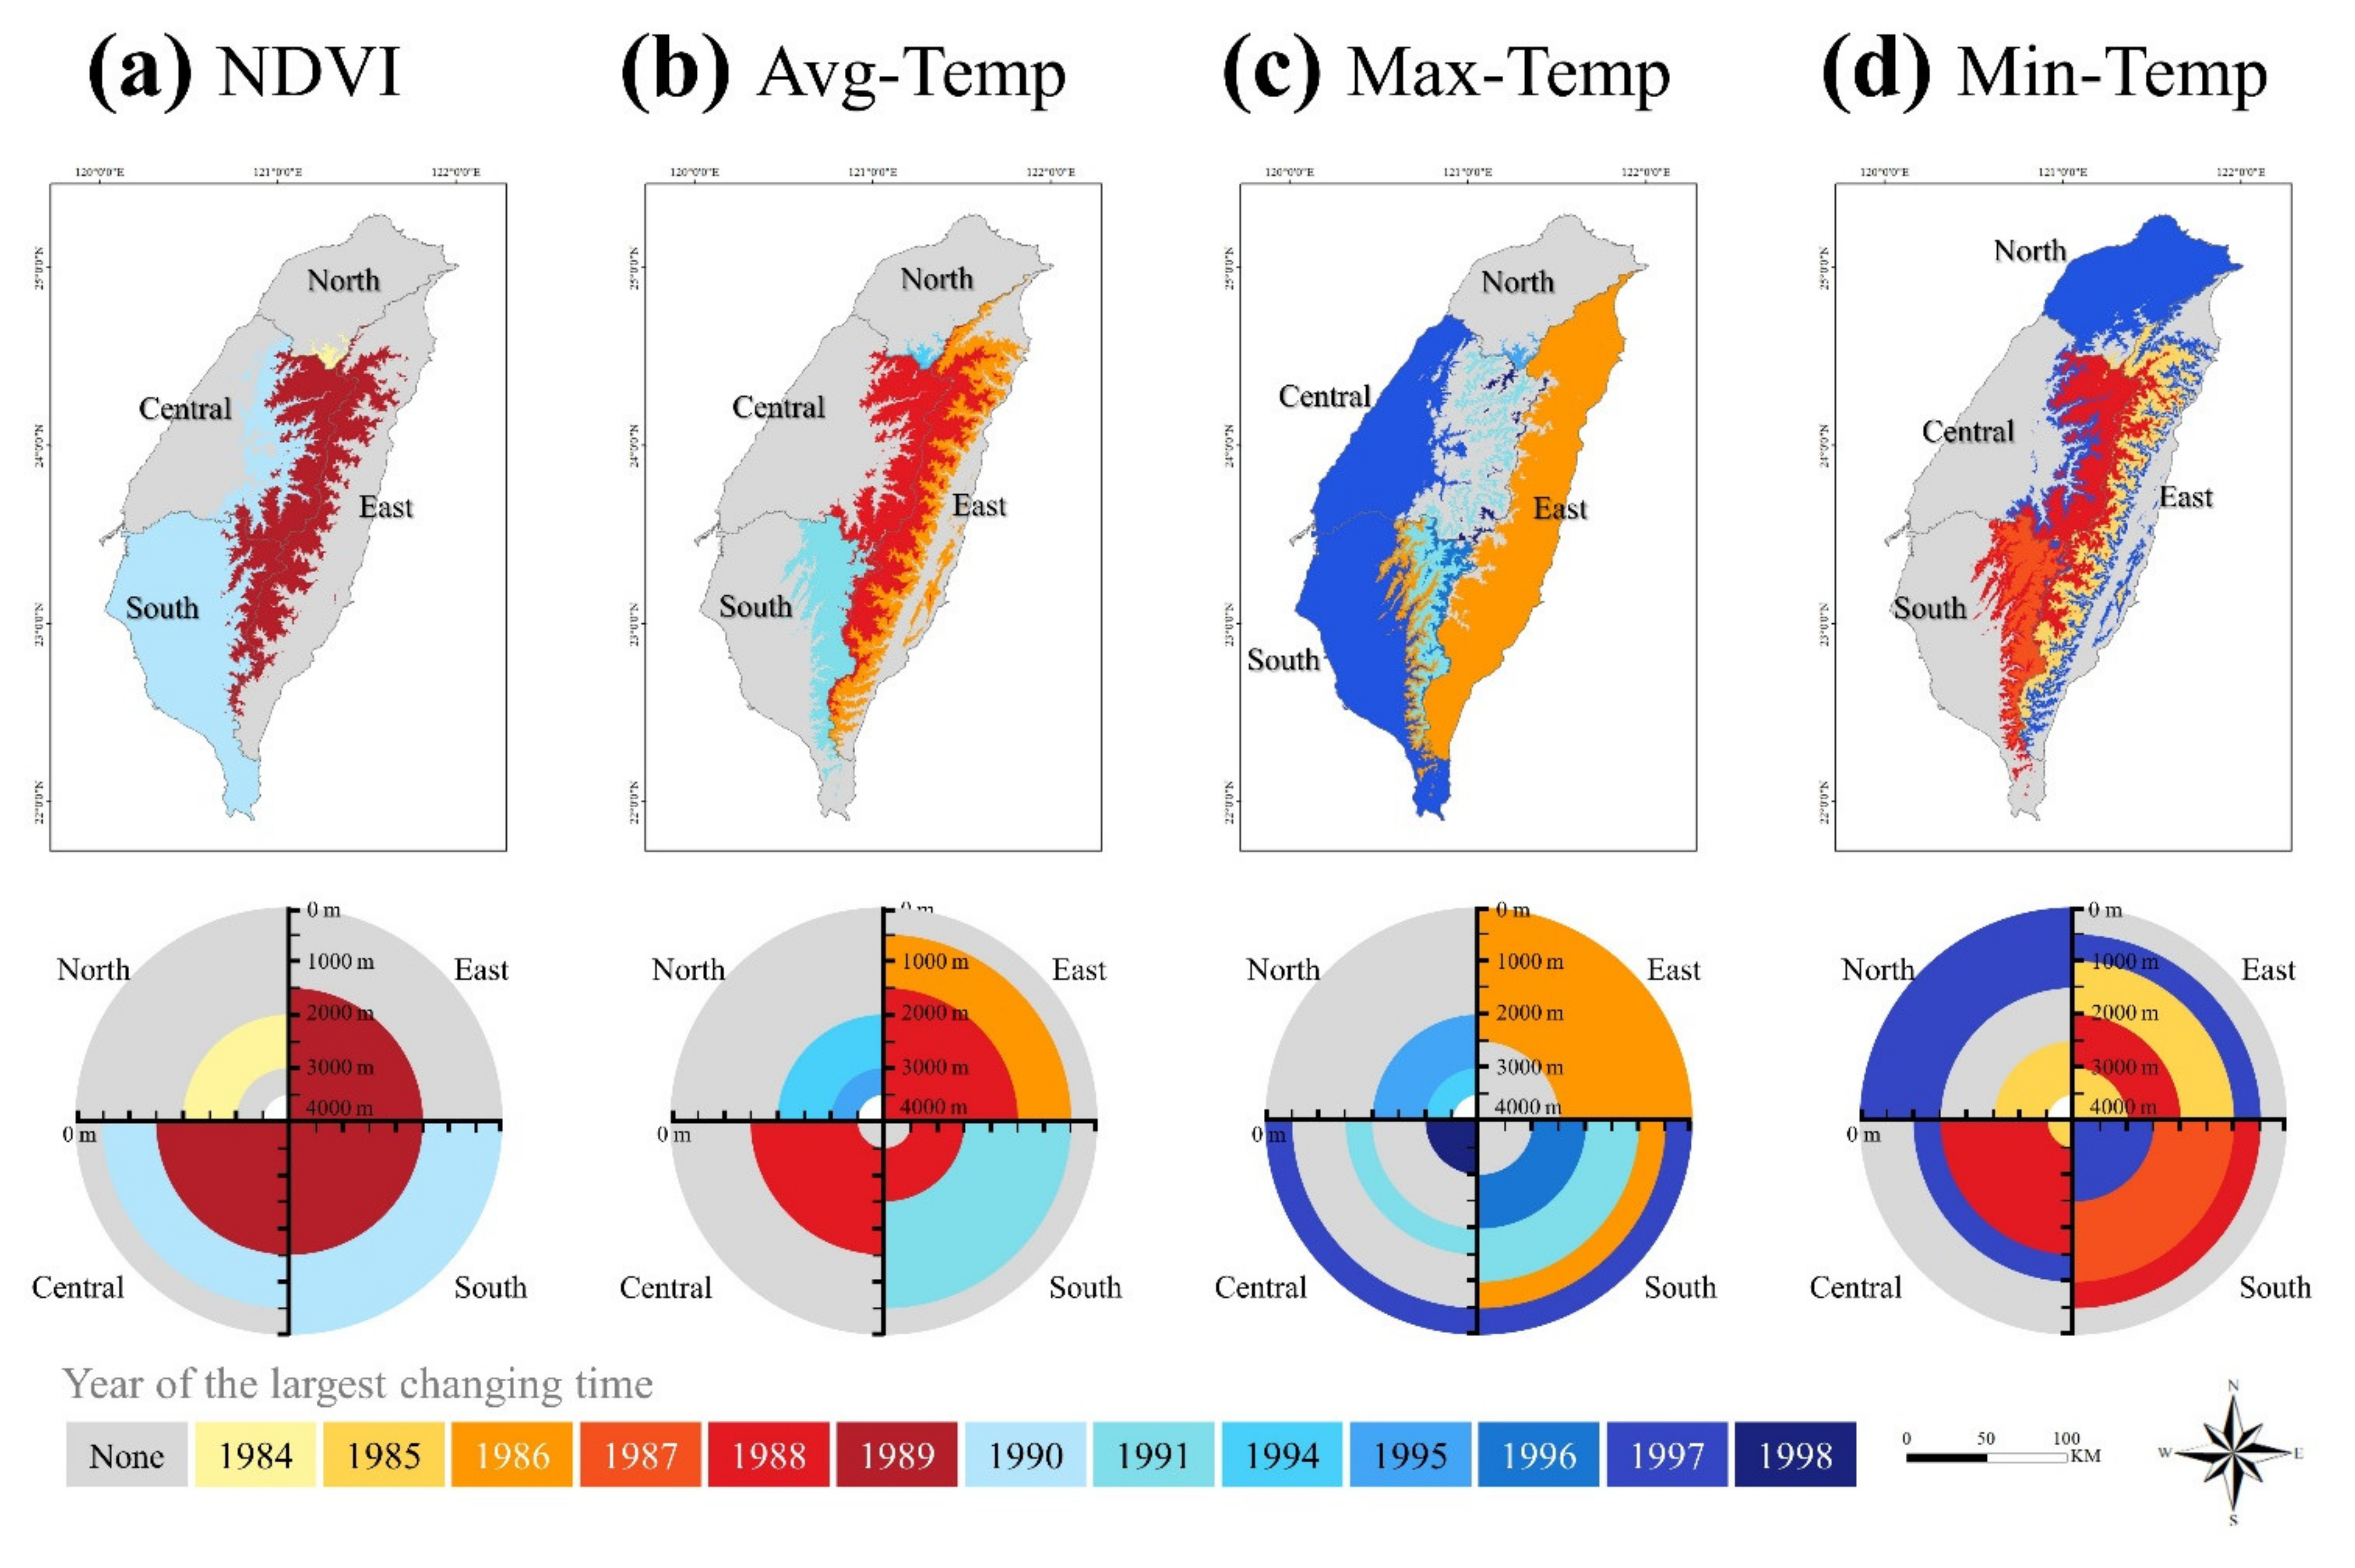
3.3.2. Largest Changes in the Time and Direction of Breakpoints
3.3.3. ENSO Events
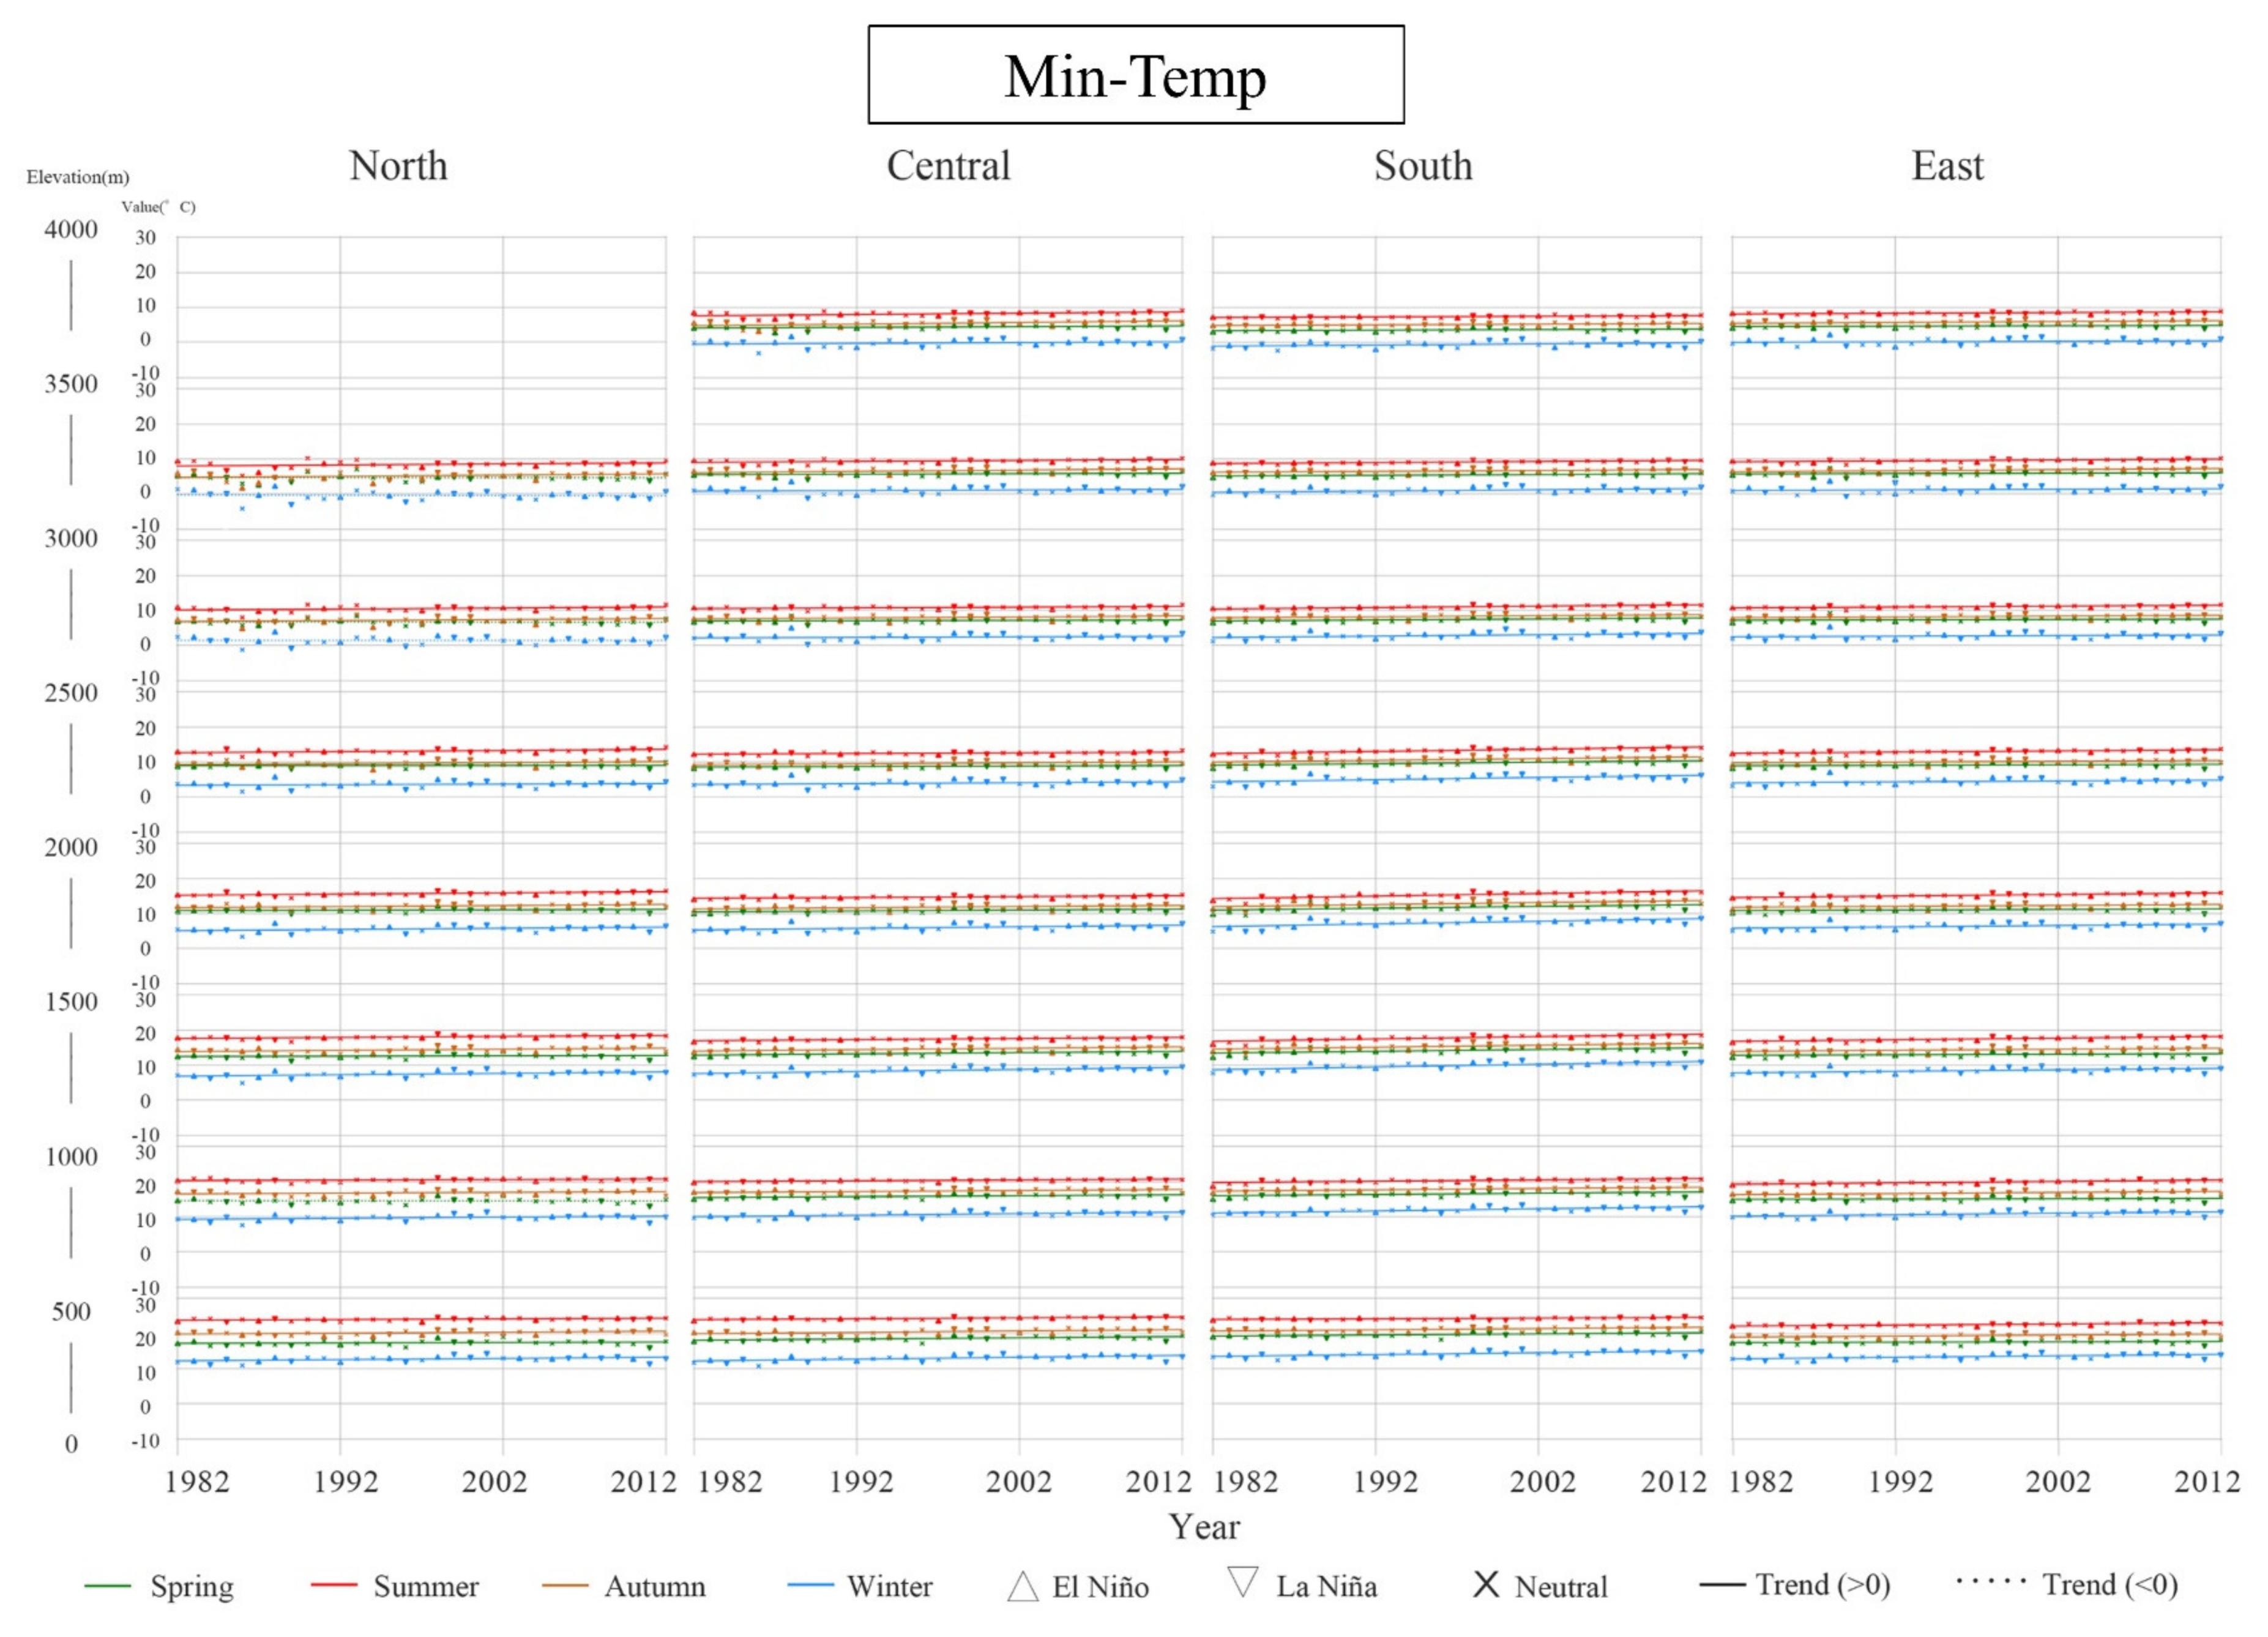
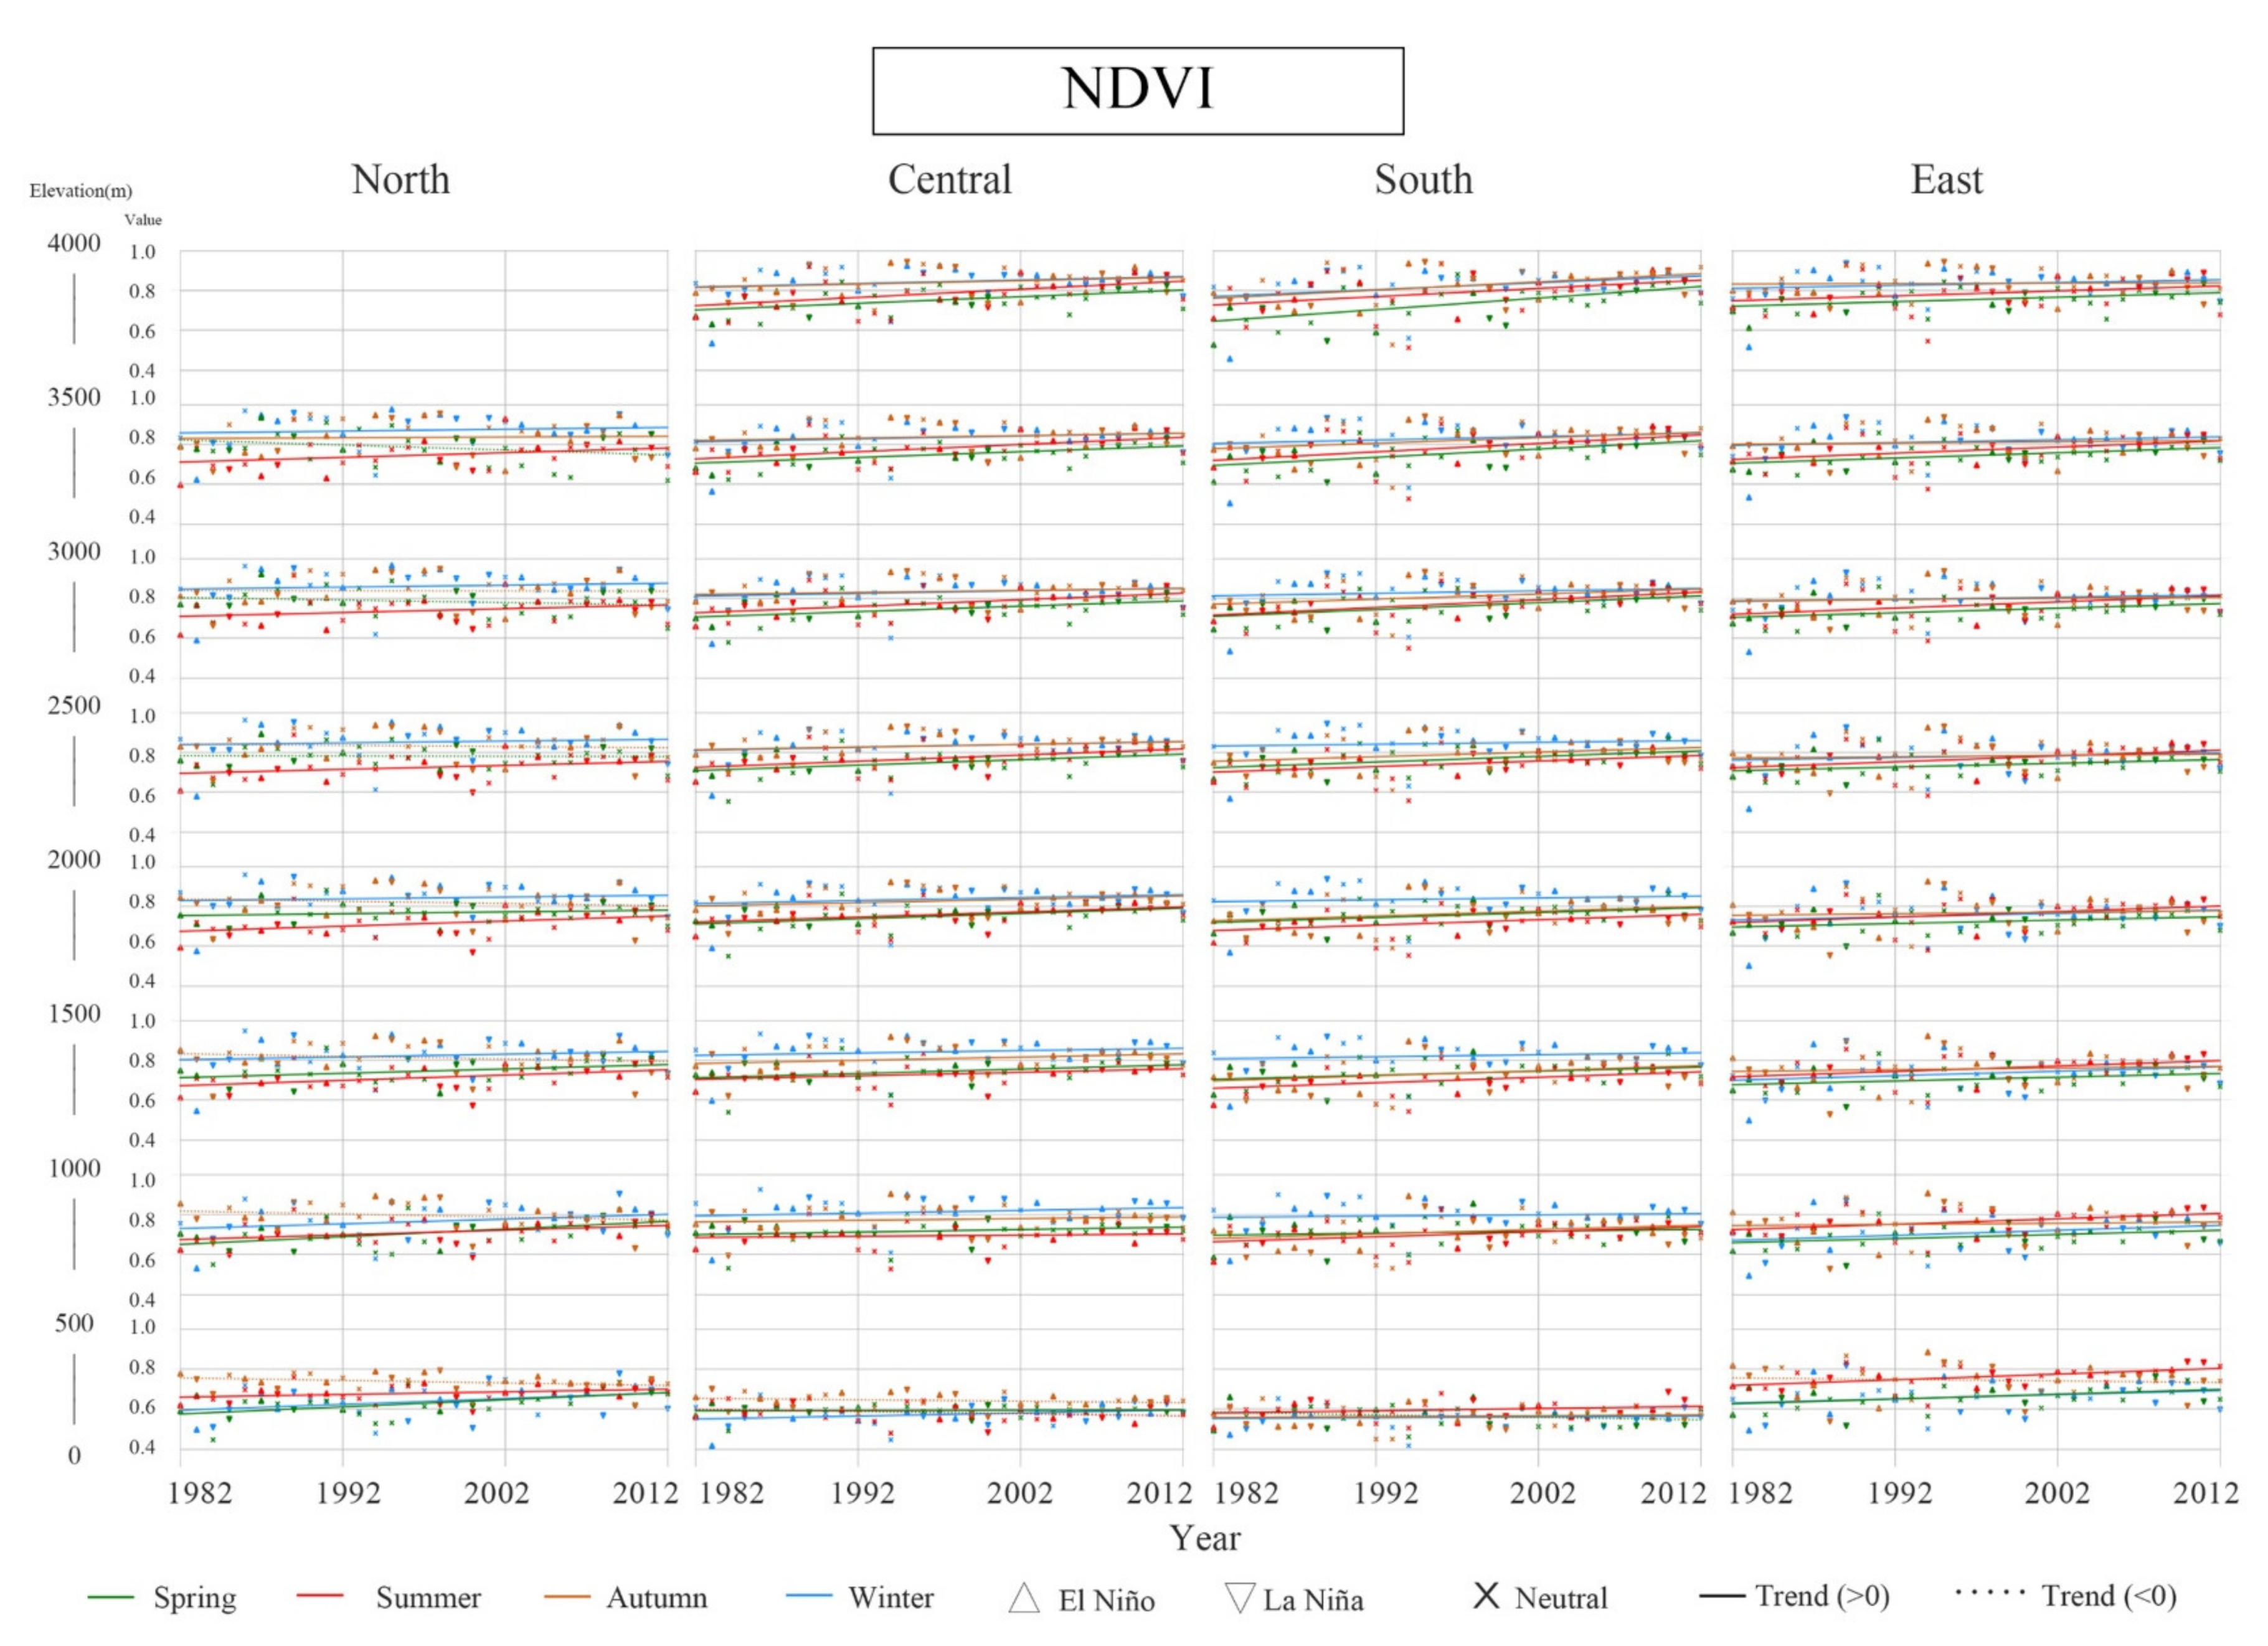
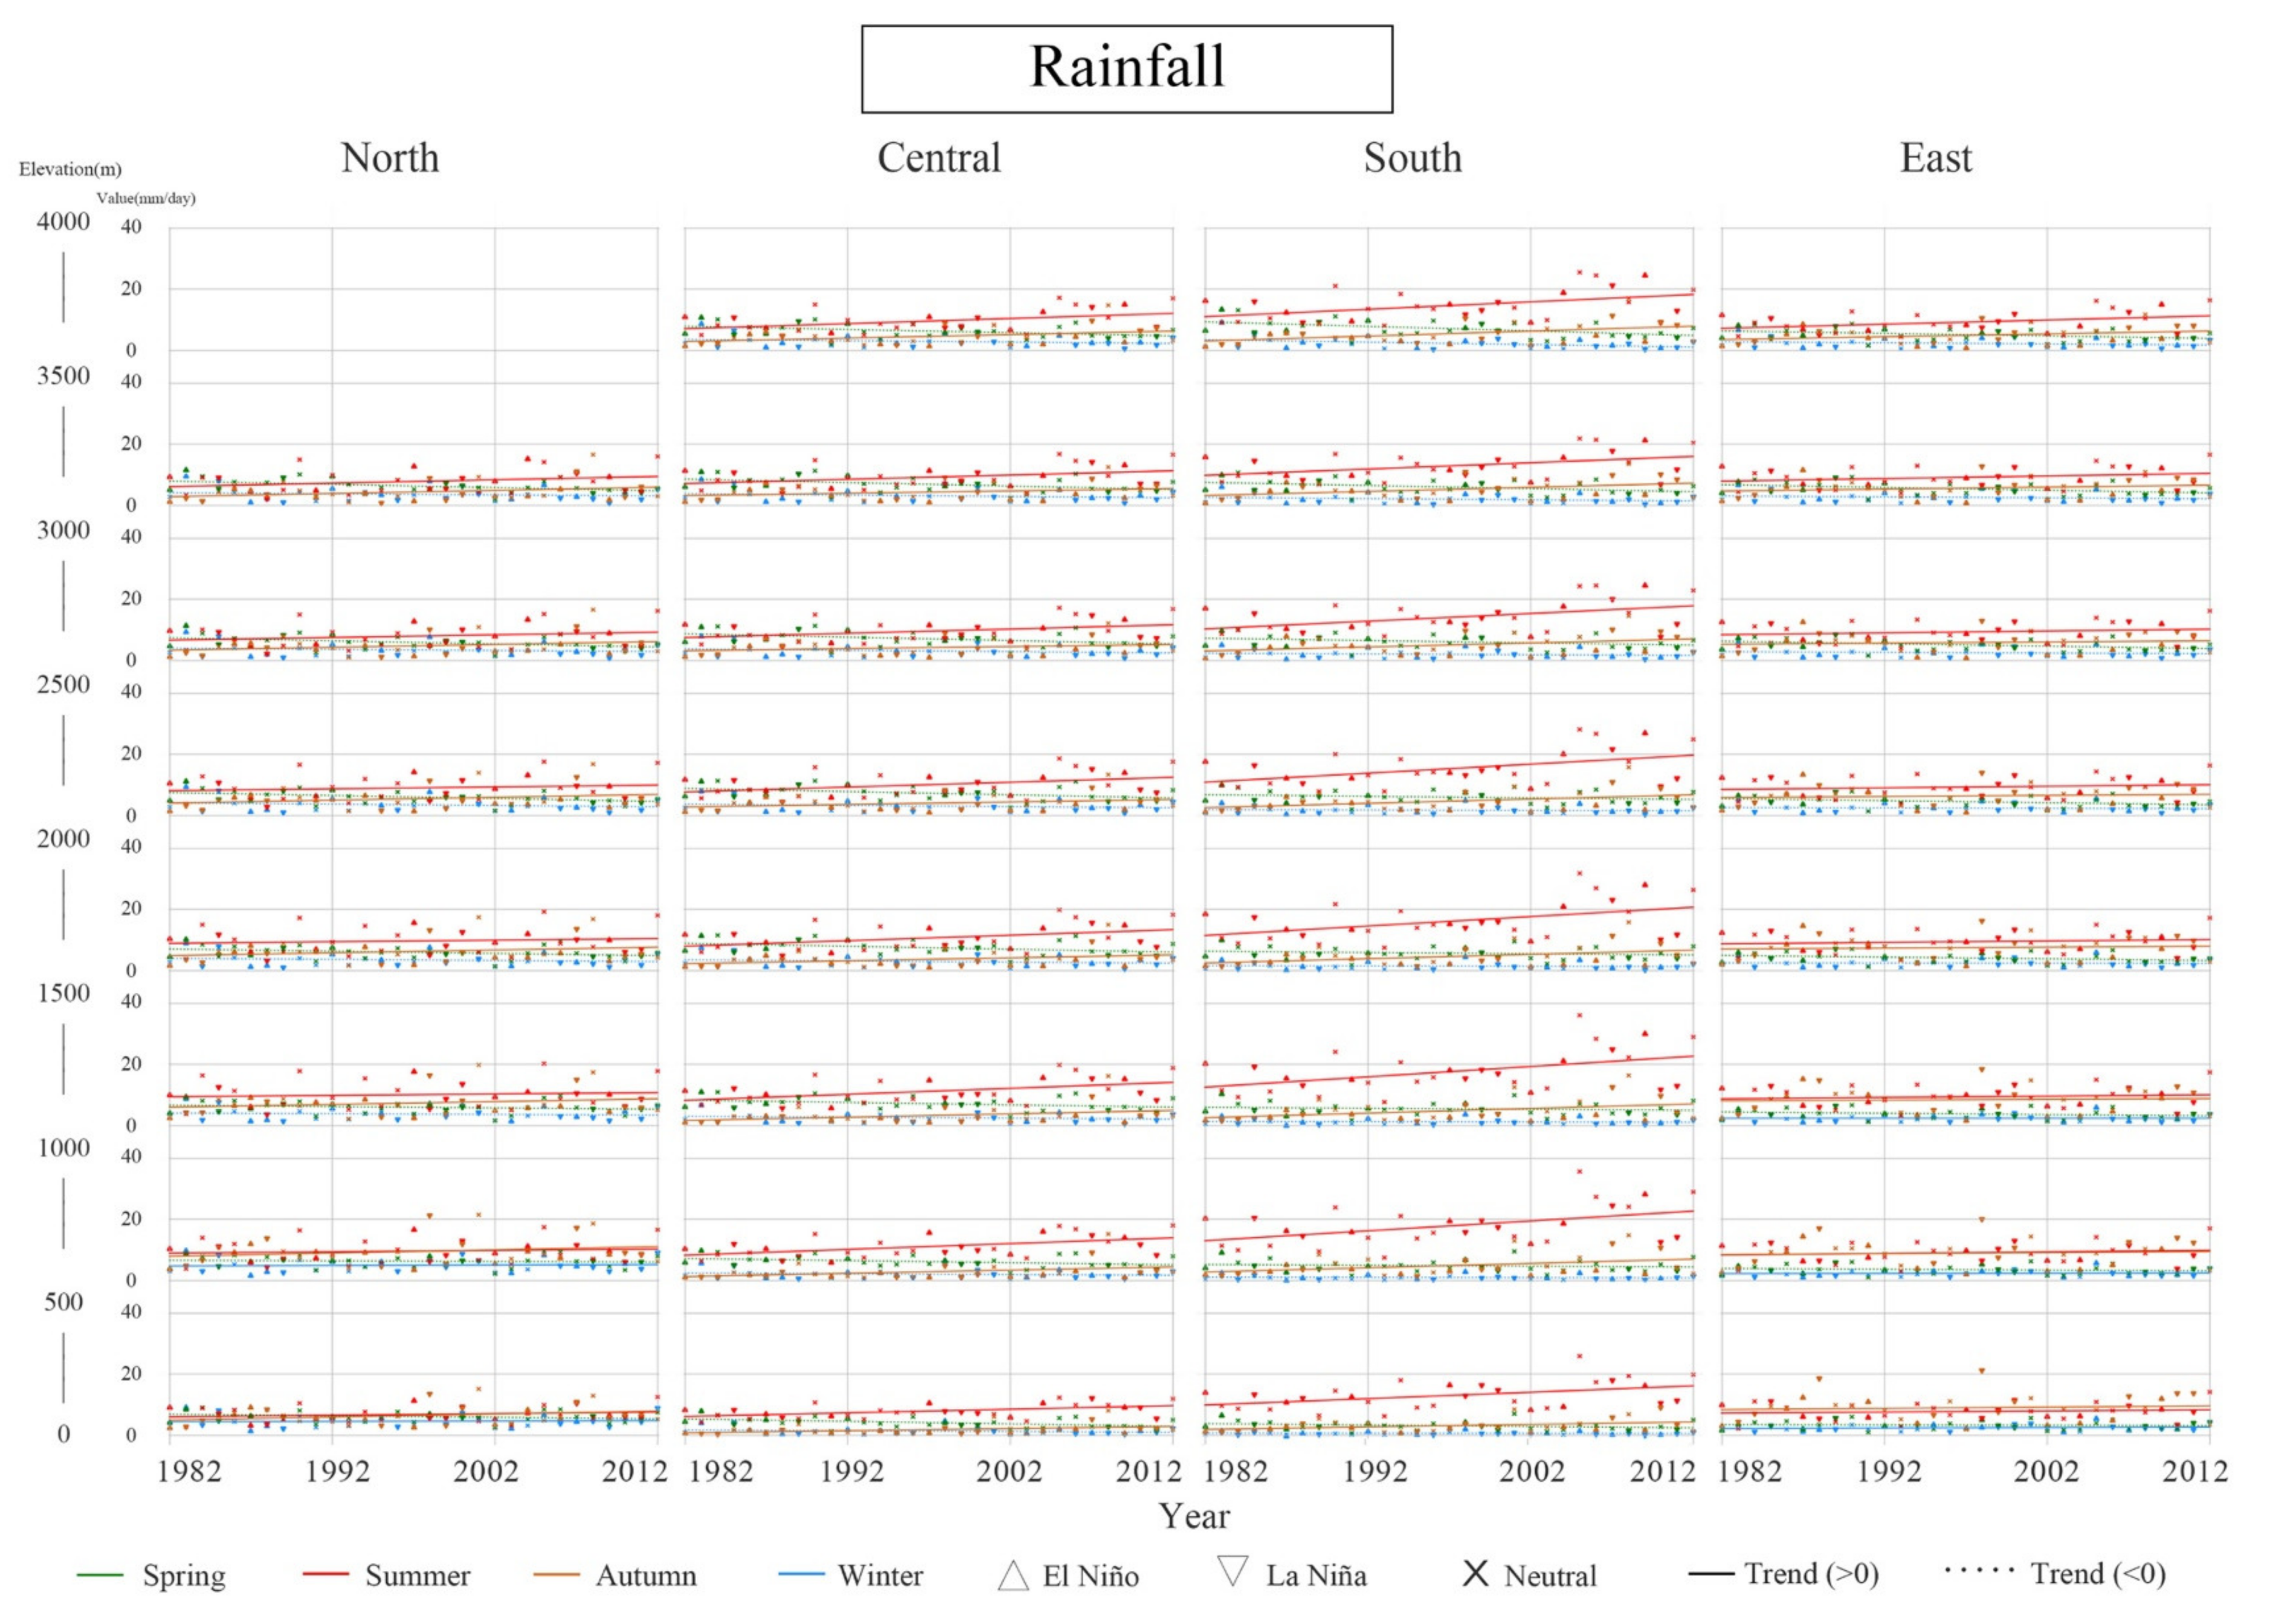
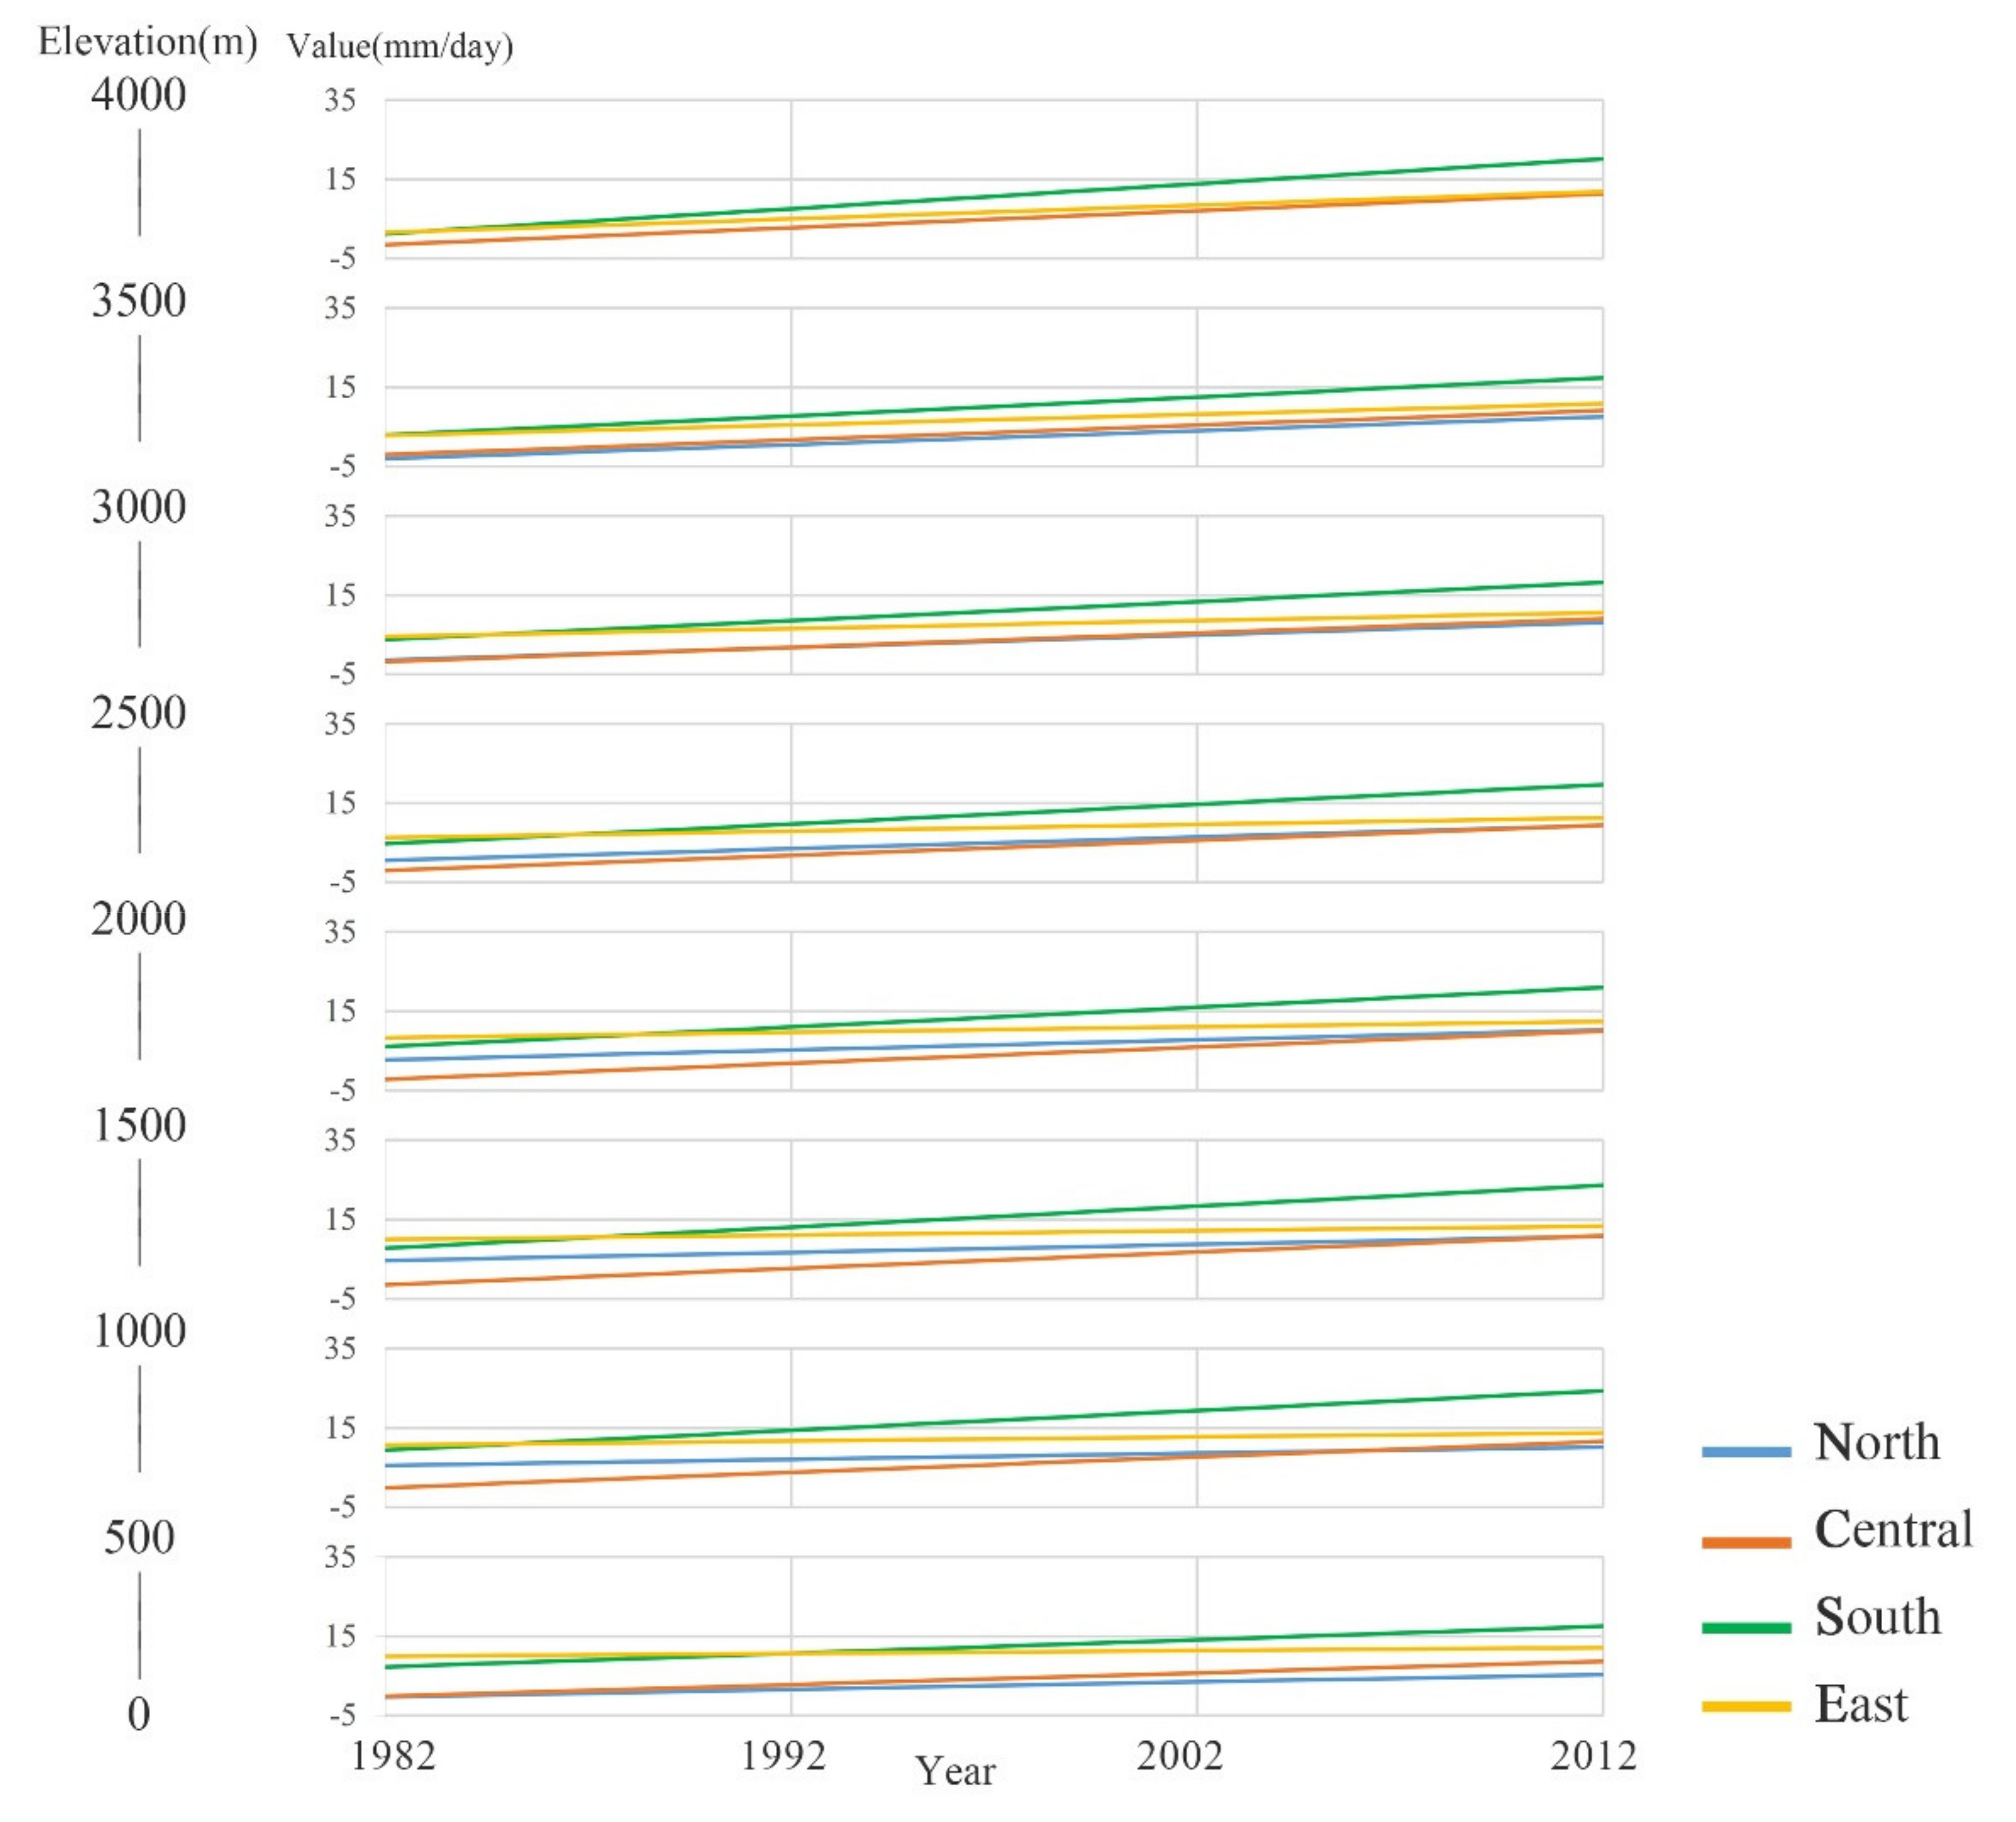
3.4. Regional and Seasonal Variations of NDVI, Rainfall, and Temperature in Taiwan at Varied Elevations
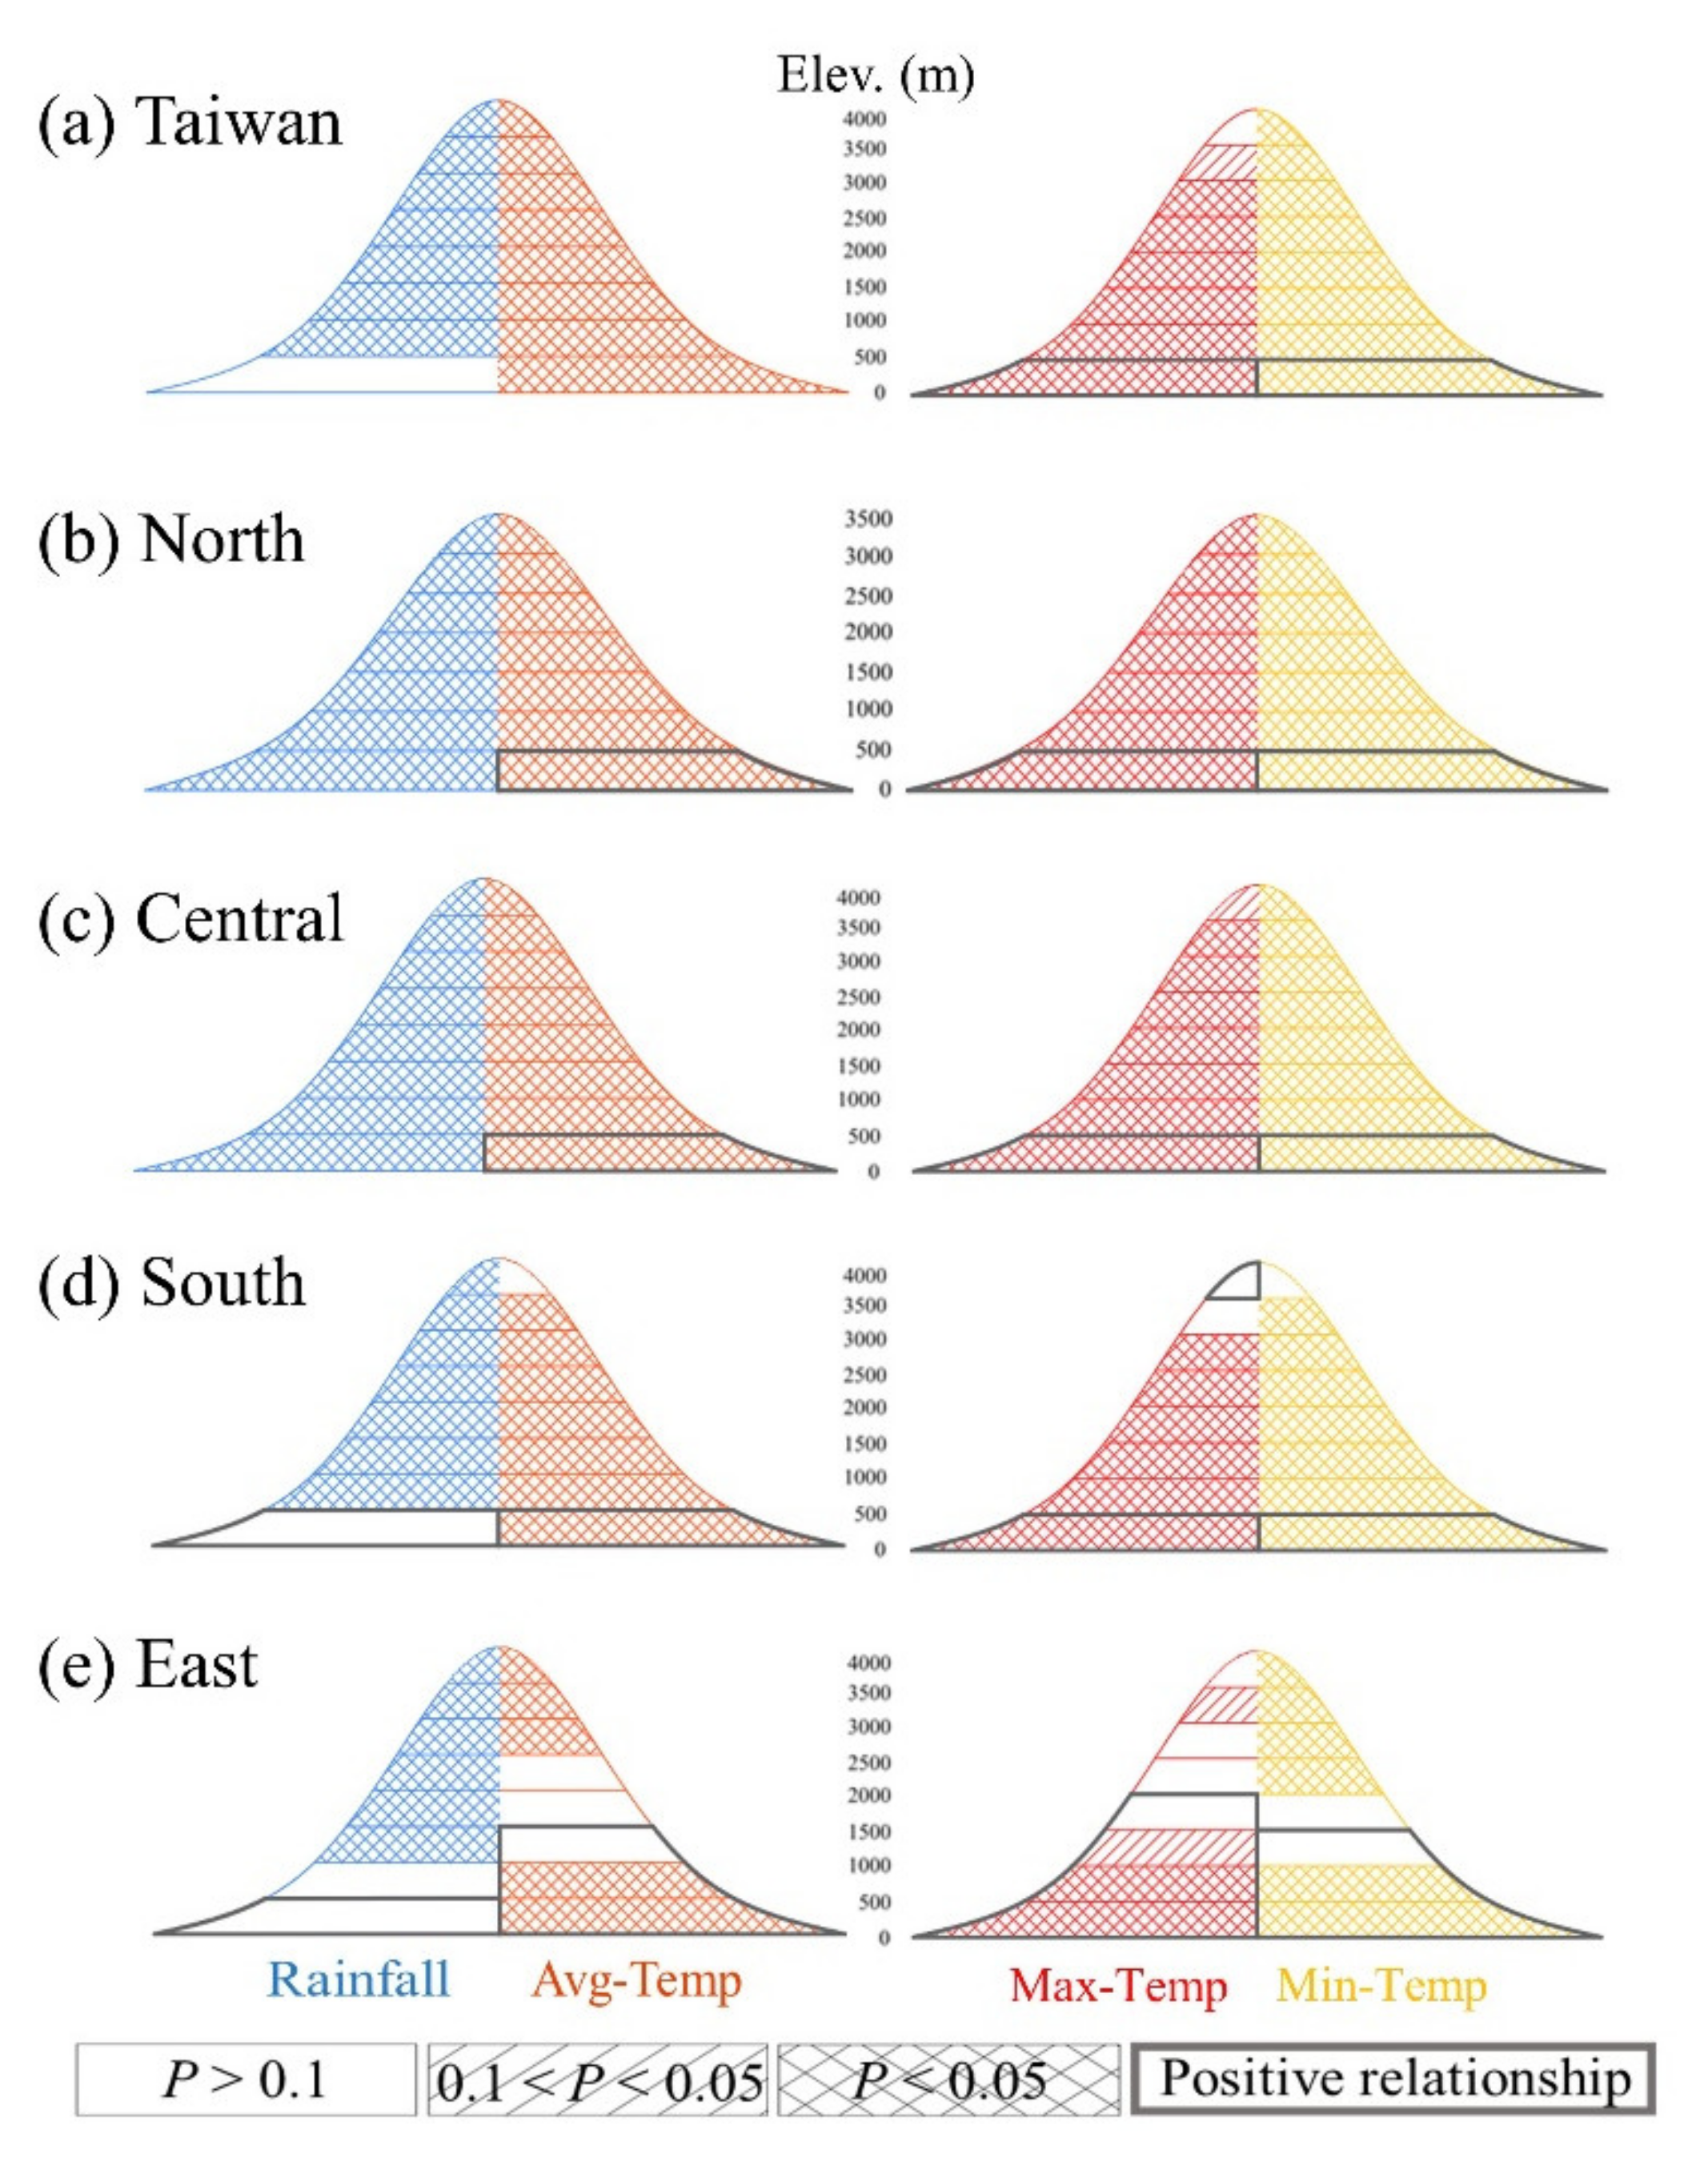
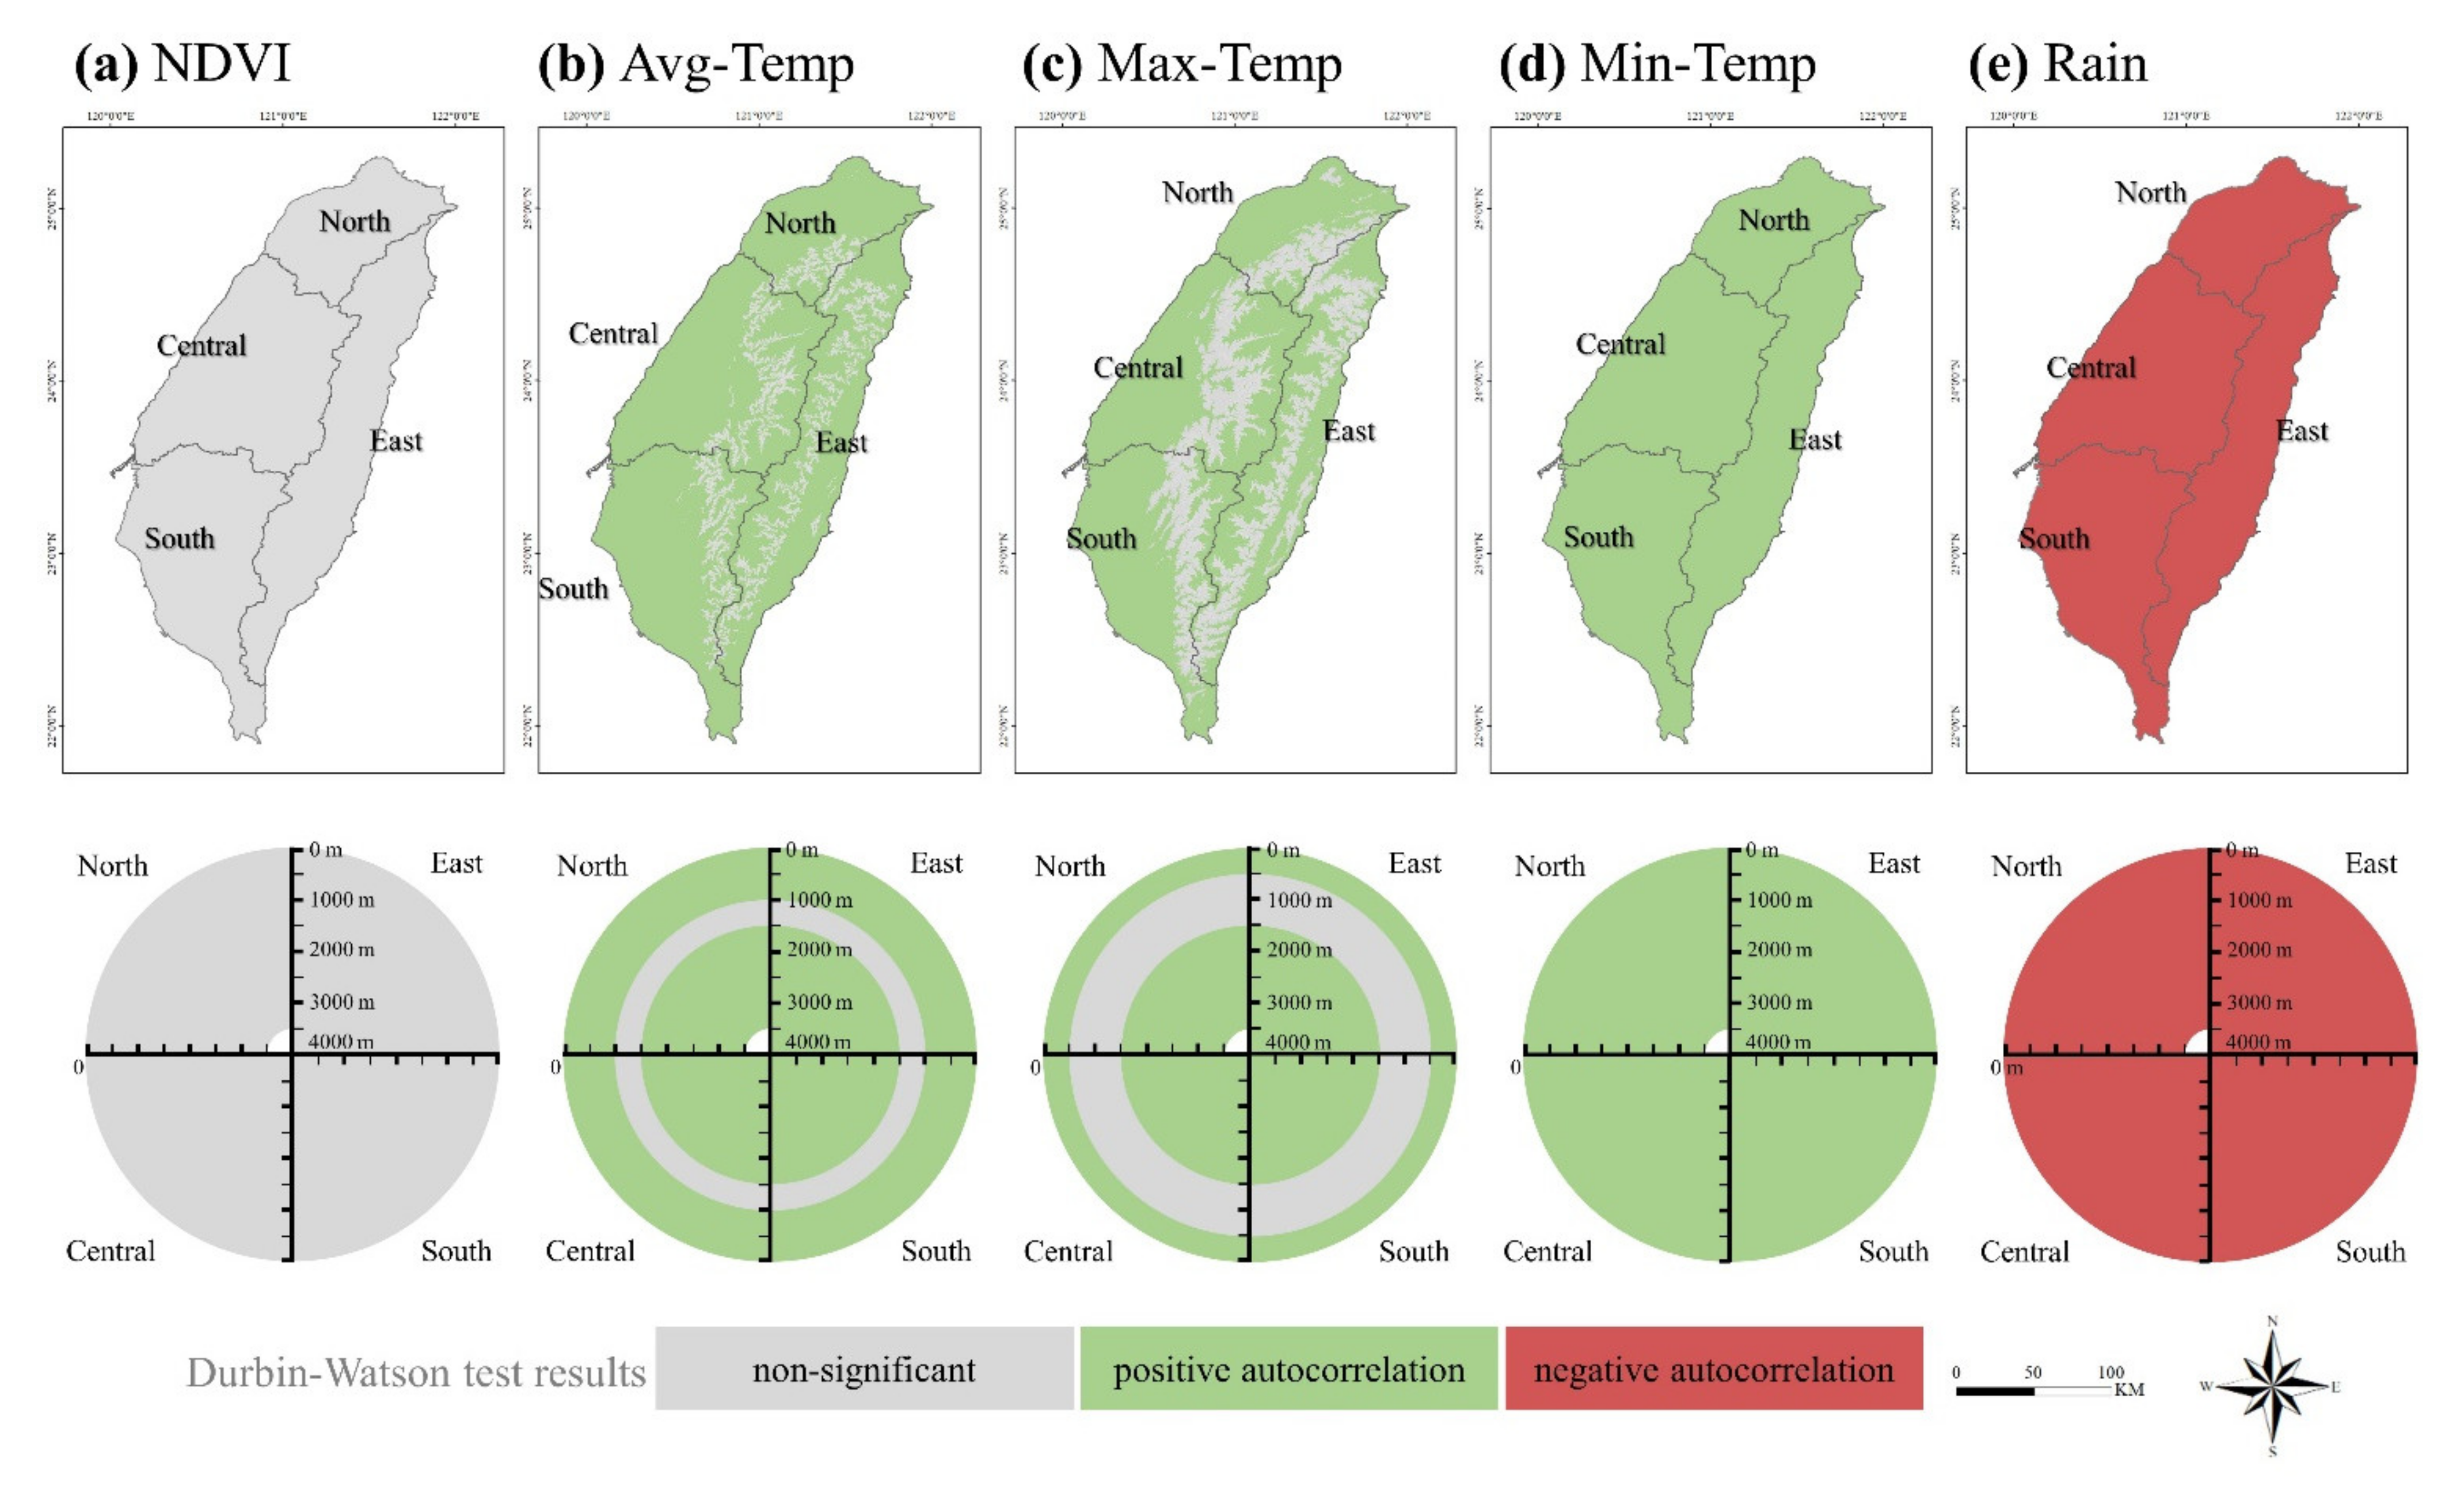
3.5. Correlation and Serial Autocorrelation Analysis of NDVI and Climatic Factors
4. Conclusions
- The overall NDVI trend in Taiwan starts with an increasing pattern, and then follows two downward trends until 2000, followed by a gentle increase. Among climate factors, only the minimum temperature has one breakpoint, found in the late 1990s;
- Based on the vertical investigation, the trends and breakpoints of NDVI across Taiwan are highly consistent, with three breakpoints for the altitudes below 3500 m (1989, 1994, and 2000) and two breakpoints above 3500 m (1989 and 1994). Rainfall gradually increases, with no breakpoints. Average and maximum temperature have similar trends, while minimum temperature shows variations—especially at higher altitudes.
- Regarding the occurrence of breakpoints for regional assessment, the northern region displays a stable situation, while the central region shows higher variations. Higher elevations show larger variations in the NDVI and temperature datasets. NDVI, average temperature, and minimum temperature reveal their largest changes earlier in higher altitude areas. Specifically, the increasing minimum temperature direction is more prominent in the mid-to-high-altitude areas of the eastern and central regions;
- The incidence of La Niña events is larger than that of El Niño events for the whole study period, and especially after 2000;
- Seasonal variations are observed for each region. However, the difference between the dry and wet seasons is getting larger, with the smallest difference in the northern region and the largest difference in the southern region;
- Taiwan’s NDVI and climatic factors have a significant negative correlation (p < 0.05), but the maximum and minimum temperatures have significant positive effects at altitudes below 500 m. The northern and central regions reveal similar responses, while the south and east display different feedbacks.
Supplementary Materials
Author Contributions
Funding
Institutional Review Board Statement
Informed Consent Statement
Acknowledgments
Conflicts of Interest
References
- Jacquin, A.; Sheeren, D.; Lacombe, J.P. Vegetation cover degradation assessment in Madagascar savanna based on trend analysis of MODIS NDVI time series. Int. J. Appl. Earth Obs. Geoinf. 2010, 12, S3–S10. [Google Scholar] [CrossRef] [Green Version]
- Pan, N.; Feng, X.; Fu, B.; Wang, S.; Ji, F.; Pan, S. Increasing global vegetation browning hidden in overall vegetation greening: Insights from time-varying trends. Remote Sens. Environ. 2018, 214, 59–72. [Google Scholar] [CrossRef]
- Setiawan, Y.; Yoshino, K.; Prasetyo, L.B. Characterizing the dynamics change of vegetation cover on tropical forestlands using 250 m multi-temporal MODIS EVI. Int. J. Appl. Earth Obs. Geoinf. 2014, 26, 132–144. [Google Scholar] [CrossRef]
- Tong, X.; Tian, F.; Brandt, M.; Liu, Y.; Zhang, W.; Fensholt, R. Trends of land surface phenology derived from passive microwave and optical remote sensing systems and associated drivers across the dry tropics 1992–2012. Remote Sens. Environ. 2019, 232, 111307. [Google Scholar] [CrossRef]
- Corlett, R.T. Impacts of warming on tropical lowland rainforests. Trends Ecol. Evol. 2011, 26, 606–613. [Google Scholar] [CrossRef] [PubMed]
- Fu, Y.; He, H.S.; Zhao, J.; Larsen, D.R.; Zhang, H.; Sunde, M.G.; Duan, S. Climate and spring phenology effects on autumn phenology in the Greater Khingan Mountains, Northeastern China. Remote Sens. 2018, 10, 449. [Google Scholar] [CrossRef] [Green Version]
- Zhang, A.; Jia, G.; Ustin, S.L. Water availability surpasses warmth in controlling global vegetation trends in recent decade: Revealed by satellite time series. Environ. Res. Lett. 2021, 16, 074028. [Google Scholar] [CrossRef]
- Lin, H.Y.; Li, C.F.; Chen, T.Y.; Hsieh, C.F.; Wang, G.; Wang, T.; Hu, J.M. Climate-based approach for modeling the distribution of montane forest vegetation in Taiwan. Appl. Veg. Sci. 2020, 23, 239–253. [Google Scholar] [CrossRef]
- Ouyang, W.; Wan, X.; Xu, Y.; Wang, X.; Lin, C. Vertical difference of climate change impacts on vegetation at temporal-spatial scales in the upper stream of the Mekong River Basin. Sci. Total Environ. 2020, 701, 134782. [Google Scholar] [CrossRef] [PubMed]
- Xu, S.; Yu, Z.; Lettenmaier, D.P.; McVicar, T.R.; Ji, X. Elevation-dependent response of vegetation dynamics to climate change in a cold mountainous region. Environ. Res. Lett. 2020, 15, 094005. [Google Scholar] [CrossRef]
- Li, W.; Tan, M. Influences of vertical differences in population emigration on mountainous vegetation greenness: A case study in the Taihang Mountains. Sci. Rep. 2018, 8, 16954. [Google Scholar] [CrossRef]
- Wei, H.; Zhao, X.; Liang, S.; Zhou, T.; Wu, D.; Tang, B. Effects of warming hiatuses on vegetation growth in the Northern Hemisphere. Remote Sens. 2018, 10, 683. [Google Scholar] [CrossRef] [Green Version]
- Los, S.O.; Street-Perrott, F.A.; Loader, N.J.; Froyd, C.A. Detection of signals linked to climate change, land-cover change and climate oscillators in Tropical Montane Cloud Forests. Remote Sens. Environ. 2021, 260, 112431. [Google Scholar] [CrossRef]
- Schulz, H.M.; Li, C.; Thies, B.; Chang, S.; Bendix, J. Mapping the montane cloud forest of Taiwan using 12 year MODIS-derived ground fog frequency data. PLoS ONE 2017, 12, e0172663. [Google Scholar] [CrossRef]
- Chang, C.T.; Wang, H.C.; Huang, C.Y. Retrieving multi-scale climatic variations from high dimensional time-series MODIS green vegetation cover in a tropical/subtropical mountainous island. J. Mt. Sci. 2014, 11, 407–420. [Google Scholar] [CrossRef]
- Jump, A.S.; Huang, T.J.; Chou, C.H. Rapid altitudinal migration of mountain plants in Taiwan and its implications for high altitude biodiversity. Ecography 2012, 35, 204–210. [Google Scholar] [CrossRef]
- Chang, C.T.; Wang, H.C.; Huang, C.Y. Impacts of vegetation onset time on the net primary productivity in a mountainous island in Pacific Asia. Environ. Res. Lett. 2013, 8, 045030. [Google Scholar] [CrossRef] [Green Version]
- Krishnaswamy, J.; John, R.; Joseph, S. Consistent response of vegetation dynamics to recent climate change in tropical mountain regions. Glob. Change Biol. 2014, 20, 203–215. [Google Scholar] [CrossRef]
- Chen, B.; Xu, G.; Coops, N.C.; Ciais, P.; Innes, J.L.; Wang, G.; Myneni, R.B.; Wang, T.; Krzyzanowski, J.; Li, Q. Changes in vegetation photosynthetic activity trends across the Asia–Pacific region over the last three decades. Remote Sens. Environ. 2014, 144, 28–41. [Google Scholar] [CrossRef]
- Tsai, H.P.; Yang, M.D. Relating vegetation dynamics to climate variables in Taiwan using 1982–2012 NDVI3g data. IEEE J. Sel. Top. Appl. Earth Obs. Remote Sens. 2016, 9, 1624–1639. [Google Scholar] [CrossRef]
- Hsu, H.-H.; Chou, C.; Wu, Y.-C.; Lu, M.-M.; Chen, C.-T.; Chen, Y.-M. Climate Change in Taiwan: Scientific Report 2011 (Summary); National Science Council: Taipei, Taiwan, 2011; p. 67. [Google Scholar]
- Yang, M.D.; Chen, S.C.; Tsai, H.P. A long-term vegetation recovery estimation for Mt. Jou-Jou using multi-date SPOT 1, 2, and 4 images. Remote Sens. 2017, 9, 893. [Google Scholar] [CrossRef] [Green Version]
- Dile, Y.T.; Ayana, E.K.; Worqlul, A.W.; Xie, H.; Srinivasan, R.; Lefore, N.; You, L.; Clarke, N. Evaluating satellite-based evapotranspiration estimates for hydrological applications in data-scarce regions: A case in Ethiopia. Sci. Total Environ. 2020, 743, 140702. [Google Scholar] [CrossRef] [PubMed]
- Yang, Y.; Wang, S.; Bai, X.; Tan, Q.; Li, Q.; Wu, L.; Tian, S.; Hu, Z.; Li, C.; Deng, Y. Factors affecting long-term trends in global NDVI. Forests 2019, 10, 372. [Google Scholar] [CrossRef] [Green Version]
- Brehaut, L.; Danby, R.K. Inconsistent relationships between annual tree ring-widths and satellite-measured NDVI in a mountainous subarctic environment. Ecol. Indic. 2018, 91, 698–711. [Google Scholar] [CrossRef]
- Wang, S.; Wang, X.; Chen, G.; Yang, Q.; Wang, B.; Ma, Y.; Shen, M. Complex responses of spring alpine vegetation phenology to snow cover dynamics over the Tibetan Plateau, China. Sci. Total Environ. 2017, 593, 449–461. [Google Scholar] [CrossRef]
- Tsai, H.P.; Lin, Y.H.; Yang, M.D. Exploring long term spatial vegetation trends in Taiwan from AVHRR NDVI3g dataset using RDA and HCA analyses. Remote Sens. 2016, 8, 290. [Google Scholar] [CrossRef] [Green Version]
- Zhang, Y.; Gao, J.; Liu, L.; Wang, Z.; Ding, M.; Yang, X. NDVI-based vegetation changes and their responses to climate change from 1982 to 2011: A case study in the Koshi River Basin in the middle Himalayas. Glob. Planet. Chang. 2013, 108, 139–148. [Google Scholar] [CrossRef]
- Vrieling, A.; De Leeuw, J.; Said, M.Y. Length of growing period over Africa: Variability and trends from 30 years of NDVI time series. Remote Sens. 2013, 5, 982–1000. [Google Scholar] [CrossRef] [Green Version]
- Kennedy, R.E.; Yang, Z.; Gorelick, N.; Braaten, J.; Cavalcante, L.; Cohen, W.B.; Healey, S. Implementation of the LandTrendr algorithm on google earth engine. Remote Sens. 2018, 10, 691. [Google Scholar] [CrossRef] [Green Version]
- Peng, J.; Liu, Z.; Liu, Y.; Wu, J.; Han, Y. Trend analysis of vegetation dynamics in Qinghai–Tibet Plateau using Hurst Exponent. Ecol. Indic. 2012, 14, 28–39. [Google Scholar] [CrossRef]
- Jamali, S.; Jönsson, P.; Eklundh, L.; Ardö, J.; Seaquist, J. Detecting changes in vegetation trends using time series segmentation. Remote Sens. Environ. 2015, 156, 182–195. [Google Scholar] [CrossRef]
- Eklundh, L.; Jönsson, P. TIMESAT for processing time-series data from satellite sensors for land surface monitoring. In Multitemporal Remote Sensing; Springer: Cham, Switzerland, 2016. [Google Scholar] [CrossRef]
- Verbesselt, J.; Hyndman, R.; Newnham, G.; Culvenor, D. Detecting trend and seasonal changes in satellite image time series. Remote Sens. Environ. 2010, 114, 106–115. [Google Scholar] [CrossRef]
- Mugiraneza, T.; Nascetti, A.; Ban, Y. Continuous monitoring of urban land cover change trajectories with landsat time series and landtrendr-google earth engine cloud computing. Remote Sens. 2020, 12, 2883. [Google Scholar] [CrossRef]
- Zhang, M.; Lin, H.; Long, X.; Cai, Y. Analyzing the spatiotemporal pattern and driving factors of wetland vegetation changes using 2000–2019 time-series Landsat data. Sci. Total Environ. 2021, 780, 146615. [Google Scholar] [CrossRef]
- Alibakhshi, S.; Hovi, A.; Rautiainen, M. Temporal dynamics of albedo and climate in the sparse forests of Zagros. Sci. Total Environ. 2019, 663, 596–609. [Google Scholar] [CrossRef] [PubMed]
- Wang, Y.; Liu, G.; Guo, E. Spatial distribution and temporal variation of drought in Inner Mongolia during 1901–2014 using Standardized Precipitation Evapotranspiration Index. Sci. Total Environ. 2019, 654, 850–862. [Google Scholar] [CrossRef] [PubMed]
- Zhou, Y.; Zhang, L.; Xiao, J.; Williams, C.A.; Vitkovskaya, I.; Bao, A. Spatiotemporal transition of institutional and socioeconomic impacts on vegetation productivity in Central Asia over last three decades. Sci. Total Environ. 2019, 658, 922–935. [Google Scholar] [CrossRef]
- Wen, Z.; Wu, S.; Chen, J.; Lü, M. NDVI indicated long-term interannual changes in vegetation activities and their responses to climatic and anthropogenic factors in the Three Gorges Reservoir Region, China. Sci. Total Environ. 2017, 574, 947–959. [Google Scholar] [CrossRef] [PubMed]
- De Jong, R.; Verbesselt, J.; Schaepman, M.E.; De Bruin, S. Trend changes in global greening and browning: Contribution of short-term trends to longer-term change. Glob. Change Biol. 2012, 18, 642–655. [Google Scholar] [CrossRef]
- Verbesselt, J.; Zeileis, A.; Herold, M. Near real-time disturbance detection using satellite image time series. Remote Sens. Environ. 2012, 123, 98–108. [Google Scholar] [CrossRef]
- Saatchi, S.; Asefi-Najafabady, S.; Malhi, Y.; Aragão, L.E.; Anderson, L.O.; Myneni, R.B.; Nemani, R. Persistent effects of a severe drought on Amazonian forest canopy. Proc. Natl. Acad. Sci. USA 2013, 110, 565–570. [Google Scholar] [CrossRef] [Green Version]
- Watts, L.M.; Laffan, S.W. Effectiveness of the BFAST algorithm for detecting vegetation response patterns in a semi-arid region. Remote Sens. Environ. 2014, 154, 234–245. [Google Scholar] [CrossRef]
- Fensholt, R.; Proud, S.R. Evaluation of earth observation based global long term vegetation trends—Comparing GIMMS and MODIS global NDVI time series. Remote Sens. Environ. 2012, 119, 131–147. [Google Scholar] [CrossRef]
- Li, P.; Peng, C.; Wang, M.; Luo, Y.; Li, M.; Zhang, K.; Zhang, D.; Zhu, Q. Dynamics of vegetation autumn phenology and its response to multiple environmental factors from 1982 to 2012 on Qinghai-Tibetan Plateau in China. Sci. Total Environ. 2018, 637, 855–864. [Google Scholar] [CrossRef]
- Huete, A.; Didan, K.; Miura, T.; Rodriguez, E.P.; Gao, X.; Ferreira, L.G. Overview of the radiometric and biophysical performance of the MODIS vegetation indices. Remote Sens. Environ. 2002, 83, 195–213. [Google Scholar] [CrossRef]
- Pinzon, J.E.; Tucker, C.J. A non-stationary 1981–2012 AVHRR NDVI3g time series. Remote Sens. 2014, 6, 6929–6960. [Google Scholar] [CrossRef] [Green Version]
- Bégué, A.; Vintrou, E.; Ruelland, D.; Claden, M.; Dessay, N. Can a 25-year trend in Soudano-Sahelian vegetation dynamics be interpreted in terms of land use change? A remote sensing approach. Glob. Environ. Change 2011, 21, 413–420. [Google Scholar] [CrossRef]
- Barbosa, H.A.; Huete, A.R.; Baethgen, W.E. A 20-year study of NDVI variability over the Northeast Region of Brazil. J. Arid Environ. 2006, 67, 288–307. [Google Scholar] [CrossRef]
- Anyamba, A.; Eastman, J.R. Interannual variability of NDVI over Africa and its relation to El Niño/Southern Oscillation. Remote Sens. 1996, 17, 2533–2548. [Google Scholar] [CrossRef]
- Rouse, J.W., Jr.; Haas, R.H.; Schell, J.A.; Deering, D.W. Monitoring vegetation systems in the Great Plains with ERTS. In NASA. Goddard Space Flight Center 3d ERTS-1 Symphony; NASA: Washington, DC, USA, 1974; pp. 309–317. [Google Scholar]
- Rolim, L.Z.R.; de Souza Filho, F.D.A. Shift detection in hydrological regimes and pluriannual low-frequency streamflow forecasting using the hidden markov model. Water 2020, 12, 2058. [Google Scholar] [CrossRef]
- Xue, C.; Wu, H.; Jiang, X. Temporal and spatial change monitoring of drought grade based on ERA5 analysis data and BFAST method in the belt and road area during 1989–2017. Adv. Meteorol. 2019, 2019, 4053718. [Google Scholar] [CrossRef]
- Pearson, K. Mathematical contributions to the theory of evolution—On a form of spurious correlation which may arise when indices are used in the measurement of organs. Proc. R. Soc. Lond. 1897, 60, 489–498. [Google Scholar] [CrossRef]
- Durbin, J.; Watson, G.S. Testing for serial correlation in least squares regression. III. Biometrika 1971, 58, 1–19. [Google Scholar] [CrossRef]
- Chen, T.H.K.; Prishchepov, A.V.; Fensholt, R.; Sabel, C.E. Detecting and monitoring long-term landslides in urbanized areas with nighttime light data and multi-seasonal Landsat imagery across Taiwan from 1998 to 2017. Remote Sens. Environ. 2019, 225, 317–327. [Google Scholar] [CrossRef]
- Henny, L.; Thorncroft, C.D.; Hsu, H.H.; Bosart, L.F. Extreme rainfall in Taiwan: Seasonal statistics and trends. J. Clim. 2021, 34, 4711–4731. [Google Scholar] [CrossRef]
- Abdulmana, S.; Lim, A.; Wongsai, S.; Wongsai, N. Land surface temperature and vegetation cover changes and their relationships in Taiwan from 2000 to 2020. Remote Sens. Appl. Soc. Environ. 2021, 24, 100636. [Google Scholar] [CrossRef]
- Nichol, J.E.; Choi, S.Y.; Wong, M.S.; Abbas, S. Temperature change and urbanisation in a multi-nucleated megacity: China’s Pearl River Delta. Urban Clim. 2020, 31, 100592. [Google Scholar] [CrossRef]
- Tu, H.M.; Chen, H.M. From deforestation to afforestation: Effect of slopeland use policies on land use/cover change in Taiwan. Land Use Policy 2020, 99, 105038. [Google Scholar] [CrossRef]
- Cheng, F.Y.; Hsu, Y.C.; Lin, P.L.; Lin, T.H. Investigation of the effects of different land use and land cover patterns on mesoscale meteorological simulations in the Taiwan area. J. Appl. Meteorol. Climatol. 2013, 52, 570–587. [Google Scholar] [CrossRef]
- Liu, L.; Guo, J.; Miao, Y.; Li, J.; Chen, D.; He, J.; Cui, C. Elucidating the relationship between aerosol concentration and summertime boundary layer structure in central China. Environ. Pollut. 2018, 241, 646–653. [Google Scholar] [CrossRef]
- Lee, C.H.; Yeh, H.F. Impact of climate change and human activities on streamflow variations based on the Budyko framework. Water 2019, 11, 2001. [Google Scholar] [CrossRef] [Green Version]
- Shiu, C.J.; Liu, S.C.; Chen, J.P. Diurnally asymmetric trends of temperature, humidity, and precipitation in Taiwan. J. Clim. 2009, 22, 5635–5649. [Google Scholar] [CrossRef] [Green Version]
- Chen, Y.C.; Yao, C.K.; Honjo, T.; Lin, T.P. The application of a high-density street-level air temperature observation network (HiSAN): Dynamic variation characteristics of urban heat island in Tainan, Taiwan. Sci. Total Environ. 2018, 626, 555–566. [Google Scholar] [CrossRef] [PubMed]
- Hwang, R.L.; Lin, C.Y.; Huang, K.T. Spatial and temporal analysis of urban heat island and global warming on residential thermal comfort and cooling energy in Taiwan. Energy Build. 2017, 152, 804–812. [Google Scholar] [CrossRef]
- Huang, J.M.; Chen, L.C. A numerical study on mitigation strategies of urban heat islands in a tropical megacity: A case study in Kaohsiung City, Taiwan. Sustainability 2020, 12, 3952. [Google Scholar] [CrossRef]
- Hwang, R.L.; Lin, T.P.; Lin, F.Y. Evaluation and mapping of building overheating risk and air conditioning use due to the urban heat island effect. J. Build. Eng. 2020, 32, 101726. [Google Scholar] [CrossRef]
- Gao, M.; Piao, S.; Chen, A.; Yang, H.; Liu, Q.; Fu, Y.H.; Janssens, I.A. Divergent changes in the elevational gradient of vegetation activities over the last 30 years. Nat. Commun. 2019, 10, 2970. [Google Scholar] [CrossRef]
- Kuo, C.C.; Su, Y.; Liu, H.Y.; Lin, C.T. Assessment of climate change effects on alpine summit vegetation in the transition of tropical to subtropical humid climate. Plant Ecol. 2021, 222, 933–951. [Google Scholar] [CrossRef]
- Kuo, W.P. Living with “abnormal” drought in rain-soaked Taiwan: Analysis of water consumption practices and discourses. Anthropol. Noteb. 2019, 25, 71–91. [Google Scholar]
- Chi, C.H.; McEwan, R.W.; Chang, C.T.; Zheng, C.; Yang, Z.; Chiang, J.M.; Lin, T.C. Typhoon disturbance mediates elevational patterns of forest structure, but not species diversity, in humid monsoon Asia. Ecosystems 2015, 18, 1410–1423. [Google Scholar] [CrossRef]
- Huang, W.; Dong, S. Long-term and inter-annual variations of tropical cyclones affecting Taiwan region. Reg. Stud. Mar. Sci. 2019, 30, 100721. [Google Scholar] [CrossRef]
- Chang, C.P.; Yeh, T.C.; Chen, J.M. Effects of terrain on the surface structure of typhoons over Taiwan. Mon. Weather Rev. 1993, 121, 734–752. [Google Scholar] [CrossRef]
- Abbas, S.; Nichol, J.E.; Fischer, G.A.; Wong, M.S.; Irteza, S.M. Impact assessment of a super-typhoon on Hong Kong’s secondary vegetation and recommendations for restoration of resilience in the forest succession. Agr. Forest Meteorol. 2020, 280, 107784. [Google Scholar] [CrossRef]
- Hsiao, L.F.; Yang, M.J.; Lee, C.S.; Kuo, H.C.; Shih, D.S.; Tsai, C.C.; Wang, C.J.; Chang, L.Y.; Chen, D.Y.C.; Feng, L.; et al. Ensemble forecasting of typhoon rainfall and floods over a mountainous watershed in Taiwan. J. Hydrol. 2013, 506, 55–68. [Google Scholar] [CrossRef] [Green Version]
- Chen, C.W.; Tung, Y.S.; Liou, J.J.; Li, H.C.; Cheng, C.T.; Chen, Y.M.; Oguchi, T. Assessing landslide characteristics in a changing climate in northern Taiwan. Catena 2019, 175, 263–277. [Google Scholar] [CrossRef]
- Chen, C.Y. Event-based rainfall warning regression model for landslide and debris flow issuing. Environ. Earth Sci. 2020, 79, 127. [Google Scholar] [CrossRef]
- Wang, H.C.; Chang, C.T. The dynamic of vegetation growth with regular climate and climatic fluctuations in a subtropical mountainous island, Taiwan. Remote Sens. 2021, 13, 3298. [Google Scholar] [CrossRef]
- Piao, S.; Nan, H.; Huntingford, C.; Ciais, P.; Friedlingstein, P.; Sitch, S.; Peng, S.; Ahlström, A.; Canadell, J.G.; Cong, N.; et al. Evidence for a weakening relationship between interannual temperature variability and northern vegetation activity. Nat. Commun. 2014, 5, 5018. [Google Scholar] [CrossRef] [Green Version]
- Guo, Q.; Kelt, D.A.; Sun, Z.; Liu, H.; Hu, L.; Ren, H.; Wen, J. Global variation in elevational diversity patterns. Sci. Rep. 2013, 3, 3007. [Google Scholar] [CrossRef] [PubMed]
- Chen, Y.Y.; Huang, W.; Wang, W.H.; Juang, J.Y.; Hong, J.S.; Kato, T.; Luyssaert, S. Reconstructing Taiwan’s land cover changes between 1904 and 2015 from historical maps and satellite images. Sci. Rep. 2019, 9, 3643. [Google Scholar] [CrossRef] [Green Version]
- Jiang, Z.; Tai-Jen Chen, G.; Wu, M.C. Large-scale circulation patterns associated with heavy spring rain events over Taiwan in strong ENSO and non-ENSO years. Mon. Weather Rev. 2003, 131, 1769–1782. [Google Scholar] [CrossRef]
- Chen, J.M.; Li, T.; Shih, C.F. Asymmetry of the el niño-spring rainfall relationship in Taiwan. J. Meteorol. Soc. Jpn. Ser. II 2008, 86, 297–312. [Google Scholar] [CrossRef] [Green Version]
- Lee, J.H.; Yang, C.Y.; Julien, P.Y. Taiwanese rainfall variability associated with large-scale climate phenomena. Adv. Water Resour. 2020, 135, 103462. [Google Scholar] [CrossRef]
- Li, H.C.; Zhao, M.; Tsai, C.H.; Mii, H.S.; Chang, Q.; Wei, K.Y. The first high-resolution stalagmite record from Taiwan: Climate and environmental changes during the past 1300 years. J. Asian Earth Sci. 2015, 114, 574–587. [Google Scholar] [CrossRef]
- Huang, Z.; Ma, C.; Chyi, S.J.; Tang, L.; Zhao, L. Paleofire, vegetation, and climate reconstructions of the middle to late Holocene from lacustrine sediments of the Toushe Basin, Taiwan. Geophys. Res. Lett. 2020, 47, e2020GL090401. [Google Scholar] [CrossRef]
- NOAA Climate Prediction Center. Cold & Warm Episodes by Season. Available online: https://origin.cpc.ncep.noaa.gov/products/analysis_monitoring/ensostuff/ONI_v5.php (accessed on 15 January 2021).
- Hung, C.W.; Hsu, H.H.; Lu, M.M. Decadal oscillation of spring rain in northern Taiwan. Geophys. Res. Lett. 2004, 31, L22206. [Google Scholar] [CrossRef] [Green Version]
- Lin, C.C.; Liou, Y.J.; Huang, S.J. Impacts of two-type ENSO on rainfall over Taiwan. Adv. Meteorol. 2015, 2015, 658347. [Google Scholar] [CrossRef] [Green Version]
- Wang, B.; Wu, R.; Fu, X. Pacific–East Asian teleconnection: How does ENSO affect East Asian climate? J. Clim. 2000, 13, 1517–1536. [Google Scholar] [CrossRef]
- Hsu, Y.J.; Fu, Y.; Bürgmann, R.; Hsu, S.Y.; Lin, C.C.; Tang, C.H.; Wu, Y.M. Assessing seasonal and interannual water storage variations in Taiwan using geodetic and hydrological data. Earth Planet Sci. Lett. 2020, 550, 116532. [Google Scholar] [CrossRef]
- Wu, C.H.; Tsai, I.C.; Tsai, P.C.; Tung, Y.S. Large–scale seasonal control of air quality in Taiwan. Atmos. Environ. 2019, 214, 116868. [Google Scholar] [CrossRef]


| Region | County |
|---|---|
| North | Keelung City, Taipei City, New Taipei City, Taoyuan City, Hsinchu County, Hsinchu City |
| Central | Miaoli County, Taichung City, Changhua County, Nantou County, Yunlin County |
| South | Chiayi City, Chiayi County, Tainan City, Kaohsiung City, Pingtung County |
| East | Yilan County, Hualien County, Taitung County |
| h | NDVI | Rain | Avg-Temp | Max-Temp | Min-Temp |
|---|---|---|---|---|---|
| 1/2 | None | None | None | None | None |
| 1/3–1/4 | 1997(11) | ||||
| 1/5 | 1988(4), 1994(8), 2000(10) | ||||
| 1/6 | None | ||||
| 1/7–1/12 | 1989(5), 1994(8), 2000(10) |
| h | NDVI | Rain | Avg-Temp | Max-Temp | Min-Temp |
|---|---|---|---|---|---|
| 1/2 | 0.0010 | 0.0371 | −0.0068 | −0.0170 | 0.0326 |
| 1/3–1/4 | 0.0175→ −0.0187 | ||||
| 1/5 | 0.0084→−0.0205 →−0.0216→0.0004 | ||||
| 1/6 | 0.0010 | ||||
| 1/7–1/12 | 0.0065→−0.0357 →−0.0221→0.00002 |
| Time | El Niño | La Niña | |
|---|---|---|---|
| 1982–2012 | Occurrences | 9 | 10 |
| (372 months) | Number of months | 98 | 112 |
| Ratio (%) | 26 | 30 | |
| 2000–2012 | Occurrences | 4 | 5 |
| (156 months) | Number of months | 31 | 43 |
| Ratio (%) | 20 | 28 |
Publisher’s Note: MDPI stays neutral with regard to jurisdictional claims in published maps and institutional affiliations. |
© 2021 by the authors. Licensee MDPI, Basel, Switzerland. This article is an open access article distributed under the terms and conditions of the Creative Commons Attribution (CC BY) license (https://creativecommons.org/licenses/by/4.0/).
Share and Cite
Tsai, H.P.; Wang, G.-G.; Zhuang, Z.-H. Vertical Differences in the Long-Term Trends and Breakpoints of NDVI and Climate Factors in Taiwan. Remote Sens. 2021, 13, 4707. https://doi.org/10.3390/rs13224707
Tsai HP, Wang G-G, Zhuang Z-H. Vertical Differences in the Long-Term Trends and Breakpoints of NDVI and Climate Factors in Taiwan. Remote Sensing. 2021; 13(22):4707. https://doi.org/10.3390/rs13224707
Chicago/Turabian StyleTsai, Hui Ping, Geng-Gui Wang, and Zhong-Han Zhuang. 2021. "Vertical Differences in the Long-Term Trends and Breakpoints of NDVI and Climate Factors in Taiwan" Remote Sensing 13, no. 22: 4707. https://doi.org/10.3390/rs13224707
APA StyleTsai, H. P., Wang, G.-G., & Zhuang, Z.-H. (2021). Vertical Differences in the Long-Term Trends and Breakpoints of NDVI and Climate Factors in Taiwan. Remote Sensing, 13(22), 4707. https://doi.org/10.3390/rs13224707