Article

Vertical Differences in the Long-Term Trends and Breakpoints of NDVI and Climate Factors in Taiwan

1
Department of Civil Engineering, National Chung Hsing University, 145 Xingda Rd., Taichung 402, Taiwan
2
Pervasive AI Research (PAIR) Labs, Hsinchu 300, Taiwan
*
Author to whom correspondence should be addressed.
Remote Sens. 2021, 13(22), 4707; https://doi.org/10.3390/rs13224707
Submission received: 27 September 2021 / Revised: 13 November 2021 / Accepted: 19 November 2021 / Published: 21 November 2021
(This article belongs to the Special Issue Remote Sensing of Tropical Montane Ecosystems and Elevation Gradients)

Abstract

:
This study explored the long-term trends and breakpoints of vegetation, rainfall, and temperature in Taiwan from overall and regional perspectives in terms of vertical differences from 1982 to 2012. With time-series Advanced Very-High-Resolution Radiometer (AVHRR) normalized difference vegetation index (NDVI) data and Taiwan Climate Change Estimate and Information Platform (TCCIP) gridded monthly climatic data, their vertical dynamics were investigated by employing the Breaks for Additive Seasonal and Trend (BFAST) algorithm, Pearson’s correlation analysis, and the Durbin–Watson test. The vertical differences in NDVI values presented three breakpoints and a consistent trend from positive (1982 to 1989) to negative at varied rates, and then gradually increased after 2000. In addition, a positive rainfall trend was discovered. Average and maximum temperature had similar increasing trends, while minimum temperature showed variations, especially at higher altitudes. In terms of regional variations, the vegetation growth was stable in the north but worse in the central region. Higher elevations revealed larger variations in the NDVI and temperature datasets. NDVI, along with average and minimum temperature, showed their largest changes earlier in higher altitude areas. Specifically, the increasing minimum temperature direction was more prominent in the mid-to-high-altitude areas in the eastern and central regions. Seasonal variations were observed for each region. The difference between the dry and wet seasons is becoming larger, with the smallest difference in the northern region and the largest difference in the southern region. Taiwan’s NDVI and climatic factors have a significant negative correlation (p < 0.05), but the maximum and minimum temperatures have significant positive effects at low altitudes below 500 m. The northern and central regions reveal similar responses, while the south and east display different feedbacks. The results illuminate climate change evidence from assessment of the long-term dynamics of vegetation and climatic factors, providing valuable references for establishing correspondent climate-adaptive strategies in Taiwan.

Graphical Abstract

1. Introduction

Vegetation is an important hub linking the atmosphere, hydrology, and soil; thus, continuous monitoring of vegetation dynamics is imperative in the context of global climate change [1,2,3,4,5,6,7]. As vegetation is sensitive to climate change, and mountainous regions are experiencing more pronounced climate change impacts, many studies have investigated the relationship between vegetation and climatic factors from a vertical perspective [8,9,10,11,12,13]. Located in Southeast Asia, Taiwan is a mountainous subtropical island, with over 60% of the land covered by mountains. The mountains of Taiwan play a critical role in its eco-environmental functions of ecosystem conservation, hydrological regulation, and water resource balance for both mountain communities and lowland residents [14,15]. Therefore, many studies have attempted to investigate Taiwan’s vegetation dynamics and responses to climate change. Jump et al. (2012) [16] investigated the biodiversity of Taiwan’s high-altitude areas, and found that the high-altitude boundary of mountain plant distribution has changed significantly with the warming of the climate. Chang et al. (2013) [17] evaluated the influence of ENSO (the El Niño/La Niña–Southern Oscillation)-associated spring drought on vegetation growth, and concluded that the possible increasing frequency of ENSO-related droughts might result in negative impacts on the ecosystem metabolism and NPP (net primary productivity) of Taiwan. Krishnaswamy et al. (2014) [18] found an elevation-sensitive interaction between temperature, rainfall, and vegetation in high-altitude mountainous areas based on AVHRR (Advanced Very-High-Resolution Radiometer) NDVI (normalized difference vegetation index) GIMMS (Global Inventory, Monitoring, and Modelling Studies) data. Chen et al. (2014) [19] analyzed vegetation photosynthetic activity trends across the Asia-Pacific region, and found a significant increase in annual NDVI in Taiwan, at a rate of 0.002 yr−1. Tsai and Yang (2016) [20] applied 30 years of AVHRR NDVI GIMMS3g (third-generation Global Inventory, Monitoring, and Modelling Studies) data to study the long-term changes in Taiwan’s overall vegetation and natural factors; based on their findings, Taiwan is experiencing a greening trend—especially from January to June.
Additionally, the spatial variability of NDVI was found to be higher in the 1990s and lower in the 2000s [20]. However, vertical differences in vegetation in response to regular and irregular climate variabilities in Taiwan have not yet been well understood. Therefore, in order to better predict and manage future ecosystem dynamics, there is an increasing need to study vegetation responses to climate change at various elevations. According to a government climate change report [21], the frequency of extreme drought events in the past 100 years has obvious inter-decadal changes on the scale of 20–30 years, with seasonal differences. Furthermore, the temperature in Taiwan has increased over the past 100 years at varied rates.
Moreover, rainfall in each season also has a different decadal trend. The number of days of heavy rain in the mountainous area has continued to increase since 1985. The heavy rain events in the northern mountainous area have undergone major annual changes since the 1990s. A higher frequency of heavy rain events in the southern mountainous area has been observed since 2000. In the southern mountainous area, torrential and heavy torrential rain incidents have increased markedly—especially from 2004 to 2009. Considering that other natural challenges—such as the earthquakes, typhoons, and landslides that Taiwan encounters every year—may accelerate those climate change magnitudes, a better understanding of regional and seasonal variations in how ecosystems respond to climate variations is essential for establishing future climate adaptation strategies.
Satellite-based remote sensing data have been widely applied to study vegetation responses to climate change, due to their advantages of broad spatial and regular temporal coverage [22]. Over the past several decades, NDVI data from the AVHRR GIMMS3g have been extensively implemented worldwide in order to discern spatial and temporal relationships between vegetation and climatic factors [23,24,25,26,27,28]. The GIMMS3g dataset is the longest historical record that is well suited for long-term multi-decadal studies [29]. Additionally, many time-series change-detection methods—such as the LandTrendr (the Landsat-based detection of Trends in Disturbance and Recovery) [30], DBEST (Detecting Breakpoints and Estimating Segments in Trend) [31,32], TIMESAT analysis [33], and BFAST (Breaks for Additive Season and Trend) [34] algorithms—have been developed to study change processes [35]. Among those methods, BFAST overcomes the weaknesses of DBEST by improving the estimation of seasonal changes. Utilizing an ordinary least squares moving sum (OLS-MOSUM) to define the position of the breakpoint in the time series, and the Bayesian information criterion to determine the optimal number of breakpoints, the BFAST algorithm stands out due to its capacity to effectively interpret seasonal data; it has been successfully applied in many fields [36,37,38,39,40]. In terms of vegetation-related studies, de Jong et al. (2011) [41] applied BFAST to detect vegetation changes in shrubland and grassland areas, while Verbesselt et al. (2012) [42] and Saatchi et al. (2012) [43] studied vegetation drought in Somalia and the Amazon rainforest, respectively. Chen et al. (2014) [19] applied the BFAST algorithm to detect changes in the Poyang Lake wetland ecosystem in the subtropical monsoon region. Watts and Laffan (2014) [44] evaluated the use of BFAST for detecting fires and floods in semi-arid climates; they found that the breakpoints detected by BFAST corresponded to known flood events, with an accuracy of between 68% and 79%.
From a vertical perspective, this study explores the long-term trends and breakpoints of vegetation and climatic factors—particularly rainfall and temperature—in Taiwan. The vertical perspective is defined as the elevation gradients in the vertical dimension of the terrain. Using AVHRR GIMMS3g NDVI data and gridded temperature and rainfall data produced by the Taiwan Climate Change Estimate Information Project (TCCIP), the vertical differences in the impacts of climatic factors on vegetation-related temporal and spatial scales in Taiwan were studied. The purposes of this study are as follows: (1) to understand the trends and breakpoints in the overall NDVI, rainfall, and temperature in Taiwan; (2) to explore the trends and breakpoints in NDVI, rainfall, and temperature at varying elevations; (3) to investigate the regional characteristics of NDVI, rainfall, and temperature; (4) to study the seasonal variations in NDVI, rainfall, and temperature; and (5) to investigate the relationship between NDVI and climatic factors on a regional scale at varying elevations.

2. Materials and Methods

2.1. Study Area

Taiwan is located at the junction of the subtropical Eurasian and the Philippine Sea plates. With a total area of 36,000 km2, and an elevation range of nearly 4000 m (Figure 1), Taiwan has five mountain ranges running north–south, with more than 200 peaks over 3000 m a.s.l. Additionally, the weather in Taiwan is influenced by the northeast and southwest monsoon systems, bringing abundant rainfall in the rainy season and frequent tropical cyclones in summer. Under such special topography and geological conditions, Taiwan is characterized by rich biological resources and ecosystems ranging from tropical to temperate zones, making the study area the only region with a lush forest ecosystem among countries that pass through the Tropic of Cancer. For the purposes of this study, Taiwan was divided into four regions. Each region’s counties and cities were consistent with those from the Taiwan Climate Change Estimate Information Project (TCCIP) (Table 1).

2.2. Research Flow

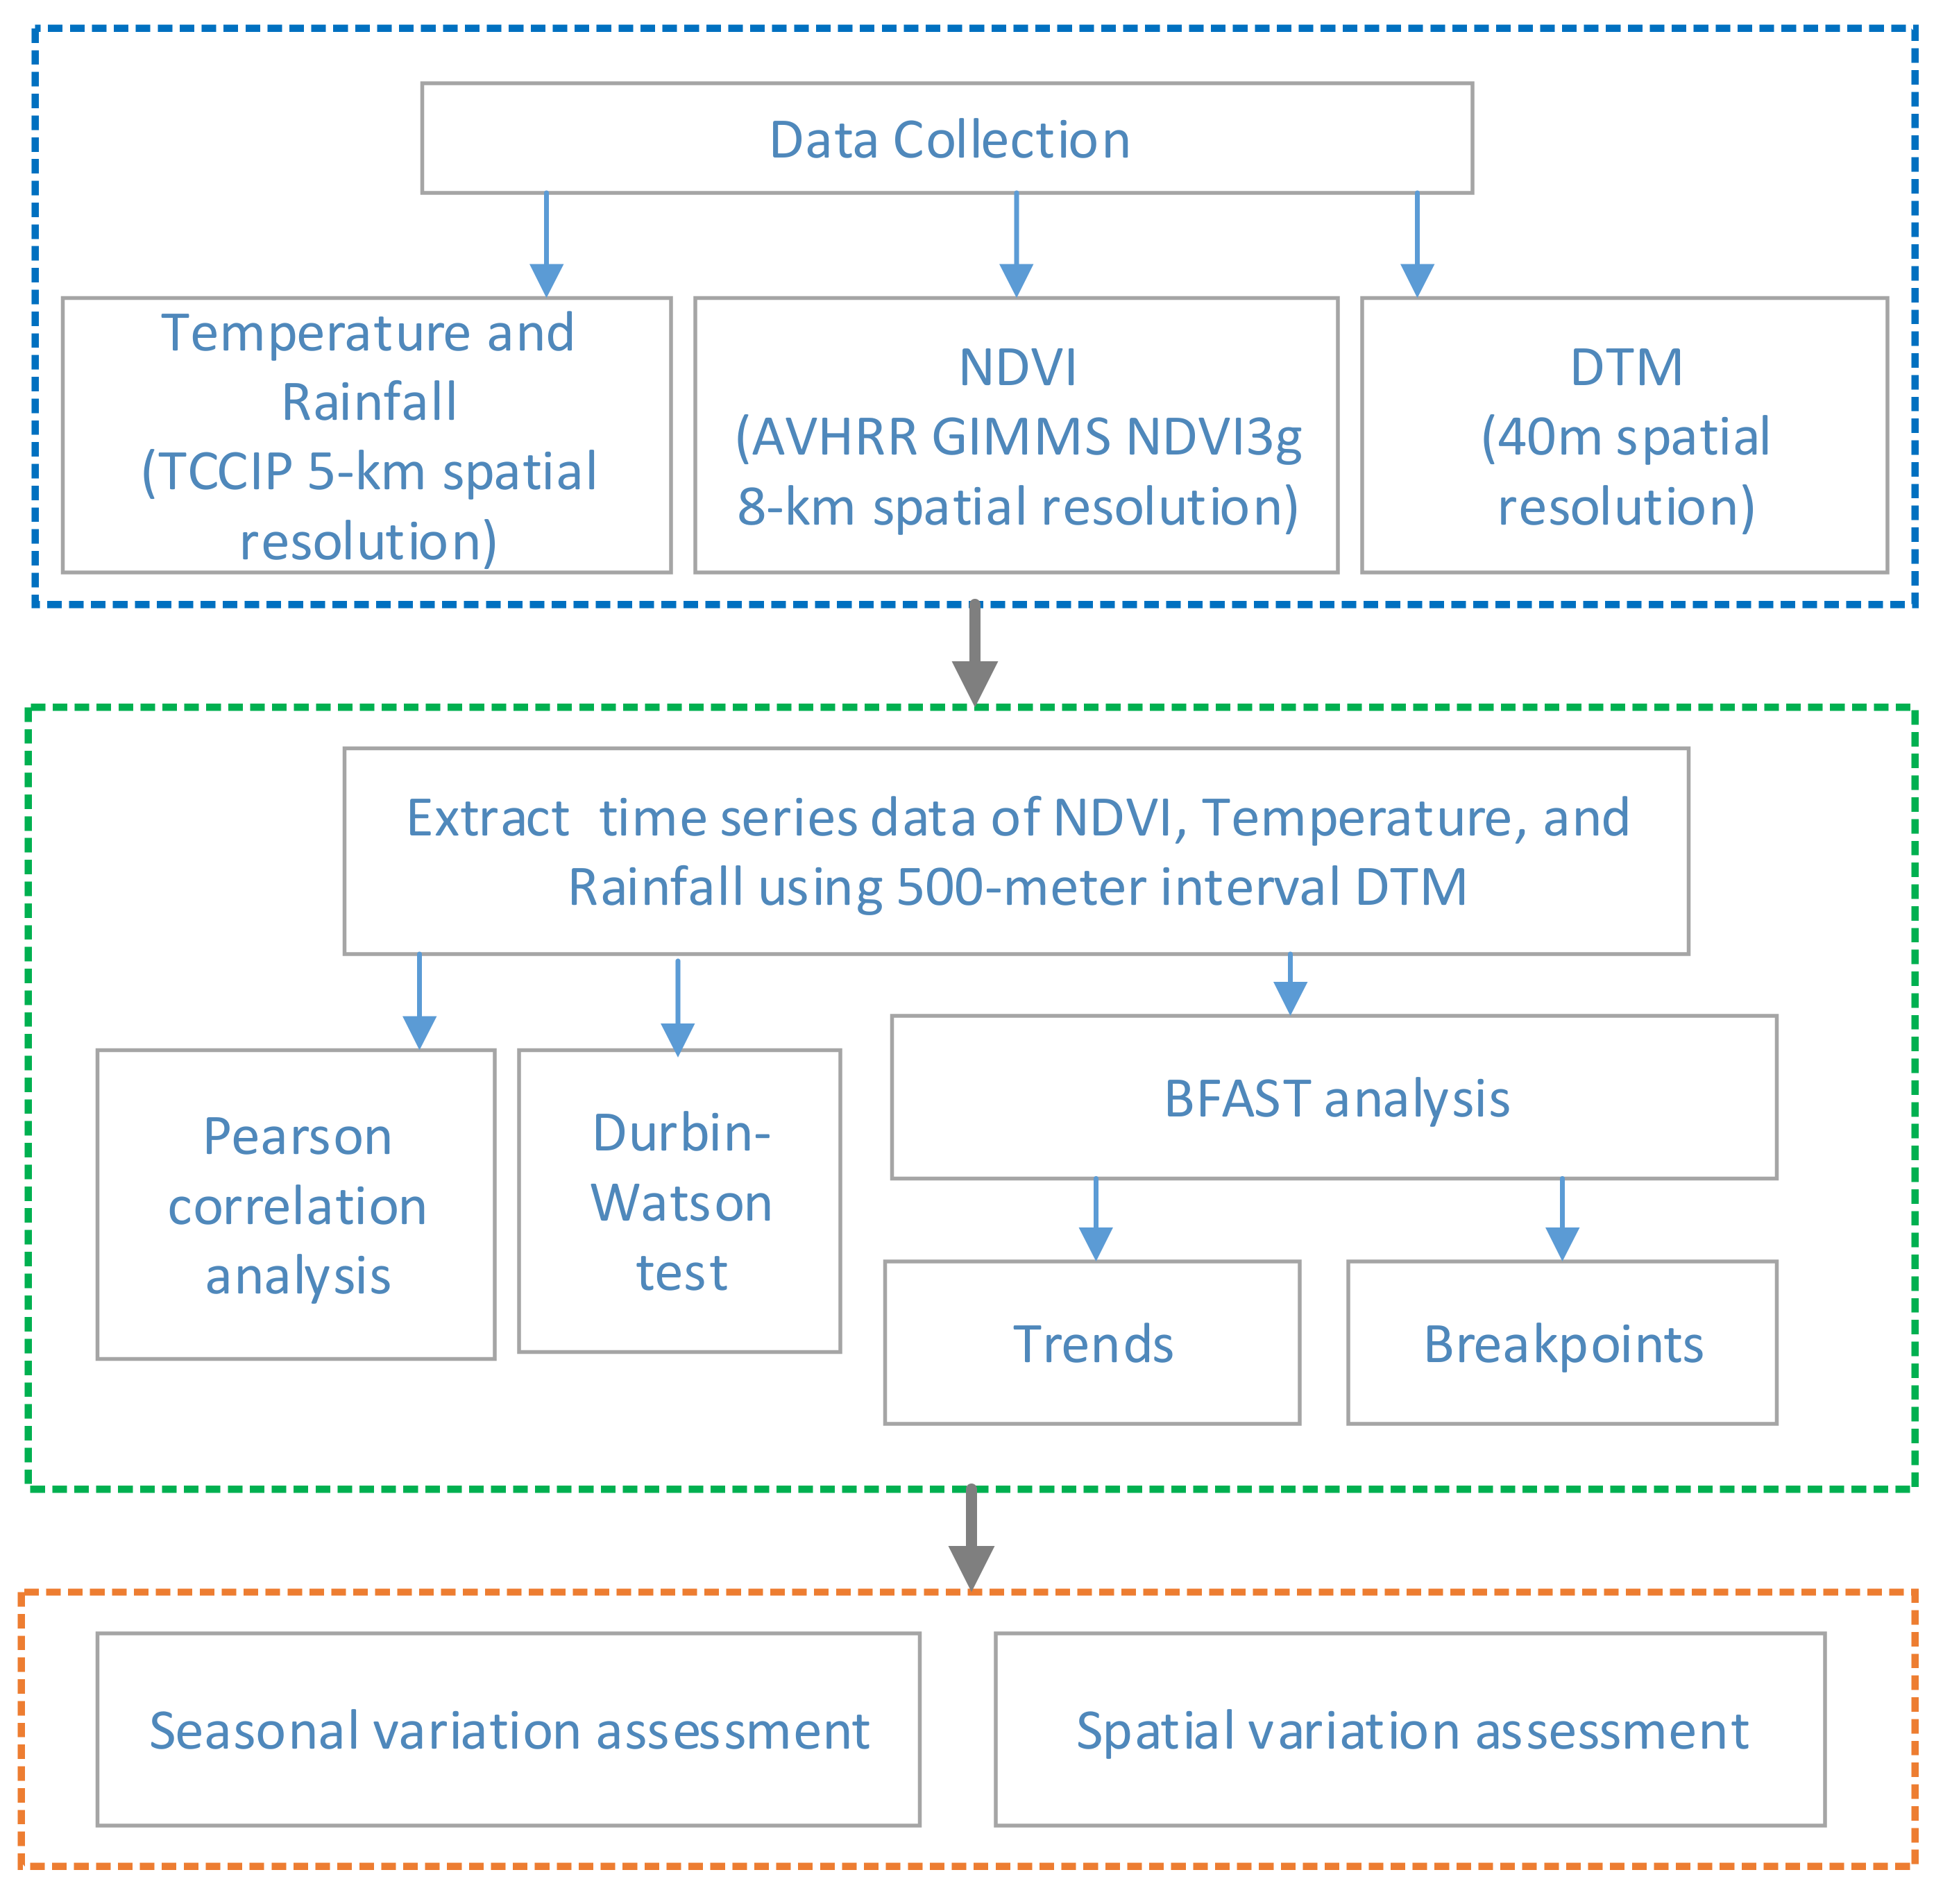
The research flow of this study is illustrated in Figure 2. First, after collection of data on climatic factors (average temperature, minimum temperature, maximum temperature, and rainfall) and NDVI, all time-series data were divided by elevations at 500 m intervals, based on the DTM (digital terrain model) data derived from the Taiwan Ministry of the Interior across the study period 1982–2012. Later, Pearson’s correlation analysis, the Durbin–Watson test, and BFAST analysis were applied to those time-series data to investigate the correlation, autocorrelation, trends, and breakpoints on multiple spatial and temporal scales. Eventually, the seasonal and spatial variations were assessed in order to better understand vegetation responses to climate factors in Taiwan.

2.3. The Normalized Difference Vegetation Index (NDVI)

The time-series vegetation data from 1982 to 2012 were derived from the AVHRR GIMMS3g NDVI dataset—an 8 km spatial resolution satellite dataset distributed via the Global Land Cover Facility (http://www.landcover.org/, accessed on 1 October 2017). Monthly NDVI values were obtained via the maximum value composite (MVC) method in order to reduce the interference of clouds and the atmosphere [45]. NDVI has been widely utilized as an important indicator of vegetation conditions based on the red and near-infrared spectra [46,47]. To date, the AVHRR GIMMS3g NDVI dataset is the longest global NDVI time series, and has been carefully calibrated and widely used in large-scale phenological studies worldwide [39,46,48,49,50,51]. The NDVI can be derived using Equation (1) [52]:
NDVI = NIR RED NIR + RED
where RED and NIR represent surface reflectance averaged over ranges of wavelengths in the spectrum’s visible and near-infrared regions, respectively.
The corresponding time series of monthly temperature and rainfall data at 5 km spatial resolution were obtained from the TCCIP’s gridded dataset (https://tccip.ncdr.nat.gov.tw/, accessed on 1 October 2017). The Ministry of the Interior provided the DTM data via an open data platform (https://data.gov.tw/datasets/, accessed on 15 October 2017). The DTM data were used to produce the 500 m interval mask for extracting values from time-series NDVI and climatic data.

2.4. Break for Additive Seasonal and Trend (BFAST)

The Break for Additive Seasonal and Trend (BFAST) method was developed by Verbesselt et al. in 2010 [34], and has been successfully applied in many ecosystem-related studies on topics such as such as drought [38], hydrology [53], and climatology [54].
Specifically, the BFAST method decomposes time-series data into the trend, seasonal, and remainder components using Equation (2):
Y t = T t + S t + e t , t = 1 , , m
where Y t   represents the observed data at time t , which signifies the monthly NDVI value, rainfall, and temperature data in this study; T t is the trend component (Trend) and S t is the seasonal component (Seasonal), while e t is the remainder component (Remainder) to capture the remaining variation in the data beyond that in the seasonal and trend components. A piecewise linear relationship is assumed for T t , with sector-specific slopes and intercepts on n + 1 different sectors. Accordingly, there are m breakpoints t 1 * , , t n * , defining t 0 * = 0 , so that:
T t = α i + β i t
for   t j 1 * < t t j * , and where j = 1 , , n . The intercept α j   and the slope of consecutive linear models β j can be used to determine the magnitude and direction of the abrupt change, and the slope of the gradual change, between the detected breakpoints. The magnitude of an abrupt change at a breakpoint is derived from the difference between T t at t j 1 * and t j * , so that:
The   magnitude   of   an   abrupt   change = α j 1 α j + β j 1 β j t
where β j 1 represents the slope before the gradual change, whereas β j represents the slope after the gradual change.
The seasonal component across breakpoints can vary, but is rigid between breakpoints. Let the seasonal breakpoint be given by t 1 # , , t p # , and define t 0 # = 0 ;   then, for t j 1 # < t t j # , we assume that:
S t = γ i , j   if   time   t   is   in   the   season   i ,   i = 1 , , s 1 ; i = 1 s 1 γ i , j   if   time   t   is   in   season   0 ,
where s is the number of observations per year referred to the period of seasonality, and γ i , j represents the effect of season i . Thus, the summation of the seasonal component S t across s successive times is exactly zero for t j 1 # < t t j # . The seasonal term can be rewritten as:
S t = i = 1 s 1 γ i , j d i , j d t , 0
where d i , j = 1 when t is in season i , and 0 otherwise. Consequently, if t is in season 0 , then d i , j d t , 0 = 1 . For other seasons, d i , j d t , 0 = 1 when t is in season i 0 . The parameter d i , j is often called a seasonal dummy variable, used to account for the seasons in a regression model.
Following a designed iteration procedure, the detection of breakpoints—including their number and their position in the time series—is based on the Bayesian information criterion (BIC) and ordinary least squares residual-based moving sum (MOSUM) method, respectively [34,42]. In this study, the BFAST method was implemented using the R environment’s bfast package (version 3.5.2, http://www.R-project.org, accessed on 1 January 2018).

2.5. Pearson’s Product–Moment Correlation Coefficient and Serial Autocorrelation

Pearson’s product–moment correlation coefficient is a global-adapted research method developed by Pearson in 1896 [55]. The main concept of the correlation is to evaluate the linear relationship between two variables. Based on the examination of the correlation coefficient (r), the correlation between two variables—and the correlation’s direction—can be revealed. Furthermore, the Durbin–Watson test can test the common issue of temporal serial autocorrelation in time-series data [56]. In this study, Pearson’s product–moment correlation coefficient and the Durbin–Watson test were implemented in the R environment (Version 3.5.2, http://www.R-project.org, accessed on 1 January 2018).

3. Results and Discussion

3.1. Temporal Variation of NDVI, Rainfall, and Temperature in Taiwan

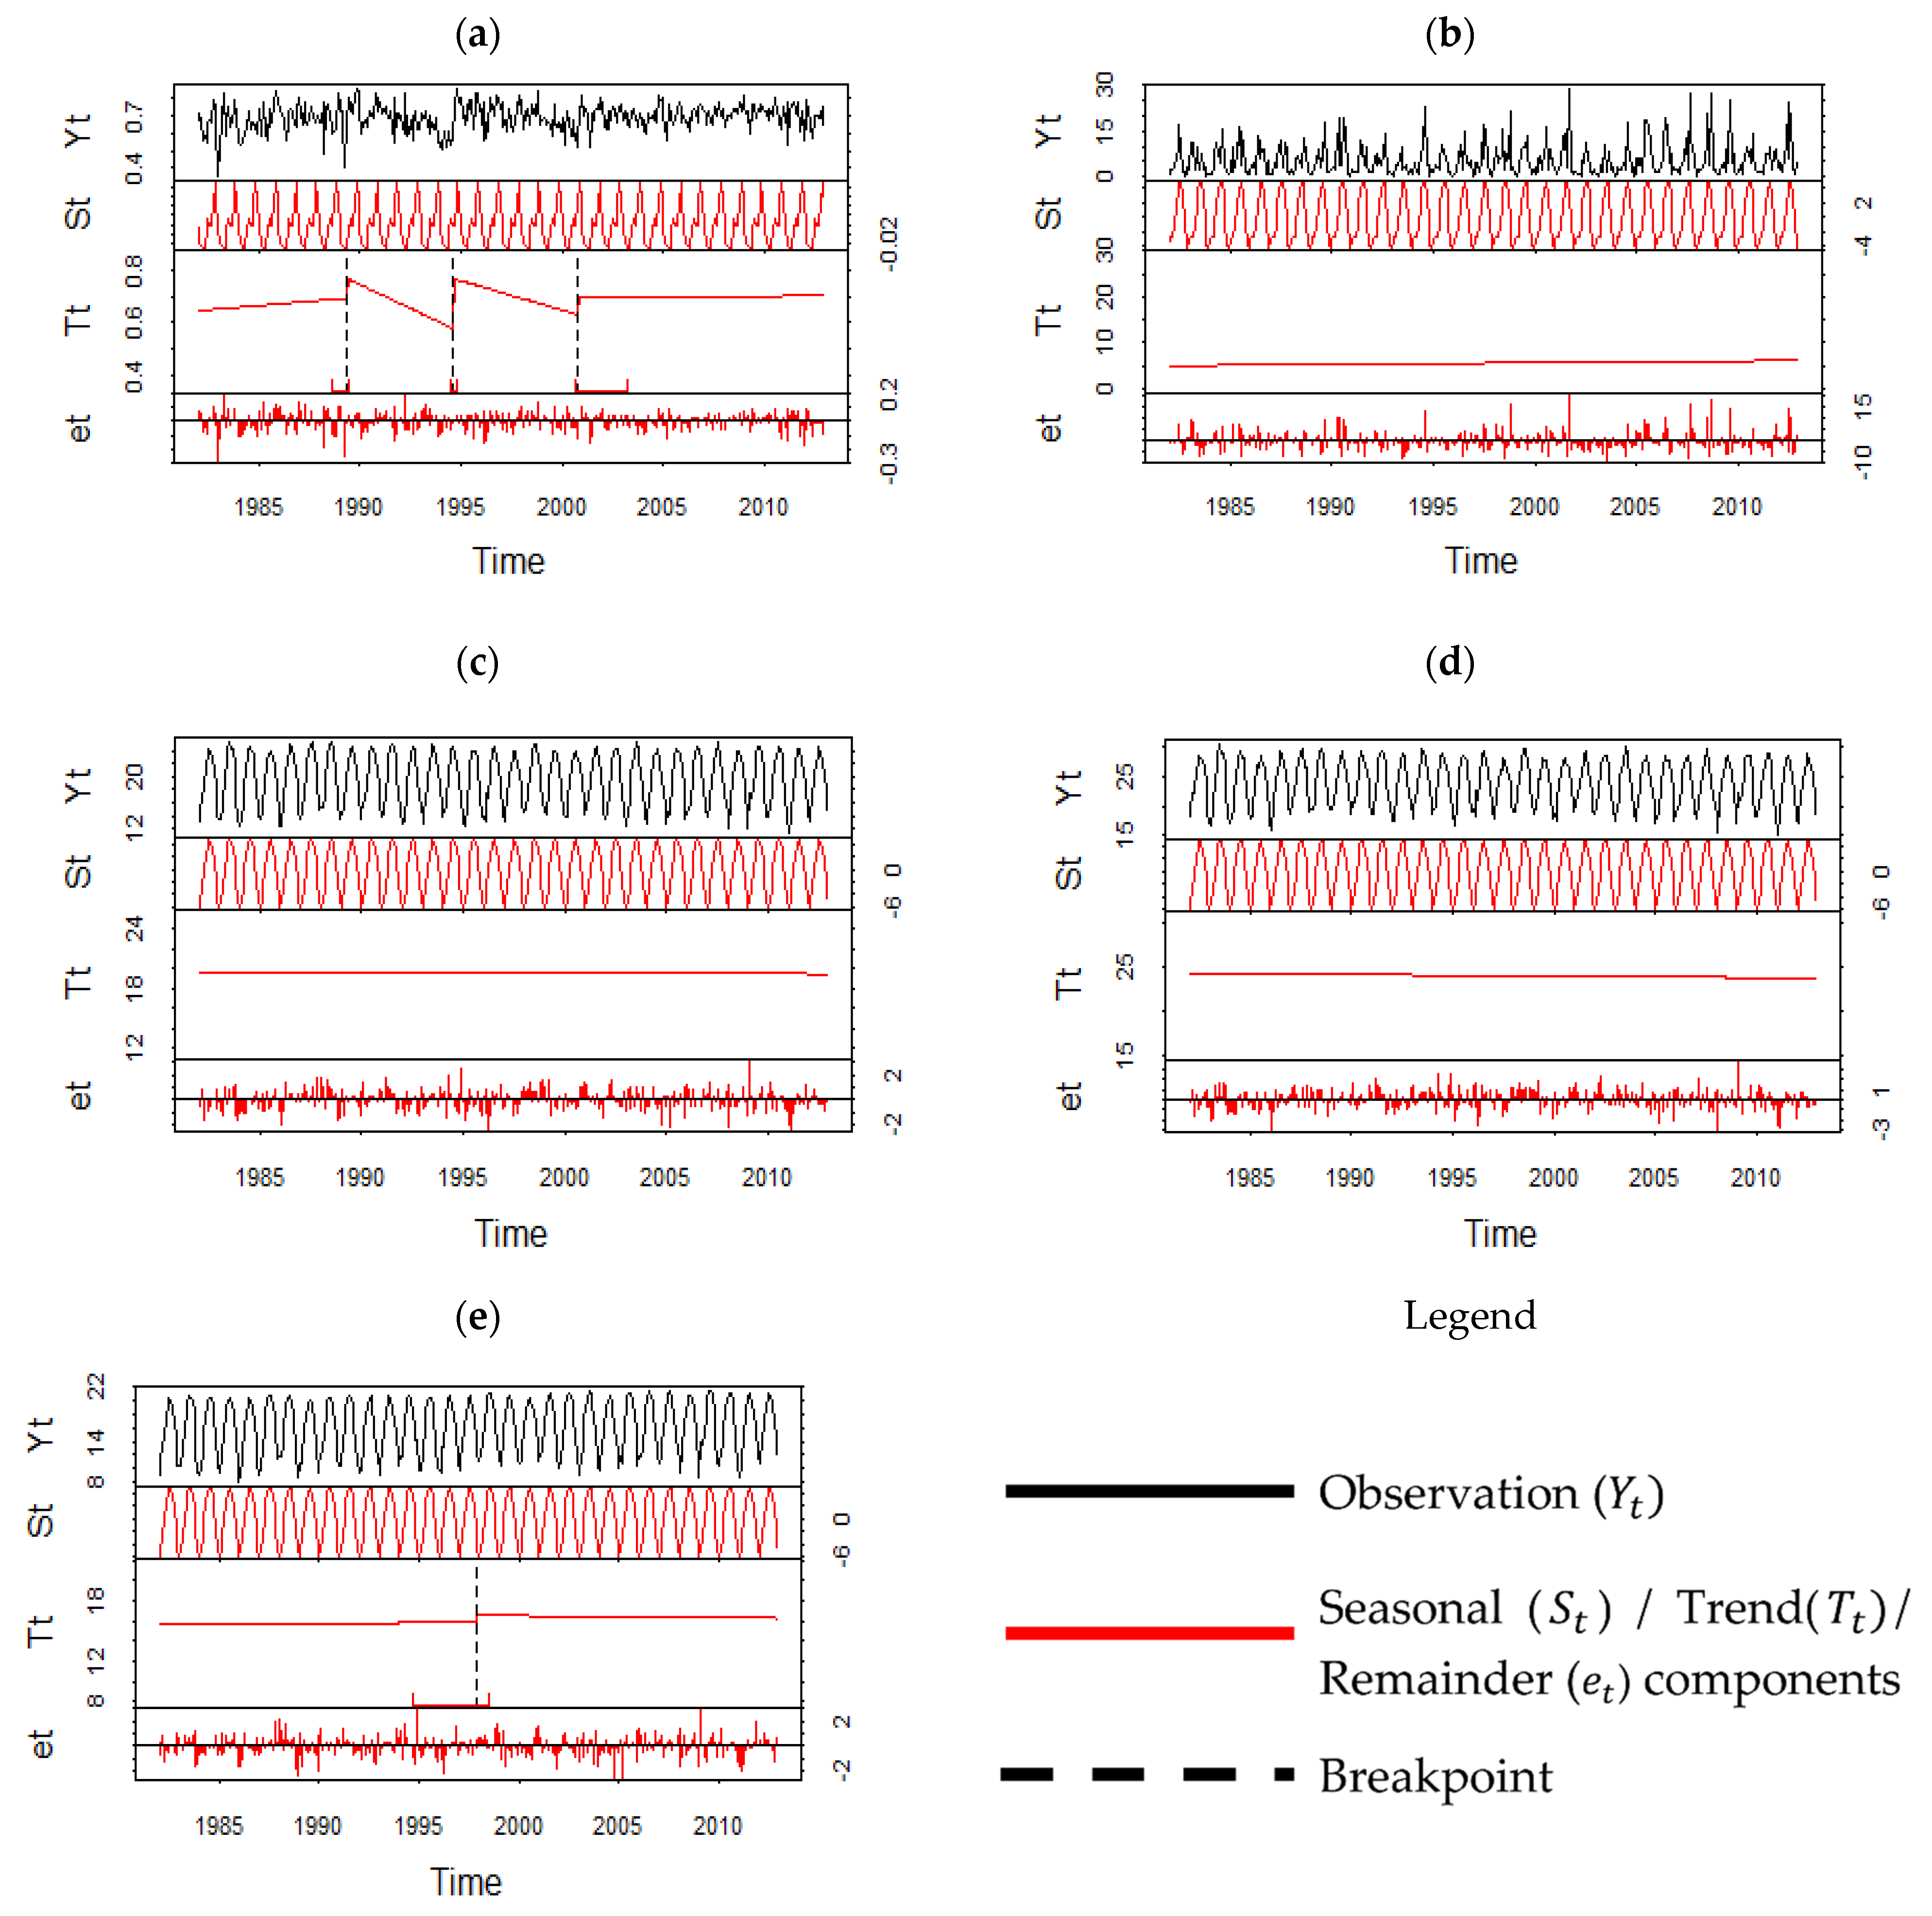
In this study, the BFAST method was used to analyze the long-term trends of Taiwan’s overall NDVI, rainfall, and temperature over the 30 years from 1982 to 2012, on a monthly basis. A total of 372 observations were derived. For the BFAST method, a minimal section size, h, is employed to distinguish between potentially detected breaks in the trend model given as a portion relative to the sample size. On the other hand, the h parameter determines the sensitivity of BFAST. The value of h also determines the maximal number of breaks to be calculated. The number of samples needs to be at least 30 in order to be considered an efficient sample size based on general statistical rules. Therefore, considering the minimum number of observations in each section divided by the length of the time series, a series of h values from 1/2 to 1/12 were tested to determine the optimal h value for BFAST. Furthermore, the number of iterations was set to 500, as suggested by Verbesselt et al. (2010) [34].
The BFAST results are shown in Table 2 and Table 3, along with Figure 3. Only NDVI and minimum temperature (Min-Temp) had breakpoints detected. When h was set to 1/5–1/12 (except 1/6), the temporal characteristics of NDVI had breakpoints. When h was 1/5, the breakpoints occurred in April 1988, August 1994, and October 2000. The slopes changed by 0.0084, −0.0205, −0.0216, and 0.0004, which revealed a positive increasing trend, two negative decreasing trends, and a relatively small positive trend, respectively. A similar trend was found when h was 1/7–1/12; the breakpoints occurred in May 1989, August 1994, and October 2000, with the corresponding intercepts 0.0065, −0.0357, −0.0221, and 0.00002. For the minimum temperature (Min-Temp), the breakpoints occurred in November 1997, with an increasing trend before (0.0175 for the slope value) and a decreasing trend after (−0.0187 for the slope value). Considering the overall data characteristics, including NDVI and climatic factors, the h value was set to 1/7 afterwards for further analysis.
The NDVI trend is closely linked to the sequence of Taiwan’s development. As a developing region, Taiwan has experienced population growth with subsequent urbanization, a decoupling of the demand for agricultural land from population growth, and a transition from forest shrinking to forest expansion. Based on a study conducted by Chen et al. (2019) [57], substantial land cover changes were discovered from the historical reconstruction of Taiwan’s land cover maps from 1904 to 2015. Between 1982 and 1994, urban expansion consumed agricultural and forested land in the vicinity of larger cities, responsible for the NDVI breakpoints observed in 1989 and 1994. Additionally, according to the Taiwan Forest Management Plan implemented in 1997, the annual logging volume shall not exceed 200,000 cubic meters. Therefore, the forest area of Taiwan has been under control since then, thus reflecting the upward trend in NDVI observed since 2000.
There were no breakpoints detected for the rainfall (Rain), average temperature (Avg-Temp), or maximum temperature (Max-Temp). The slopes were 0.0124 and −0.0068 for rainfall and average temperature, respectively, indicating an increasing rainfall pattern and decreasing average temperature. Although the maximum temperature had no breakpoint, it gradually decreased with a slope of −0.0170.
The increasing rainfall pattern may be associated with the positive trend found in extreme rainfall reported by Henny et al. (2021) [58], based on a 56-year dataset across Taiwan in different seasons and geographic regions; however, the slightly decreasing average temperature and maximum temperature differed from the findings of other studies [59,60]; these discrepancies may result from the different datasets and study periods.

3.2. Temporal Variations of NDVI, Rainfall, and Temperature in Taiwan at Varied Elevations

Data on NDVI and climatic factors (average temperature, minimum temperature, maximum temperature, and rainfall) were divided by elevation at 500 m intervals, based on the DTM data from the study period 1982–2012. After applying BFAST, the results shown in Figure 4 displayed a consistent pattern of breakpoints across varied elevations.
A total of three breakpoints were detected from 0 to 3500 m, and two breakpoints from 3500 to 4000 m. For elevations of 0 to 3500 m, the first breakpoint occurred in 1989, the second breakpoint was in 1994, and the third breakpoint was in 2000. The NDVI slope from 1982 to 1989 was positive in terms of trends, reflecting a positive plant growth state; from 1989 to 2000, the slope was negative, reflecting a negative plant growth state. After 2000, only the lowest and second-highest altitudes (0 to 500 m and 3000 to 3500 m) had a positive trend, and the remaining elevations from 500 to 3000 m showed a negative trend. At 3500–4000 m, the two breakpoints were the same as at other altitudes, and the trends were also similar.
The NDVI trend also reflects the effects of land use/cover change with associated public administrative policies, such as the Veteran Agricultural Reclamation Policy (VARP) (1955−1988), the Farmland Release Policy (FRP) (1989–2004), and the National Land Restoration Policy (NLRP) (2005−2015) [61]. Based on a study of three major Veterans Affairs Council (VAC) farms located in central Taiwan, with the implementation of the VARP, 21.15% of forestland was transformed into farmland; with the FRP policy, 7.36% of public farmland and 0.72% of private farmland changed into forestland. With the NLRP policy, 27.33% of public farmland and 3.53% of private farmland changed into forestland [61]. According to the high elevation of these three VAC farms (3000 to 3500 m), the positive trend in NDVI corresponded well with the findings of the present study.
Additionally, the positive trend in NDVI found at 0–500 m is consistent with the findings of Abdulmana et al. (2021) [59], who studied NDVI based on satellite images across Taiwan from 2000 to 2020; the authors reported a significant mean increase in decadal trends of NDVI (95% confidence interval: 0.013–0.025 unit/decade). As the effects of land use/cover would interact with the mesoscale meteorological simulation, understanding the exchange mechanism of heat and momentum plays an important role in predictive models [62,63] that can be applied to future climate change mitigation.
Figure 5 shows the BFAST results of climatic factors, including rainfall (Rain), average temperature (Avg-Temp), maximum temperature (Max-Temp), and minimum temperature (Min-Temp). There were no breakpoints detected in rainfall, but the rainfall across all of Taiwan was found to be gradually increasing at all altitudes. Furthermore, based on a study of three catchments in northern Taiwan, no significant trend was found from 1980 to 2017 in annual precipitation records derived from five weather stations [64], which is consistent with the absence of breakpoints observed in the present study. Moreover, the reduction in light precipitation (<4 mm h−1) and an increase in heavy precipitation (>10 mm h−1) derived from the 1961–2005 meteorological data for Taiwan may contribute to the overall increase in rainfall at all altitudes [65].
In terms of average temperature, in contrast to elevations lower than 500 m, the elevations of 500–1000 m and 3500–4000 m gradually decreased. The remaining patterns between 1000 and 3500 m were similar, with one breakpoint occurring in 1988. The trend before 1988 was positive, and the trend after that was negative. The maximum temperature (Max-Temp) for the elevations of 0–500 m gradually increased; the other altitudes showed a cooling trend. The observed increased maximum temperature for the 0–500 m elevations coincided with the nighttime warming trend found in major urban areas [65]. The temperature changes in megacities have been studied worldwide with respect to the effects of urban heat islands and associated health and environmental impacts [60,66,67,68,69].
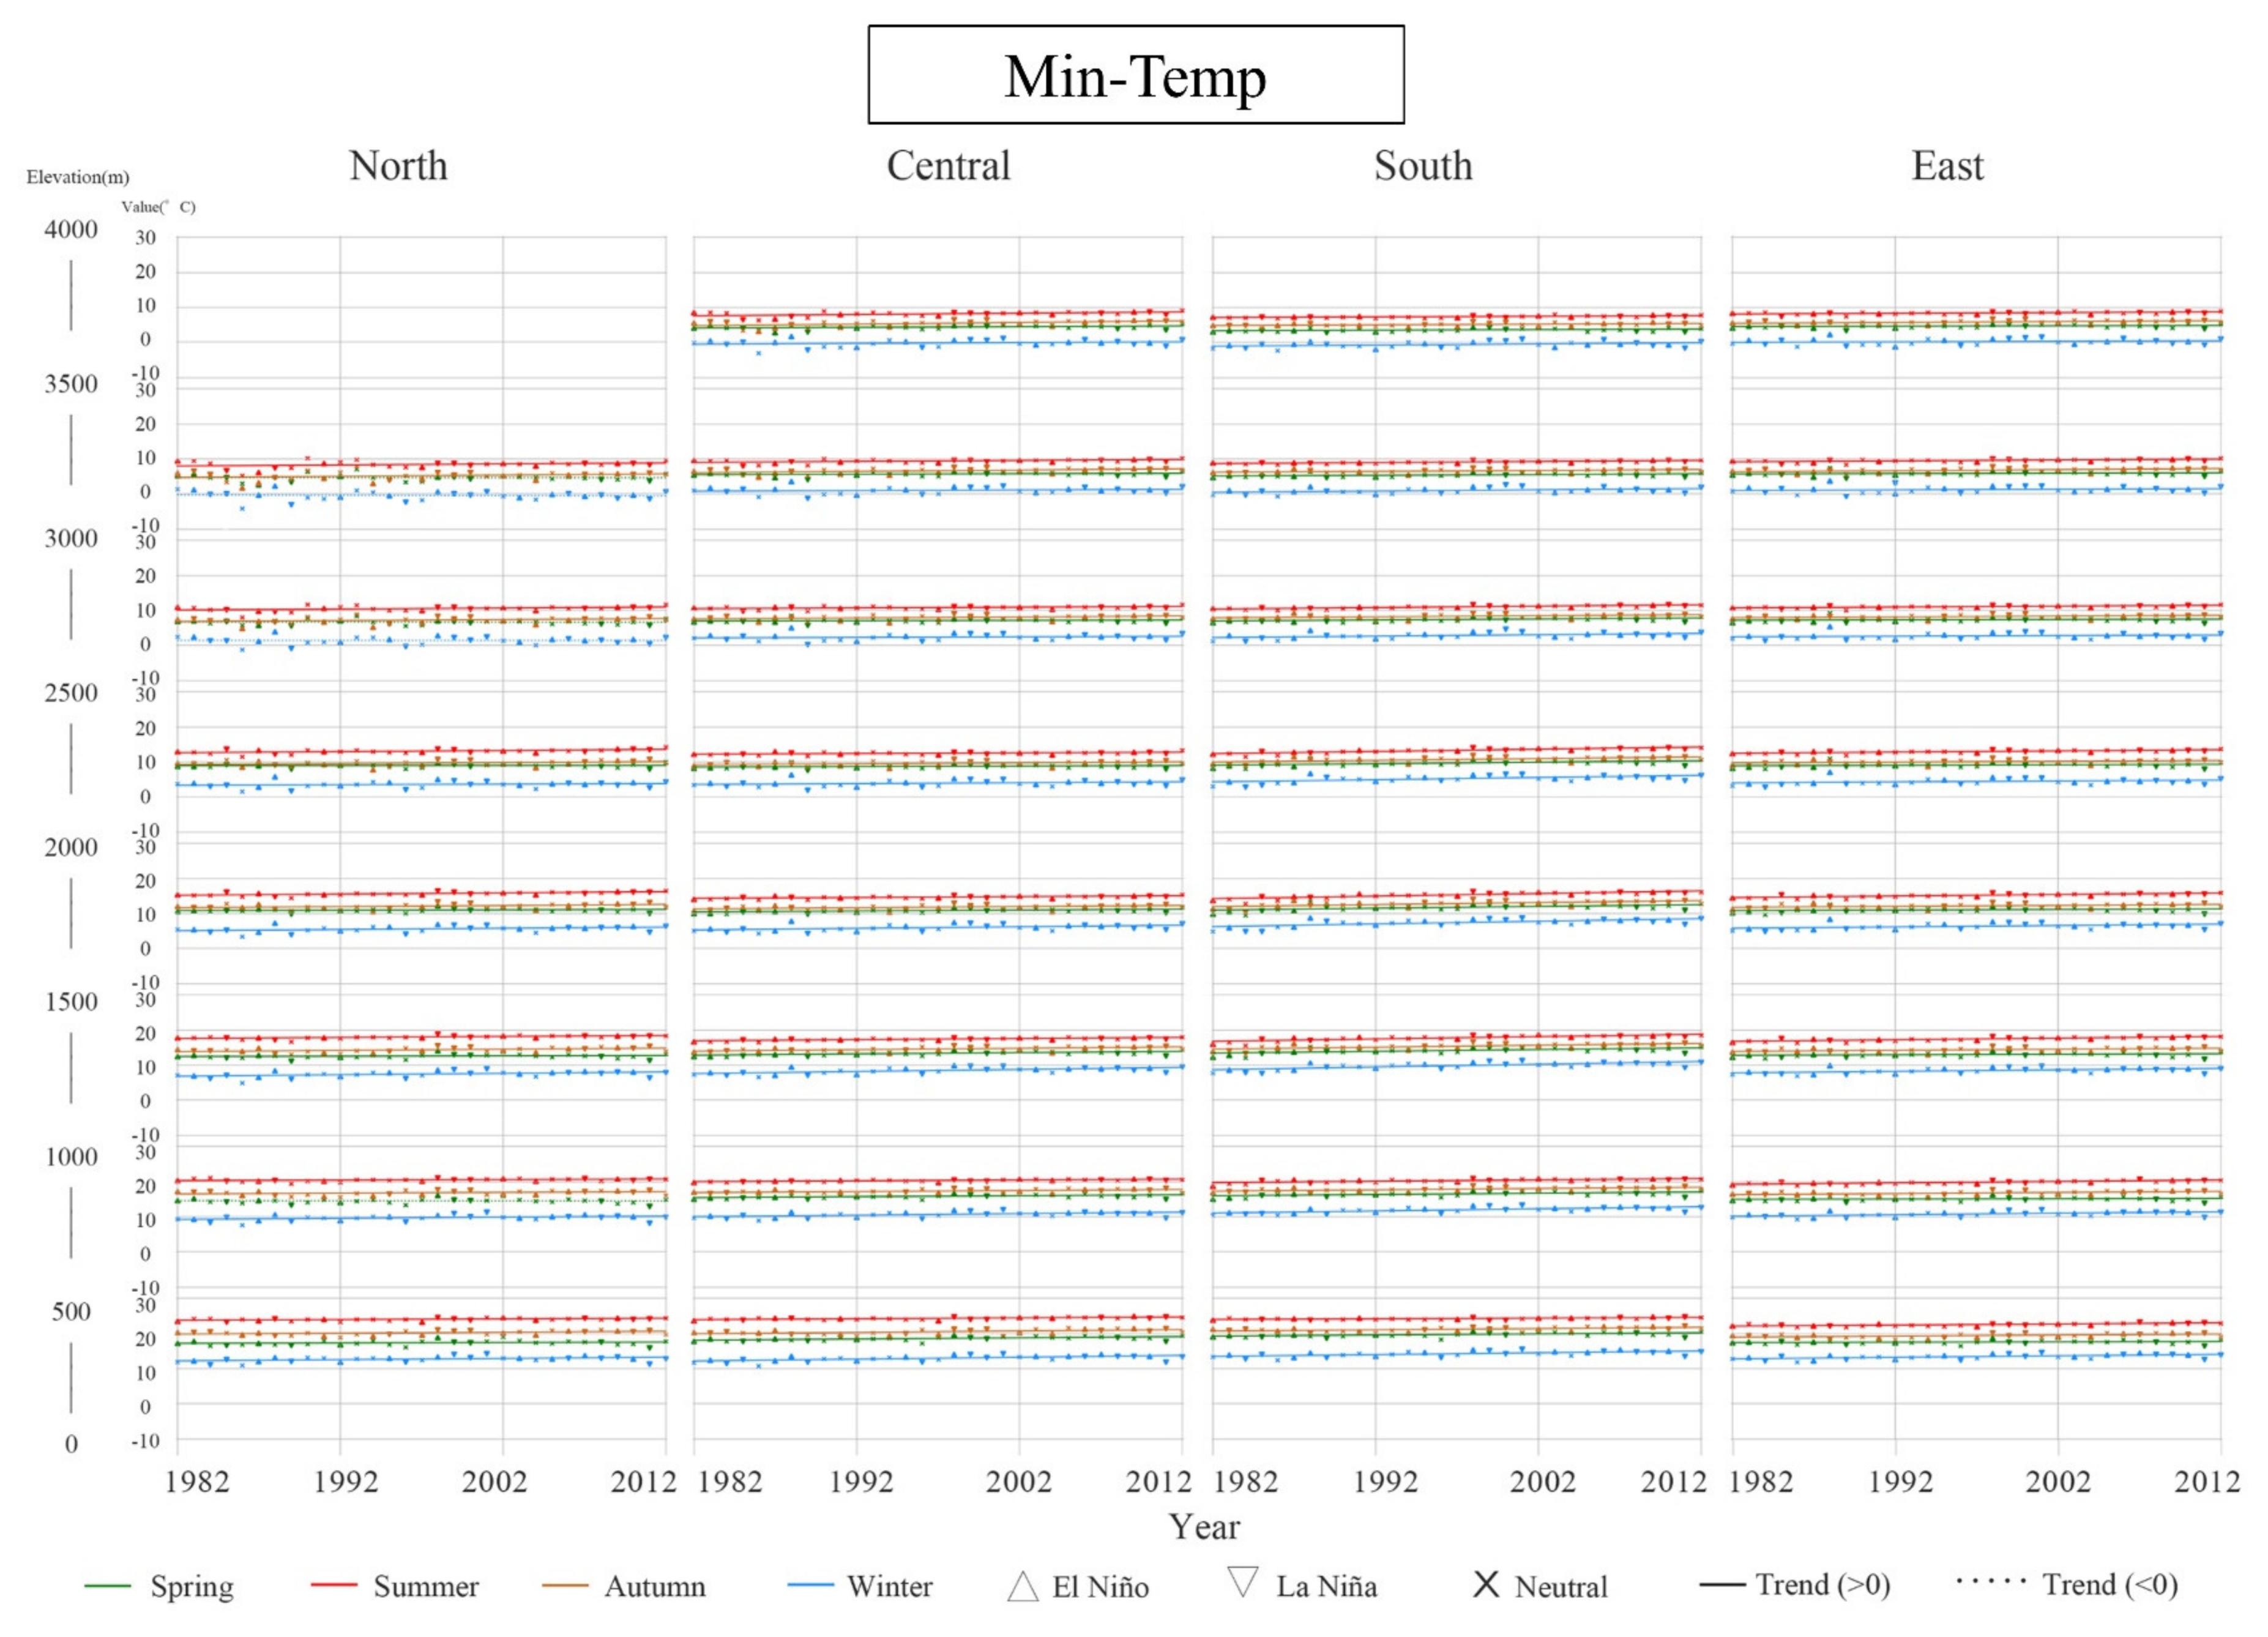
There was a breakpoint between 500 and 2500 m in 1986, and the cooling trend after that was relatively gentle. Most of the minimum temperature (Min-Temp) values increased, especially in areas above 2000 m, and the areas below 2000 m only began a downward trend after 1997. There were three breakpoints at the higher altitudes of 3000–3500 m, all of which showed rising trends in 1985, 1988, and 2001. The observed pattern at higher altitudes provides a great insight into the changing climate, because higher altitude areas typically present natural status without many human disturbances. Additionally, montane regions harbor more than half of the world’s biodiversity [70]. Therefore, many scholars have explored the effects of climate change on montane vegetation in Taiwan, with valuable results, including the changing phenology [71], the impacts of seasonal drought [72], and the typhoon disturbance mediation of forest structure [73,74].

3.3. Regional Variations of NDVI, Rainfall, and Temperature in Taiwan at Varied Elevations

The regional variations of NDVI, rainfall, and temperature in Taiwan at varied elevations were investigated, including the occurrence and the largest changes in the time and direction of breakpoints. Detailed results of regional variations are provided in the supplementary materials (Figures S1–S5).

3.3.1. Occurrence of Breakpoints

Figure 6 illustrates the occurrence of breakpoints examined via BFAST analysis for the NDVI and temperature datasets. There were no breakpoints observed for the rainfall dataset. For NDVI (Figure 6a), the northern region had only one breakpoint at higher elevation (2000–3000 m), while other regions revealed two or more breakpoints over the study periods. The central and eastern regions showed three breakpoints at elevations between 500 and 2000 m, and above 1500 m. The southern region presented two consistent breakpoints across all altitudes.
The occurrence of NDVI breakpoints may be related to topographic characteristics and complex weather systems such as monsoons, meiyu periods, typhoons, and associated natural disaster events [75,76]. As Taiwan is located on the Pacific Rim of the seismic belt, its unique geological characteristics also make Taiwan vulnerable to natural disasters. For example, based on historical records, an average of 3–4 typhoons make landfall in Taiwan annually, and the associated natural disasters such as flooding, landslides, and debris flows have normally resulted in land deformation at various scales across Taiwan [77,78,79]. Thus, the NDVI breakpoints with the downward trends during the study periods were highly plausible, reflecting island-wide land deformation.
The average temperature (Figure 6b) showed no breakpoints for most of the northern and central regions. One and two breakpoints were observed in the eastern and southern regions, respectively. For the maximum temperature (Figure 6c), areas below 500 m in the northern and central regions, and below 1000 m in the southern and eastern regions, showed one breakpoint. One breakpoint of the minimum temperature was detected for most of the northern regions (Figure 6d). One to two breakpoints were discovered above 1500 m in the central region, and above 500 m in the south and east. Four breakpoints were observed at the highest elevation in the central region. Additionally, the northern region displayed a stable situation, with fewer occurrences, while the central region showed higher variations. Higher elevations showed larger variations in the NDVI and temperature datasets.
The temperature has long been the dominant control factor in global vegetation trends, especially in the higher latitude and altitude areas [6,7,12]. A recent study conducted by Wang and Chang (2021) [80] performed a detailed assessment of the relationships between vegetation, climatic factors, and non-climatic factors at multiple timescales across various land cover types in Taiwan; based on their findings, temperature and precipitation play important roles in vegetation growth; however, the effects vary across seasons. The conclusions of Wang and Chang (2021) [80] correspond to the statement presented by Piao et al. (2014) [81], who recognized that the relationship between vegetation and climate factors might change over time due to the changes in climate and other environmental factors [81].

3.3.2. Largest Changes in the Time and Direction of Breakpoints

Figure 7 and Figure 8 demonstrate the detected timing of the largest changes in the time and direction of breakpoints occurring in the time series of NDVI and temperature datasets examined via BFAST analysis. As shown in Figure 7a, the higher altitude areas (2000–3000 m) in the north had their largest breakpoint earlier in 1984 for NDVI. A consistent change in time in 1989 was observed for other regions at an altitude above 1500 m. Elevations below 1500 m in the central and southern regions showed their largest change one year after 1989. In general, the eastern region showed its largest change earlier than other regions. In Figure 7b, the observed pattern of average temperature was similar to that of NDVI. The largest change occurred in the late 1980s at an elevation above 1500 m for the central, southern, and eastern regions. For the area above 2000 m in the north, and between 500 and 2500 m in the south, the largest changes occurred in the 1990s. For the maximum temperature (Figure 7c), most eastern regions showed their largest change earlier in 1986, while the other regions showed theirs in the 1990s. Mid-altitude (1000–3000 m) areas showed their largest maximum temperature change in the early 1990s, while lower altitude areas showed theirs in the late 1990s. Lower altitude areas in the southern, central, and eastern regions displayed their largest minimum temperature change in the 1980s (Figure 7d). The largest breakpoint occurred in the majority of the northern regions around the late 1990s. In short, NDVI, average temperature, and minimum temperature showed their largest changes earlier at higher altitude areas, reflecting the sensitivity and diversity of montane regions. Based on a global study of elevational diversity patterns conducted by Guo et al. (2013) [82], 443 montane regions around the Northern and Southern Hemispheres have presented both physical and physiological constraints in various ways. Thus, it is necessary to better quantify and interpret the patterns in order to understand the underlying causal mechanisms.
Figure 8 displays the largest change in direction of the NDVI and temperature datasets, which should be interpreted carefully, considering that the largest change in direction was a snapshot of the study period and, thus, could not reveal the whole trajectory of the time series. Nevertheless, based on our results (Figure 8a), a dominant browning of NDVI (direction < 0, shown in red) was observed in the southern and central regions, which is consistent with the long-term landslide monitoring records [83] and the increasing extreme rainfall trend found over the southwestern mountain slopes during the meiyu season [58].
In the eastern and northern regions, NDVI browning was observed at higher altitudes. A dominant decreasing direction of average and maximum temperature was found in most of the eastern and southern regions (Figure 8b,c). An increasing trend (direction > 0, shown in green) was found in the maximum and minimum temperature datasets at higher altitudes. Specifically, the increasing minimum temperature direction was more prominent in the mid-to-high-altitude areas in the eastern and central regions.

3.3.3. ENSO Events

A large-scale climate index, the El Niño–Southern Oscillation (ENSO) is an ocean–atmosphere interaction phenomenon that moderates climatic factors with great variations worldwide. Many previous studies have indicated that rainfall variations in northeast Taiwan are influenced by the ENSO [15,84,85]. A recent study further illustrates that ENSO forcing, including monsoon systems, exhibits a coherent association with March and October–November rainfall patterns in Taiwan [86]. Since rainfall and temperature are two critical climatic factors for plants’ biophysical conditions, many scholars have devoted research efforts to discerning their relationships. Chang et al. (2013) [17] revealed that ENSO-related rainfall patterns in Taiwan carried out biophysical memory effects on vegetation’s time-series patterns. Based on a Holocene stalagmite record, Li et al. (2015) [87] found that during the La Niña years, southern Taiwan experienced decreased rainfall in April–June and increased rainfall in July–September, which were associated with weaker meiyu rainfall and stronger typhoons, respectively. For central Taiwan, Huang et al. (2020) [88] discovered that frequent drought-related wildfires, which impact vegetation in central Taiwan, were associated with the dry and cool weather during the El Niño years.
The months of ENSO events determined by the NOAA (National Oceanic and Atmospheric Administration) climate prediction center are marked in orange and green for the El Niño and La Niña events, respectively, in Figure 4 and Figure 5 [89]. Between 1982 and 2012, the La Niña events occurred 10 times, while the El Niño events occurred 9 times; therefore, the total number of months of La Niña events accounted for 30% of the study period from 1982 to 2012 (372 months), while the total number of months of El Niño events accounted for 26% (Table 4). Additionally, between 2000 and 2012, La Niña events occurred five times, while El Niño events occurred four times; however, a larger percentage difference between ENSO events was discovered after 2000. The La Niña and El Niño events accounted for 28% and 20% of the months in 2000–2012 (156 months), respectively. The larger percentage difference implies the increasing frequency of La Niña events, with associated impacts such as weaker meiyu rainfall and stronger typhoons in Taiwan.

3.4. Regional and Seasonal Variations of NDVI, Rainfall, and Temperature in Taiwan at Varied Elevations

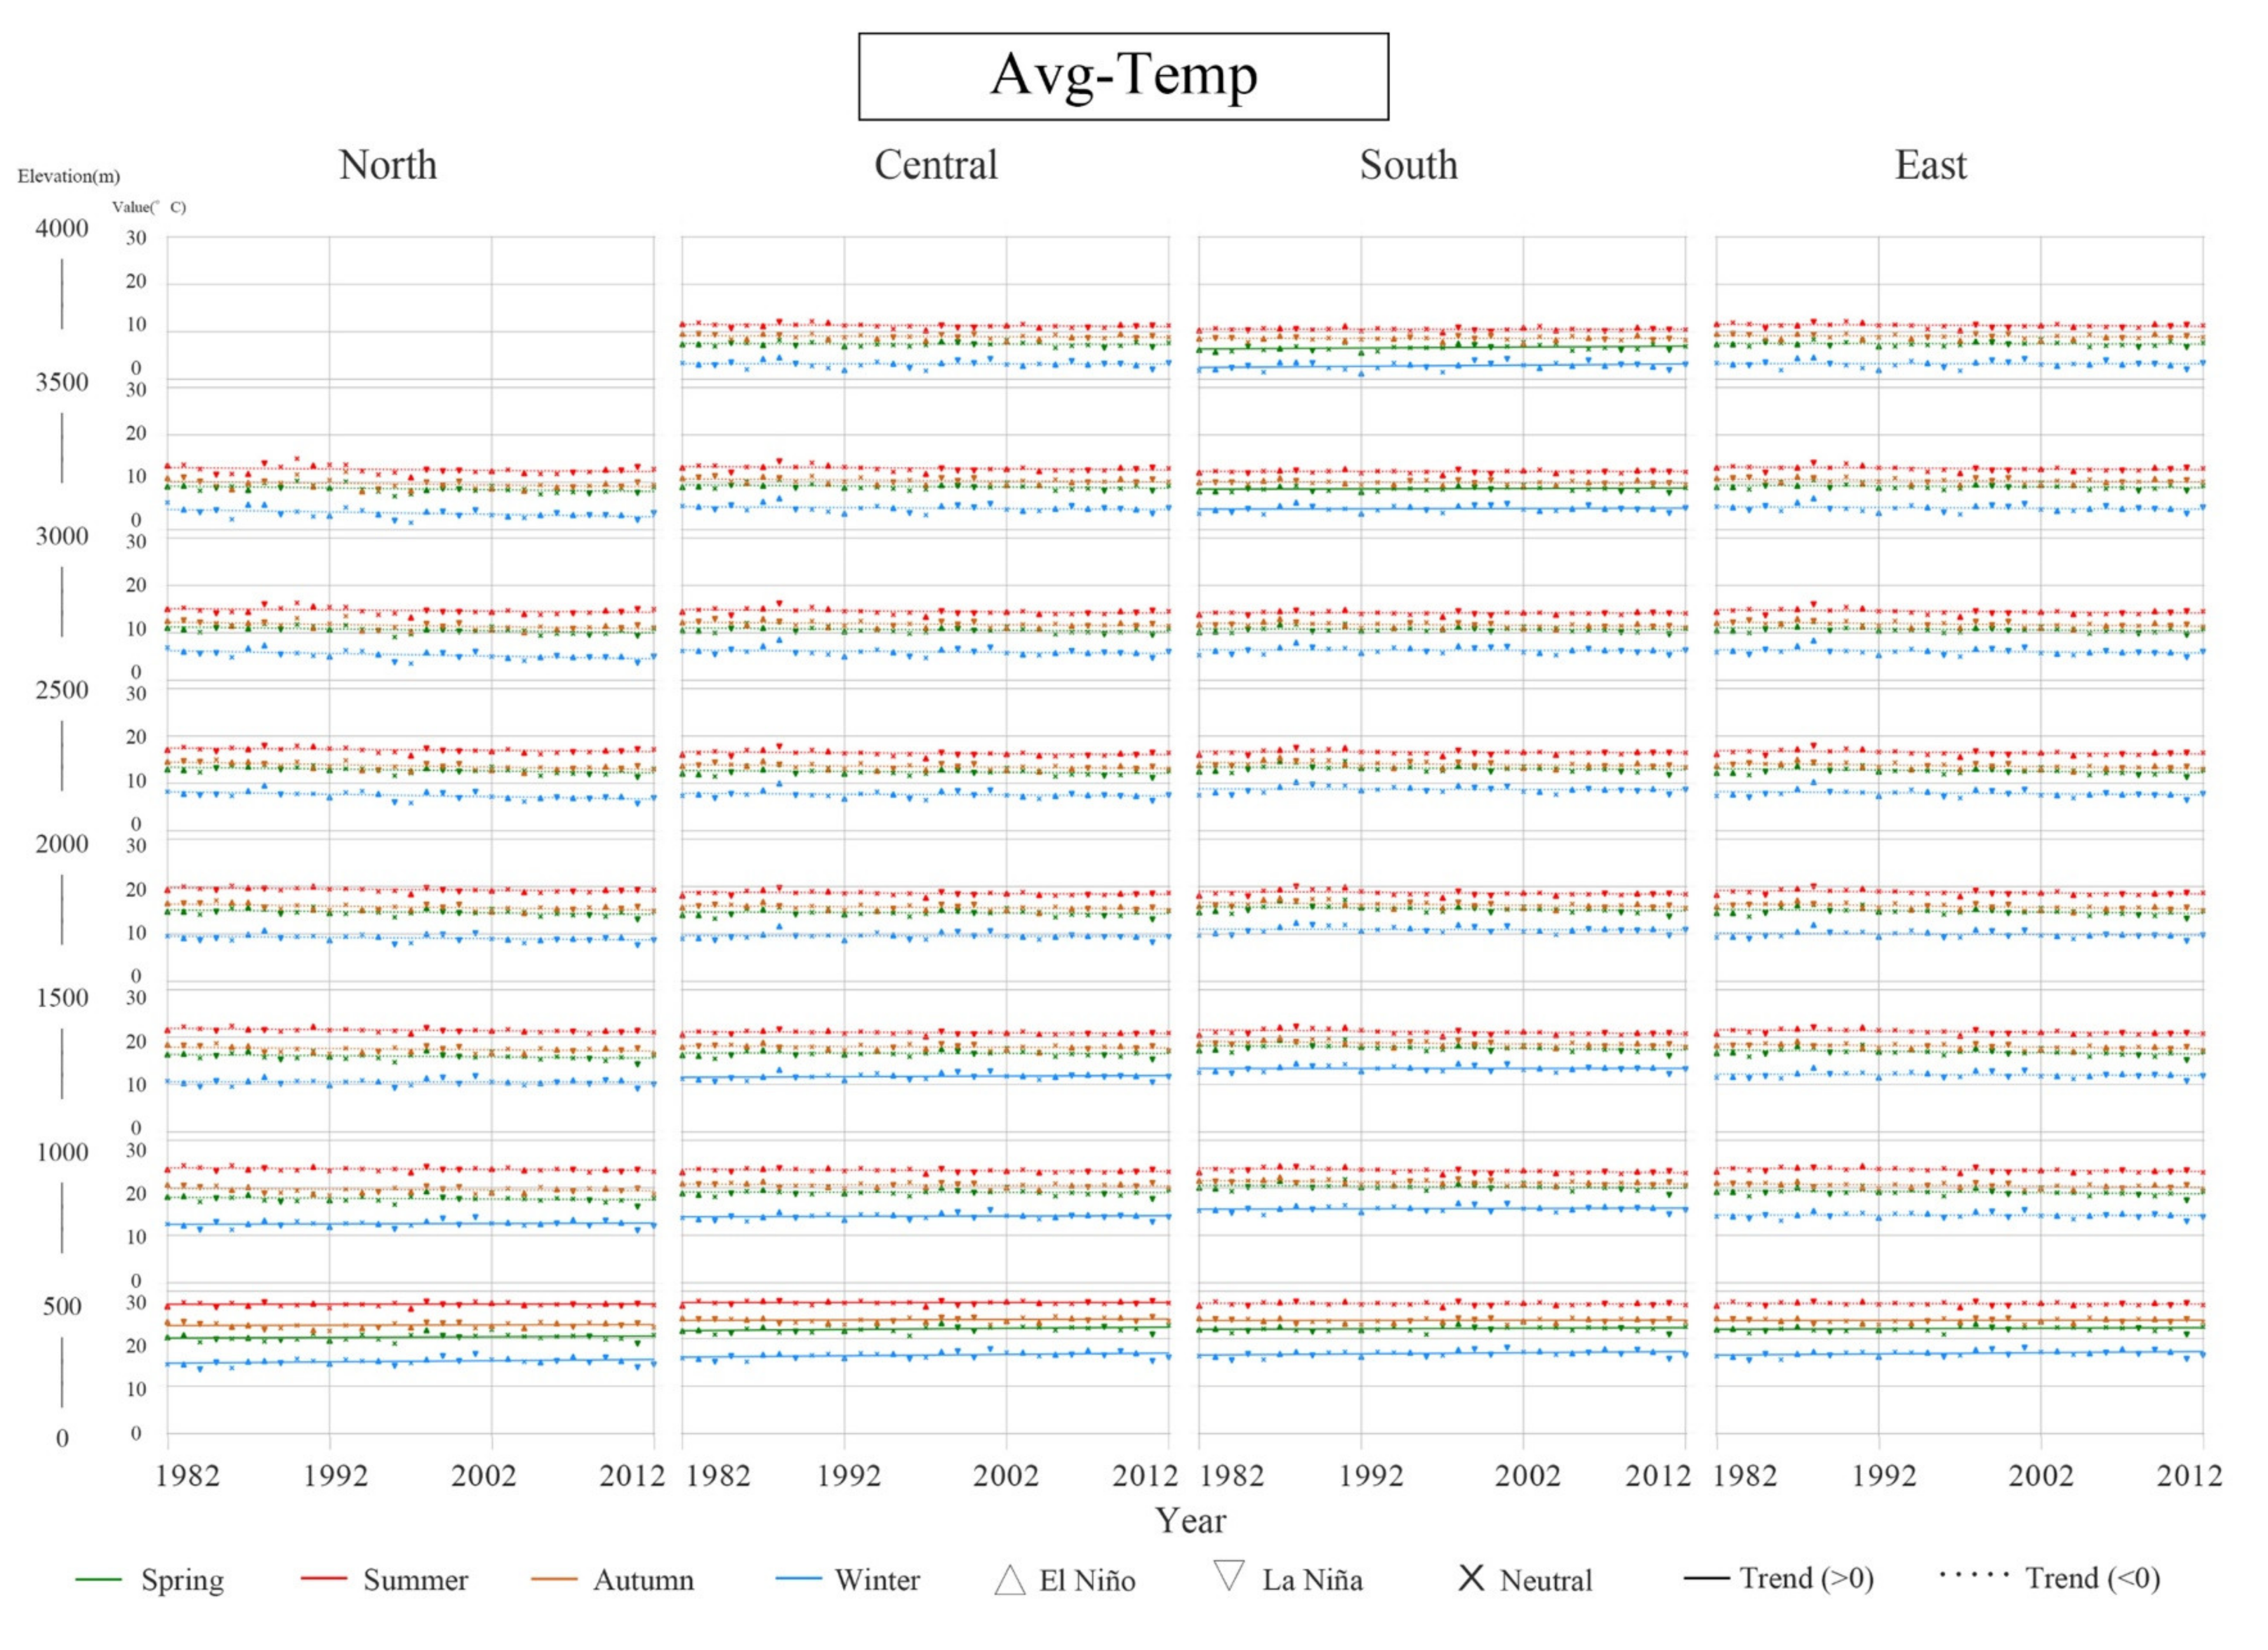
Four divisions (north, central, south, and east) and four seasons (spring, summer, fall, and winter) were adapted from the TCCIP. Regional and seasonal variations in NDVI, rainfall, and temperature at varied elevations were studied. The seasonal and regional linear trends of NDVI are shown in Figure 9. Most regions except the east showed higher NDVI values in fall/winter and lower values in spring and summer; however, at altitudes below 500 m—especially in the central and southern regions—the discrepancy between seasons was not as clear, associated with a relatively higher level of human occupation. Thus, the area with relatively higher human occupation contains cities and human-controlled vegetation systems such as croplands, agricultural fields, public parks, etc., which are typically maintained at all times. Thus, the variations in NDVI between seasons are due to human influences. In the northern region, an upward trend in NDVI in spring was found at altitudes below 2000 m.
Additionally, NDVI’s upward trend was found in summer and winter, while there was a downward trend in autumn. For the central, southern, and eastern regions, there was an upward trend in all seasons. Apart from the regional deviations, it is noticeable that the discrepancies between seasons seemed to gradually shrink, which implies a decreasing strength of seasonality islandwide.
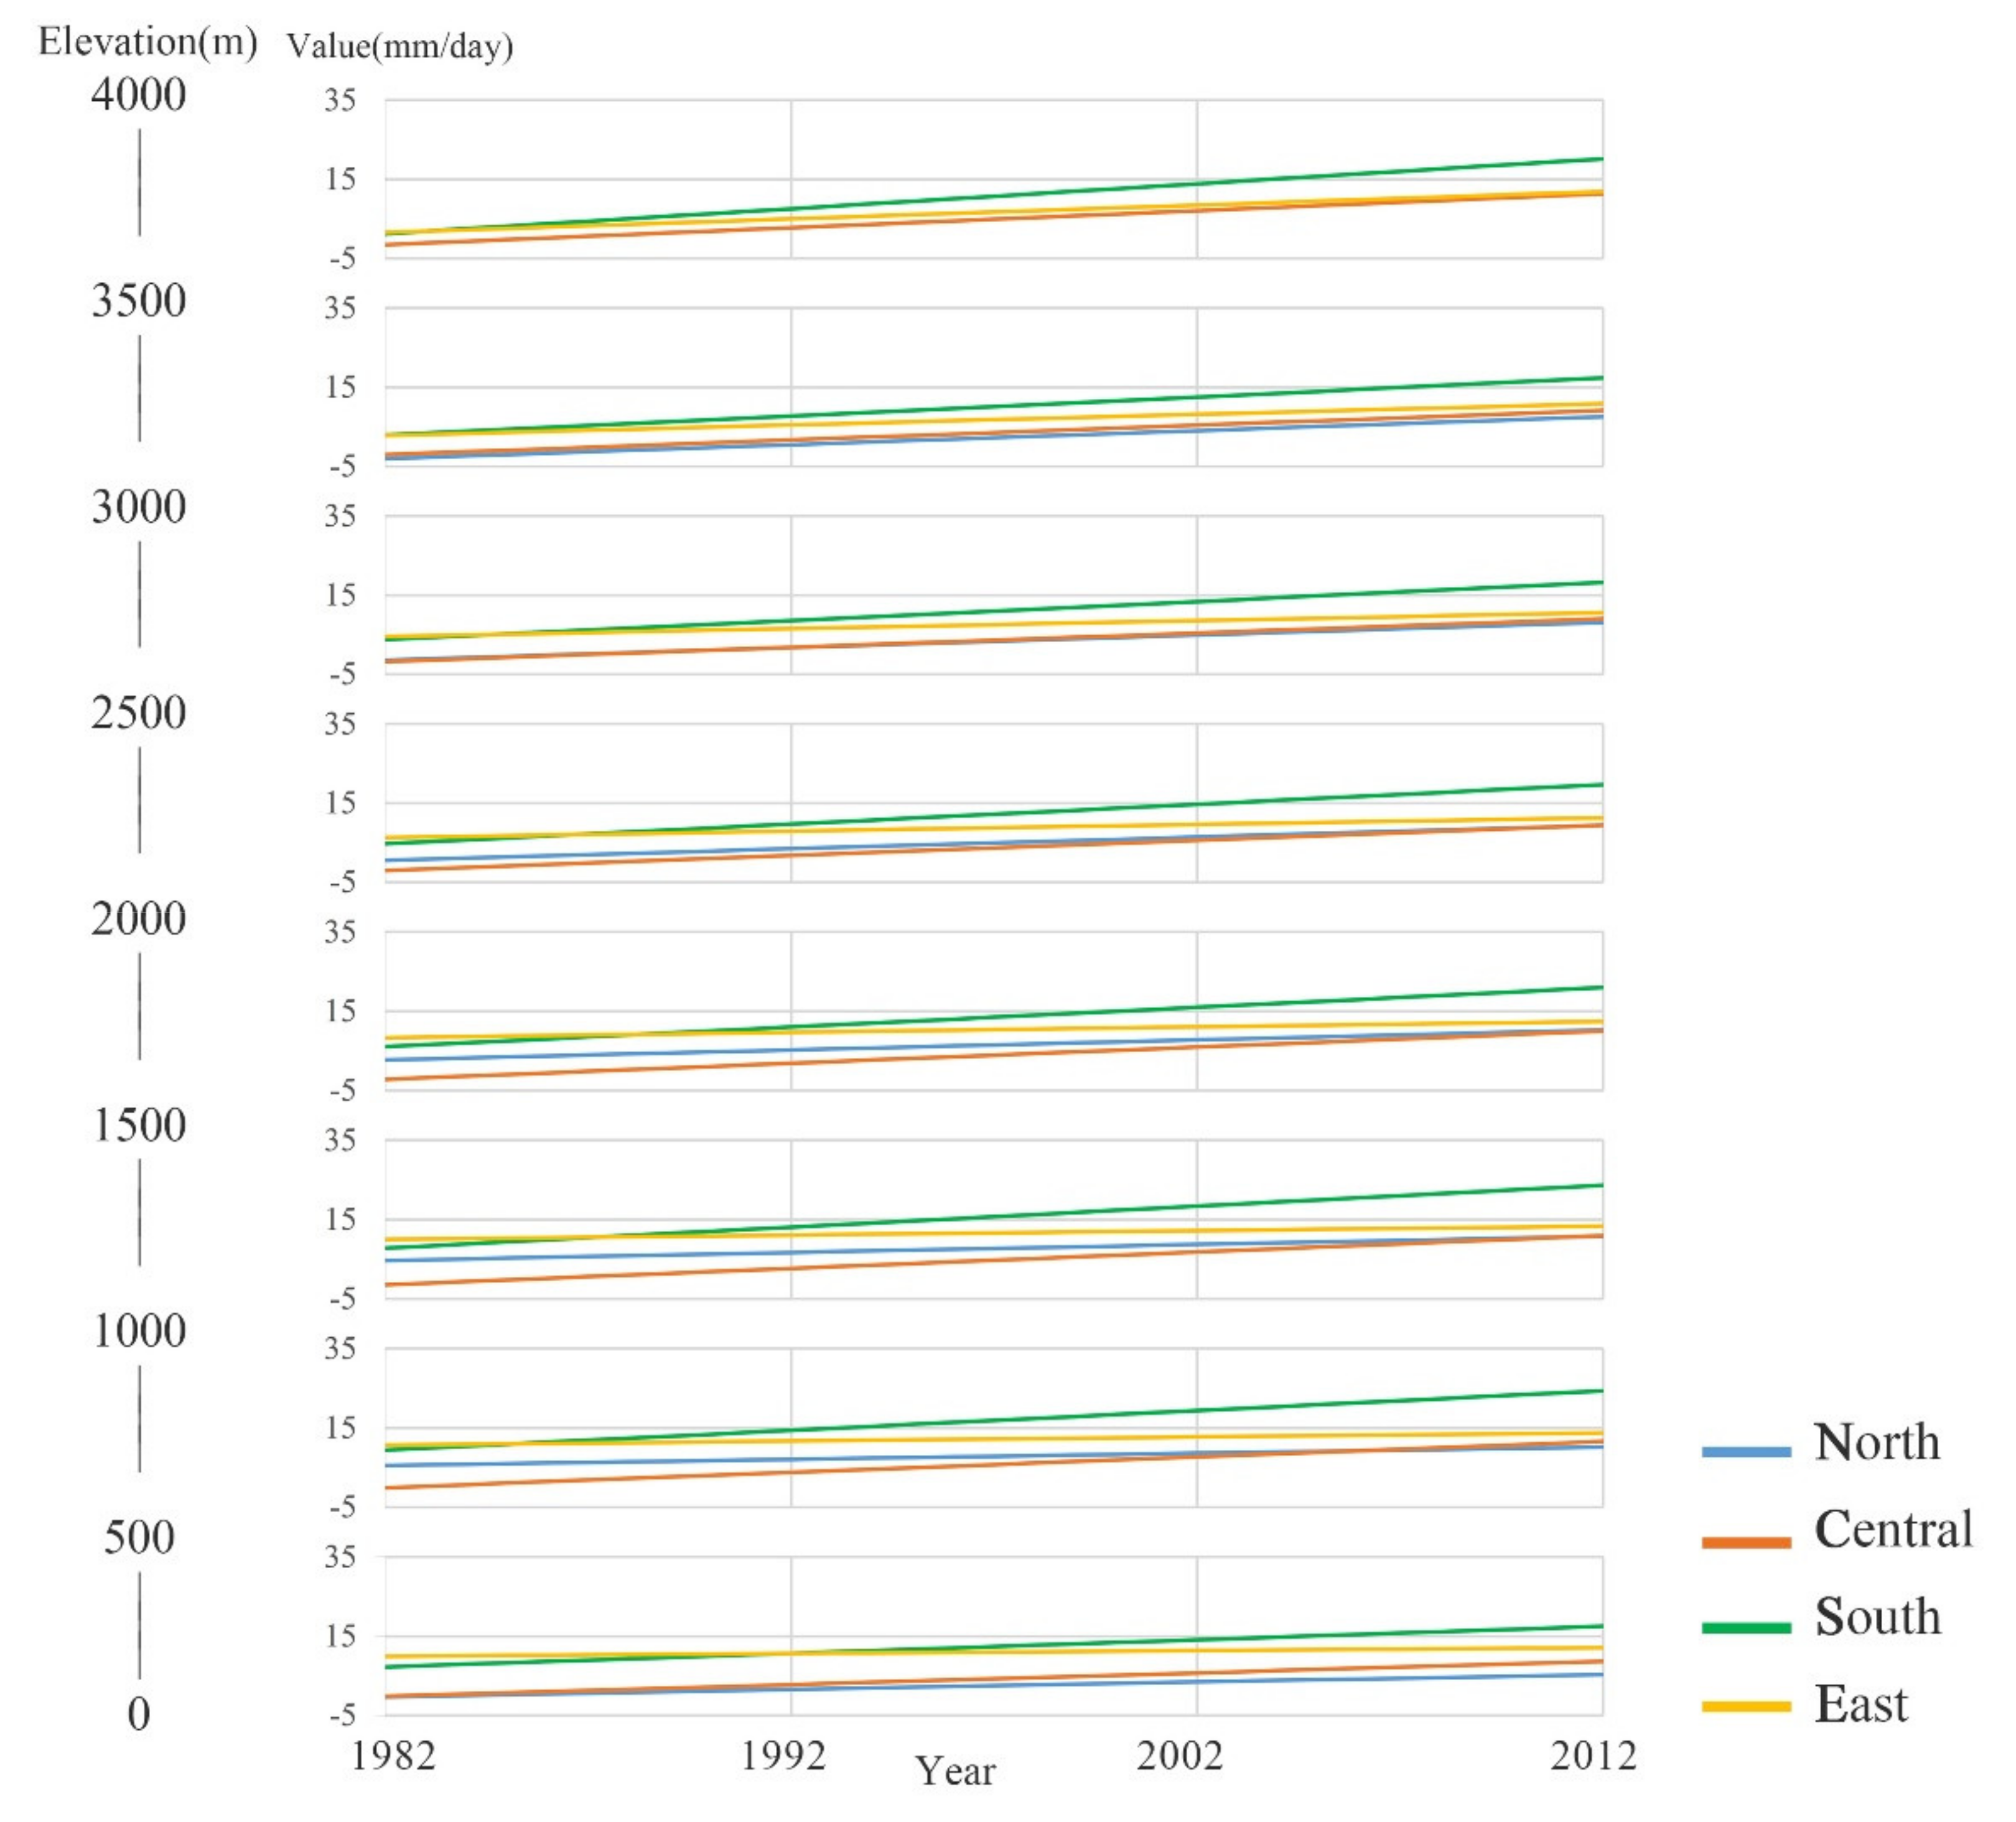
As shown in Figure 10, summer rainfall increased in most regions—especially in the southern and central regions—which is consistent with the findings of increasing extreme rainfall over much of Taiwan during typhoon season [58]. For the areas of the northern region below 1000 m altitude, a negative trend of spring rainfall was observed, requiring further investigation of possible associations with La Niña events and the PDO (Pacific decadal oscillation) [84,90]. The spring and winter rainfall patterns were negative in the higher altitude (1000 to 3500 m) areas, while summer and fall patterns were positive. As an increasing trend of extreme rainfall has been noted in spring and winter by Henny et al. (2021) [58], there is a need to pay attention to the variation between elevations.
Similar rainfall patterns were found for the central and southern regions; again, there were negative trends in spring and winter and positive trends in summer and fall. The positive trends in summer and fall rainfall were in accordance with the consistent increase in extreme rainfall discovered in the typhoon season [58]. Based on another long-term study by Shiu et al. (2009) [65], a reduction in light precipitation (<4 mm h−1) and an increase in heavy precipitation (>10 mm h−1) may also contribute to the observed rainfall seasonal pattern.
For the eastern region, only areas below 1500 m had a negative spring rainfall trend; however, summer, fall, and winter all showed positive trends. In addition, the highest winter rainfall was observed in the northern region, and the highest summer rainfall was found in the central/southern regions, which experienced northeast and southwest monsoons during winter and summer.
The average temperature reached its peak in summer, and then descended through fall, spring, and winter (Figure 11). Both the northern and central regions showed an increase in average temperature at altitudes below 500 m for all seasons. At the 500–1000 m altitude, the average winter temperature pattern was positive, while the average spring, summer, and fall temperature patterns were negative. Areas above 1000 m and 1500 m in the northern and central regions, respectively, showed negative patterns for all seasons; however, in the winter, an opposite trend was found at 1000–1500 m. The average temperature trend was negative in the north but positive in the central region. At the same altitude, spring, summer, and fall all showed decreasing average temperature trends. The average temperature in the southern region was found to be positive in all seasons except summer at elevations below 500 m.
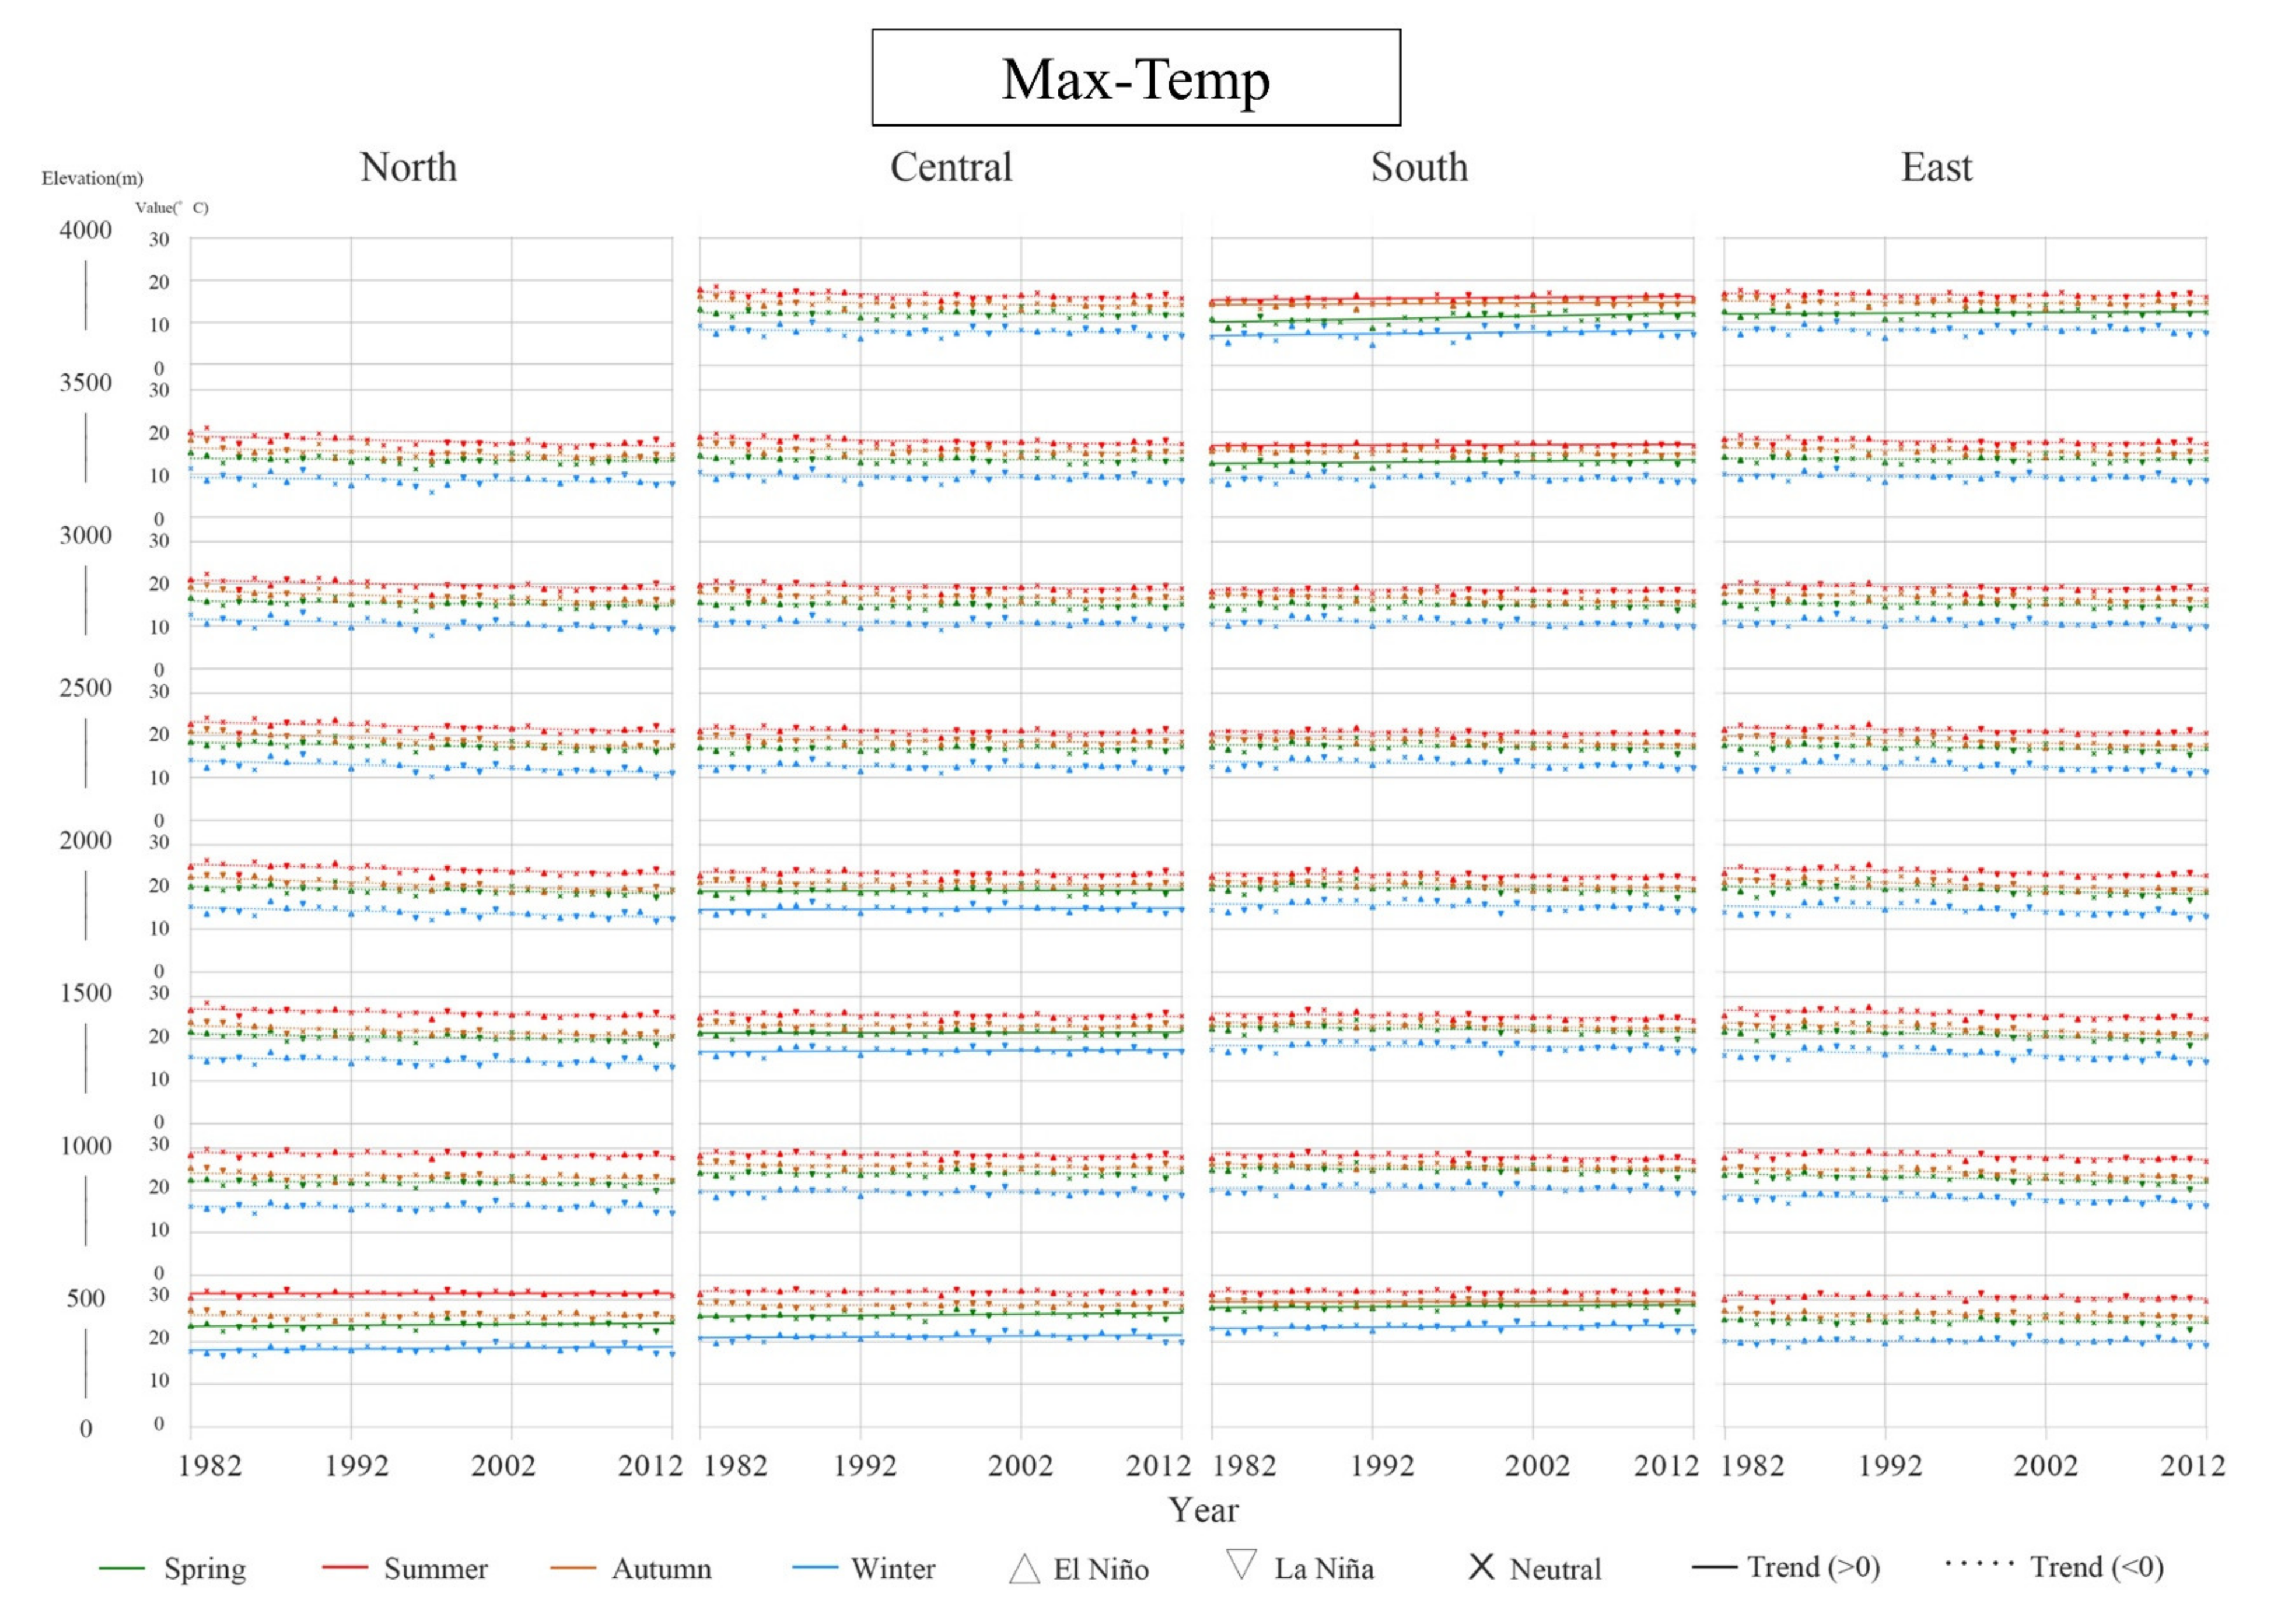
Nevertheless, at the elevation of 500–1000 m, winter was the only season showing a positive trend. Decreased average temperatures were found at altitudes of 1000–4000 m. The eastern region’s increased average temperature was only observed in spring, fall, and winter at the lower elevations (below 500 m). On the other hand, altitudes above 500 m in the eastern region had decreased average temperature in all seasons. The linear trend of the maximum temperature in different seasons is shown in Figure 12. A negative trend was found in the fall at lower elevations (below 500 m); other than that, the maximum temperature decreased in all seasons at all elevations. In the central region, spring and winter showed increasing maximum temperatures at elevations below 500 m and between 1000 and 2000 m; other than that, decreased maximum temperatures were observed year-round in the central region. However, the southern region had a more complex pattern: at the lower altitudes (below 500 m), the maximum temperature trend was positive in spring, autumn, and winter.
On the other hand, a negative trend took control at altitudes of 500–3000 m for all seasons. At altitudes of 3000–3500 m, trends were positive in spring and summer, but negative in fall and winter. Areas at the highest elevation (3500–4000 m) were all positive. For the eastern region, negative trends were found from 0 to 3500 m; conversely, there was a positive spring trend and a negative trend in the other three seasons at altitudes of 3500–4000 m. As shown in Figure 13, the minimum temperature in the north was positive in all seasons at the altitudes of 0–500 m and 1000–2500 m; however, at elevations of 500–1000 m, the minimum temperature decreased in spring, but increased in fall and winter. Additionally, as the elevation rose to 2500–3500 m, the minimum temperature decreased in spring and winter, but increased in summer and fall. Thus, an overall positive minimum temperature trend was found in the central, southern, and eastern regions.
Overall, large variations in rainfall and temperature were found in different regions, elevations, and seasons. Thus, a comprehensive understanding of the spatial and temporal variations is challenging. Based on many valuable previous works, the association between the ENSO and rainfall in Taiwan is strong and complex [84,91]. As the ENSO affects an abnormal lower tropospheric anticyclonic circulation around the Philippine Sea in the El Niño phase, altering the East Asian subtropical front would influence rainfall in the meiyu season [92]. Jiang et al. (2003) [84] studied 50 years of daily rainfall station data in Taiwan to examine the relationship between spring rainfall and the ENSO; the authors found that a weak mid-latitude frontal system in the East China coastal area and an anomalous anticyclone over the Philippine Sea area may correspond to Taiwan’s heavy spring rainfall events. Lin et al. (2015) [91] further investigated two types of ENSO (canonical ENSO and ENSO Modoki) in detail, and evaluated their effects on rainfall; they concluded that during canonical El Niño episodes, the rainfall increases in winter and spring but decreases in summer and fall; however, in El Niño Modoki episodes, the rainfall pattern shows the opposite response. Meanwhile, during two types of La Niña episodes, only fall rainfall increases. The effects of the Central Mountain Range (CMR), monsoons, and topography in Taiwan should also be considered.
Therefore, we adopted the definitions of the dry and wet seasons from two previous studies [93,94] in order to investigate how the dry (spring and winter) and wet (summer and fall) seasons had changed in terms of the amount of rainfall across Taiwan over the three-decade study period. As shown in Figure 14, the differences in the amounts of rainfall between the dry and wet seasons revealed increasing discrepancies over time across Taiwan, indicating that the difference in rainfall between the dry and wet seasons was becoming larger. Furthermore, the largest difference was found in the southern region, while the smallest was found in the north, revealing an unbalanced potential water resource issue in Taiwan.

3.5. Correlation and Serial Autocorrelation Analysis of NDVI and Climatic Factors

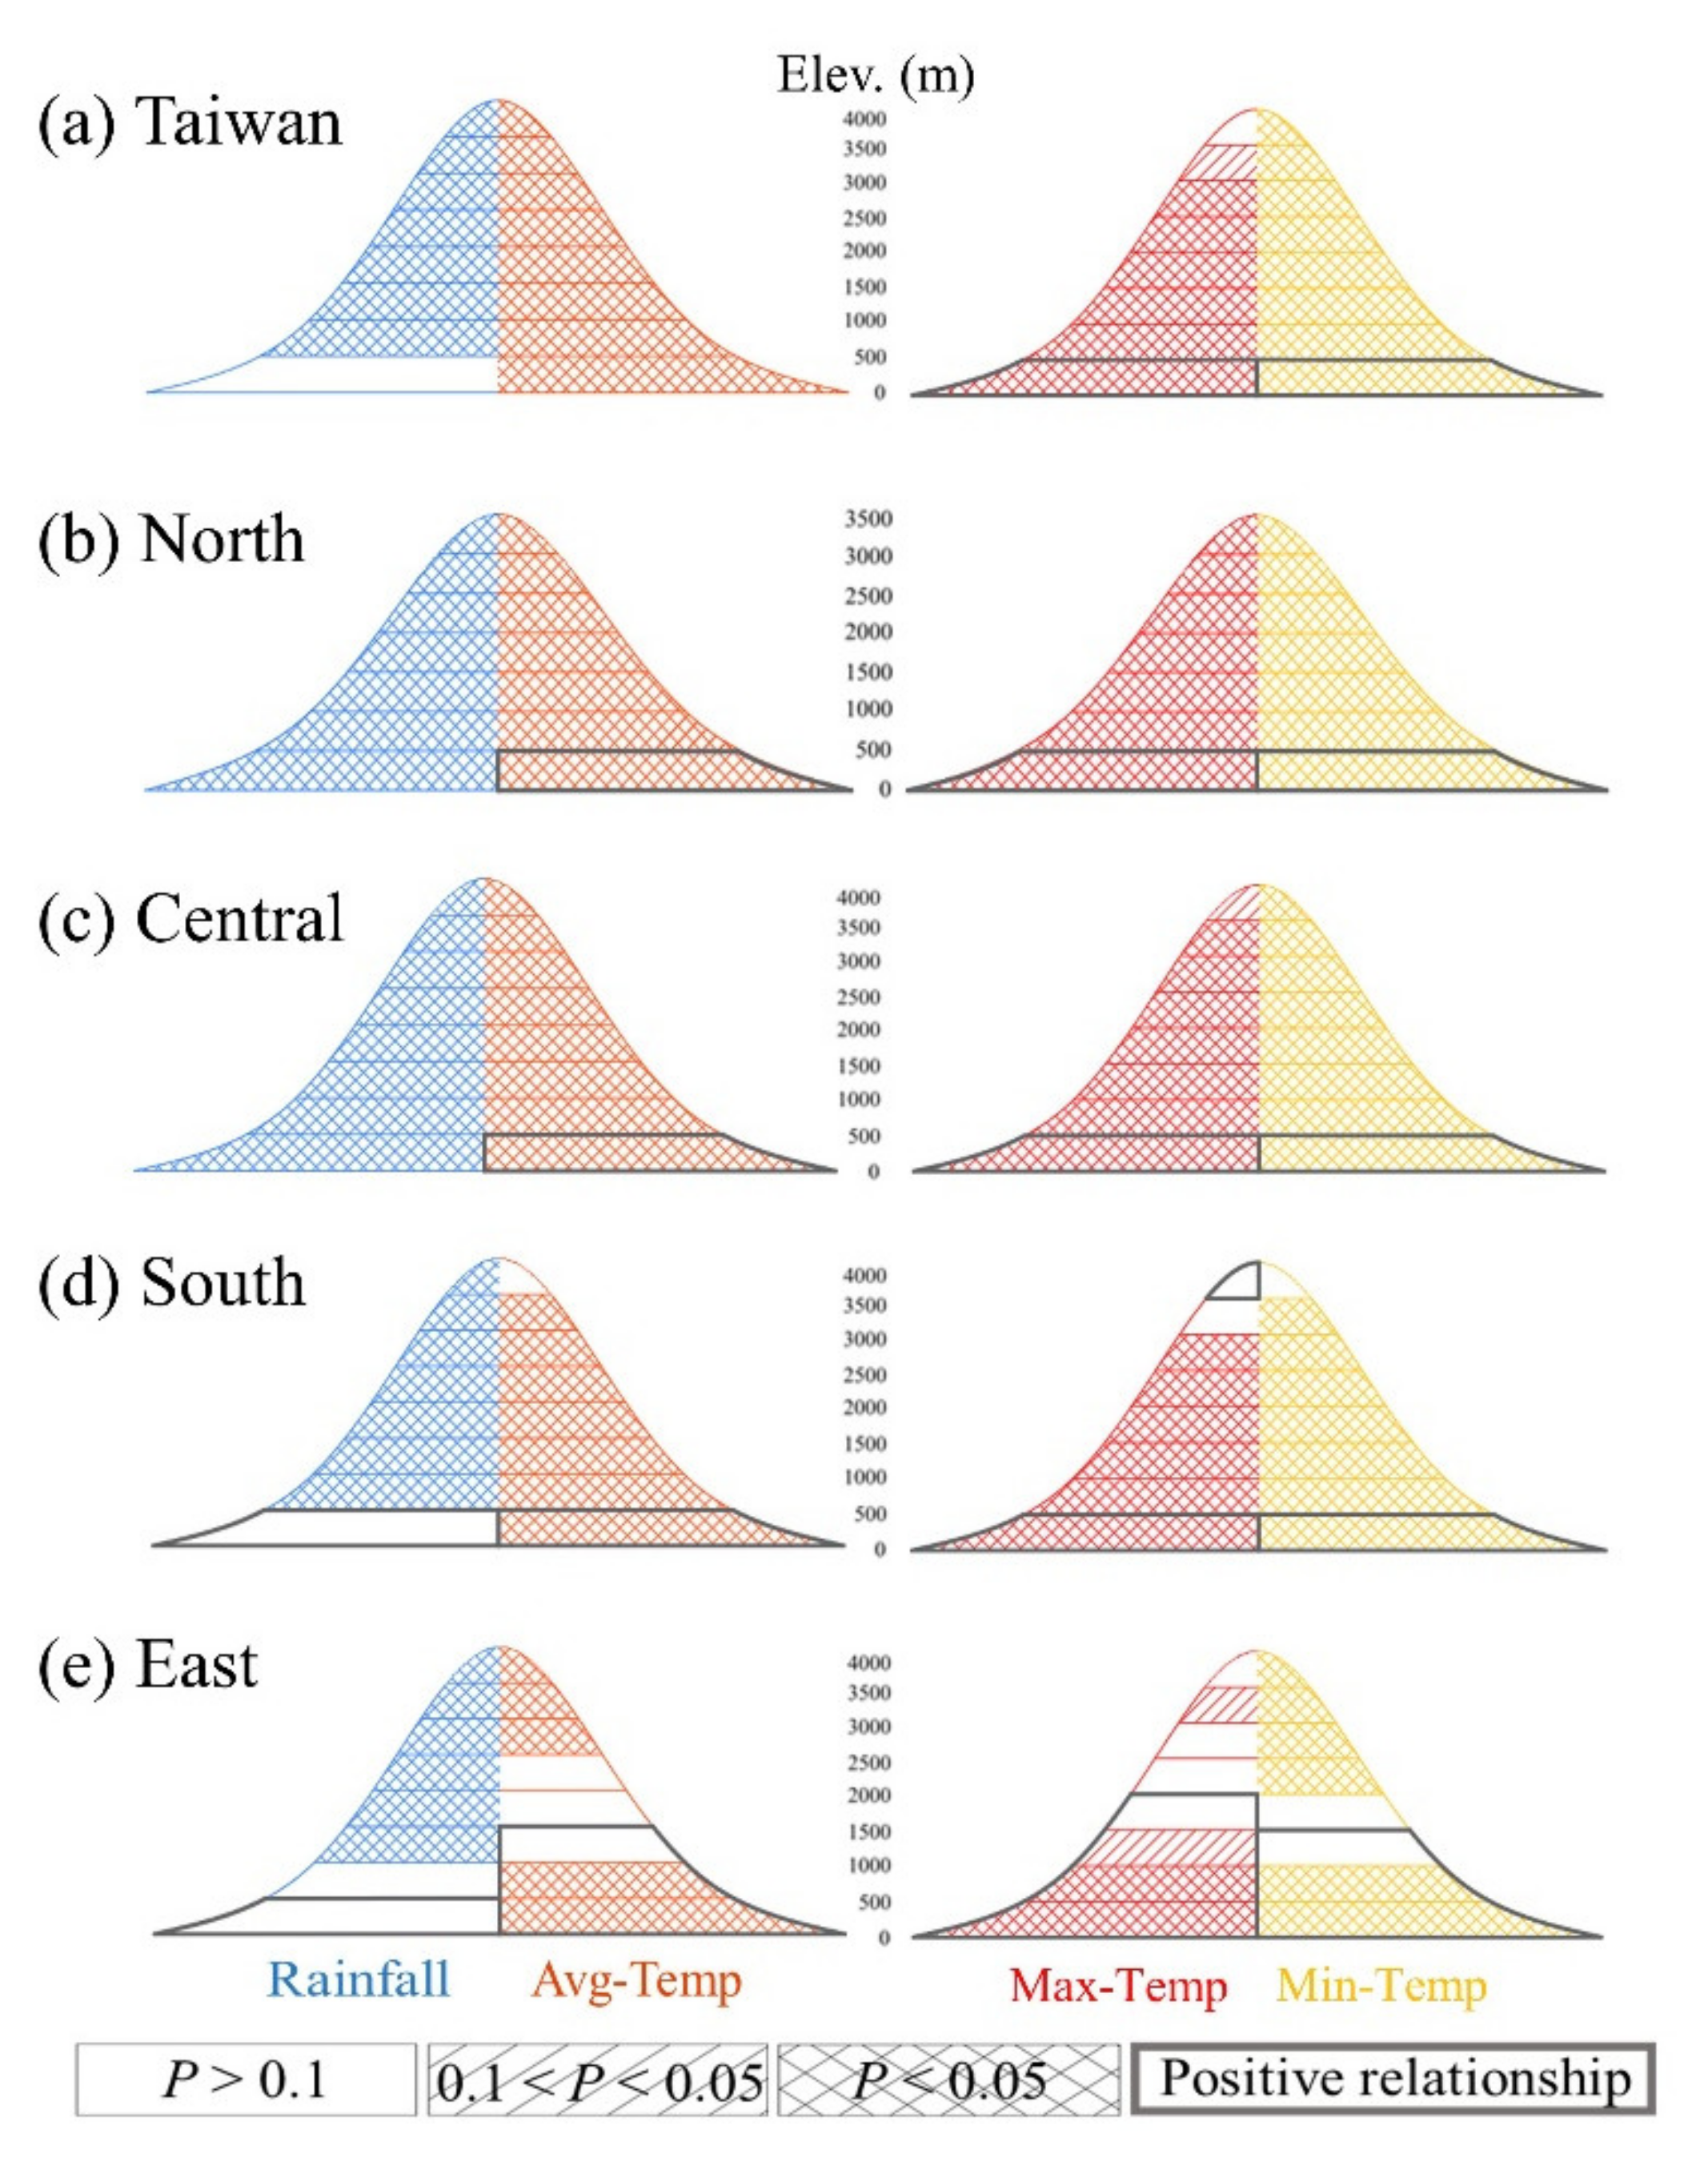
In this study, Pearson’s correlation coefficient was used to analyze the correlation between NDVI and climatic factors at all altitudes in Taiwan; the results are shown in Figure 15a. Most of Taiwan’s NDVI and climatic factors had a significant negative correlation (p < 0.05). The only positive relationship was found between maximum and minimum temperatures at low altitudes below 500 m. At altitudes above 3000 m, the negative effect of the maximum temperature on NDVI gradually reduced. For rainfall, insignificant relationships were found at altitudes below 500 m.
The regional variation results are shown in Figure 15b–e; again, the northern and central regions had similar responses, while the south and east displayed different feedback. For the northern and central regions, four climatic factors showed significant effects on NDVI. Most of the effects were negative, except for temperatures at the lower altitudes (below 500 m), which were positive.
On the other hand, rainfall slightly affected NDVI in the southern and eastern regions at elevations below 500 m. For the southern region, the significant correlation level of temperatures decreased when the elevation increased. The correlation level of temperature decreased in the mid-latitude area (1000–3000 m). However, the positive effects of temperatures extended to altitudes up to 2500 m. Notably, the eastern region displayed more diverse responses, attributed to its broader spatial coverage across latitudes. However, a potential lag correlation may need further investigation at a later date.
Figure 16 illustrates the outcome of the Durbin–Watson test. As shown in Figure 16a, the NDVI residual component revealed no significant autocorrelation. However, for the majority of the temperature datasets, significant positive autocorrelation was observed (Figure 16b–d). On the other hand, the residual rainfall component displayed significant negative autocorrelation across Taiwan (Figure 16e). The presence of significant autocorrelation indicates that the residual components were not independent of one another. However, autocorrelation in the residual components was expected, as the h parameter in the BFAST algorithm restrains the level of detail within the linear segments. Therefore, potential variations may exist over shorter periods than the trend segment length permitted by the h parameter values used [44].

4. Conclusions

This study is the first comprehensive assessment evaluating Taiwan’s vegetation and climate factors for associated long-term trends and breakpoints from a vertical perspective. Based on the overall, regional, and seasonal perspectives, our major findings are summarized as follows:
  • The overall NDVI trend in Taiwan starts with an increasing pattern, and then follows two downward trends until 2000, followed by a gentle increase. Among climate factors, only the minimum temperature has one breakpoint, found in the late 1990s;
  • Based on the vertical investigation, the trends and breakpoints of NDVI across Taiwan are highly consistent, with three breakpoints for the altitudes below 3500 m (1989, 1994, and 2000) and two breakpoints above 3500 m (1989 and 1994). Rainfall gradually increases, with no breakpoints. Average and maximum temperature have similar trends, while minimum temperature shows variations—especially at higher altitudes.
  • Regarding the occurrence of breakpoints for regional assessment, the northern region displays a stable situation, while the central region shows higher variations. Higher elevations show larger variations in the NDVI and temperature datasets. NDVI, average temperature, and minimum temperature reveal their largest changes earlier in higher altitude areas. Specifically, the increasing minimum temperature direction is more prominent in the mid-to-high-altitude areas of the eastern and central regions;
  • The incidence of La Niña events is larger than that of El Niño events for the whole study period, and especially after 2000;
  • Seasonal variations are observed for each region. However, the difference between the dry and wet seasons is getting larger, with the smallest difference in the northern region and the largest difference in the southern region;
  • Taiwan’s NDVI and climatic factors have a significant negative correlation (p < 0.05), but the maximum and minimum temperatures have significant positive effects at altitudes below 500 m. The northern and central regions reveal similar responses, while the south and east display different feedbacks.
Our study’s results illustrate the vertical differences in climate change evidence in Taiwan, improving our overall understanding of vegetation and climatic dynamics over long periods across different regions and altitudes. Our results have potential applications in supporting ecological management and climate adaptation strategies in Taiwan to meet future climate change challenges.

Supplementary Materials

The following are available online at https://www.mdpi.com/article/10.3390/rs13224707/s1, Figure S1: Regional BFAST results for NDVI at varied elevations, Figure S2: Regional BFAST results for rainfall at varied elevations, Figure S3: Regional BFAST results for the average temperature at varied elevations, Figure S4: Regional BFAST results for the maximum temperature at varied elevations, Figure S5: Regional BFAST results for the minimum temperature at varied elevations.

Author Contributions

Conceptualization, H.P.T.; methodology, H.P.T.; software, H.P.T., G.-G.W. and Z.-H.Z.; validation, H.P.T., G.-G.W. and Z.-H.Z.; formal analysis, H.P.T.; investigation, H.P.T., G.-G.W. and Z.-H.Z.; resources, H.P.T.; data curation, H.P.T. and G.-G.W.; writing—original draft preparation, H.P.T. and G.-G.W.; writing—review and editing, H.P.T.; visualization, H.P.T., G.-G.W. and Z.-H.Z.; supervision, H.P.T.; project administration, H.P.T.; funding acquisition, H.P.T. All authors have read and agreed to the published version of the manuscript.

Funding

This research was funded by the Taiwan Ministry of Science and Technology, grant number MOST 107-2119-M-005-008-MY2, MOST 109-2121-M-005-002, MOST 109-2119-M-005-003, MOST 110-2121-M-005-001, MOST 110-2321-B-005-003, and MOST 110-2321-B-492-001.

Institutional Review Board Statement

Not applicable.

Informed Consent Statement

Not applicable.

Acknowledgments

The authors would like to thank the Taiwan Ministry of Science and Technology for the financial support of this research. Additionally, this research was partially supported by Pervasive AI Research (PAIR) Labs, Taiwan, and the “Innovation and Development Center of Sustainable Agriculture” from the Featured Areas Research Center Program within the framework of the Higher Education Sprout Project by the Ministry of Education (MOE) in Taiwan.

Conflicts of Interest

The authors declare no conflict of interest. The sponsors had no role in the design of the study, in the collection, analyses, or interpretation of data, in the writing of the manuscript, and in the decision to publish the results.

References

  1. Jacquin, A.; Sheeren, D.; Lacombe, J.P. Vegetation cover degradation assessment in Madagascar savanna based on trend analysis of MODIS NDVI time series. Int. J. Appl. Earth Obs. Geoinf. 2010, 12, S3–S10. [Google Scholar] [CrossRef] [Green Version]
  2. Pan, N.; Feng, X.; Fu, B.; Wang, S.; Ji, F.; Pan, S. Increasing global vegetation browning hidden in overall vegetation greening: Insights from time-varying trends. Remote Sens. Environ. 2018, 214, 59–72. [Google Scholar] [CrossRef]
  3. Setiawan, Y.; Yoshino, K.; Prasetyo, L.B. Characterizing the dynamics change of vegetation cover on tropical forestlands using 250 m multi-temporal MODIS EVI. Int. J. Appl. Earth Obs. Geoinf. 2014, 26, 132–144. [Google Scholar] [CrossRef]
  4. Tong, X.; Tian, F.; Brandt, M.; Liu, Y.; Zhang, W.; Fensholt, R. Trends of land surface phenology derived from passive microwave and optical remote sensing systems and associated drivers across the dry tropics 1992–2012. Remote Sens. Environ. 2019, 232, 111307. [Google Scholar] [CrossRef]
  5. Corlett, R.T. Impacts of warming on tropical lowland rainforests. Trends Ecol. Evol. 2011, 26, 606–613. [Google Scholar] [CrossRef] [PubMed]
  6. Fu, Y.; He, H.S.; Zhao, J.; Larsen, D.R.; Zhang, H.; Sunde, M.G.; Duan, S. Climate and spring phenology effects on autumn phenology in the Greater Khingan Mountains, Northeastern China. Remote Sens. 2018, 10, 449. [Google Scholar] [CrossRef] [Green Version]
  7. Zhang, A.; Jia, G.; Ustin, S.L. Water availability surpasses warmth in controlling global vegetation trends in recent decade: Revealed by satellite time series. Environ. Res. Lett. 2021, 16, 074028. [Google Scholar] [CrossRef]
  8. Lin, H.Y.; Li, C.F.; Chen, T.Y.; Hsieh, C.F.; Wang, G.; Wang, T.; Hu, J.M. Climate-based approach for modeling the distribution of montane forest vegetation in Taiwan. Appl. Veg. Sci. 2020, 23, 239–253. [Google Scholar] [CrossRef]
  9. Ouyang, W.; Wan, X.; Xu, Y.; Wang, X.; Lin, C. Vertical difference of climate change impacts on vegetation at temporal-spatial scales in the upper stream of the Mekong River Basin. Sci. Total Environ. 2020, 701, 134782. [Google Scholar] [CrossRef] [PubMed]
  10. Xu, S.; Yu, Z.; Lettenmaier, D.P.; McVicar, T.R.; Ji, X. Elevation-dependent response of vegetation dynamics to climate change in a cold mountainous region. Environ. Res. Lett. 2020, 15, 094005. [Google Scholar] [CrossRef]
  11. Li, W.; Tan, M. Influences of vertical differences in population emigration on mountainous vegetation greenness: A case study in the Taihang Mountains. Sci. Rep. 2018, 8, 16954. [Google Scholar] [CrossRef]
  12. Wei, H.; Zhao, X.; Liang, S.; Zhou, T.; Wu, D.; Tang, B. Effects of warming hiatuses on vegetation growth in the Northern Hemisphere. Remote Sens. 2018, 10, 683. [Google Scholar] [CrossRef] [Green Version]
  13. Los, S.O.; Street-Perrott, F.A.; Loader, N.J.; Froyd, C.A. Detection of signals linked to climate change, land-cover change and climate oscillators in Tropical Montane Cloud Forests. Remote Sens. Environ. 2021, 260, 112431. [Google Scholar] [CrossRef]
  14. Schulz, H.M.; Li, C.; Thies, B.; Chang, S.; Bendix, J. Mapping the montane cloud forest of Taiwan using 12 year MODIS-derived ground fog frequency data. PLoS ONE 2017, 12, e0172663. [Google Scholar] [CrossRef]
  15. Chang, C.T.; Wang, H.C.; Huang, C.Y. Retrieving multi-scale climatic variations from high dimensional time-series MODIS green vegetation cover in a tropical/subtropical mountainous island. J. Mt. Sci. 2014, 11, 407–420. [Google Scholar] [CrossRef]
  16. Jump, A.S.; Huang, T.J.; Chou, C.H. Rapid altitudinal migration of mountain plants in Taiwan and its implications for high altitude biodiversity. Ecography 2012, 35, 204–210. [Google Scholar] [CrossRef]
  17. Chang, C.T.; Wang, H.C.; Huang, C.Y. Impacts of vegetation onset time on the net primary productivity in a mountainous island in Pacific Asia. Environ. Res. Lett. 2013, 8, 045030. [Google Scholar] [CrossRef] [Green Version]
  18. Krishnaswamy, J.; John, R.; Joseph, S. Consistent response of vegetation dynamics to recent climate change in tropical mountain regions. Glob. Change Biol. 2014, 20, 203–215. [Google Scholar] [CrossRef]
  19. Chen, B.; Xu, G.; Coops, N.C.; Ciais, P.; Innes, J.L.; Wang, G.; Myneni, R.B.; Wang, T.; Krzyzanowski, J.; Li, Q. Changes in vegetation photosynthetic activity trends across the Asia–Pacific region over the last three decades. Remote Sens. Environ. 2014, 144, 28–41. [Google Scholar] [CrossRef]
  20. Tsai, H.P.; Yang, M.D. Relating vegetation dynamics to climate variables in Taiwan using 1982–2012 NDVI3g data. IEEE J. Sel. Top. Appl. Earth Obs. Remote Sens. 2016, 9, 1624–1639. [Google Scholar] [CrossRef]
  21. Hsu, H.-H.; Chou, C.; Wu, Y.-C.; Lu, M.-M.; Chen, C.-T.; Chen, Y.-M. Climate Change in Taiwan: Scientific Report 2011 (Summary); National Science Council: Taipei, Taiwan, 2011; p. 67. [Google Scholar]
  22. Yang, M.D.; Chen, S.C.; Tsai, H.P. A long-term vegetation recovery estimation for Mt. Jou-Jou using multi-date SPOT 1, 2, and 4 images. Remote Sens. 2017, 9, 893. [Google Scholar] [CrossRef] [Green Version]
  23. Dile, Y.T.; Ayana, E.K.; Worqlul, A.W.; Xie, H.; Srinivasan, R.; Lefore, N.; You, L.; Clarke, N. Evaluating satellite-based evapotranspiration estimates for hydrological applications in data-scarce regions: A case in Ethiopia. Sci. Total Environ. 2020, 743, 140702. [Google Scholar] [CrossRef] [PubMed]
  24. Yang, Y.; Wang, S.; Bai, X.; Tan, Q.; Li, Q.; Wu, L.; Tian, S.; Hu, Z.; Li, C.; Deng, Y. Factors affecting long-term trends in global NDVI. Forests 2019, 10, 372. [Google Scholar] [CrossRef] [Green Version]
  25. Brehaut, L.; Danby, R.K. Inconsistent relationships between annual tree ring-widths and satellite-measured NDVI in a mountainous subarctic environment. Ecol. Indic. 2018, 91, 698–711. [Google Scholar] [CrossRef]
  26. Wang, S.; Wang, X.; Chen, G.; Yang, Q.; Wang, B.; Ma, Y.; Shen, M. Complex responses of spring alpine vegetation phenology to snow cover dynamics over the Tibetan Plateau, China. Sci. Total Environ. 2017, 593, 449–461. [Google Scholar] [CrossRef]
  27. Tsai, H.P.; Lin, Y.H.; Yang, M.D. Exploring long term spatial vegetation trends in Taiwan from AVHRR NDVI3g dataset using RDA and HCA analyses. Remote Sens. 2016, 8, 290. [Google Scholar] [CrossRef] [Green Version]
  28. Zhang, Y.; Gao, J.; Liu, L.; Wang, Z.; Ding, M.; Yang, X. NDVI-based vegetation changes and their responses to climate change from 1982 to 2011: A case study in the Koshi River Basin in the middle Himalayas. Glob. Planet. Chang. 2013, 108, 139–148. [Google Scholar] [CrossRef]
  29. Vrieling, A.; De Leeuw, J.; Said, M.Y. Length of growing period over Africa: Variability and trends from 30 years of NDVI time series. Remote Sens. 2013, 5, 982–1000. [Google Scholar] [CrossRef] [Green Version]
  30. Kennedy, R.E.; Yang, Z.; Gorelick, N.; Braaten, J.; Cavalcante, L.; Cohen, W.B.; Healey, S. Implementation of the LandTrendr algorithm on google earth engine. Remote Sens. 2018, 10, 691. [Google Scholar] [CrossRef] [Green Version]
  31. Peng, J.; Liu, Z.; Liu, Y.; Wu, J.; Han, Y. Trend analysis of vegetation dynamics in Qinghai–Tibet Plateau using Hurst Exponent. Ecol. Indic. 2012, 14, 28–39. [Google Scholar] [CrossRef]
  32. Jamali, S.; Jönsson, P.; Eklundh, L.; Ardö, J.; Seaquist, J. Detecting changes in vegetation trends using time series segmentation. Remote Sens. Environ. 2015, 156, 182–195. [Google Scholar] [CrossRef]
  33. Eklundh, L.; Jönsson, P. TIMESAT for processing time-series data from satellite sensors for land surface monitoring. In Multitemporal Remote Sensing; Springer: Cham, Switzerland, 2016. [Google Scholar] [CrossRef]
  34. Verbesselt, J.; Hyndman, R.; Newnham, G.; Culvenor, D. Detecting trend and seasonal changes in satellite image time series. Remote Sens. Environ. 2010, 114, 106–115. [Google Scholar] [CrossRef]
  35. Mugiraneza, T.; Nascetti, A.; Ban, Y. Continuous monitoring of urban land cover change trajectories with landsat time series and landtrendr-google earth engine cloud computing. Remote Sens. 2020, 12, 2883. [Google Scholar] [CrossRef]
  36. Zhang, M.; Lin, H.; Long, X.; Cai, Y. Analyzing the spatiotemporal pattern and driving factors of wetland vegetation changes using 2000–2019 time-series Landsat data. Sci. Total Environ. 2021, 780, 146615. [Google Scholar] [CrossRef]
  37. Alibakhshi, S.; Hovi, A.; Rautiainen, M. Temporal dynamics of albedo and climate in the sparse forests of Zagros. Sci. Total Environ. 2019, 663, 596–609. [Google Scholar] [CrossRef] [PubMed]
  38. Wang, Y.; Liu, G.; Guo, E. Spatial distribution and temporal variation of drought in Inner Mongolia during 1901–2014 using Standardized Precipitation Evapotranspiration Index. Sci. Total Environ. 2019, 654, 850–862. [Google Scholar] [CrossRef] [PubMed]
  39. Zhou, Y.; Zhang, L.; Xiao, J.; Williams, C.A.; Vitkovskaya, I.; Bao, A. Spatiotemporal transition of institutional and socioeconomic impacts on vegetation productivity in Central Asia over last three decades. Sci. Total Environ. 2019, 658, 922–935. [Google Scholar] [CrossRef]
  40. Wen, Z.; Wu, S.; Chen, J.; Lü, M. NDVI indicated long-term interannual changes in vegetation activities and their responses to climatic and anthropogenic factors in the Three Gorges Reservoir Region, China. Sci. Total Environ. 2017, 574, 947–959. [Google Scholar] [CrossRef] [PubMed]
  41. De Jong, R.; Verbesselt, J.; Schaepman, M.E.; De Bruin, S. Trend changes in global greening and browning: Contribution of short-term trends to longer-term change. Glob. Change Biol. 2012, 18, 642–655. [Google Scholar] [CrossRef]
  42. Verbesselt, J.; Zeileis, A.; Herold, M. Near real-time disturbance detection using satellite image time series. Remote Sens. Environ. 2012, 123, 98–108. [Google Scholar] [CrossRef]
  43. Saatchi, S.; Asefi-Najafabady, S.; Malhi, Y.; Aragão, L.E.; Anderson, L.O.; Myneni, R.B.; Nemani, R. Persistent effects of a severe drought on Amazonian forest canopy. Proc. Natl. Acad. Sci. USA 2013, 110, 565–570. [Google Scholar] [CrossRef] [Green Version]
  44. Watts, L.M.; Laffan, S.W. Effectiveness of the BFAST algorithm for detecting vegetation response patterns in a semi-arid region. Remote Sens. Environ. 2014, 154, 234–245. [Google Scholar] [CrossRef]
  45. Fensholt, R.; Proud, S.R. Evaluation of earth observation based global long term vegetation trends—Comparing GIMMS and MODIS global NDVI time series. Remote Sens. Environ. 2012, 119, 131–147. [Google Scholar] [CrossRef]
  46. Li, P.; Peng, C.; Wang, M.; Luo, Y.; Li, M.; Zhang, K.; Zhang, D.; Zhu, Q. Dynamics of vegetation autumn phenology and its response to multiple environmental factors from 1982 to 2012 on Qinghai-Tibetan Plateau in China. Sci. Total Environ. 2018, 637, 855–864. [Google Scholar] [CrossRef]
  47. Huete, A.; Didan, K.; Miura, T.; Rodriguez, E.P.; Gao, X.; Ferreira, L.G. Overview of the radiometric and biophysical performance of the MODIS vegetation indices. Remote Sens. Environ. 2002, 83, 195–213. [Google Scholar] [CrossRef]
  48. Pinzon, J.E.; Tucker, C.J. A non-stationary 1981–2012 AVHRR NDVI3g time series. Remote Sens. 2014, 6, 6929–6960. [Google Scholar] [CrossRef] [Green Version]
  49. Bégué, A.; Vintrou, E.; Ruelland, D.; Claden, M.; Dessay, N. Can a 25-year trend in Soudano-Sahelian vegetation dynamics be interpreted in terms of land use change? A remote sensing approach. Glob. Environ. Change 2011, 21, 413–420. [Google Scholar] [CrossRef]
  50. Barbosa, H.A.; Huete, A.R.; Baethgen, W.E. A 20-year study of NDVI variability over the Northeast Region of Brazil. J. Arid Environ. 2006, 67, 288–307. [Google Scholar] [CrossRef]
  51. Anyamba, A.; Eastman, J.R. Interannual variability of NDVI over Africa and its relation to El Niño/Southern Oscillation. Remote Sens. 1996, 17, 2533–2548. [Google Scholar] [CrossRef]
  52. Rouse, J.W., Jr.; Haas, R.H.; Schell, J.A.; Deering, D.W. Monitoring vegetation systems in the Great Plains with ERTS. In NASA. Goddard Space Flight Center 3d ERTS-1 Symphony; NASA: Washington, DC, USA, 1974; pp. 309–317. [Google Scholar]
  53. Rolim, L.Z.R.; de Souza Filho, F.D.A. Shift detection in hydrological regimes and pluriannual low-frequency streamflow forecasting using the hidden markov model. Water 2020, 12, 2058. [Google Scholar] [CrossRef]
  54. Xue, C.; Wu, H.; Jiang, X. Temporal and spatial change monitoring of drought grade based on ERA5 analysis data and BFAST method in the belt and road area during 1989–2017. Adv. Meteorol. 2019, 2019, 4053718. [Google Scholar] [CrossRef]
  55. Pearson, K. Mathematical contributions to the theory of evolution—On a form of spurious correlation which may arise when indices are used in the measurement of organs. Proc. R. Soc. Lond. 1897, 60, 489–498. [Google Scholar] [CrossRef]
  56. Durbin, J.; Watson, G.S. Testing for serial correlation in least squares regression. III. Biometrika 1971, 58, 1–19. [Google Scholar] [CrossRef]
  57. Chen, T.H.K.; Prishchepov, A.V.; Fensholt, R.; Sabel, C.E. Detecting and monitoring long-term landslides in urbanized areas with nighttime light data and multi-seasonal Landsat imagery across Taiwan from 1998 to 2017. Remote Sens. Environ. 2019, 225, 317–327. [Google Scholar] [CrossRef]
  58. Henny, L.; Thorncroft, C.D.; Hsu, H.H.; Bosart, L.F. Extreme rainfall in Taiwan: Seasonal statistics and trends. J. Clim. 2021, 34, 4711–4731. [Google Scholar] [CrossRef]
  59. Abdulmana, S.; Lim, A.; Wongsai, S.; Wongsai, N. Land surface temperature and vegetation cover changes and their relationships in Taiwan from 2000 to 2020. Remote Sens. Appl. Soc. Environ. 2021, 24, 100636. [Google Scholar] [CrossRef]
  60. Nichol, J.E.; Choi, S.Y.; Wong, M.S.; Abbas, S. Temperature change and urbanisation in a multi-nucleated megacity: China’s Pearl River Delta. Urban Clim. 2020, 31, 100592. [Google Scholar] [CrossRef]
  61. Tu, H.M.; Chen, H.M. From deforestation to afforestation: Effect of slopeland use policies on land use/cover change in Taiwan. Land Use Policy 2020, 99, 105038. [Google Scholar] [CrossRef]
  62. Cheng, F.Y.; Hsu, Y.C.; Lin, P.L.; Lin, T.H. Investigation of the effects of different land use and land cover patterns on mesoscale meteorological simulations in the Taiwan area. J. Appl. Meteorol. Climatol. 2013, 52, 570–587. [Google Scholar] [CrossRef]
  63. Liu, L.; Guo, J.; Miao, Y.; Li, J.; Chen, D.; He, J.; Cui, C. Elucidating the relationship between aerosol concentration and summertime boundary layer structure in central China. Environ. Pollut. 2018, 241, 646–653. [Google Scholar] [CrossRef]
  64. Lee, C.H.; Yeh, H.F. Impact of climate change and human activities on streamflow variations based on the Budyko framework. Water 2019, 11, 2001. [Google Scholar] [CrossRef] [Green Version]
  65. Shiu, C.J.; Liu, S.C.; Chen, J.P. Diurnally asymmetric trends of temperature, humidity, and precipitation in Taiwan. J. Clim. 2009, 22, 5635–5649. [Google Scholar] [CrossRef] [Green Version]
  66. Chen, Y.C.; Yao, C.K.; Honjo, T.; Lin, T.P. The application of a high-density street-level air temperature observation network (HiSAN): Dynamic variation characteristics of urban heat island in Tainan, Taiwan. Sci. Total Environ. 2018, 626, 555–566. [Google Scholar] [CrossRef] [PubMed]
  67. Hwang, R.L.; Lin, C.Y.; Huang, K.T. Spatial and temporal analysis of urban heat island and global warming on residential thermal comfort and cooling energy in Taiwan. Energy Build. 2017, 152, 804–812. [Google Scholar] [CrossRef]
  68. Huang, J.M.; Chen, L.C. A numerical study on mitigation strategies of urban heat islands in a tropical megacity: A case study in Kaohsiung City, Taiwan. Sustainability 2020, 12, 3952. [Google Scholar] [CrossRef]
  69. Hwang, R.L.; Lin, T.P.; Lin, F.Y. Evaluation and mapping of building overheating risk and air conditioning use due to the urban heat island effect. J. Build. Eng. 2020, 32, 101726. [Google Scholar] [CrossRef]
  70. Gao, M.; Piao, S.; Chen, A.; Yang, H.; Liu, Q.; Fu, Y.H.; Janssens, I.A. Divergent changes in the elevational gradient of vegetation activities over the last 30 years. Nat. Commun. 2019, 10, 2970. [Google Scholar] [CrossRef]
  71. Kuo, C.C.; Su, Y.; Liu, H.Y.; Lin, C.T. Assessment of climate change effects on alpine summit vegetation in the transition of tropical to subtropical humid climate. Plant Ecol. 2021, 222, 933–951. [Google Scholar] [CrossRef]
  72. Kuo, W.P. Living with “abnormal” drought in rain-soaked Taiwan: Analysis of water consumption practices and discourses. Anthropol. Noteb. 2019, 25, 71–91. [Google Scholar]
  73. Chi, C.H.; McEwan, R.W.; Chang, C.T.; Zheng, C.; Yang, Z.; Chiang, J.M.; Lin, T.C. Typhoon disturbance mediates elevational patterns of forest structure, but not species diversity, in humid monsoon Asia. Ecosystems 2015, 18, 1410–1423. [Google Scholar] [CrossRef]
  74. Huang, W.; Dong, S. Long-term and inter-annual variations of tropical cyclones affecting Taiwan region. Reg. Stud. Mar. Sci. 2019, 30, 100721. [Google Scholar] [CrossRef]
  75. Chang, C.P.; Yeh, T.C.; Chen, J.M. Effects of terrain on the surface structure of typhoons over Taiwan. Mon. Weather Rev. 1993, 121, 734–752. [Google Scholar] [CrossRef]
  76. Abbas, S.; Nichol, J.E.; Fischer, G.A.; Wong, M.S.; Irteza, S.M. Impact assessment of a super-typhoon on Hong Kong’s secondary vegetation and recommendations for restoration of resilience in the forest succession. Agr. Forest Meteorol. 2020, 280, 107784. [Google Scholar] [CrossRef]
  77. Hsiao, L.F.; Yang, M.J.; Lee, C.S.; Kuo, H.C.; Shih, D.S.; Tsai, C.C.; Wang, C.J.; Chang, L.Y.; Chen, D.Y.C.; Feng, L.; et al. Ensemble forecasting of typhoon rainfall and floods over a mountainous watershed in Taiwan. J. Hydrol. 2013, 506, 55–68. [Google Scholar] [CrossRef] [Green Version]
  78. Chen, C.W.; Tung, Y.S.; Liou, J.J.; Li, H.C.; Cheng, C.T.; Chen, Y.M.; Oguchi, T. Assessing landslide characteristics in a changing climate in northern Taiwan. Catena 2019, 175, 263–277. [Google Scholar] [CrossRef]
  79. Chen, C.Y. Event-based rainfall warning regression model for landslide and debris flow issuing. Environ. Earth Sci. 2020, 79, 127. [Google Scholar] [CrossRef]
  80. Wang, H.C.; Chang, C.T. The dynamic of vegetation growth with regular climate and climatic fluctuations in a subtropical mountainous island, Taiwan. Remote Sens. 2021, 13, 3298. [Google Scholar] [CrossRef]
  81. Piao, S.; Nan, H.; Huntingford, C.; Ciais, P.; Friedlingstein, P.; Sitch, S.; Peng, S.; Ahlström, A.; Canadell, J.G.; Cong, N.; et al. Evidence for a weakening relationship between interannual temperature variability and northern vegetation activity. Nat. Commun. 2014, 5, 5018. [Google Scholar] [CrossRef] [Green Version]
  82. Guo, Q.; Kelt, D.A.; Sun, Z.; Liu, H.; Hu, L.; Ren, H.; Wen, J. Global variation in elevational diversity patterns. Sci. Rep. 2013, 3, 3007. [Google Scholar] [CrossRef] [PubMed]
  83. Chen, Y.Y.; Huang, W.; Wang, W.H.; Juang, J.Y.; Hong, J.S.; Kato, T.; Luyssaert, S. Reconstructing Taiwan’s land cover changes between 1904 and 2015 from historical maps and satellite images. Sci. Rep. 2019, 9, 3643. [Google Scholar] [CrossRef] [Green Version]
  84. Jiang, Z.; Tai-Jen Chen, G.; Wu, M.C. Large-scale circulation patterns associated with heavy spring rain events over Taiwan in strong ENSO and non-ENSO years. Mon. Weather Rev. 2003, 131, 1769–1782. [Google Scholar] [CrossRef]
  85. Chen, J.M.; Li, T.; Shih, C.F. Asymmetry of the el niño-spring rainfall relationship in Taiwan. J. Meteorol. Soc. Jpn. Ser. II 2008, 86, 297–312. [Google Scholar] [CrossRef] [Green Version]
  86. Lee, J.H.; Yang, C.Y.; Julien, P.Y. Taiwanese rainfall variability associated with large-scale climate phenomena. Adv. Water Resour. 2020, 135, 103462. [Google Scholar] [CrossRef]
  87. Li, H.C.; Zhao, M.; Tsai, C.H.; Mii, H.S.; Chang, Q.; Wei, K.Y. The first high-resolution stalagmite record from Taiwan: Climate and environmental changes during the past 1300 years. J. Asian Earth Sci. 2015, 114, 574–587. [Google Scholar] [CrossRef]
  88. Huang, Z.; Ma, C.; Chyi, S.J.; Tang, L.; Zhao, L. Paleofire, vegetation, and climate reconstructions of the middle to late Holocene from lacustrine sediments of the Toushe Basin, Taiwan. Geophys. Res. Lett. 2020, 47, e2020GL090401. [Google Scholar] [CrossRef]
  89. NOAA Climate Prediction Center. Cold & Warm Episodes by Season. Available online: https://origin.cpc.ncep.noaa.gov/products/analysis_monitoring/ensostuff/ONI_v5.php (accessed on 15 January 2021).
  90. Hung, C.W.; Hsu, H.H.; Lu, M.M. Decadal oscillation of spring rain in northern Taiwan. Geophys. Res. Lett. 2004, 31, L22206. [Google Scholar] [CrossRef] [Green Version]
  91. Lin, C.C.; Liou, Y.J.; Huang, S.J. Impacts of two-type ENSO on rainfall over Taiwan. Adv. Meteorol. 2015, 2015, 658347. [Google Scholar] [CrossRef] [Green Version]
  92. Wang, B.; Wu, R.; Fu, X. Pacific–East Asian teleconnection: How does ENSO affect East Asian climate? J. Clim. 2000, 13, 1517–1536. [Google Scholar] [CrossRef]
  93. Hsu, Y.J.; Fu, Y.; Bürgmann, R.; Hsu, S.Y.; Lin, C.C.; Tang, C.H.; Wu, Y.M. Assessing seasonal and interannual water storage variations in Taiwan using geodetic and hydrological data. Earth Planet Sci. Lett. 2020, 550, 116532. [Google Scholar] [CrossRef]
  94. Wu, C.H.; Tsai, I.C.; Tsai, P.C.; Tung, Y.S. Large–scale seasonal control of air quality in Taiwan. Atmos. Environ. 2019, 214, 116868. [Google Scholar] [CrossRef]
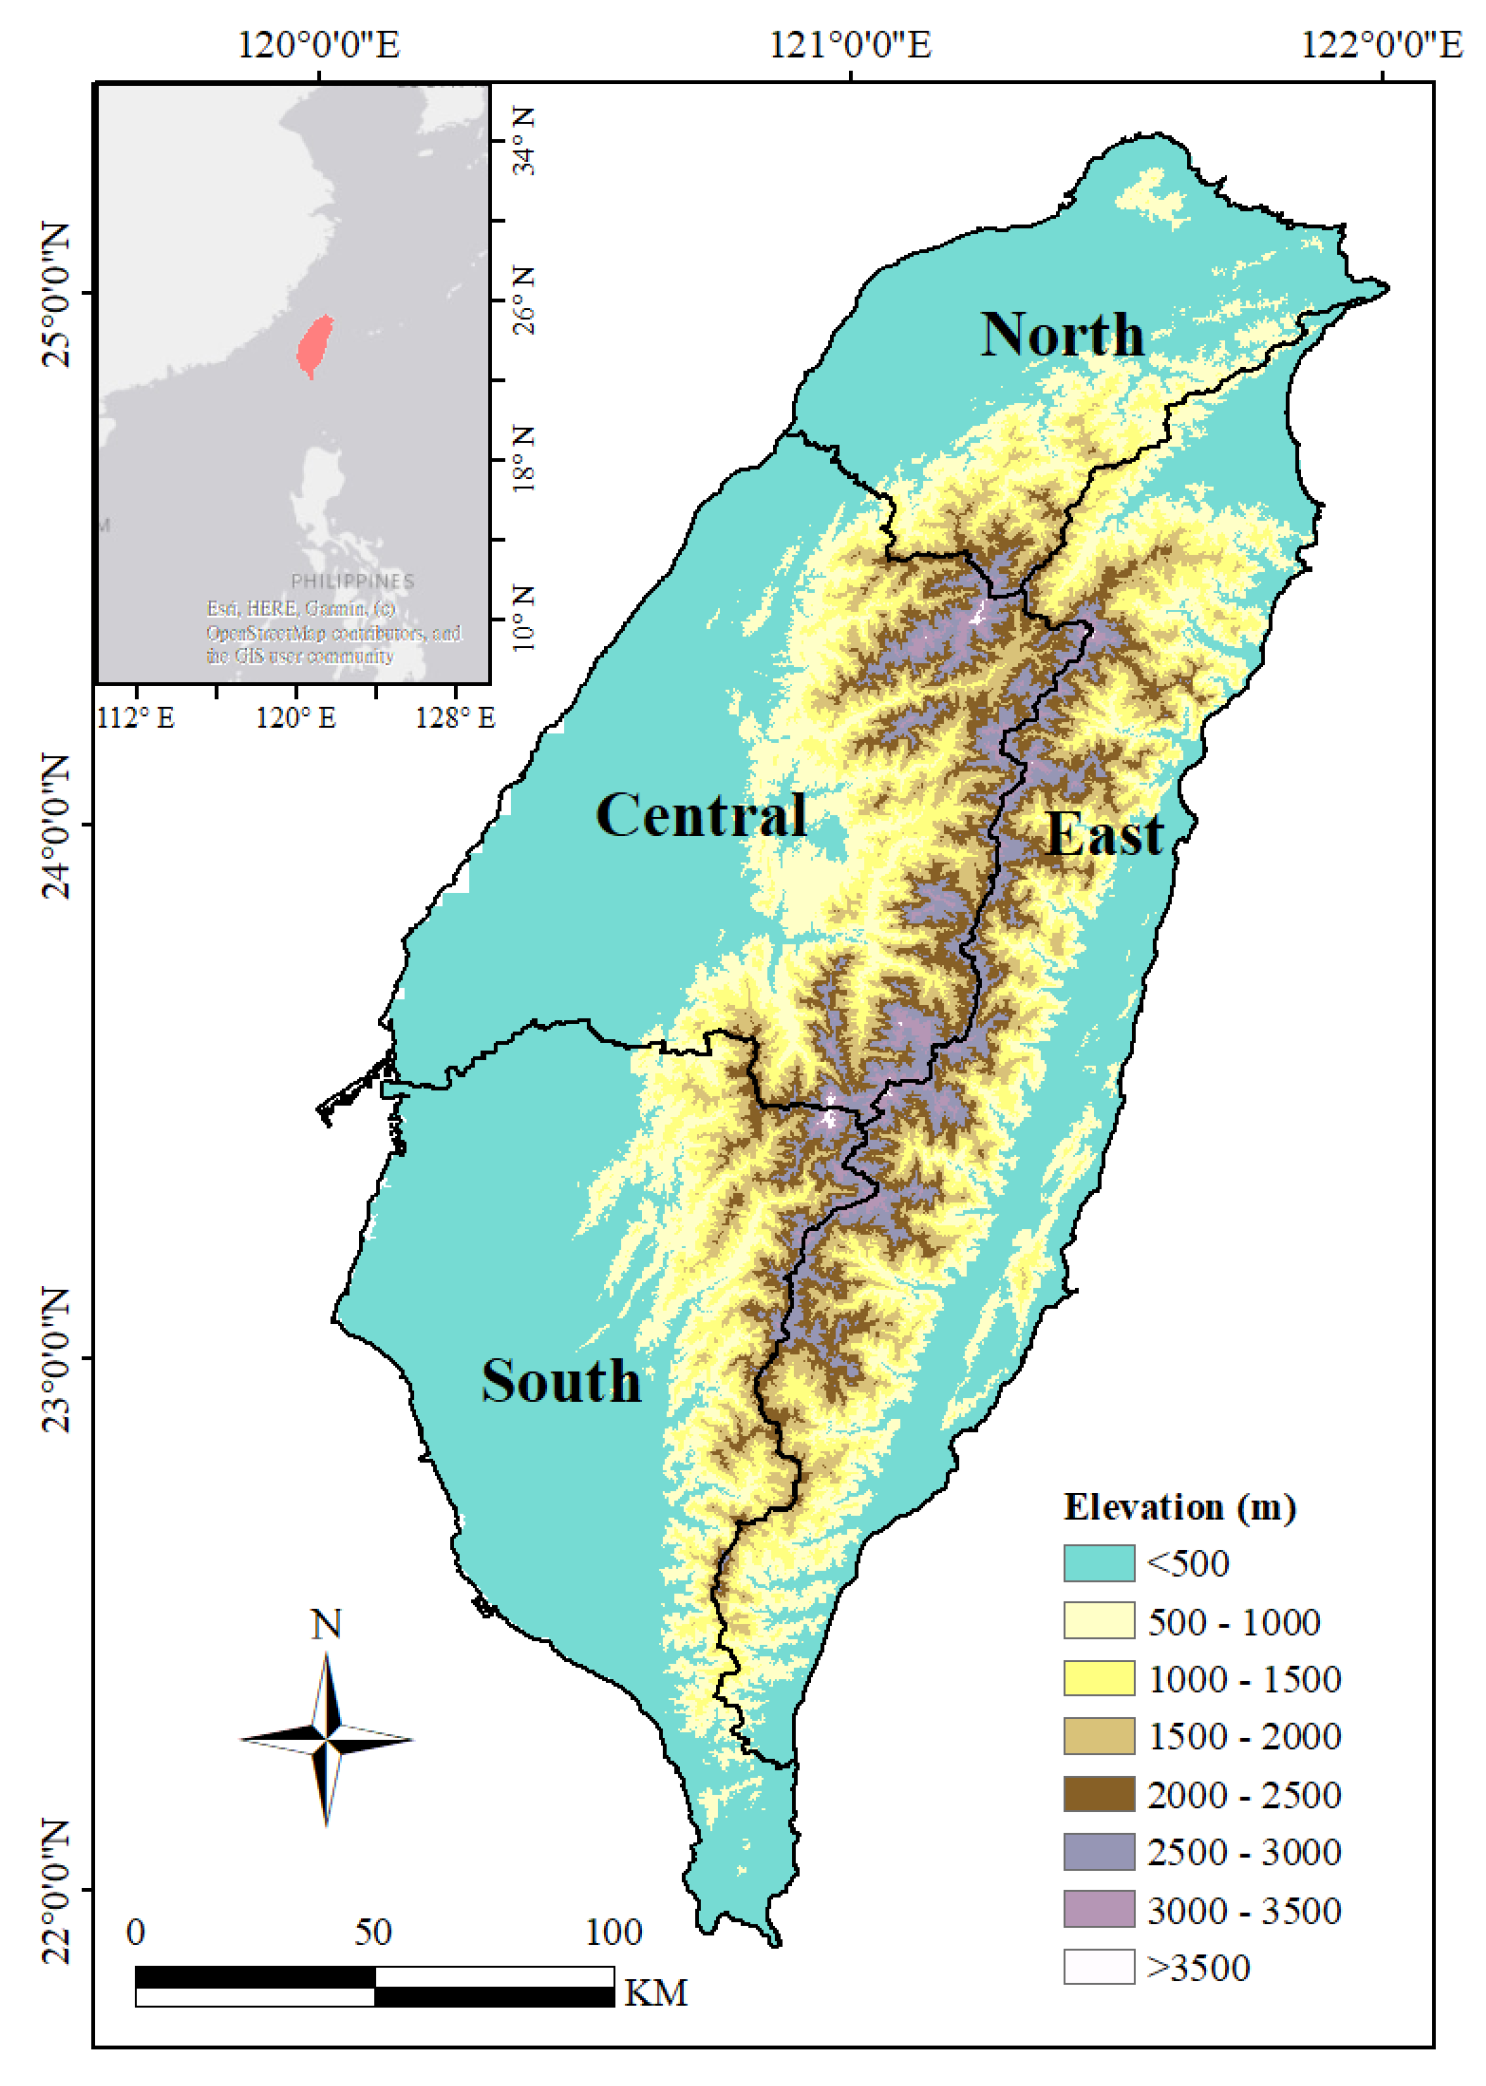
Figure 1. Study area.
Remotesensing 13 04707 g001
Figure 2. Research flow.
Remotesensing 13 04707 g002
Figure 3. BFAST results for (a) NDVI, (b) rainfall (Rain), (c) average temperature (Avg-Temp), (d) maximum temperature (Max-Temp), and (e) minimum temperature (Min-Temp) in Taiwan.
Remotesensing 13 04707 g003
Figure 4. BFAST results for NDVI in Taiwan at varied elevations.
Remotesensing 13 04707 g004
Figure 5. BFAST results for (a) rainfall, (b) average temperature, (c) maximum temperature, and (d) minimum temperature in Taiwan, at varied elevations.
Remotesensing 13 04707 g005
Figure 6. Occurrence of breakpoints for the (a) NDVI, (b) average temperature, (c) maximum temperature, and (d) minimum temperature.
Remotesensing 13 04707 g006
Figure 7. BFAST detected the largest change in time for the (a) NDVI, (b) average temperature, (c) maximum temperature, and (d) minimum temperature datasets.
Remotesensing 13 04707 g007
Figure 8. BFAST detected the largest change in direction for the (a) NDVI, (b) average temperature, (c) maximum temperature, and (d) minimum temperature datasets.
Remotesensing 13 04707 g008
Figure 9. Regional and seasonal linear regression results for NDVI at varied elevations.
Remotesensing 13 04707 g009
Figure 10. Regional and seasonal linear regression results for rainfall at varied elevations.
Remotesensing 13 04707 g010
Figure 11. Regional and seasonal linear regression results for the average temperature at varied elevations.
Remotesensing 13 04707 g011
Figure 12. Regional and seasonal linear regression results for the maximum temperature at varied elevations.
Remotesensing 13 04707 g012
Figure 13. Regional and seasonal linear regression results for the minimum temperature at varied elevations.
Remotesensing 13 04707 g013
Figure 14. Regional and seasonal comparison for the dry and wet seasons.
Remotesensing 13 04707 g014
Figure 15. Regional correlations between NDVI and climatic factors at varied elevations for (a) Taiwan, (b) north, (c) central, (d) south, and (e) east regions.
Remotesensing 13 04707 g015
Figure 16. The outcome of the Durbin–Watson test for (a) NDVI and (be) climatic factors at varied elevations.
Remotesensing 13 04707 g016
Table 1. Regional counties and cities.
RegionCounty
NorthKeelung City, Taipei City, New Taipei City, Taoyuan City, Hsinchu County, Hsinchu City
CentralMiaoli County, Taichung City, Changhua County, Nantou County, Yunlin County
SouthChiayi City, Chiayi County, Tainan City, Kaohsiung City, Pingtung County
EastYilan County, Hualien County, Taitung County
Table 2. BFAST breakpoints result for NDVI, rainfall (Rain), average temperature (Avg-Temp), maximum temperature (Max-Temp), and minimum temperature (Min-Temp) in Taiwan, with varied h values (shown in the detected year (month)).
hNDVIRainAvg-TempMax-TempMin-Temp
1/2NoneNoneNoneNoneNone
1/3–1/41997(11)
1/51988(4), 1994(8), 2000(10)
1/6None
1/7–1/121989(5), 1994(8), 2000(10)
Table 3. BFAST slope results for NDVI, rainfall (Rain), average temperature (Avg-Temp), maximum temperature (Max-Temp), and minimum temperature (Min-Temp) in Taiwan, with varied h values.
hNDVIRainAvg-TempMax-TempMin-Temp
1/20.00100.0371−0.0068−0.01700.0326
1/3–1/40.0175→
−0.0187
1/50.0084→−0.0205
→−0.0216→0.0004
1/60.0010
1/7–1/120.0065→−0.0357
→−0.0221→0.00002
Table 4. Occurrences and durations of ENSO events.
Time El NiñoLa Niña
1982–2012Occurrences910
(372 months)Number of months98112
Ratio (%)2630
2000–2012Occurrences45
(156 months)Number of months3143
Ratio (%)2028
Publisher’s Note: MDPI stays neutral with regard to jurisdictional claims in published maps and institutional affiliations.