Abstract
The cooling effect of green spaces as an ecological solution to mitigate urban climate change is well documented. However, the factors influencing the microclimate in the built environment around forest parks, diurnal variations of their impact and their degree of importance have not been explicitly addressed. We attempted to quantify how much various landscape parameters, including land cover and spatial location, impact the ambient air and surface temperature in the area around Beijing’s Olympic Forest Park. Data were taken along strategically located traverses inside and outside the park. We found: (1) The air temperature during the day was 1.0–3.5 °C lower in the park than in the surrounding area; the surface temperature was 1.7–4.8 °C lower; air humidity in the park increased by 8.7–15.1%; and the human comfort index reduced to 1.8–6.9, all generating a more comfortable thermal environment in the park than in the surrounding area. (2) The distance to the park and the green space ratio of the park’s surrounding area are significant factors for regulating its microclimate. A 1 km increase in distance to the park caused the temperature to increase by 0.83 °C; when the green space ratio increased by 10%, the temperature dropped by 0.16 °C on average. The impact of these two parameters was more obvious in the afternoon than in the middle of the day or in the morning. The green space ratio could be used for designing a more stable thermal environment. (3) Land cover affects surface temperature more than it does air temperature. Our data suggest that an urban plan with an even distribution of green space would provide the greatest thermal comfort.
1. Introduction
Urbanization and climate change are two main challenges and fundamental considerations in 21st-century urban planning [1]. Over the past few decades, a major concentration of people has taken place in urban areas, especially in developing countries such as China. Currently, over 50% of the world’s population lives in cities. This percentage is expected to increase to 66% by 2050 [2].
These rapid changes are causing a significant deterioration of the urban climate [3]. The urban heat island (UHI) is one of the most documented features of the urban environment, involving the increase in temperature relative to the surrounding non-urban areas [4]. It also causes strong thermal heterogeneity in fine-scale intra-urban environments [5,6]. UHI increases water consumption [7] and the use of energy for cooling [8], intensifies the concentration of pollutants in the air and worsens thermal comfort [9,10] and exposes citizens to greater health risks such as hyperemia, heart attack and stroke [11]. In addition, increased energy use under warm conditions violates urban sustainability principles [12]. Consequently, mitigating and adapting to UHI, especially finding ecological measures, has become a major research area in urban planning and urban ecology [13,14].
Urban parks and green spaces provide various ecosystem services such as air and water purification [15], runoff reduction [16] and noise reduction [17]. They have also been considered an ecological solution for regulating the microclimate and alleviating UHI through the process of cooling [18,19,20,21,22]. The cooling effect of green spaces has been attributed to the processes of evapotranspiration and shading [23]. Extensive studies based on field measurements have shown that urban parks are usually 0.5–4 °C cooler than their adjacent built-up area [13,22,24,25,26,27], and even 5–7 °C cooler [28,29,30], although there is evidence of a non-significant cooling effect of parks [31] or even a warming effect [32,33].
Research on UHI and the cooling effect of urban parks has so far focused mainly on effects inside the parks as compared to the surrounding built-up areas, and put importance on the characteristics of parks rather than surrounding areas; this research relates the cooling function of the park to the park’s characteristics such as size, shape and landscape composition. However, less effort has been made to understand the factors that regulate the thermal condition in the surrounding areas, especially their interaction with the extended cooling effect of the parks into these areas. Past studies of the issue have resulted in conflicting interpretations and conclusions. For example, Hamada and Ohta [34] suggest that the cooling effect of urban parks on the adjacent urban area is limited to a few hundred meters; Honjo and Takakura [35] find that it may extend a distance comparable to the length of the park, while according to other studies it can be extended up to 1.4 km regardless of the size or length of the park [12], or even 3 km [36]; Oke et al. [23] and Zhao et al. [14] contend that both distance and the level of cooling are influenced by the size of the green space (however, according to Algretawee [37], the length of the park cannot be a reliable indicator to determine the cooling distance); the cooling effect of medium and small size parks is relatively similar [33,36]; and even distribution of smaller parks in urban areas can be more efficient in improving the thermal environment than a solitary large park [38,39,40].
Why is there such inconsistency in results and conclusions? Is it because of the factors in surrounding areas of the parks that affect the extension of the park’s cooling effect? Can these factors cause a strong heterogeneity of temperature in the proximity of a large urban park under its thermal influence? According to Yan [12], the thermal performance of an urban park and its influence on the surrounding built-up area are not only dependent on the features of the park itself, but also on the characteristics of the surrounding urban areas such as land cover [12], urban morphology [41] and spatial location [42]. According to Qiu and Jia [31], and based on land surface temperature (LST) data, the range of the cooling effect of parks (cooling distance) and the temperature gradient were largely regulated by the landscape features outside the parks, and small green patches in the proximity of parks played a more important role in providing thermal comfort at night compared to the daytime. Additionally, it is suggested that the distance from parks and land cover types in the proximity of parks influence thermal variations in these areas [12]. Based on surface temperature data, Algretawee [36] suggested that the thermal function of urban parks varies diurnally, and the distance from parks is an important determinant for temperature regulation outside the parks.
Since many of the features and characteristics of surrounding areas of parks can be controlled and optimized through landscaping and urban planning, it is prudent to investigate and identify the important factors and try to formulate a scientific basis for urban planning. However, the degree of importance of these factors and the diurnal variations of their impacts have not been explicitly addressed, and many of the above-mentioned studies and conclusions are based on remote sensing technology and LST data, not on air temperature, which has direct and essential impacts on humans’ mental and physical well-being. It is clear that further empirical research based on high-resolution air temperature data is required to fully define the key factors influencing the microclimate of the surrounding area and to establish the necessary guidelines for planners and stakeholders.
In this study, we present the results of field measurements taken in and around Olympic Forest Park in Beijing, China, where the area is supposed to be under the influence of the park’s thermal effects. We investigate the thermal performance of the park and influencing factors on the thermal environment of the surrounding built-up area under hot summer weather conditions. The specific objectives of our study are: (1) to quantify the cooling effect of an urban park in its surrounding built environment, and (2) to explore how landscape parameters including land cover and spatial location contribute to the diurnal variations in air temperature in the area surrounding the park, and their degree of importance.
2. Material and Methods
2.1. Study Area and Site Description
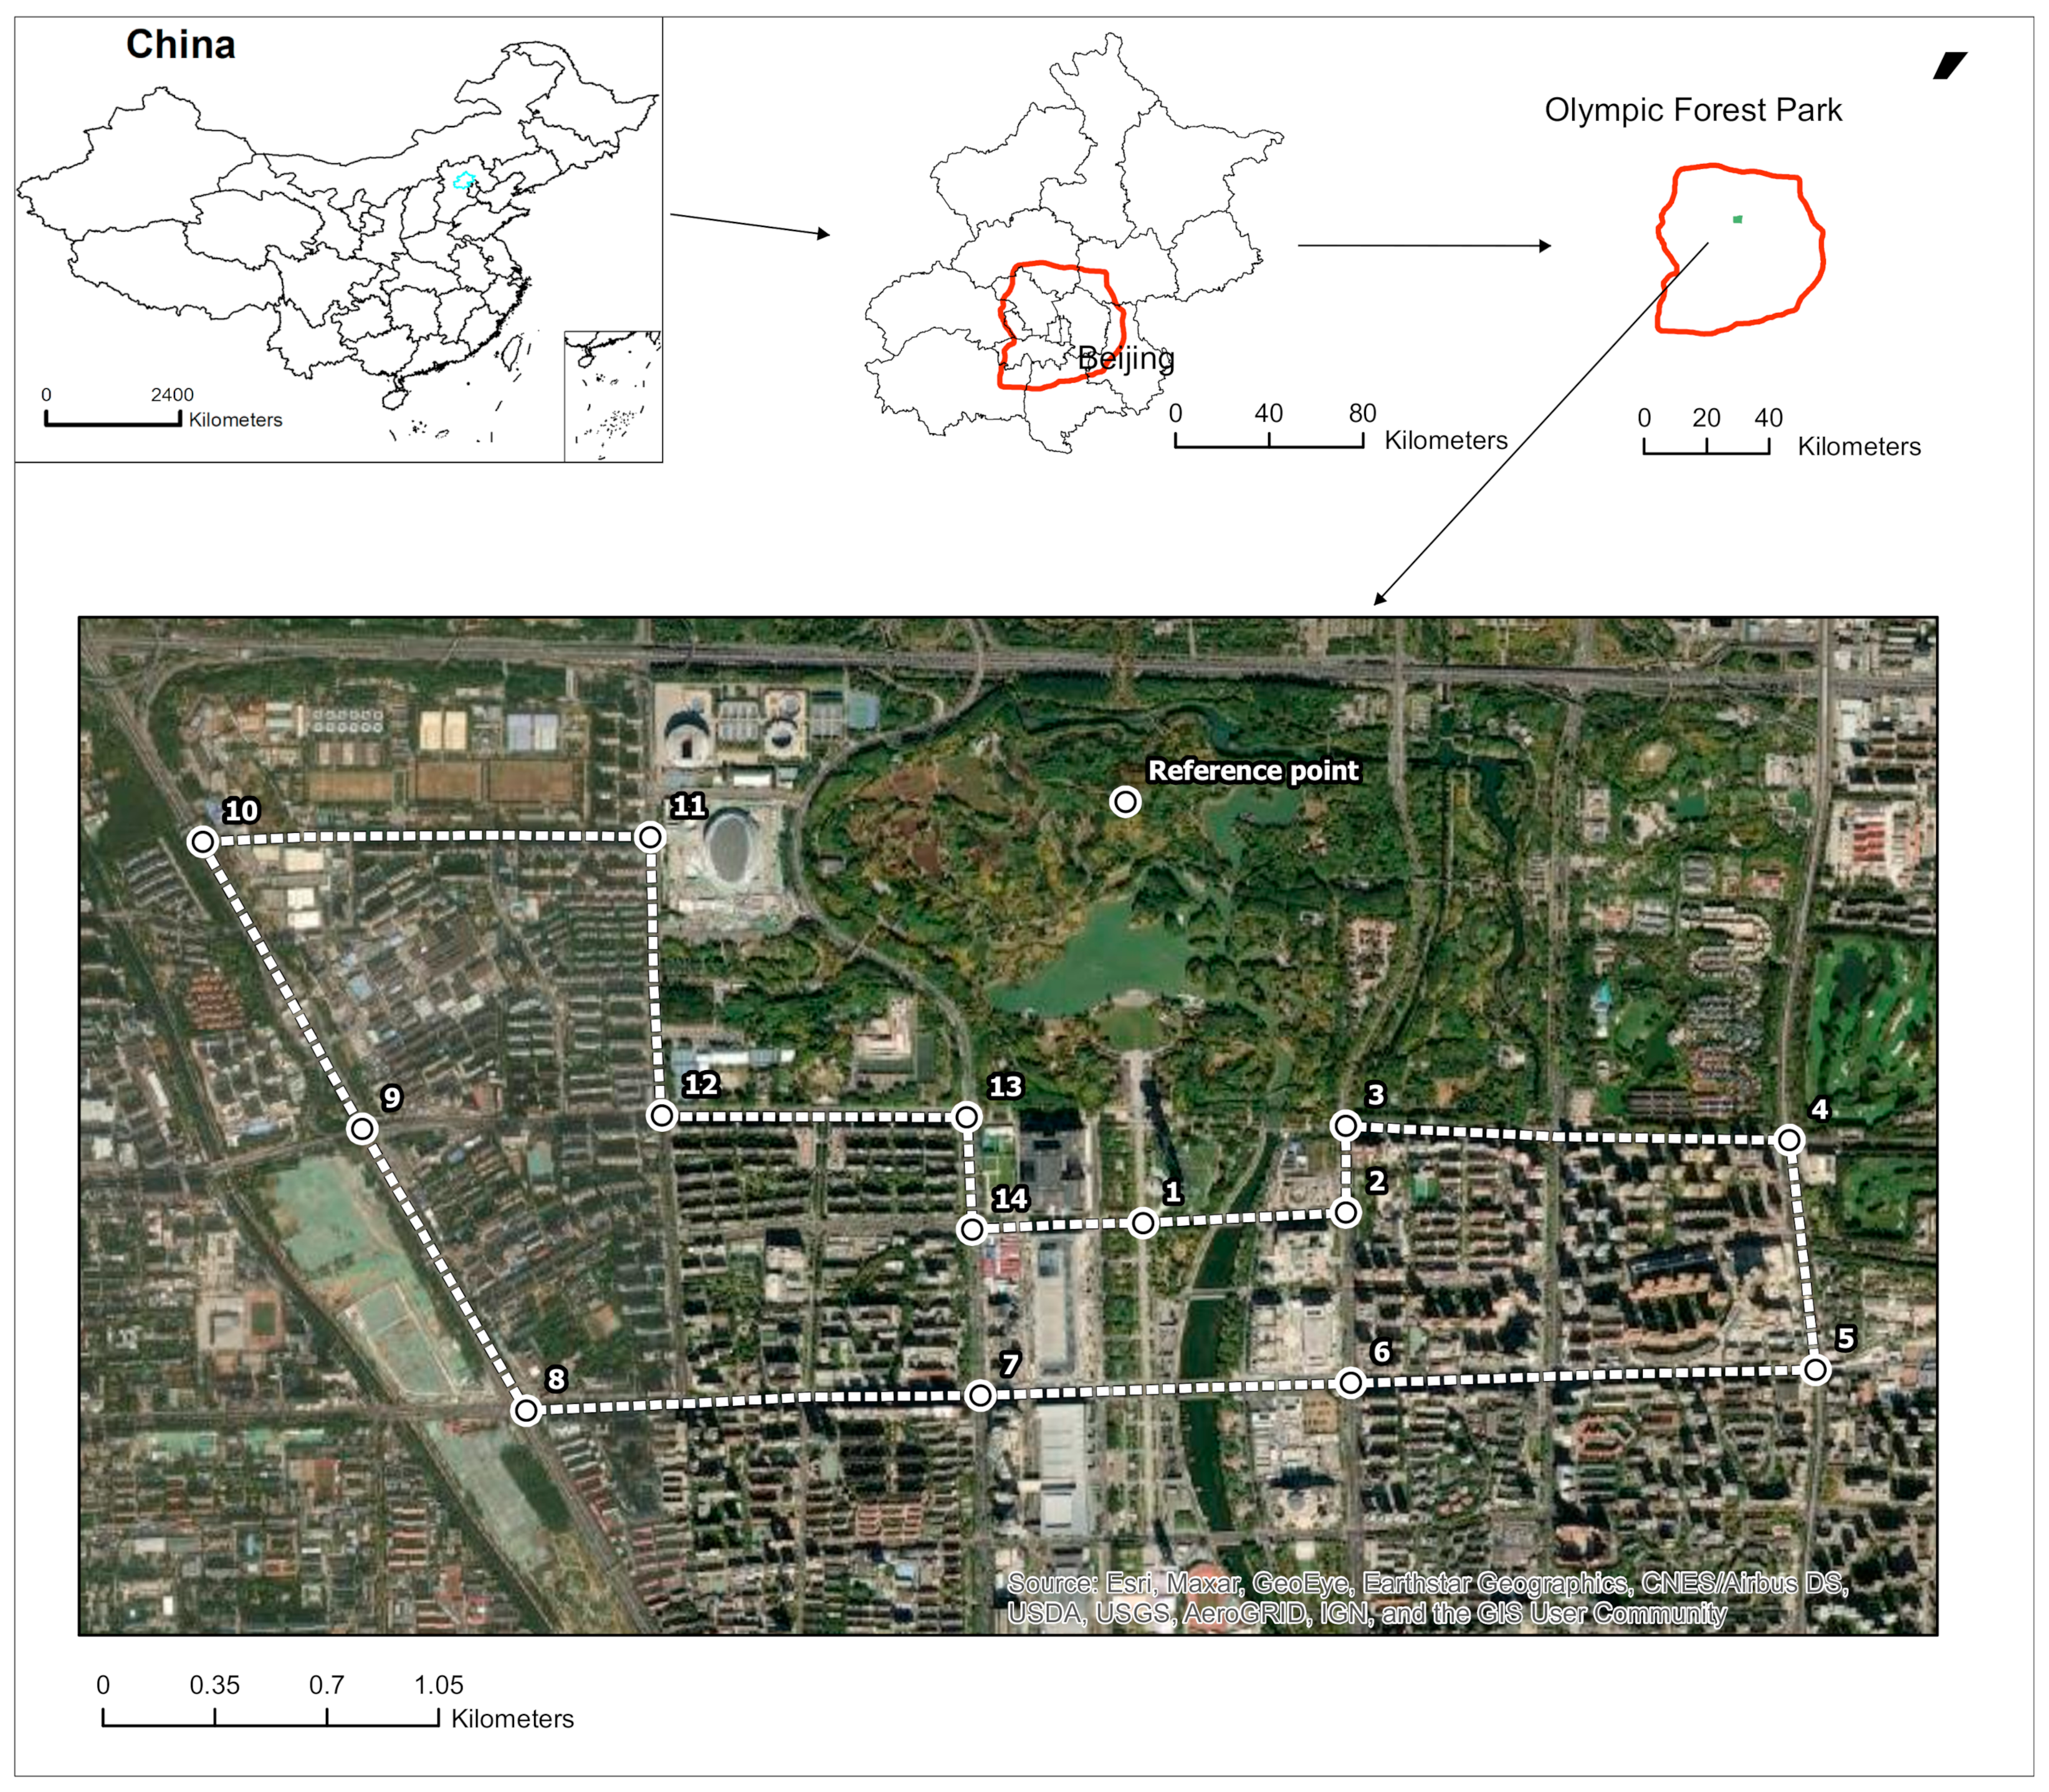
The study was conducted in Olympic Forest Park in Beijing (39°28′–41°05′N, 115°25′–117°30′E) and its surrounding area (Figure 1). Beijing, with a population of 21.7 million at the end of 2016, is the world’s third most populated city [43]. It has a monsoon-influenced humid continental climate with hot and humid summers and cold, dry and windy winters [44]. The annual average temperature of the city is 12.6 °C (27 °C in July and −4 °C in January). The city has been facing the urban heat island (UHI) phenomenon over the last 50 years due to rapid urbanization, increasing built-up areas, a decline in natural land and anthropogenic activities; the current UHI has reached an average of 4.5 °C [8]. Beijing’s urban green spaces sprawl across 81,305 ha and about 40% are urban parks [45]. The Olympic Forest Park, with an area of 680 ha, is the largest public green space in the city. It was built in the northern part of Beijing’s built-up area for the 2008 World Olympic Games, and it has become a tourism and recreation destination for visitors and residents. It is planted with deciduous and evergreen trees, shrubs and grasses, and includes a man-made dragon-shaped lake and other natural landscape features.
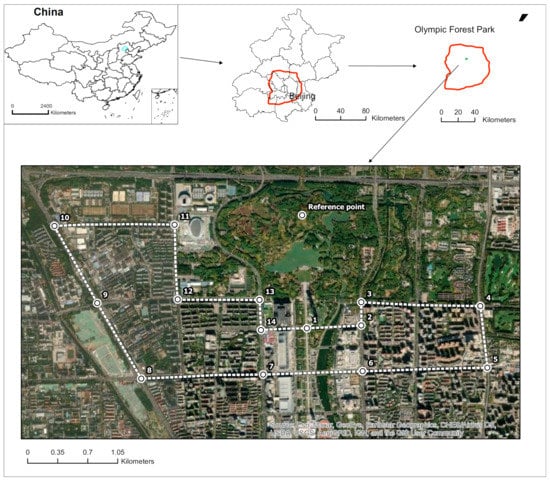
Figure 1.
Spatial location of measurement points (1, 2, 3, …, 14) and the reference point at the center of Beijing Olympic Forest Park.
The measurements were taken along a route of 14.6 km passing along the edge of the park and surrounding urban areas with an average 2.5 km distance to the center of the park, which was determined as our reference point (Figure 1). The reference point was on a small paved road to avoid the influence of shadows from trees. The measurement route was chosen on the south side of the forest park as this area is flat, thus temperature variations due to topographical differences are small and can be ignored, and we could choose the streets with similar width and traffic flow to minimize the impact of traffic and anthropogenic activities on data. Further considerations are presented in Section 4.6 (limitations). All temperature measurements were made in the middle of the paved streets to avoid shade from buildings and trees. Fourteen points (1, 2, 3, … 14) were chosen on the route and used for spatial comparison and for investigating the relationship between characteristics of each location and air and surface temperature. The points were sufficiently close to one another to be affected by uniform meso-scale weather conditions; however, they were each affected by distinctly heterogeneous micro-scale landscape features. Table 1 describes the landscape feature of each point.

Table 1.
Description of measurement points.
2.2. Data
2.2.1. Traverse Method for Air Temperature Measurement
The mobile traverse method is an economic and fast technique to measure microclimate factors when the number of fixed stations in the study area is limited. It allows the accurate depiction of the spatial distribution of UHI in the study area over short time intervals, although not instantaneously. We used this method to measure the air temperature and relative humidity (RH) during three days including 3 and 5 August and 10 July 2017. However, since there was no significant difference among the results of observation dates (Table 2), in this paper, we presented the data of 10 July 2017, a day with average maximum temperature 36.3 °C, average daily mean temperature 29.2 °C, average RH 70%, sky cloud cover less than 10% and average wind speed 3 m/s in the study area with a dominant NE wind direction. The survey was repeated 6 times from morning to evening (9:22–10:30, 10:35–11:40, 11:45–12:50, 13:00–14:05, 14:20–15:30 and 15:45–17:00). After completing each transect and reaching the final point, the measurements were repeated in the opposite direction.
Table 2.
Pearson correlation analysis results for the relationship of air temperature between measurement days.
The measurements were carried out on sunny and windless days to better define the UHI effect and minimize the influence of air convection and climatological variance. We used Kestrel NK4500 meteorological sensors (operating range −10 to +55 °C, temperature accuracy of ±0.1 °C, RH accuracy of ±3%). The meteorological sensors were mounted on a cargo bicycle at the height of 1.5 m above the ground. A similar meteorological sensor was mounted on a 1.5-m-tall tripod at the reference point in the center of the park. A piece of thick white paper was used to provide shelter for observation to avoid direct exposure to sunlight. The data at the reference point were used to correct (normalize) the values taken by the meteorological sensors mounted on the cargo bicycle since the measurements at different points were not instantaneous.
The data of each traverse were adjusted to its beginning time by correcting the values using the temperature variation rate of the reference point. Our meteorological sensors were able to measure wind speed, and there was no significant change in wind speed during each traverse. The data automatically made records at 10-s intervals and stored them in the data logger. Furthermore, the two meteorological sensors were factory-calibrated; however, they were tested before the measurement by recording temperature data on the same places—the correlation coefficient of datasets was 0.97. A GPS recorder was used to record the latitude, longitude and altitude of the measurement route. We sampled in the middle of the streets under clear sunshine to avoid the influence of shadows from buildings and trees.
2.2.2. Landscape Factors
Two categories of landscape parameters were chosen for describing the environmental characteristics. They included land cover features and spatial location. Both have potential impact on the air and surface temperatures, and they can be easily calculated and controlled during urban planning. From the land cover features, we measured the percentage of green and grey area at each point. Spatial location was determined as the distance of each measurement point to the reference point. According to previous reports, air temperature at an urban site is affected by land cover features in its surrounding area within a few hundred meters [46,47]. Thus, a buffer zone of 200 m around each measurement point was determined by GIS ArcMap 10, and the ratio of green to grey surface area within it was calculated. In order to determine the effect of landscape features on the distribution of UHI, the land cover map of the study area was classified based on the supervised classification using data of Google Earth Engine on 6 August 2017, including SPOT5 (fusion 2.5 m), and also, classification accuracy assessments were performed with field knowledge. The sites were then classified into two main categories: green space and grey space. Urban forest parks, residential parks, water bodies and farmlands were considered as green space, while buildings, roads and bare land were considered as grey spaces.
2.2.3. Land Surface Temperature
Land surface temperature (LST) represents heat energy (infrared radiation), which is given off by surfaces such as land and buildings. Through thermal sensors mounted on satellites and airplanes, it is possible to estimate the surface temperatures and detect temperature differences on a very fine scale (i.e., roofs, pavements and grassy areas). However, satellite data have limitations such as low temporal resolution (the thermal images can reflect the temperature of acquisition time); also, a high percentage of cloud cover in some satellite images might limit studying certain locations. So, we combined satellite data for surface temperatures and data from our field measurements for the air temperature to obtain a more accurate and complete picture of the study area’s temperature variations. LST data of the study area were derived from the thermal infrared bands (TIR) of Landsat 8 TM images acquired on 10 July 2017, 2:53 p.m. (row32/path123), with a spatial resolution of 30 m (resampled from 120 m). Firstly, the Top-of-Atmosphere Radiance (TOA) was calculated from the digital number (DN) of TIR bands (Landsat project office science, 2009), and then surface radiance was extracted from TOA by removing the atmospheric effect in the thermal zone [48]. Finally, LST was estimated from surface radiance applying the Planck function and mono-window algorithm [49].
2.2.4. Thermo-Physiologic Comfort Index
Tacitly and predominantly, human thermal comfort is associated with the urban heat island phenomenon. However, for human beings, experiencing human comfort is more sensible than urban heat island itself. In this study, we used our collected field measurement data including air temperature, RH and wind speed to estimate the effects of landscape parameters on the urban heat island and thermal comfort in the study area. The thermo-physiologic comfort of each measurement point was analyzed by means of the comfort index (CI) introduced by the Beijing Meteorological Bureau based on the Lu Dinghuang local comfort index [50]. A higher value of CI represents more discomfort in the thermal environment (Table 3). The empirical model has been used to estimate the thermal comfort through air temperature, RH and wind speed since 1997 using Equation (3). The enhanced thermal comfort (∆CI) of an urban park can then be calculated from the difference of CI at measurement and reference points by using Equations (1)–(4):
where i is the ith measurement point; is the values of air temperature (°C) at the ith measurement point; , and are the average values of air temperature (°C), RH (%) and CI of measurement points during the entire measurement time, respectively; , and are air temperature, RH and CI of the reference point; , and are their values at the measurement points, respectively; , and are the incremental changes in cooling, RH and thermal comfort, respectively, at ith measurement point; and represents the square root of wind speed (m/s).
Table 3.
Classification of thermo-physiologic comfort issued by Beijing Meteorological Bureau based on Lu Dinghuang comfort index [50].
2.3. Data Analysis
As discussed in Section 2.2.1, 14 field measurement points were selected on the measurement route, and the measurement was repeated six times during a day. During each traverse, the air temperature of each point was represented by the average of 30–45 consecutive values that were recorded every 10 s. We used t-test to examine statistical differences in air temperature between the park and its surrounding area. Additionally, the Pearson correlation analysis was applied to investigate the relationship between air temperature, LST, distance from the park and the effect of land cover type. Regression analysis was undertaken to relate the air temperature and its variations to landscape parameters, including distance and land cover type, using the average values of temperature in measurement points and also to quantify the slopes of air temperature variation concerning each of the landscape parameters during each traverse. To estimate the relationship between air temperature and LST, we extracted the LST value of the pixels where the measurement points were located. As LST data were estimated from Landsat 8 imagery acquired at 2:53 p.m., we used air temperature values of traverse five (2:20 to 3:30 p.m.) on 10 July 2017 for the statistical analysis. The data analysis was performed by running the IBM SPSS statistics for Windows, version 24 (IBM Corp., Armonk, NY, USA). p values less than 0.05 were considered as statistically significant.
3. Results
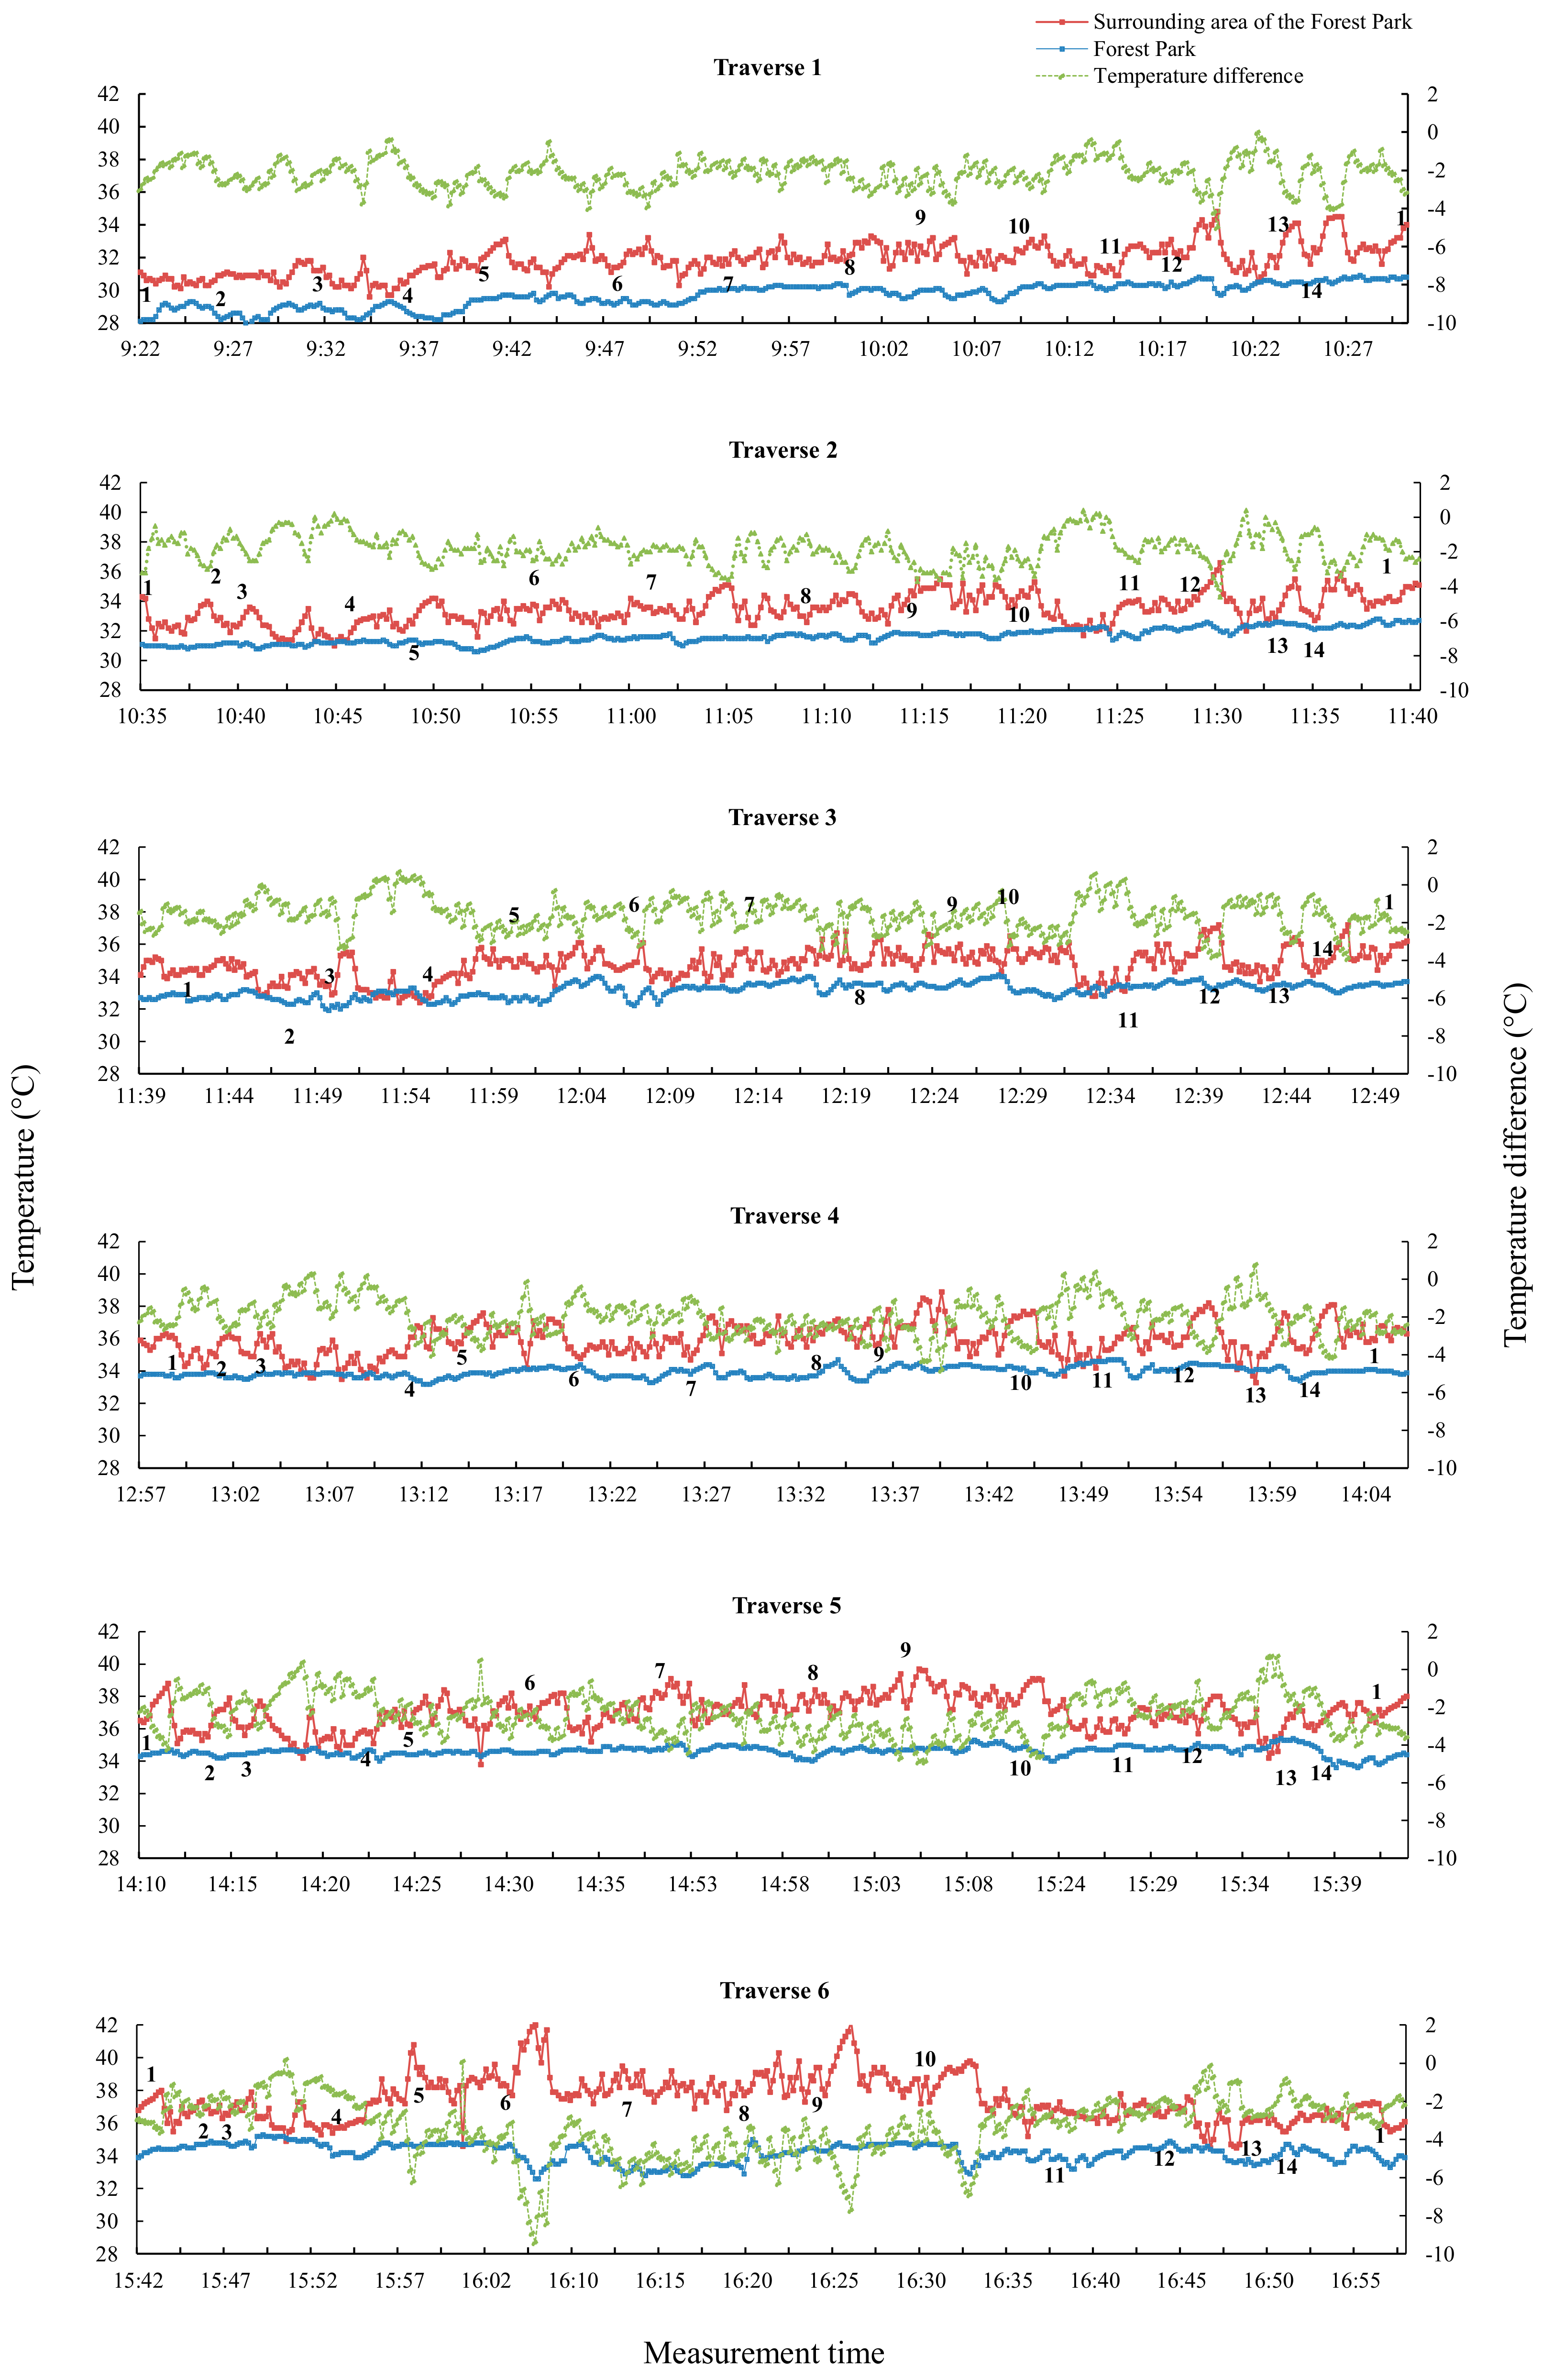
3.1. Air Temperature and Cooling Effect of the Park
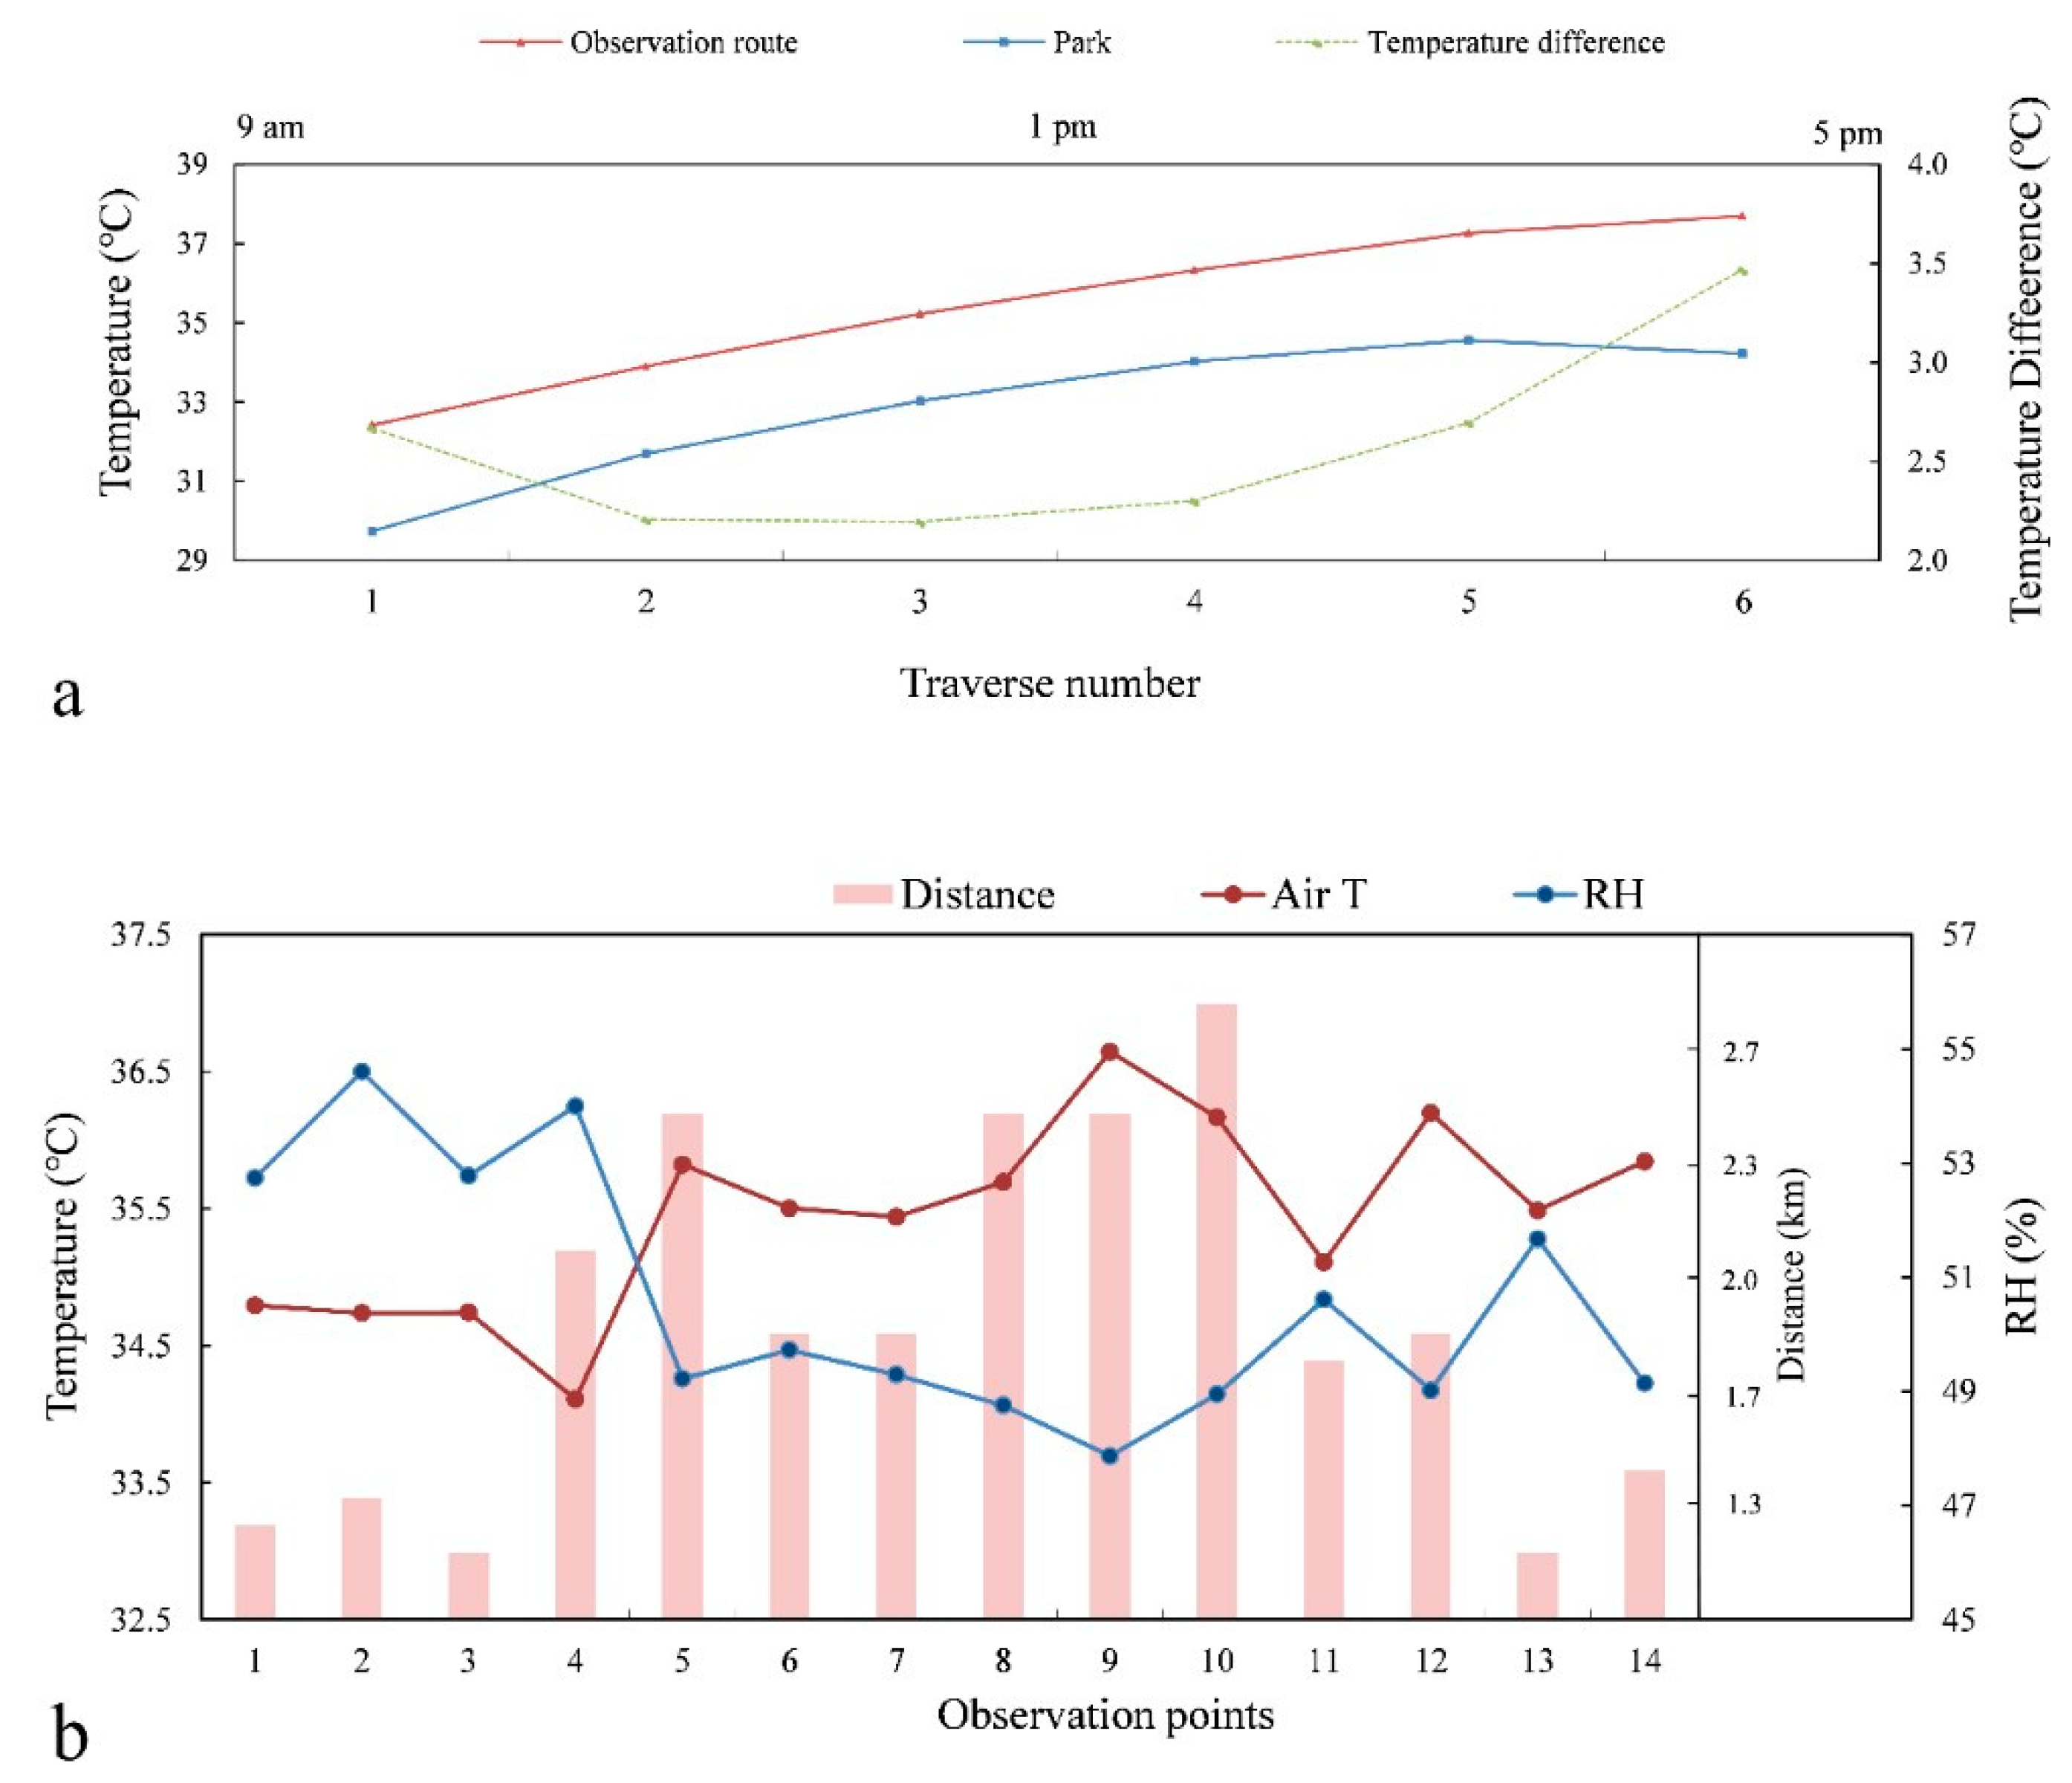
The cooling effect of a park is usually calculated by subtracting the maximum urban temperature from the minimum park temperature. However, most urban environments are heterogeneous and hence the average values of temperature can provide a better explanation of the variation between specific urban points. In this study, the cooling effect of the park was calculated in a similar way, but instead of maximum and minimum temperature, we used the average values of the specific points. Figure 2 shows the result of six round traverse microclimate investigations along the measurement route outside the Olympic Forest Park and the reference point at the center of the park. The t-test results indicated a distinct air temperature difference between the park and its surrounding area (Table 4). The reference point was on average 1.0–3.5 °C cooler than the entire measurement route, with 8.7–15.1% higher RH, and it decreased CI by 1.8–6.9 for a more comfortable thermal environment.
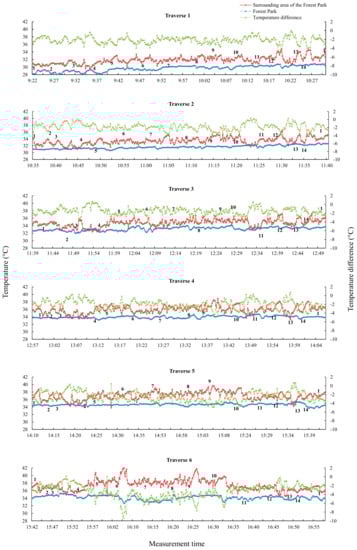
Figure 2.
The air temperature variation trend in the center of Olympic Forest Park and the measurement route on 10 July 2017. Temperature (T) difference: T Park—T measurement point. The numbers on the charts area stand for the measurement point’s number.
Table 4.
Paired samples t-test analysis results for comparing the air temperature difference between the park and its surrounding urban area.
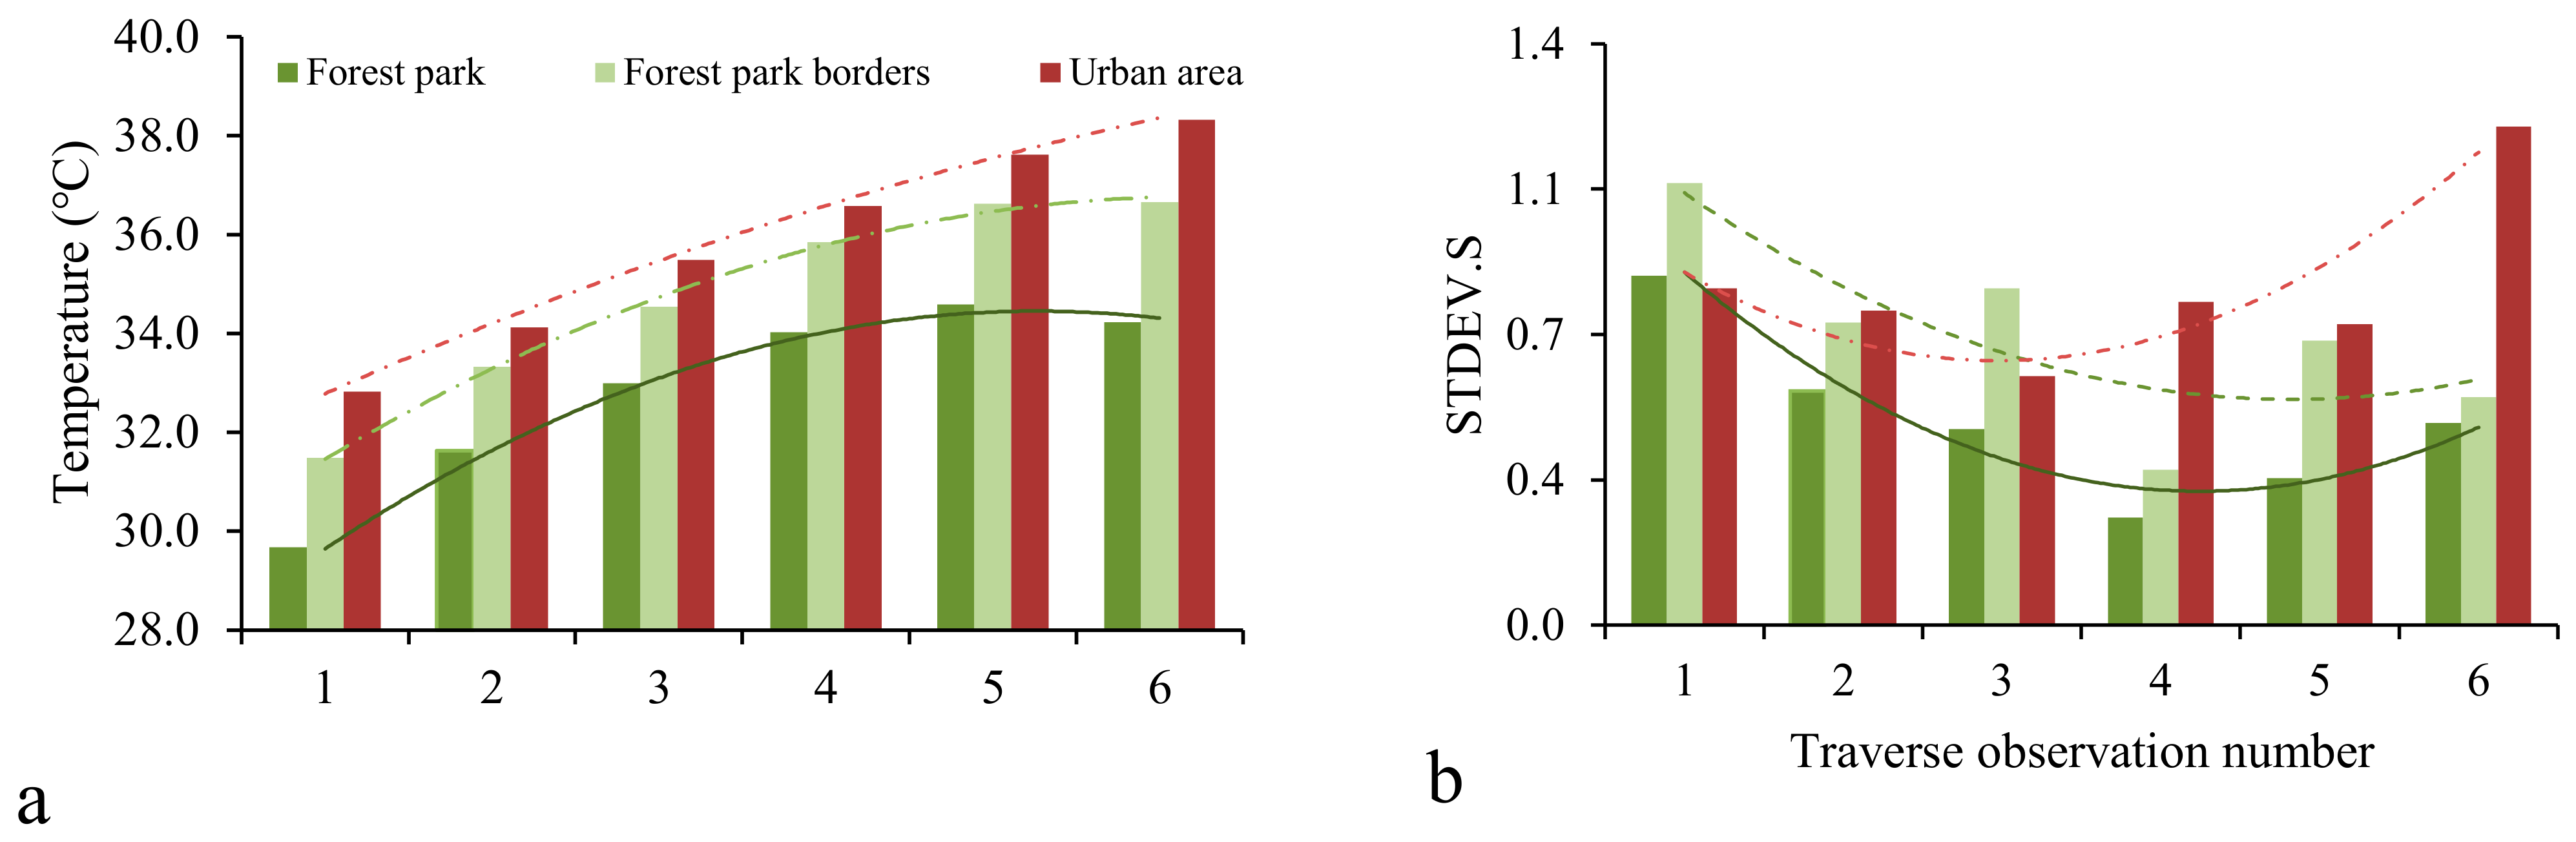
The temperature difference between the park and the surrounding area was more pronounced in the morning (2.7 °C and 2.2 °C, traverse 1 and 2) and afternoon (2.7 °C and 3.5 °C, traverse 5 and 6) than midday (2.22 °C and 2.3 °C, traverse 3 and 4) (Figure 3a). Generally, the points on the park’s borders showed a lower temperature and higher RH in comparison with the points far from the park’s border (Figure 4a). On the measurement route, the lowest air temperature of 34.1 °C (1.7 higher than the reference point) was observed at point 4, near the park’s border, and with a high ratio of green space (37%) in the buffer zone, while the highest air temperature of 36.6 °C was observed at point 9, far from the park and with a relatively lower rate of green space (14%) (Figure 3b). Meanwhile, point 4 with CI as 93.65 generated the most comfortable thermal environment, while point 9 with CI as 98.25 had the worst situation in the study area. The CI of the park was 91.37. Our results showed that the large urban park could provide an obvious diurnal cooling effect; however, there is strong thermal heterogeneity in their proximity, and the environmental characteristics outside the park have an important influence on regulating thermal conditions and comfort in these areas.
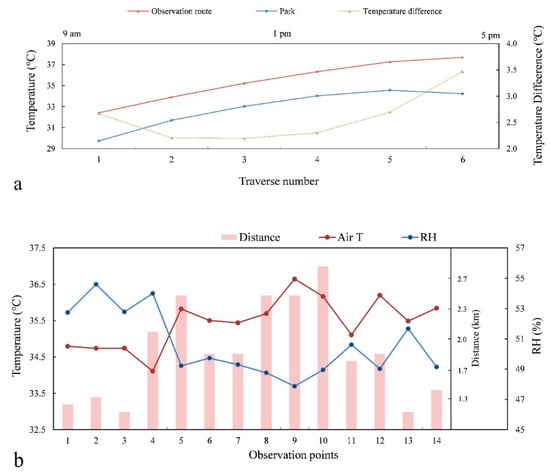
Figure 3.
The comparison of the average air temperature difference between the Olympic Forest Park and the measurement route in the surrounding area of the park (a), and distribution pattern of air temperature, RH and distance to park of measurement points (b). Temperature (T) difference: average T of each traverse—corresponding T of park (average values of 6 traverses on 10 July 2017).
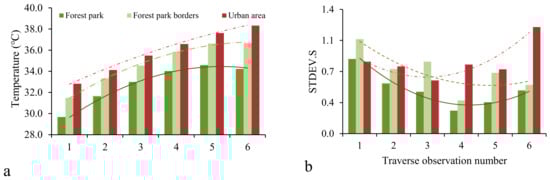
Figure 4.
Average air temperature (a) and standard deviation of air temperature values (b) of the forest park (reference point), points on forest park’s borders (1, 2, 3, 4 and 13) and points far from the park (5, 6, 7, 8, 9 and 10), during 6 traverses on 10 July 2017 (see Figure 1 for the spatial location of points).
3.2. Land Surface Temperature
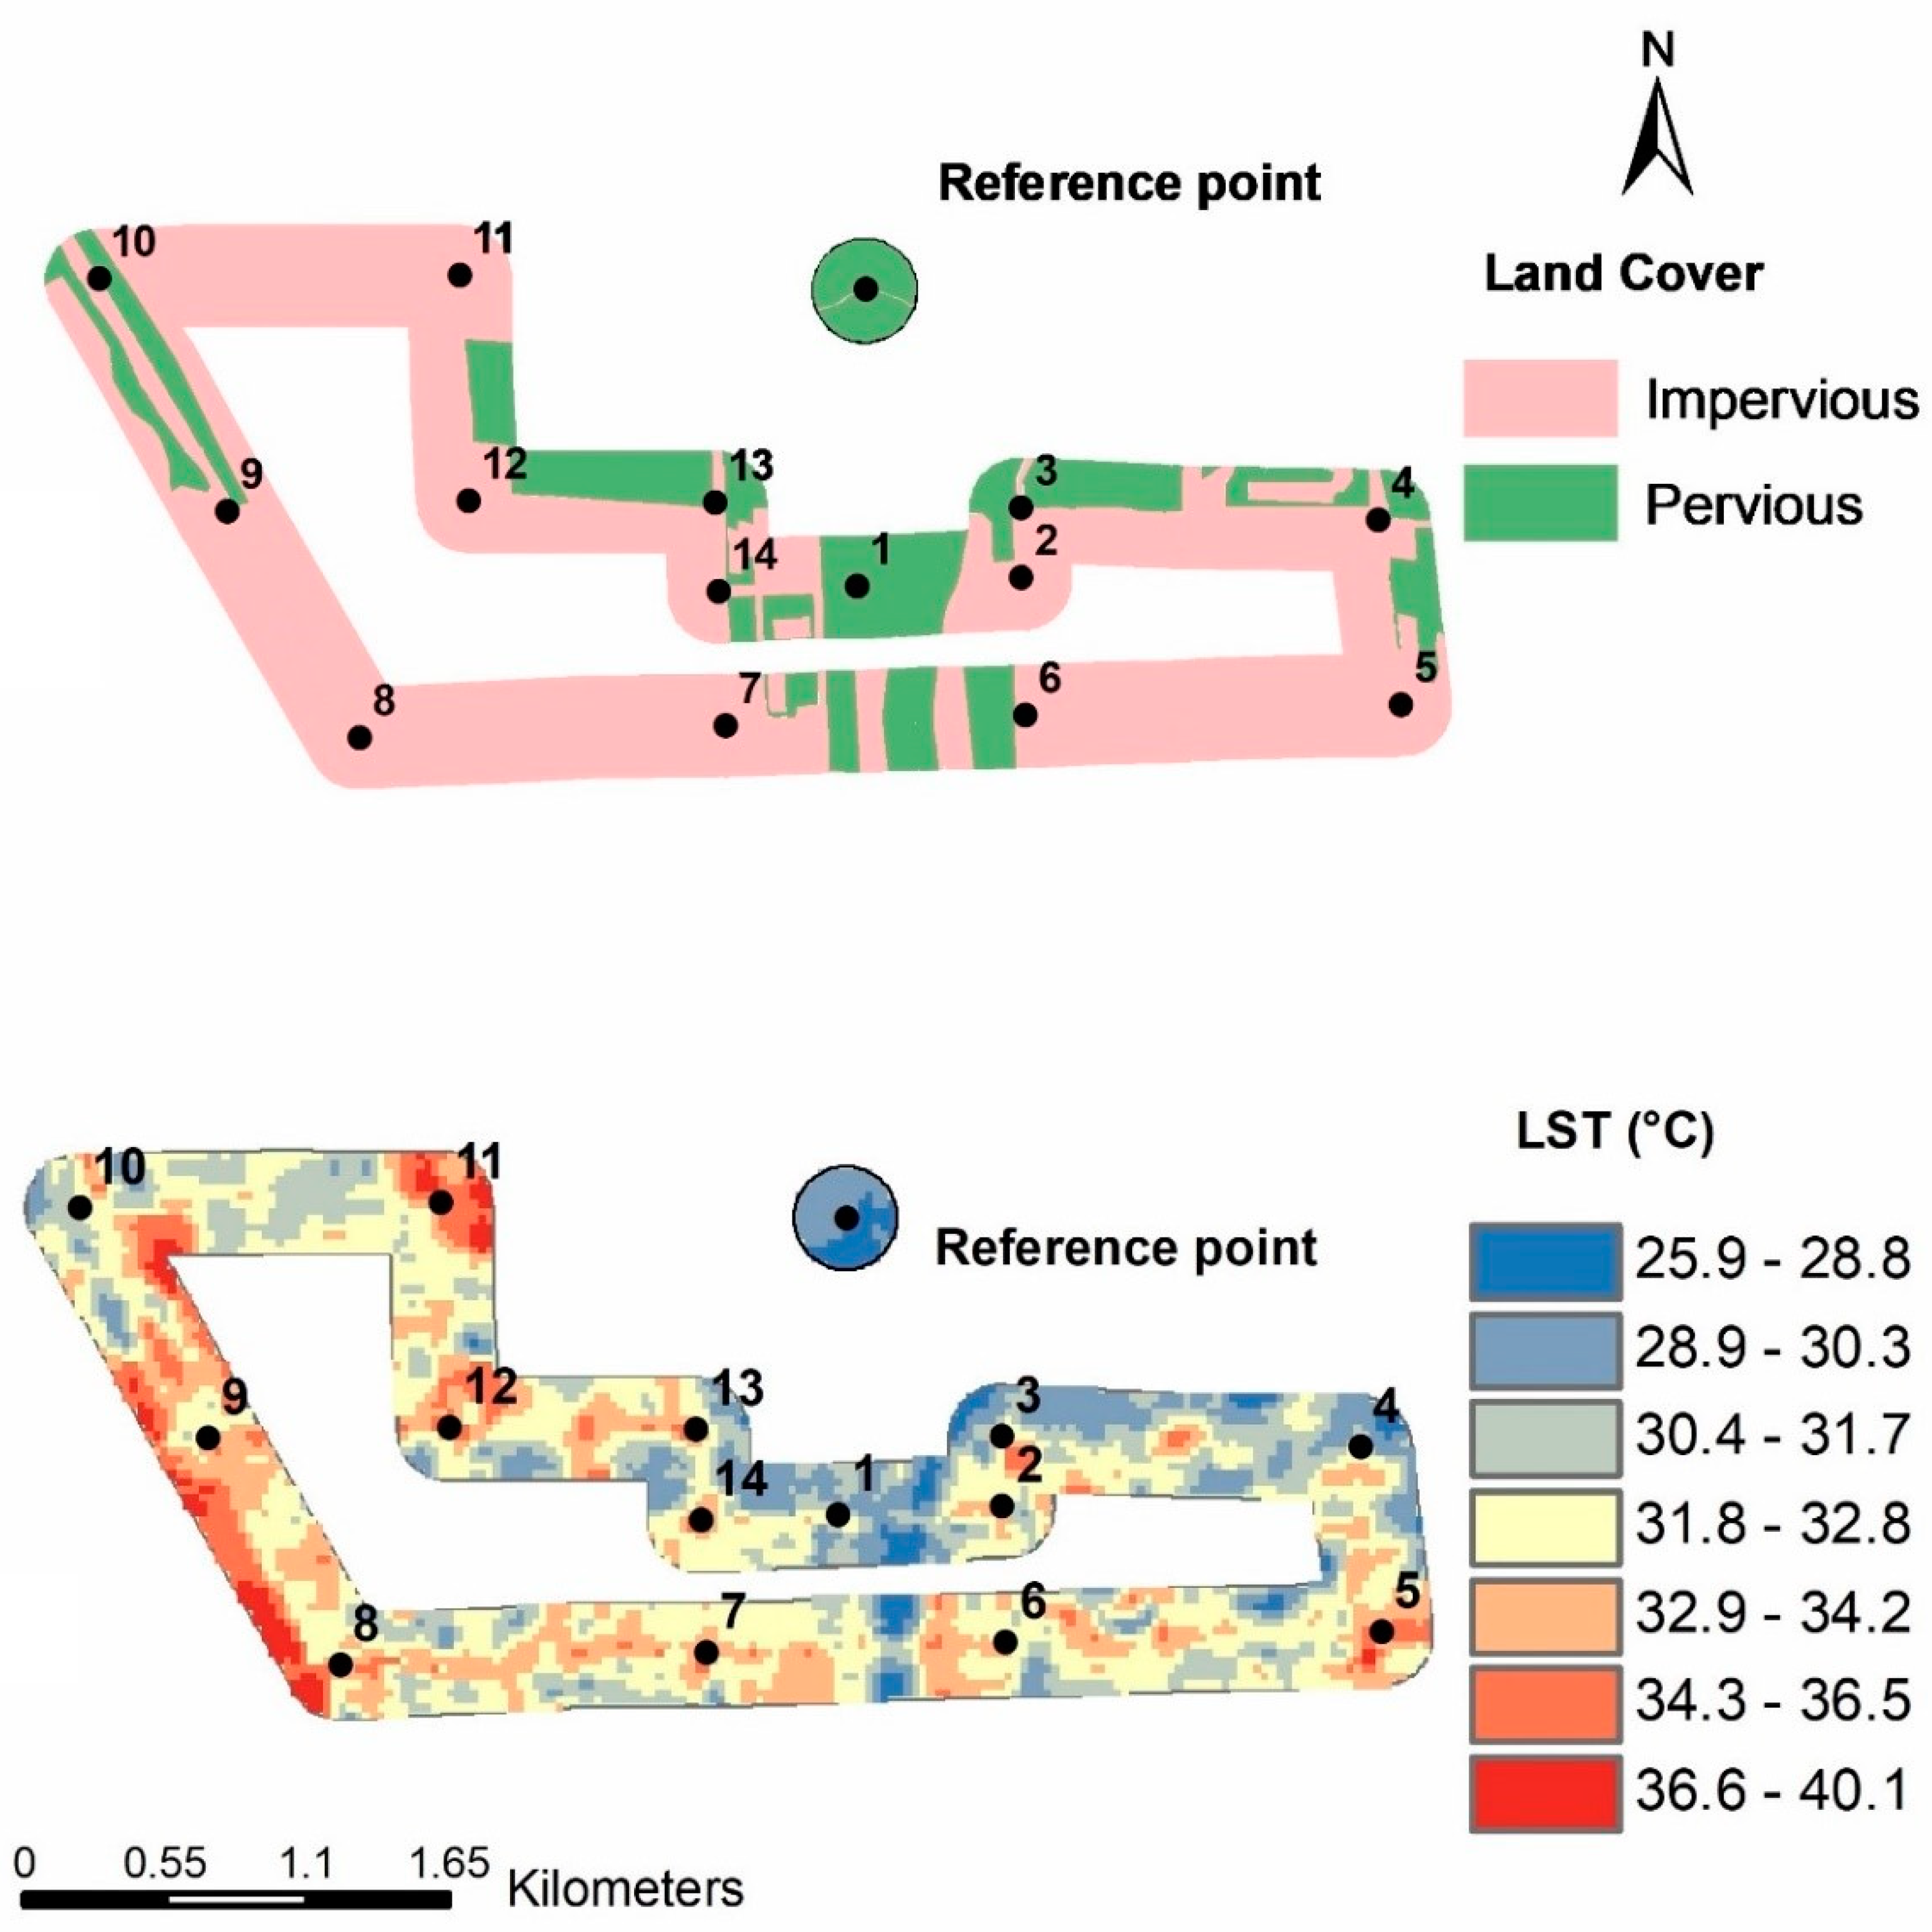
Figure 5b presents the LST profile in the study area. The Pearson correlation analysis showed that LST and air temperature are significantly positively correlated with r = 0.522 (p = 0.021, N = 15) (Table 5). The LST data showed that points 2, 3 and 4 with the LST values of 32.3, 30.8 and 31.1 °C were the coolest points, while points 8, 9 and 11 with 33.6, 33.3 and 33.9 °C presented the warmest points, which is in agreement with the coolest and warmest observed points for air temperature. Additionally, with the same trend as air temperature, the points on the edges of the park had 1.4 °C lower LST in comparison with the points far from the park’s borders. It can be implied that in Beijing, during hot, sunny and calm-wind summer days, the LST variation profile might display the same trend as the air temperature profile. However, it should be noted that the impact of land cover on surface temperature was stronger than its impact on air temperature.

Figure 5.
The land cover map (a), LST map (b) and the LST profile (c) of the measurement route within the 200-m buffer zone on 10 July 2017, 2:53 p.m. In the land cover map, “green surface” stands for urban green spaces, farmlands and water bodies, while “grey surface” stands for buildings, roads and bare land.
Table 5.
Pearson correlation analysis results between “distance to park” and “greenspace ratio” and air and surface temperature on 10 July 2017.
3.3. The Influence of Distance to Park
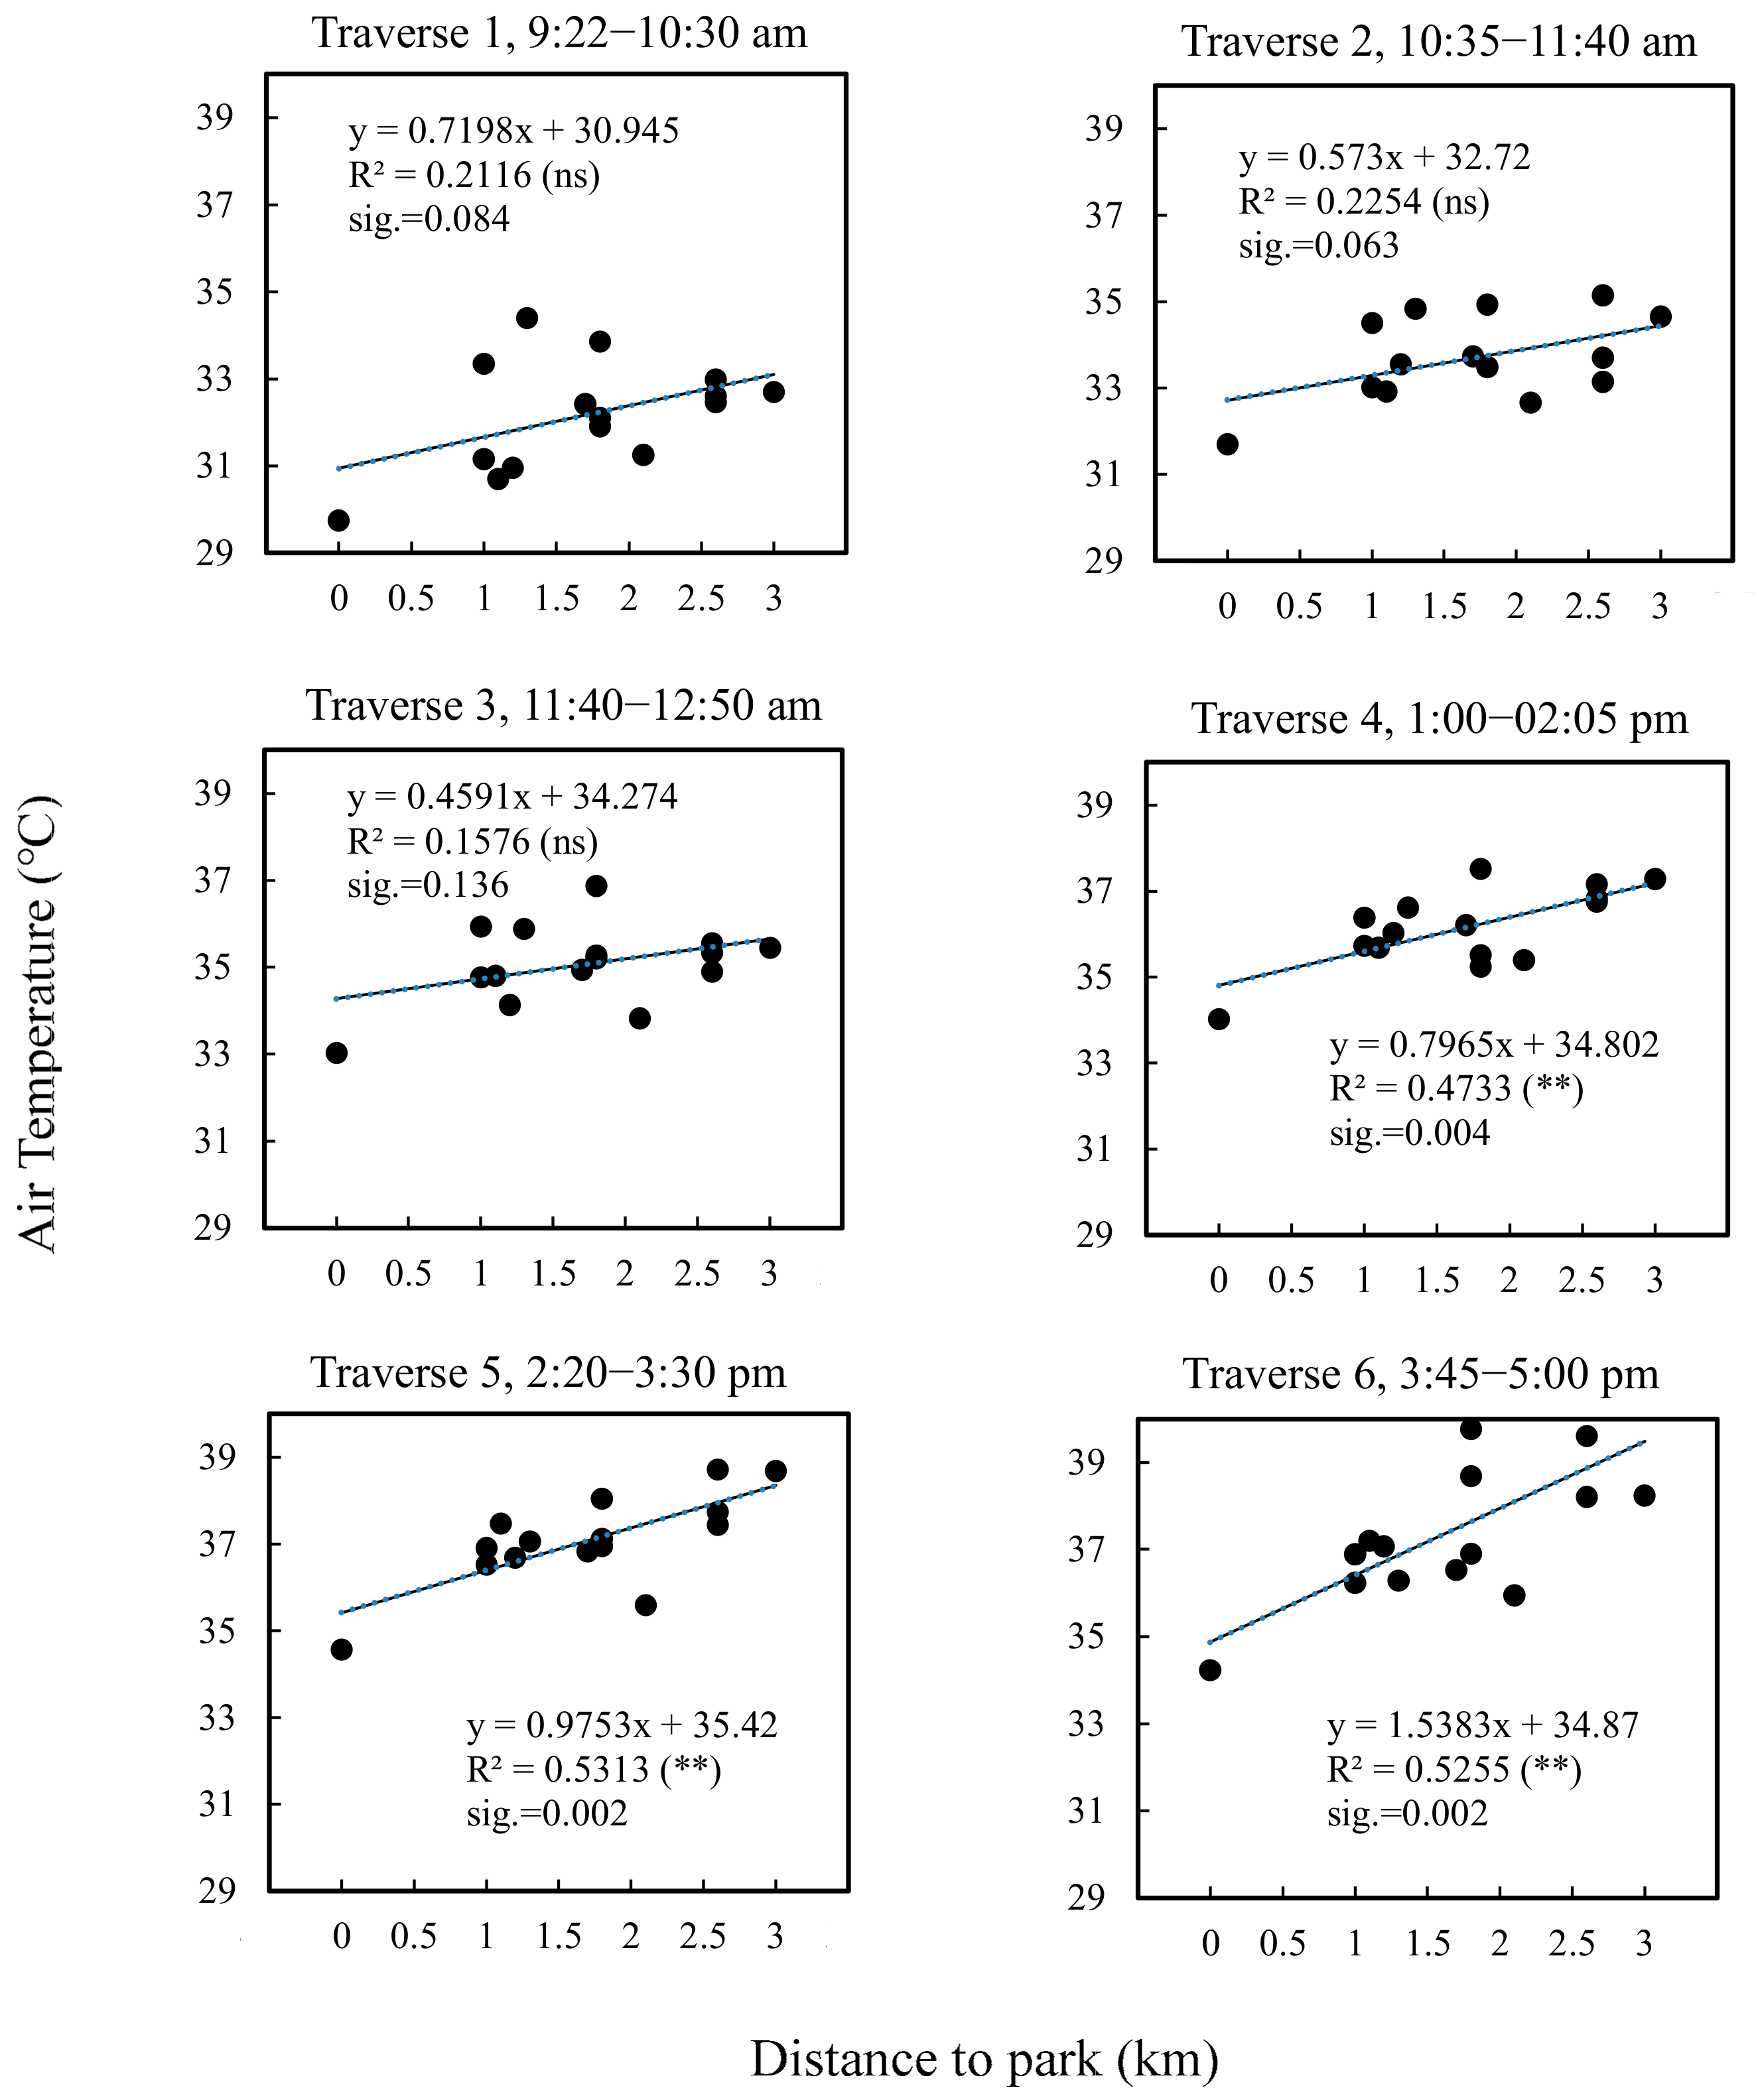
The cooling effect of the park not only lowered the mean air temperature within the park, but also influenced the temperature in the surrounding built-up areas. Figure 4a shows that the temperature in the proximity of the park exhibits an increasing trend as the distance to park borders increases. Statistically, the air temperature was significantly positively correlated with the distance (r = 0.730, p = 0.002, N = 15), and for each 1 km distance increment, the temperature increased by approximately 0.83 °C on average (Table 6). The measurement points on the edges of the park (points 1, 2, 3, 4 and 13) with an average distance of 1.1 km to the reference point at the center of park had 1.1 °C cooler temperature, 4.2% higher RH and 2.0 better thermo-physiologic comfort index than the points with an average distance of 2.4 km (5, 6, 7, 8, 9 and 10). However, further slope regression analysis showed that the correlation between unit distance and cooling intensity was more pronounced in the afternoon, during traverse 5 and 6 with an R2 of 0.53 (p = 0.002, N = 15) and 0.52 (p = 0.002, N = 15), respectively, while traverse 3, at noon, with an R2 of 0.15 (p = 0.136, N = 15) showed the weakest correlation (Figure 6). This indicates that the extension of cooling effect of the large urban park is greater in the afternoon when the day mean temperature tends to increase. In addition to air temperature data, the LST profiled the same trend and relation between distance and cooling intensity, and the points on the park’s borders were 1.4 °C cooler than the remote points. The other finding to note is that the standard deviation of air temperature values obtained from points on the park’s borders and the reference point was significantly smaller than that of the air temperature values from the remote points, indicating that the green spaces and the large urban park contribute to the stability of the thermal environment in the surrounding areas (Figure 4b).
Table 6.
Summary of simple regression analysis results for the impacts of “distance to park” and “greenspace ratio” on air temperature.
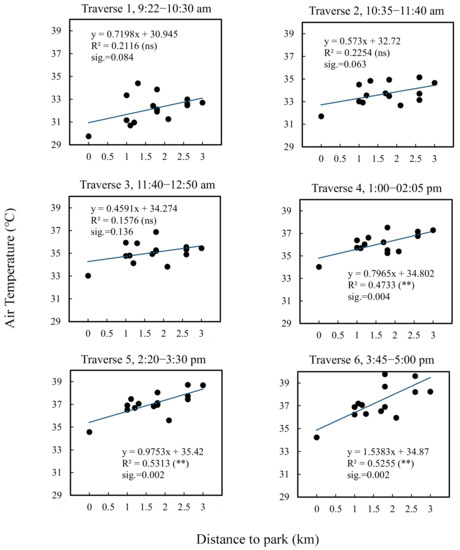
Figure 6.
The slopes of linear regressions between air temperature and distance to park for the measurement points (** p < 0.01, N = 15, sig.: 2-tailed significance, data of 10 July 2017).
The regression analysis was performed with 15 average values of air temperature of the measurement points and the reference point on 10 July 2017.
3.4. The Impact of Land Cover Features
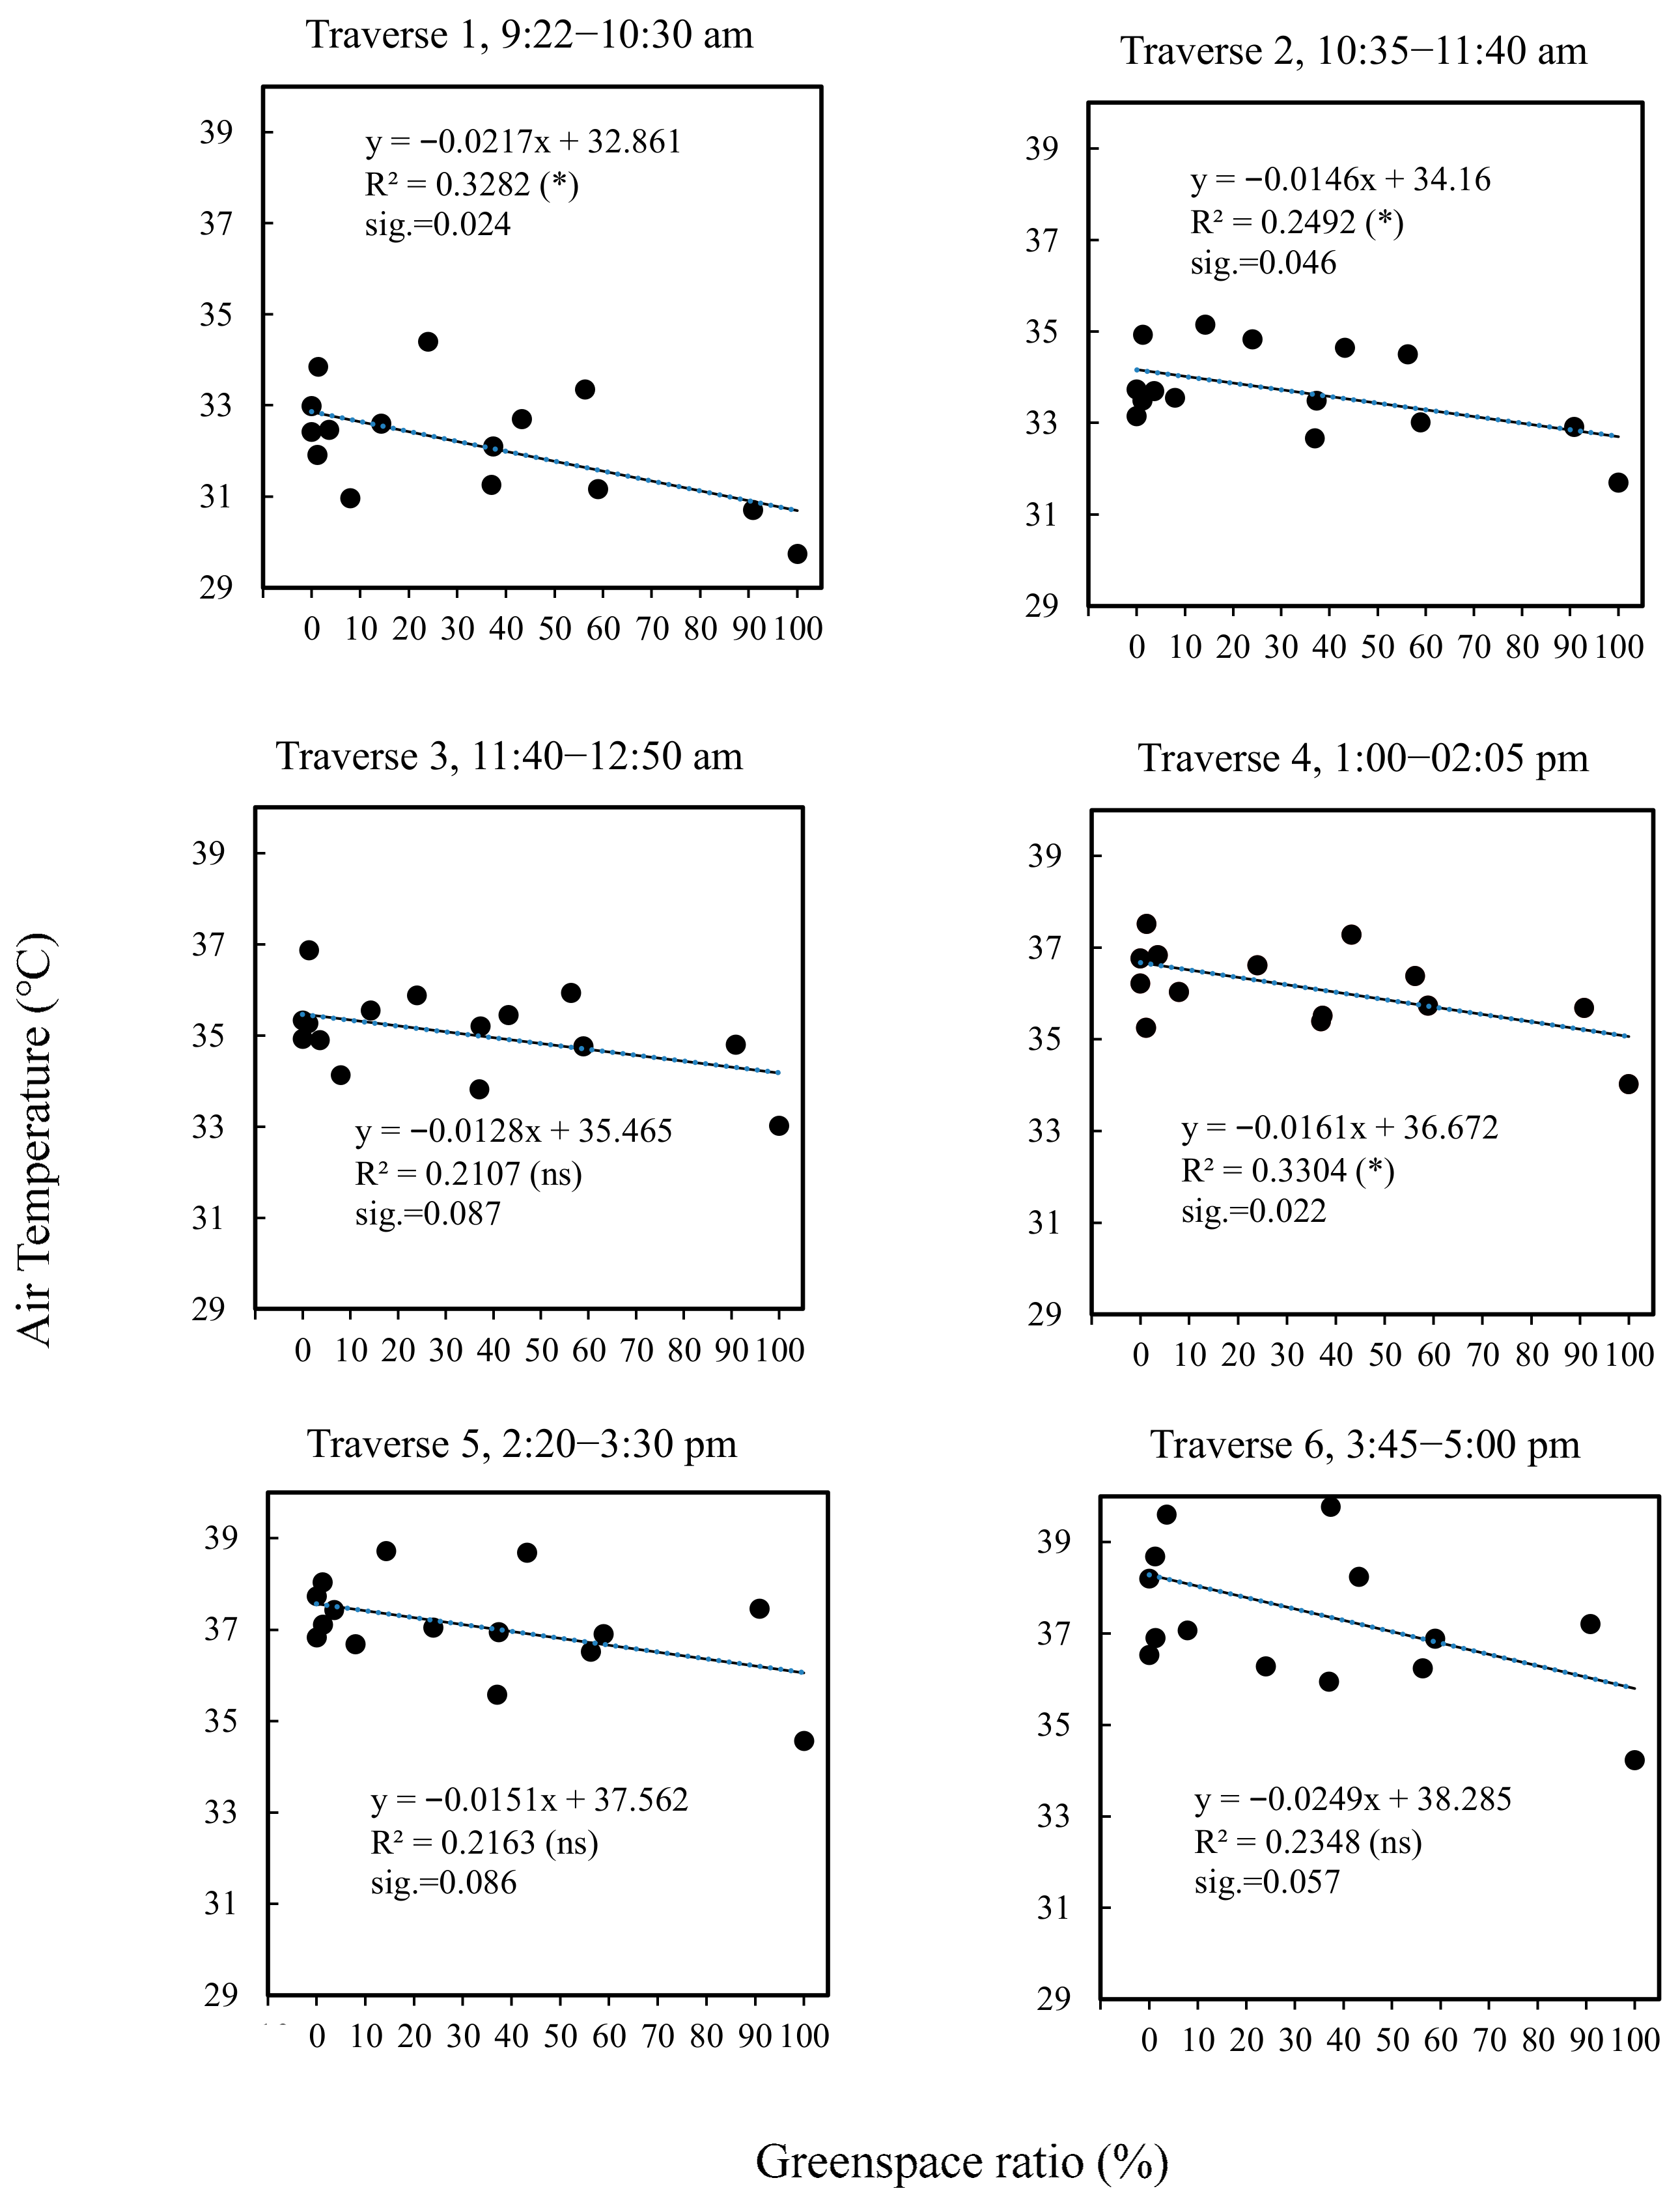
Figure 7 presents the slopes of linear regressions between air temperature and green to grey space ratio at measurement points within a buffer zone of 200 m in radius. The green space ratio exhibits a negative correlation with air temperature with r = −0.597 (p = 0.014, N = 15) on average, and when the ratio of green space increased by 10%, the temperature decreased by 0.16 °C (Table 5 and Table 6). Additionally, the points with a higher ratio of green space had higher RH and better human thermal comfort conditions. The correlation between temperature and green space ratio in the measurement points was slightly stronger in the afternoon, which was the same as the cooling intensity trend of the forest park. This indicates that the cooling function of green spaces in the study area is more pronounced in the afternoon when average temperature increases. Further analysis showed the same influence of green space ratio on LST (see Section 3.2).
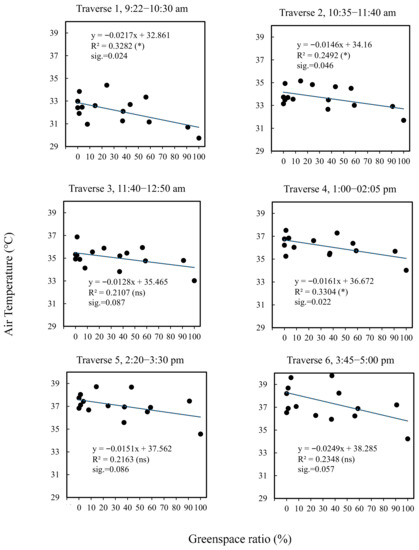
Figure 7.
The slopes of linear regressions between air temperature and green space ratio for the measurement points (* p < 0.01, N = 15, sig.: 2-tailed significance, data of 10 July 2017).
These results indicate that in the surrounding area of a large urban park, besides the effect of distance to the park, the characteristics of the urban area have an important influence on regulating the thermal environment, and that they can modify the impact of the distance to the park. For example, among the measurement points, measurement points 4 and 9 have nearly the same distance to the reference point, while they show the lowest and highest temperature, respectively. The land cover data show that point 4 has a 23% larger green coverage than point 9. Statistically, comparing the influence of distance to the park and green space ratio, the two factors considered in this study, distance to the park with an average R2 of 0.357 (p = 0.014, N = 15) had a greater influence on temperature than did the “greenspace ratio” with an R2 of 0.519 (p = 0.002, N = 15) (Table 5). However, the thermal effect of the “greenspace ratio” was more stable, as its R2 slopes varied from 0.21 (p = 0.087, N = 15) to 0.32 (p = 0.022, N = 15) during the day (Figure 7), while for “distance to park” they varied from 0.15 (p = 0.087, N = 15) to 0.53 (p = 0.002, N = 15) (Figure 6).
4. Discussion
Urban green patches have been considered as an ecological means to mitigate excess heat events because of their cooling effect, which is widely documented in different cities and regions. However, the influence of characteristics of the built environment surrounding large urban parks on microclimate conditions has not been addressed explicitly. This study observed and analyzed microclimate differences in the surrounding areas of Beijing’s Olympic Forest Park during hot summer days in relation to landscape parameters such as the distance to the park and the ratio of green to gray space, and their degree of importance. The result indicated the both parameters play a significant role in regulating the microclimate in the areas around the park and caused significant spatial differences in temperature, RH and CI. Although the impact of distance was stronger, the green space ratio could provide a more stable thermal environment; these effects were more pronounced in the afternoon than in the middle of the day and in the morning. This highlights that proper planning can improve the thermal environment of the park’s surrounding urban areas, especially during high-temperature times of the day.
4.1. Cooling Effect of the Park
The air temperature in the park was consistently lower than the entire measurement route during the different measurement periods, and the difference ranged from 1.0 °C to 3.5 °C. This finding suggests that urban parks offer great heat stress relief, especially in the afternoon when it is most required, and this should be considered in all urban development or redevelopment scenarios. Extensive studies based on field measurements have also shown that urban parks are usually 0.5–4 °C cooler than adjacent built-up urban areas [13,24,25,26,27,51,52]. However, in a similar study of the cooling effect of Olympic Forest Park in Beijing, Yan [12] found that the cooling effect of the park ranged from 0.6 to 4.8 °C, but that in certain measurement periods the temperature in the park was higher than in the surrounding area. This inconsistency in the range of cooling effect might be due to the difference in the location of measurement points and different geographical characteristics.
The intensity of the park’s cooling effect was different at different times during the day. At noon (traverse 3 and 4), the cooling effect of the park was a minimum of 2.2 °C, on average; the greatest cooling effect was observed in the afternoon, during traverse 5 and 6, with an average of 3.1 °C. A similar trend was observed in previous studies. Through field measurements and simulation modeling, Zhao [53] found that the cooling effect was significantly higher in the afternoon than in the morning. In another study by Yan et al. [39], the cooling function of a park was at its minimum value at noon. This was probably because of the stomatal closure of vegetation, which lowers the evapotranspiration function of plants at noon [54], and the solar radiation angle and consequently a lesser area of tree shade, which is a prime factor in the cooling effect of trees [55].
4.2. Effect of Distance on Microclimate in the Area Surrounding the Park
The cooling effect of urban greenery not only lowers the temperature in the green patches, but it can also extend to the surrounding area and thus generate a better overall thermal comfort. However, our results show that the measurement points with lesser distance to the park were cooler. We found that, on average, the temperature tends to increase by approximately 0.8 °C for every 1 km increase in distance. Huang et al. [56] reported a 0.4 °C/km air temperature reduction in Nanjing, China; also, a surface temperature drop of 0.15 °C/km in Beijing, China [42] and 3.89 °C/km in Delhi, India [57] has been observed. Different values of temperature reduction gradient might be related to using different measuring methods, climate background and the category of temperature [58]. However, this basic pattern is supported by others, although with different interpretations. Hamada and Ohta [34] studied an urban park in Japan with an area of 147 ha and suggested that the cooling impact of the park can extend for several hundred meters. According to [35], the cooling impact extends into the surrounding area with a distance comparable to the length of the park. Consistent with that finding, [14,23] suggest that the cooling range is linked to the size of the park. As seen in the regression analysis, the influence of distance on temperature was stronger in the afternoon (traverses 5 and 6) than in the middle of the day and in the morning. This could be because of the greater temperature difference between the park and the surrounding area in the afternoon, which is conducive to the diffusion of the park’s cooling effect into the surrounding built environment [12]. Our results underscore the importance of lowering the distance to urban parks or constructing more urban parks.
4.3. Effect of Land Cover
The environmental characteristics of the areas around large urban parks can also affect the microclimate conditions in these areas. In our experiment, we found that when the green space ratio increased by 10% in the measurement points, the temperature decreased by about 0.16 °C. This is consistent with a recent study that found that per 10% increase in vegetated area, the daytime air temperature decreased by 0.05–0.15 °C [39]. Zhao [14] suggested that the ratio of green space to grey space (green space ratio) in the total unit area is the most significant indicator for alleviating high-temperature events in Beijing. This process relates to how green space vegetation affects air temperature through evapotranspiration and shading [59]. Vegetation can portion solar radiation into latent heat rather than sensible heat [60]. The shadow provided by trees and shrubs also can generate a cooling effect on their immediate surrounding area [8,51,61,62]. Another Chinese study shows that the size of a green patch and the percentage of water area are prime factors for maximizing the cooling effect of green spaces [63,64]. In contrast, evidence supports that an increase in the percentage of grey area (buildings, roads, etc.) leads to the partition of solar radiation into sensible heat [65,66], an increase in air temperature [67] and a decrease in human thermal comfort [65]. Furthermore, an increase in the area covered by buildings and roads is associated with higher levels of anthropogenic heat use for space heating, industrial activities and automobile and engine vehicle use [20]. We also found that, like the influence of distance, the ratio of green space shows a greater influence on the microclimate in the afternoon, probably because the temperature difference between green covers and grey covers is at the highest level in the afternoon, and the cooling function of greeneries is more pronounced.
The standard deviation of the temperature values from our points on the parks’ borders, like at the points with a higher ratio of green space, was significantly smaller than at other points. This is consistent with the findings of a recent study in Shenzhen, China, which showed that greater vegetation coverage could significantly reduce air temperature fluctuations and maintain a stable thermal environment for the dwellers [39]. These results suggest that an even distribution of small green spaces in the proximity of urban parks is an efficient way to improve the thermal environment, and confirm the importance of balancing the green space ratio in the built environment of cities through reasonable planning to obtain maximum thermal comfort for citizens. This also contributes to environmental justice for people by providing access to green space close to their homes [68].
4.4. LST
We enabled air temperature to give us a complete picture of the study area’s thermal conditions by combining satellite data on surface temperatures with data from our field measurements. We found agreement in variation trends between surface temperature and air temperature among our measurement points, and the surface temperature exhibited the same relation with the distance to the park and green space ratio. Other studies have also reported a close relationship and similar spatial patterns among surface and air temperatures in urban areas [69,70]. Although there is also evidence of non-significant correlation between these two parameters [71], due possibly to specific local characteristics such as wind, area geometry and experimental design [72], we can conclude that under study conditions and climates similar to those of our study, LST is correlated with air temperature, and it can be considered a helpful source for studying urban climate, especially when there are limitations on conducting field measurements.
4.5. Planning Implementation of the Study
There has been an increasing interest in applying the theories of urban ecology to scientific urban planning [13,14,73]. The results of this study provide suggestions for practical use to optimize microclimate in the built areas around large urban parks.
- (1)
- Lower the distance to urban parks or construct more urban parks.
The result showed that air and surface temperature in the areas around the urban park decrease with decreasing distance to the park. So, we encourage the construction of more parks in urban built areas or the construction of buildings near parks, which will lead to the thermal comfort of citizens and savings on cooling energy usage.
- (2)
- Balance the distribution of green space and increase the ratio of green space to grey space in urban built areas.
The ratio of green to grey space is negatively correlated with air and surface temperature. It is an important factor in regulating the microclimate and providing a stable thermal environment in built areas. Even the distribution of small green patches such as neighborhood-scale parks, roadside greeneries and rooftop gardens can be an effective measure to alleviate the excess urban heat in cities, particularly in dense urban areas such as Beijing. It also contributes to environmental justice with many people having access to green spaces near to their homes.
- (3)
- Pay attention to the ecological function of urban green space.
Urban green spaces can be viewed as an ecological measure to mitigate UHI through the cooling effect. Therefore, constructing and designing urban green space should not be confined to aesthetic values but should highlight their ecological services. Additionally, stakeholders should promote urban green space protection policies.
4.6. Limitations
Despite the positive results, this study presents several limitations. It was conducted in Beijing, China with a humid-continental climate. The findings may not be applicable to different climate conditions. Additionally, land cover types were classified into two classes, while the effect of different features in the same land cover class was not considered. For example, all woody plants, grasses and other types of greeneries were considered as green space without differentiating the effect of plant species. In addition, we only collected summer daytime temperature, while seasonal and nighttime data are also necessary to comprehensively understand the mechanism of the cooling effect of urban green space. The study was conducted on days with a low wind speed of 3 m/s on average. However, the temperature measurements in the study area are likely to be slightly impacted due to the dominant NE wind direction. Additionally, micro-scale landscape features in urban areas are distinctly heterogeneous; we admit there are more factors that can influence thermal conditions in surrounding areas of large urban parks such as planting design, urban structure, urban geometry, road orientations, traffic, anthropogenic activities, building layout and weather conditions, and this might be the reason for the relatively low R2 values in this study. In addition, the co-effect and interactions of the distance to the park and the ratio of green space in measurement points were not addressed in this paper. The approach in this study can be improved in the future by studying the effect of these factors, and by incorporating vegetation characteristic differences.
5. Conclusions
This study has shown the strong heterogeneity of temperature in proximity to built environments around a park, and has suggested that both the green space ratio and the distance to the park in these areas are important factors for determining air and surface temperature and thermal comfort in these areas, especially in the afternoon on days when the average daily temperature is at its highest level. The impact of distance on temperature is strong; however, a higher ratio of green space to grey space contributes to a more stable thermal environment. The results suggest that for an urban park to offer thermal comfort in the adjacent built environment, the distance to the park must be relatively short. By distributing parks evenly throughout the urban area, their impact would be more widespread. Human comfort would be increased with an increased ratio of green space to gray space and with attention paid to the ecological function of the green space. This study highlights that reasonable planning of built areas outside urban parks contributes to the better utilization of parks, microclimate and people’s thermal comfort.
Author Contributions
Research design and methodology, M.A.-B., B.Z. and G.-D.X.; original draft preparation, M.A.-B., B.Z. and G.-D.X.; validation, G.-D.X., A.J.O. and B.Z.; analysis, M.A.-B. and B.Z.; writing—review and editing, M.A.-B. and A.J.O.; All authors have read and agreed to the published version of the manuscript.
Funding
This research was funded by the National Key Research and Development Plan, grant number 2016YFC0503403 and 2016YFC0503706; The Strategic Priority Research Program of Chinese Academy of Sciences, grant number XDA2002040203; Fundamental Research Funds for the Central Universities of China, grant number 2682019CX77; and Interdisciplinary Research Projects of Southwest Jiaotong University (No. 2682021ZTPY085).
Institutional Review Board Statement
Not applicable.
Informed Consent Statement
Not applicable.
Conflicts of Interest
The authors declare that there is no conflict of interest.
References
- Simonds, J.O. Landscape Architecture: A Manual of Site Planning and Design; McGraw-Hill Professional: New York, NY, USA, 2007. [Google Scholar]
- World’s Population Increasingly Urban with More Than Half Living in Urban Areas | UN DESA | United Nations Department of Economic and Social Affairs. Available online: https://www.un.org/en/development/desa/news/population/world-urbanization-prospects-2014.html (accessed on 18 November 2021).
- Kalnay, E.; Cai, M.; Midi-pyre, C. Impact of urbanization and land-use change on climate. Nature 2003, 423, 528–531. [Google Scholar] [CrossRef]
- Oke, T.R. The energetic basis of the urban heat island. Q. J. R. Meteorol. Soc. 1982, 108, 1–24. [Google Scholar] [CrossRef]
- Cao, J.; Zhou, W.; Zheng, Z.; Ren, T.; Wang, W. Within-city spatial and temporal heterogeneity of air temperature and its relationship with land surface temperature. Landsc. Urban Plan. 2021, 206, 103979. [Google Scholar] [CrossRef]
- Li, X.; Zhou, W. Optimizing urban greenspace spatial pattern to mitigate urban heat island effects: Extending understanding from local to the city scale. Urban For. Urban Green. 2019, 41, 255–263. [Google Scholar] [CrossRef]
- Wan, K.K.W.W.; Li, D.H.W.W.; Pan, W.; Lam, C.J. Impact of climate change on building energy use in different climate zones and mitigation and adaptation implications. Appl. Energy 2012, 97, 274–282. [Google Scholar] [CrossRef]
- Zhang, B.; Xie, G.D.; Gao, J.X.; Yang, Y. The cooling effect of urban green spaces as a contribution to energy-saving and emission-reduction: A case study in Beijing, China. Build. Environ. 2014, 76, 37–43. [Google Scholar] [CrossRef]
- Taha, H.; Akbari, H.; Rosenfeld, A. Heat island and oasis effects of vegetative canopies: Micro-meteorological field-measurements. Theor. Appl. Climatol. 1991, 44, 123–138. [Google Scholar] [CrossRef] [Green Version]
- Lee, L.S.H.; Jim, C.Y. Urban woodland on intensive green roof improved outdoor thermal comfort in subtropical summer. Int. J. Biometeorol. 2019, 63, 895–909. [Google Scholar] [CrossRef]
- Méndez-Lázaro, P.A.; Pérez-Cardona, C.M.; Rodríguez, E.; Martínez, O.; Taboas, M.; Bocanegra, A.; Méndez-Tejeda, R. Climate change, heat, and mortality in the tropical urban area of San Juan, Puerto Rico. Int. J. Biometeorol. 2018, 62, 699–707. [Google Scholar] [CrossRef] [PubMed]
- Yan, H.; Wu, F.; Dong, L. Influence of a large urban park on the local urban thermal environment. Sci. Total Environ. 2018, 622–623, 882–891. [Google Scholar] [CrossRef]
- Bowler, D.E.; Buyung-Ali, L.; Knight, T.M.; Pullin, A.S. Urban greening to cool towns and cities: A systematic review of the empirical evidence. Landsc. Urban Plan. 2010, 97, 147–155. [Google Scholar] [CrossRef]
- Zhao, C.; Fu, G.; Liu, X.; Fu, F. Urban planning indicators, morphology and climate indicators: A case study for a north-south transect of Beijing, China. Build. Environ. 2011, 46, 1174–1183. [Google Scholar] [CrossRef]
- Deletic, A. Sediment transport in urban runoff over grassed areas. J. Hydrol. 2005, 301, 108–122. [Google Scholar] [CrossRef]
- Zhang, B.; Xie, G.D.; Li, N.; Wang, S. Effect of urban green space changes on the role of rainwater runoff reduction in Beijing, China. Landsc. Urban Plan. 2015, 140, 8–16. [Google Scholar] [CrossRef]
- Kabisch, N. Ecosystem service implementation and governance challenges in urban green space planning-The case of Berlin, Germany. Land Use Policy 2015, 42, 557–567. [Google Scholar] [CrossRef]
- Xue, F.; Gou, Z.; Siu, S.; Lau, Y. Green open space in high-dense Asian cities: Site configurations, microclimates and users’ perceptions. Sustain. Cities Soc. 2017, 34, 114–125. [Google Scholar] [CrossRef]
- Niemelä, J. Ecology of urban green spaces: The way forward in answering major research questions. Landsc. Urban Plan. 2014, 125, 298–303. [Google Scholar] [CrossRef]
- Akbari, H.; Pomerantz, M.; Taha, H. Cool surfaces and shade trees to reduce energy use and improve air quality in urban areas. Sol. Energy 2001, 70, 295–310. [Google Scholar] [CrossRef]
- Wang, Y.; Berardi, U.; Wang, Y.; Berardi, U.; Akbari, H. The Urban Heat Island Effect in the City of Toronto The Urban Heat Island effect in the city of Toronto. Procedia Eng. 2015, 118, 137–144. [Google Scholar] [CrossRef] [Green Version]
- Zhang, B.; Amani-Beni, M.; Shi, Y.; Xie, G.-D. The summer microclimate of green spaces in Beijing’ Olympic park and their effects on human comfort index. Ecol. Sci. 2018, 37, 77–86. (In Chinese) [Google Scholar] [CrossRef]
- Oke, T.R.; Crowther, J.M.; Mcnaughton, K.G.; Monteith, J.L.; Gardiner, B. The Micrometeorology of the Urban Forest. Phil. Trans. R. Soc. Lond. B 1989, 335–349. [Google Scholar] [CrossRef]
- Jauregui, E. Influence of a large urban park on temperature and convective precipitation in a tropical city. Energy Build. 1990, 15, 457–463. [Google Scholar] [CrossRef]
- Ca, V.T.; Asaeda, T.; Abu, E.M.; Mohamad, E.; Abu, E.M.; Mohamad, E. Reductions in air conditioning energy caused by a nearby park. Energy Build. 1998, 29, 83–92. [Google Scholar] [CrossRef]
- Skoulika, F.; Santamouris, M.; Kolokotsa, D.; Boemi, N. On the thermal characteristics and the mitigation potential of a medium size urban park in Athens, Greece. Landsc. Urban Plan. 2014, 123, 73–86. [Google Scholar] [CrossRef]
- Jamei, E.; Rajagopalan, P.; Seyedmahmoudian, M.; Jamei, Y. Review on the impact of urban geometry and pedestrian level greening on outdoor thermal comfort. Renew. Sustain. Energy Rev. 2016, 54, 1002–1017. [Google Scholar] [CrossRef]
- Spronken-Smith, R.; Oke, T. The thermal regime of urban parks in two cities with different summer climates. Int. J. Remote Sens. 1998, 19, 2085–2104. [Google Scholar] [CrossRef]
- Oliveira, S.; Andrade, H.; Vaz, T. The cooling effect of green spaces as a contribution to the mitigation of urban heat: A case study in Lisbon. Build. Environ. 2011, 46, 2186–2194. [Google Scholar] [CrossRef]
- Upmanis, H.; Eliasson, I.; Lindqvist, S. The influence of green areas on nocturnal temperatures in a high latitude city (Göteborg, Sweden). Int. J. Climatol. 1998, 18, 681–700. [Google Scholar] [CrossRef]
- Qiu, K.; Jia, B. The roles of landscape both inside the park and the surroundings in park cooling effect. Sustain. Cities Soc. 2020, 52, 101864. [Google Scholar] [CrossRef]
- Anjos, M.; Lopes, A. Urban Heat Island and Park Cool Island intensities in the coastal city of Aracaju, North-Eastern Brazil. Sustainability 2017, 9, 1379. [Google Scholar] [CrossRef] [Green Version]
- Xiao, X.D.; Dong, L.; Yan, H.; Yang, N.; Xiong, Y. The influence of the spatial characteristics of urban green space on the urban heat island effect in Suzhou Industrial Park. Sustain. Cities Soc. 2018, 40, 428–439. [Google Scholar] [CrossRef]
- Hamada, S.; Ohta, T. Seasonal variations in the cooling effect of urban green areas on surrounding urban areas. Urban For. Urban Green. 2010, 9, 15–24. [Google Scholar] [CrossRef]
- Honjo, T.; Takakura, T. Simulation of Thermal Effects of Urban reen Areas on Their Surrounding Areas. Energy Build. 1990, 16, 443–446. [Google Scholar] [CrossRef]
- Algretawee, H.; Rayburg, S.; Neave, M. Estimating the effect of park proximity to the central of Melbourne city on Urban Heat Island (UHI) relative to Land Surface Temperature (LST). Ecol. Eng. 2019, 138, 374–390. [Google Scholar] [CrossRef]
- Algretawee, H.; Rayburg, S.; Neave, M.; Studies, S. The cooling effect of a meadium sized park on an urban environment. Int. J. GEOMATE 2016, 11, 2541–2546. [Google Scholar]
- Gunawardena, K.R.; Wells, M.J.; Kershaw, T. Utilising green and bluespace to mitigate urban heat island intensity. Sci. Total Environ. 2017, 584–585, 1040–1055. [Google Scholar] [CrossRef] [PubMed]
- Yan, C.; Guo, Q.; Li, H.; Li, L.; Qiu, G.Y. Quantifying the cooling effect of urban vegetation by mobile traverse method: A local-scale urban heat island study in a subtropical megacity. Build. Environ. 2020, 169, 106541. [Google Scholar] [CrossRef]
- Debbage, N.; Shepherd, J.M. The urban heat island effect and city contiguity. Comput. Environ. Urban Syst. 2015, 54, 181–194. [Google Scholar] [CrossRef]
- Yu, C.; Hien, W.N. Thermal benefits of city parks. Energy Build. 2006, 38, 105–120. [Google Scholar] [CrossRef]
- Amani-Beni, M.; Zhang, B.; Xie, G.-D.; Shi, Y. Impacts of urban green landscape patterns on land surface temperature: Evidence from the adjacent area of Olympic Forest Park of Beijing, China. Sustainability 2019, 11, 513. [Google Scholar] [CrossRef] [Green Version]
- Beijing Municipal Bureau of Statistics. Beijing Statistical Yearbook 2018; Beijing Municipal Bureau of Statistics: Beijing, China, 2018.
- Yang, P.; Ren, G.; Hou, W.; Liu, W. Spatial and diurnal characteristics of summer rainfall over Beijing Municipality based on a high-density AWS dataset. Int. J. Climatol. 2013, 33, 2769–2780. [Google Scholar] [CrossRef]
- Zhang, B. Urban Green Spaces and Their Key Eco-Services in Beijing; China Environmental Science Press: Beijing, China, 2016. [Google Scholar]
- Yokobori, T.; Ohta, S.; Res, C.; Yokobori, T.; Ohta, S. Effect of land cover on air temperatures involved in the development of an intra-urban heat island. Clim. Res. 2009, 39, 61–73. [Google Scholar] [CrossRef]
- Costa, A.; Araújo, V. A methodology to study the urban distribution of air temperature in fixed points. In Proceedings of the 2nd PALENC Conference and 28th AIVC Conference on Building Low Energy Cooling and Advanced Ventilation Technologies in the 21st Century, Crete, Greece, 27–29 September 2007; Volume 1, pp. 227–230. [Google Scholar]
- Asgarian, A.; Amiri, B.J.; Sakieh, Y. Assessing the effect of green cover spatial patterns on urban land surface temperature using landscape metrics approach. Urban Ecosyst. 2015, 18, 209–222. [Google Scholar] [CrossRef]
- Chander, G.; Markham, B.L.; Helder, D.L. Summary of current radiometric calibration coefficients for Landsat MSS, TM, ETM+, and EO-1 ALI sensors. Remote Sens. Environ. 2009, 113, 893–903. [Google Scholar] [CrossRef]
- Xu, X.; Li, X.; Meng, D. Impacts of Beijing different underlying surfaces on urban heat island effect and human comfort. J. Cap. Univ. Natural Sci. Ed. 2013, 34, 47–52, 76. (In Chinese) [Google Scholar]
- Amani-Beni, M.; Zhang, B.; Xie, G.D.; Xu, J. Impact of urban park’s tree, grass and waterbody on microclimate in hot summer days: A case study of Olympic Park in Beijing, China. Urban For. Urban Green. 2018, 32, 1–6. [Google Scholar] [CrossRef]
- Sailor, D.J.; Bass, B. Development and features of the Green Roof Energy Calculator (GREC). J. Living Archit. 2014, 1, 36–58. [Google Scholar] [CrossRef]
- Zhao, Q.; Sailor, D.J.; Wentz, E.A. Impact of tree locations and arrangements on outdoor microclimates and human thermal comfort in an urban residential environment. Urban For. Urban Green. 2018, 32, 81–91. [Google Scholar] [CrossRef] [Green Version]
- Bar-Tsur, A.; Rudich, J.; Bravdo, B. Photosynthesis, transpiration and stomatal resistance to gas exchange in tomato plants under high temperatures. J. Hortic. Sci. 1985, 60, 405–410. [Google Scholar] [CrossRef]
- Kong, F.; Yan, W.; Zheng, G.; Yin, H.; Cavan, G.; Zhan, W.; Zhang, N.; Cheng, L. Retrieval of three-dimensional tree canopy and shade using terrestrial laser scanning (TLS) data to analyze the cooling effect of vegetation. Agric. For. Meteorol. 2016, 217, 22–34. [Google Scholar] [CrossRef]
- Huang, L.; Zhao, D.; Wang, J.; Zhu, J.; Li, J. Scale impacts of land cover and vegetation corridors on urban thermal behavior in Nanjing, China. Theor. Appl. Climatol. 2008, 94, 241–257. [Google Scholar] [CrossRef]
- Pramanik, S.; Punia, M. Assessment of green space cooling effects in dense urban landscape: A case study of Delhi, India. Model. Earth Syst. Environ. 2019, 5, 867–884. [Google Scholar] [CrossRef]
- Sodoudi, S.; Shahmohamadi, P.; Vollack, K.; Cubasch, U.; Che-Ani, A.I. Mitigating the Urban Heat Island Effect in Megacity Tehran. Adv. Meteorol. 2014, 2014, 547974. [Google Scholar] [CrossRef]
- Tan, Z.; Lau, K.K.; Ng, E. Urban tree design approaches for mitigating daytime urban heat island effects in a high-density urban environment. Energy Build. 2016, 114, 265–274. [Google Scholar] [CrossRef]
- Kubota, T.; Lee, H.S.; Trihamdani, A.R.; Phuong, T.T.T.; Tanaka, T.; Matsuo, K. Impacts of land use changes from the Hanoi Master Plan 2030 on urban heat islands: Part 1. Cooling effects of proposed green strategies. Sustain. Cities Soc. 2017, 32, 295–317. [Google Scholar] [CrossRef]
- Vasilikou, C.; Nikolopoulou, M. Outdoor thermal comfort for pedestrians in movement: Thermal walks in complex urban morphology. Int. J. Biometeorol. 2020, 64, 277–291. [Google Scholar] [CrossRef] [Green Version]
- Amani-Beni, M.; Zhang, B.; Xie, G.; Yunting, S. Spatial temporal changes of urban green spaces in relation to land surface temperature/a case study from Beijing, China. In Proceedings of the 55th International Federation of Landscape Architecture (IFLA) World Congress, Singapore, 18–19 July 2018. [Google Scholar]
- Yang, C.; He, X.; Yu, L.; Yang, J.; Yan, F.; Bu, K.; Chang, L.; Zhang, S. The cooling effect of urban parks and its monthly variations in a snow climate city. Remote Sens. 2017, 9, 1066. [Google Scholar] [CrossRef] [Green Version]
- Lehnert, M.; Tokar, V.; Jurek, M.; Geletič, J. Summer thermal comfort in Czech cities: Measured effects of blue and green features in city centres. Int. J. Biometeorol. 2021, 65, 1277–1289. [Google Scholar] [CrossRef]
- Ling, A.; Kevin, K.; Chao, K.L.; Yang, Y. Regulation of Outdoor Thermal Comfort by Trees in Hong Kong. Sustain. Cities Soc. 2017, 31, 12–25. [Google Scholar] [CrossRef]
- Antoniadis, D.; Katsoulas, N.; Kittas, C. Simulation of schoolyard’s microclimate and human thermal comfort under Mediterranean climate conditions: Effects of trees and green structures. Int. J. Biometeorol. 2018, 62, 2025–2036. [Google Scholar] [CrossRef]
- Wang, Y.; Berardi, U.; Akbari, H. Comparing the effects of urban heat island mitigation strategies for Toronto, Canada. Energy Build. 2016, 114, 2–19. [Google Scholar] [CrossRef]
- Jaganmohan, M.; Knapp, S.; Buchmann, C.M.; Schwarz, N. The Bigger, the Better? The Influence of Urban Green Space Design on Cooling Effects for Residential Areas. J. Environ. Qual. 2016, 45, 134–145. [Google Scholar] [CrossRef]
- Ben-Dor, E.; Saaroni, H. Airborne video thermal radiometry as a tool for monitoring microscale structures of the urban heat island. Int. J. Remote Sens. 1997, 18, 3039–3053. [Google Scholar] [CrossRef]
- Nichol, J.E.; Yee, W.; Lam, K.; Sing, M. Urban heat island diagnosis using ASTER satellite images and ‘ in situ ’ air temperature. Atmos. Res. 2009, 94, 276–284. [Google Scholar] [CrossRef]
- Arnfield, A.J. Two decades of urban climate research: A review of turbulence, exchanges of energy and water, and the urban heat island. Int. J. Climatol. 2003, 26, 1–26. [Google Scholar] [CrossRef]
- Offerle, B.; Eliasson, I.; Grimmond, C.S.B.; Holmer, B. Surface heating in relation to air temperature, wind and turbulence in an urban street canyon. Bound.-Layer Meteorol. 2007, 122, 273–292. [Google Scholar] [CrossRef]
- Zhou, W.; Wang, J.; Cadenasso, M.L. Effects of the spatial configuration of trees on urban heat mitigation: A comparative study. Remote Sens. Environ. 2017, 195, 1–12. [Google Scholar] [CrossRef]
Publisher’s Note: MDPI stays neutral with regard to jurisdictional claims in published maps and institutional affiliations. |
© 2021 by the authors. Licensee MDPI, Basel, Switzerland. This article is an open access article distributed under the terms and conditions of the Creative Commons Attribution (CC BY) license (https://creativecommons.org/licenses/by/4.0/).