Uncertainty Introduced by Darkening Agents in the Lunar Regolith: An Unmixing Perspective
Abstract
:1. Introduction
2. Methods
2.1. Radiative Transfer Models
2.1.1. Hapke Model
2.1.2. Forward Mixing Model
2.1.3. Space Weathering
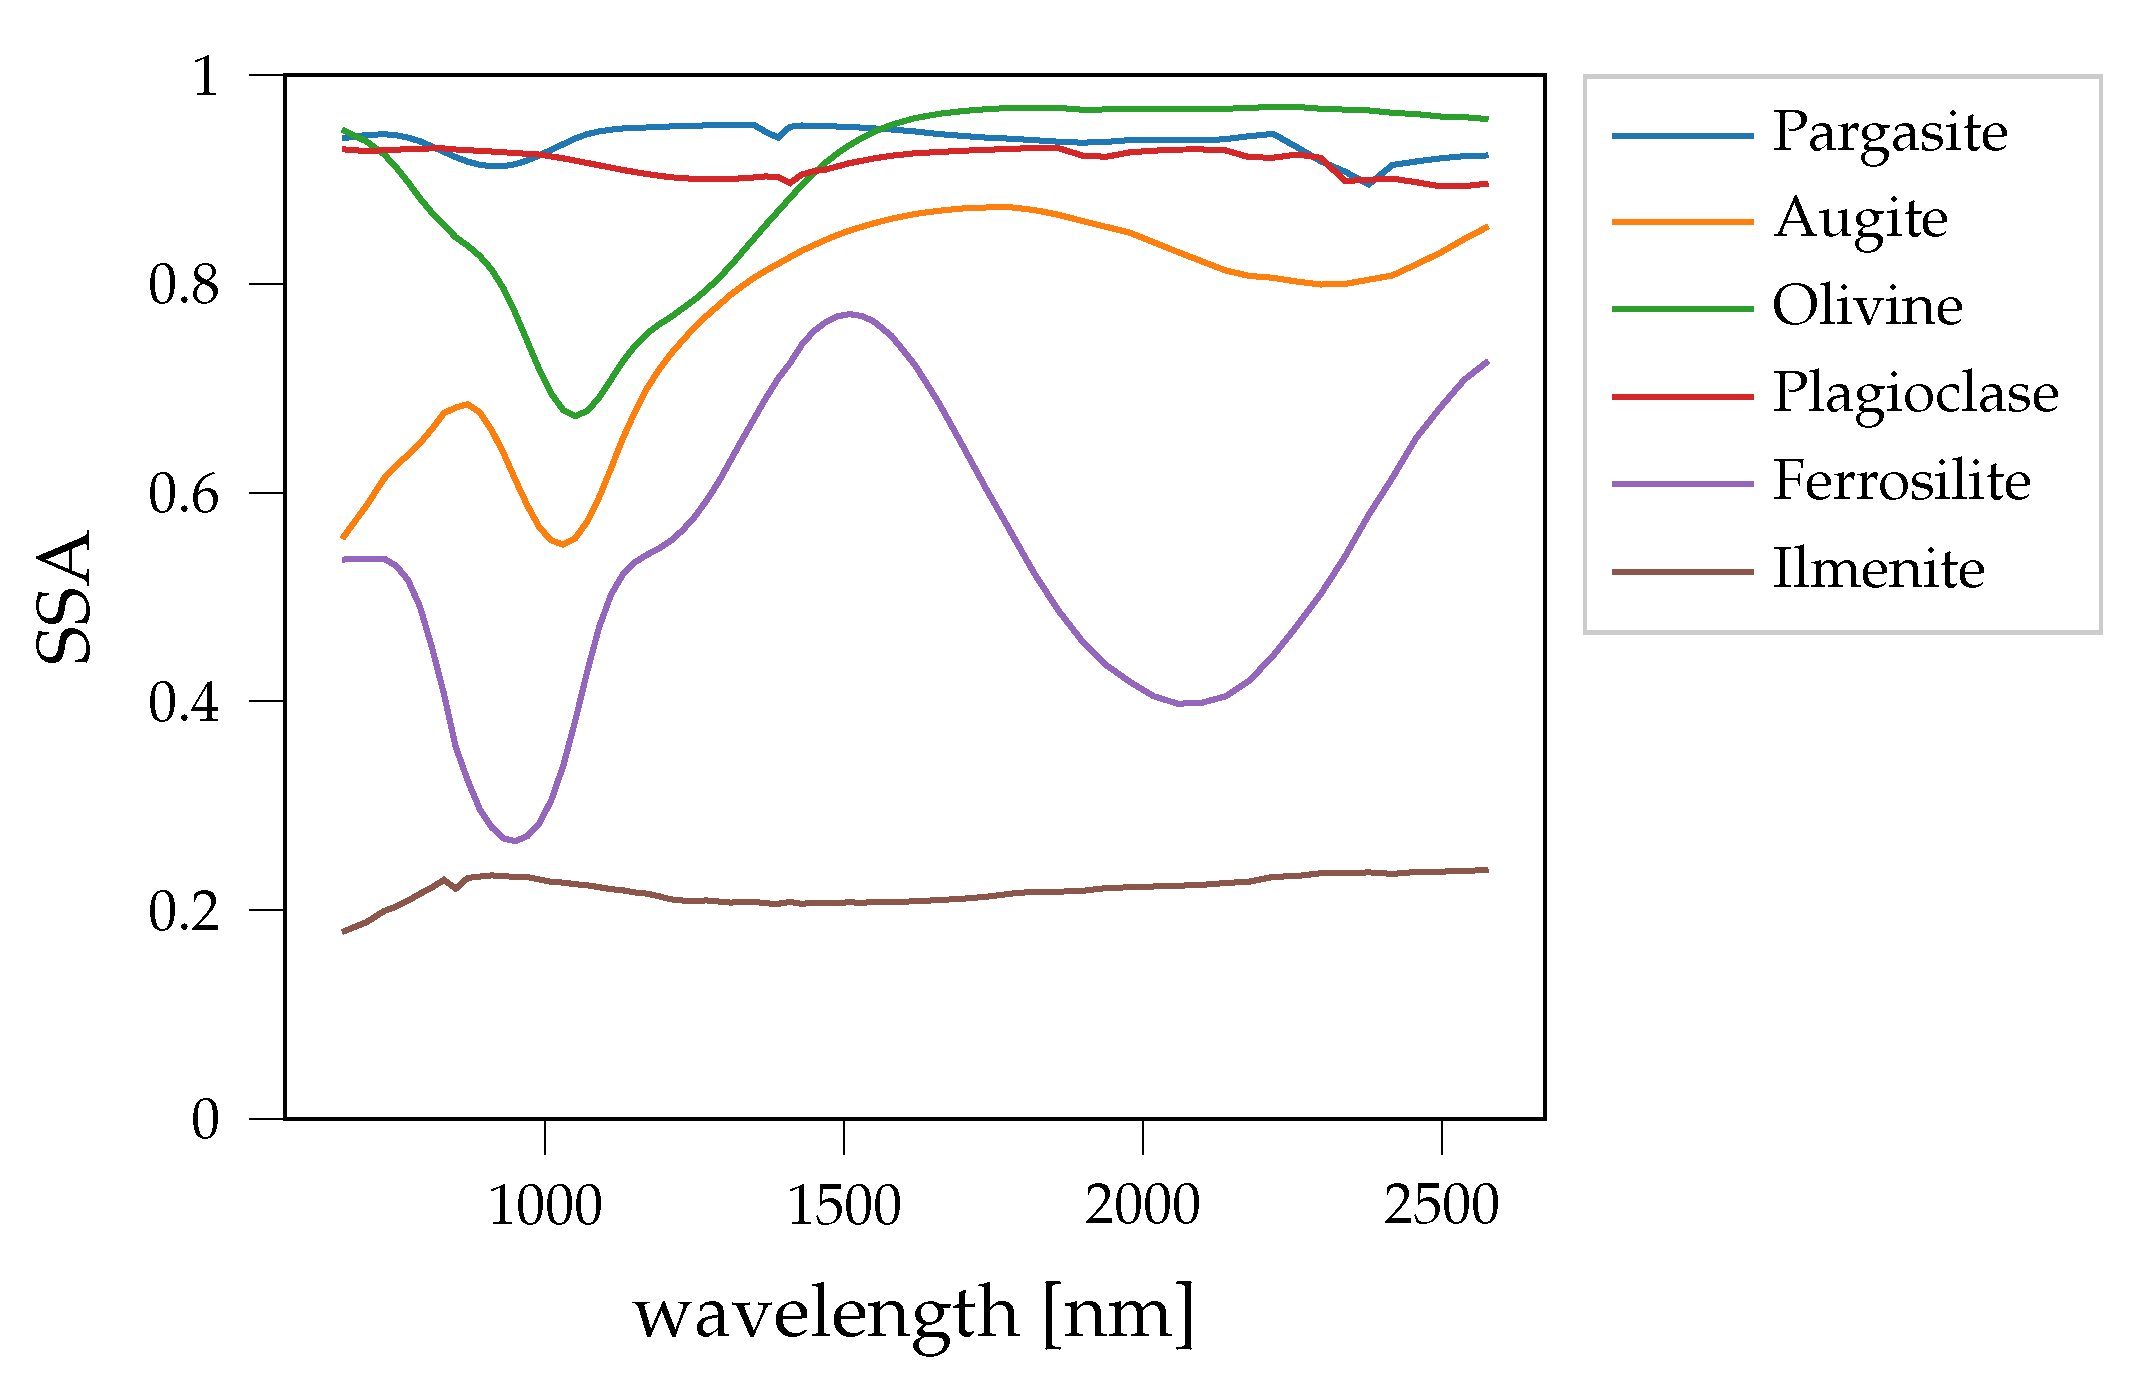
2.1.4. Endmember Catalogs
2.2. Bayesian Inference
2.2.1. Sampling Algorithm
2.2.2. Likelihood
2.2.3. Prior
3. Results
3.1. Synthetic Mixtures
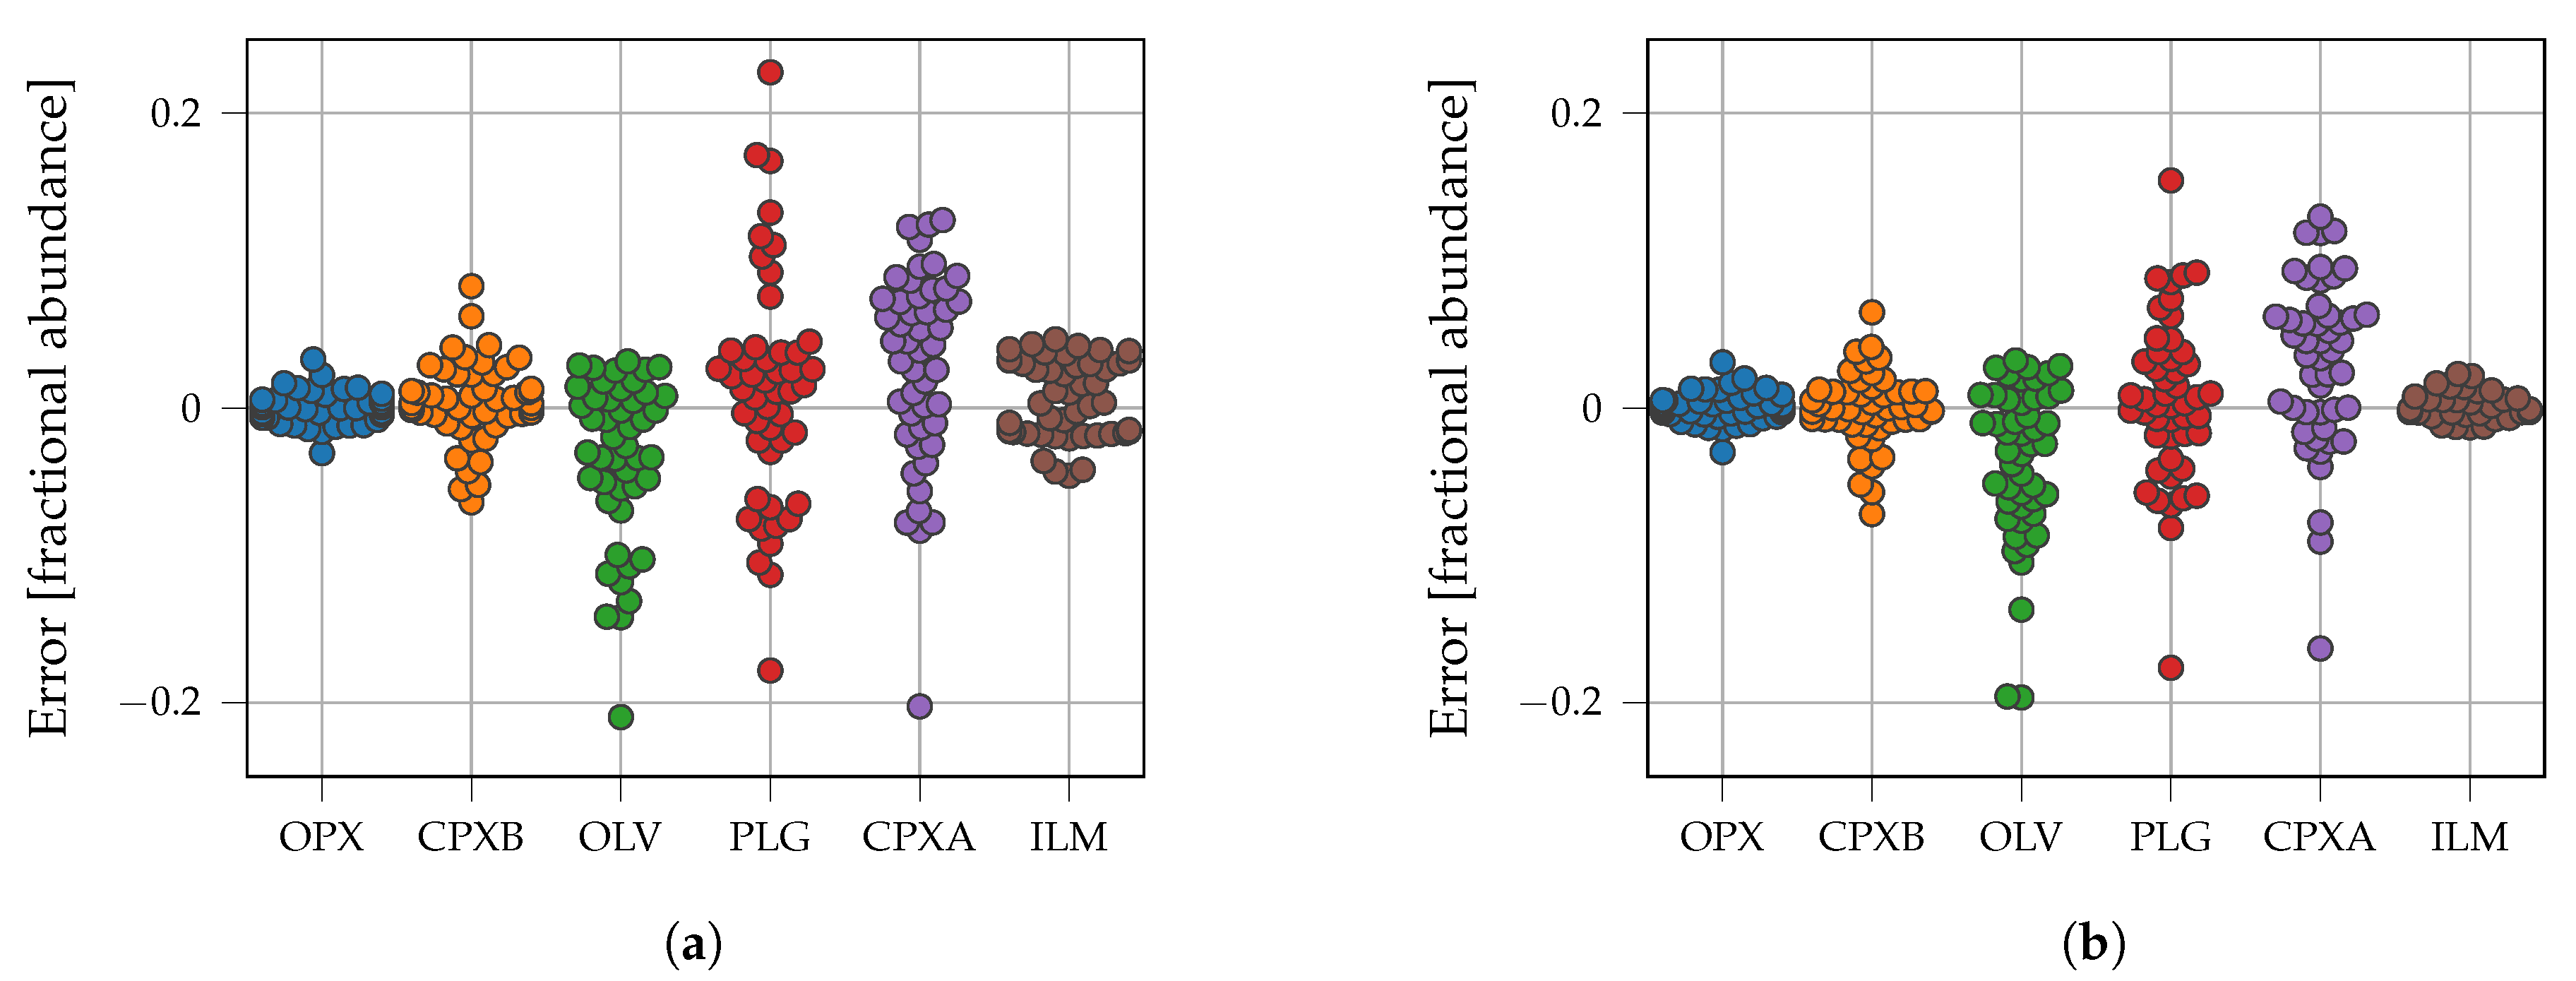
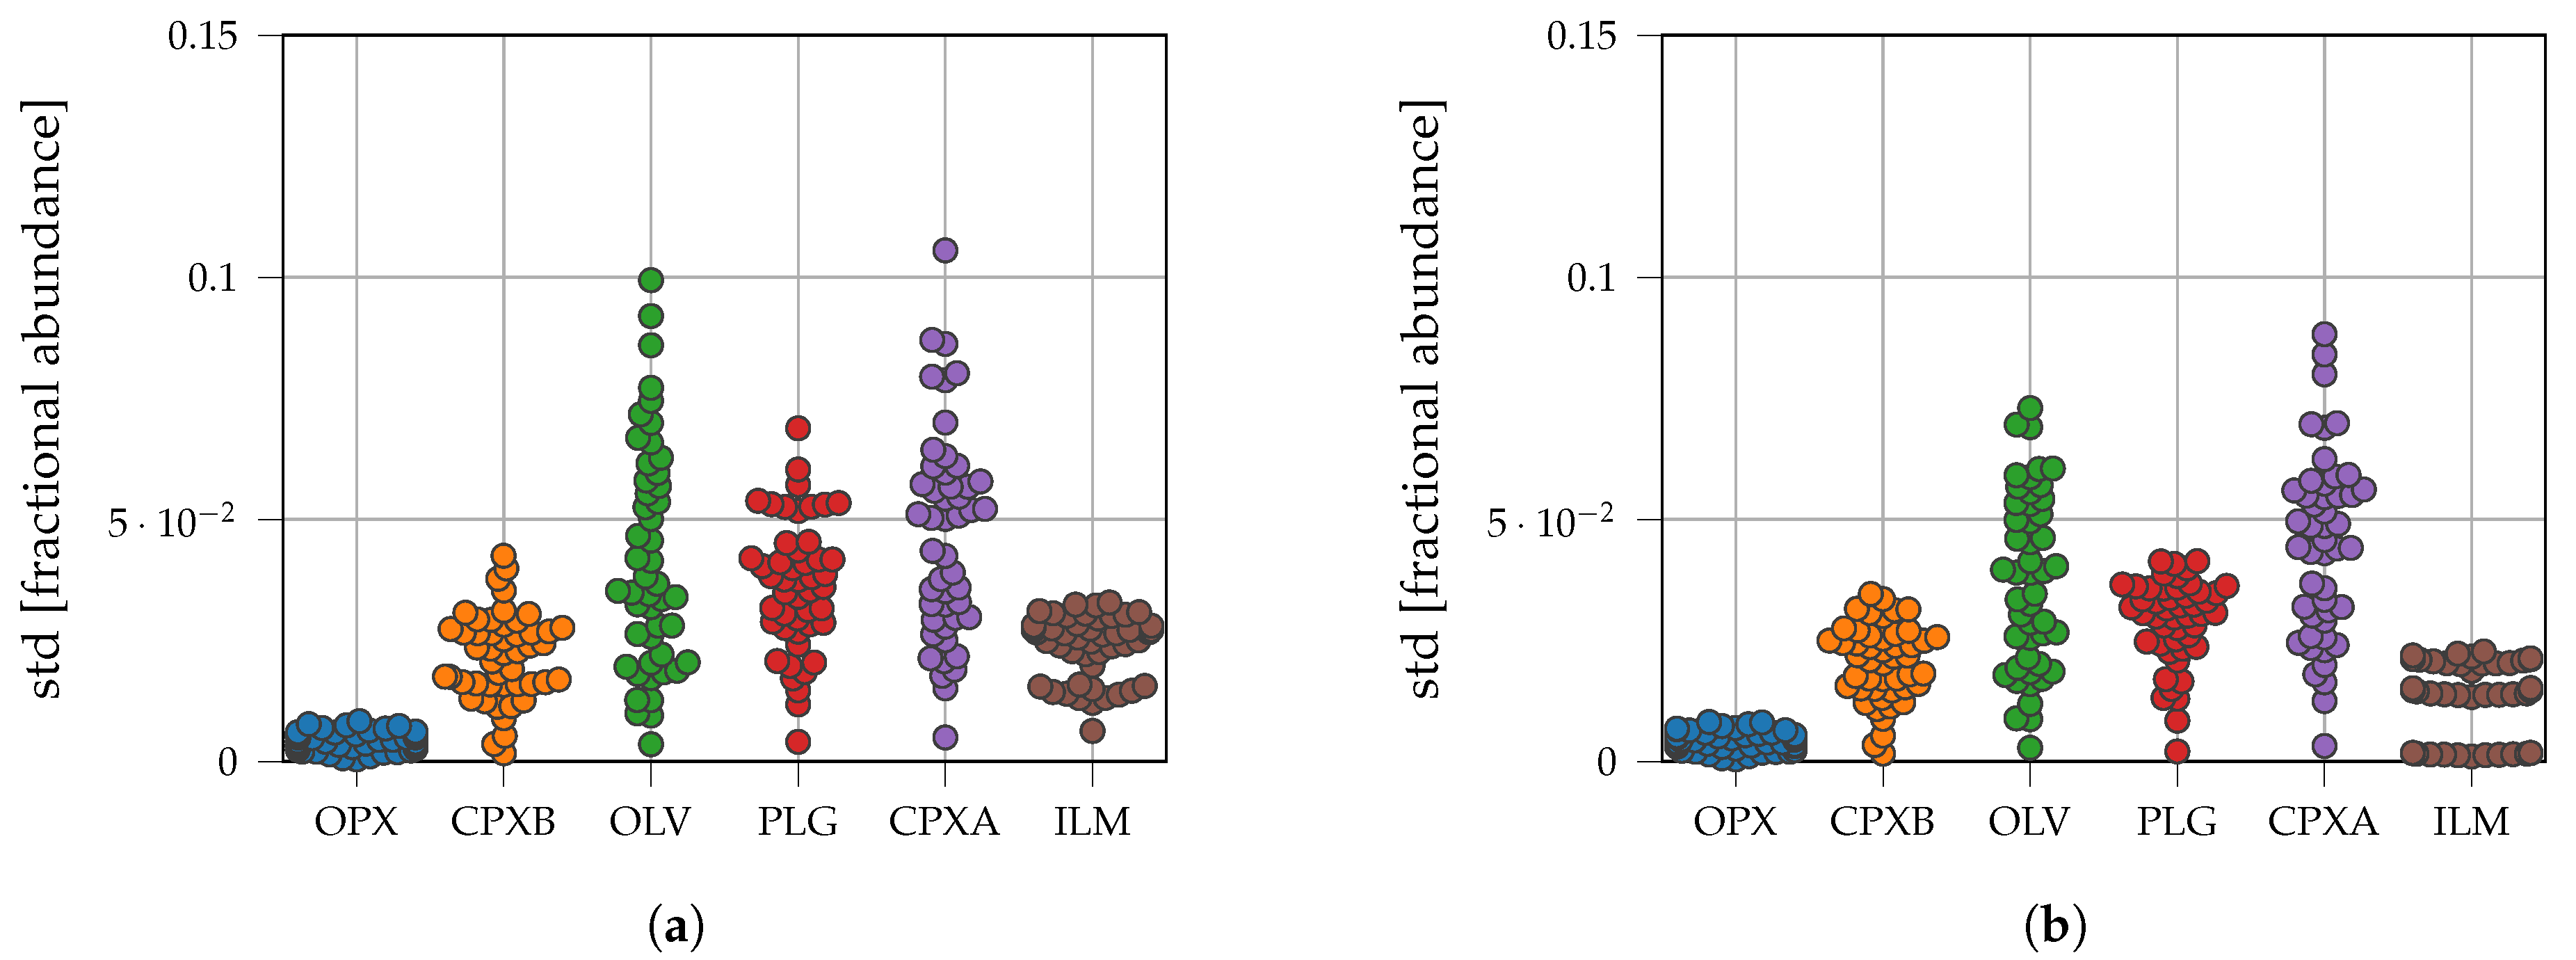
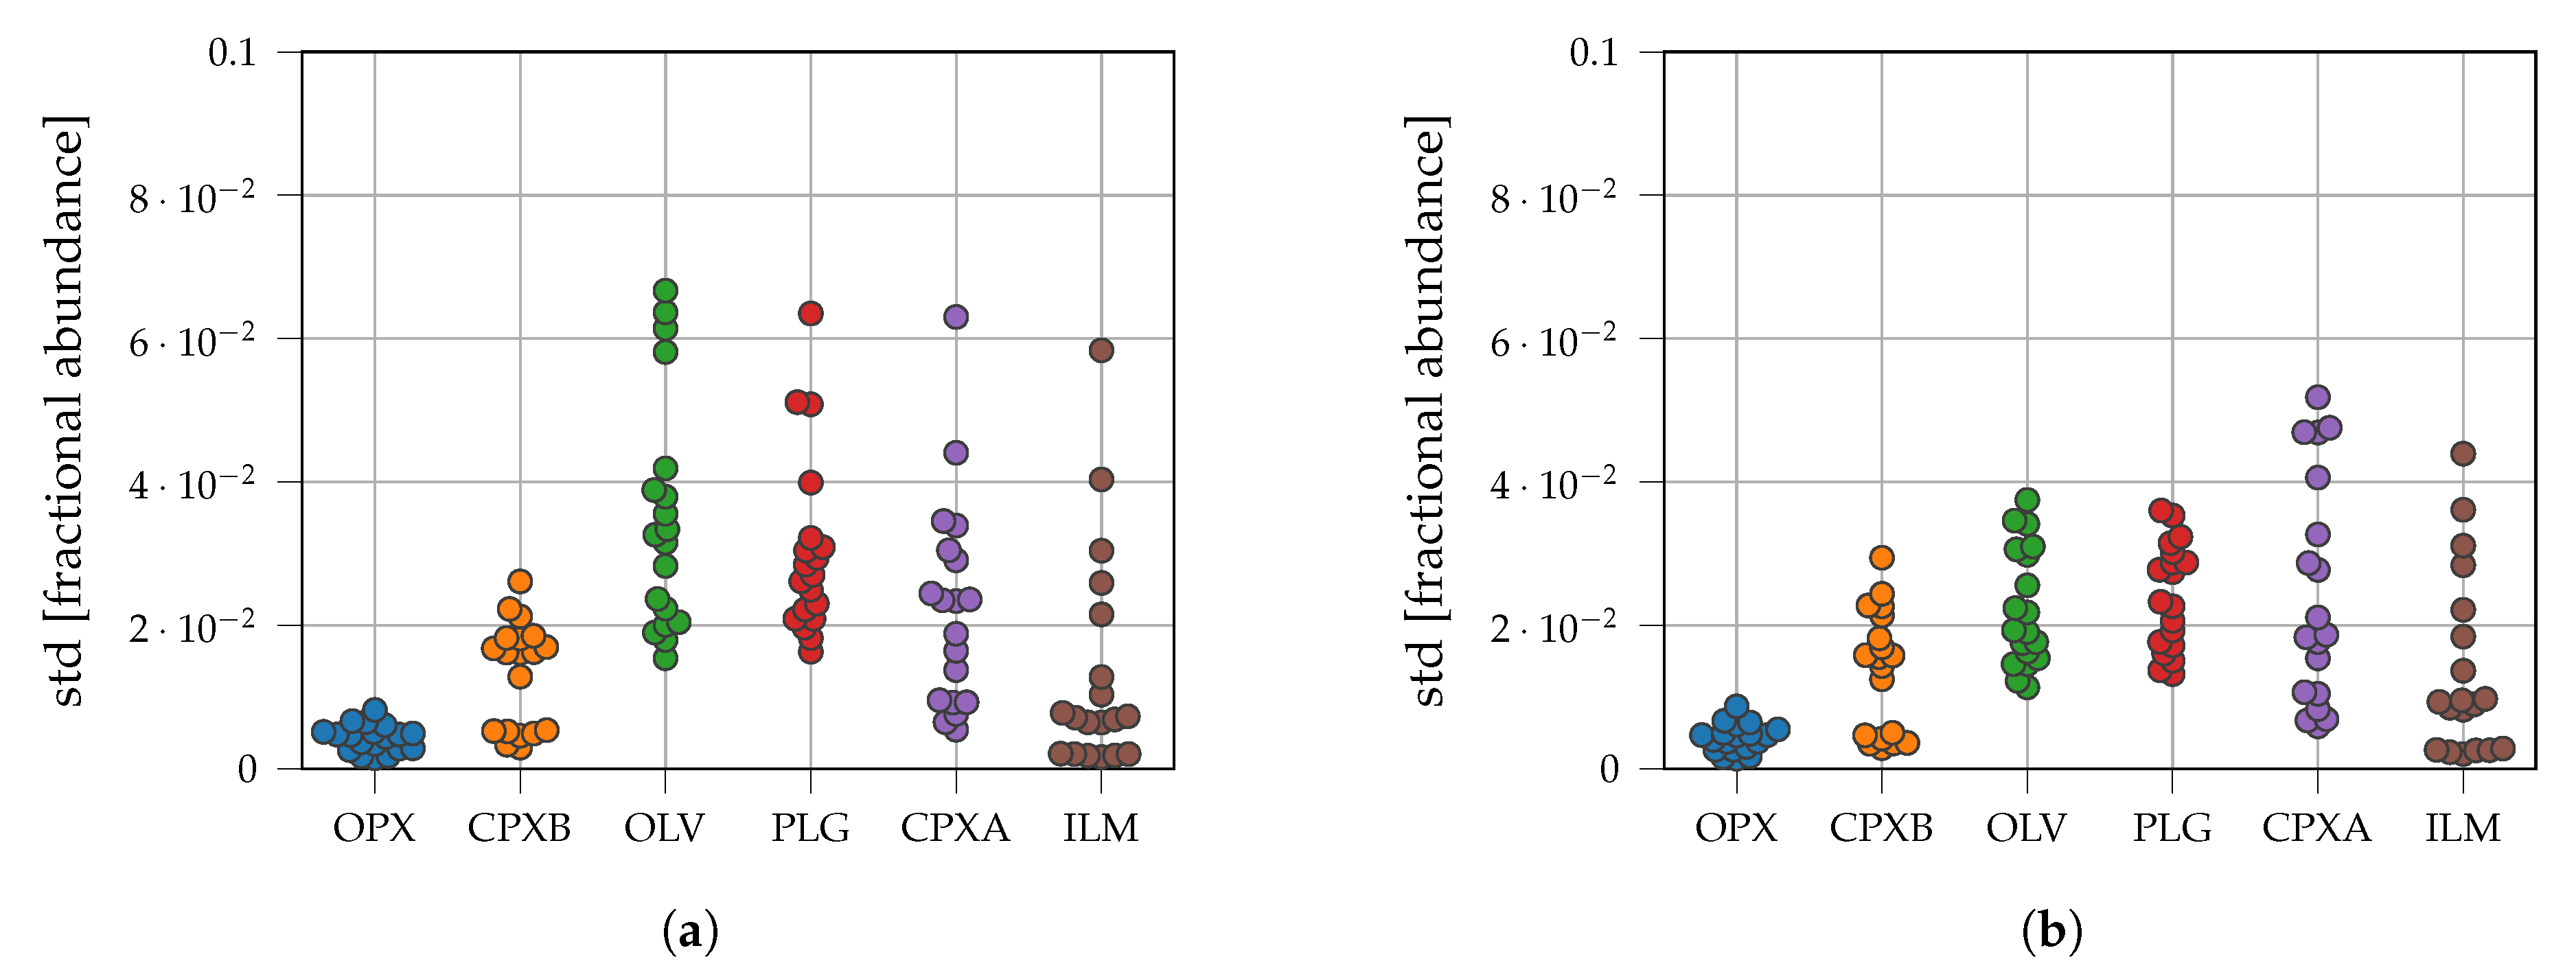
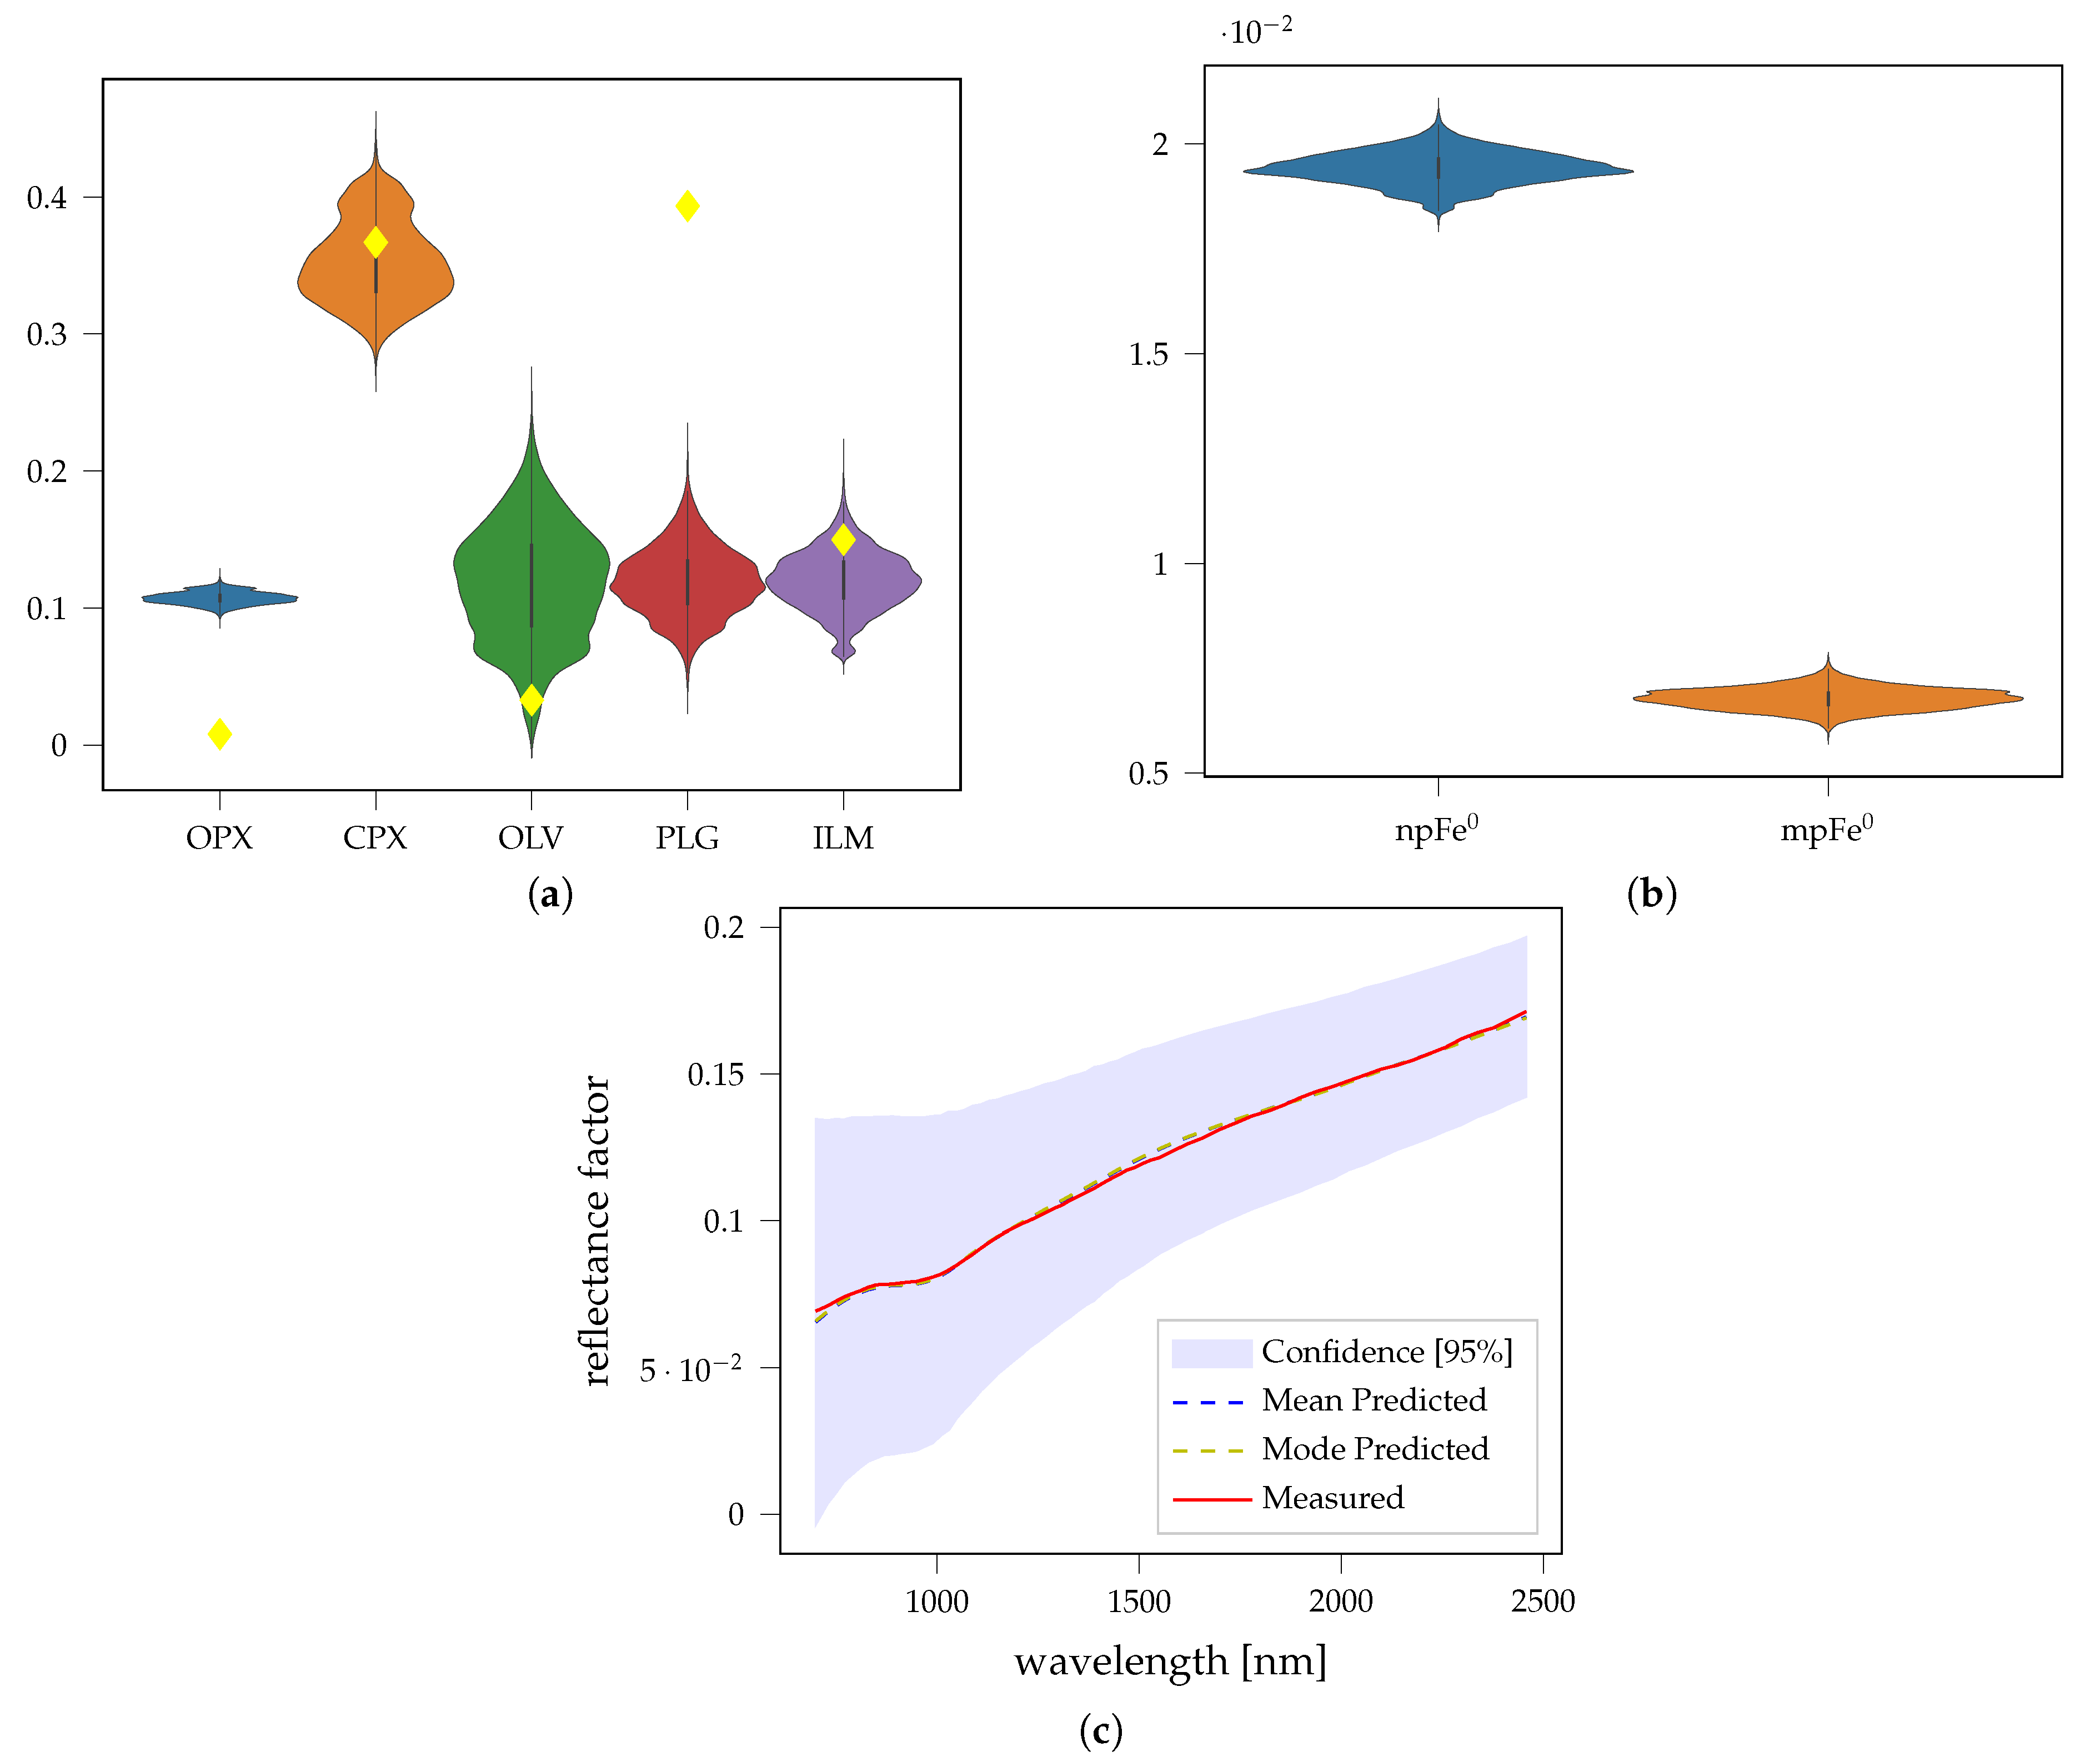
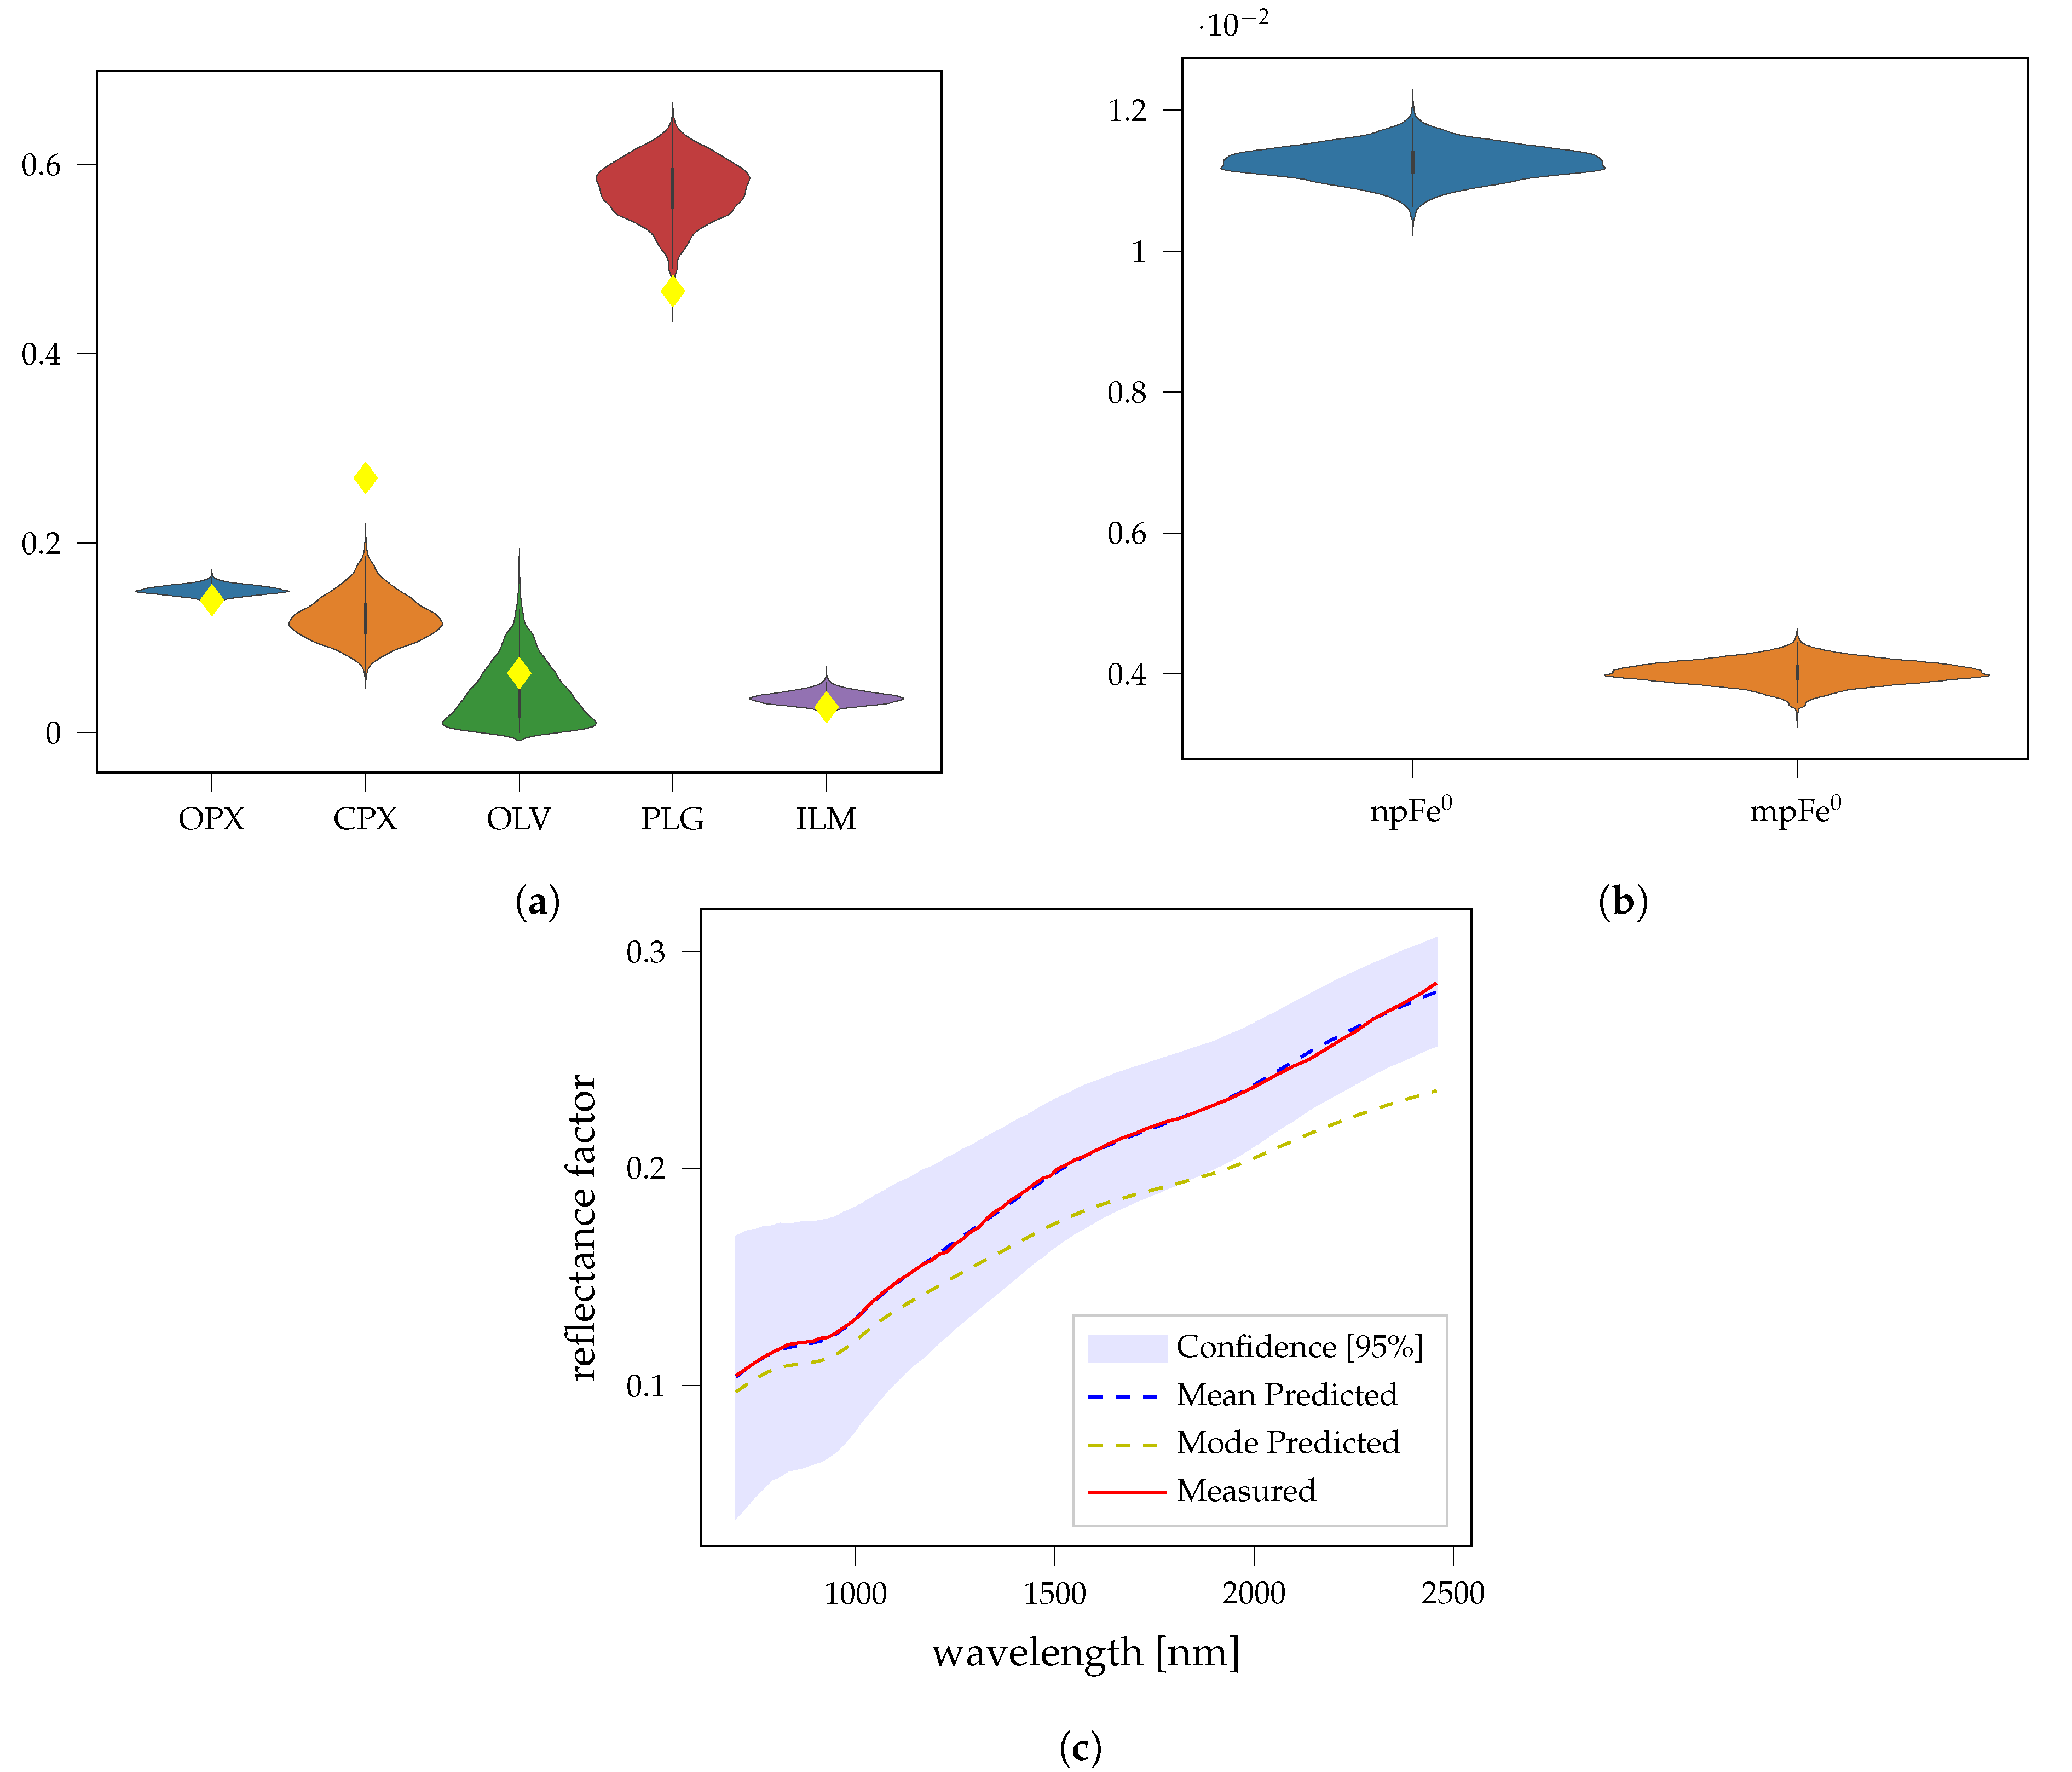
3.2. Fresh Laboratory Mixtures
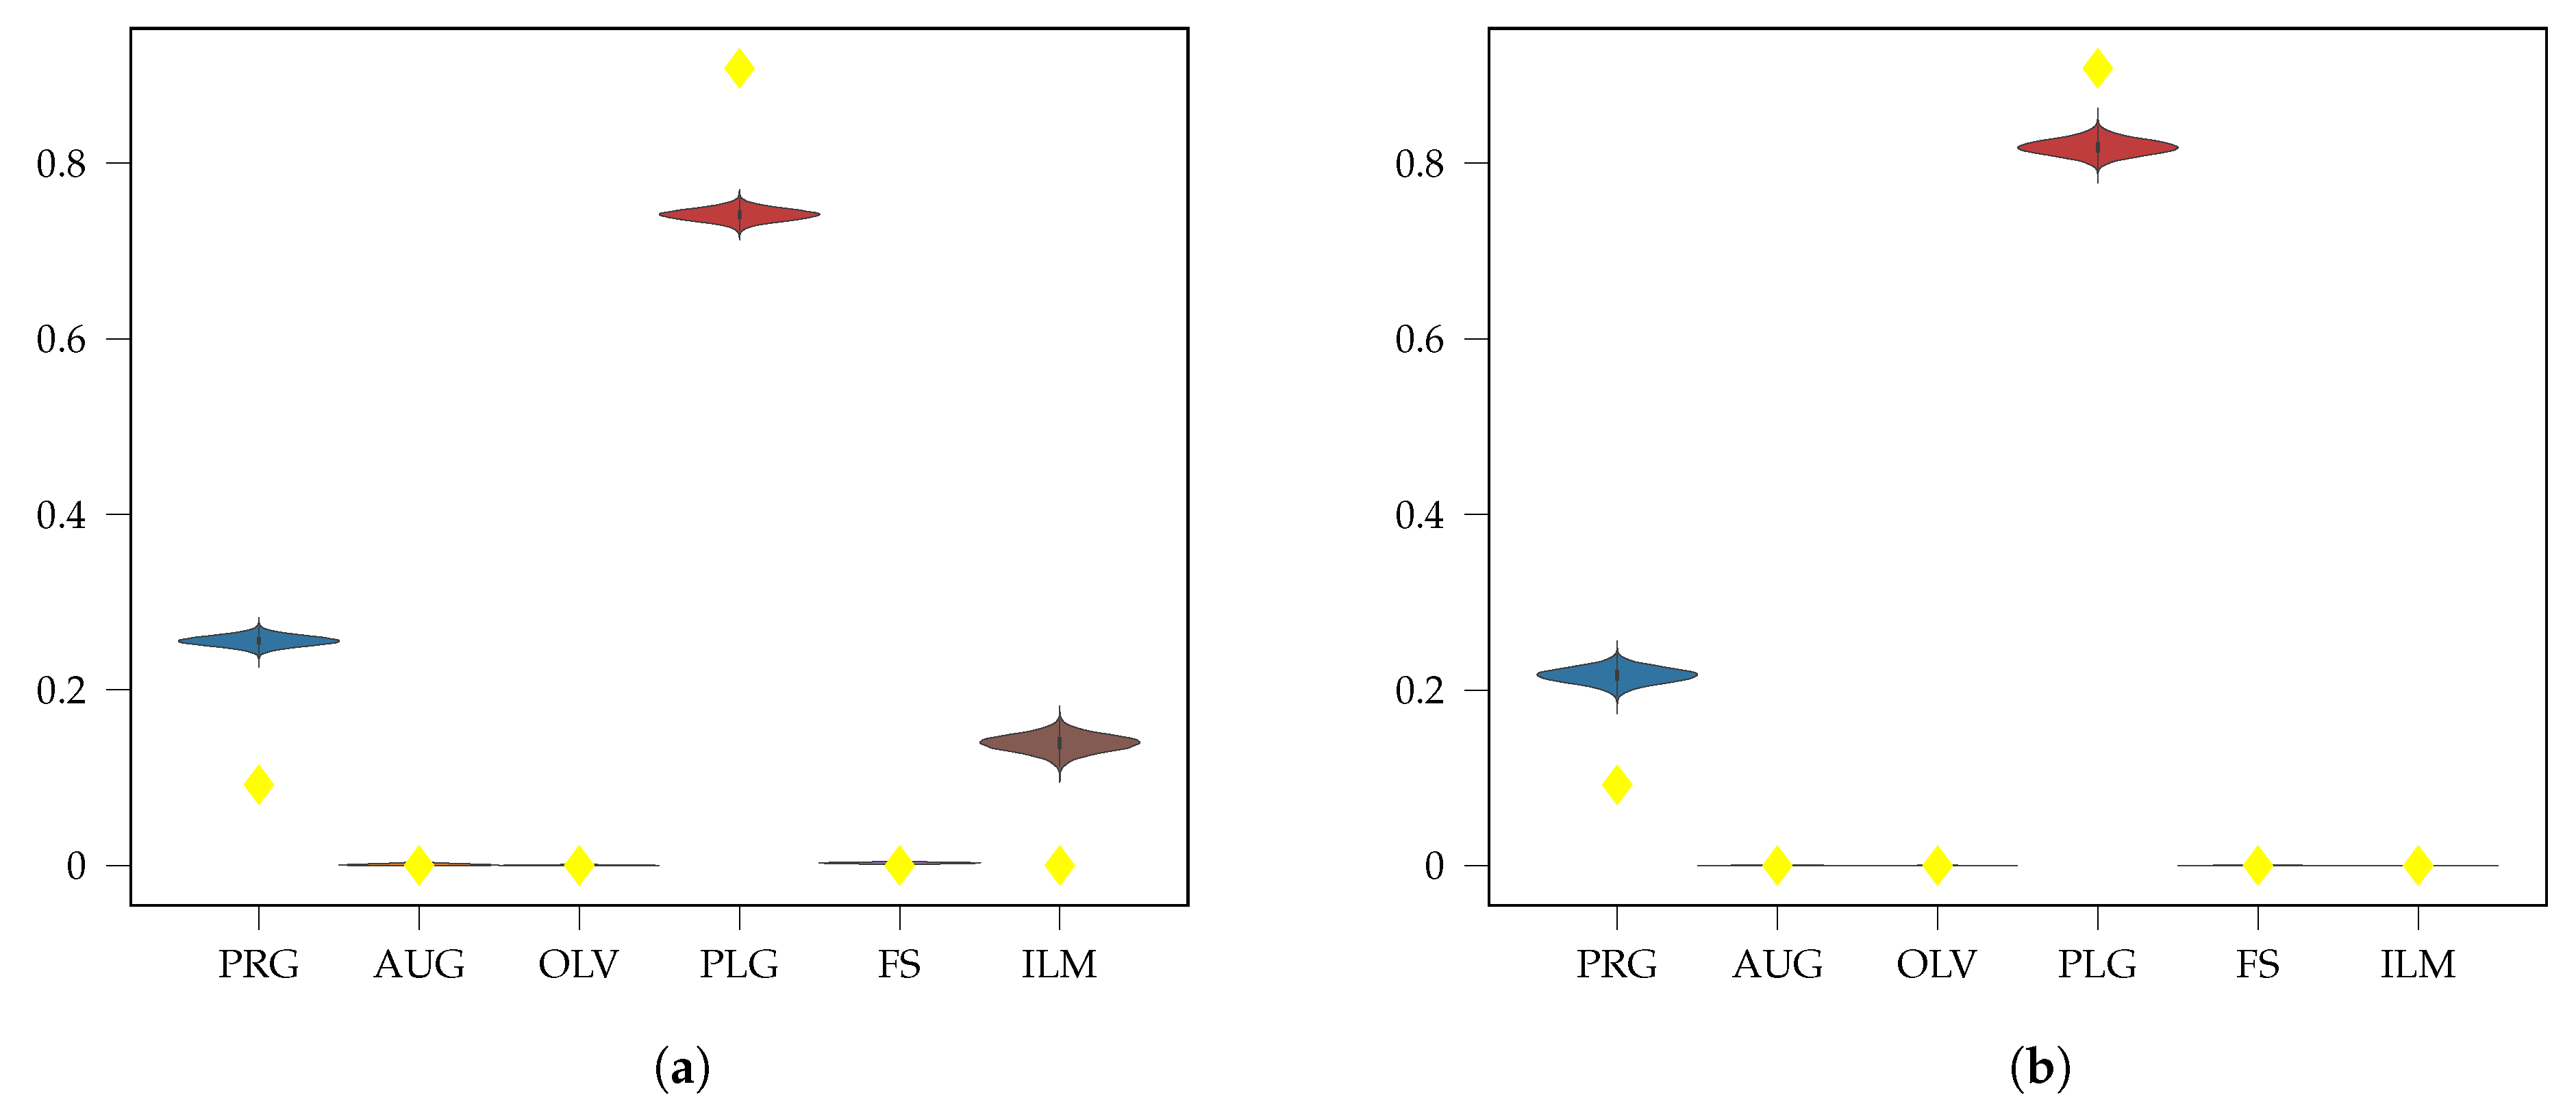
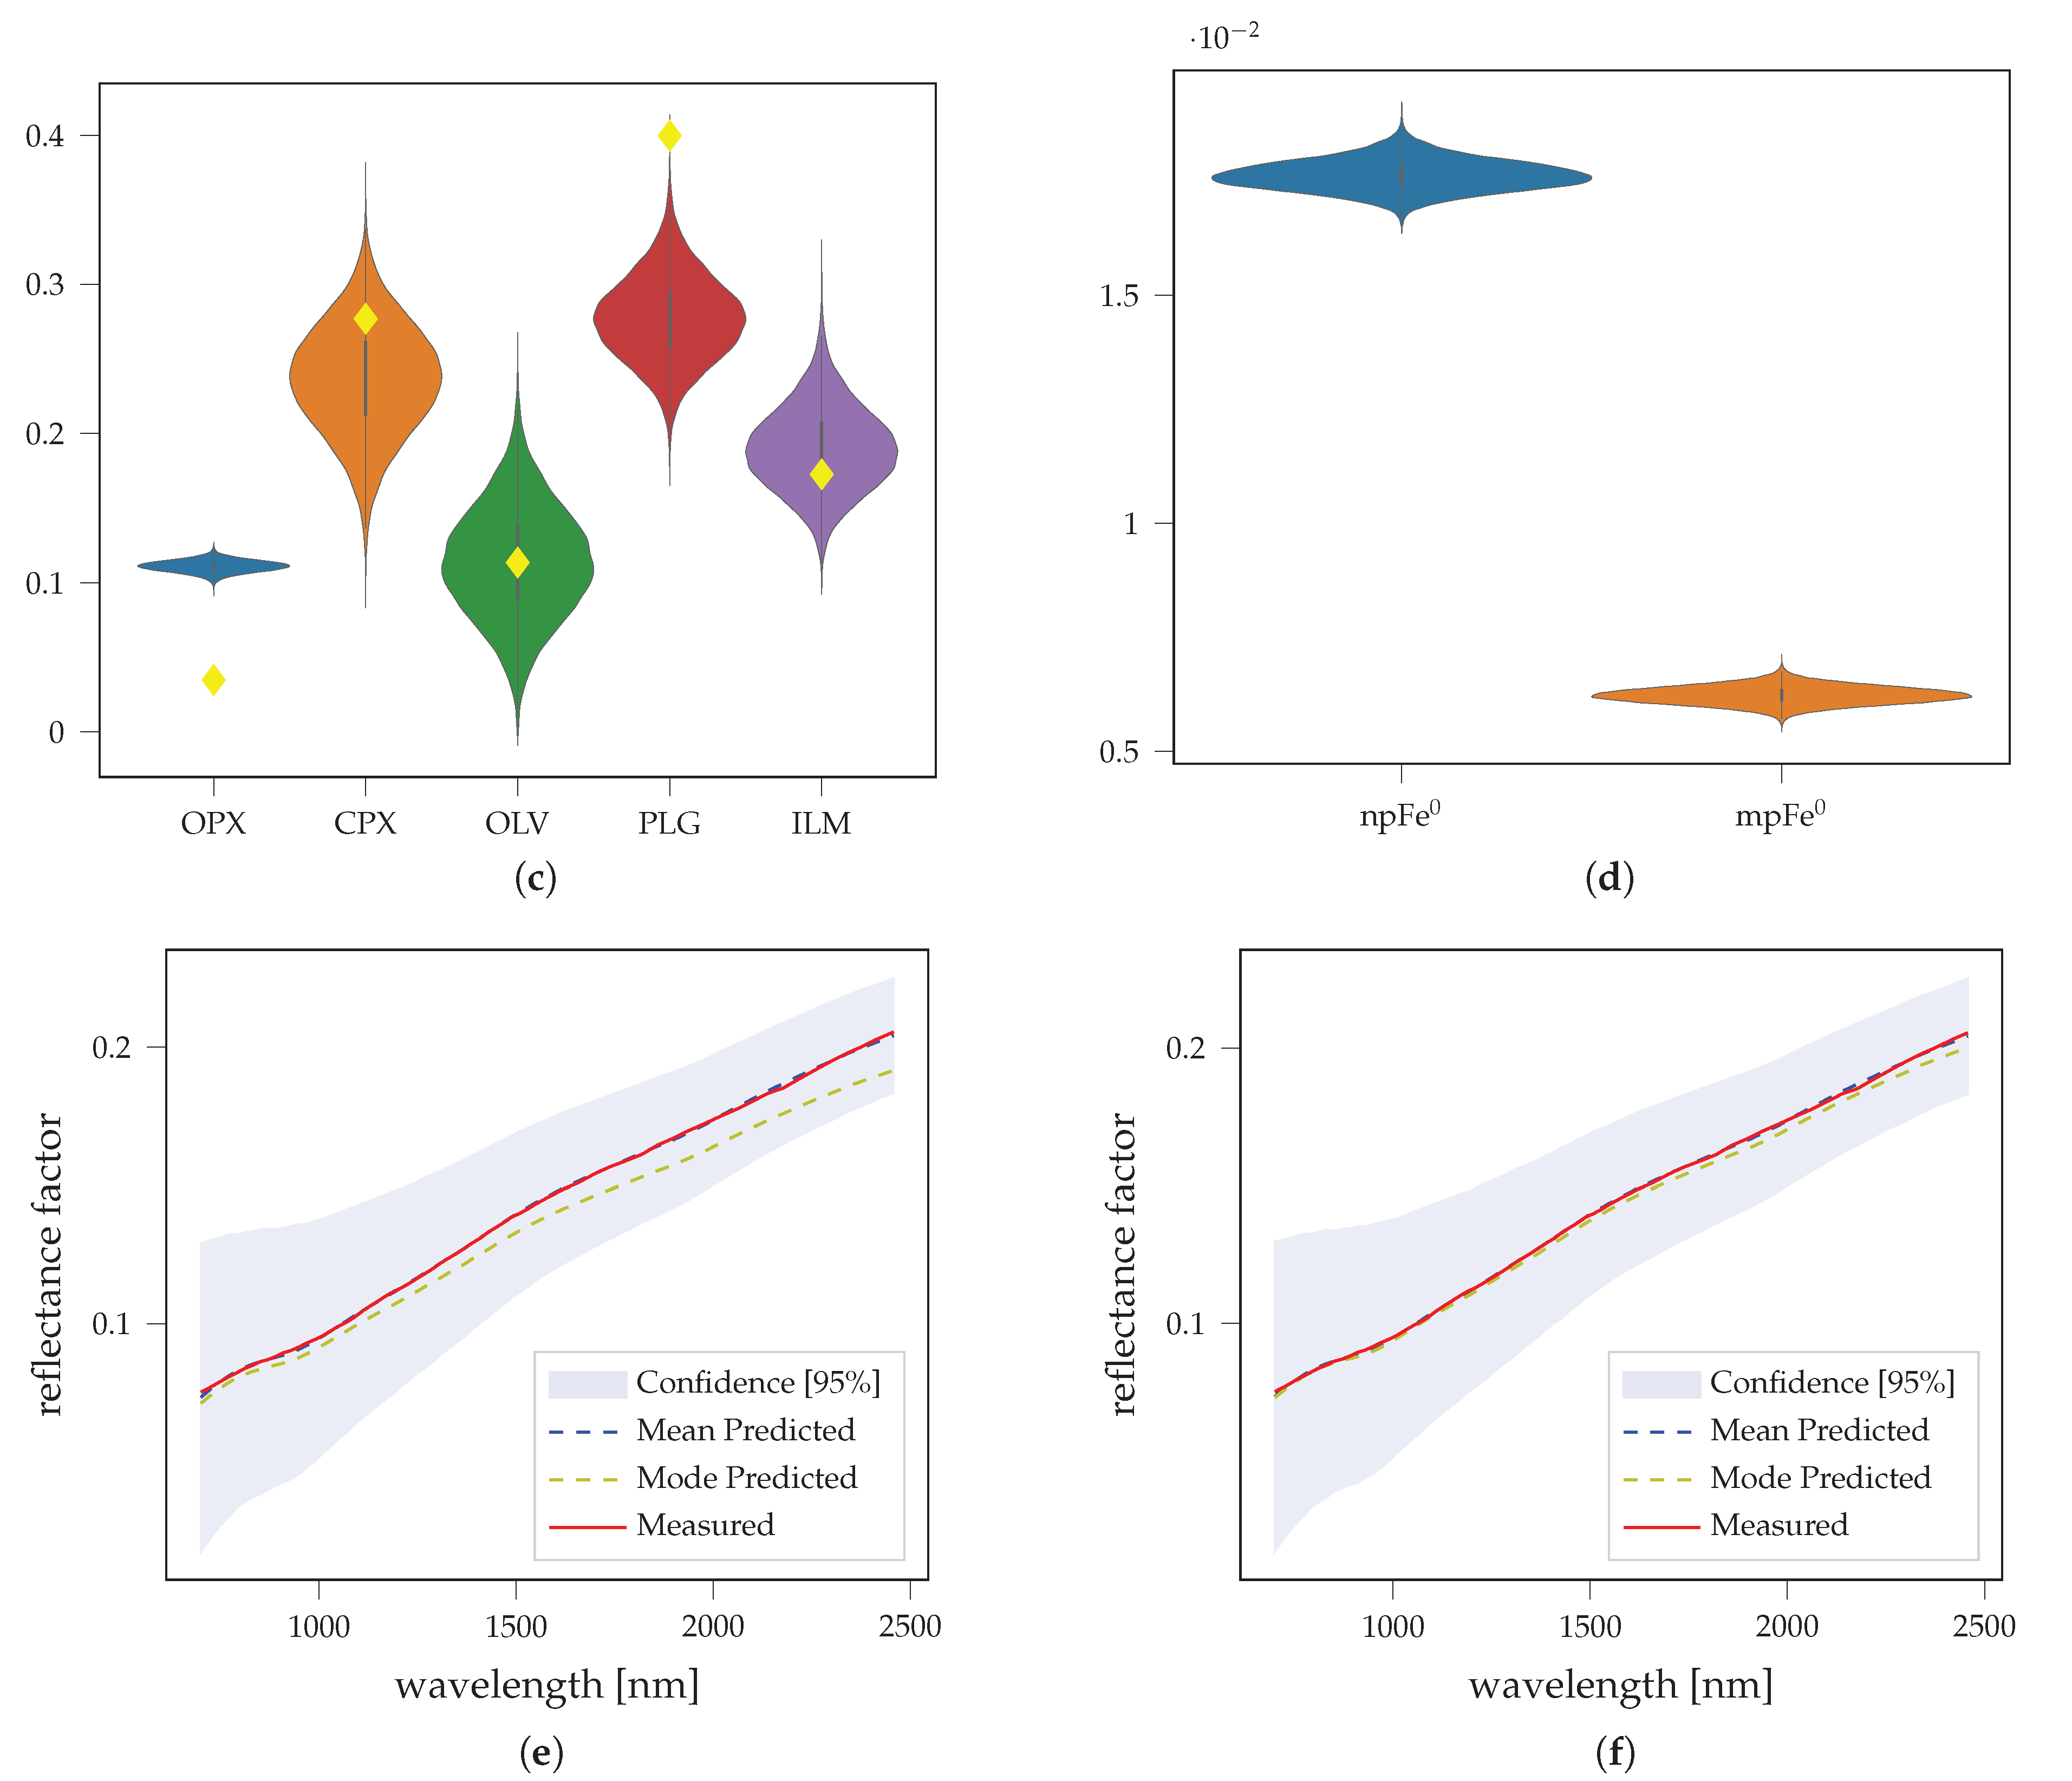
3.3. LSCC Samples
4. Discussion
5. Conclusions
Author Contributions
Funding
Data Availability Statement
Acknowledgments
Conflicts of Interest
Appendix A
Appendix A.1. Synthetic Mixtures
| SiO2 | TiO2 | Al2O3 | Cr2O3 | MgO | CaO | MnO | FeO | Na2O | K2O | P2O5 | Fe2O3 | |
|---|---|---|---|---|---|---|---|---|---|---|---|---|
| AG-TJM-009 | 54.09 | 0.16 | 1.23 | 0.75 | 26.79 | 1.52 | 0.49 | 15.22 | 0.05 | 0.05 | 0.0 | 0.00 |
| AG-TJM-010 | 50.73 | 0.74 | 8.73 | 0.00 | 16.65 | 15.82 | 0.13 | 5.37 | 1.27 | 0.00 | 0.0 | 1.08 |
| PO-EAC-056 | 40.42 | 0.00 | 0.03 | 0.13 | 48.25 | 0.19 | 0.15 | 11.11 | 0.00 | 0.00 | 0.0 | 0.00 |
| PL-EAC-029 | 54.85 | 0.06 | 27.71 | 0.02 | 0.00 | 10.97 | 0.01 | 0.00 | 5.15 | 0.40 | 0.0 | 0.46 |
| PP-ALS-105 | 48.41 | 1.05 | 5.29 | 0.03 | 12.37 | 22.15 | 0.26 | 6.15 | 0.36 | 0.00 | 0.0 | 3.79 |
| SC-EAC-034 | 0.20 | 47.61 | 0.01 | 0.02 | 0.01 | 0.00 | 0.02 | 45.43 | 0.00 | 0.00 | 0.0 | 0.00 |
| Sample ID | Mineral | Origin | Abbreviation |
|---|---|---|---|
| AG-TJM-009 | Hypersthene | Johnstown Meteorite | OPX |
| AG-TJM-010 | Augite | Kakanui, New Zealand | CPXB |
| PO-EAC-056 | Olivine | Green sand beach near S Point, HI | OLV |
| PL-EAC-029 | Plagioclase | Ylijarvi, Ylamaaa, Kimi, Finland | PLG |
| PP-ALS-105 | Diopside | Trail Creek, Grand Co., CO | CPXA |
| SC-EAC-034 | Ilmenite | Telemark, Norway | ILM |
| mix0 | mix1 | mix2 | ||||||||||
|---|---|---|---|---|---|---|---|---|---|---|---|---|
| Mode | Mean | Std | Theo | Mode | Mean | Std | Theo | Mode | Mean | Std | Theo | |
| OPX | 9.97 | 9.96 | 0.04 | 10.00 | 9.80 | 9.82 | 0.14 | 10.00 | 10.76 | 10.66 | 0.27 | 10.00 |
| CPXB | 39.95 | 40.00 | 0.17 | 40.00 | 40.19 | 40.33 | 0.89 | 40.00 | 37.31 | 37.75 | 1.58 | 40.00 |
| OLV | 4.58 | 4.44 | 0.36 | 5.00 | 8.29 | 8.35 | 1.84 | 5.00 | 18.28 | 19.20 | 3.19 | 5.00 |
| PLG | 29.85 | 29.93 | 0.41 | 30.00 | 29.11 | 28.45 | 1.71 | 30.00 | 13.89 | 16.75 | 3.05 | 30.00 |
| CPXA | 15.02 | 15.38 | 0.50 | 15.00 | 12.60 | 12.43 | 2.13 | 15.00 | 18.96 | 13.99 | 3.56 | 15.00 |
| ILM | 0.17 | 0.83 | 0.63 | 0.00 | 0.52 | 1.50 | 1.21 | 0.00 | 2.03 | 3.60 | 2.21 | 0.00 |
| npFe | 0.00 | 0.00 | 0.00 | 0.00 | 0.00 | 0.00 | 0.00 | 0.00 | 0.00 | 0.01 | 0.01 | 0.00 |
| mpFe | 0.00 | 0.00 | 0.00 | 0.00 | 0.40 | 0.40 | 0.00 | 0.40 | 0.78 | 0.79 | 0.01 | 0.80 |
| SUM | 99.55 | 100.54 | 100.00 | 100.51 | 100.87 | 100.00 | 101.23 | 101.96 | 100.00 | |||
| mix3 | mix4 | mix5 | ||||||||||
| Mode | Mean | Std | Theo | Mode | Mean | Std | Theo | Mode | Mean | Std | Theo | |
| OPX | 10.07 | 9.91 | 0.34 | 10.00 | 10.34 | 10.46 | 0.19 | 10.00 | 9.87 | 9.87 | 0.24 | 10.00 |
| CPXB | 35.50 | 39.32 | 1.69 | 40.00 | 38.56 | 39.69 | 1.30 | 40.00 | 38.72 | 38.86 | 1.60 | 40.00 |
| OLV | 40.64 | 32.95 | 5.25 | 5.00 | 6.37 | 2.48 | 2.05 | 5.00 | 7.98 | 8.40 | 4.56 | 5.00 |
| PLG | 1.60 | 12.86 | 4.53 | 30.00 | 25.96 | 28.15 | 1.97 | 30.00 | 27.49 | 27.86 | 2.83 | 30.00 |
| CPXA | 7.46 | 2.73 | 2.17 | 15.00 | 18.36 | 18.76 | 2.92 | 15.00 | 13.56 | 13.21 | 5.03 | 15.00 |
| ILM | 9.80 | 4.19 | 2.49 | 0.00 | 0.24 | 1.62 | 1.40 | 0.00 | 4.30 | 4.61 | 2.42 | 0.00 |
| npFe | 0.07 | 0.05 | 0.01 | 0.00 | 0.57 | 0.57 | 0.01 | 0.60 | 0.60 | 0.61 | 0.02 | 0.60 |
| mpFe | 1.18 | 1.16 | 0.02 | 1.20 | 0.01 | 0.01 | 0.00 | 0.00 | 0.40 | 0.40 | 0.01 | 0.40 |
| SUM | 105.08 | 101.95 | 100.00 | 99.82 | 101.15 | 100.00 | 101.93 | 102.81 | 100.00 | |||
| mix6 | mix7 | mix8 | ||||||||||
| Mode | Mean | Std | Theo | Mode | Mean | Std | Theo | Mode | Mean | Std | Theo | |
| OPX | 8.69 | 8.63 | 0.33 | 10.00 | 10.52 | 10.68 | 0.58 | 10.00 | 11.43 | 11.64 | 0.39 | 10.00 |
| CPXB | 46.15 | 45.51 | 1.59 | 40.00 | 33.21 | 39.95 | 2.91 | 40.00 | 33.81 | 31.75 | 2.44 | 40.00 |
| OLV | 18.74 | 14.98 | 5.36 | 5.00 | 10.37 | 11.96 | 7.17 | 5.00 | 11.08 | 2.41 | 2.63 | 5.00 |
| PLG | 26.56 | 26.74 | 4.51 | 30.00 | 21.10 | 29.30 | 5.31 | 30.00 | 19.85 | 18.35 | 2.76 | 30.00 |
| CPXA | 0.51 | 2.26 | 2.07 | 15.00 | 23.73 | 7.81 | 5.97 | 15.00 | 22.63 | 35.25 | 5.78 | 15.00 |
| ILM | 1.76 | 4.32 | 2.50 | 0.00 | 1.63 | 1.90 | 1.55 | 0.00 | 0.69 | 1.64 | 1.38 | 0.00 |
| npFe | 0.68 | 0.69 | 0.02 | 0.60 | 0.55 | 0.57 | 0.03 | 0.60 | 1.34 | 1.32 | 0.02 | 1.40 |
| mpFe | 0.75 | 0.76 | 0.02 | 0.80 | 1.28 | 1.29 | 0.03 | 1.20 | 0.01 | 0.01 | 0.00 | 0.00 |
| SUM | 102.41 | 102.45 | 100.00 | 100.56 | 101.60 | 100.00 | 99.48 | 101.04 | 100.00 | |||
| mix9 | mix10 | mix11 | ||||||||||
| Mode | Mean | Std | Theo | Mode | Mean | Std | Theo | Mode | Mean | Std | Theo | |
| OPX | 10.68 | 10.46 | 0.49 | 10.00 | 9.71 | 9.44 | 0.37 | 10.00 | 9.77 | 8.86 | 0.54 | 10.00 |
| CPXB | 39.80 | 36.92 | 2.93 | 40.00 | 43.59 | 44.30 | 1.60 | 40.00 | 39.64 | 46.41 | 2.76 | 40.00 |
| OLV | 7.62 | 9.75 | 6.68 | 5.00 | 5.39 | 5.74 | 3.67 | 5.00 | 8.74 | 9.25 | 5.80 | 5.00 |
| PLG | 22.46 | 22.45 | 3.81 | 30.00 | 34.59 | 36.19 | 2.89 | 30.00 | 20.78 | 27.35 | 4.11 | 30.00 |
| CPXA | 4.62 | 19.44 | 8.02 | 15.00 | 7.01 | 3.59 | 2.98 | 15.00 | 20.16 | 7.79 | 5.47 | 15.00 |
| ILM | 0.49 | 1.74 | 1.46 | 0.00 | 0.13 | 2.07 | 1.59 | 0.00 | 1.78 | 1.54 | 1.31 | 0.00 |
| npFe | 1.40 | 1.40 | 0.04 | 1.40 | 1.44 | 1.46 | 0.02 | 1.40 | 1.38 | 1.44 | 0.03 | 1.40 |
| mpFe | 0.37 | 0.37 | 0.02 | 0.40 | 0.81 | 0.79 | 0.02 | 0.80 | 1.18 | 1.22 | 0.03 | 1.20 |
| SUM | 85.67 | 100.77 | 100.00 | 100.41 | 101.33 | 100.00 | 100.88 | 101.19 | 100.00 | |||
| mix12 | mix13 | mix14 | ||||||||||
| Mode | Mean | Std | Theo | Mode | Mean | Std | Theo | Mode | Mean | Std | Theo | |
| OPX | 10.39 | 10.09 | 0.50 | 10.00 | 11.54 | 11.44 | 0.48 | 10.00 | 6.48 | 6.71 | 0.60 | 10.00 |
| CPXB | 38.62 | 38.96 | 2.82 | 40.00 | 37.73 | 36.57 | 2.24 | 40.00 | 37.72 | 39.38 | 1.64 | 40.00 |
| OLV | 11.31 | 9.79 | 5.69 | 5.00 | 33.08 | 35.29 | 6.59 | 5.00 | 1.92 | 2.24 | 1.72 | 5.00 |
| PLG | 19.88 | 19.74 | 3.17 | 30.00 | 6.57 | 7.23 | 3.54 | 30.00 | 45.94 | 47.81 | 2.04 | 30.00 |
| CPXA | 23.44 | 20.65 | 7.95 | 15.00 | 12.51 | 7.60 | 5.67 | 15.00 | 6.13 | 2.57 | 1.89 | 15.00 |
| ILM | 1.69 | 1.81 | 1.49 | 0.00 | 1.56 | 1.93 | 1.56 | 0.00 | 2.10 | 1.77 | 1.43 | 0.00 |
| npFe | 2.15 | 2.15 | 0.04 | 2.20 | 2.22 | 2.23 | 0.03 | 2.20 | 2.25 | 2.29 | 0.04 | 2.20 |
| mpFe | 0.00 | 0.01 | 0.01 | 0.00 | 0.32 | 0.32 | 0.02 | 0.40 | 0.73 | 0.74 | 0.02 | 0.80 |
| SUM | 105.32 | 101.04 | 100.00 | 102.98 | 100.06 | 100.00 | 100.29 | 100.48 | 100.00 | |||
| mix15 | mix16 | mix17 | ||||||||||
| Mode | Mean | Std | Theo | Mode | Mean | Std | Theo | Mode | Mean | Std | Theo | |
| OPX | 10.29 | 11.09 | 0.74 | 10.00 | 9.17 | 9.16 | 0.07 | 9.20 | 9.07 | 9.07 | 0.18 | 9.20 |
| CPXB | 38.16 | 35.75 | 3.99 | 40.00 | 36.89 | 36.79 | 0.36 | 36.80 | 38.87 | 38.89 | 1.13 | 36.80 |
| OLV | 24.38 | 11.31 | 8.60 | 5.00 | 4.92 | 5.39 | 0.99 | 4.60 | 0.71 | 5.90 | 2.80 | 4.60 |
| PLG | 18.23 | 18.96 | 4.36 | 30.00 | 26.73 | 26.32 | 1.18 | 27.60 | 27.08 | 28.03 | 2.41 | 27.60 |
| CPXA | 0.59 | 21.99 | 10.56 | 15.00 | 13.71 | 13.66 | 1.51 | 13.80 | 17.80 | 9.52 | 3.24 | 13.80 |
| ILM | 1.96 | 1.53 | 1.31 | 0.00 | 9.98 | 9.87 | 1.98 | 8.00 | 15.51 | 9.71 | 2.56 | 8.00 |
| npFe | 2.17 | 2.17 | 0.06 | 2.20 | 0.00 | 0.00 | 0.00 | 0.00 | 0.01 | 0.01 | 0.01 | 0.00 |
| mpFe | 1.18 | 1.18 | 0.03 | 1.20 | 0.00 | 0.00 | 0.00 | 0.00 | 0.41 | 0.41 | 0.01 | 0.40 |
| SUM | 93.61 | 100.63 | 100.00 | 101.40 | 101.20 | 100.00 | 109.03 | 101.12 | 100.00 | |||
| mix18 | mix19 | mix20 | ||||||||||
| Mode | Mean | Std | Theo | Mode | Mean | Std | Theo | Mode | Mean | Std | Theo | |
| OPX | 9.04 | 9.10 | 0.30 | 9.20 | 10.37 | 10.39 | 0.33 | 9.20 | 8.69 | 8.68 | 0.20 | 9.20 |
| CPXB | 37.76 | 40.48 | 1.75 | 36.80 | 36.89 | 37.34 | 1.64 | 36.80 | 35.95 | 35.97 | 1.24 | 36.80 |
| OLV | 7.86 | 8.05 | 3.45 | 4.60 | 12.22 | 14.88 | 3.52 | 4.60 | 2.26 | 2.77 | 1.96 | 4.60 |
| PLG | 21.73 | 26.48 | 3.49 | 27.60 | 21.05 | 25.06 | 3.40 | 27.60 | 30.05 | 29.81 | 1.85 | 27.60 |
| CPXA | 16.18 | 9.28 | 3.77 | 13.80 | 9.78 | 4.85 | 2.97 | 13.80 | 15.59 | 14.84 | 3.51 | 13.80 |
| ILM | 5.82 | 4.08 | 2.38 | 8.00 | 7.95 | 6.38 | 2.67 | 8.00 | 8.06 | 7.69 | 2.65 | 8.00 |
| npFe | 0.00 | 0.01 | 0.01 | 0.00 | 0.00 | 0.01 | 0.01 | 0.00 | 0.60 | 0.60 | 0.01 | 0.60 |
| mpFe | 0.78 | 0.79 | 0.01 | 0.80 | 1.19 | 1.21 | 0.02 | 1.20 | 0.00 | 0.00 | 0.00 | 0.00 |
| SUM | 98.39 | 97.46 | 100.00 | 98.25 | 98.89 | 100.00 | 100.60 | 99.77 | 100.00 | |||
| mix21 | mix22 | mix23 | ||||||||||
| Mode | Mean | Std | Theo | Mode | Mean | Std | Theo | Mode | Mean | Std | Theo | |
| OPX | 9.75 | 9.52 | 0.30 | 9.20 | 10.59 | 10.38 | 0.41 | 9.20 | 9.86 | 8.92 | 0.51 | 9.20 |
| CPXB | 33.87 | 36.21 | 1.75 | 36.80 | 32.01 | 33.40 | 2.69 | 36.80 | 34.59 | 40.23 | 2.33 | 36.80 |
| OLV | 7.84 | 15.35 | 6.16 | 4.60 | 12.45 | 3.79 | 3.24 | 4.60 | 13.34 | 9.92 | 5.96 | 4.60 |
| PLG | 24.27 | 23.85 | 4.10 | 27.60 | 18.88 | 23.85 | 3.99 | 27.60 | 19.33 | 28.95 | 5.17 | 27.60 |
| CPXA | 13.79 | 7.67 | 5.11 | 13.80 | 18.51 | 21.58 | 6.11 | 13.80 | 13.03 | 4.22 | 3.59 | 13.80 |
| ILM | 7.95 | 5.71 | 2.72 | 8.00 | 5.91 | 5.00 | 2.67 | 8.00 | 12.18 | 7.87 | 3.06 | 8.00 |
| npFe | 0.58 | 0.61 | 0.02 | 0.60 | 0.58 | 0.57 | 0.02 | 0.60 | 0.64 | 0.65 | 0.02 | 0.60 |
| mpFe | 0.40 | 0.39 | 0.01 | 0.40 | 0.77 | 0.79 | 0.02 | 0.80 | 1.17 | 1.22 | 0.03 | 1.20 |
| SUM | 97.47 | 98.31 | 100.00 | 98.35 | 97.99 | 100.00 | 102.33 | 100.11 | 100.00 | |||
| mix24 | mix25 | mix26 | ||||||||||
| Mode | Mean | Std | Theo | Mode | Mean | Std | Theo | Mode | Mean | Std | Theo | |
| OPX | 8.76 | 8.84 | 0.34 | 9.20 | 7.97 | 7.87 | 0.45 | 9.20 | 8.51 | 8.31 | 0.57 | 9.20 |
| CPXB | 32.63 | 36.47 | 1.91 | 36.80 | 28.43 | 33.90 | 2.65 | 36.80 | 36.45 | 38.13 | 2.52 | 36.80 |
| OLV | 6.87 | 10.07 | 4.20 | 4.60 | 1.57 | 7.63 | 5.54 | 4.60 | 15.52 | 6.57 | 5.01 | 4.60 |
| PLG | 23.48 | 28.49 | 2.95 | 27.60 | 22.79 | 27.96 | 4.17 | 27.60 | 33.03 | 34.10 | 4.20 | 27.60 |
| CPXA | 19.23 | 8.47 | 5.43 | 13.80 | 31.63 | 15.13 | 7.00 | 13.80 | 0.47 | 6.23 | 5.01 | 13.80 |
| ILM | 9.69 | 6.86 | 2.81 | 8.00 | 2.91 | 4.79 | 2.65 | 8.00 | 3.55 | 5.38 | 2.75 | 8.00 |
| npFe | 1.41 | 1.41 | 0.02 | 1.40 | 1.42 | 1.41 | 0.03 | 1.40 | 1.42 | 1.43 | 0.03 | 1.40 |
| mpFe | 0.00 | 0.01 | 0.01 | 0.00 | 0.33 | 0.33 | 0.02 | 0.40 | 0.83 | 0.85 | 0.02 | 0.80 |
| SUM | 100.67 | 99.20 | 100.00 | 95.30 | 97.28 | 100.00 | 97.54 | 98.72 | 100.00 | |||
| mix27 | mix28 | mix29 | ||||||||||
| Mode | Mean | Std | Theo | Mode | Mean | Std | Theo | Mode | Mean | Std | Theo | |
| OPX | 10.58 | 10.40 | 0.73 | 9.20 | 9.85 | 9.22 | 0.51 | 9.20 | 8.96 | 7.92 | 0.64 | 9.20 |
| CPXB | 34.74 | 35.52 | 3.77 | 36.80 | 33.63 | 36.95 | 2.28 | 36.80 | 31.58 | 37.27 | 2.93 | 36.80 |
| OLV | 17.54 | 18.77 | 9.94 | 4.60 | 0.00 | 1.88 | 1.80 | 4.60 | 8.91 | 4.14 | 3.35 | 4.60 |
| PLG | 21.87 | 18.42 | 6.88 | 27.60 | 33.24 | 38.10 | 3.16 | 27.60 | 29.98 | 35.60 | 4.17 | 27.60 |
| CPXA | 9.78 | 10.64 | 7.87 | 13.80 | 6.55 | 7.37 | 4.35 | 13.80 | 13.88 | 8.37 | 5.73 | 13.80 |
| ILM | 3.61 | 4.75 | 2.76 | 8.00 | 6.40 | 3.35 | 2.26 | 8.00 | 4.02 | 5.15 | 2.80 | 8.00 |
| npFe | 1.35 | 1.34 | 0.04 | 1.40 | 2.17 | 2.19 | 0.03 | 2.20 | 2.12 | 2.21 | 0.04 | 2.20 |
| mpFe | 1.32 | 1.32 | 0.05 | 1.20 | 0.00 | 0.01 | 0.00 | 0.00 | 0.46 | 0.44 | 0.02 | 0.40 |
| SUM | 98.11 | 98.50 | 100.00 | 89.68 | 96.88 | 100.00 | 97.33 | 98.43 | 100.00 | |||
| mix30 | mix31 | mix32 | ||||||||||
| Mode | Mean | Std | Theo | Mode | Mean | Std | Theo | Mode | Mean | Std | Theo | |
| OPX | 7.81 | 7.53 | 0.62 | 9.20 | 9.09 | 8.67 | 0.77 | 9.20 | 8.39 | 8.42 | 0.11 | 8.40 |
| CPXB | 36.21 | 39.00 | 2.65 | 36.80 | 35.89 | 37.86 | 2.66 | 36.80 | 34.74 | 34.78 | 0.53 | 33.60 |
| OLV | 2.69 | 3.31 | 2.81 | 4.60 | 11.93 | 4.45 | 3.48 | 4.60 | 3.72 | 3.53 | 1.27 | 4.20 |
| PLG | 31.23 | 35.79 | 4.03 | 27.60 | 27.84 | 35.14 | 3.87 | 27.60 | 27.12 | 27.42 | 1.47 | 25.20 |
| CPXA | 15.27 | 7.14 | 5.08 | 13.80 | 8.12 | 5.79 | 4.24 | 13.80 | 10.13 | 10.02 | 1.77 | 12.60 |
| ILM | 5.71 | 4.99 | 2.62 | 8.00 | 2.77 | 5.02 | 2.72 | 8.00 | 15.86 | 15.64 | 2.28 | 16.00 |
| npFe | 2.23 | 2.25 | 0.04 | 2.20 | 2.28 | 2.27 | 0.05 | 2.20 | 0.00 | 0.00 | 0.00 | 0.00 |
| mpFe | 0.72 | 0.76 | 0.03 | 0.80 | 0.99 | 1.03 | 0.04 | 1.20 | 0.00 | 0.00 | 0.00 | 0.00 |
| SUM | 98.92 | 97.76 | 100.00 | 95.63 | 96.94 | 100.00 | 99.96 | 99.81 | 100.00 | |||
| mix33 | mix34 | mix35 | ||||||||||
| Mode | Mean | Std | Theo | Mode | Mean | Std | Theo | Mode | Mean | Std | Theo | |
| OPX | 8.88 | 8.81 | 0.20 | 8.40 | 8.65 | 8.31 | 0.41 | 8.40 | 9.12 | 8.35 | 0.54 | 8.40 |
| CPXB | 31.13 | 30.99 | 1.14 | 33.60 | 28.73 | 33.86 | 3.05 | 33.60 | 29.97 | 34.01 | 3.11 | 33.60 |
| OLV | 7.95 | 7.58 | 2.04 | 4.20 | 10.49 | 5.00 | 3.82 | 4.20 | 1.73 | 2.41 | 1.87 | 4.20 |
| PLG | 21.10 | 20.71 | 2.68 | 25.20 | 13.95 | 22.96 | 5.34 | 25.20 | 28.48 | 31.94 | 3.13 | 25.20 |
| CPXA | 15.73 | 15.24 | 2.63 | 12.60 | 23.20 | 15.10 | 6.09 | 12.60 | 16.19 | 8.71 | 5.22 | 12.60 |
| ILM | 17.80 | 17.59 | 2.72 | 16.00 | 11.53 | 12.02 | 2.84 | 16.00 | 12.27 | 11.80 | 2.47 | 16.00 |
| npFe | 0.00 | 0.00 | 0.00 | 0.00 | 0.01 | 0.02 | 0.01 | 0.00 | 0.01 | 0.02 | 0.01 | 0.00 |
| mpFe | 0.39 | 0.39 | 0.01 | 0.40 | 0.71 | 0.75 | 0.02 | 0.80 | 1.17 | 1.18 | 0.01 | 1.20 |
| SUM | 102.59 | 100.92 | 100.00 | 96.55 | 97.25 | 100.00 | 97.76 | 97.23 | 100.00 | |||
| mix36 | mix37 | mix38 | ||||||||||
| Mode | Mean | Std | Theo | Mode | Mean | Std | Theo | Mode | Mean | Std | Theo | |
| OPX | 8.92 | 8.83 | 0.23 | 8.40 | 8.29 | 8.18 | 0.33 | 8.40 | 8.87 | 8.70 | 0.35 | 8.40 |
| CPXB | 34.38 | 32.56 | 1.26 | 33.60 | 33.25 | 32.42 | 2.06 | 33.60 | 29.26 | 32.76 | 1.83 | 33.60 |
| OLV | 0.07 | 1.05 | 0.95 | 4.20 | 5.09 | 6.78 | 4.66 | 4.20 | 15.65 | 17.31 | 6.27 | 4.20 |
| PLG | 27.48 | 28.19 | 2.07 | 25.20 | 24.42 | 24.11 | 3.83 | 25.20 | 14.26 | 21.09 | 5.26 | 25.20 |
| CPXA | 10.38 | 14.40 | 2.78 | 12.60 | 0.91 | 12.18 | 5.67 | 12.60 | 13.64 | 3.74 | 3.29 | 12.60 |
| ILM | 13.97 | 13.48 | 2.74 | 16.00 | 16.33 | 16.27 | 2.95 | 16.00 | 21.74 | 16.69 | 3.10 | 16.00 |
| npFe | 0.59 | 0.59 | 0.01 | 0.60 | 0.63 | 0.62 | 0.02 | 0.60 | 0.60 | 0.61 | 0.02 | 0.60 |
| mpFe | 0.00 | 0.00 | 0.00 | 0.00 | 0.37 | 0.37 | 0.01 | 0.40 | 0.80 | 0.82 | 0.02 | 0.80 |
| SUM | 95.21 | 98.51 | 100.00 | 88.29 | 99.94 | 100.00 | 103.42 | 100.30 | 100.00 | |||
| mix39 | mix40 | mix41 | ||||||||||
| Mode | Mean | Std | Theo | Mode | Mean | Std | Theo | Mode | Mean | Std | Theo | |
| OPX | 8.01 | 8.03 | 0.49 | 8.40 | 9.69 | 9.68 | 0.45 | 8.40 | 12.28 | 11.47 | 0.60 | 8.40 |
| CPXB | 31.48 | 31.33 | 2.62 | 33.60 | 28.61 | 29.51 | 2.66 | 33.60 | 21.46 | 27.39 | 3.07 | 33.60 |
| OLV | 6.59 | 15.45 | 7.72 | 4.20 | 8.43 | 3.16 | 2.58 | 4.20 | 21.65 | 25.18 | 9.20 | 4.20 |
| PLG | 21.63 | 21.88 | 6.03 | 25.20 | 20.90 | 22.75 | 3.76 | 25.20 | 3.73 | 8.45 | 5.38 | 25.20 |
| CPXA | 7.93 | 6.93 | 5.59 | 12.60 | 17.66 | 20.38 | 6.31 | 12.60 | 25.15 | 12.35 | 8.62 | 12.60 |
| ILM | 17.69 | 17.02 | 3.22 | 16.00 | 12.54 | 12.15 | 3.03 | 16.00 | 14.29 | 12.78 | 3.08 | 16.00 |
| npFe | 0.63 | 0.63 | 0.03 | 0.60 | 1.35 | 1.35 | 0.03 | 1.40 | 1.32 | 1.35 | 0.04 | 1.40 |
| mpFe | 1.22 | 1.22 | 0.03 | 1.20 | 0.00 | 0.01 | 0.01 | 0.00 | 0.40 | 0.40 | 0.03 | 0.40 |
| SUM | 93.34 | 100.64 | 100.00 | 97.83 | 97.63 | 100.00 | 98.57 | 97.63 | 100.00 | |||
| mix42 | mix43 | mix44 | ||||||||||
| Mode | Mean | Std | Theo | Mode | Mean | Std | Theo | Mode | Mean | Std | Theo | |
| OPX | 7.78 | 7.45 | 0.50 | 8.40 | 7.16 | 6.17 | 0.69 | 8.40 | 9.68 | 9.22 | 0.60 | 8.40 |
| CPXB | 37.17 | 38.83 | 1.61 | 33.60 | 27.73 | 32.31 | 2.35 | 33.60 | 28.12 | 31.30 | 4.25 | 33.60 |
| OLV | 1.45 | 2.77 | 2.21 | 4.20 | 1.73 | 4.39 | 3.39 | 4.20 | 0.77 | 1.32 | 1.27 | 4.20 |
| PLG | 29.75 | 32.75 | 2.86 | 25.20 | 35.06 | 36.52 | 3.60 | 25.20 | 19.32 | 22.58 | 5.31 | 25.20 |
| CPXA | 0.54 | 2.84 | 2.50 | 12.60 | 11.96 | 3.98 | 3.25 | 12.60 | 27.09 | 20.93 | 8.71 | 12.60 |
| ILM | 14.57 | 14.32 | 3.01 | 16.00 | 13.89 | 14.96 | 3.00 | 16.00 | 11.81 | 11.68 | 2.40 | 16.00 |
| npFe | 1.47 | 1.46 | 0.03 | 1.40 | 1.45 | 1.52 | 0.04 | 1.40 | 2.06 | 2.10 | 0.06 | 2.20 |
| mpFe | 0.77 | 0.78 | 0.02 | 0.80 | 1.05 | 1.04 | 0.03 | 1.20 | 0.00 | 0.01 | 0.01 | 0.00 |
| SUM | 91.27 | 98.95 | 100.00 | 97.53 | 98.33 | 100.00 | 96.79 | 97.04 | 100.00 | |||
| mix45 | mix46 | mix47 | ||||||||||
| Mode | Mean | Std | Theo | Mode | Mean | Std | Theo | Mode | Mean | Std | Theo | |
| OPX | 8.27 | 8.68 | 0.56 | 8.40 | 6.65 | 7.77 | 0.68 | 8.40 | 8.11 | 8.37 | 0.83 | 8.40 |
| CPXB | 29.73 | 30.84 | 2.74 | 33.60 | 34.55 | 34.15 | 2.39 | 33.60 | 33.14 | 33.91 | 3.53 | 33.60 |
| OLV | 10.26 | 16.03 | 7.45 | 4.20 | 12.51 | 4.38 | 4.14 | 4.20 | 17.41 | 9.24 | 6.99 | 4.20 |
| PLG | 21.52 | 21.32 | 5.26 | 25.20 | 24.34 | 34.42 | 3.75 | 25.20 | 22.08 | 26.87 | 5.71 | 25.20 |
| CPXA | 2.55 | 8.10 | 6.44 | 12.60 | 5.01 | 4.51 | 3.90 | 12.60 | 0.13 | 6.11 | 5.19 | 12.60 |
| ILM | 14.02 | 13.42 | 3.24 | 16.00 | 16.39 | 12.24 | 3.05 | 16.00 | 15.19 | 12.32 | 3.28 | 16.00 |
| npFe | 2.21 | 2.19 | 0.04 | 2.20 | 2.18 | 2.23 | 0.05 | 2.20 | 2.19 | 2.22 | 0.06 | 2.20 |
| mpFe | 0.44 | 0.43 | 0.03 | 0.40 | 0.80 | 0.79 | 0.03 | 0.80 | 1.08 | 1.11 | 0.05 | 1.20 |
| SUM | 86.35 | 98.39 | 100.00 | 99.44 | 97.47 | 100.00 | 96.07 | 96.83 | 100.00 | |||
| mix0 | mix1 | mix2 | ||||||||||
|---|---|---|---|---|---|---|---|---|---|---|---|---|
| Mode | Mean | Std | Theo | Mode | Mean | Std | Theo | Mode | Mean | Std | Theo | |
| OPX | 9.98 | 9.96 | 0.04 | 10.00 | 9.82 | 9.82 | 0.14 | 10.00 | 10.46 | 10.59 | 0.26 | 10.00 |
| CPXB | 39.99 | 40.04 | 0.16 | 40.00 | 40.72 | 40.51 | 0.88 | 40.00 | 37.65 | 39.10 | 1.50 | 40.00 |
| OLV | 4.62 | 4.65 | 0.28 | 5.00 | 8.80 | 8.81 | 1.78 | 5.00 | 18.93 | 18.69 | 2.89 | 5.00 |
| PLG | 30.29 | 30.31 | 0.21 | 30.00 | 29.41 | 29.28 | 1.50 | 30.00 | 19.10 | 20.83 | 2.48 | 30.00 |
| CPXA | 14.97 | 14.98 | 0.32 | 15.00 | 12.54 | 11.43 | 1.99 | 15.00 | 16.08 | 10.46 | 3.19 | 15.00 |
| ILM | 0.01 | 0.17 | 0.13 | 0.00 | 0.05 | 0.19 | 0.14 | 0.00 | 0.15 | 0.23 | 0.16 | 0.00 |
| npFe | 0.00 | 0.00 | 0.00 | 0.00 | 0.00 | 0.00 | 0.00 | 0.00 | 0.00 | 0.01 | 0.01 | 0.00 |
| mpFe | 0.00 | 0.00 | 0.00 | 0.00 | 0.40 | 0.40 | 0.00 | 0.40 | 0.80 | 0.80 | 0.01 | 0.80 |
| SUM | 99.86 | 100.12 | 100.00 | 101.33 | 100.04 | 100.00 | 102.36 | 99.90 | 100.00 | |||
| mix3 | mix4 | mix5 | ||||||||||
| Mode | Mean | Std | Theo | Mode | Mean | Std | Theo | Mode | Mean | Std | Theo | |
| OPX | 9.70 | 9.81 | 0.34 | 10.00 | 10.22 | 10.45 | 0.20 | 10.00 | 9.87 | 9.87 | 0.23 | 10.00 |
| CPXB | 40.08 | 40.80 | 1.53 | 40.00 | 38.55 | 40.26 | 1.31 | 40.00 | 40.15 | 39.75 | 1.46 | 40.00 |
| OLV | 19.90 | 24.58 | 4.53 | 5.00 | 4.49 | 2.24 | 1.60 | 5.00 | 9.83 | 10.86 | 4.62 | 5.00 |
| PLG | 21.40 | 21.22 | 3.38 | 30.00 | 30.66 | 29.87 | 1.65 | 30.00 | 30.77 | 30.55 | 2.43 | 30.00 |
| CPXA | 8.55 | 3.12 | 2.34 | 15.00 | 20.65 | 17.28 | 3.12 | 15.00 | 8.74 | 8.75 | 4.43 | 15.00 |
| ILM | 0.27 | 0.31 | 0.18 | 0.00 | 0.02 | 0.15 | 0.13 | 0.00 | 0.01 | 0.25 | 0.17 | 0.00 |
| npFe | 0.02 | 0.03 | 0.01 | 0.00 | 0.57 | 0.58 | 0.01 | 0.60 | 0.62 | 0.62 | 0.02 | 0.60 |
| mpFe | 1.19 | 1.19 | 0.02 | 1.20 | 0.02 | 0.02 | 0.00 | 0.00 | 0.40 | 0.40 | 0.01 | 0.40 |
| SUM | 99.90 | 99.84 | 100.00 | 104.59 | 100.24 | 100.00 | 99.36 | 100.03 | 100.00 | |||
| mix6 | mix7 | mix8 | ||||||||||
| Mode | Mean | Std | Theo | Mode | Mean | Std | Theo | Mode | Mean | Std | Theo | |
| OPX | 8.74 | 8.71 | 0.32 | 10.00 | 10.57 | 10.60 | 0.52 | 10.00 | 11.26 | 11.44 | 0.39 | 10.00 |
| CPXB | 46.53 | 45.72 | 1.51 | 40.00 | 39.68 | 40.78 | 2.39 | 40.00 | 33.64 | 33.52 | 2.29 | 40.00 |
| OLV | 12.44 | 12.66 | 4.60 | 5.00 | 8.16 | 11.20 | 5.91 | 5.00 | 6.23 | 2.28 | 1.85 | 5.00 |
| PLG | 30.30 | 30.60 | 3.51 | 30.00 | 31.55 | 31.71 | 4.14 | 30.00 | 20.41 | 21.46 | 2.52 | 30.00 |
| CPXA | 1.32 | 2.03 | 1.80 | 15.00 | 15.52 | 6.07 | 4.41 | 15.00 | 28.42 | 31.32 | 4.86 | 15.00 |
| ILM | 0.27 | 0.28 | 0.18 | 0.00 | 0.01 | 0.26 | 0.18 | 0.00 | 0.00 | 0.11 | 0.10 | 0.00 |
| npFe | 0.68 | 0.68 | 0.01 | 0.60 | 0.55 | 0.57 | 0.02 | 0.60 | 1.34 | 1.33 | 0.02 | 1.40 |
| mpFe | 0.77 | 0.77 | 0.02 | 0.80 | 1.31 | 1.30 | 0.03 | 1.20 | 0.00 | 0.01 | 0.01 | 0.00 |
| SUM | 99.60 | 99.99 | 100.00 | 105.49 | 100.63 | 100.00 | 99.96 | 100.14 | 100.00 | |||
| mix9 | mix10 | mix11 | ||||||||||
| Mode | Mean | Std | Theo | Mode | Mean | Std | Theo | Mode | Mean | Std | Theo | |
| OPX | 9.92 | 10.30 | 0.45 | 10.00 | 9.95 | 9.51 | 0.36 | 10.00 | 8.77 | 8.77 | 0.47 | 10.00 |
| CPXB | 39.89 | 38.58 | 2.54 | 40.00 | 42.86 | 43.97 | 1.56 | 40.00 | 47.18 | 47.21 | 2.19 | 40.00 |
| OLV | 19.99 | 10.13 | 6.04 | 5.00 | 0.47 | 6.67 | 3.90 | 5.00 | 18.30 | 9.47 | 5.32 | 5.00 |
| PLG | 23.52 | 25.36 | 3.16 | 30.00 | 34.66 | 36.59 | 2.81 | 30.00 | 25.20 | 29.05 | 3.24 | 30.00 |
| CPXA | 5.86 | 15.29 | 6.99 | 15.00 | 1.89 | 3.14 | 2.56 | 15.00 | 0.65 | 5.72 | 4.58 | 15.00 |
| ILM | 0.05 | 0.20 | 0.17 | 0.00 | 0.39 | 0.27 | 0.17 | 0.00 | 0.04 | 0.19 | 0.15 | 0.00 |
| npFe | 1.45 | 1.41 | 0.03 | 1.40 | 1.45 | 1.45 | 0.02 | 1.40 | 1.44 | 1.44 | 0.03 | 1.40 |
| mpFe | 0.35 | 0.37 | 0.02 | 0.40 | 0.79 | 0.79 | 0.02 | 0.80 | 1.23 | 1.22 | 0.02 | 1.20 |
| SUM | 99.23 | 99.85 | 100.00 | 90.23 | 100.15 | 100.00 | 100.14 | 100.40 | 100.00 | |||
| mix12 | mix13 | mix14 | ||||||||||
| Mode | Mean | Std | Theo | Mode | Mean | Std | Theo | Mode | Mean | Std | Theo | |
| OPX | 9.89 | 9.86 | 0.47 | 10.00 | 11.59 | 11.36 | 0.48 | 10.00 | 8.00 | 6.91 | 0.67 | 10.00 |
| CPXB | 41.22 | 40.94 | 2.49 | 40.00 | 36.27 | 38.91 | 2.19 | 40.00 | 35.52 | 38.95 | 1.80 | 40.00 |
| OLV | 16.01 | 11.35 | 5.42 | 5.00 | 21.61 | 24.65 | 5.87 | 5.00 | 1.89 | 2.73 | 2.15 | 5.00 |
| PLG | 22.92 | 22.60 | 2.75 | 30.00 | 12.45 | 14.57 | 2.81 | 30.00 | 43.67 | 47.63 | 2.27 | 30.00 |
| CPXA | 14.77 | 15.13 | 6.96 | 15.00 | 17.25 | 9.78 | 5.80 | 15.00 | 9.64 | 3.00 | 2.45 | 15.00 |
| ILM | 0.04 | 0.17 | 0.14 | 0.00 | 0.23 | 0.24 | 0.16 | 0.00 | 0.32 | 0.31 | 0.18 | 0.00 |
| npFe | 2.15 | 2.17 | 0.03 | 2.20 | 2.21 | 2.23 | 0.03 | 2.20 | 2.24 | 2.28 | 0.04 | 2.20 |
| mpFe | 0.00 | 0.01 | 0.01 | 0.00 | 0.34 | 0.34 | 0.02 | 0.40 | 0.71 | 0.73 | 0.03 | 0.80 |
| SUM | 104.85 | 100.04 | 100.00 | 99.40 | 99.50 | 100.00 | 99.04 | 99.54 | 100.00 | |||
| mix15 | mix16 | mix17 | ||||||||||
| Mode | Mean | Std | Theo | Mode | Mean | Std | Theo | Mode | Mean | Std | Theo | |
| OPX | 10.74 | 10.71 | 0.68 | 10.00 | 9.16 | 9.16 | 0.07 | 9.20 | 9.10 | 9.07 | 0.18 | 9.20 |
| CPXB | 38.64 | 38.87 | 3.35 | 40.00 | 36.76 | 36.82 | 0.34 | 36.80 | 38.80 | 38.93 | 1.14 | 36.80 |
| OLV | 30.84 | 11.69 | 7.30 | 5.00 | 5.54 | 5.55 | 0.89 | 4.60 | 5.97 | 6.02 | 2.66 | 4.60 |
| PLG | 18.06 | 23.21 | 3.62 | 30.00 | 26.56 | 26.63 | 0.84 | 27.60 | 27.89 | 28.34 | 2.08 | 27.60 |
| CPXA | 1.24 | 15.30 | 8.40 | 15.00 | 13.22 | 13.38 | 1.25 | 13.80 | 9.58 | 9.24 | 3.01 | 13.80 |
| ILM | 0.04 | 0.18 | 0.14 | 0.00 | 9.00 | 9.32 | 1.37 | 8.00 | 9.83 | 9.18 | 1.51 | 8.00 |
| npFe | 2.18 | 2.19 | 0.05 | 2.20 | 0.00 | 0.00 | 0.00 | 0.00 | 0.00 | 0.01 | 0.01 | 0.00 |
| mpFe | 1.20 | 1.19 | 0.03 | 1.20 | 0.00 | 0.00 | 0.00 | 0.00 | 0.41 | 0.41 | 0.01 | 0.40 |
| SUM | 99.56 | 99.96 | 100.00 | 100.25 | 100.85 | 100.00 | 101.17 | 100.79 | 100.00 | |||
| mix18 | mix19 | mix20 | ||||||||||
| Mode | Mean | Std | Theo | Mode | Mean | Std | Theo | Mode | Mean | Std | Theo | |
| OPX | 8.97 | 9.07 | 0.30 | 9.20 | 10.34 | 10.31 | 0.34 | 9.20 | 8.58 | 8.68 | 0.20 | 9.20 |
| CPXB | 39.54 | 40.16 | 1.71 | 36.80 | 37.29 | 37.60 | 1.71 | 36.80 | 37.72 | 35.96 | 1.22 | 36.80 |
| OLV | 7.04 | 7.04 | 3.25 | 4.60 | 13.78 | 13.89 | 3.35 | 4.60 | 6.29 | 2.64 | 1.86 | 4.60 |
| PLG | 24.80 | 24.46 | 2.97 | 27.60 | 20.78 | 24.97 | 3.01 | 27.60 | 30.27 | 29.36 | 1.29 | 27.60 |
| CPXA | 3.22 | 11.42 | 3.67 | 13.80 | 9.01 | 5.16 | 2.91 | 13.80 | 9.28 | 15.16 | 3.34 | 13.80 |
| ILM | 8.05 | 7.44 | 1.33 | 8.00 | 7.48 | 8.09 | 1.41 | 8.00 | 7.31 | 8.47 | 1.45 | 8.00 |
| npFe | 0.00 | 0.01 | 0.01 | 0.00 | 0.00 | 0.01 | 0.01 | 0.00 | 0.62 | 0.60 | 0.01 | 0.60 |
| mpFe | 0.79 | 0.79 | 0.01 | 0.80 | 1.21 | 1.22 | 0.02 | 1.20 | 0.00 | 0.00 | 0.00 | 0.00 |
| SUM | 91.63 | 99.59 | 100.00 | 98.69 | 100.02 | 100.00 | 99.45 | 100.27 | 100.00 | |||
| mix21 | mix22 | mix23 | ||||||||||
| Mode | Mean | Std | Theo | Mode | Mean | Std | Theo | Mode | Mean | Std | Theo | |
| OPX | 9.45 | 9.46 | 0.31 | 9.20 | 10.34 | 10.32 | 0.40 | 9.20 | 9.04 | 8.91 | 0.49 | 9.20 |
| CPXB | 36.64 | 36.45 | 1.82 | 36.80 | 31.96 | 33.40 | 2.44 | 36.80 | 36.53 | 40.28 | 2.16 | 36.80 |
| OLV | 13.40 | 13.25 | 5.71 | 4.60 | 7.17 | 2.62 | 2.02 | 4.60 | 5.84 | 9.98 | 5.34 | 4.60 |
| PLG | 24.60 | 23.82 | 3.18 | 27.60 | 22.52 | 22.89 | 2.99 | 27.60 | 27.55 | 28.40 | 3.99 | 27.60 |
| CPXA | 4.86 | 8.89 | 5.46 | 13.80 | 20.30 | 22.87 | 5.16 | 13.80 | 12.38 | 4.34 | 3.58 | 13.80 |
| ILM | 9.01 | 7.87 | 1.39 | 8.00 | 7.27 | 7.48 | 1.37 | 8.00 | 10.20 | 8.75 | 1.52 | 8.00 |
| npFe | 0.59 | 0.61 | 0.02 | 0.60 | 0.55 | 0.56 | 0.02 | 0.60 | 0.64 | 0.65 | 0.02 | 0.60 |
| mpFe | 0.40 | 0.40 | 0.01 | 0.40 | 0.79 | 0.79 | 0.01 | 0.80 | 1.20 | 1.22 | 0.03 | 1.20 |
| SUM | 97.96 | 99.74 | 100.00 | 99.56 | 99.58 | 100.00 | 101.53 | 100.66 | 100.00 | |||
| mix24 | mix25 | mix26 | ||||||||||
| Mode | Mean | Std | Theo | Mode | Mean | Std | Theo | Mode | Mean | Std | Theo | |
| OPX | 8.92 | 8.78 | 0.33 | 9.20 | 7.78 | 7.85 | 0.44 | 9.20 | 8.30 | 8.31 | 0.57 | 9.20 |
| CPXB | 35.24 | 36.75 | 1.77 | 36.80 | 36.28 | 33.65 | 2.57 | 36.80 | 35.14 | 37.55 | 2.75 | 36.80 |
| OLV | 10.03 | 10.36 | 3.89 | 4.60 | 17.54 | 7.06 | 5.10 | 4.60 | 19.53 | 7.52 | 4.99 | 4.60 |
| PLG | 26.99 | 27.79 | 2.37 | 27.60 | 20.23 | 26.11 | 3.22 | 27.60 | 27.90 | 31.06 | 3.88 | 27.60 |
| CPXA | 14.37 | 8.10 | 4.91 | 13.80 | 14.95 | 16.77 | 6.89 | 13.80 | 0.88 | 7.74 | 5.60 | 13.80 |
| ILM | 8.44 | 8.38 | 1.47 | 8.00 | 6.99 | 7.63 | 1.40 | 8.00 | 7.18 | 8.24 | 1.48 | 8.00 |
| npFe | 1.42 | 1.41 | 0.02 | 1.40 | 1.43 | 1.41 | 0.03 | 1.40 | 1.43 | 1.42 | 0.03 | 1.40 |
| mpFe | 0.00 | 0.01 | 0.01 | 0.00 | 0.33 | 0.33 | 0.01 | 0.40 | 0.82 | 0.84 | 0.02 | 0.80 |
| SUM | 103.98 | 100.15 | 100.00 | 103.77 | 99.07 | 100.00 | 98.92 | 100.42 | 100.00 | |||
| mix27 | mix28 | mix29 | ||||||||||
| Mode | Mean | Std | Theo | Mode | Mean | Std | Theo | Mode | Mean | Std | Theo | |
| OPX | 10.17 | 10.16 | 0.73 | 9.20 | 9.92 | 9.36 | 0.55 | 9.20 | 7.62 | 7.94 | 0.65 | 9.20 |
| CPXB | 36.80 | 37.10 | 3.46 | 36.80 | 33.27 | 35.56 | 2.70 | 36.80 | 34.58 | 36.30 | 3.07 | 36.80 |
| OLV | 7.18 | 12.13 | 6.96 | 4.60 | 0.03 | 1.76 | 1.66 | 4.60 | 0.85 | 5.14 | 3.96 | 4.60 |
| PLG | 22.46 | 21.37 | 4.13 | 27.60 | 30.29 | 33.73 | 3.30 | 27.60 | 27.30 | 32.25 | 3.68 | 27.60 |
| CPXA | 26.85 | 12.28 | 8.00 | 13.80 | 18.37 | 11.52 | 5.49 | 13.80 | 12.17 | 10.43 | 6.24 | 13.80 |
| ILM | 7.66 | 7.47 | 1.38 | 8.00 | 6.79 | 7.43 | 1.39 | 8.00 | 8.74 | 8.13 | 1.47 | 8.00 |
| npFe | 1.35 | 1.33 | 0.04 | 1.40 | 2.12 | 2.17 | 0.04 | 2.20 | 2.19 | 2.21 | 0.04 | 2.20 |
| mpFe | 1.35 | 1.34 | 0.04 | 1.20 | 0.00 | 0.00 | 0.00 | 0.00 | 0.44 | 0.43 | 0.02 | 0.40 |
| SUM | 111.12 | 100.50 | 100.00 | 98.66 | 99.37 | 100.00 | 91.25 | 100.19 | 100.00 | |||
| mix30 | mix31 | mix32 | ||||||||||
| Mode | Mean | Std | Theo | Mode | Mean | Std | Theo | Mode | Mean | Std | Theo | |
| OPX | 8.22 | 7.50 | 0.64 | 9.20 | 8.78 | 8.73 | 0.81 | 9.20 | 8.43 | 8.42 | 0.11 | 8.40 |
| CPXB | 34.72 | 38.72 | 2.63 | 36.80 | 31.55 | 36.89 | 3.15 | 36.80 | 34.88 | 34.75 | 0.53 | 33.60 |
| OLV | 2.55 | 3.93 | 3.03 | 4.60 | 7.31 | 5.65 | 4.13 | 4.60 | 3.15 | 3.34 | 1.19 | 4.20 |
| PLG | 29.24 | 33.34 | 3.32 | 27.60 | 23.94 | 31.73 | 3.83 | 27.60 | 27.16 | 27.07 | 1.31 | 25.20 |
| CPXA | 17.00 | 8.03 | 4.96 | 13.80 | 17.80 | 7.61 | 5.31 | 13.80 | 11.23 | 10.36 | 1.63 | 12.60 |
| ILM | 10.28 | 8.18 | 1.47 | 8.00 | 9.50 | 8.08 | 1.46 | 8.00 | 16.29 | 16.29 | 1.87 | 16.00 |
| npFe | 2.21 | 2.25 | 0.04 | 2.20 | 2.18 | 2.26 | 0.05 | 2.20 | 0.00 | 0.00 | 0.00 | 0.00 |
| mpFe | 0.74 | 0.75 | 0.03 | 0.80 | 1.01 | 1.02 | 0.04 | 1.20 | 0.00 | 0.00 | 0.00 | 0.00 |
| SUM | 102.02 | 99.70 | 100.00 | 98.88 | 98.68 | 100.00 | 101.14 | 100.23 | 100.00 | |||
| mix33 | mix34 | mix35 | ||||||||||
| Mode | Mean | Std | Theo | Mode | Mean | Std | Theo | Mode | Mean | Std | Theo | |
| OPX | 8.80 | 8.78 | 0.20 | 8.40 | 8.58 | 8.24 | 0.39 | 8.40 | 8.20 | 8.13 | 0.39 | 8.40 |
| CPXB | 31.32 | 31.25 | 1.08 | 33.60 | 31.68 | 34.37 | 2.40 | 33.60 | 31.79 | 34.73 | 2.09 | 33.60 |
| OLV | 7.48 | 7.33 | 1.93 | 4.20 | 3.79 | 3.65 | 2.87 | 4.20 | 7.68 | 3.33 | 2.64 | 4.20 |
| PLG | 20.90 | 21.42 | 2.33 | 25.20 | 18.89 | 22.73 | 3.35 | 25.20 | 25.22 | 29.44 | 3.07 | 25.20 |
| CPXA | 15.02 | 14.69 | 2.30 | 12.60 | 20.51 | 15.34 | 5.50 | 12.60 | 12.48 | 8.71 | 4.40 | 12.60 |
| ILM | 17.26 | 17.27 | 2.10 | 16.00 | 16.84 | 14.59 | 2.01 | 16.00 | 10.65 | 14.55 | 2.23 | 16.00 |
| npFe | 0.00 | 0.00 | 0.00 | 0.00 | 0.01 | 0.02 | 0.01 | 0.00 | 0.03 | 0.03 | 0.01 | 0.00 |
| mpFe | 0.39 | 0.39 | 0.01 | 0.40 | 0.75 | 0.76 | 0.01 | 0.80 | 1.13 | 1.17 | 0.02 | 1.20 |
| SUM | 100.78 | 100.73 | 100.00 | 100.29 | 98.93 | 100.00 | 96.02 | 98.89 | 100.00 | |||
| mix36 | mix37 | mix38 | ||||||||||
| Mode | Mean | Std | Theo | Mode | Mean | Std | Theo | Mode | Mean | Std | Theo | |
| OPX | 8.74 | 8.82 | 0.22 | 8.40 | 7.98 | 8.17 | 0.32 | 8.40 | 8.64 | 8.64 | 0.35 | 8.40 |
| CPXB | 32.58 | 32.55 | 1.21 | 33.60 | 32.08 | 32.49 | 2.02 | 33.60 | 33.89 | 33.40 | 1.60 | 33.60 |
| OLV | 0.16 | 0.98 | 0.87 | 4.20 | 14.84 | 5.94 | 4.03 | 4.20 | 12.93 | 14.69 | 4.96 | 4.20 |
| PLG | 29.40 | 27.14 | 1.70 | 25.20 | 24.14 | 24.35 | 3.04 | 25.20 | 23.20 | 23.26 | 3.63 | 25.20 |
| CPXA | 8.85 | 14.89 | 2.59 | 12.60 | 17.14 | 12.60 | 5.48 | 12.60 | 0.88 | 3.77 | 3.19 | 12.60 |
| ILM | 14.54 | 15.23 | 2.02 | 16.00 | 17.71 | 16.68 | 2.11 | 16.00 | 16.61 | 16.57 | 2.16 | 16.00 |
| npFe | 0.59 | 0.59 | 0.01 | 0.60 | 0.62 | 0.62 | 0.02 | 0.60 | 0.61 | 0.60 | 0.02 | 0.60 |
| mpFe | 0.00 | 0.00 | 0.00 | 0.00 | 0.38 | 0.37 | 0.01 | 0.40 | 0.83 | 0.83 | 0.02 | 0.80 |
| SUM | 94.28 | 99.62 | 100.00 | 113.88 | 100.23 | 100.00 | 96.15 | 100.34 | 100.00 | |||
| mix39 | mix40 | mix41 | ||||||||||
| Mode | Mean | Std | Theo | Mode | Mean | Std | Theo | Mode | Mean | Std | Theo | |
| OPX | 8.94 | 8.13 | 0.59 | 8.40 | 9.43 | 9.61 | 0.44 | 8.40 | 11.01 | 11.40 | 0.60 | 8.40 |
| CPXB | 28.47 | 31.69 | 2.45 | 33.60 | 29.50 | 29.79 | 2.50 | 33.60 | 29.79 | 29.47 | 3.14 | 33.60 |
| OLV | 19.01 | 12.95 | 5.56 | 4.20 | 1.85 | 3.03 | 2.55 | 4.20 | 6.85 | 11.39 | 6.90 | 4.20 |
| PLG | 22.79 | 24.61 | 3.57 | 25.20 | 22.30 | 21.88 | 3.06 | 25.20 | 15.62 | 16.22 | 3.66 | 25.20 |
| CPXA | 5.21 | 6.64 | 4.33 | 12.60 | 21.88 | 20.38 | 5.89 | 12.60 | 14.30 | 16.61 | 8.82 | 12.60 |
| ILM | 13.99 | 16.28 | 2.27 | 16.00 | 13.98 | 14.33 | 2.07 | 16.00 | 14.11 | 13.70 | 2.03 | 16.00 |
| npFe | 0.61 | 0.62 | 0.02 | 0.60 | 1.34 | 1.36 | 0.03 | 1.40 | 1.34 | 1.34 | 0.04 | 1.40 |
| mpFe | 1.21 | 1.23 | 0.03 | 1.20 | 0.00 | 0.01 | 0.01 | 0.00 | 0.44 | 0.45 | 0.02 | 0.40 |
| SUM | 98.42 | 100.30 | 100.00 | 98.95 | 99.02 | 100.00 | 91.69 | 98.78 | 100.00 | |||
| mix42 | mix43 | mix44 | ||||||||||
| Mode | Mean | Std | Theo | Mode | Mean | Std | Theo | Mode | Mean | Std | Theo | |
| OPX | 7.94 | 7.42 | 0.52 | 8.40 | 7.27 | 6.40 | 0.77 | 8.40 | 8.81 | 8.72 | 0.50 | 8.40 |
| CPXB | 37.42 | 38.80 | 1.70 | 33.60 | 27.35 | 31.09 | 3.00 | 33.60 | 35.14 | 34.99 | 2.71 | 33.60 |
| OLV | 4.27 | 3.42 | 2.58 | 4.20 | 2.92 | 5.29 | 3.46 | 4.20 | 0.48 | 1.85 | 1.71 | 4.20 |
| PLG | 27.44 | 31.16 | 2.61 | 25.20 | 30.11 | 33.35 | 3.48 | 25.20 | 18.75 | 24.89 | 3.42 | 25.20 |
| CPXA | 2.32 | 3.05 | 2.40 | 12.60 | 14.10 | 6.28 | 4.87 | 12.60 | 16.43 | 14.23 | 5.74 | 12.60 |
| ILM | 16.46 | 16.30 | 2.19 | 16.00 | 18.46 | 17.29 | 2.03 | 16.00 | 13.81 | 13.84 | 2.03 | 16.00 |
| npFe | 1.45 | 1.47 | 0.03 | 1.40 | 1.48 | 1.51 | 0.04 | 1.40 | 2.16 | 2.16 | 0.04 | 2.20 |
| mpFe | 0.77 | 0.77 | 0.02 | 0.80 | 1.04 | 1.04 | 0.03 | 1.20 | 0.00 | 0.01 | 0.01 | 0.00 |
| SUM | 95.86 | 100.15 | 100.00 | 100.21 | 99.71 | 100.00 | 93.41 | 98.53 | 100.00 | |||
| mix45 | mix46 | mix47 | ||||||||||
| Mode | Mean | Std | Theo | Mode | Mean | Std | Theo | Mode | Mean | Std | Theo | |
| OPX | 8.83 | 8.59 | 0.54 | 8.40 | 7.40 | 7.72 | 0.69 | 8.40 | 8.43 | 8.26 | 0.81 | 8.40 |
| CPXB | 30.16 | 31.74 | 2.36 | 33.60 | 30.12 | 33.81 | 2.60 | 33.60 | 30.28 | 33.86 | 3.12 | 33.60 |
| OLV | 7.10 | 13.91 | 6.05 | 4.20 | 0.75 | 5.23 | 3.93 | 4.20 | 4.59 | 9.46 | 5.67 | 4.20 |
| PLG | 21.86 | 22.24 | 3.59 | 25.20 | 28.09 | 31.50 | 3.57 | 25.20 | 21.38 | 25.01 | 4.08 | 25.20 |
| CPXA | 16.90 | 8.08 | 5.92 | 12.60 | 8.94 | 5.68 | 4.30 | 12.60 | 19.24 | 6.88 | 5.62 | 12.60 |
| ILM | 14.09 | 14.87 | 2.08 | 16.00 | 15.90 | 15.36 | 2.13 | 16.00 | 12.72 | 14.82 | 2.11 | 16.00 |
| npFe | 2.13 | 2.20 | 0.04 | 2.20 | 2.27 | 2.23 | 0.05 | 2.20 | 2.21 | 2.21 | 0.06 | 2.20 |
| mpFe | 0.46 | 0.44 | 0.02 | 0.40 | 0.78 | 0.78 | 0.03 | 0.80 | 1.05 | 1.10 | 0.04 | 1.20 |
| SUM | 98.95 | 99.42 | 100.00 | 91.19 | 99.31 | 100.00 | 96.66 | 98.28 | 100.00 | |||
Appendix A.2. Fresh Laboratory Samples
| SiO2 | TiO2 | Al2O3 | Cr2O3 | MgO | CaO | MnO | FeO | Na2O | K2O | P2O5 | Fe2O3 | |
|---|---|---|---|---|---|---|---|---|---|---|---|---|
| Pargasite | 43.80 | 1.06 | 15.63 | 0.03 | 18.85 | 12.39 | 0.05 | 0.25 | 2.84 | 1.72 | 0.00 | 0.28 |
| Augite | 50.10 | 1.26 | 4.81 | 0.60 | 15.22 | 22.70 | 0.08 | 2.41 | 0.49 | 0.02 | 0.00 | 2.35 |
| Olivine | 37.70 | 0.07 | 0.04 | 0.03 | 35.40 | 0.16 | 0.39 | 26.49 | 0.03 | 0.02 | 0.00 | 0.23 |
| Plagioclase | 54.70 | 0.00 | 28.80 | 0.00 | 0.00 | 11.22 | 0.00 | 0.28 | 4.78 | 0.60 | 0.00 | 0.00 |
| Ferrosilite | 47.90 | 0.05 | 0.32 | 0.03 | 5.18 | 0.88 | 1.92 | 44.70 | 0.03 | 0.03 | 0.00 | 0.20 |
| Ilmenite | 0.02 | 50.40 | 0.02 | 0.12 | 6.15 | 0.00 | 0.26 | 34.10 | 0.00 | 0.00 | 0.00 | 7.90 |
| Mineral | Origin | Abbreviation |
|---|---|---|
| Pargasite | Merelani Hill, Tanzania | PRG |
| Augite | Paškopole, Czech Republic | AUG |
| Olivine | China | OLV |
| Plagioclase | Nordingrå, Sweden | PLG |
| Ferrosilite | Mansjöberg, Sweden | FS |
| Ilmenite | Rogaland, Norway | ILM |
| mix0 | mix1 | mix2 | ||||||||||
|---|---|---|---|---|---|---|---|---|---|---|---|---|
| Mode | Mean | Std | Theo | Mode | Mean | Std | Theo | Mode | Mean | Std | Theo | |
| PRG | 25.37 | 25.58 | 0.60 | 9.20 | 36.74 | 36.95 | 0.59 | 18.50 | 46.19 | 46.24 | 0.47 | 28.10 |
| AUG | 0.02 | 0.14 | 0.11 | 0.00 | 0.03 | 0.11 | 0.09 | 0.00 | 0.00 | 0.10 | 0.08 | 0.00 |
| OLV | 0.00 | 0.05 | 0.05 | 0.00 | 0.00 | 0.05 | 0.04 | 0.00 | 0.00 | 0.04 | 0.04 | 0.00 |
| PLG | 74.59 | 74.13 | 0.70 | 90.80 | 62.94 | 62.83 | 0.67 | 81.50 | 53.73 | 53.88 | 0.57 | 71.90 |
| FS | 0.28 | 0.28 | 0.09 | 0.00 | 0.15 | 0.14 | 0.08 | 0.00 | 0.08 | 0.10 | 0.06 | 0.00 |
| ILM | 14.49 | 13.91 | 1.01 | 0.00 | 13.62 | 14.04 | 0.98 | 0.00 | 11.60 | 11.47 | 0.84 | 0.00 |
| npFe | 0.00 | 0.00 | 0.00 | 0.00 | 0.00 | 0.00 | 0.00 | 0.00 | 0.00 | |||
| mpFe | 0.00 | 0.00 | 0.00 | 0.00 | 0.00 | 0.00 | 0.00 | 0.00 | 0.00 | |||
| SUM | 114.75 | 114.09 | 100.00 | 113.48 | 114.12 | 100.00 | 111.61 | 111.83 | 100.00 | |||
| mix3 | mix4 | mix5 | ||||||||||
| Mode | Mean | Std | Theo | Mode | Mean | Std | Theo | Mode | Mean | Std | Theo | |
| PRG | 78.28 | 78.19 | 0.32 | 68.00 | 83.11 | 82.98 | 0.42 | 78.50 | 90.10 | 90.04 | 0.36 | 89.10 |
| AUG | 0.08 | 0.14 | 0.08 | 0.00 | 0.12 | 0.13 | 0.08 | 0.00 | 0.01 | 0.04 | 0.04 | 0.00 |
| OLV | 0.00 | 0.06 | 0.05 | 0.00 | 0.00 | 0.05 | 0.05 | 0.00 | 0.00 | 0.03 | 0.03 | 0.00 |
| PLG | 22.52 | 22.36 | 0.39 | 32.00 | 17.55 | 17.55 | 0.48 | 21.50 | 10.67 | 10.67 | 0.38 | 10.90 |
| FS | 0.02 | 0.06 | 0.04 | 0.00 | 0.03 | 0.07 | 0.05 | 0.00 | 0.03 | 0.07 | 0.05 | 0.00 |
| ILM | 6.76 | 6.74 | 0.60 | 0.00 | 9.28 | 9.32 | 0.74 | 0.00 | 7.72 | 7.80 | 0.64 | 0.00 |
| npFe | 0.00 | 0.00 | 0.00 | 0.00 | 0.00 | 0.00 | 0.00 | 0.00 | 0.00 | |||
| mpFe | 0.00 | 0.00 | 0.00 | 0.00 | 0.00 | 0.00 | 0.00 | 0.00 | 0.00 | |||
| SUM | 107.67 | 107.55 | 100.00 | 110.08 | 110.10 | 100.00 | 108.53 | 108.65 | 100.00 | |||
| mix6 | mix7 | mix8 | ||||||||||
| Mode | Mean | Std | Theo | Mode | Mean | Std | Theo | Mode | Mean | Std | Theo | |
| PRG | 18.76 | 18.85 | 1.71 | 0.00 | 30.02 | 30.11 | 3.69 | 0.00 | 44.41 | 46.99 | 4.15 | 0.00 |
| AUG | 0.00 | 0.08 | 0.08 | 0.00 | 0.00 | 0.19 | 0.19 | 0.00 | 0.12 | 0.30 | 0.29 | 0.00 |
| OLV | 0.53 | 0.62 | 0.34 | 0.00 | 3.59 | 3.80 | 0.89 | 0.00 | 6.10 | 6.82 | 1.10 | 0.00 |
| PLG | 70.98 | 71.21 | 1.89 | 92.80 | 43.15 | 43.11 | 4.19 | 85.10 | 18.96 | 14.11 | 4.79 | 76.90 |
| FS | 11.93 | 11.88 | 0.24 | 7.20 | 25.74 | 25.64 | 0.56 | 14.90 | 33.49 | 32.96 | 0.68 | 23.10 |
| ILM | 0.06 | 0.61 | 0.57 | 0.00 | 0.04 | 0.68 | 0.63 | 0.00 | 0.15 | 0.82 | 0.79 | 0.00 |
| npFe | 0.00 | 0.00 | 0.00 | 0.00 | 0.00 | 0.00 | 0.00 | 0.00 | 0.00 | |||
| mpFe | 0.00 | 0.00 | 0.00 | 0.00 | 0.00 | 0.00 | 0.00 | 0.00 | 0.00 | |||
| SUM | 102.27 | 103.25 | 100.00 | 102.54 | 103.52 | 100.00 | 103.24 | 101.99 | 100.00 | |||
| mix9 | mix10 | mix11 | ||||||||||
| Mode | Mean | Std | Theo | Mode | Mean | Std | Theo | Mode | Mean | Std | Theo | |
| PRG | 33.27 | 38.70 | 1.84 | 0.00 | 16.89 | 21.22 | 1.76 | 0.00 | 11.88 | 11.52 | 0.82 | 0.00 |
| AUG | 0.22 | 0.72 | 0.72 | 0.00 | 4.18 | 1.27 | 1.10 | 0.00 | 0.09 | 0.57 | 0.50 | 0.00 |
| OLV | 5.66 | 4.77 | 1.11 | 0.00 | 0.73 | 2.21 | 1.13 | 0.00 | 0.04 | 0.50 | 0.40 | 0.00 |
| PLG | 7.45 | 2.09 | 1.80 | 58.80 | 4.32 | 1.58 | 1.59 | 38.00 | 0.09 | 0.72 | 0.65 | 26.30 |
| FS | 57.05 | 57.11 | 0.76 | 41.20 | 80.55 | 80.17 | 0.87 | 62.00 | 93.34 | 93.39 | 0.52 | 73.70 |
| ILM | 0.57 | 0.64 | 0.61 | 0.00 | 0.29 | 0.48 | 0.46 | 0.00 | 0.00 | 0.43 | 0.41 | 0.00 |
| npFe | 0.00 | 0.00 | 0.00 | 0.00 | 0.01 | 0.01 | 0.00 | 0.01 | 0.01 | |||
| mpFe | 0.00 | 0.00 | 0.00 | 0.00 | 0.00 | 0.00 | 0.00 | 0.00 | 0.00 | |||
| SUM | 104.23 | 104.03 | 100.00 | 106.97 | 106.93 | 100.00 | 105.44 | 107.12 | 100.00 | |||
| mix12 | mix13 | mix14 | ||||||||||
| Mode | Mean | Std | Theo | Mode | Mean | Std | Theo | Mode | Mean | Std | Theo | |
| PRG | 3.85 | 3.73 | 1.15 | 0.00 | 3.89 | 7.30 | 3.79 | 0.00 | 53.52 | 55.49 | 1.09 | 56.50 |
| AUG | 3.60 | 2.81 | 1.46 | 0.00 | 18.79 | 3.51 | 3.22 | 54.10 | 0.44 | 0.56 | 0.54 | 0.00 |
| OLV | 1.02 | 1.05 | 0.75 | 0.00 | 6.44 | 6.81 | 3.89 | 0.00 | 0.19 | 0.34 | 0.32 | 0.00 |
| PLG | 0.07 | 0.61 | 0.58 | 13.70 | 0.69 | 3.10 | 2.72 | 0.00 | 0.23 | 0.80 | 0.74 | 0.00 |
| FS | 99.97 | 99.79 | 0.20 | 86.30 | 73.16 | 83.11 | 3.19 | 45.90 | 50.31 | 49.68 | 0.86 | 43.50 |
| ILM | 0.01 | 0.36 | 0.36 | 0.00 | 0.01 | 0.85 | 0.80 | 0.00 | 0.08 | 0.51 | 0.49 | 0.00 |
| npFe | 0.00 | 0.00 | 0.00 | 0.00 | 0.03 | 0.03 | 0.00 | 0.01 | 0.01 | |||
| mpFe | 0.00 | 0.00 | 0.00 | 0.00 | 0.01 | 0.01 | 0.00 | 0.00 | 0.00 | |||
| SUM | 108.52 | 108.35 | 100.00 | 102.97 | 104.68 | 100.00 | 104.77 | 107.38 | 100.00 | |||
| mix15 | mix16 | |||||||||||
| Mode | Mean | Std | Theo | Mode | Mean | Std | Theo | |||||
| PRG | 0.13 | 1.40 | 1.25 | 0.00 | 31.88 | 32.04 | 16.29 | 0.00 | ||||
| AUG | 0.32 | 1.16 | 1.14 | 0.00 | 2.18 | 7.30 | 6.50 | 0.00 | ||||
| OLV | 20.78 | 28.54 | 2.75 | 53.60 | 7.47 | 7.10 | 6.05 | 0.00 | ||||
| PLG | 0.03 | 1.13 | 1.05 | 0.00 | 12.32 | 15.67 | 13.11 | 0.00 | ||||
| FS | 76.62 | 76.17 | 2.66 | 46.40 | 2.69 | 5.92 | 4.58 | 54.60 | ||||
| ILM | 0.05 | 0.46 | 0.45 | 0.00 | 24.88 | 24.85 | 11.52 | 45.40 | ||||
| npFe | 0.00 | 0.01 | 0.01 | 4.87 | 6.82 | 1.85 | ||||||
| mpFe | 0.00 | 0.01 | 0.01 | 0.00 | 0.06 | 0.06 | ||||||
| SUM | 97.93 | 108.85 | 100.00 | 81.42 | 92.88 | 100.00 | ||||||
| mix0 | mix1 | mix2 | ||||||||||
|---|---|---|---|---|---|---|---|---|---|---|---|---|
| Mode | Mean | Std | Theo | Mode | Mean | Std | Theo | Mode | Mean | Std | Theo | |
| PRG | 21.75 | 21.67 | 0.90 | 9.20 | 33.15 | 33.63 | 0.95 | 18.50 | 44.30 | 44.07 | 0.73 | 28.10 |
| AUG | 0.00 | 0.04 | 0.04 | 0.00 | 0.00 | 0.04 | 0.04 | 0.00 | 0.00 | 0.03 | 0.03 | 0.00 |
| OLV | 0.00 | 0.02 | 0.02 | 0.00 | 0.00 | 0.02 | 0.02 | 0.00 | 0.00 | 0.02 | 0.02 | 0.00 |
| PLG | 81.84 | 81.82 | 0.91 | 90.80 | 69.83 | 69.84 | 0.97 | 81.50 | 59.05 | 59.06 | 0.75 | 71.90 |
| FS | 0.00 | 0.04 | 0.04 | 0.00 | 0.00 | 0.03 | 0.03 | 0.00 | 0.00 | 0.02 | 0.02 | 0.00 |
| ILM | 0.00 | 0.01 | 0.01 | 0.00 | 0.00 | 0.03 | 0.03 | 0.00 | 0.02 | 0.07 | 0.06 | 0.00 |
| npFe | 0.01 | 0.01 | 0.00 | 0.01 | 0.01 | 0.00 | 0.01 | 0.01 | 0.00 | |||
| mpFe | 0.00 | 0.00 | 0.00 | 0.00 | 0.00 | 0.00 | 0.00 | 0.00 | 0.00 | |||
| SUM | 103.59 | 103.60 | 100.00 | 102.98 | 103.60 | 100.00 | 103.37 | 103.26 | 100.00 | |||
| mix3 | mix4 | mix5 | ||||||||||
| Mode | Mean | Std | Theo | Mode | Mean | Std | Theo | Mode | Mean | Std | Theo | |
| PRG | 77.43 | 77.62 | 0.36 | 68.00 | 82.29 | 82.36 | 0.56 | 78.50 | 90.05 | 89.82 | 0.46 | 89.10 |
| AUG | 0.00 | 0.02 | 0.02 | 0.00 | 0.00 | 0.03 | 0.03 | 0.00 | 0.00 | 0.02 | 0.02 | 0.00 |
| OLV | 0.00 | 0.01 | 0.01 | 0.00 | 0.00 | 0.02 | 0.02 | 0.00 | 0.00 | 0.01 | 0.01 | 0.00 |
| PLG | 24.59 | 24.50 | 0.40 | 32.00 | 20.20 | 20.37 | 0.60 | 21.50 | 12.26 | 12.40 | 0.52 | 10.90 |
| FS | 0.00 | 0.01 | 0.01 | 0.00 | 0.00 | 0.02 | 0.01 | 0.00 | 0.00 | 0.01 | 0.01 | 0.00 |
| ILM | 1.18 | 1.13 | 0.42 | 0.00 | 1.16 | 1.07 | 0.44 | 0.00 | 1.87 | 1.88 | 0.59 | 0.00 |
| npFe | 0.00 | 0.00 | 0.00 | 0.00 | 0.00 | 0.00 | 0.00 | 0.00 | 0.00 | |||
| mpFe | 0.00 | 0.00 | 0.00 | 0.00 | 0.00 | 0.00 | 0.00 | 0.00 | 0.00 | |||
| SUM | 103.20 | 103.31 | 100.00 | 103.66 | 103.86 | 100.00 | 104.19 | 104.15 | 100.00 | |||
| mix6 | mix7 | mix8 | ||||||||||
| Mode | Mean | Std | Theo | Mode | Mean | Std | Theo | Mode | Mean | Std | Theo | |
| PRG | 0.00 | 0.04 | 0.04 | 0.00 | 0.00 | 0.07 | 0.07 | 0.00 | 0.03 | 0.13 | 0.12 | 0.00 |
| AUG | 0.00 | 0.02 | 0.02 | 0.00 | 0.00 | 0.05 | 0.05 | 0.00 | 0.00 | 0.08 | 0.08 | 0.00 |
| OLV | 0.00 | 0.07 | 0.07 | 0.00 | 0.01 | 0.26 | 0.23 | 0.00 | 0.09 | 0.42 | 0.37 | 0.00 |
| PLG | 90.55 | 90.52 | 0.18 | 92.80 | 75.78 | 75.95 | 0.36 | 85.10 | 65.61 | 65.87 | 0.53 | 76.90 |
| FS | 13.00 | 12.97 | 0.21 | 7.20 | 27.53 | 28.27 | 0.39 | 14.90 | 37.41 | 37.46 | 0.55 | 23.10 |
| ILM | 0.00 | 0.00 | 0.00 | 0.00 | 0.00 | 0.00 | 0.00 | 0.00 | 0.00 | 0.00 | 0.00 | 0.00 |
| npFe | 0.00 | 0.00 | 0.00 | 0.00 | 0.00 | 0.00 | 0.00 | 0.00 | 0.00 | |||
| mpFe | 0.00 | 0.00 | 0.00 | 0.00 | 0.00 | 0.00 | 0.00 | 0.00 | 0.00 | |||
| SUM | 103.55 | 103.63 | 100.00 | 103.32 | 104.60 | 100.00 | 103.15 | 103.96 | 100.00 | |||
| mix9 | mix10 | mix11 | ||||||||||
| Mode | Mean | Std | Theo | Mode | Mean | Std | Theo | Mode | Mean | Std | Theo | |
| PRG | 0.00 | 0.24 | 0.22 | 0.00 | 0.04 | 0.41 | 0.36 | 0.00 | 0.60 | 0.65 | 0.51 | 0.00 |
| AUG | 0.01 | 0.15 | 0.14 | 0.00 | 0.03 | 0.24 | 0.22 | 0.00 | 0.07 | 0.22 | 0.21 | 0.00 |
| OLV | 0.21 | 0.57 | 0.50 | 0.00 | 0.17 | 0.81 | 0.68 | 0.00 | 0.04 | 0.33 | 0.30 | 0.00 |
| PLG | 44.43 | 43.97 | 0.74 | 58.80 | 20.86 | 24.01 | 0.86 | 38.00 | 10.20 | 11.87 | 0.68 | 26.30 |
| FS | 60.48 | 60.54 | 0.77 | 41.20 | 79.36 | 81.98 | 0.82 | 62.00 | 94.13 | 94.14 | 0.54 | 73.70 |
| ILM | 0.00 | 0.00 | 0.00 | 0.00 | 0.00 | 0.01 | 0.01 | 0.00 | 0.00 | 0.01 | 0.01 | 0.00 |
| npFe | 0.00 | 0.01 | 0.01 | 0.00 | 0.01 | 0.01 | 0.00 | 0.01 | 0.01 | |||
| mpFe | 0.00 | 0.00 | 0.00 | 0.00 | 0.00 | 0.00 | 0.00 | 0.00 | 0.00 | |||
| SUM | 105.12 | 105.47 | 100.00 | 100.45 | 107.45 | 100.00 | 105.04 | 107.22 | 100.00 | |||
| mix12 | mix13 | mix14 | ||||||||||
| Mode | Mean | Std | Theo | Mode | Mean | Std | Theo | Mode | Mean | Std | Theo | |
| PRG | 0.74 | 0.79 | 0.62 | 0.00 | 8.07 | 7.41 | 3.77 | 0.00 | 53.34 | 55.50 | 1.11 | 56.50 |
| AUG | 0.16 | 0.48 | 0.41 | 0.00 | 0.68 | 3.63 | 3.17 | 54.10 | 0.43 | 0.55 | 0.54 | 0.00 |
| OLV | 2.35 | 2.48 | 0.87 | 0.00 | 3.13 | 6.65 | 3.83 | 0.00 | 0.05 | 0.34 | 0.33 | 0.00 |
| PLG | 2.67 | 4.26 | 1.04 | 13.70 | 0.67 | 2.99 | 2.61 | 0.00 | 2.59 | 0.86 | 0.80 | 0.00 |
| FS | 99.99 | 99.82 | 0.18 | 86.30 | 84.39 | 83.10 | 3.07 | 45.90 | 49.70 | 49.72 | 0.85 | 43.50 |
| ILM | 0.00 | 0.01 | 0.01 | 0.00 | 0.89 | 1.00 | 0.23 | 0.00 | 0.10 | 0.13 | 0.11 | 0.00 |
| npFe | 0.00 | 0.01 | 0.00 | 0.01 | 0.03 | 0.03 | 0.00 | 0.01 | 0.01 | |||
| mpFe | 0.00 | 0.00 | 0.00 | 0.00 | 0.01 | 0.01 | 0.00 | 0.00 | 0.00 | |||
| SUM | 105.91 | 107.82 | 100.00 | 97.84 | 104.78 | 100.00 | 106.22 | 107.10 | 100.00 | |||
| mix15 | mix16 | |||||||||||
| Mode | Mean | Std | Theo | Mode | Mean | Std | Theo | |||||
| PRG | 0.19 | 0.57 | 0.51 | 0.00 | 15.11 | 20.78 | 11.02 | 0.00 | ||||
| AUG | 0.09 | 0.45 | 0.41 | 0.00 | 0.86 | 6.57 | 5.86 | 0.00 | ||||
| OLV | 25.41 | 29.63 | 2.56 | 53.60 | 5.08 | 8.53 | 6.56 | 0.00 | ||||
| PLG | 0.19 | 1.34 | 1.20 | 0.00 | 5.39 | 10.36 | 8.50 | 0.00 | ||||
| FS | 76.07 | 76.51 | 2.66 | 46.40 | 6.43 | 6.34 | 4.50 | 54.60 | ||||
| ILM | 0.00 | 0.02 | 0.01 | 0.00 | 42.06 | 41.83 | 5.49 | 45.40 | ||||
| npFe | 0.00 | 0.01 | 0.01 | 4.09 | 5.65 | 1.63 | ||||||
| mpFe | 0.00 | 0.01 | 0.01 | 0.00 | 0.04 | 0.05 | ||||||
| SUM | 101.94 | 108.51 | 100.00 | 74.93 | 94.42 | 100.00 | ||||||
Appendix A.3. LSCC Samples
| SiO2 | TiO2 | Al2O3 | Cr2O3 | MgO | CaO | MnO | FeO | Na2O | K2O | P2O5 | Fe2O3 | |
|---|---|---|---|---|---|---|---|---|---|---|---|---|
| 10084 | 41.3 | 8.30 | 12.00 | 0.30 | 8.46 | 11.60 | 0.21 | 15.50 | 0.39 | 0.12 | 0.12 | 0.17 |
| 12001 | 45.3 | 3.20 | 11.00 | 0.41 | 10.60 | 9.83 | 0.21 | 16.90 | 0.39 | 0.21 | 0.23 | 0.11 |
| 12030 | 46.1 | 3.74 | 10.50 | 0.40 | 9.94 | 9.09 | 0.23 | 17.60 | 0.41 | 0.26 | 0.19 | 0.12 |
| 14141 | 47.2 | 1.96 | 15.00 | 0.26 | 11.00 | 10.10 | 0.15 | 11.60 | 0.59 | 0.47 | 0.26 | 0.07 |
| 14163 | 47.1 | 2.00 | 15.40 | 0.23 | 11.00 | 10.20 | 0.15 | 11.50 | 0.57 | 0.41 | 0.21 | 0.08 |
| 14259 | 47.1 | 1.99 | 15.80 | 0.24 | 10.70 | 10.50 | 0.15 | 11.00 | 0.60 | 0.43 | 0.26 | 0.09 |
| 14260 | 47.4 | 1.86 | 16.30 | 0.22 | 10.40 | 10.70 | 0.14 | 10.70 | 0.60 | 0.44 | 0.22 | 0.10 |
| 15041 | 46.1 | 2.03 | 12.50 | 0.39 | 11.20 | 9.91 | 0.20 | 15.20 | 0.36 | 0.16 | 0.19 | 0.11 |
| 15071 | 45.8 | 2.33 | 12.40 | 0.43 | 11.40 | 9.81 | 0.21 | 15.60 | 0.36 | 0.14 | 0.15 | 0.10 |
| 61141 | 44.5 | 0.58 | 26.10 | 0.11 | 6.56 | 15.20 | 0.08 | 5.15 | 0.46 | 0.10 | 0.06 | 0.05 |
| 61221 | 44.5 | 0.56 | 27.20 | 0.09 | 5.45 | 15.90 | 0.06 | 4.62 | 0.46 | 0.07 | 0.05 | 0.04 |
| 62231 | 44.5 | 0.58 | 25.70 | 0.11 | 6.59 | 15.30 | 0.09 | 5.31 | 0.42 | 0.09 | 0.07 | 0.08 |
| 64801 | 44.6 | 0.63 | 26.50 | 0.10 | 6.09 | 15.60 | 0.08 | 4.82 | 0.44 | 0.12 | 0.06 | 0.10 |
| 67461 | 44.4 | 0.44 | 27.30 | 0.09 | 5.11 | 16.10 | 0.07 | 4.93 | 0.41 | 0.05 | 0.03 | 0.07 |
| 67481 | 44.7 | 0.49 | 26.70 | 0.09 | 5.98 | 15.60 | 0.08 | 5.19 | 0.45 | 0.06 | 0.05 | 0.04 |
| 70181 | 40.7 | 8.11 | 11.50 | 0.43 | 10.10 | 10.30 | 0.22 | 16.00 | 0.35 | 0.08 | 0.06 | 0.16 |
| 71061 | 39.2 | 9.48 | 9.33 | 0.48 | 10.80 | 9.58 | 0.23 | 18.50 | 0.34 | 0.07 | 0.04 | 0.17 |
| 71501 | 38.4 | 10.70 | 9.94 | 0.46 | 9.97 | 9.94 | 0.24 | 17.80 | 0.35 | 0.07 | 0.07 | 0.17 |
| 79221 | 40.5 | 7.38 | 11.60 | 0.40 | 10.90 | 10.30 | 0.22 | 15.80 | 0.38 | 0.09 | 0.06 | 0.17 |
| 10084 | 12001 | 12030 | ||||||||||
|---|---|---|---|---|---|---|---|---|---|---|---|---|
| Mode | Mean | Std | Theo | Mode | Mean | Std | Theo | Mode | Mean | Std | Theo | |
| OPX | 11.50 | 10.73 | 0.47 | 0.80 | 23.14 | 22.92 | 0.61 | 1.99 | 22.83 | 22.88 | 0.82 | 6.48 |
| CPX | 40.09 | 35.27 | 1.85 | 36.69 | 46.20 | 45.63 | 1.70 | 43.75 | 42.33 | 37.70 | 2.23 | 50.40 |
| OLV | 7.11 | 11.70 | 4.19 | 3.28 | 7.02 | 2.31 | 1.90 | 8.24 | 9.02 | 4.59 | 3.55 | 7.24 |
| PLG | 12.94 | 11.94 | 2.50 | 39.34 | 7.15 | 11.68 | 2.09 | 32.46 | 12.38 | 21.34 | 3.99 | 25.77 |
| OTH | 4.92 | 7.27 | 5.73 | |||||||||
| ILM | 6.52 | 12.01 | 2.15 | 14.98 | 6.01 | 5.50 | 1.03 | 6.30 | 8.04 | 7.88 | 1.28 | 4.38 |
| npFe | 1.86 | 1.94 | 0.04 | 1.56 | 1.51 | 0.03 | 0.35 | 0.35 | 0.02 | |||
| mpFe | 0.69 | 0.68 | 0.03 | 0.79 | 0.84 | 0.02 | 0.33 | 0.34 | 0.02 | |||
| SUM | 78.16 | 81.66 | 100.00 | 89.52 | 88.03 | 100.00 | 94.60 | 94.39 | 100.00 | |||
| 14141 | 14163 | 14259 | ||||||||||
| Mode | Mean | Std | Theo | Mode | Mean | Std | Theo | Mode | Mean | Std | Theo | |
| OPX | 17.03 | 16.99 | 0.51 | 13.93 | 11.87 | 11.86 | 0.48 | 16.34 | 12.55 | 12.67 | 0.49 | 20.03 |
| CPX | 6.75 | 7.71 | 1.63 | 22.53 | 4.77 | 6.36 | 1.68 | 24.33 | 5.52 | 9.77 | 1.62 | 29.09 |
| OLV | 14.17 | 14.45 | 5.81 | 7.36 | 22.77 | 21.99 | 6.14 | 6.03 | 14.46 | 5.12 | 3.79 | 6.22 |
| PLG | 54.09 | 54.11 | 5.08 | 48.96 | 47.60 | 48.62 | 5.11 | 47.51 | 55.10 | 60.57 | 3.22 | 38.16 |
| OTH | 3.72 | 3.77 | 2.98 | |||||||||
| ILM | 4.32 | 4.29 | 0.73 | 3.50 | 3.80 | 4.19 | 0.71 | 2.01 | 4.08 | 4.09 | 0.69 | 3.52 |
| npFe | 0.16 | 0.16 | 0.01 | 0.58 | 0.59 | 0.02 | 1.07 | 1.07 | 0.02 | |||
| mpFe | 0.11 | 0.11 | 0.01 | 0.20 | 0.20 | 0.02 | 0.35 | 0.36 | 0.02 | |||
| SUM | 96.36 | 97.56 | 100.00 | 90.82 | 93.03 | 100.00 | 91.71 | 92.21 | 100.00 | |||
| 14260 | 15041 | 15071 | ||||||||||
| Mode | Mean | Std | Theo | Mode | Mean | Std | Theo | Mode | Mean | Std | Theo | |
| OPX | 14.83 | 15.01 | 0.51 | 13.98 | 23.31 | 23.26 | 0.66 | 8.13 | 23.34 | 23.12 | 0.65 | 6.66 |
| CPX | 9.27 | 12.13 | 1.82 | 26.88 | 34.16 | 40.74 | 2.61 | 40.35 | 36.26 | 39.39 | 2.12 | 38.97 |
| OLV | 1.67 | 4.16 | 3.15 | 6.27 | 13.24 | 4.73 | 3.34 | 7.11 | 3.41 | 4.42 | 3.26 | 8.06 |
| PLG | 56.09 | 57.35 | 3.04 | 46.59 | 13.38 | 16.89 | 2.84 | 33.41 | 16.28 | 20.43 | 2.70 | 37.42 |
| OTH | 3.58 | 8.41 | 4.96 | |||||||||
| ILM | 4.40 | 3.65 | 0.65 | 2.69 | 3.18 | 3.19 | 0.64 | 2.59 | 3.43 | 4.05 | 0.78 | 3.93 |
| npFe | 1.11 | 1.13 | 0.02 | 1.60 | 1.59 | 0.04 | 1.33 | 1.34 | 0.03 | |||
| mpFe | 0.40 | 0.40 | 0.02 | 0.80 | 0.83 | 0.03 | 0.71 | 0.72 | 0.02 | |||
| SUM | 86.26 | 92.30 | 100.00 | 87.27 | 88.81 | 100.00 | 82.73 | 91.42 | 100.00 | |||
| 61141 | 61221 | 62231 | ||||||||||
| Mode | Mean | Std | Theo | Mode | Mean | Std | Theo | Mode | Mean | Std | Theo | |
| OPX | 4.63 | 4.54 | 0.28 | 3.39 | 4.46 | 4.46 | 0.17 | 4.18 | 4.25 | 4.30 | 0.28 | 4.23 |
| CPX | 0.54 | 1.81 | 0.54 | 5.39 | 0.38 | 1.18 | 0.33 | 6.22 | 0.79 | 1.59 | 0.46 | 6.19 |
| OLV | 6.46 | 4.21 | 2.37 | 4.24 | 18.11 | 17.15 | 2.00 | 5.50 | 10.41 | 6.20 | 2.83 | 5.90 |
| PLG | 80.98 | 84.45 | 2.30 | 85.77 | 75.09 | 74.80 | 1.82 | 82.83 | 78.55 | 81.98 | 2.61 | 82.45 |
| OTH | 0.61 | 0.42 | 0.61 | |||||||||
| ILM | 1.17 | 1.11 | 0.20 | 0.61 | 1.08 | 1.14 | 0.20 | 0.85 | 1.18 | 1.10 | 0.18 | 0.61 |
| npFe | 0.43 | 0.42 | 0.01 | 0.06 | 0.06 | 0.00 | 0.49 | 0.47 | 0.01 | |||
| mpFe | 0.15 | 0.15 | 0.01 | 0.03 | 0.03 | 0.00 | 0.14 | 0.15 | 0.01 | |||
| SUM | 93.77 | 96.11 | 100.00 | 99.12 | 98.73 | 100.00 | 95.18 | 95.17 | 100.00 | |||
| 64801 | 67461 | 67481 | ||||||||||
| Mode | Mean | Std | Theo | Mode | Mean | Std | Theo | Mode | Mean | Std | Theo | |
| OPX | 4.26 | 4.20 | 0.26 | 4.40 | 5.86 | 5.90 | 0.18 | 3.97 | 5.03 | 5.06 | 0.14 | 4.09 |
| CPX | 0.10 | 1.83 | 0.52 | 5.40 | 3.59 | 4.41 | 0.52 | 5.80 | 0.46 | 0.97 | 0.29 | 5.06 |
| OLV | 7.21 | 3.14 | 2.04 | 3.90 | 5.81 | 7.89 | 2.23 | 3.36 | 11.70 | 12.80 | 1.80 | 5.55 |
| PLG | 80.78 | 85.12 | 2.09 | 85.21 | 81.34 | 81.08 | 1.97 | 86.33 | 79.37 | 79.24 | 1.63 | 84.88 |
| OTH | 0.43 | 0.13 | 0.28 | |||||||||
| ILM | 1.15 | 1.20 | 0.21 | 0.65 | 0.79 | 0.81 | 0.16 | 0.40 | 0.97 | 0.99 | 0.18 | 0.14 |
| npFe | 0.44 | 0.43 | 0.01 | 0.12 | 0.11 | 0.00 | 0.15 | 0.15 | 0.00 | |||
| mpFe | 0.12 | 0.12 | 0.01 | 0.03 | 0.03 | 0.00 | 0.04 | 0.04 | 0.00 | |||
| SUM | 93.50 | 95.49 | 100.00 | 97.40 | 100.10 | 100.00 | 97.52 | 99.05 | 100.00 | |||
| 70181 | 71061 | 71501 | ||||||||||
| Mode | Mean | Std | Theo | Mode | Mean | Std | Theo | Mode | Mean | Std | Theo | |
| OPX | 13.66 | 13.64 | 0.37 | 3.25 | 0.01 | 0.38 | 0.34 | 2.33 | 12.40 | 12.80 | 0.48 | 2.62 |
| CPX | 27.30 | 25.51 | 1.61 | 30.63 | 0.01 | 2.16 | 0.49 | 39.16 | 31.62 | 31.59 | 1.28 | 35.99 |
| OLV | 10.69 | 7.64 | 3.89 | 7.75 | 17.97 | 11.64 | 6.67 | 7.90 | 0.71 | 1.87 | 1.54 | 6.56 |
| PLG | 19.93 | 24.47 | 2.94 | 36.40 | 54.89 | 61.00 | 6.35 | 28.14 | 18.33 | 18.95 | 2.22 | 30.05 |
| OTH | 2.80 | 1.42 | 2.37 | |||||||||
| ILM | 18.70 | 19.81 | 3.04 | 19.17 | 36.26 | 37.29 | 5.84 | 21.06 | 30.79 | 27.04 | 4.04 | 22.40 |
| npFe | 1.77 | 1.77 | 0.03 | 1.03 | 1.03 | 0.04 | 1.78 | 1.77 | 0.03 | |||
| mpFe | 0.65 | 0.66 | 0.02 | 0.12 | 0.14 | 0.03 | 0.64 | 0.64 | 0.02 | |||
| SUM | 90.28 | 91.08 | 100.00 | 109.14 | 112.47 | 100.00 | 93.85 | 92.24 | 100.00 | |||
| 79221 | ||||||||||||
| Mode | Mean | Std | Theo | |||||||||
| OPX | 10.76 | 10.76 | 0.44 | 3.48 | ||||||||
| CPX | 11.62 | 12.80 | 1.82 | 27.70 | ||||||||
| OLV | 24.71 | 23.59 | 6.37 | 11.35 | ||||||||
| PLG | 24.64 | 27.31 | 3.09 | 39.97 | ||||||||
| OTH | 0.24 | |||||||||||
| ILM | 16.49 | 16.34 | 2.59 | 17.27 | ||||||||
| npFe | 1.82 | 1.81 | 0.04 | |||||||||
| mpFe | 0.60 | 0.60 | 0.02 | |||||||||
| SUM | 88.22 | 90.80 | 100.00 | |||||||||
| 10084 | 12001 | 12030 | ||||||||||
|---|---|---|---|---|---|---|---|---|---|---|---|---|
| Mode | Mean | Std | Theo | Mode | Mean | Std | Theo | Mode | Mean | Std | Theo | |
| OPX | 11.11 | 10.90 | 0.47 | 0.80 | 23.03 | 22.88 | 0.61 | 1.99 | 23.47 | 22.88 | 0.87 | 6.48 |
| CPX | 44.61 | 42.22 | 2.44 | 36.69 | 47.34 | 45.81 | 1.58 | 43.75 | 42.67 | 37.88 | 2.14 | 50.40 |
| OLV | 1.32 | 2.55 | 1.93 | 3.28 | 1.74 | 1.33 | 1.13 | 8.24 | 0.85 | 1.80 | 1.46 | 7.24 |
| PLG | 12.05 | 13.44 | 2.74 | 39.34 | 10.86 | 12.03 | 1.61 | 32.46 | 19.70 | 23.19 | 2.27 | 25.77 |
| OTH | 4.92 | 7.27 | 5.73 | |||||||||
| ILM | 15.03 | 14.58 | 2.22 | 14.98 | 5.51 | 6.96 | 1.37 | 6.30 | 7.44 | 10.18 | 1.84 | 4.38 |
| npFe | 1.93 | 1.93 | 0.05 | 1.51 | 1.51 | 0.03 | 0.33 | 0.35 | 0.02 | |||
| mpFe | 0.68 | 0.71 | 0.02 | 0.86 | 0.84 | 0.02 | 0.35 | 0.35 | 0.02 | |||
| SUM | 84.13 | 83.69 | 100.00 | 88.48 | 89.02 | 100.00 | 94.13 | 95.95 | 100.00 | |||
| 14141 | 14163 | 14259 | ||||||||||
| Mode | Mean | Std | Theo | Mode | Mean | Std | Theo | Mode | Mean | Std | Theo | |
| OPX | 17.00 | 16.94 | 0.48 | 13.93 | 11.44 | 11.76 | 0.46 | 16.34 | 13.01 | 12.75 | 0.50 | 20.03 |
| CPX | 14.26 | 8.50 | 1.43 | 22.53 | 11.13 | 8.42 | 1.58 | 24.33 | 18.66 | 9.38 | 1.69 | 29.09 |
| OLV | 7.15 | 12.81 | 3.41 | 7.36 | 16.92 | 16.65 | 3.46 | 6.03 | 4.44 | 9.80 | 3.10 | 6.22 |
| PLG | 55.31 | 54.75 | 3.15 | 48.96 | 49.34 | 51.88 | 3.23 | 47.51 | 51.95 | 55.64 | 2.87 | 38.16 |
| OTH | 3.72 | 3.77 | 2.98 | |||||||||
| ILM | 4.68 | 5.14 | 0.95 | 3.50 | 4.60 | 5.02 | 0.93 | 2.01 | 5.10 | 4.99 | 0.90 | 3.52 |
| npFe | 0.16 | 0.16 | 0.01 | 0.58 | 0.59 | 0.02 | 1.06 | 1.07 | 0.02 | |||
| mpFe | 0.12 | 0.11 | 0.01 | 0.21 | 0.21 | 0.01 | 0.33 | 0.34 | 0.02 | |||
| SUM | 98.40 | 98.13 | 100.00 | 93.43 | 93.72 | 100.00 | 93.16 | 92.56 | 100.00 | |||
| 14260 | 15041 | 15071 | ||||||||||
| Mode | Mean | Std | Theo | Mode | Mean | Std | Theo | Mode | Mean | Std | Theo | |
| OPX | 15.88 | 15.14 | 0.55 | 13.98 | 23.36 | 23.36 | 0.67 | 8.13 | 23.28 | 23.19 | 0.64 | 6.66 |
| CPX | 19.94 | 12.82 | 2.27 | 26.88 | 48.17 | 42.50 | 2.94 | 40.35 | 46.71 | 40.36 | 2.28 | 38.97 |
| OLV | 6.42 | 7.51 | 2.98 | 6.27 | 5.71 | 2.85 | 2.24 | 7.11 | 3.92 | 2.95 | 2.18 | 8.06 |
| PLG | 45.68 | 52.69 | 3.60 | 46.59 | 8.07 | 16.75 | 3.02 | 33.41 | 17.03 | 20.63 | 2.33 | 37.42 |
| OTH | 3.58 | 8.41 | 4.96 | |||||||||
| ILM | 4.29 | 4.38 | 0.85 | 2.69 | 3.75 | 3.76 | 0.82 | 2.59 | 4.75 | 4.92 | 0.97 | 3.93 |
| npFe | 1.03 | 1.12 | 0.04 | 1.55 | 1.58 | 0.04 | 1.34 | 1.34 | 0.03 | |||
| mpFe | 0.39 | 0.39 | 0.02 | 0.83 | 0.83 | 0.03 | 0.71 | 0.72 | 0.02 | |||
| SUM | 92.21 | 92.54 | 100.00 | 89.07 | 89.21 | 100.00 | 95.69 | 92.05 | 100.00 | |||
| 61141 | 61221 | 62231 | ||||||||||
| Mode | Mean | Std | Theo | Mode | Mean | Std | Theo | Mode | Mean | Std | Theo | |
| OPX | 4.80 | 4.74 | 0.26 | 3.39 | 4.47 | 4.33 | 0.17 | 4.18 | 4.52 | 4.50 | 0.30 | 4.23 |
| CPX | 0.70 | 1.18 | 0.35 | 5.39 | 3.48 | 2.11 | 0.42 | 6.22 | 0.01 | 1.35 | 0.35 | 6.19 |
| OLV | 10.81 | 10.48 | 1.76 | 4.24 | 13.99 | 14.02 | 1.75 | 5.50 | 12.53 | 11.42 | 1.90 | 5.90 |
| PLG | 77.39 | 78.33 | 1.77 | 85.77 | 75.05 | 77.15 | 1.51 | 82.83 | 75.88 | 76.57 | 1.93 | 82.45 |
| OTH | 0.61 | 0.42 | 0.61 | |||||||||
| ILM | 1.30 | 1.32 | 0.26 | 0.61 | 1.13 | 1.26 | 0.26 | 0.85 | 1.17 | 1.28 | 0.25 | 0.61 |
| npFe | 0.44 | 0.44 | 0.01 | 0.06 | 0.06 | 0.00 | 0.48 | 0.48 | 0.01 | |||
| mpFe | 0.13 | 0.13 | 0.01 | 0.03 | 0.03 | 0.00 | 0.14 | 0.14 | 0.01 | |||
| SUM | 95.00 | 96.05 | 100.00 | 98.11 | 98.88 | 100.00 | 94.11 | 95.12 | 100.00 | |||
| 64801 | 67461 | 67481 | ||||||||||
| Mode | Mean | Std | Theo | Mode | Mean | Std | Theo | Mode | Mean | Std | Theo | |
| OPX | 4.75 | 4.42 | 0.26 | 4.40 | 5.95 | 5.93 | 0.16 | 3.97 | 5.06 | 5.05 | 0.14 | 4.09 |
| CPX | 4.89 | 1.42 | 0.36 | 5.40 | 4.26 | 4.39 | 0.47 | 5.80 | 0.39 | 1.09 | 0.29 | 5.06 |
| OLV | 8.18 | 9.09 | 1.63 | 3.90 | 9.77 | 8.29 | 1.54 | 3.36 | 12.19 | 12.59 | 1.46 | 5.55 |
| PLG | 75.77 | 79.08 | 1.72 | 85.21 | 81.29 | 80.61 | 1.37 | 86.33 | 79.25 | 79.28 | 1.32 | 84.88 |
| OTH | 0.43 | 0.13 | 0.28 | |||||||||
| ILM | 1.09 | 1.42 | 0.28 | 0.65 | 0.84 | 0.95 | 0.21 | 0.40 | 1.09 | 1.13 | 0.23 | 0.14 |
| npFe | 0.44 | 0.44 | 0.01 | 0.12 | 0.12 | 0.00 | 0.15 | 0.15 | 0.00 | |||
| mpFe | 0.11 | 0.11 | 0.01 | 0.03 | 0.03 | 0.00 | 0.04 | 0.04 | 0.00 | |||
| SUM | 94.68 | 95.45 | 100.00 | 102.11 | 100.17 | 100.00 | 97.98 | 99.15 | 100.00 | |||
| 70181 | 71061 | 71501 | ||||||||||
| Mode | Mean | Std | Theo | Mode | Mean | Std | Theo | Mode | Mean | Std | Theo | |
| OPX | 13.62 | 13.71 | 0.38 | 3.25 | 0.13 | 0.40 | 0.37 | 2.33 | 12.43 | 12.77 | 0.47 | 2.62 |
| CPX | 29.07 | 28.56 | 1.82 | 30.63 | 7.99 | 2.63 | 0.50 | 39.16 | 34.36 | 32.03 | 1.25 | 35.99 |
| OLV | 1.71 | 4.28 | 2.56 | 7.75 | 12.94 | 18.69 | 3.06 | 7.90 | 0.13 | 1.46 | 1.22 | 6.56 |
| PLG | 19.83 | 24.09 | 2.78 | 36.40 | 53.99 | 54.66 | 3.53 | 28.14 | 17.31 | 18.64 | 2.06 | 30.05 |
| OTH | 2.80 | 1.42 | 2.37 | |||||||||
| ILM | 19.08 | 21.83 | 3.11 | 19.17 | 35.52 | 32.99 | 4.39 | 21.06 | 28.94 | 27.94 | 3.61 | 22.40 |
| npFe | 1.77 | 1.76 | 0.03 | 1.00 | 1.03 | 0.04 | 1.74 | 1.77 | 0.03 | |||
| mpFe | 0.67 | 0.66 | 0.02 | 0.13 | 0.11 | 0.02 | 0.66 | 0.64 | 0.02 | |||
| SUM | 83.31 | 92.47 | 100.00 | 110.56 | 109.37 | 100.00 | 93.17 | 92.84 | 100.00 | |||
| 79221 | ||||||||||||
| Mode | Mean | Std | Theo | |||||||||
| OPX | 11.26 | 11.10 | 0.40 | 3.48 | ||||||||
| CPX | 23.11 | 23.64 | 1.56 | 27.70 | ||||||||
| OLV | 10.76 | 11.37 | 3.75 | 11.35 | ||||||||
| PLG | 27.57 | 27.74 | 2.88 | 39.97 | ||||||||
| OTH | 0.24 | |||||||||||
| ILM | 19.87 | 19.00 | 2.84 | 17.27 | ||||||||
| npFe | 1.76 | 1.76 | 0.03 | |||||||||
| mpFe | 0.63 | 0.62 | 0.02 | |||||||||
| SUM | 92.56 | 92.85 | 100.00 | |||||||||
References
- Papike, J.; Taylor, L.; Simon, S. Lunar minerals. In Lunar Sourcebook; a User’s Guide to the Moon; Heiken, G., Vaniman, D., French, B., Eds.; Cambridge University Press: Cambridge, UK, 1991; pp. 121–182. [Google Scholar]
- Mustard, J.F.; Pieters, C.M. Quantitative abundance estimates from bidirectional reflectance measurements. J. Geophys. Res.: Solid Earth 1987, 92, E617–E626. [Google Scholar] [CrossRef] [Green Version]
- Lucey, P.G.; Blewett, D.T.; Jolliff, B.L. Lunar iron and titanium abundance algorithms based on final processing of Clementine ultraviolet-visible images. J. Geophys. Res. Planets 2000, 105, 20297–20305. [Google Scholar] [CrossRef]
- Sato, H.; Robinson, M.S.; Lawrence, S.J.; Denevi, B.W.; Hapke, B.; Jolliff, B.L.; Hiesinger, H. Lunar mare TiO2 abundances estimated from UV/Vis reflectance. Icarus 2017, 296, 216–238. [Google Scholar] [CrossRef]
- Bhatt, M.; Wöhler, C.; Grumpe, A.; Hasebe, N.; Naito, M. Global mapping of lunar refractory elements: Multivariate regression vs. machine learning. Astron. Astrophys. 2019, 627, A155. [Google Scholar] [CrossRef]
- Keshava, N.; Mustard, J.F. Spectral unmixing. IEEE Signal Process. Mag. 2002, 19, 44–57. [Google Scholar] [CrossRef]
- Bishop, J.L.; Bell, J.F., III; Moersch, J.E. Remote Compositional Analysis: Techniques for Understanding Spectroscopy, Mineralogy, and Geochemistry of Planetary Surfaces; Cambridge University Press: Cambridge, UK, 2019; Volume 24. [Google Scholar]
- Pieters, C.M.; Boardman, J.; Buratti, B.; Chatterjee, A.; Clark, R.; Glavich, T.; Green, R.; Head, J.; Isaacson, P.; Malaret, E.; et al. The Moon Mineralogy Mapper (M3) on Chandrayaan-1. Curr. Sci. 2009, 96, 500–505. [Google Scholar]
- Hapke, B. Theory of Reflectance and Emittance Spectroscopy; Cambridge University Press: Cambridge, UK, 2012. [Google Scholar]
- Poulet, F.; Carter, J.; Bishop, J.; Loizeau, D.; Murchie, S. Mineral abundances at the final four curiosity study sites and implications for their formation. Icarus 2014, 231, 65–76. [Google Scholar] [CrossRef]
- Liu, Y.; Glotch, T.D.; Scudder, N.A.; Kraner, M.L.; Condus, T.; Arvidson, R.E.; Guinness, E.A.; Wolff, M.J.; Smith, M.D. End-member identification and spectral mixture analysis of CRISM hyperspectral data: A case study on southwest Melas Chasma, Mars. J. Geophys. Res.: Planets 2016, 121, 2004–2036. [Google Scholar] [CrossRef]
- Li, L. Quantifying lunar soil composition with partial least squares modeling of reflectance. Adv. Space Res. 2008, 42, 267–274. [Google Scholar] [CrossRef]
- Rommel, D.; Grumpe, A.; Felder, M.P.; Wöhler, C.; Mall, U.; Kronz, A. Automatic endmember selection and nonlinear spectral unmixing of Lunar analog minerals. Icarus 2017, 284, 126–149. [Google Scholar] [CrossRef]
- Hapke, B. Space weathering from Mercury to the asteroid belt. J. Geophys. Res.: Planets 2001, 106, 10039–10073. [Google Scholar] [CrossRef]
- Pieters, C.M.; Noble, S.K. Space weathering on airless bodies. J. Geophys. Res.: Planets 2016, 121, 1865–1884. [Google Scholar] [CrossRef] [PubMed]
- Lucey, P.G.; Riner, M.A. The optical effects of small iron particles that darken but do not redden: Evidence of intense space weathering on Mercury. Icarus 2011, 212, 451–462. [Google Scholar] [CrossRef]
- Sunshine, J.M.; Pieters, C.M. Determining the composition of olivine from reflectance spectroscopy. J. Geophys. Res. Planets 1998, 103, 13675–13688. [Google Scholar] [CrossRef]
- Taylor, L.A.; Pieters, C.; Keller, L.P.; Morris, R.V.; McKAY, D.S.; Patchen, A.; Wentworth, S. The effects of space weathering on Apollo 17 mare soils: Petrographie and chemical characterization. Meteorit. Planet. Sci. 2001, 36, 285–299. [Google Scholar] [CrossRef]
- Taylor, L.A.; Pieters, C.; Patchen, A.; Taylor, D.H.S.; Morris, R.V.; Keller, L.P.; McKay, D.S. Mineralogical and chemical characterization of lunar highland soils: Insights into the space weathering of soils on airless bodies. J. Geophys. Res. Planets 2010, 115. [Google Scholar] [CrossRef]
- Hess, M.; Wilhelm, T.; Arnaut, M.; Wöhler, C. Uncertainty-Based Unmixing of Space Weathered Lunar Spectra. In Proceedings of the Lunar and Planetary Science Conference, Virtual Meeting. 15–19 March 2021; Number 2548, p. 1048. [Google Scholar]
- Pieters, C.M.; Besse, S.; Boardman, J.; Buratti, B.; Cheek, L.; Clark, R.N.; Combe, J.P.; Dhingra, D.; Goswami, J.N.; Green, R.O.; et al. Mg-spinel lithology: A new rock type on the lunar farside. J. Geophys. Res. Planets 2011, 116, E6. [Google Scholar] [CrossRef] [Green Version]
- Lapotre, M.G.; Ehlmann, B.L.; Minson, S.E. A probabilistic approach to remote compositional analysis of planetary surfaces. J. Geophys. Res. Planets 2017, 122, 983–1009. [Google Scholar] [CrossRef] [Green Version]
- Gelman, A.; Carlin, J.B.; Stern, H.S.; Dunson, D.B.; Vehtari, A.; Rubin, D.B. Bayesian Data Analysis; CRC Press: Boca Raton, FL, USA, 2013. [Google Scholar]
- Wohlfarth, K.S.; Wöhler, C.; Grumpe, A. Space Weathering and Lunar OH/H2O Insights from Ab Initio Mie Modeling of Submicroscopic Iron. Astron. J. 2019, 158, 80. [Google Scholar] [CrossRef]
- Hapke, B. Bidirectional reflectance spectroscopy: 1. Theory. J. Geophys. Res. Solid Earth 1981, 86, 3039–3054. [Google Scholar] [CrossRef]
- Hapke, B. Bidirectional Reflectance Spectroscopy: 5. The Coherent Backscatter Opposition Effect and Anisotropic Scattering. Icarus 2002, 157, 523–534. [Google Scholar] [CrossRef] [Green Version]
- Hapke, B. Bidirectional reflectance spectroscopy: 3. Correction for macroscopic roughness. Icarus 1984, 59, 41–59. [Google Scholar] [CrossRef] [Green Version]
- Kattawar, G.W. A three-parameter analytic phase function for multiple scattering calculations. J. Quant. Spectrosc. Radiat. Transf. 1975, 15, 839–849. [Google Scholar] [CrossRef] [Green Version]
- Warell, J. Properties of the Hermean regolith: IV. Photometric parameters of Mercury and the Moon contrasted with Hapke modelling. Icarus 2004, 167, 271–286. [Google Scholar] [CrossRef]
- Yang, Y.; Li, S.; Milliken, R.E.; Zhang, H.; Robertson, K.; Hiroi, T. Phase Functions of Typical Lunar Surface Minerals Derived for the Hapke Model and Implications for Visible to Near-Infrared Spectral Unmixing. J. Geophys. Res. Planets 2019, 124, 31–60. [Google Scholar] [CrossRef]
- Howari, F.M.; Acbas, G.; Nazzal, Y.; AlAydaroos, F. Hapke-based computational method to enable unmixing of hyperspectral data of common salts. Chem. Cent. J. 2018, 12, 1–15. [Google Scholar] [CrossRef] [PubMed] [Green Version]
- Hapke, B. Bidirectional reflectance spectroscopy: 6. Effects of porosity. Icarus 2008, 195, 918–926. [Google Scholar] [CrossRef] [Green Version]
- Fowler, B.W. Expansion of Mie-theory phase functions in series of Legendre polynomials. JOSA 1983, 73, 19–22. [Google Scholar] [CrossRef]
- Baker, A.; Jolliff, B.; Yasanayake, C.; Denevi, B.; Lawrence, S. Lunar Agglutinate Glass Compositions and Comparison to Soil Grain-Size Fractions. In Proceedings of the Lunar and Planetary Science Conference, Virtual Meeting. 16–20 March 2020; Number 2326, p. 1321. [Google Scholar]
- Denevi, B.; Yasanayake, C.; Jolliff, B.; Lawrence, S.; Hiroi, T.; Martin, A. The Spectral Properties of Lunar Agglutinates. In Proceedings of the Lunar and Planetary Science Conference, Virtual Meeting. 15–19 March 2021; Number 2548, p. 2368. [Google Scholar]
- Sun, L.; Lucey, P.G. Unmixing Mineral Abundance and Mg# With Radiative Transfer Theory: Modeling and Applications. J. Geophys. Res. Planets 2021, 126, e2020JE006691. [Google Scholar]
- Cloutis, E.A. Pyroxene reflectance spectra: Minor absorption bands and effects of elemental substitutions. J. Geophys. Res. Planets 2002, 107, 6:1–6:12. [Google Scholar] [CrossRef] [Green Version]
- Burns, R.G.; Burns, R.G. Mineralogical Applications of Crystal Field Theory; Number 5; Cambridge University Press: Cambridge, UK, 1993. [Google Scholar]
- Klima, R.L.; Pieters, C.M.; Dyar, M.D. Spectroscopy of synthetic Mg-Fe pyroxenes I: Spin-allowed and spin-forbidden crystal field bands in the visible and near-infrared. Meteorit. Planet. Sci. 2007, 42, 235–253. [Google Scholar] [CrossRef]
- Klima, R.L.; Dyar, M.D.; Pieters, C.M. Near-infrared spectra of clinopyroxenes: Effects of calcium content and crystal structure. Meteorit. Planet. Sci. 2011, 46, 379–395. [Google Scholar] [CrossRef]
- Neal, R.M. Probabilistic Inference Using Markov Chain Monte Carlo Methods; Department of Computer Science, University of Toronto Toronto: Ontario, ON, Canada, 1993. [Google Scholar]
- Metropolis, N.; Rosenbluth, A.W.; Rosenbluth, M.N.; Teller, A.H.; Teller, E. Equation of state calculations by fast computing machines. J. Chem. Phys. 1953, 21, 1087–1092. [Google Scholar] [CrossRef] [Green Version]
- Hastings, W.K. Monte Carlo sampling methods using Markov chains and their applications. Biometrika 1970, 57, 97–109. [Google Scholar] [CrossRef]
- Hoffman, M.D.; Gelman, A. The No-U-Turn sampler: Adaptively setting path lengths in Hamiltonian Monte Carlo. J. Mach. Learn. Res. 2014, 15, 1593–1623. [Google Scholar]
- Haario, H.; Saksman, E.; Tamminen, J. An adaptive Metropolis algorithm. Bernoulli 2001, 7, 223–242. [Google Scholar] [CrossRef] [Green Version]
- Haario, H.; Laine, M.; Mira, A.; Saksman, E. DRAM: Efficient adaptive MCMC. Stat. Comput. 2006, 16, 339–354. [Google Scholar] [CrossRef]
- Neal, R.M. MCMC using Hamiltonian dynamics. In Handbook of Markov Chain Monte Carlo; Chapman and Hall/CRC: London, UK, 2011; Volume 2, Ch. 5. [Google Scholar]
- Bastien, F.; Lamblin, P.; Pascanu, R.; Bergstra, J.; Goodfellow, I.; Bergeron, A.; Bouchard, N.; Warde-Farley, D.; Bengio, Y. Theano: New features and speed improvements. arXiv 2012, arXiv:1211.5590. [Google Scholar]
- Salvatier, J.; Wiecki, T.V.; Fonnesbeck, C. Probabilistic programming in Python using PyMC3. Peerj Comput. Sci. 2016, 2, e55. [Google Scholar] [CrossRef] [Green Version]
- Fu, Z.; Robles-Kelly, A.; Caelli, T.; Tan, R.T. On automatic absorption detection for imaging spectroscopy: A comparative study. IEEE Trans. Geosci. Remote Sens. 2007, 45, 3827–3844. [Google Scholar] [CrossRef]
- Bishop, C.M. Pattern Recognition and Machine Learning; Springer: New York, NY, USA, 2006. [Google Scholar]
- Lawrence, D.; Feldman, W.; Barraclough, B.; Binder, A.; Elphic, R.; Maurice, S.; Thomsen, D. Global elemental maps of the Moon: The Lunar Prospector gamma-ray spectrometer. Science 1998, 281, 1484–1489. [Google Scholar] [CrossRef] [PubMed] [Green Version]
- Hess, M.; Wöhler, C.; Bhatt, M.; Berezhnoy, A.; Grumpe, A.; Wohlfarth, K.; Bhardwaj, A.; Shevchenko, V. Processes governing the VIS/NIR spectral reflectance behavior of lunar swirls. Astron. Astrophys. 2020, 639, A12. [Google Scholar] [CrossRef]
- Trang, D.; Lucey, P.G. Improved space weathering maps of the lunar surface through radiative transfer modeling of Kaguya multiband imager data. Icarus 2019, 321, 307–323. [Google Scholar] [CrossRef]
- Trang, D.; Lucey, P.G.; Izenberg, N.R. Radiative transfer modeling of MESSENGER VIRS spectra: Detection and mapping of submicroscopic iron and carbon. Icarus 2017, 293, 206–217. [Google Scholar] [CrossRef]
- Grumpe, A.; Mengewein, N.; Rommel, D.; Mall, U.; Wöhler, C. Interpreting spectral unmixing coefficients: From spectral weights to mass fractions. Icarus 2018, 299, 1–14. [Google Scholar] [CrossRef]
- Housley, R.; Cirlin, E.; Goldberg, I.; Crowe, H. Ferromagnetic resonance studies of lunar core stratigraphy. In Proceedings of the Lunar and Planetary Science Conference Proceedings, Houston, TX, USA, 15–19 March 1976; Volume 7, pp. 13–26. [Google Scholar]
- Arnaut, M.; Wohlfarth, K.; Wöhler, C. The interaction between multiple nanophase iron particles changes the slope of lunar reflectance spectra. In Proceedings of the European Planetary Science Congress, Virtual Meeting. 13–24 September 2021. [Google Scholar] [CrossRef]
- Lapotre, M.G.; Ehlmann, B.; Minson, S.E.; Arvidson, R.; Ayoub, F.; Fraeman, A.; Ewing, R.; Bridges, N. Compositional variations in sands of the Bagnold Dunes, Gale Crater, Mars, from visible-shortwave infrared spectroscopy and comparison with ground truth from the Curiosity rover. J. Geophys. Res. Planets 2017, 122, 2489–2509. [Google Scholar] [CrossRef]
- Ren, Z.; Sun, L.; Zhai, Q. Improved k-means and spectral matching for hyperspectral mineral mapping. Int. J. Appl. Earth Obs. Geoinf. 2020, 91, 102154. [Google Scholar] [CrossRef]
- Arnaut, M.; Wohlfarth, K.; Wöhler, C. A Study of Hyperspectral Clustering—How To Speed Up Spectral Unmixing Of Moon Mineralogy Mapper Data. In Proceedings of the Lunar and Planetary Science Conference, Virtual Meeting. 16–20 March 2020; p. 3008. [Google Scholar]



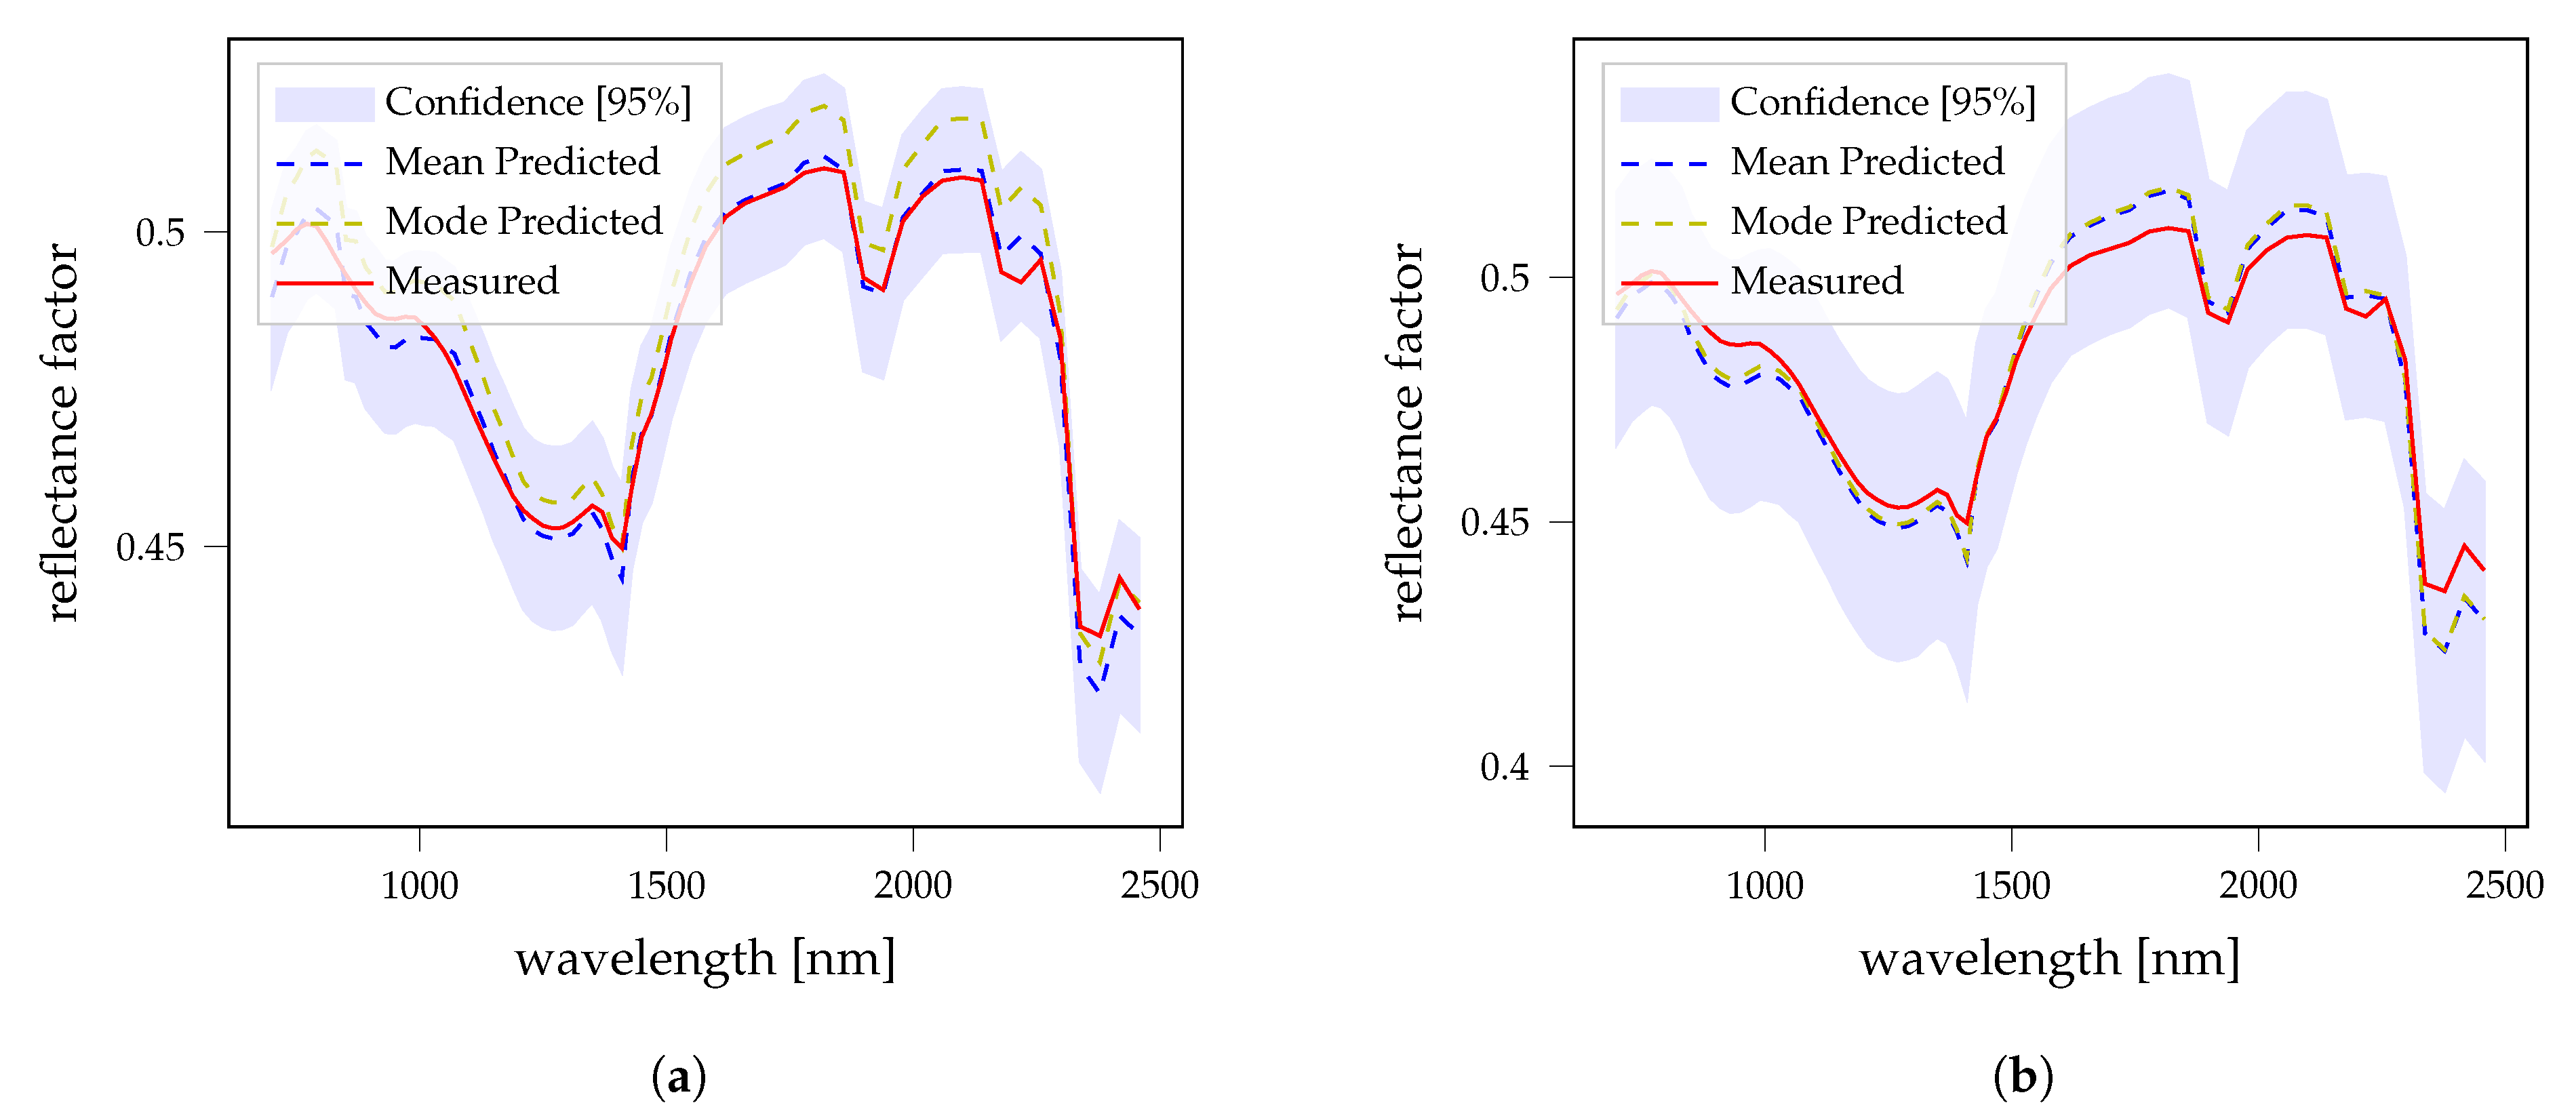
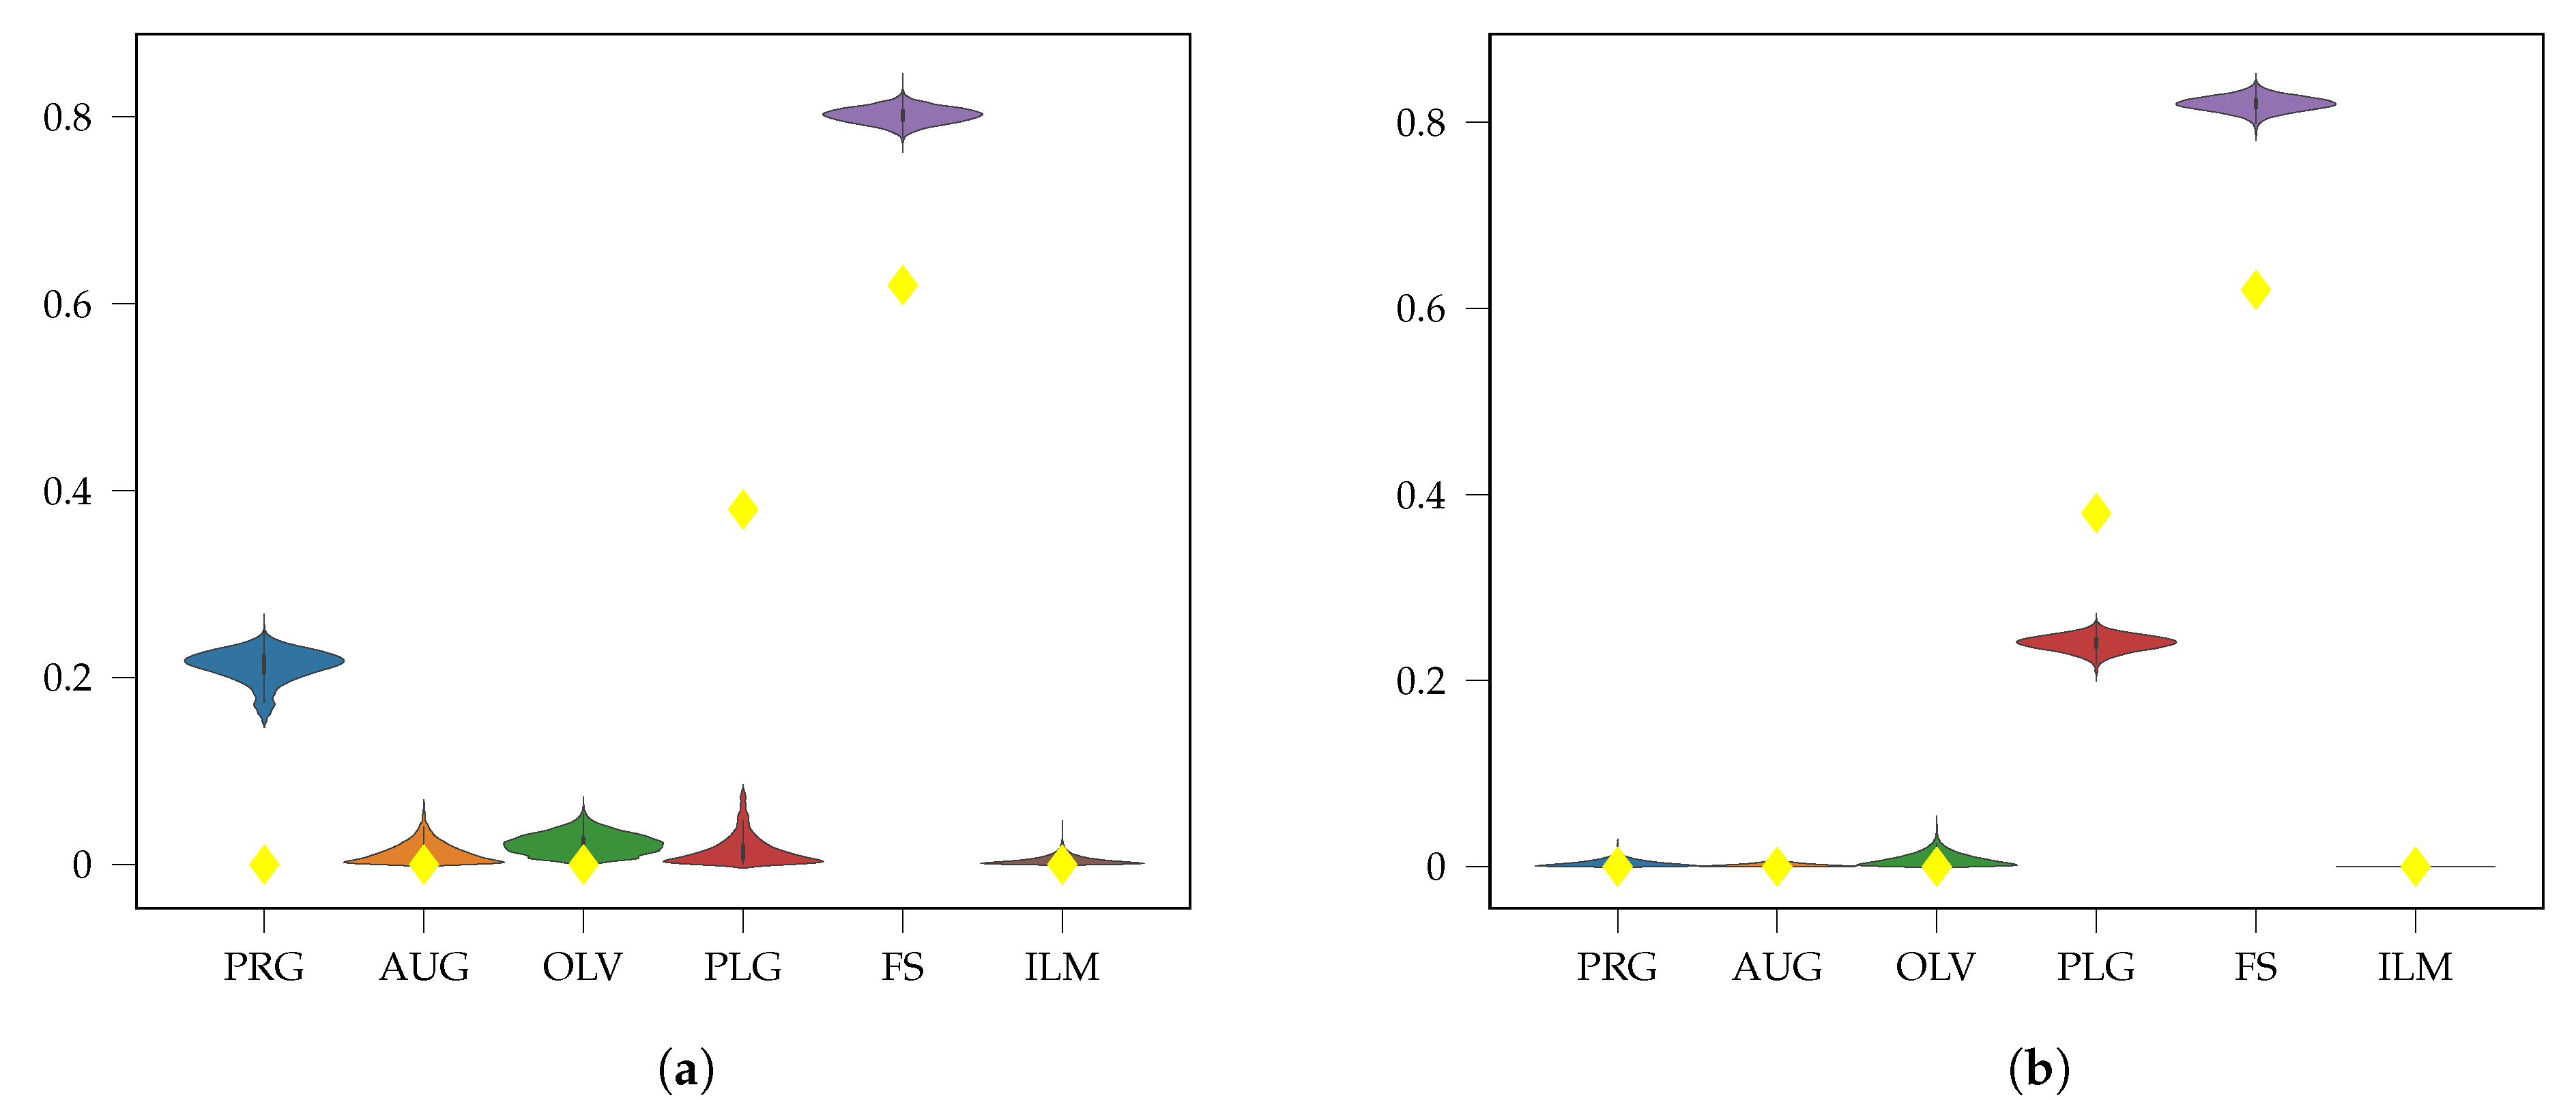

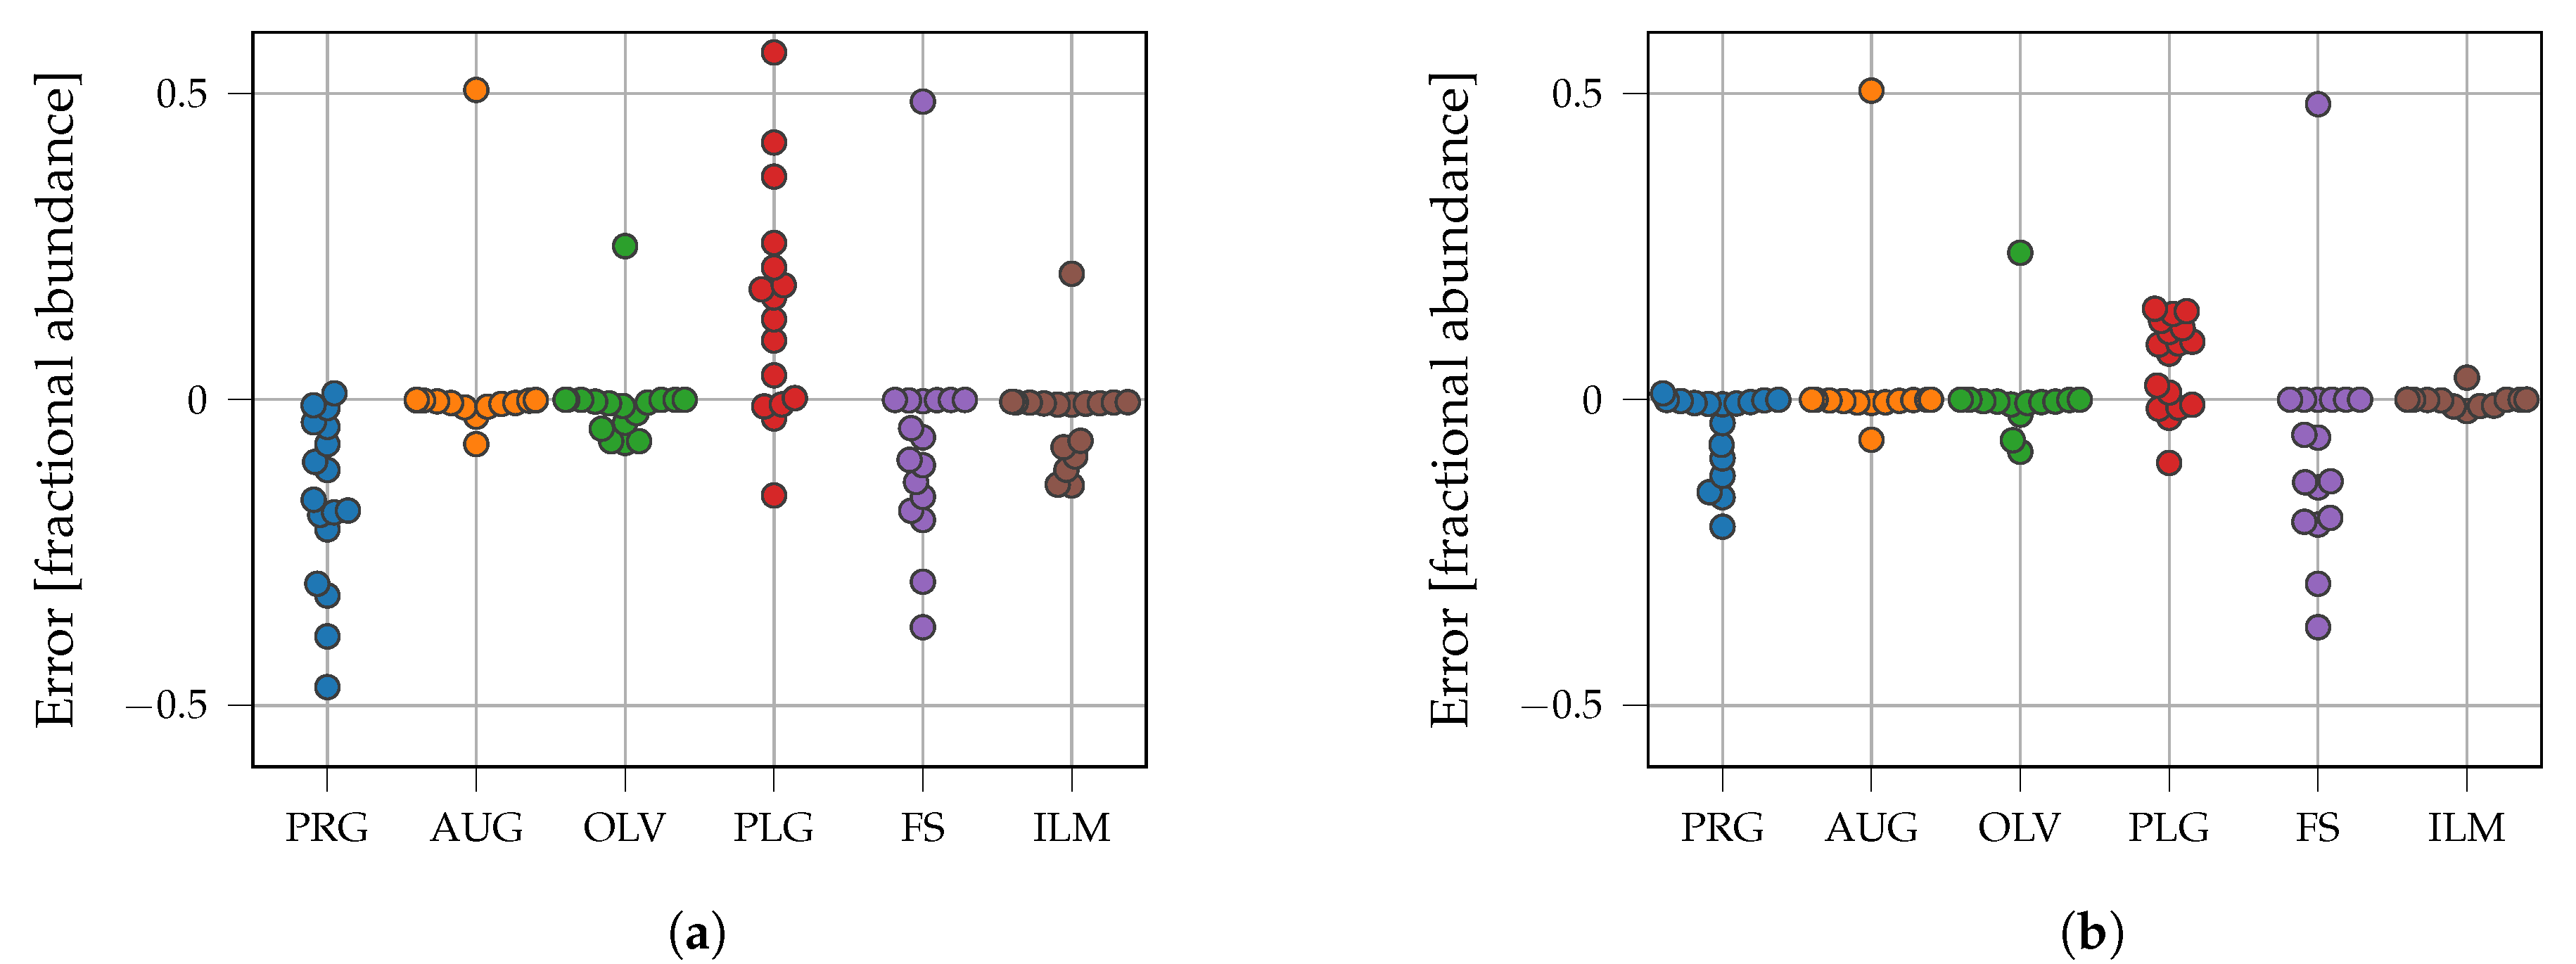
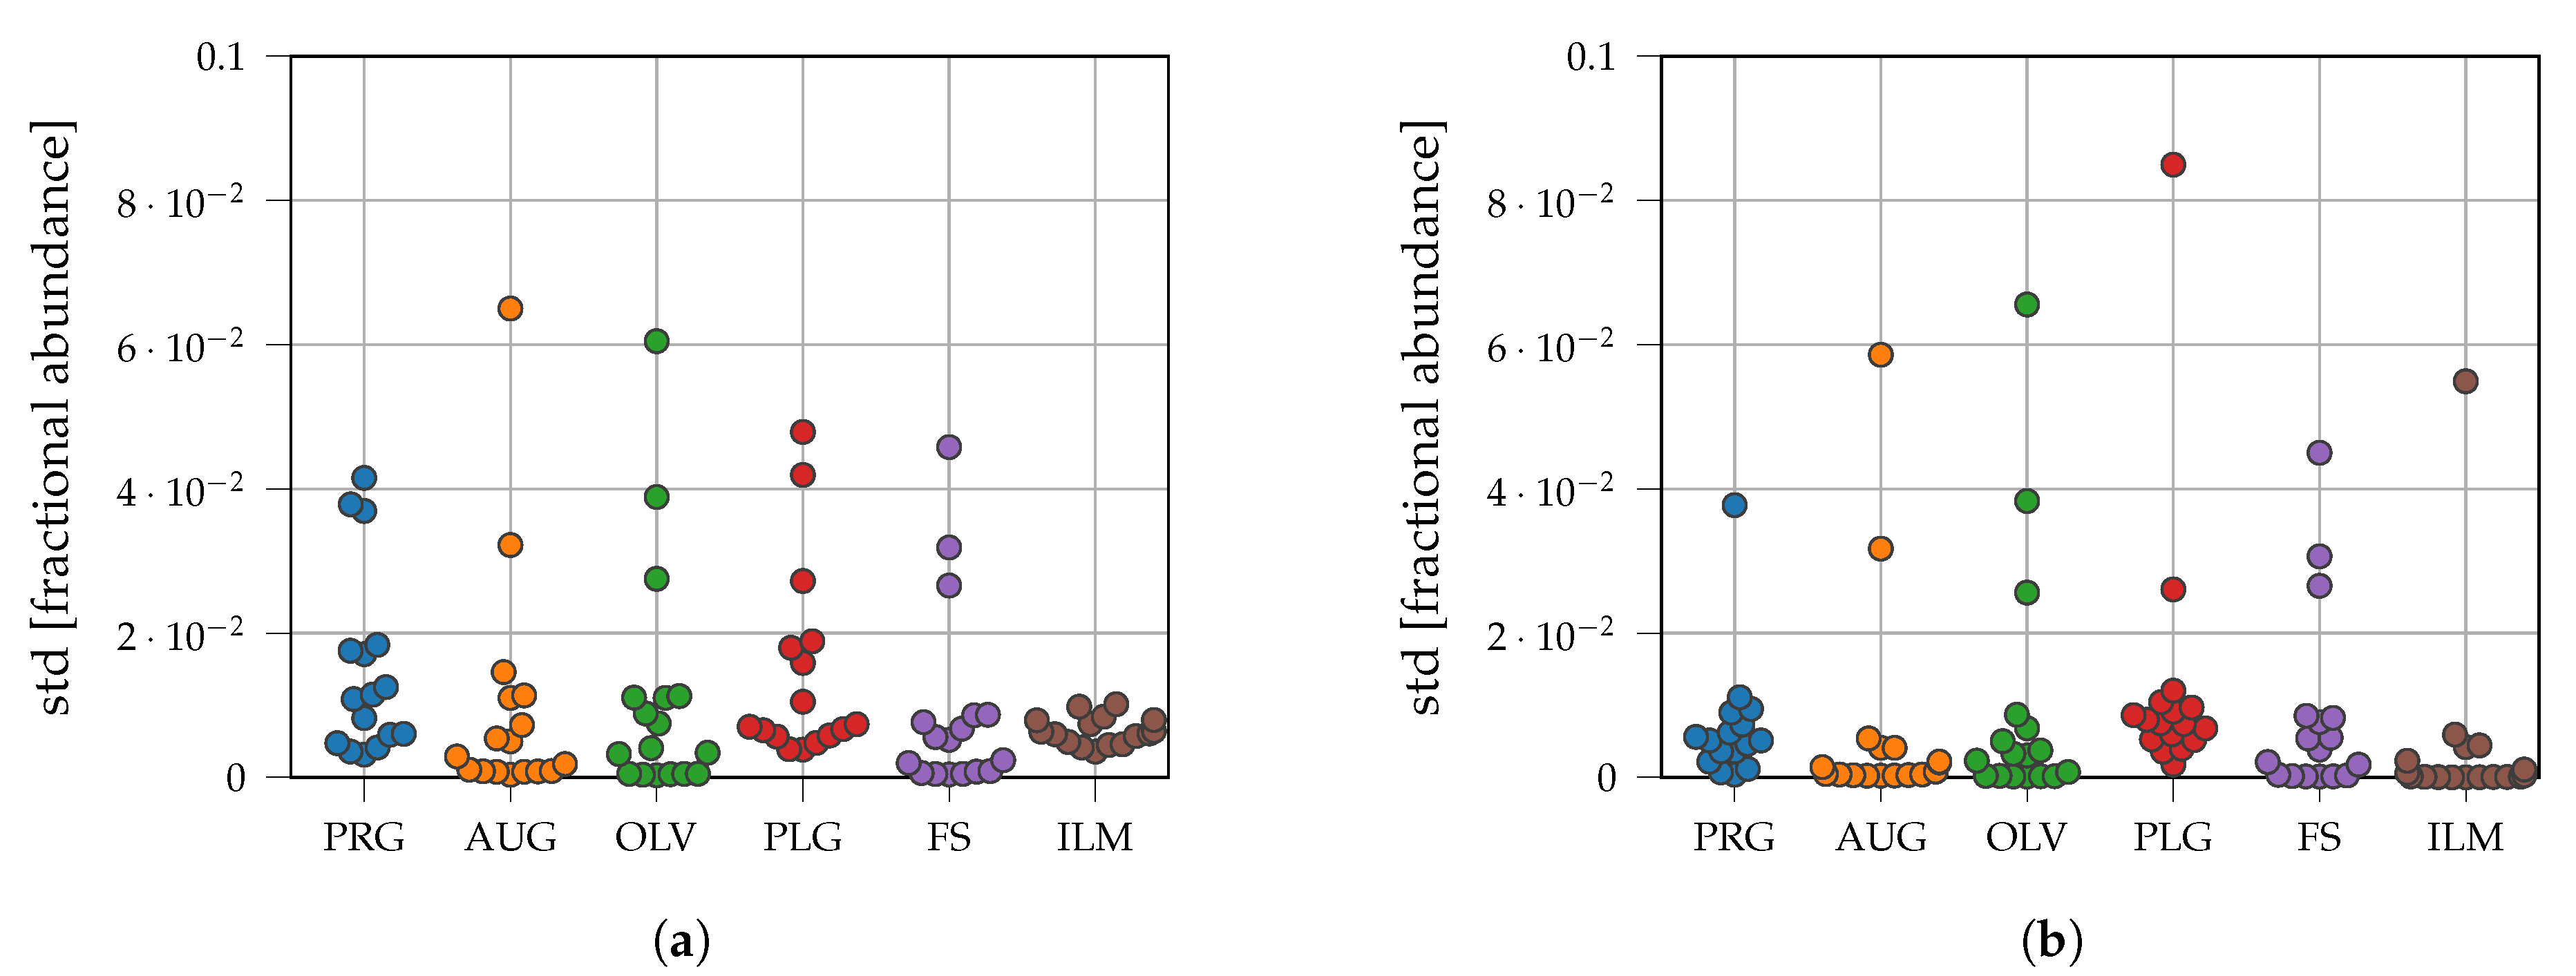


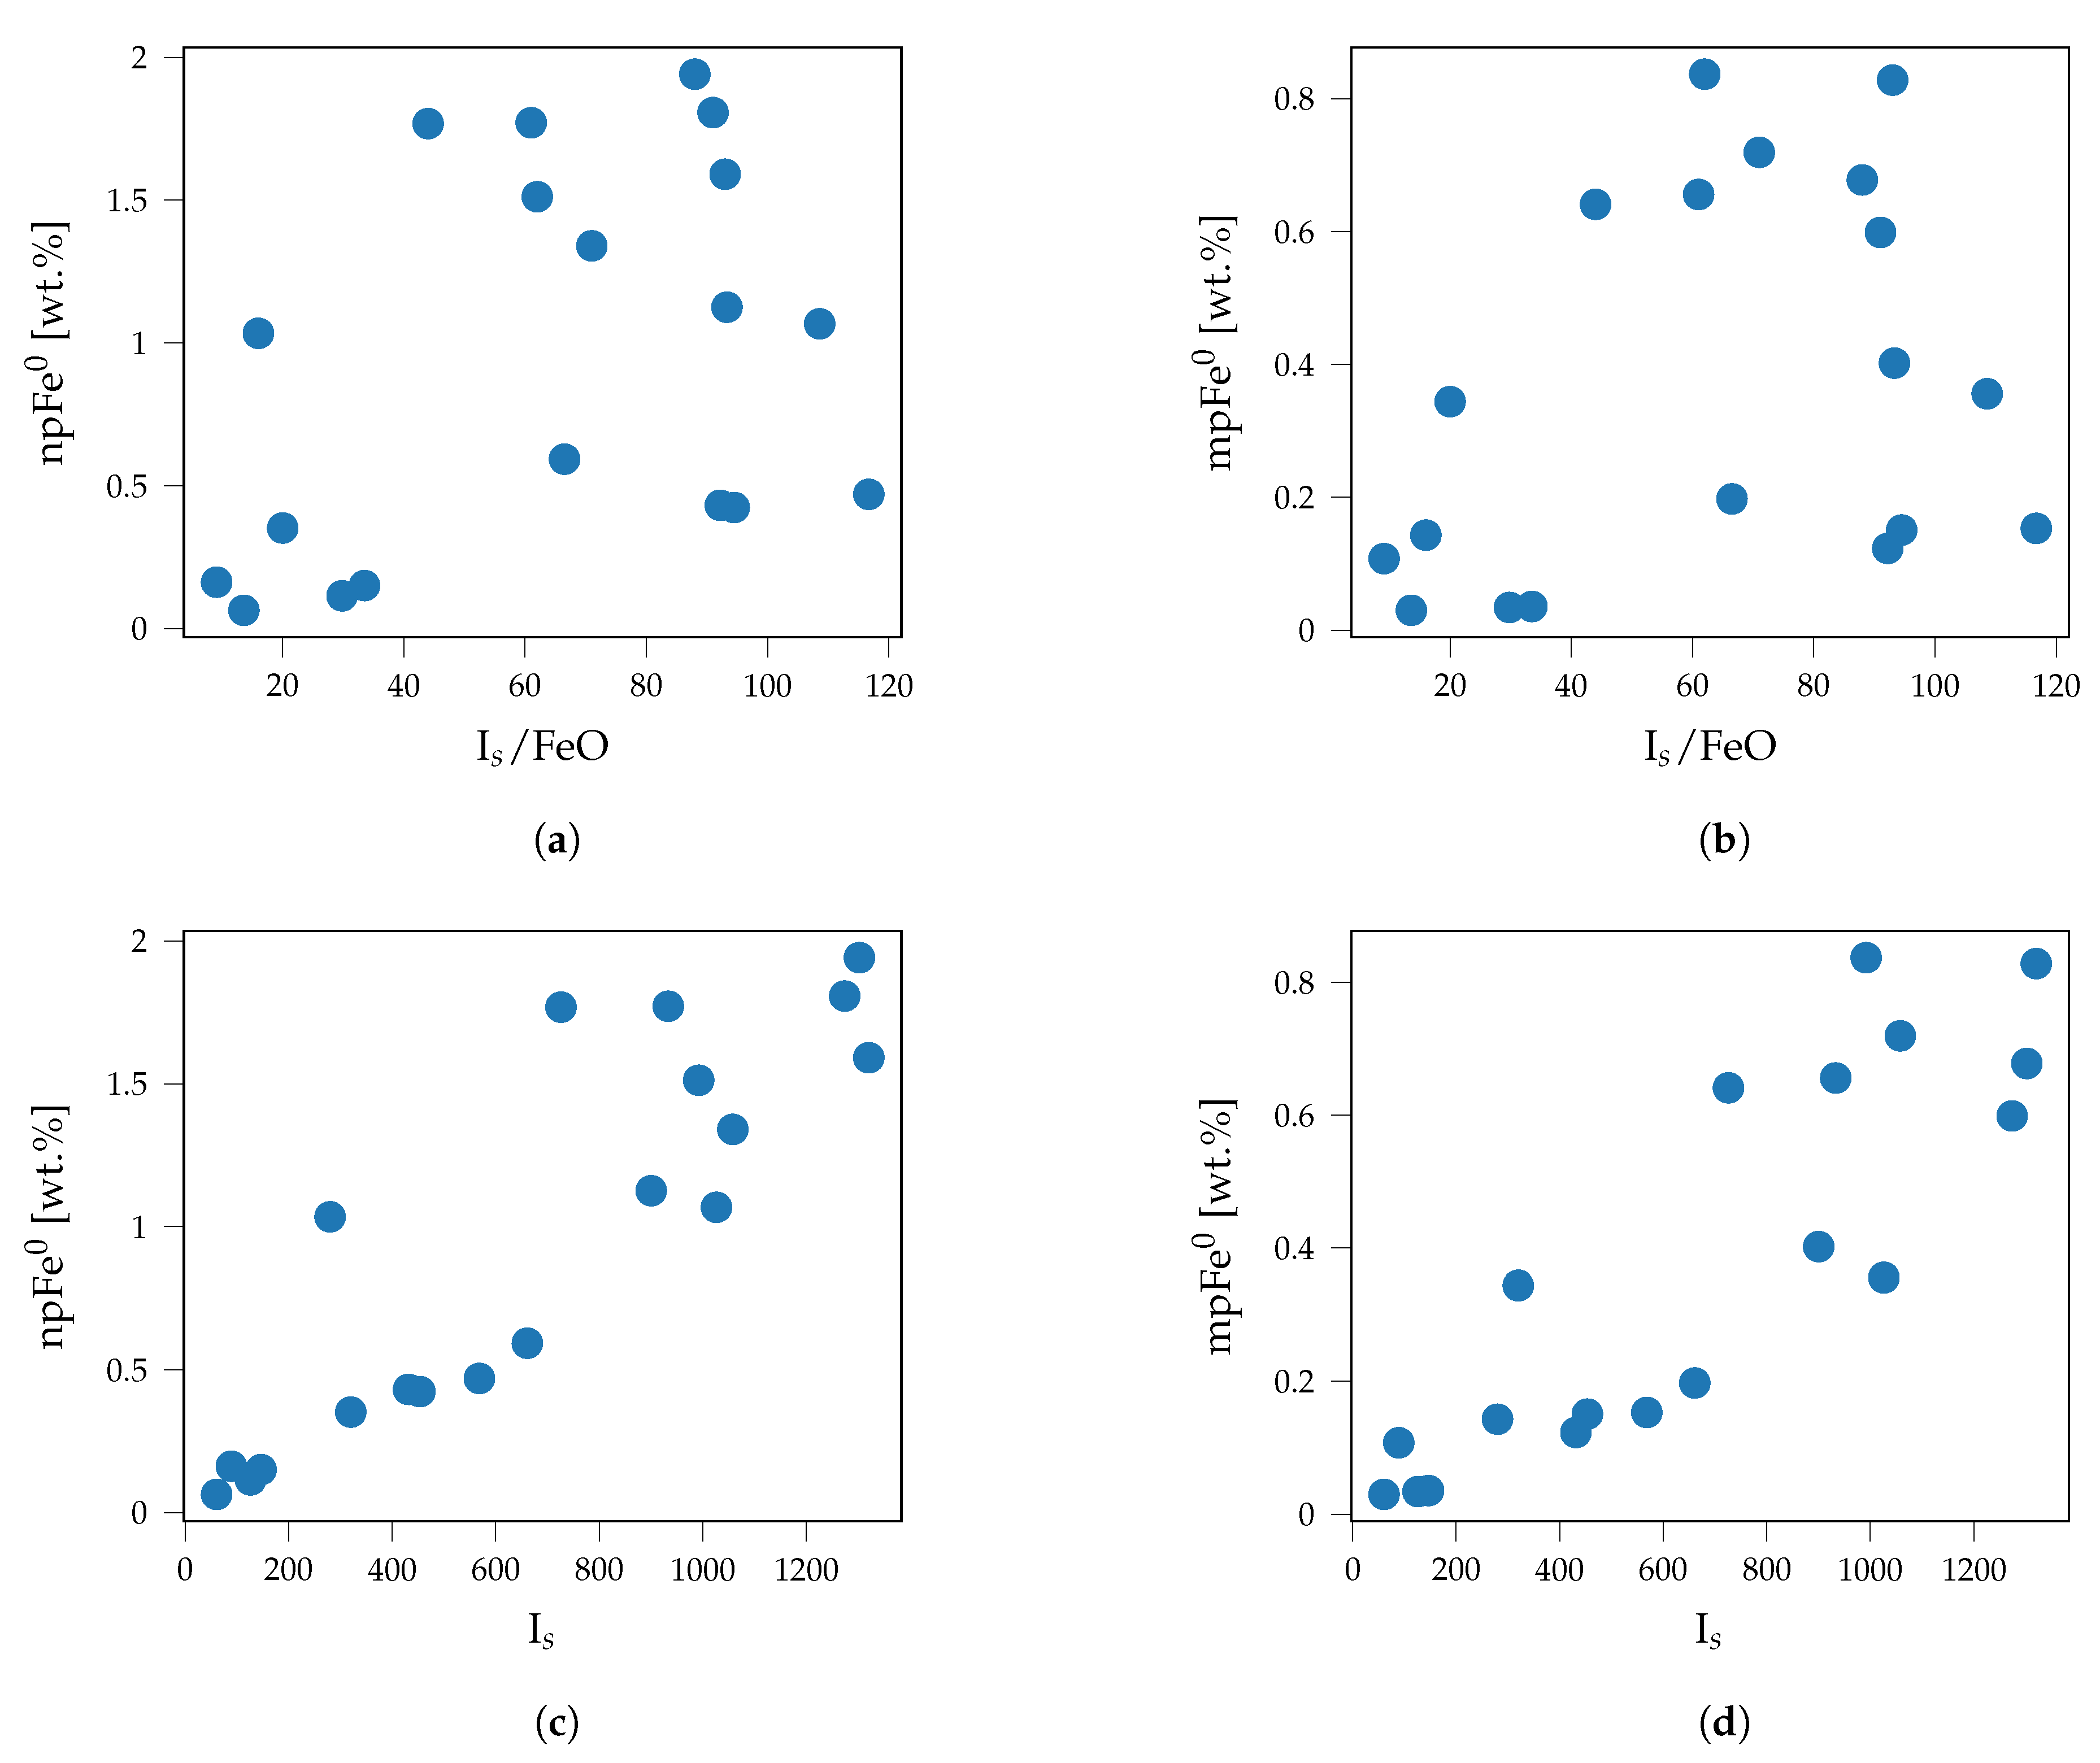
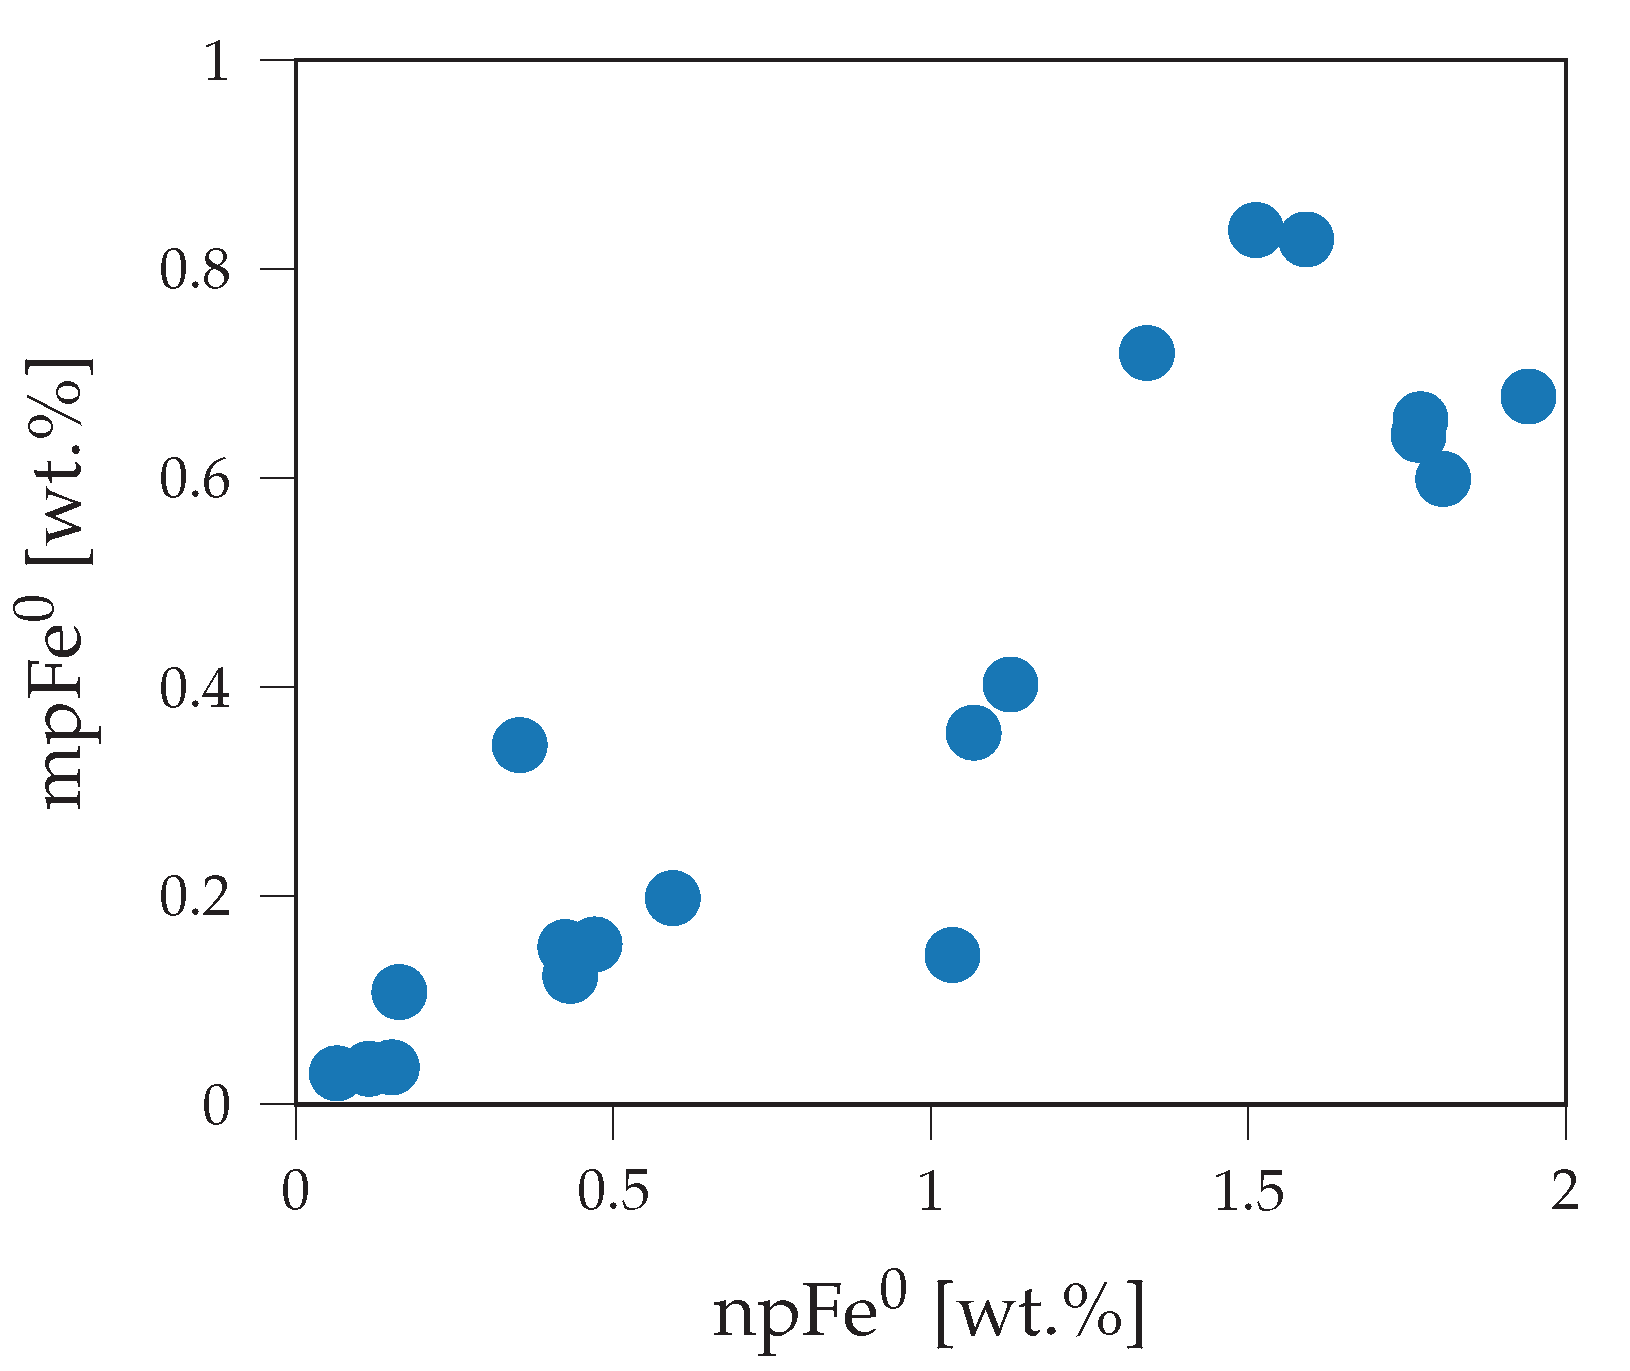
| Parameter | npFe0 | mpFe0 | Medium |
|---|---|---|---|
| [g/cm3] | 7.568 | 7.568 | 3.5 |
| D [nm] | 10 | 150 | 30 m |
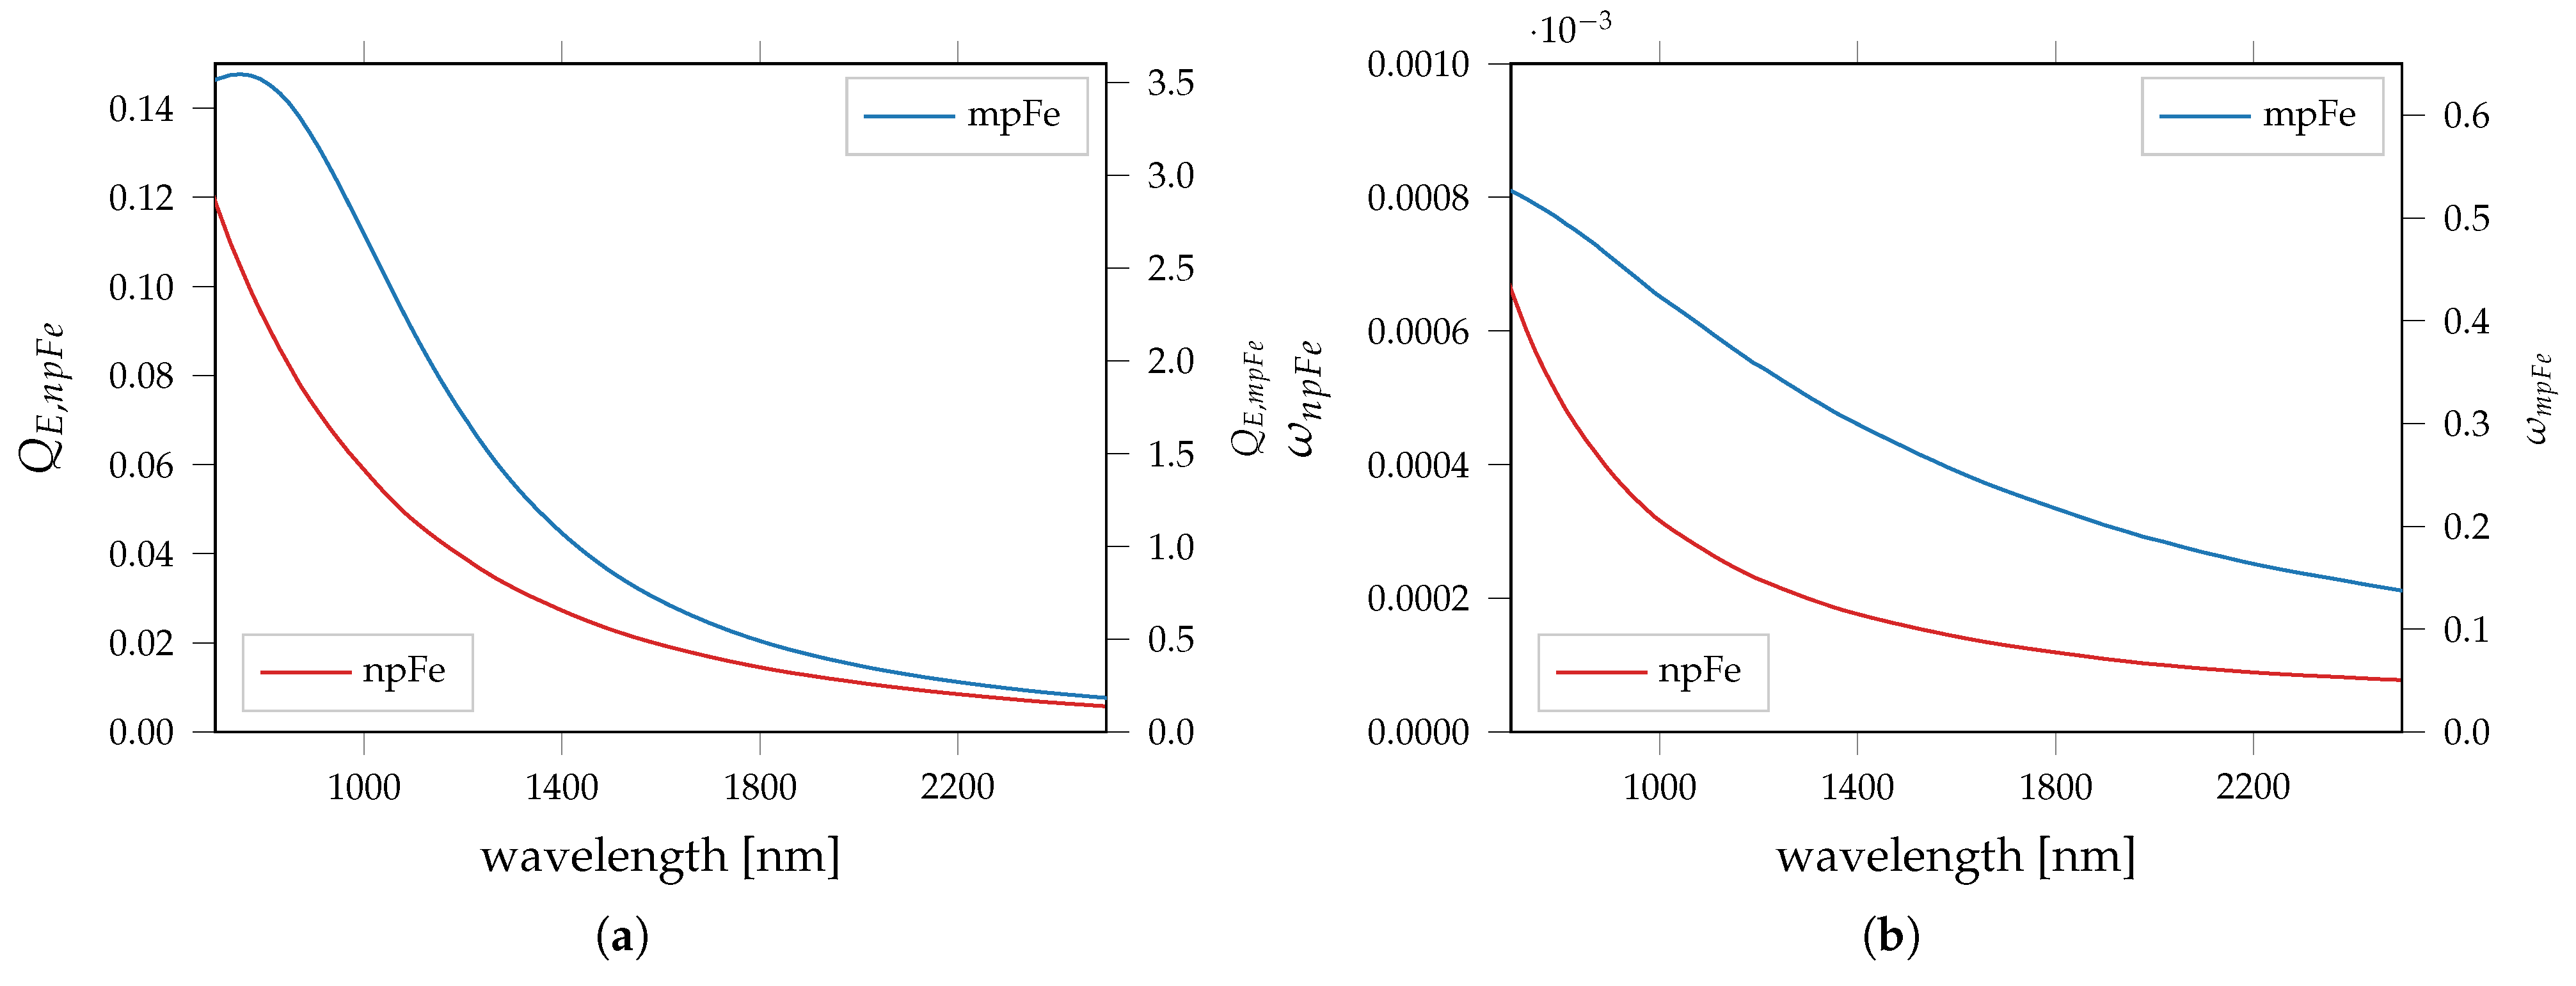
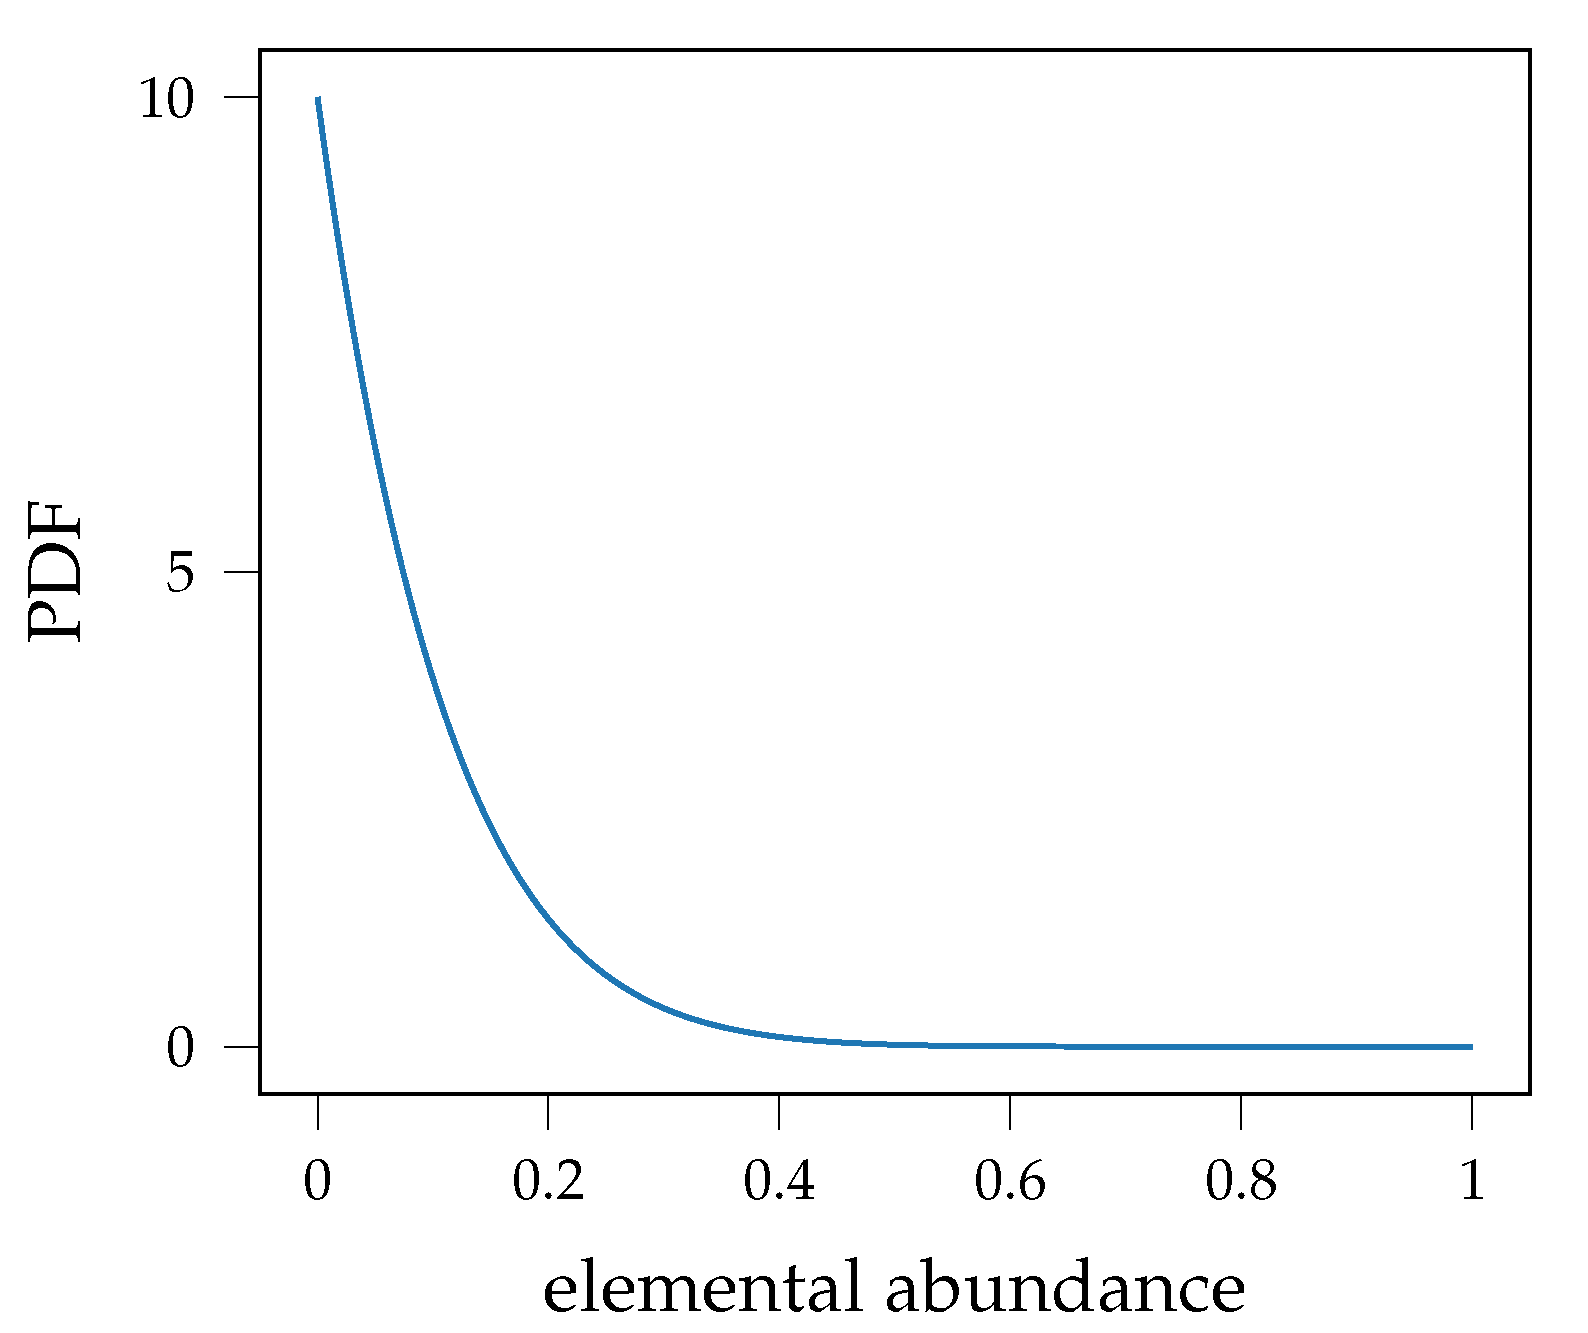
| Figure 1a | Figure 1a | 2.1 |
| SiO2 | TiO2 | Al2O3 | Cr2O3 | MgO | CaO | MnO | FeO | Na2O | K2O | P2O5 | SO3 | |
|---|---|---|---|---|---|---|---|---|---|---|---|---|
| None | 1 | 1 | 1 | 1 | 1 | 1 | 1 | 1 | 1 | 1 | 1 | 1 |
| TiO2 | 1 | 40 | 1 | 1 | 1 | 1 | 1 | 1 | 1 | 1 | 1 | 1 |
| Ti/Al | 1 | 40 | 40 | 1 | 1 | 1 | 1 | 1 | 1 | 1 | 1 | 1 |
| All | 30 | 30 | 30 | 1 | 30 | 30 | 1 | 30 | 1 | 1 | 1 | 1 |
| OPX | CPXB | OLV | PLG | CPXA | ILM | |
|---|---|---|---|---|---|---|
| rNone | 0.93 | 0.71 | 0.47 | 0.54 | 0.48 | 0.13 |
| rTi/Al | 0.94 | 0.81 | 0.56 | 0.70 | 0.58 | 0.02 |
Publisher’s Note: MDPI stays neutral with regard to jurisdictional claims in published maps and institutional affiliations. |
© 2021 by the authors. Licensee MDPI, Basel, Switzerland. This article is an open access article distributed under the terms and conditions of the Creative Commons Attribution (CC BY) license (https://creativecommons.org/licenses/by/4.0/).
Share and Cite
Hess, M.; Wilhelm, T.; Wöhler, C.; Wohlfarth, K. Uncertainty Introduced by Darkening Agents in the Lunar Regolith: An Unmixing Perspective. Remote Sens. 2021, 13, 4702. https://doi.org/10.3390/rs13224702
Hess M, Wilhelm T, Wöhler C, Wohlfarth K. Uncertainty Introduced by Darkening Agents in the Lunar Regolith: An Unmixing Perspective. Remote Sensing. 2021; 13(22):4702. https://doi.org/10.3390/rs13224702
Chicago/Turabian StyleHess, Marcel, Thorsten Wilhelm, Christian Wöhler, and Kay Wohlfarth. 2021. "Uncertainty Introduced by Darkening Agents in the Lunar Regolith: An Unmixing Perspective" Remote Sensing 13, no. 22: 4702. https://doi.org/10.3390/rs13224702
APA StyleHess, M., Wilhelm, T., Wöhler, C., & Wohlfarth, K. (2021). Uncertainty Introduced by Darkening Agents in the Lunar Regolith: An Unmixing Perspective. Remote Sensing, 13(22), 4702. https://doi.org/10.3390/rs13224702


