Article

Regional Ranking of Marine Turtle Nesting in Remote Western Australia by Integrating Traditional Ecological Knowledge and Remote Sensing

by
Anton D. Tucker
1,2,*,
Kellie L. Pendoley
1,3,
Kathy Murray
4,
Graham Loewenthal
4,
Chris Barber
4,
Jai Denda
4,
Gina Lincoln
1,5,6,
Dean Mathews
1,5,
Daniel Oades
1,5,
Scott D. Whiting
1,2,
Miriuwung Gajerrong Rangers
,
Balanggarra Rangers
,
Wunambal Gaambera Rangers
,
Dambimangari Rangers
,
Mayala Rangers
,
Bardi Jawi Rangers
,
Nyul Nyul Rangers
,
Yawuru Rangers
,
Karajarri Rangers
,
Nyangumarta Rangers
and
Ngarla Rangers
add Show full author list remove Hide full author list
1
Western Australia Marine Science Institution, Crawley, WA 6009, Australia
2
Department of Biodiversity, Conservation and Attractions, Marine Science Program, Kensington, WA 6151, Australia
3
Pendoley Environmental, Booragoon, WA 6154, Australia
4
Department of Biodiversity, Conservation and Attractions, Remote Sensing and Spatial Analysis Program, Kensington, WA 6151, Australia
5
Indigenous Saltwater Advisory Group Program, P.O. Box 47, Broome, WA 6726, Australia
6
Department of Parks and Wildlife, Broome, WA 6056, Australia
*
Author to whom correspondence should be addressed.
Kimberley Rangers are recognized by Contributor Roles Taxonomy as coauthors and as individuals in the Acknowledgements sections. E-mail address: [email protected].
Remote Sens. 2021, 13(22), 4696; https://doi.org/10.3390/rs13224696
Submission received: 7 September 2021 / Revised: 11 October 2021 / Accepted: 11 November 2021 / Published: 20 November 2021
(This article belongs to the Special Issue Remote Sensing Applications for Sea Turtle Conservation)

Abstract

:
Western Australia’s remote Kimberley coastline spans multiple Traditional Owner estates. Marine turtle nesting distribution and abundance in Indigenous Protected Areas and newly declared Marine Parks were assessed by aerial photogrammetry surveys for the Austral summer and winter nesting seasons. Images of nesting tracks were quantified in the lab and verified by ad hoc ground patrols. The rankings of log-scaled plots of track abundance and density give guidance to regional co-management planning. Spatial and temporal differences were detected in that remoter islands had higher nesting usage and few terrestrial predators. The surveys found year-round green turtle nesting peaking in summer, as well as spatial boundaries to the summer and winter flatback stocks. Summer surveys recorded 126.2 island activities per km and 17.7 mainland activities per km. Winter surveys recorded 65.3 island activities per km and quantified a known winter mainland rookery with 888 tracks/km. The three highest density rookeries were found to be winter flatback turtles at Cape Domett, summer green turtles at the Lacepede Islands and summer flatback turtles at Eighty Mile Beach. Moderate to lesser density nesting by summer green turtles and winter flatback turtles occurred in the North Kimberley offshore islands. Traditional Ecological Knowledge and ground-based surveys verified the harder-to-detect species (olive ridley or hawksbill turtles) with irregular nesting, low track persistence and non-aggregated nesting. Higher-density rookeries may provide locations for long-term monitoring using repeated aerial or ground surveys; however, the sparse or infrequently nesting species require insights gleaned by Tradition Ecological Knowledge. Common and conspicuous nesters are easily detected and ranked, but better-informed co-management requires additional ground surveys or surveys timed with the reproductive peaks of rarer species.

1. Introduction

Marine turtle nesting distributions and abundance for the remote Kimberley Bioregion of Western Australia represent a knowledge gap in the Indian Ocean [1]. The region’s remoteness complicates efforts to monitor nesting systematically or regularly. The regional background context for turtle nesting [2,3,4] involves impending industrial development and the expansion of a comprehensive marine park network including State and Commonwealth marine protected areas. However, Kimberley turtle nesting habitats are within the land and sea tenure areas (Figure 1) mapped by the National Native Title Tribunal (NNTT), Indigenous Protected Areas (IPAs), Indigenous Land Use Agreements (ILUA), and the Parks Australia Marine and Terrestrial Protected Areas. Therefore, Indigenous rangers and Traditional Owners will be the foremost natural resource managers who protect, enhance and conserve the unique biodiversity values of the region through Native Title rights, cultural practices and interests [5,6].
The Western Australia Marine Science Institution (WAMSI) has fostered co-management partnerships between Indigenous managers and Western scientists to combine Traditional Ecological Knowledge and Scientific Ecological Knowledge for better conservation outcomes [7,8,9]. A fundamental need for improved spatial knowledge in order to evaluate the threats of climate change, oil and gas exploration and extraction, feral animals and marine debris on the region’s endangered turtle species continues to exist. Maps of marine megafauna distribution assist the Indigenous ranger groups engaged in on-country management of Indigenous Protected Areas, aid the co-management of Western Australia Marine Parks and inform the National Recovery Plan for Australian Marine Turtles [10].
The Marine Bioregional Plan for the North-west Marine Region [11], prepared under the Environmental Protection and Biodiversity Conservation Act [12], includes nesting by flatback turtles (Natator depressus), green turtles (Chelonia mydas), hawksbill turtles (Er-etmochelys imbricata), and olive ridley turtles (Lepidochelys olivacea) [13]. Loggerhead (Caretta caretta) and leatherback turtles (Dermochelys coriacea) are transients or end-of-migration foragers and are not documented nesters in the Kimberley. All marine turtle species are considered of conservation concern at global [13] or national levels [14]. Early estimates approximated that green and flatback turtle nesting was substantial (100 s–1000 s), with sparser records of olive ridley and hawksbill turtles [14,15]. The spatial scale needs to address the variability of access to the region’s remote beaches (from 100 m pocket beaches up to a 220 km extent of Eighty Mile Beach) as well as the geospatial arrangement (offshore islands, and mainland beaches). Nesting density varies from single nests to some rookeries with hundreds of overlapping tracks per night [3]. A further survey complication is that flatback turtle rookeries shift between summer and winter nesting seasons as their distribution extends into northern coastlines [15,16].
Existing Kimberley turtle records derive from three periods: millennia of Indigenous Knowledge, exploration journals in the 19th and 20th centuries, and in recent decades, industry surveys and Commonwealth border patrols. This joint historical background [3,17,18,19,20,21] does not yield an integrated regional perspective. A thorough revision requires contemporary quantitative surveys informed by local indigenous knowledge [8,22,23,24]. A two-way knowledge approach fulfills the regional aspirations of combining Traditional Knowledge with Western Science to derive management tools from broad scale aerial surveys by digital photogrammetry of turtle tracks on beaches. The photographic estimates of abundance, density and species identity are archivable records that can be reanalyzed and repeated.
The survey will generate a distribution and abundance summary to guide Kimberley inventory and management decisions. The aims are to:
  • Locate and rank the nesting hotspots of medium to large aggregations of abundant species.
  • Document the rarer species that may be better known from Traditional Ecological Knowledge.
  • Meld the traditional ecological knowledge and scientific approaches so that future co-management projects can be undertaken effectively and efficiently.

2. Materials and Methods

2.1. Study Area

The Kimberley study area (Figure 1) catalogues 2633 offshore islands and 1375 mainland beaches. Turtle rookeries are dotted along the discontinuous sandy strip of a remote 4340 km coast [25,26]. Only sixteen percent of the contemporary mainland coast is sandy, or 702 km, with a mean beach length of 0.52 km [25,26]. The scattered beaches were reached by daily flights from isolated airstrips. We developed a hybrid approach to designing beach surveys, with remote sensing of the reflective albedos of beach sand blended with traditional knowledge of nesting areas as well as explorer records and recent industry surveys.

2.2. Remote Sensing for Aerial Survey Design

Sandy beaches were found with Landsat Thematic Mapper (TM) 5 and Landsat Enhanced Thematic Mapper (ETM) 7 using the remote sensing software ERDAS ER Mapper 16.6.0.630 (Hexagon Geospatial). The sandy beaches were visualized by bright white pixels from a simple brightness index using Landsat bands 1 (Blue), 2 (Green) and 3 (Red) and thresholding the brightest pixels in each band. The brightness was confirmed by a pilot study of sand albedo from 46 WA turtle rookeries for sand reflectance ranging from 37–64% in sand reflectance [27]. The reflective albedos of sandy substrates were detected by satellite sensors at medium resolution (25 m pixels). The sand spectral signature changed to redder substrates for geological regions with iron-rich soils; thus, the threshold values were adjusted to be suitable. Where higher resolution Rapideye imagery (Planet Labs Inc.) was available (a pixel resolution of 6 m) the same method was applied for a more detailed beach dataset. Both high resolution and medium resolution beach datasets were filtered by removing questionable white points within a spatial buffer of >1300 m from the mainland coasts and >500 m from the island coasts. A visual inspection preceded a final digital clean-up of false positives before the remote-sensing beach dataset was given to aerial crew for flight planning. This information was combined with a layer of island beaches sourced from Landgate aerial photography (Available online: https://www0.landgate.wa.gov.au/ accessed 20 March 2021). All identified beaches were cross referenced against mainland beaches in the Australian Beach Safety and Management Program National Dataset [25,26]. A criterion of 100+ m beaches was consistent with and facilitated review of images from remotely sensed data. In addition, the GIS photomosaic layer and Google Earth images complimented beach identification.

2.3. Flight Path Planning

In general, the survey attempted to fly over every sandy beach to record turtle tracks for the Kimberley coast. The project aligned region-wide surveys to the mid-seasons of two dominant nesting species in the Kimberley, the green and the flatback turtle. An early January flight involved summer green turtle nesting and any summer nesting flatback turtles south of the Dampier Peninsula [12,18,19,20], and an August flight evaluated the winter nesting flatbacks east and north of the Dampier Peninsula [3,19]. The chosen flight dates were selected to avoid cyclone season, precluding any detail about hawksbill nesting (October peak, informed by Pilbara) or olive ridley nesting (April/May peaks, based on NT nesting).
Co-management local knowledge ensured that Native Title and Marine Park areas had thorough coverage. The knowledge was collated and guided by Land and Sea Country Plans [28,29,30,31,32,33,34] and multiple visits to communities, including Indigenous Saltwater Advisory Group (ISWAG) meetings, Prescribed Body Corporates or informal ranger interviews.
Place names given by early explorers [35], historical accounts [36,37,38] or recent surveys [3,4,19,39,40,41] were defaults in the flight paths. Anecdotal locations from nature-observant witnesses were added if a species and GPS was given. Lastly, an internet search for online images (from Google search of the terms turtle, tracks, Kimberley, Western Australia, and the species and common names for sea turtles) added geotagged locations if a species ID was concurred by two biologists.

2.4. Image Capture

Surveys were flown on consecutive days from 30 December 2013 to 8 January 2014 (hereafter Summer) and 31 July to 9 August 2014 (hereafter Winter). Each seasonal survey began at the WA/NT state border (−14.882 S, 129.988 E) and flew in daily increments toward a western boundary of Eighty Mile Beach Marine Park (−19.966 S, 119.081 E) by refueling at the airstrips at Kununurra, Kalumburu, Derby, Broome, or Port Hedland. Each survey took eight flight days, with an extra day afforded for re-flights or weather delays. Recent Google Earth Imagery from 2014 was cached to a tablet or laptop for pre-flight planning and in-flight reference to navigation instruments.
Flights were aligned, to the extent possible, with morning low tides and spring tides to enhance the details of fresh or old turtle tracks [42,43,44,45]. Flights or sections were re-flown the next day if atmospheric visibility was affected by bushfires or technical issues after take-off.
We followed standard guidelines for aerial survey [42,43,44,45] operating conditions (150–200 m elevation and 100 km/hr speed) from previous surveys conducted with the same aircraft (Cirrus SR22), pilot, observer, and camera system [20]. A downward-pointing digital camera attached to the starboard wing took 20% overlapping geotagged images along flight paths at a resolution of 2–3 cm per pixel. Camera specifications were a Sony SLT-A99V, f-stop of f/3.2 to 3.5, exposures 1/1250 to 1/8000 s, ISO-100, exposures −1 bias, focal length 24 mm, max apertures = 2, pattern metering mode, no flash, focal length 24. The digital camera was triggered by a wireless connection from the cockpit. The image swath captured the supratidal beach and exposed intertidal sand with the falling tide. A track tally for major beaches was annotated to the tablet as each beach flight concluded.
Standard NMEA (National Marine Electronics Association) GPS and flight instrument data were synchronized to the flight records and navigation instruments. The metadata for each image included a geo-referenced ID number, latitude and longitude in decimal degrees, flight attributes of date/time, altitude, heading and sequence. Images were downloaded to a portable hard drive and transferred to DBCA for visual analysis.

2.5. Image Analysis

In the office, all digital photos were merged as photo-mosaics before enumeration of nesting tracks for each beach. Dual monitor screens assisted in viewing the aerial image details alongside the flight paths. Beach images were magnified for clarity, and notable features annotated in a spreadsheet. Initial interpretation of the images involved multiple viewers experienced in both aerial surveys and ground survey verification. The interpretations of all viewers were compiled by a single reviewer (ADT). The geotagged images included fresh tracks, old tracks, and nesting body pit depressions (pits). Digital images were further annotated with habitat type, track counts, pit counts, species or other details relevant to management. Geographic feature names were added from recent nautical charts (2010 Marine Gazetteer of Australia and Australian Hydrographic Office www.hydro.gov.au accessed on 17 November 2020).
We tallied fresh turtle track counts to show density (# tracks km−1, and # beach km) for summer and winter flights. The overlapped extent of flight tile images was combined in ArcGIS as a merged photo-mosaic. The data of each mosaic tile was summed so that tracks were only counted once if recorded by partially overlapping photos.
Final data products included a point vector dataset having all track observations and an ArcGIS geodatabase that related the individual photographs to the mosaics so that analysis of turtle tracks could be completed from the mosaics. Images (n = 45,000+) and GIS layers were delivered to ranger groups by portable hard drives and archived at the WAMSI 1.2.2 project in the CSIRO Pawsey Supercomputing Centre and the DBCA Remote Sensing and Spatial Analysis Program for reference and potential use in other projects.

2.6. Ground Surveys

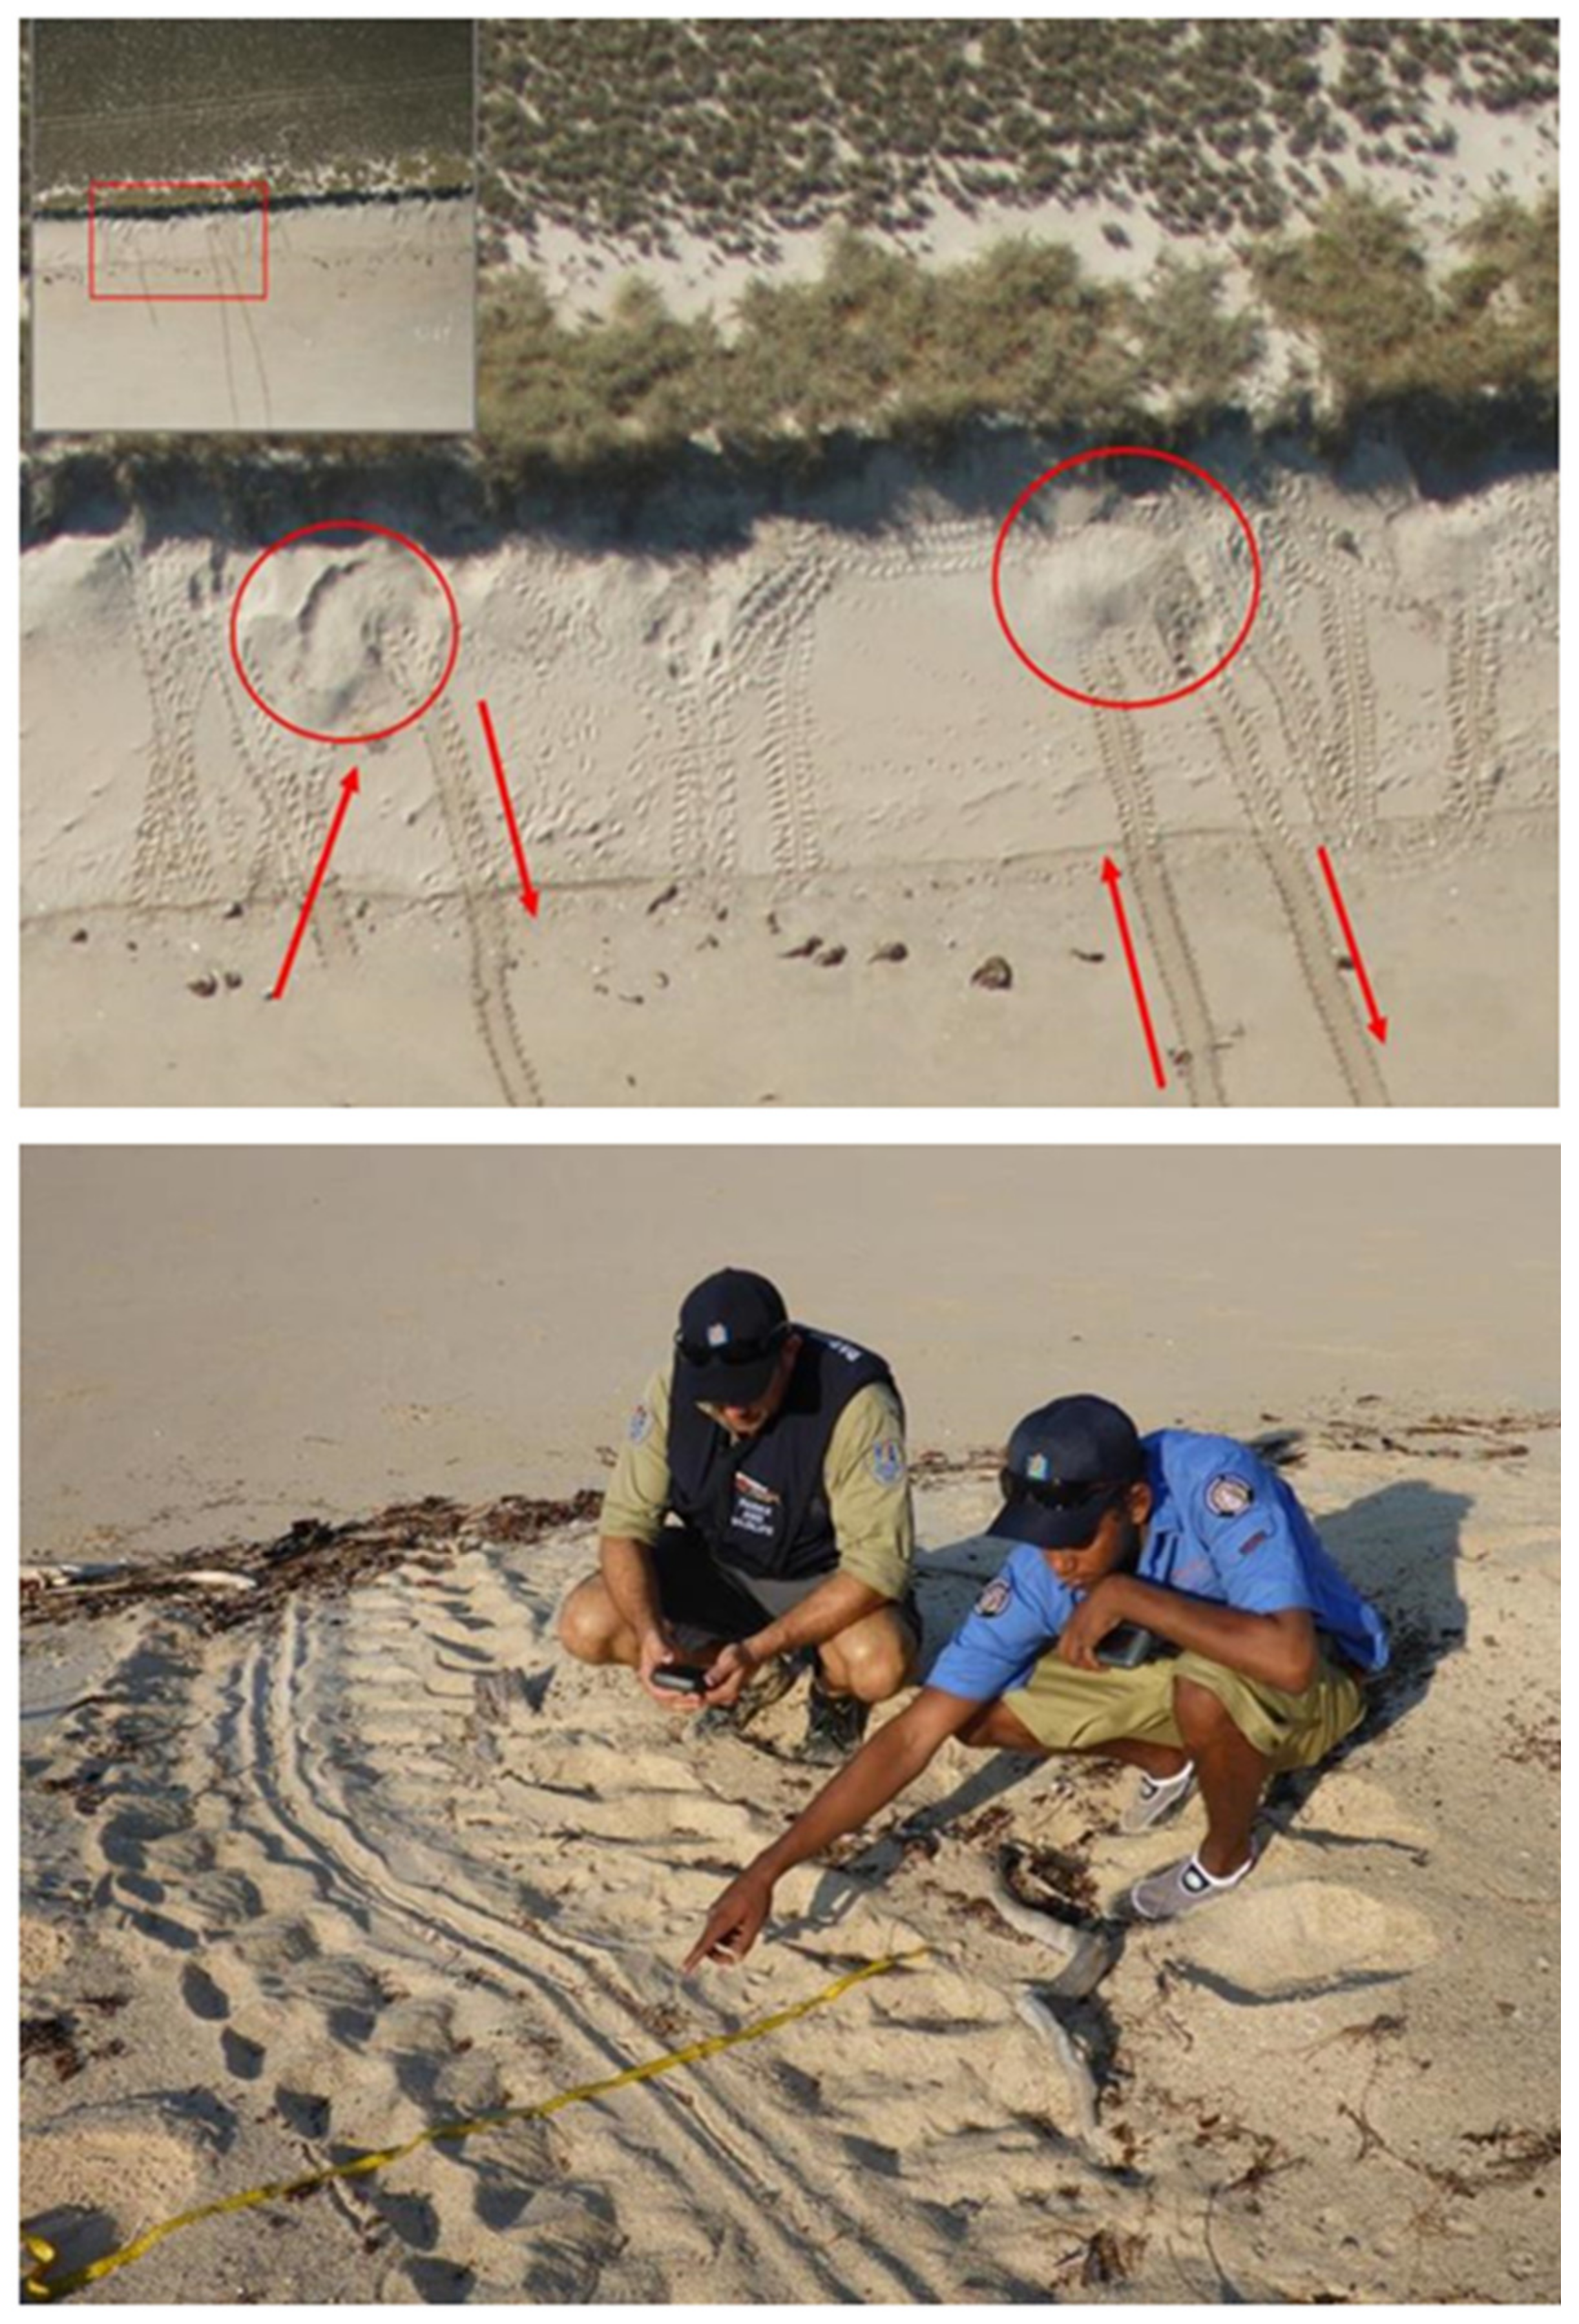
A recognized logistic hurdle was a scarcity of boat access across the remote coast. Therefore, the field work with Traditional Owners relied on opportunistic ground surveys reinforced by Traditional Ecological Knowledge, (TEK) which was defined as “a subset of ecological knowledge, generally defined as local knowledge held by indigenous peoples or local knowledge unique to a given culture or society” [46]. A reliance on TEK adjusted the aerial survey counts, as nesting beaches that were not exclusively monospecific by season and species were named based on their diagnostic crawl characteristics, direct observation, or excavated nests of live or deceased hatchlings. Rangers carried a photographic field guide of track characteristics [47] on a hand-held electronic device with CyberTracker software to take photographs (Figure 2). Training involved 27 field trips and 44 presentations to develop high confidence in species IDs. In contrast, accessible beaches had earlier information on significant mainland flatback [3,4,20] and offshore green [13] rookeries scaled at 100–1000 s. Ground surveys targeted both the high-density rookeries as well as rarer occurrences. Ground truths included 30 winter beaches, but only seven summer beaches because of wet season summer cyclones.
Sea turtles have high cultural importance to Aboriginal culture and the Traditional Ecological Knowledge explicitly documented by Healthy Country Plans [5]. We followed the evolving guidelines for ‘right way research’ before, during, and after surveys with rangers, Kimberley Land Council coordinators, and elders [24]. We received permissions to enter Indigenous Protected Areas and Marine Parks with Traditional Owners present [48] (Figure 3). Ground surveys had to respond to regional realities (random bushfires, cultural travel to elder funeral observances, monsoonal weather). Furthermore, flights started and ended in different Saltwater Country and Native Title Groups. Therefore, we completed ground surveys within days to weeks of flight dates to verify species ID by observed evidence (Figure 2 bottom, track or hatchling observations), to corroborate the aerial images, and to cross-reference with the direct observations of earlier observers and studies.

2.7. GIS Products Scaled to Saltwater Native Title Groups

All aerial images of flown-over beaches were included; however, it was not feasible to verify the hundreds of micro-beaches on the ground given limited boat resources. Furthermore, beaches shorter than 100 m were not detailed features in coastal atlases [25,26]. The abundance and density of tracks were mapped as GIS layers.
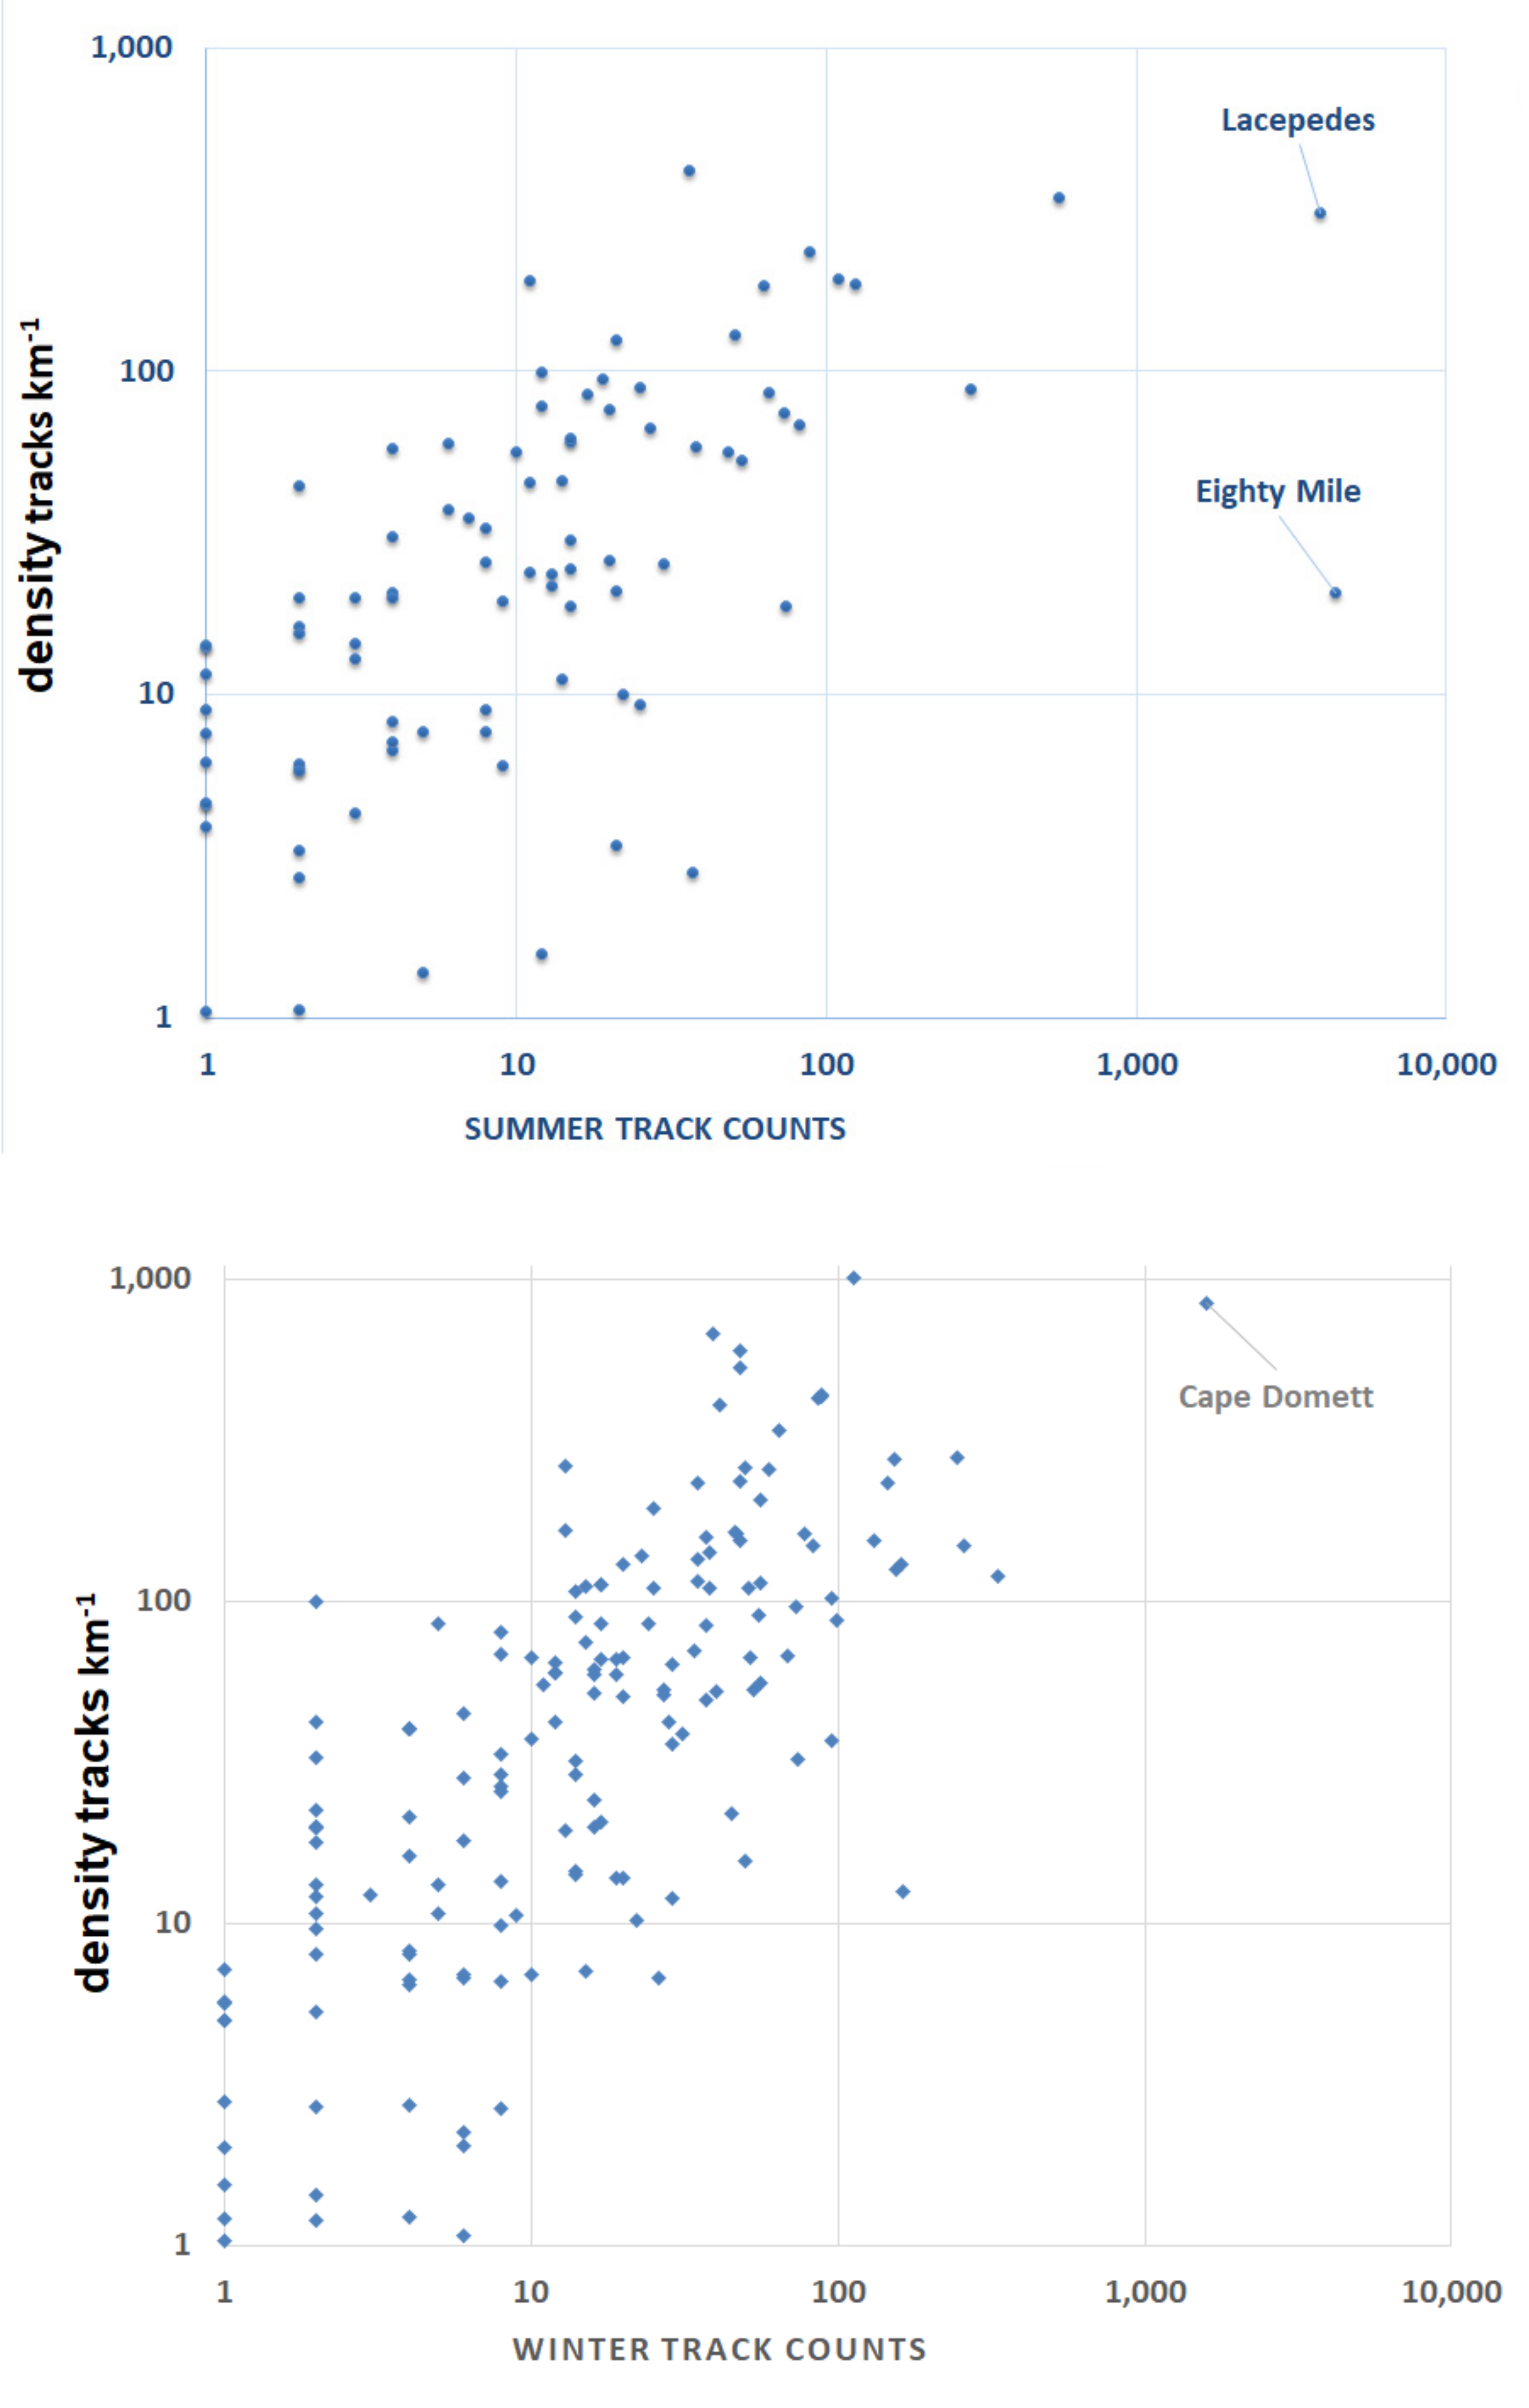
Turtle activity was plotted by log10 scale (1 s–10 s–100 s–1000 s), with track counts on the x-axis and nest density on the y-axis. A regional median of track counts gave an applied interpretation across all Kimberley rookeries. Track count values above the median defined rookeries of aggregated activities, while values below the median indicated rookeries of lesser significance. A regional overlay of Traditional Owner Native Title boundaries [49] was compared to the survey results [50].
GIS products were completed with ESRI ARCGIS 10.6.1 or QGIS 2.18. Statistical analyses were conducted in MS Excel 10 with PopTools 3.2 add-in. Means are reported with sample size, 1 SD, and range.

3. Results

3.1. Spatial Coverage and Track Determination

Clear image quality occurred on 89.3% (17,228/19,256 images) of winter flights and 91.9% (21,700/23,600 images) of summer flights. The consecutive flight days in the 2014/15 summer and winter seasons included >90% of all beaches on each survey. The flight guidelines at 153–200 m elevation detected tracks or old nesting pits (both features are 1 m wide and clearly detected from aircraft), with a preference for interpreting species by track characteristics from ground level viewing (choices were flatback, green, or other). The survey region had year-round nesting by green turtles peaking in Austral summer, as well as spatially segregated summer and winter nesting by flatback turtles.
A scatterplot of track counts against density at a log–log scale (Figure 3) revealed two summer rookeries (Eighty Mile Beach: 100% flatback turtles; Lacepedes: 90% green turtles, 10% flatbacks) and a winter center of nesting activity (Cape Domett: 100% flatback turtles), and as outliers for the highest scaled category. These outlier rookeries were reported separately in to avoid extreme value bias in statistical analyses. Ranked numeric track counts by beach are given for season, placename, percentage of flight season tracks, beach length, and density for summer (Supplementary Table S1) and winter (Supplementary Table S2).

3.2. Relative Species Abundance at the Time of Seasonal Surveys

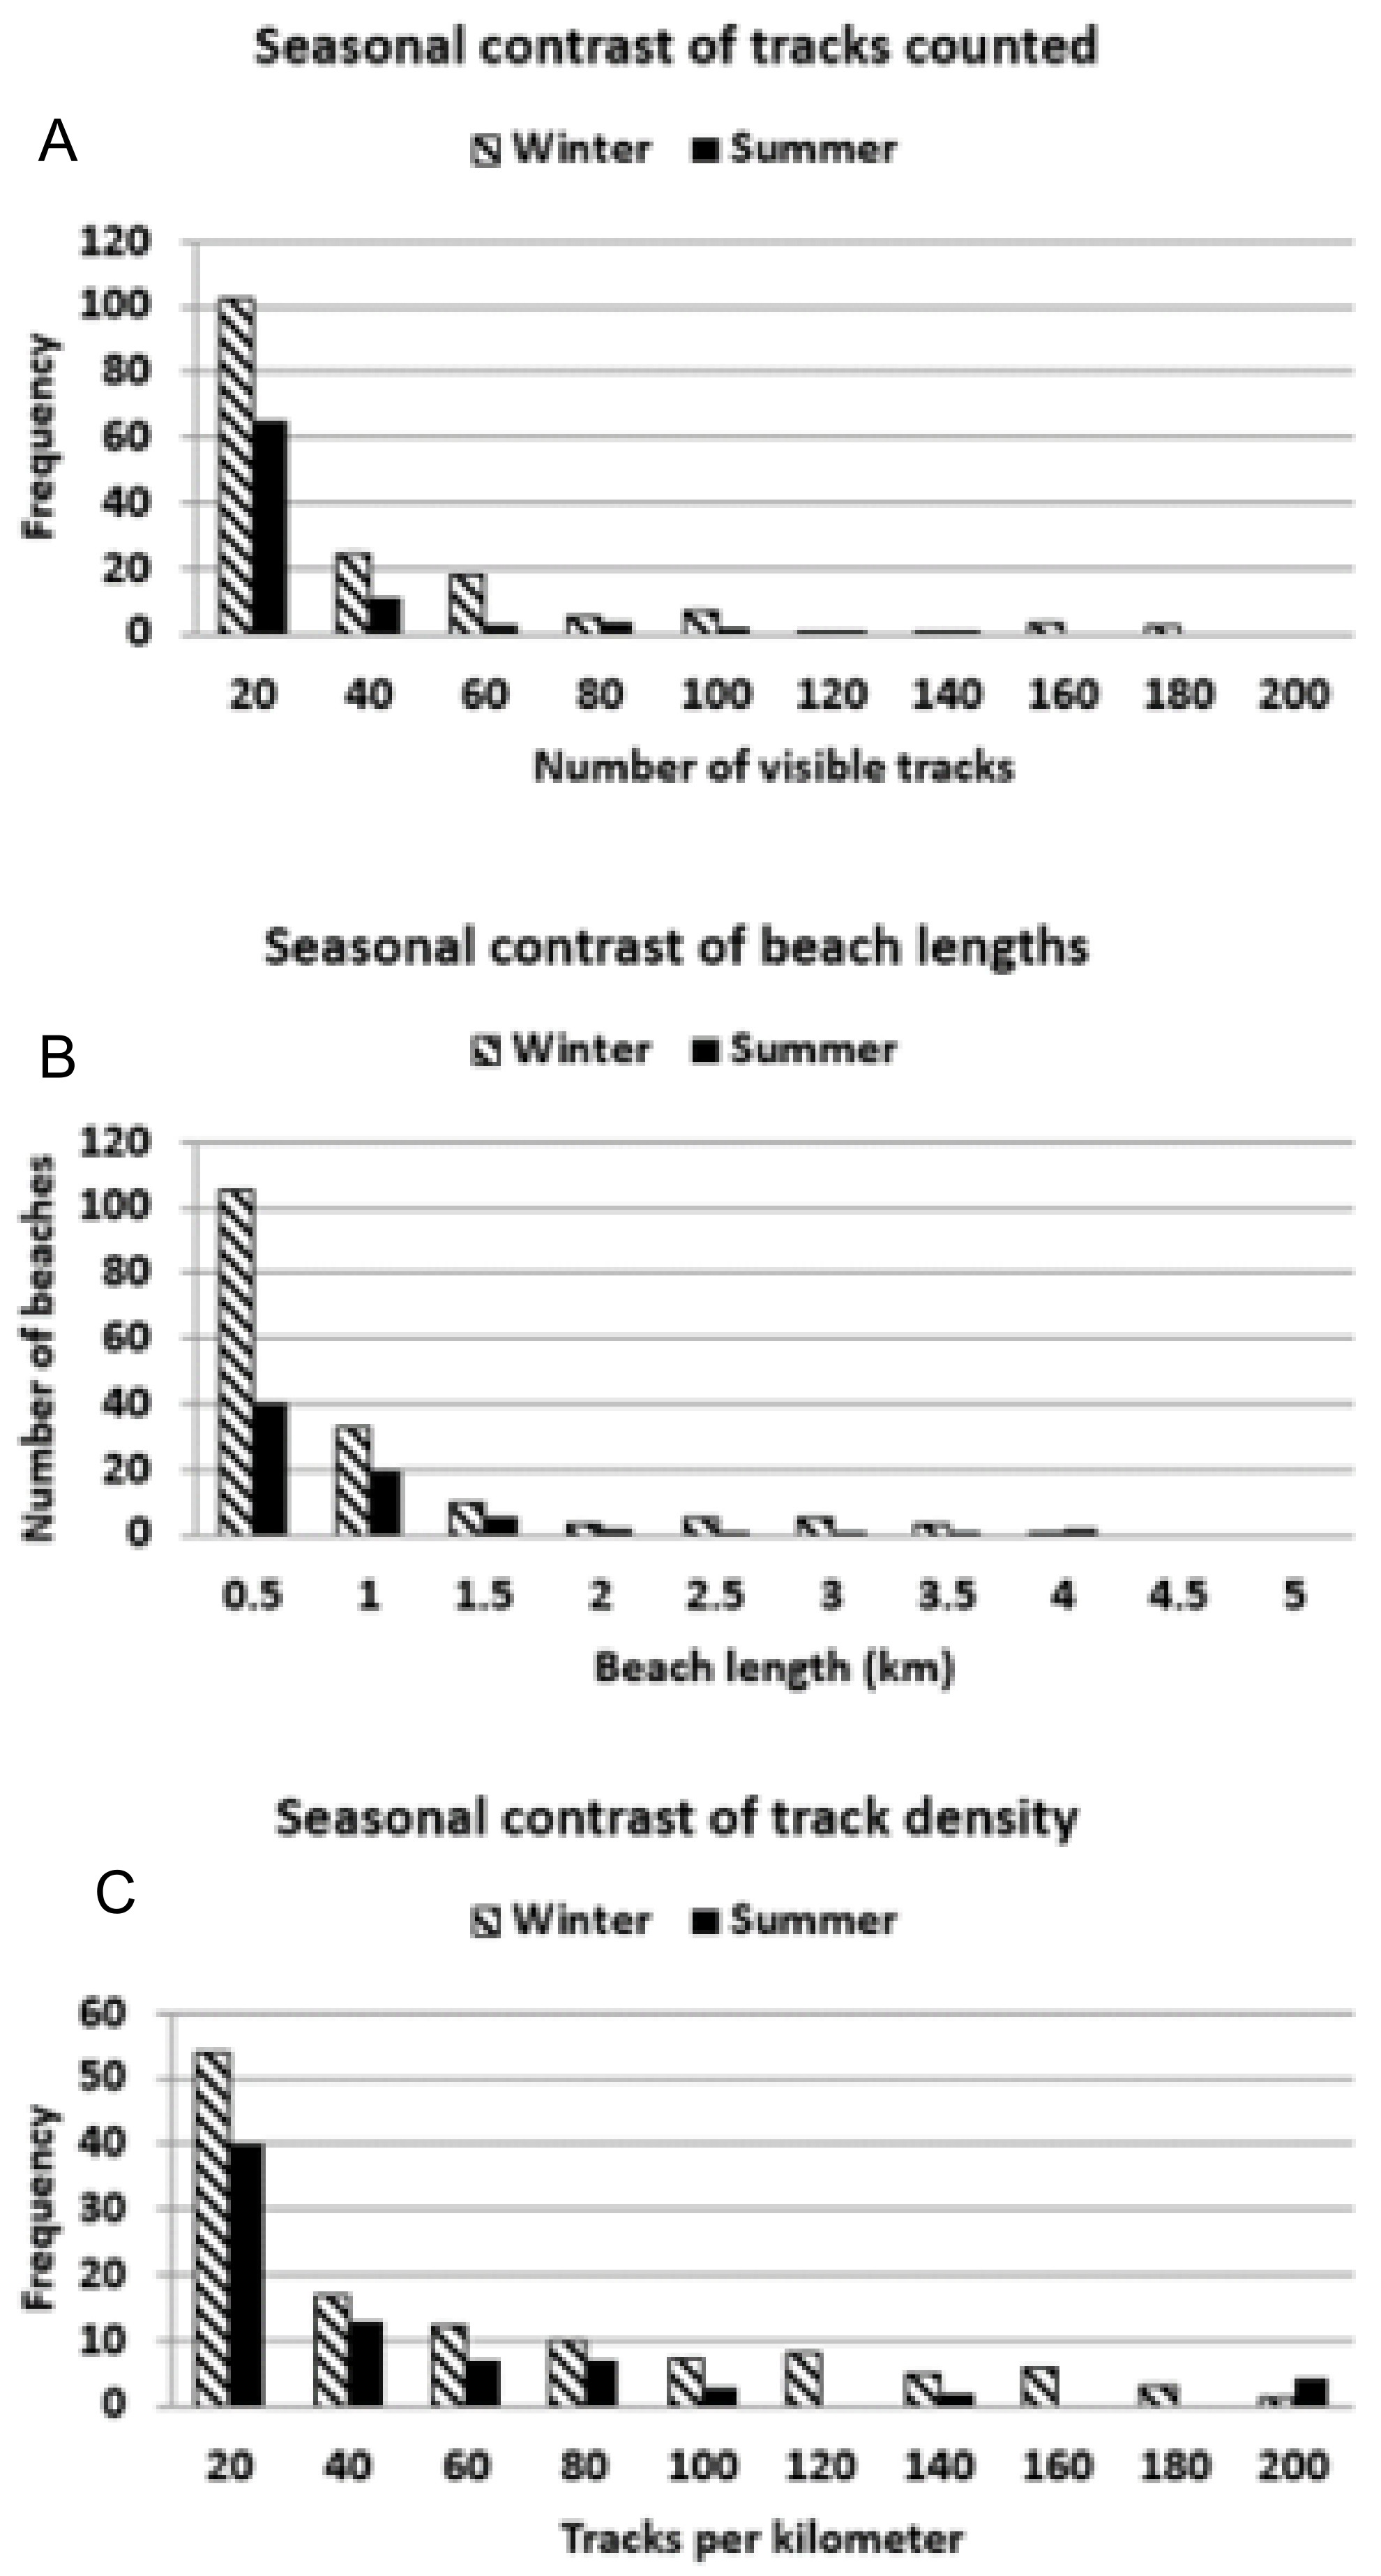
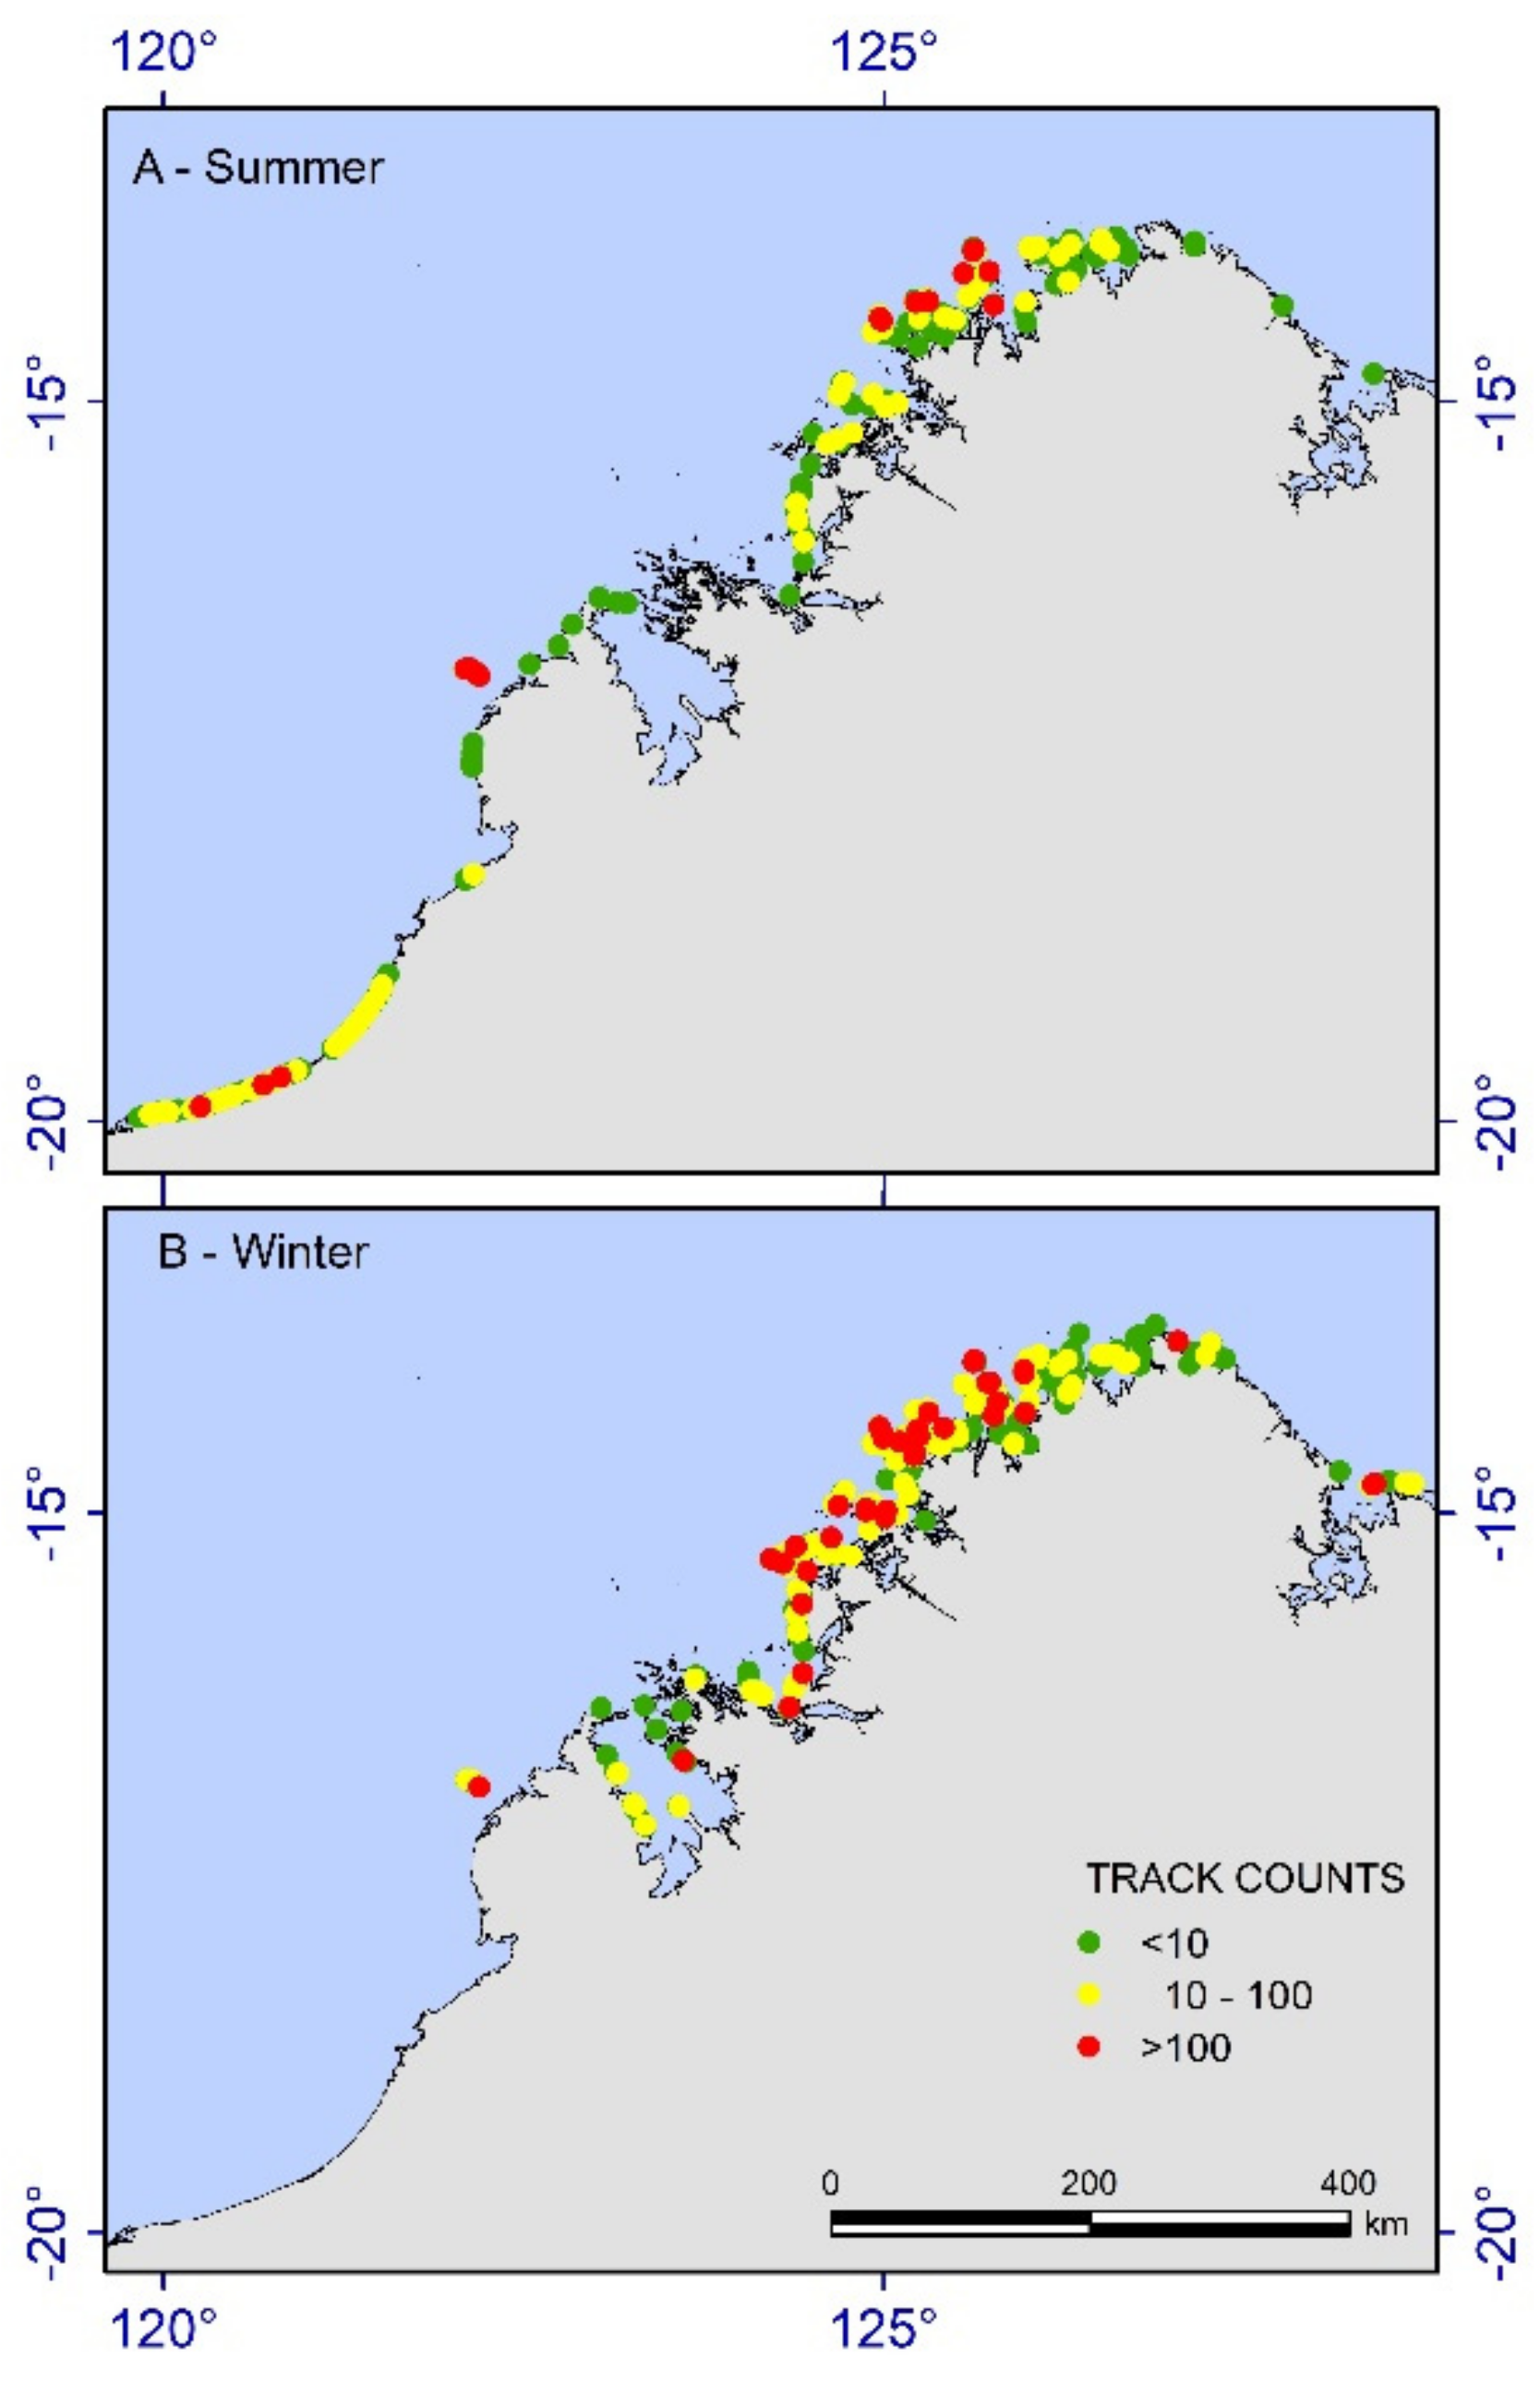
Winter surveys revealed 167 beaches with quantified tracks (Figure 4A,B). Summer surveys revealed 91 beaches with quantified tracks (Figure 4A,B). Low to moderate track counts were detected across the Kimberley offshore islands, while isolated tracks dotted the mainland coastal stretches backed by mainland rocky cliffs or mangroves. Since higher aggregations of tracks (above median of 20 nests km−1) were relevant to broad co-management concerns, the track data were qualitatively classed into low (<10), medium (11–100), and high-density (>101–1000) track counts for the GIS layers (Figure 5A, winter; Figure 5B, summer).
The multi-pixel resolution of aerial images was hypothetically able to capture the solo tracks of small olive ridley or hawksbill turtles; thus, fresh tracks by either species should be detected in photos, but not old, eroded tracks. However, none of the light-bodied turtle species were observed by aerial survey, only first-hand inspection by ground patrols. No leatherback or loggerhead tracks were recorded, although they are known migrants through the Kimberley region according to both traditional knowledge and satellite telemetry studies.

3.3. Summer Aerial Surveys

The summer flatback nesting was southwest of the Dampier Peninsula, from Broome southward to Eighty Mile Beach (41%). The summer green turtle nesting was primarily on the Lacepede Islands (36%), west of the Dampier Peninsula, and on the North Kimberley offshore islands (23%). Summer surveys recorded 5782 island activities spanning 45.8 km (across 52 islands) for an average of 126.2 island activities km−1. Summer surveys recorded 4953 mainland activities spanning 279.6 km (on 37 mainland beaches) for an average of 17.7 mainland activities km−1.
The Lacepede Islands had 3910 island tracks over 12.6 km, for a density of 309 tracks km−1. Eighty Mile Beach had 4387 mainland tracks over 212 km, for a density of 20.7 tracks km−1. However, the Eighty Mile tracks had higher density within two 6 km monitoring strips centered on Wallal Downs and Anna Plains Station, punctuated by coastal stretches of barren salt flats or exposed limestone that impeded nesting. Wallal Downs had a nesting density of 90 tracks km−1 (542 tracks in 6 km) and Anna Plains had a nesting density of 52 tracks km-1 (309 tracks in 6 km). Excluding the Lacepedes and Eighty Mile Beach, the mean number of summer tracks was 27.4 (n = 89, SD = 68.9, range 1–562), mean beach length was 1.2 km (n = 78, SD = 2.3, range 0.1–13.2 km) and mean track density was 48.1 tracks km−1, SD = 74.9, range 0.7–417 tracks-. Summer flights recorded 2989 activities for 67.1 km beach (across 63 mainland beaches) at an average of 44.5 mainland activities km−1.
The summer survey recorded 90.4% of all tracks in the top ten ranked beaches. The ranked summer rookeries (Supplemental Table S1) were Eighty Mile Beach and the Lacepedes, followed by the offshore islands of Maret Island (562), Cassini (293), Parry Island (124), Oliver Island (110), Bougainville Peninsula (88), West Montelivet Island (82), Sir Graham Moore Island (74) and Condillac Island (73). Other high track densities (tracks km−1) were recorded from Maret Island (345), the West Lacepede Islands (309), Oliver Islands (192), Parry Island (186), and Cassini Island (88).

3.4. Winter Aerial Surveys

The winter flatback tracks were concentrated on the mainland beaches at Cape Domett (23%) and broadly scattered among offshore islands east of the Dampier Peninsula (77%). Cape Domett had a total track count of 1598 tracks on 1.8 km and a density of 888 tracks km−1. Excluding Cape Domett, the mean number of mainland winter tracks was 32.1 (n = 166, SD = 48.2, range 0–333), mean beach length was 0.7 km (n = 166, SD = 1.3, range 0.1–13.1 tracks km−1) and mean track density was 85.4 tracks km−1, SD = 137.5, range 0.7–1017 tracks km−1. Winter surveys recorded 3932 island tracks on 60.2 beach km (across 102 island beaches) for an average of 65.3 island tracks km−1.
The winter survey recorded 48.3% of all tracks in the top ten ranked beaches, expanding to 61.4 % of winter tracks in the top twenty beaches. The highest ranked winter rookeries (Supplemental Table S2) were at Cape Domett (1598), followed by South Maret Island (333), Cassini Island (257), Parry Island (246), a mainland coast referenced as East Shakespeare Hill east of Cape Domett (164), SW Osbourne Island (161), Coronation Island (155), Keraudren Island (152), Kuntjumal Kutangari Island (146), East Montalivet Island (131), Vulcan Island (112) and North Maret Island (99). Ranking rookeries by density was distorted by a prevalence of short beaches in the Kimberley. However, the same rookeries recorded as substantial by track counts had a density of >100 tracks km−1, with the exceptions of North Maret (87 tracks km−1) and East Shakespeare Hill (13 tracks km−1).

3.5. Findings from Ad Hoc Ground Surveys

A total of 42 field trips (between 2013–2019) verified species from track characteristics or viewing of hatchlings. Surveys included winter (Jun-Jul-Aug, n = 17), spring (Sep-Oct-Nov, n = 15), summer (Dec-Jan-Feb, n = 5) and fall (Mar-Apr-May, n = 5). The results include observations of 2473 body pits, 47 unidentified tracks, 2 green turtle hatchlings, 165 green turtle tracks, 54 flatback hatchlings, 358 flatback tracks and 39 hawksbill tracks.
Ad hoc ground surveys focused on three major rookeries because of the limited boat access, although additional islands and beaches were visited. For Eighty Mile Beach and Cape Domett, species verification revealed 100% flatback tracks during several years of two-week ground surveys. The Lacepede Islands were characterized as an offshore green turtle rookery; however, the overlapping track density did not allow exact species ID and counts. DBCA and Nyul Nyul rangers approximated that ~10% flatbacks were amongst the nesting tracks on the West Island of the Lacepedes group.
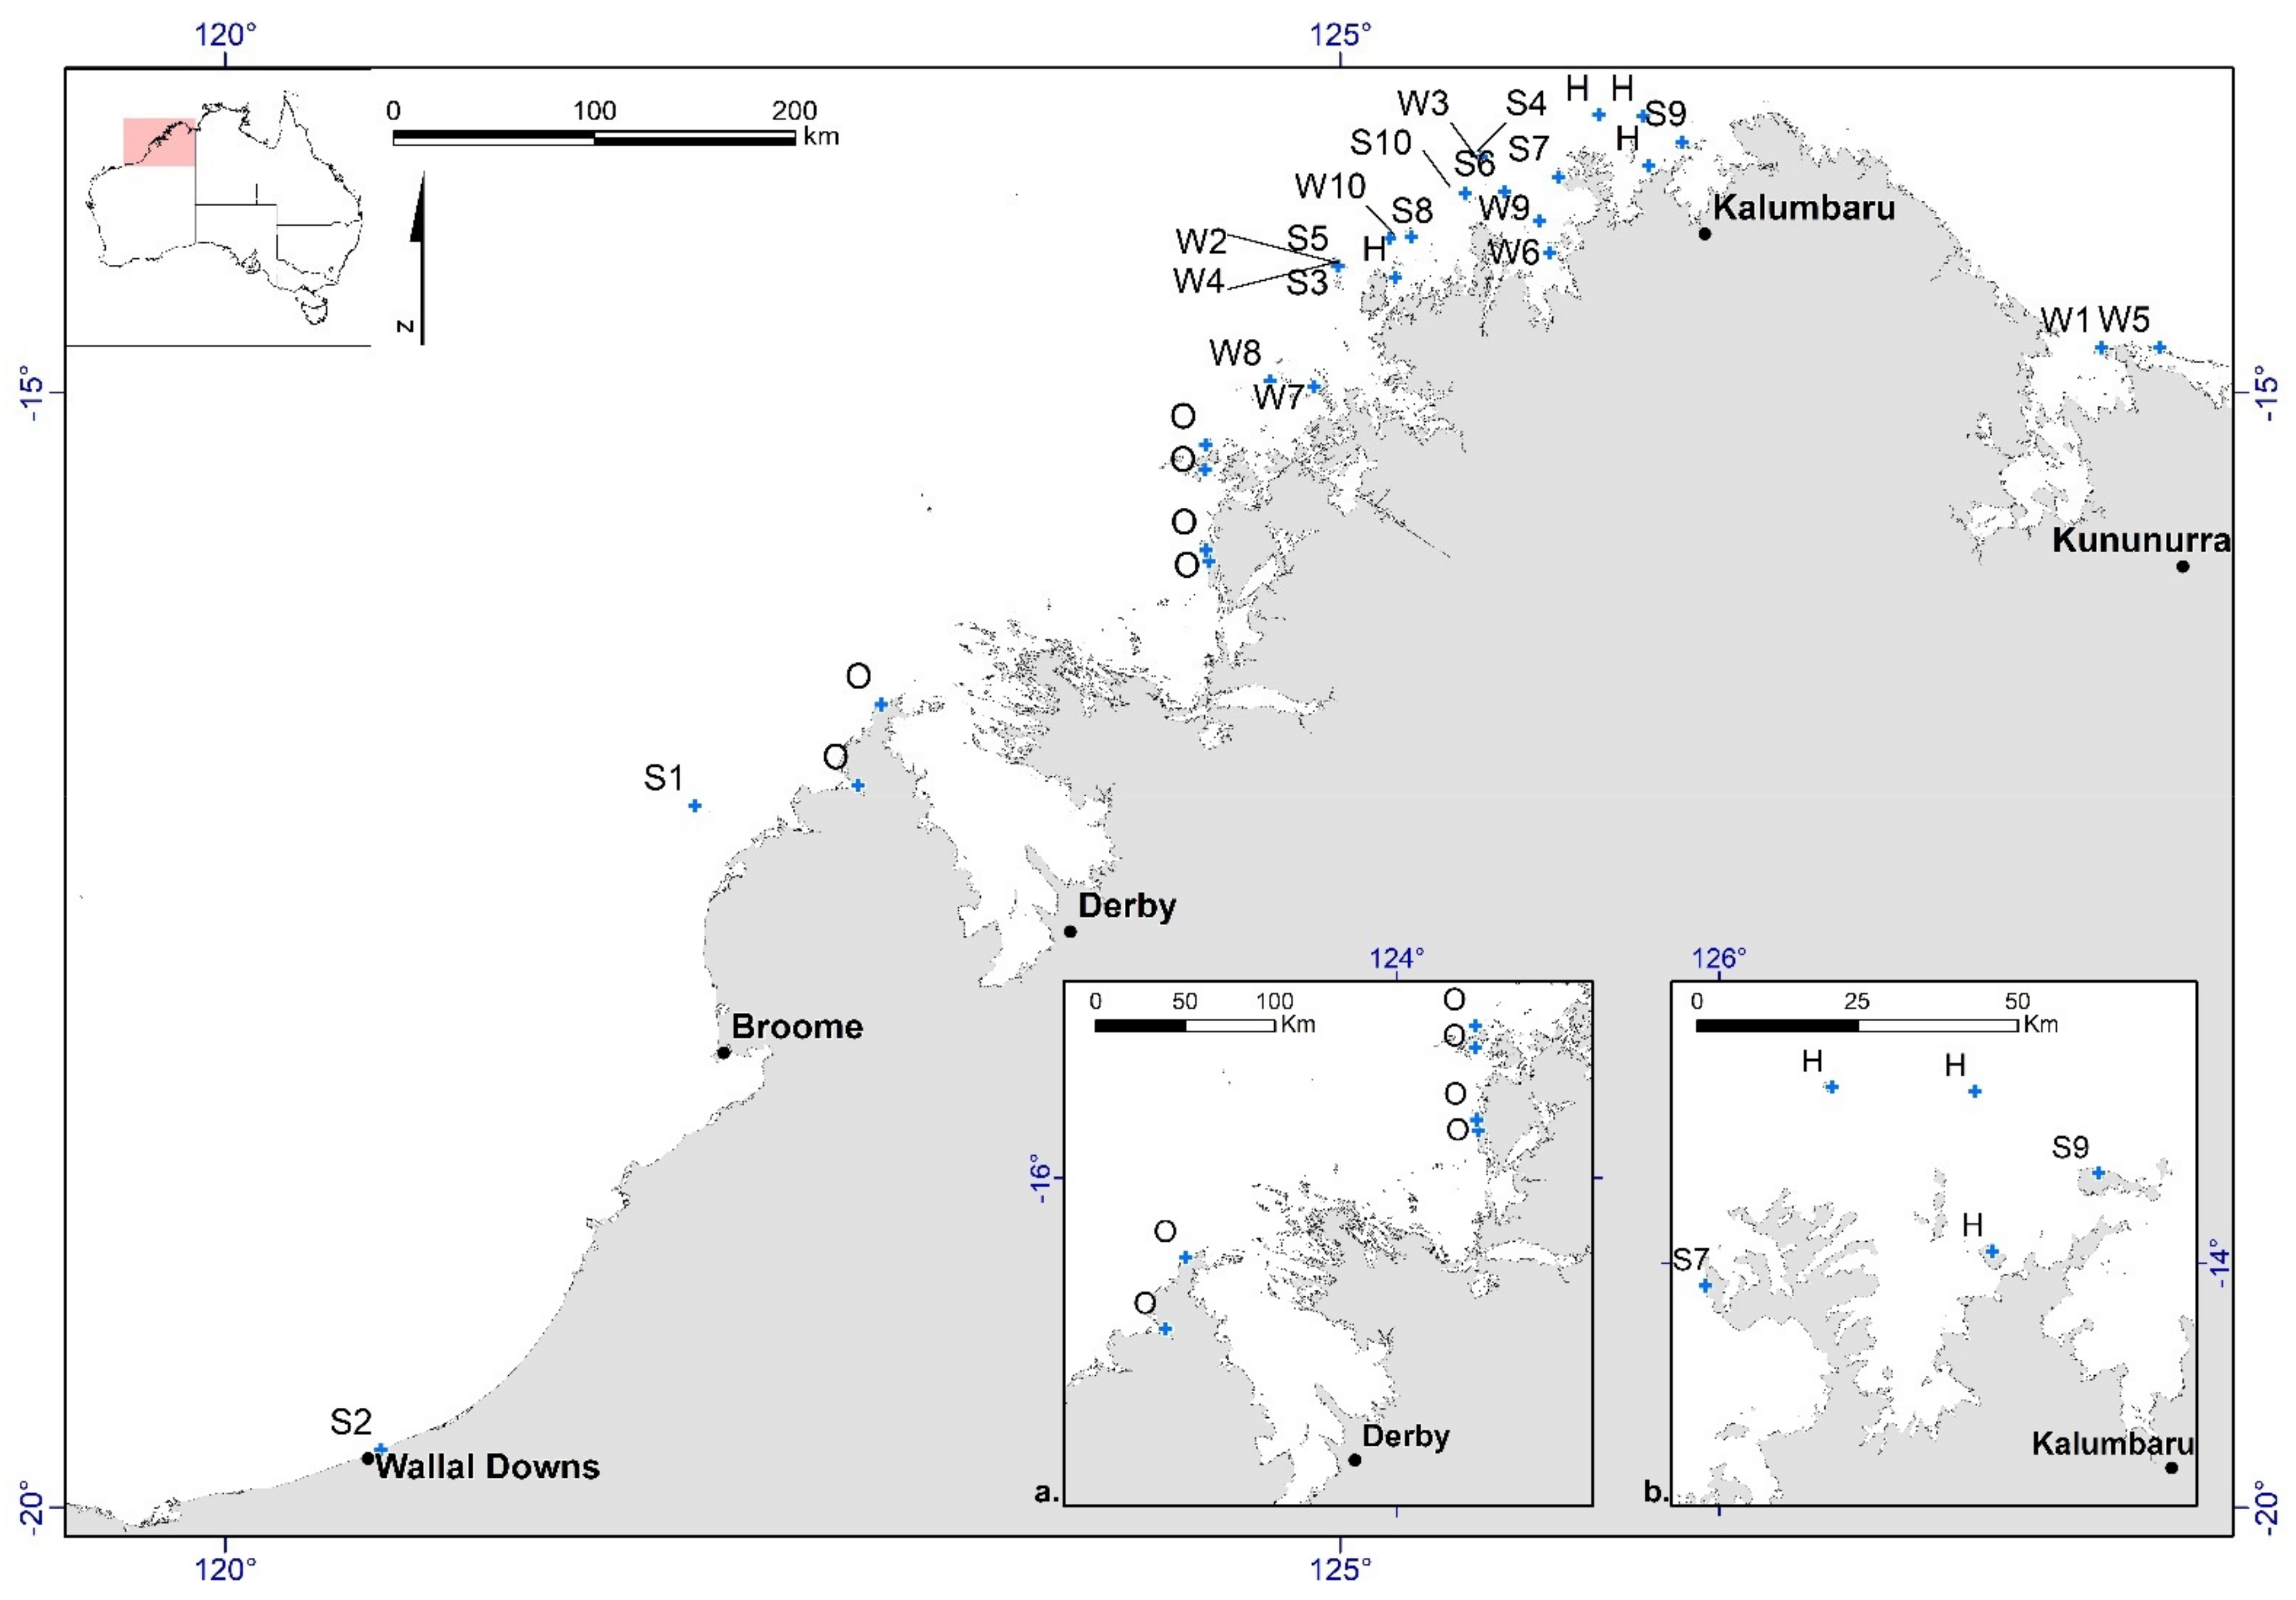
All rare species found were recorded by Indigenous rangers during foot patrols (Figure 6). Olive ridley tracks or hatchlings were recorded on the Dampier Peninsula and along Camden Sound (June, September). Foot surveys also discovered single hawksbill turtle track and a stranded female nester in surveys of the North Kimberley mainland and offshore islands in February, July, September and October (Figure 6).
Indigenous rangers found that the Dampier Peninsula bordering King Sound (Figure 6) marked the spatial changeover of summer to winter flatback nesting. The easternmost summer mainland flatback nesting occurred at One Arm Point (−16.463, 123.047) and the easternmost summer island flatback nesting was in the Lacepede Islands (−16.853, 122.135), while the westernmost winter mainland flatback nesting occurred near Lombadina (−16.5078, 122.892). The westernmost winter flatback nesting enclosed by King Sound included observations from Helpman Island (−16.733, 123.607), Point Torment (−17.067, 123.581), Valentine Island (−16.728, 123.619) and Malaburra (−17.037, 123.273).
A regional overlay of Traditional Owner Native Title boundaries [49] with the numerical results [50] afforded a new operational map for Traditional Owner, state and national strategic management interests across seasons, rookeries, and species (Figure 6). The seasonal summaries for the islands and mainland (Table 1) offer a conceptual outline of how Kimberley co-management groups might consider the survey outcomes to index beaches or augment future surveys (Table 2).

4. Discussion

4.1. Advantages and Limitations of Aerial Survey

Aerial surveys were efficient for the widely distributed, discontinuous habitats and nonlinear survey technique demanded by the Kimberley region coastal geomorphology. A log10 scale perspective suited for a vast region gave a ‘tenure blind’ framework to promote strategic and complementary monitoring programs across multiple management systems (e.g., IPA, State, Commonwealth, Native Title areas) by ranking with co-management interests in common (Table 2). Most importantly, the spatially explicit guide considers where to invest strategically in future monitoring at given levels. A survey platform using a fixed-wing plane was chosen instead of helicopter or drone because the daily distances were in the hundreds of transit km per day and the convoluted flight path [51] was constrained by limited refueling locations. High resolution remote sensing satellites (such as Pleiades, pansharpened to 50 cm) may capture the turtle tracks of heavy bodied species but are seldom at a resolution necessary to name turtle species by themselves [52]. In contrast, the detailed resolution of drone surveys worked well for Cape Domett, a monospecific 2 km rookery [53], but was not an ideal tool for a multiday survey of a discontinuous coast. A significant new finding was that aggregated winter nesting (77%) on many offshore islands exceeded the large mainland rookery (23%) at Cape Domett. We concur that remote sensing holds promise for future surveys; however, standard aerial surveys and ground patrols remain the default to circumvent the high sand albedo, which may hinder satellite detection of low contrast turtle tracks, for example on Florida beaches [52]. We welcome future advances in remote sensing and artificial intelligence that progressively improve the promise of remote track identification.
The mid-seasonal aerial surveys supplemented by ground verifications yielded positive IDs for persistent tracks of the heavier green and flatback turtles discovered by on-ground verification. A general observation was that flatbacks prefer the sheltered shores of islands while greens prefer exposed beaches [39]. Species IDs remained uncertain for lighter bodied, smaller species unless rookeries were monospecific. The summer and winter flights were unlikely to capture hawksbill October nesting phenology aligned with the Pilbara Bioregion and Northern Territory. The flight timings also did not document the sparse olive ridley nesting adjacent to Camden Sound, which was determined independently of the flights. Therefore, solo nesting by olive ridley or hawksbill turtles would be better documented through different timing or targeted boat surveys along with consultation with Traditional Owner groups.
Early aerial studies [44,45] have relied on a positive correlation verified between ground and aerial surveys as critical support when coasts cannot be visited regularly [30,31]. Isolated snapshot surveys work from a survey window that samples peak midseason nesting [50]. However, the present case study indicates that any snapshot or ad hoc survey of multiple beaches is confounded by extended nesting seasons in the tropics, extreme variability in nightly nesting numbers [3] and track retention during irregular visits. Overlapping tracks on dense nesting beaches and non-nesting emergences further complicate the accuracy of ground survey interpretation. The intended aims of investigating regional abundance and distribution illustrate a trade-off between the imprecision of detecting individual nests (at 1 s to 10 s) and the primary management focus on defining major rookeries (with 100 s to 1000 s). Increasing temporal coverage of selected rookeries (i.e., repeated surveys over a nesting season) would lend greater confidence to the track count results [54]; however, this was not logistically or financially achievable given the study constraints.
Image clarity initially affected roughly 1 in 10 images with unavoidable flight factors (altitude changes, tight turns, speed blurring) and atmospheric visibility (bushfire smoke, glare along changing flight path), with the high image overlap of photo mosaics diminishing these impacts for any single photo. The survey timing resulted in tidal variability in the macrotidal range (up to 11 m) and variable lunar brightness, which can either disincline or boost turtle emergences. For example, variation for a fortnight of daily track counts at Cape Domett was instructive (ranging from 0 to 200 tracks a night within a few successive nights) for earlier to later moon rises and associated tide shifts ([3], DBCA- pers. comm.). Track visibility also depended on monsoonal precipitation (wet/dry season conditions), winds (shielded or exposed), hour of day and season (shadows, variable contrast with sun angle), tide (spring vs. neap tides to distinguish activity), sand color (affecting reflectance and contrast) and atmospheric clarity. The foregoing factors may affect image analysis but do not discount aerial surveys as a reliable tool [30,31,45] for detecting items of management interest ranging from 0.1 to 16 m (e.g., detected items included individual eggshells at depredated nests, hatchling track fans, human footprints, cattle tracks, swimming turtles, crocodile slide marks, navigation markers, boats, colony-nesting seabird rookeries, and migrating whales).
The empirical lessons learned relate to the scale limitations of single aerial surveys having to adjust travel logistics over remote country and offshore islands. Helicopter surveys were not workable for safety reasons when flying offshore, and inadequate boat-surveys limited wide-scale verification of track counts. However, the track counts were scaled from 1 s to 1000 s overall, so minor numerical imprecision was deemed acceptable given the primary aim was to locate and rank spatial hotspots in a strategic temporal window.

4.2. Synthesis of Survey Results with Earlier Knowledge

Management of endangered species requires fundamental spatial knowledge about foraging or breeding aggregations. These aerial surveys combine with historical accounts [13,20,55] and industrial surveys of the primary rookeries [3,19,56,57] to outline Biologically Important Areas (BIA) for Kimberley turtles [10]. Currently BIAs are defined by 20 km buffers for rookeries of loggerhead, green, hawksbill, olive ridley or leatherback turtles and by a 60 km buffer for flatback turtle rookeries. Recent genetic studies reflect that Western Australian flatback genetic stocks [16] diverge at King Sound into two winter nesting subunits and three summer subunits. Green turtle rookeries in Western Australia have summer nesting peaks, with some minor nesting year-round at northern tropical latitudes [13].
The isolated records for Kimberley olive ridley turtles [41] remain sparse compared to the April-May nesting populations in the Northern Territory [58,59] or Queensland [10]. Furthermore, these were not ‘arribada’ mass nesting aggregations but solitary nesters. Because olive ridley nests are often depredated by dingoes or feral swine on mainland beaches, hopefully Traditional Ecological Knowledge retains regional awareness of the rarer species. Leatherback records reported by Traditional Ecological Knowledge (Wunambal Gaambera rangers, pers. comm.) concerned transient animals, rather than nesters. Pilbara and Gascoyne nesting loggerheads were followed by satellite telemetry through or ending in the Kimberley region [60], but the surveys had no expectation of finding temperate zone loggerhead nesting at tropical Kimberley latitudes.
Kimberley hawksbill nesting was mentioned in the Maret Islands [19], but distribution and relative abundance remain unclear. Historical accounts of hawksbills on Jones Island derive from trade records of commercial tortoiseshell harvested by Macassan and Indonesian sailors [61]. The records of the tortoiseshell industry were incompletely documented in the early WA fishing licenses [62,63].
Sparse contemporary North Kimberley hawksbill tracks made it difficult to discern if the low number of nesters results from historical harvest depletion, marginal range distribution, or simply numerical rarity and non-ideal survey timing. If historical depletion of turtle numbers was severe, full recovery of a turtle population might take several generations [61]. Surveys in February or October may prove more productive in detecting hawksbill nesting activity in Wunambal Gaambera or Balanggarra Saltwater Country (DBCA, unpublished reports).
The early accounts of explorers [36,37,38], surveyors [63], and settlers [38] reference historical rookeries that contemporary surveys may revisit to compare whether turtle numbers have recovered, simply nest in a different season or remain unexplored. Although unknown to recent scientists, there is Traditional Knowledge to suggest that rookeries may respond to cyclone passages that erode beaches (Ballanggarra elders, pers. comm. 2017).

4.3. Shared Management Interests for Regional Efficiencies

Traditional Ecological Knowledge of turtles is strengthened by essential details of where migratory fauna feed or breed. Trans-boundary sharing of Traditional Ecological Knowledge in Healthy Country Plans is enhanced by new collaborations [47] in genetics and satellite telemetry to expand the knowledge of species with high cultural and conservation values [5,28].
Management plans must balance the spatial and temporal differences of species distributions. Fortunately, the major summer (Eighty Mile Beach, 2012–2020) and winter (Cape Domett, 2015–2020) flatback rookeries are currently monitored as index beaches by two-week track counts in recent Marine Parks jointly involving the local Indigenous Ranger Groups [4]. Nesting surveys for Eighty Mile Beach Marine Park emphasize Wallal Downs for 30–50% of all tracks in a jointly managed Marine Park, as confirmed in repeated aerial surveys [20]. From a management efficiency perspective, it is more reasonable to view Cape Domett as an accessible index option, with 23% of flatback east Kimberley nesting, rather than the 77% spread over multiple distant islands. There is not a current index beach for west Kimberley genetic stocks, although Cable Beach in Broome and Ecobeach south of Broome are plausible logistical choices with the investment of a local conservation group.
Conversely, there is a scenario with the summer green turtle rookery in the Lacepede Islands Nature Reserve, in unprotected waters but declared a Biologically Important Area with a Commonwealth definition of a 20 km buffer for year-round green turtle nesting. With the Lacepede Islands hosting 92% green and 8% flatback nesting [58], there is a question of whether the Commonwealth spatial definition of buffer strips should be defined by the more populous green turtles (20 km for greens) or extend to 60 km for the less common flatbacks. Similar situations involve multiple Kimberley islands, with differently oriented beaches used by winter and summer nesters (Figure 4 and Figure 6), as candidate index sites.
Ground surveys repeated at regular intervals would delineate a nesting season phenology [3,50]. The landscape GIS products support the conservation interests in Kimberley marine turtle stocks by Commonwealth and state Marine Park managers and Indigenous Traditional Owners. The rookery rankings for abundance and density establish a monitoring program with a landscape focus because diffuse counts across a vast coastline accumulate substantial activity counts in a multi-month season. The log scale applied in the GIS layers showed extra abundant or rare nesting hotspots for management focus. The Traditional Owner group boundaries outline a co-management framework [6]. Potential sites for detailed study can be weighted by density counts, logistic accessibility and cultural importance to the Indigenous managers and scientist/conservation joint partnerships. “Working smarter, not harder” philosophies with selected index sites are more conductive to sustainable efforts than census approaches ineffectively archiving every solo track from every single beach.
A ranking of priority rookeries (listed in Supplemental Tables S1 and S2) will guide future survey efforts to follow the widely dispersed Kimberley rookeries and are baselines for future comparisons. The present study confirms that Kimberley nesting evidence was substantial at a global scale and vital for sustaining regional populations [10]. Turtle nesting numbers have interannual fluctuations by nonsynchronous nesting cohorts. Therefore, surveys at index rookeries must ideally integrate trends over more than a decade to account for the inherent demographic or environmental “noise” [50]. The results pinpoint the distribution of Kimberley index beaches if management involves protections against mainland egg predators such as dingoes or feral pigs.
Managers may clarify that high density areas are not necessarily default index sites to monitor given that marine turtle stocks tend to have synchronous regional dynamics within the same species regardless of local density. Consequently, the survey results suggest three efficient monitoring targets for the leading Kimberley rookeries. First the aerial surveys for summer green turtles might select day flights to the Lacepedes Islands from Broome, rather than widely scattered North Kimberley islands reached from Kununurra. Second, for Eighty Mile Beach Marine Park (i.e., Wallal Downs and Anna Plains) future flights might strategically cover the genetically unique flatback stock at Ecobeach during transit from Broome. Lastly, it appears more efficient in the eastern Kimberley to quantify Cape Domett by on-site drone deployment or track counts at the one site than by attempting to cover the 77% of winter nesting spread across multiple offshore islands.
On the local or landscape scale, the management of species with seasonal phenology should consider commonness and rarity (Table 1). The two major flatback rookeries (Cape Domett, winter; Eighty Mile Beach, summer) are mainland Marine Parks currently in co-management with Traditional Owners and Park Rangers involved in ongoing annual monitoring and management. The secondary winter flatback rookeries on the offshore islands (Figure 6) are challenging to reach, even though managers may seek additional vessel resources.
Management decisions balance marine park assets, such as secure population levels of common species, against the logistics and costs of monitoring for a given site. Local, state, national and international criteria are reviewed by the Commonwealth Recovery Plan for Australian Marine Turtles [10] as to whether a low-density site reflects a natural abundance level or an impact that calls for management response.
Rookeries with high track counts but low accessibility remain important to visit periodically, if not annually [54], as complementary partnerships develop with Indigenous and western managers [5]. Low density rookeries near a logistic base may better suit involvement of a community conservation group to provide valuable daily phenology data for seasonal onset and duration, along with a census of seasonal activity. Value added components for a population study can be added by a practical mark–recapture study conducting nocturnal patrols, satellite telemetry, or introduction of remote video systems. Temporary vessel anchorages as bases and bush camping expeditions may serve monitoring needs at remote index sites.

5. Conclusions

Co-Management Depends on Knowledge Sharing

Revisions in the Western Australian Conservation and Land Management Act [64] newly emphasize the cultural importance of customary use of species. Sharing information for the purpose of joint management is crucial for migratory marine megafauna that traverse multiple management jurisdictions. The Kimberley region has substantial diversity in terms of stakeholders, drivers for monitoring, time scales of funding support, and operational scales and capacities. The present ranking of index beaches (top ten lists given in Supplementary Tables S1 and S2, Winter) and related ranger groups (Table 2) offer a strategic menu for conservation actions, including continued monitoring. Besides the mainland flatback rookeries (as separate index beaches for summer and winter), the collective cultural importance of green turtles to Kimberley Indigenous groups logically proposes the Lacepedes or an alternative index site for summer green turtles. Other in-water or rookery index sites may be recommended upon review of detailed genetic results or co-management plans.
A key proposal arising from the 2020 ISWAG forum was the tabling of an Indigenous-led 10-year turtle and dugong management outline for the entire Kimberley region. The plan, funded by Parks Australia and the Department of Biodiversity, Conservation and Attractions (DBCA), has yet to be finalized; however, it sets an ambitious regional framework for integrating traditional and western approaches across all aspects of turtle and dugong management and conservation. It extends decades of foundational work by Indigenous and non-Indigenous marine scientists and managers towards the sustainability of turtle populations in northwest Australia.
The strategic log-log survey scale illustrates how sea turtle conservation programs can do more with their available resources with integrated conservation approaches. The regional scale for a co-management perspective offers an adaptive management approach.

Supplementary Materials

The following are available online at https://www.mdpi.com/article/10.3390/rs13224696/s1, Table S1: Summer aerial surveys, percentage of summer tracks, length of beach, density of tracks km−1; S1–S10 rankings were determined by number of tracks. Table S2: Winter aerial surveys, percentage of winter tracks, length of beach, density of tracks km−1; W1–W10 rankings were determined by number of tracks.

Author Contributions

Conceptualization, A.D.T., K.L.P., S.D.W.; methodology, A.D.T., K.L.P., K.M., G.L. (Graham Loewenthal), C.B., J.D.; validation, A.D.T., S.D.W. and Kimberley Ranger groups; formal analysis, A.D.T., G.L. (Graham Loewenthal), C.B., J.D.; investigation, A.D.T., K.L.P., S.D.W.; resources, A.D.T., K.L.P., S.D.W.; data curation, A.D.T., K.M., G.L. (Graham Loewenthal); writing—original draft preparation, A.D.T., K.L.P., S.D.W.; writing—review and editing, A.D.T., K.M., G.L. (Graham Loewenthal), G.L. (Gina Lincoln), D.M., D.O., S.D.W.; visualization, G.L. (Graham Loewenthal); supervision, A.D.T., S.D.W.; project administration, S.D.W.; funding acquisition, S.D.W. All authors have read and agreed to the published version of the manuscript.

Funding

Project 1.2.2 of the Western Australian Marine Science Institution (WAMSI) within the Kimberley Marine Research Program was supported by investments from Chevron Australia, as environmental offsets and co-investment from the WAMSI Joint Venture partners. This research was financially supported by the Australian Department of Biodiversity, Conservation and Attractions, the North West Shelf Flatback Turtle Conservation Program, and the Kimberley Node of the Kimberley Biological Monitoring Program.

Data Availability Statement

Final data products included a point vector dataset having all track observations and an ESRI geodatabase that related the individual photographs to the mosaics, so that analysis of turtle tracks could be completed from the mosaics. Images (n = 45,000+) and GIS layers were shared to ISWAG ranger groups by portable hard drives and archived at the WAMSI 1.2.2 project in the CSIRO Pawsey Supercomputing Centre and the DBCA Remote Sensing and Spatial Analysis Program for reference and potential uses in other projects.

Acknowledgments

The flight planning involved Rob Ryan of Image Aviation, Leigh Rawlings of Kimberley Air Tours and Mark Dixon of DPAW aerial operations. The GIS products were developed by DBCA Remote Sensing and Spatial with the Managing Coastal Vulnerability Project directed by Ralph Talbot-Smith, with the Western Australian Land Information System. The Kununurra and Broome DBCA offices aided fieldwork, especially in Marine Parks (MP) of North Kimberley MP, Horizontal Falls MP, Lalang-Garram Camden Sound MP, Roebuck Bay MP and Eighty Mile Beach MP. Alan Kendrick, Chris Nutt and Craig Olejnik clarified co-management advice. Tom Vigilante, Sally Hopkins, Peter Bayliss, Thomas Holmes and Sabrina Fossette offered constructive comments. We acknowledge the Traditional Owners of the Land and Sea Country where the research was conducted and pay respects to Elders past, present and emerging. The Kimberley Land Council (KLC) supplied GIS boundary layers and published the Healthy Country Plans. KLC supports Kimberley Aboriginal people to look after their County by resourcing the Land & Sea Unit Managers, Indigenous Protected Area (IPA) Coordinators and the Kimberley Ranger Network. Traditional Owners and Rangers generously shared their knowledge of marine turtles found on their Sea Countries. Field logistics and cultural protocols were guided by the following individuals while on country: (Mirriuwung Gajerrong) Lawrence Carter, Andy Reid, Wayne Winton, Edmund Cohott, Winston Gerrard, (Balanggarra), Clement Maraltadj, James Burchil, Wesley Alberts, Conservation Volunteers Australia and Ben Wemyss at Berkeley River Lodge; (Wunambal Gaambera), Neil Waina, Jeremy Korbin, Robert Warren, Desmond Williams, Edmund Jungine, Jason Adams, Leonora Chainmora, Tom Vigilante, Mangolamara, Karadada, Waina; (Dambimangari) Donny Woolagoodja, Francis Woolagoodja, Janet Oobagooma, Adrian Lane, Rapheal Umbagai, Jermaine Umbagai, Edmund Jungine, (Bardi Jawi) Kevin George, Phillip McCarthy, Azton Howard, Trevor Sampi and Chris Sampi; (Nyul Nyul) Preston Cox, Aaron Cox, Dale Marshall, Mark Rothery, Albert Wiggan; (Jawinyaa) Patrick Rawson; (Yawuru) Glen McFarland, Anne O’Dea and Steve Winderlich for Conservation Volunteers Australia at Cable Beach and Ecobeach; (Karijarri) Jessica Bangu, Jacki Wemyss, Ewan Noakes, Sam Bayley, Rhys Swain, Jacquelene Shovellor, Braedan Taylor, Kamahl Bangu, Frederick Shovellor (Eighty Mile Beach Marine Park)-Craig Williams, Adrian Ferguson, Chloe Rings, Erina Young, Brad Scoble, Leah Pearson, Sarah McCallister; (Nyangumarta) Augustine Badal, Nathan Hunter, Ben Puglisi, Nyaparu Rose, Lynette Wildridge, Charmain Wright; (Ngarla) Stephen Brown, Jeffrey Brown. We thank skippers and crews of all field survey vessels, including the Worndoom, Kimberley Quest, Joonwinyan and Linygurra. DBCA staff aided field efforts in (Broome): Chris Nutt, Daniel Barrow, Adrian Lane, Darren Stevens, Michael Hourn, Brett Francis, Cameron Smith, Luke Puertollano, Anthony Richardson, Chloe Rings, Erina Young, Leah Pearson, Craig Olejnik, Phillip Bainbridge, and Todd Quartermaine (Kensington): Bob Prince, Corrine Douglas, Ryan Douglas, James Gee, Natasha Samuelraj; and (Kununurra): Ben Corey, Jennifer Munro, Luke Edwards, Wayne Winton, David Chemello, Darryl Moncrief. UWA staff and students Blair Bentley, Olly Berry, Nicki Mitchell, Jamie Tedeschi helped at remote Kimberley beaches. WAMSI support was delivered by Kelly Waples, Stuart Field, and Luke Twomey.

Conflicts of Interest

The authors declare no conflict of interest.

References

  1. Whiting, S.; Tucker, T.; Pendoley, K.; Mitchell, N.; Bentley, B.; Berry, O.; FitzSimmons, N. Marine Turtles in the Kimberley: Key Biological Indices Required to Understand and Manage Nesting Turtles along the Kimberley Coast; Western Australia Marine Science Institution: Perth, Australia, 2018; Project 1.2.2 Report; 132p. [Google Scholar]
  2. Waayers, D.; Tucker, T.; Whiting, S.; Groom, R.; Vanderklift, M.; Pillans, R.; Rossendell, J.; Pendoley, K.; Hoenner, X.; Limpus, C.; et al. Satellite tracking of marine turtles in southeastern Indian Ocean: A gap analysis of deployments spanning 1990–2016. Indian Ocean Turt. Newsl. 2019, 29, 23–37. [Google Scholar]
  3. Whiting, A.U.; Thomson, A.; Chaloupka, M.; Limpus, C.J. Seasonality, abundance and breeding biology of one of the largest populations of nesting flatback turtles, Natator depressus: Cape Domett, Western Australia. Aust. J. Zool. 2008, 56, 297–303. [Google Scholar] [CrossRef]
  4. Rings, C. Eighty Mile Beach Marine Park Turtle Monitoring Report, Annual Report 2019–2020; Department of Biodiversity, Conservation and Attractions: Perth, Australia, 2020. [Google Scholar]
  5. Austin, B.J.; Robinson, C.J.; Mathews, D.; Oades, D.; Wiggin, A.; Dobbs, R.J.; Lincoln, G.; Garnett, S.T. An Indigenous-led approach for regional knowledge partnerships in the Kimberley Region of Australia. Hum. Ecol. 2019, 47, 577–588. [Google Scholar] [CrossRef]
  6. Lincoln, G.; Hedge, P. Promoting Partnerships for Sea Country Research and Monitoring in Western Australia: A Snapshot of Indigenous, Science and Management Agency Partners, Version 1; Report to the National Environmental Science Program, Marine Biodiversity Hub; Mosaic Environmental: Broome, Australia, 2019. [Google Scholar]
  7. Castro, A.P.; Neilsan, E. Indigenous people and co-management: Implications for conflict management. Environ. Sci. Policy 2001, 4, 229–239. [Google Scholar] [CrossRef] [Green Version]
  8. Depczynski, M.; Cook, K.; Cure, K.; Davies, H.; Evans-Illidge, L.; Forester, T.; George, K.; Gould, J.; Howard, A.; Oades, D.; et al. Marine monitoring of Australia’s indigenous Sea Country using remote technologies. J. Ocean Technol. 2019, 14, 60–75. [Google Scholar]
  9. Ward-Fear, G.; Pauly, G.B.; Vendetti, J.; Shine, R. Authorship: Protocols should include citizen scientists. Nature 2020, 578, 363. [Google Scholar] [CrossRef] [PubMed] [Green Version]
  10. Commonwealth of Australia. Recovery Plan for Marine Turtles in Australia 2017–2027; Department of the Environment and Energy: Canberra, Australia, 2017; 146p. [Google Scholar]
  11. Australian Government. Marine Bioregional Plan for the North-West Marine Region; Department of Sustainability, Environment, Water, Population and Communities: Canberra, Australia, 2012; 269p.
  12. Environmental Protection and Biodiversity Conservation Act. 1999. Available online: https://www.environment.gov.au/epbc (accessed on 16 November 2020).
  13. Prince, R.I.T. Status of the Western Australian Marine Turtle Populations: The Western Australian Marine Turtle Project 1986–1990. In Proceedings of the Australian Marine Turtle Conservation Workshop, Gold Coast 1990; Russell, J., Ed.; Australian Nature Conservation Agency: Canberra, Australia, 1994; pp. 1–14. [Google Scholar]
  14. IUCN 2010. IUCN Red List of Threatened Species. Version 2010.1. Available online: https://www.iucnredlist.org/ (accessed on 5 November 2020).
  15. Limpus, C.J. Biological Review of Australian Marine Turtles; Environment Protection Agency: Brisbane, Australia, 2009; 334p. [Google Scholar]
  16. FitzSimmons, N.N.; Pittard, S.D.; McIntyre, N.; Jensen, M.P.; Guinea, M.; Hamann, M.; Kennett, R.; Leis, B.; Limpus, C.J.; Limpus, D.J.; et al. Phylogeography, genetic stocks, and conservation implications for an Australian endemic marine turtle. Aquat. Conserv. Mar. Freshw. Ecosyst. 2020, 2020, 440–460. [Google Scholar] [CrossRef]
  17. Department of Environment and Conservation. Status Performance Assessment: Biodiversity Conservation on Western Australian Islands, Phase II; Kimberley Islands; Final Report; Conservation Commission Western Australia: Perth, Australia, 2010; 122p. [Google Scholar]
  18. Waayers, D.A.; Smith, L.M.; Malseed, B.E. Inter-nesting distribution of green Chelonia mydas and flatback turtle Natator depressus at the Lacepede Islands, Western Australia. J. R. Soc. West. Aust. 2011, 94, 59–64. [Google Scholar]
  19. Waayers, D.A. Marine turtles. In Ecological Studies of the Bonaparte Archipelago and Browse Basin; Comrie-Grie, J., Abdo, L.J., Eds.; INPEX Operation, Australia Pty Ltd.: Perth, Australia, 2014; pp. 213–271. [Google Scholar]
  20. Pendoley Environmental. Eighty Mile Beach Marine Park Marine Turtle Aerial Surveys 2012, 2014, & 2016; Department of Parks and Wildlife Report. Broome, Australia, 2017. Available online: http://www.seaturtle.org/tracking/?project_id=1053 (accessed on 11 October 2021).
  21. Williams, C.; Ferguson, A.; Kay, N. Eighty Mile Beach Marine Park Turtle Monitoring Report, Annual Report 2016–17; Department of Biodiversity, Conservation and Attractions: Perth, Australia, 2017; 27p. [Google Scholar]
  22. Pyke, M.L.; Toussaint, S.; Close, P.G.; Dobbs, R.J.; Davey, I.; George, K.J.; Oades, D.; Sibosado, D.; McCarthy, P.; Tigan, C.; et al. Wetlands need people: A framework for understanding and promoting Australian indigenous wetland management. Ecol. Soc. 2018, 23, 43. [Google Scholar] [CrossRef]
  23. Wedemeyer-Strombel, K.R.; Peterson, M.J.; Sanchez, R.N.; Chavarría, S.; Valle, M.; Altamirano, E.; Gadea, V.; Sowards, S.K.; Tweedie, C.E.; Liles, M.J. Engaging fishers’ ecological knowledge for endangered species conservation: Four advantages to emphasizing voice in participatory action research. Front. Commun. 2019, 4, 30. [Google Scholar] [CrossRef] [Green Version]
  24. Cooke, S.J.; Nguyen, V.M.; Young, N.; Reid, A.J.; Roche, D.G.; Bennett, N.J.; Rytwinski, T.; Bennett, J. Contemporary authorship guidelines fail to recognize diverse contributions in conservation science research. Ecol. Solut. Evid. 2020, 2021, e12060. [Google Scholar] [CrossRef]
  25. Short, A.D. Beaches of the Northern Australian Coast: The Kimberley, Northern Territory, and Cape York; Sydney University Press: Sydney, Australia, 2006. [Google Scholar]
  26. Short, A.D. Beaches of the Western Australian Coast: Eucla to Roebuck Bay; Sydney University Press: Sydney, Australia, 2006. [Google Scholar]
  27. Bentley, B.P.; Kearney, M.R.; Whiting, S.D.; Mitchell, N.J. Microclimate modelling of beach sand temperatures reveals high spatial and temporal variation at sea turtle rookeries. J. Therm. Biol. 2020, 88, 102522. [Google Scholar] [CrossRef] [PubMed]
  28. Kimberley Indigenous Saltwater Advisory Group. Kimberley Indigenous Turtle and Dugong Initiative Planning Workshop; Outcomes Report; Tuna Blue Foundation: Freemantle, Australia, 2019; 39p. [Google Scholar]
  29. Kimberley Land Council. North Kimberley Saltwater Country Plan for Balanggarra, Uungguu, Dambimangari, and Mayala Saltwater Country; Kimberley Land Council: Broome, Australia, 2010; 69p. [Google Scholar]
  30. Wunambal Gaambera Aboriginal Corporation. Wunambal Gaambera Healthy Country Plan—Looking after Wunambal Gaambera Country 2010–2020; Kimberley Land Council: Broome, Australia, 2010; 56p. [Google Scholar]
  31. Balanggarra Aboriginal Corporation. Balanggarra Healthy Country Plan; 2011; Kimberley Land Council: Broome, Australia.
  32. Dambimangari Aboriginal Corporation. Dambimangari Healthy Country Plan 2012–2022; Kimberley Land Council: Broome, Australia, 2012; 55p. [Google Scholar]
  33. Bardi Jawi Niimidiman Aboriginal Corporation. Bardi Jawi Indigenous Protected Area Management Plan 2013–2023; Kimberley Land Council: Broome, Australia, 2013. [Google Scholar]
  34. Karajarri Traditional Lands Association. Karajarri Healthy Country Plan 2013–2023; Palanapayana Tukjana Ngurra-Everybody looking after Country Properly; Kimberley Land Council: Broome, Australia, 2014; 60p. [Google Scholar]
  35. King, P.P. Narrative of a Survey of the Intertropical and Western Coast of Australia Performed Between the Years 1818 and 1822; John Murray: London, UK, 1827. [Google Scholar]
  36. MacKnight, C.C. The Farthest Coast—A Selection of Writing Relating to the History of the Northern Coast of Australia; Melbourne University Press: Carlton, Australia, 1969; 218p. [Google Scholar]
  37. MacKnight, C.C. The Voyage to Marege: Macassan Trepangers in Northern Australia; Melbourne University Press: Carlton, Australia, 1976; 175p. [Google Scholar]
  38. Green, N. Triumphs and Tragedies: Oombulgurri—An Australian Aboriginal Community; Hesperian Press: Victoria Park, Australia, 2011; 212p. [Google Scholar]
  39. Pendoley, K.; Whittock, P.A.; Vitenbergs, A.; Bell, C. Twenty years of turtle tracks: Marine turtle nesting activity at remote locations in the Pilbara, Western Australia. Aust. J. Zool. 2016, 64, 217–226. [Google Scholar] [CrossRef]
  40. Prince, R.I.T. Marine Turtle Conservation: The Links Between Populations in Western Australia and the Northern Australian Region. People and Turtles. In Marine Turtle Conservation and Management in Northern Australia; Kennett, R., Webb, A., Duff, G., Guinea, M., Hill, G., Eds.; Northern Territory University: Darwin, Australia, 1998; pp. 93–99. [Google Scholar]
  41. Prince, R.I.T.; Jensen, M.P.; Oades, O.; Bardi, J.R. Olive ridley turtle presence and nesting records for Western Australia. Mar. Turt. Newsl. 2011, 129, 9–11. [Google Scholar]
  42. Pritchard, P.C.H. Nesting of the leatherback turtle, Dermochelys coriacea, in Pacific Mexico, with a new estimate of the world population status. Copeia 1982, 1982, 741–747. [Google Scholar] [CrossRef]
  43. Crouse, D.T. Loggerhead sea turtle nesting in North Carolina: Applications of an aerial survey. Biol. Conserv. 1984, 9, 143–155. [Google Scholar] [CrossRef]
  44. Shoop, C.R.; Ruckdeschel, C.A.; Thomson, N.B. Sea turtles in the southeast United States: Nesting activity as derived from aerial and ground surveys. Herpetologica 1985, 41, 252–259. [Google Scholar]
  45. Schroeder, B.A.; Murphy, T. Population surveys (ground and aerial) on nesting beaches. In Research and Management Techniques for the Conservation of Sea Turtles; Eckert, K.L., Bjorndal, K.A., Abreu-Grobois, F.A., Donnelly, M., Eds.; IUCN/SSC Marine Turtle Specialist Group: Washington, DC, USA, 1999; Publication No. 4; pp. 1–11. [Google Scholar]
  46. Berkes, F. The Context of Traditional Ecological Knowledge (Indigenous Knowledge). In Encyclopedia of Biodiversity, 2nd ed.; Levin, S.A., Ed.; Elsevier: Amsterdam, The Netherlands, 2013; pp. 380–388. [Google Scholar]
  47. Department of Biodiversity, Conservation and Attractions. North West Shelf Flatback Turtle Conservation Program Turtle Monitoring Field Guide, 2nd ed.; Department of Biodiversity, Conservation and Attractions: Perth, Australia, 2018; 66p. [Google Scholar]
  48. Western Australia Marine Science Institution. WAMSI Project 1.5 Kimberley Indigenous Saltwater Science Project: Project Summary; WAMSI: Crawley, WA, USA, 2017; Available online: https://wamsi.org.au/project/kimberley-indigenous-saltwater-science-kissp/ (accessed on 28 October 2019).
  49. Kimberley Land Council. Ranger/IPA Map. 2019. Available online: https://www.klc.org.au/ranger-ipa-map (accessed on 12 April 2019).
  50. SWOT Scientific Advisory Board. The State of the World’s Sea Turtles (SWOT) Minimum Data Standards for Nesting Beach Monitoring; Version 1.0 Handbook; Oceanic Society, Ross: Dublin, CA, USA, 2011; 28p. [Google Scholar]
  51. Rees, A.F.; Avens, L.; Ballorain, K.; Bevan, E.; Broderick, A.C.; Carthy, R.R.; Christianen, M.J.A.; Duclos, G.; Heithaus, M.R.; Johnston, D.W.; et al. The potential of unmanned aerial systems for sea turtle research and conservation: A review and future directions. Endanger. Species Res. 2018, 35, 81–100. [Google Scholar] [CrossRef] [Green Version]
  52. Casale, P.; Ceriani, S.A. Satellite surveys: A novel approach for assessing sea turtle nesting activity and distribution. Mar. Biol. 2019, 166, 47. [Google Scholar] [CrossRef]
  53. Bevan, E.; Whiting, S.; Tucker, T.; Guinea, M.; Raith, A.; Douglas, R. Measuring behavioural responses of sea turtle, saltwater crocodiles, and crested terns to drone disturbance to define ethical operating thresholds. PLoS ONE 2018, 13, e0194460. [Google Scholar] [CrossRef] [PubMed]
  54. Whiting, A.U.; Chaloupka, M.; Pilcher, N.J.; Basintal, P.; Limpus, C.J. Sampling nesting sea turtles: Optimizing survey design to minimize error. Mar. Ecol. Prog. Ser. 2021, 674, 257–270. [Google Scholar] [CrossRef]
  55. Limpus, C.J. Western Australian Marine Turtle Review: A Study Commissioned by the Western Australian Department of Conservation and Land Management; Department of Conservation and Land Management: Perth, Australia, 2002. [Google Scholar]
  56. RPS Environment Pty Ltd. INPEX Environmental Impact Assessment Studies: Technical Appendix—Marine Turtle Studies Report No. M06605; INPEX Browse, Ltd.: Perth, Australia, 2008. [Google Scholar]
  57. RPS Environment and Planning Pty Ltd. Woodside Browse Turtle Technical Report: Ecology of Marine Turtles of the Dampier Peninsula and the Lacepede Island Group 2009–2010; Woodside Browse PTY, Ltd.: Perth, Australia, 2010. [Google Scholar]
  58. Schäuble, C.; Kennett, R.; Winderlich, S. Flatback turtle (Natator depressus) nesting at Field Island, Kakadu National Park, Northern Territory, Australia 1990–2001. Chelonian Conserv. Biol. 2006, 5, 188–194. [Google Scholar] [CrossRef]
  59. Whiting, S.D.; Long, J.L.; Hadden, K.M.; Lauder, A.D.K.; Koch, A.U. Insights into size, seasonality and biology of a nesting population of the olive ridley turtle in northern Australia. Wildl. Res. 2007, 34, 200–210. [Google Scholar] [CrossRef]
  60. Mau, R.; Halkyard, B.; Smallwood, C.; Downs, J. Critical habitats and migratory routes of tagged loggerhead turtles (Caretta caretta) after nesting at Ningaloo Reef, Western Australia. In Proceedings of the First Western Australian Marine Turtle Symposium, Perth, Australia, 28–29 August 2012; p. 14. [Google Scholar]
  61. Halkyard, B. Exploiting green and hawksbill turtles in Western Australia. A Case Study of the Commercial Marine Turtle Fishery, 1869–1973; Asia Research Centre HMAP Working Paper No. 160. 2009, pp. 1–42. Available online: http://seaturtle.org/library/HalkyardB_2009_ExploitingGreenandHawksbillTurtlesi.pdf (accessed on 11 October 2021).
  62. Aldrich, F. The Fishery Resources of Western Australia; Fisheries Department, Western Australia: Perth, Australia, 1934. [Google Scholar]
  63. Stacey, N. Boats to Burn: Bajo Fishing Activity in the Australian Fishing Zone; Australian National University E Press: Canberra, Australia, 2007. [Google Scholar]
  64. Conservation and Land Management Act. 1984. Available online: https://www.legislation.wa.gov.au/legislation/statutes.nsf/law_a170_currencies.html (accessed on 1 January 2019).
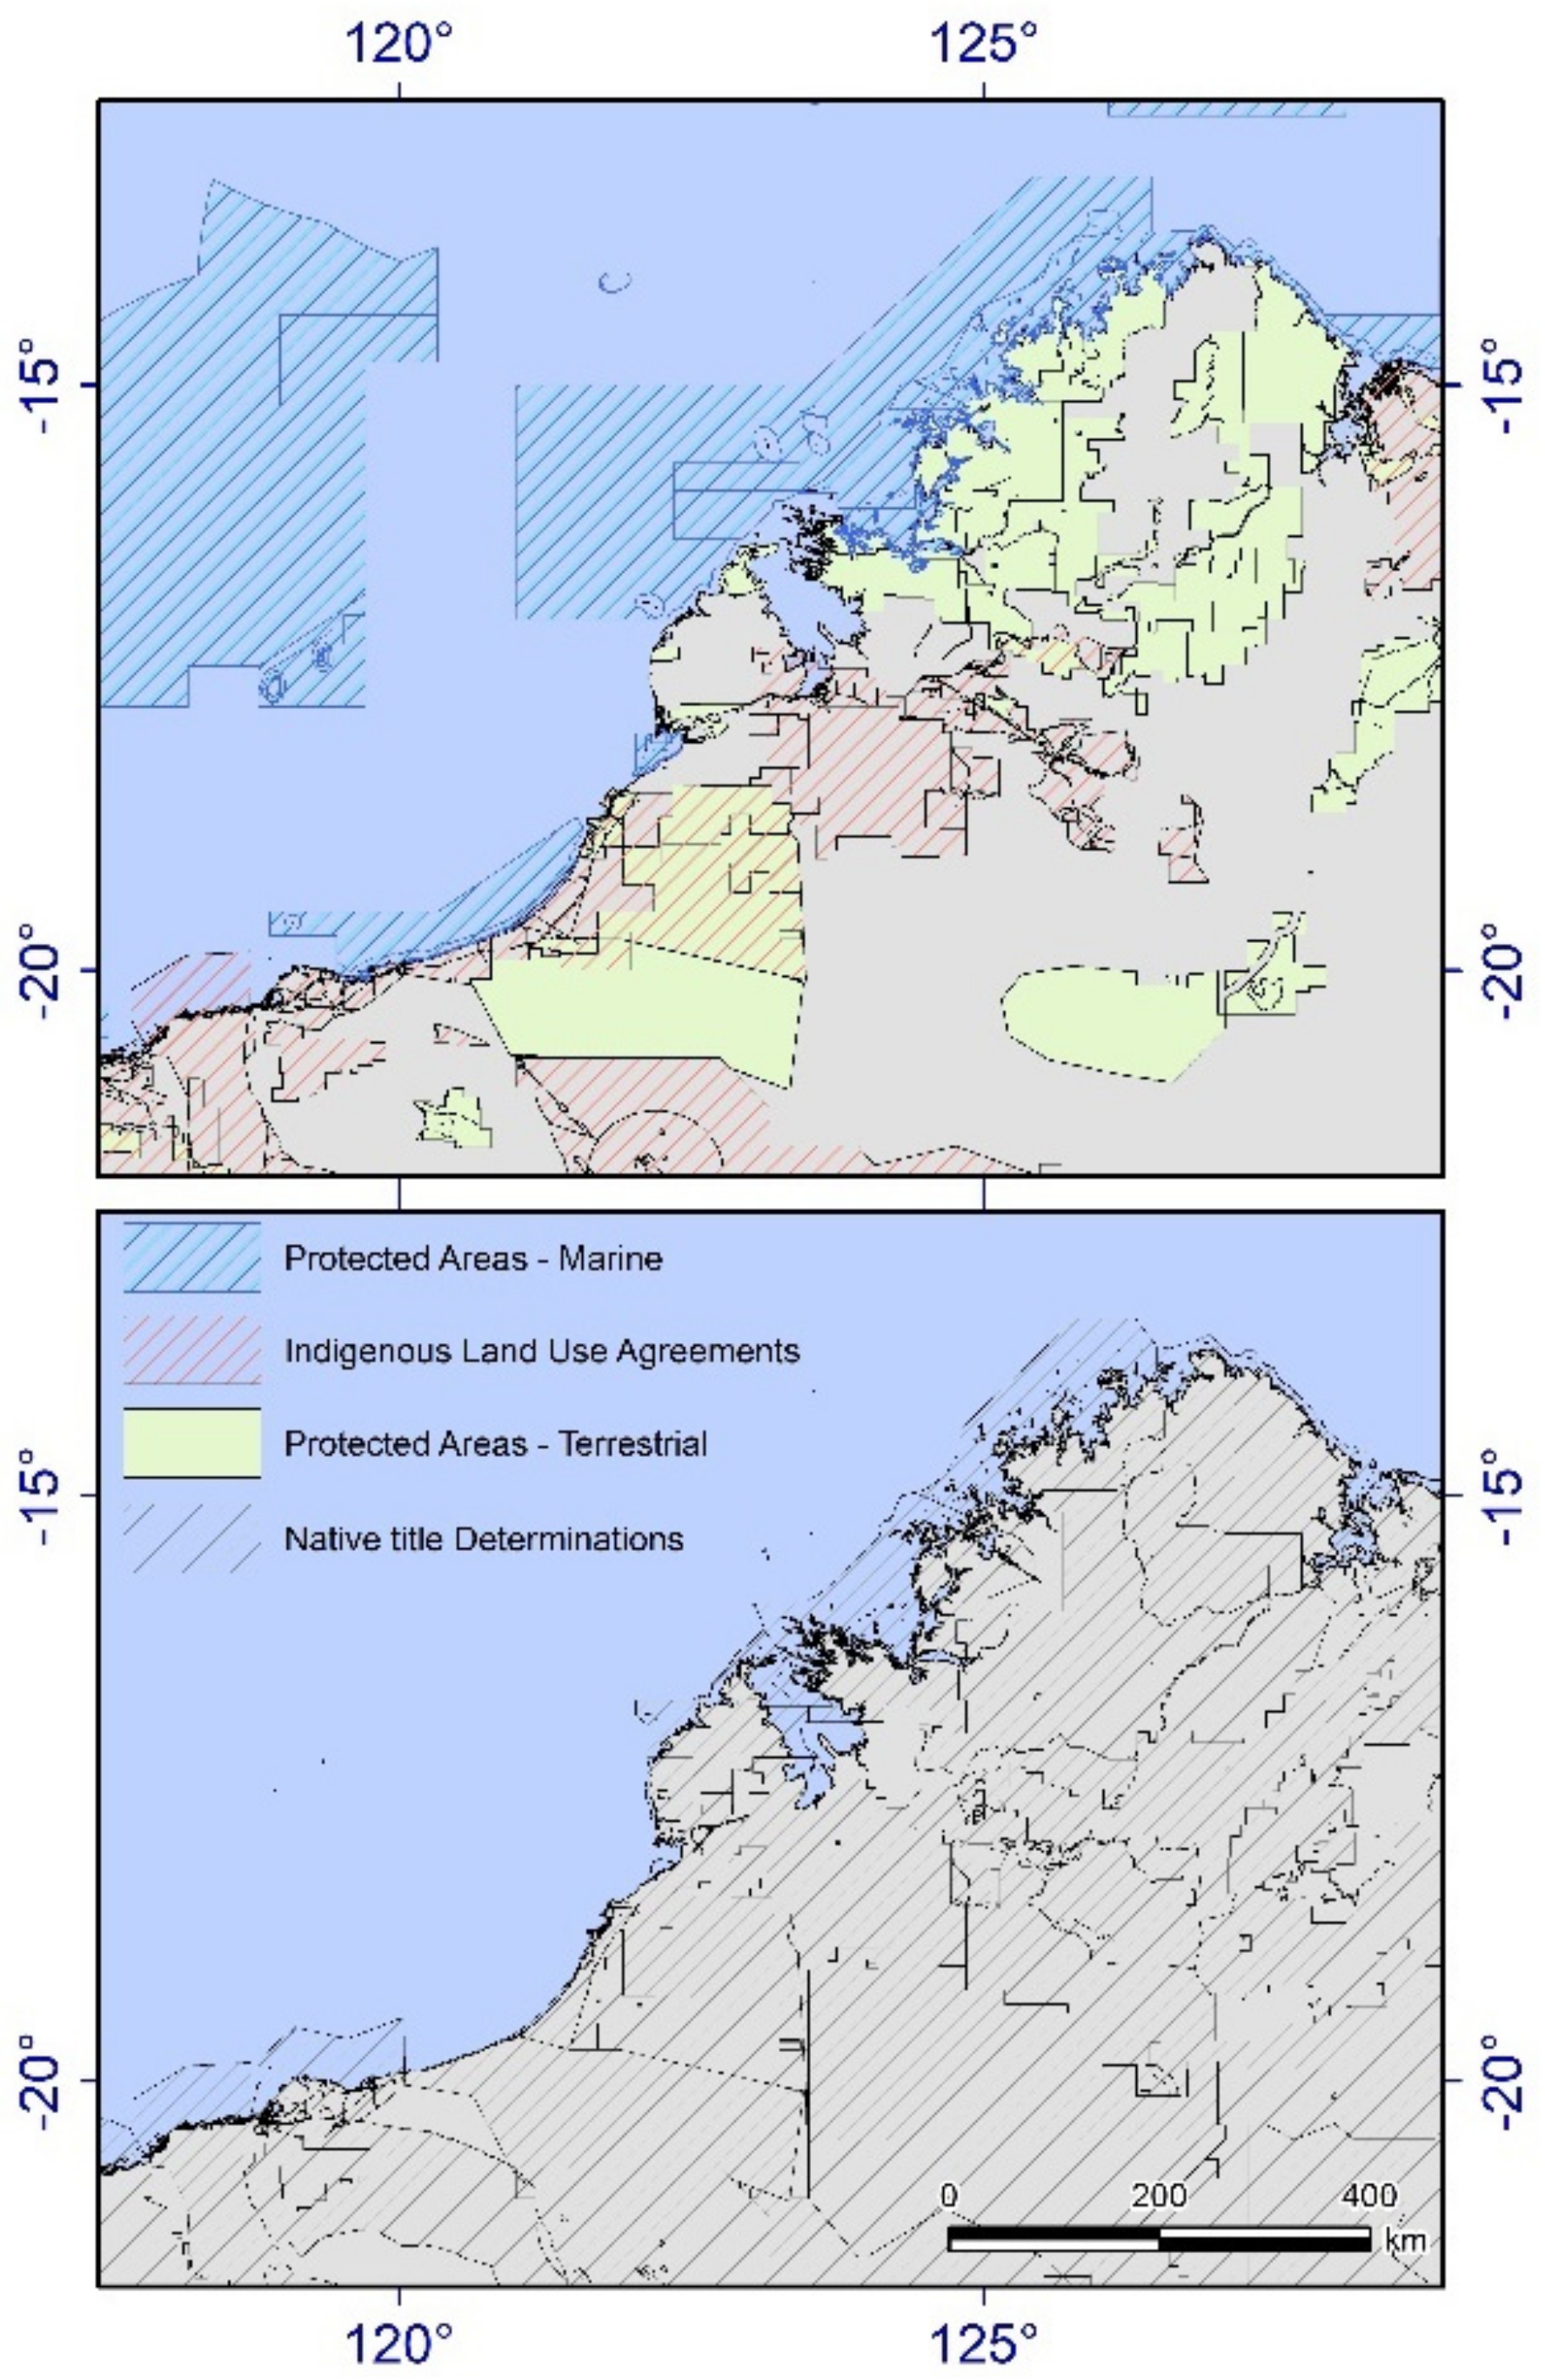
Figure 1. The Land and Sea Domains of North-Western Australia are delineated by colored overlays illustrating Kimberley Bioregion Marine Protected Areas (blue cross hatched areas), Indigenous Land Use Agreements (red cross hatched areas), Terrestrial Protected Areas (green shaded areas), and Native Title Determinations (black cross hatched areas). The overlays illustrate that Kimberley marine turtle rookeries are largely occupied, owned, or co-managed by First Nations people.
Remotesensing 13 04696 g001
Figure 2. The field methods combined aerial surveys and ground verifications. (A) Aerial images of tracks on beaches were photographed for later interpretation of species ID, behavior (approach and departure tracks are illustrated by arrows) and potential nests (indicated by circled areas of turtle-excavated sand). Image: Pendoley Environmental. (B) Ground perspective of Dambimangari and DBCA rangers verifying green turtle tracks by measured width, paired flipper gait and characteristic center tail drag marks while consulting a hand-held CyberTracker digital reference. Image: DBCA.
Remotesensing 13 04696 g002
Figure 3. Scatterplots of winter and summer track counts and density on log–log scale axes. The high-density rookeries (Cape Domett, Lacepedes and Eighty Mile) were reported separately to avoid numeric biases in pooled statistical analyses.
Remotesensing 13 04696 g003
Figure 4. Seasonal contrasts of winter (hatched bars) vs. summer (black bars) for (A) track count, (B) beach length, and (C) track density. The outlier rookeries (Cape Domett, Lacepedes, and Eighty Mile Beach) are omitted for Cape Domett, Lacepedes, and Eighty Mile Beach.
Remotesensing 13 04696 g004
Figure 5. (A) Summer and (B) winter contrasts in Kimberley marine turtle track distributions. The track counts and seasonal percentage values are listed in the Supplemental Tables S1 and S2). Track counts are given as green symbols for <10 tracks, yellow symbols for 10 to 100 tracks, and red symbols for >100 tracks.
Remotesensing 13 04696 g005
Figure 6. Major marine turtle rookeries are shown in proximity to Kimberley airstrips of North-western Australia. Abbreviations from Supplemental Tables S1 and S2 are S1–S10 = top ten summer rookeries: W1–W10 = top ten winter rookeries. The overlapping location symbols are shown with lines drawn to a closest label. Note that inset maps are at a different scale to illustrate distributions of rarer species; O = olive ridley, H = hawksbill.
Remotesensing 13 04696 g006
Table 1. Management overviews of seasonal primary turtle activities documented by Kimberley aerial survey tallies.
Seasonal Unit and Primary RookeryBeachesActivitiesKm HabitatsActivity Averages km−1
Summer island green turtles (Lacepede Islands)52 I578445.784126.3
Summer mainland flatback turtles (Eighty Mile Beach)37 4953279.63617.7
Winter island flatback turtles (North Kimberley)102 393260.21465.3
Winter mainland flatback turtles (Cape Domett)63 298927.024110.6
Table 2. Management recommendations for future investigations, with suggested months, minimum survey duration and species focus. The Findings abbreviations are for hatchlings or nesting tracks and crawl diagnostics discovered while working in Country. Abbreviations FB: flatback, GN: green, HB: hawksbill, OR: olive ridley.
Traditional Owner GroupSuggested
Months
Min Survey Days a Year Findings FB, GN, HB, OR
Miriuwung
Gadgerrong
7–8 14FB
Ballanggara7–8, 1014FB, GN, HB
Wunabaal Gaambera3–4, 7–8, 1014FB, GN, HB
Dambimangari7–814FB:GN:OR
Mayala7–84FB
Bardi Jawi127–14GN, OR
Nyul Nyul11–127–14GN, FB
Yawuru1114FB, GN
Karajarri1114FB
Nyangumarta1114FB
Ngarla1114FB
Publisher’s Note: MDPI stays neutral with regard to jurisdictional claims in published maps and institutional affiliations.