Article

Fractal Characteristic Analysis of Urban Land-Cover Spatial Patterns with Spatiotemporal Remote Sensing Images in Shenzhen City (1988–2015)

1
School of Computer Science, China University of Geosciences, Wuhan 430074, China
2
Hubei Key Laboratory of Intelligent Geo-Information Processing, China University of Geosciences, Wuhan 430074, China
*
Author to whom correspondence should be addressed.
Remote Sens. 2021, 13(22), 4640; https://doi.org/10.3390/rs13224640
Submission received: 19 October 2021 / Revised: 13 November 2021 / Accepted: 15 November 2021 / Published: 18 November 2021

Abstract

:
Understanding the urban land-cover spatial patterns is of particular significance for sustainable development planning. Due to the nonlinear characteristics related to the spatial pattern for land cover, it is essential to provide a new analysis method to analyze them across remote sensing imagery. This paper is devoted to exploring the fractals and fractal dimension properties of land-cover spatial patterns in Shenzhen city, China. Land-cover information was extracted using a supervised classification method with ArcGIS technology from cloud-free Landsat TM/ETM+/OLI imagery, covering 1988–2015. The box-counting method and the least squares regression method are combined to estimate fractal dimensions of the land-cover spatial pattern. The information entropy was used to verify our fractal dimension results. The results show the fractal dimension changes for each land cover type from 1988 to 2015: (1) the land-cover spatial form of Shenzhen city has a clear fractal structure, but fractal dimension values vary in different land cover types; (2) the fractal dimension of build-up land increases and reaches a stable value, while grassland and cultivated land decrease; The fractal structure of grassland and bare land showed a bifractals trend increasing year by year; (3) the information entropy dimension growth is approaching its maximum capacity before 2011. We integrated the information entropy index and fractal dimension to analyze the complexity in land-cover spatial evolution from space-filling, space balance, and space complexity. It can be concluded that driven by policies, the land-cover spatial form in Shenzhen experienced a process from a hierarchical spatial structure with a low evolution intensity to a higher evolution intensity with multiscale differential development. The fractal dimension has been becoming better through self-organization, and its land resources are reaching the growth limits.

Graphical Abstract

1. Introduction

With the urbanization acceleration and the rapid growth of urban space, changes in the urban spatial structure occur every day. The contradiction between the functional organization of urban interior space and the uneven use of urban land is becoming increasingly severe, affecting the sustained and healthy development of the urban economy and society [1,2]. To mitigate the urban development contradictions and support the sustained development of urban space, it is vital first to understand the current functional organization of urban interior spaces [3]. Urban spatial structure refers to the urban spatial organization of urban elements and the interaction mechanism of these elements [4]. The fractal dimension represents the urban land’s morphological characteristics and represents an optimal structure to optimize space [5]. Different fractal dimension values indicate different spatial structure features. This paper is devoted to studying the relationship between urban land-cover structure changes and policies. Urban complexity illustrates that although cities are composed of similar basic elements, such as population, land, and buildings, there are great diversities across cities [6,7]. As land is the carrier of urban development, urban evolutionary patterns reflect the expansion of cities [8,9,10], and the study of urban land-cover structure can better reveal the situation of urban spatial structure. Therefore, this paper will focus on the evolution of land-cover spatial structure to develop insight into urbanization.
Urban spatial structure can be considered the external manifestation of the spatial structure formed by various spatial activities under different factors. As urban spatial pattern changes, a set of indicators, including population, infrastructure, and economy, also change [11,12,13]. The resulting scale law can interpret the inherent laws of the urban structure change. The urban land-cover distribution patterns are uneven and complex, making it hard to grasp the spatial organization of urban patterns [14]. If the urban spatial structure is too simple, it becomes over-planned or under-structured and may fail to evolve successfully or even cease to functioning [15]. Therefore, research on the land-cover spatial structure can provide constructive guidelines for urban planning.
Researchers currently study the urban spatial complexity mainly based on dynamic models and geometric morphology methods [16]. Some scholars used the cellular automaton (CA) model to study urban spatial organization. Wang et al. [17] proposed a cellular automaton to research urban land-use patterns, in which cell states represent land uses, and transition rules express the transformation probability. A patch-logistic-CA model was later developed to consider the spatial evolution of land-use patches to achieve urban growth, and this achieved better performance for Hangzhou [18]. Moreover, a simulation model of different urban growth patterns, called simulation model of different urban growth patterns (SMDUGP) [19] was proposed to explain the reasons and processes of urban expansion. This better simulated infilling, edge expansion, outlying growth patterns, and the actual urban development model structure. Existing methods have made some progress in the urban expansion and changes, they have not focused on the changes in the morphological characteristics of each land-cover spatial structure.
Other researchers analyze the urban interior space based on geometric morphology [20]. They mainly focus on urban individuals, including the study of urban form, structure, growth, transportation, and evolutionary mechanisms [7,21]. The fractal method can effectively provide multiscale characteristics of spatial patterns closely related to the urban spatial structure study by analogy with fractal structures [22,23,24]. Irwin et al. [25] discussed the evolution of urban sprawl in terms of spatial heterogeneity and land fragmentation. Fractal geometry is an effective tool for scale-free geometric measurement, which has been an effective tool for revealing urban complexity in geography [26]. The fractals are most commonly seen as figures with perfect symmetry and strict self-similarity, which is only one type of fractal, monofractal [27]. From the perspective of fractal growth, the growth probability of monofractal at different positions is equal, and the growth in an anisotropic way [28,29]. Similar to the regular monofractal, there exist other random fractals with bifractals, which show different multiscale processes at different growth direction [30]. Nie et al. [31] used fractal theory to study the complexity of the spatiotemporal changes of the impervious area. Chen et al. [23] considered the city a multifractal system and used the local and global parameters in the multifractal to analyze urban development changes. Moreover, they also analyzed the urban form, structure, urban network, land use, and method research methods [32].
To sum up, existing methods have made some progress in the study of urban expansion and changes in urban structure. However, they have not researched the relationship between the land-cover spatial structure and urban development. Moreover, no long-term sequence was adopted to study the structure of urban land-cover types in detail. Urban spatial organization has characteristics of discontinuity and even jumping in space-time. The evolutionary processes are thus a result of natural, social, economic, and various sudden factors [31]. Therefore, it has been impossible to characterize the rapid development process and the complex characteristics of urban land-cover evolution in a short and limited period [10]. Based on the work by Cheng et al. [33], we want to investigate the evolution features in urban land-cover spatial structure, especially fast-developing cities in China. However, the case study and some specific possible reasons for this phenomenon were seldom related.
Fractal geometry has irreplaceable potential in studying the irregular geometric due to free-scale patterns in the urban internal structure and city size distributions [5]. Therefore, this study uses fractal parameters instead of the conventional measures. The box-counting method has become a method widely applied by many researchers; Batty and Longley [21]; Benguigui et al. [27]; Chen and Wang [34]; To effectively analyze the change in the morphological characteristics, this study will be based on a fractal theory using a long-term sequence, in which the difference in the fractal dimension represents a change in scale, and the fractal can thus reveal the characteristics of the urban structure.
Shenzhen city in southern China is the first special economic zone opened to the outside world during reform and opening up. In the past three decades, it has undergone significant changes between the urban spatial pattern and urban functions in Shenzhen [35]. During this period, the national government has offered a series of effective policies to alleviate urban development problems, such as the urban construction relocation, the delineation of urban ecological control lines, and the definition of urban development boundaries [36]. All policies are aimed at optimizing the urban structure [37,38]. Taking Shenzhen as an example of southern coastal cities in China, we can discuss the changes in fractal characteristics of fast-developing cities. Therefore, this study is devoted to exploring the fractal dimension growth curves of various land cover in Shenzhen city and attempts to further analysis the reasons. We first adopted a supervised classification method to classify the land cover from multi-source remote sensing data covering 1988–2015. Then, we calculated the fractal dimension of different land cover by the box-counting method and least squares regression. Finally, we integrated the information entropy index, fractal dimension, and policies to analysis the complexity in land-cover spatial evolution from space-filling, space balance, and space complexity. Through this study, we can not only reveal the changes in land-cover spatial structure in Shenzhen but also reflect the fractal method can well explain the changes in urban land-cover structure driven by urban policies. The research results will benefit from optimizing the urban spatial structure and improving the competitiveness of urban ecological system.
The remainder of this paper is structured as follows. In the next section, an overview of the research region, data source information, and data processing method are detailed. We describe the fractal dimension measurement method in Section 3. In Section 4, we analyze and discuss the results of urban spatial structure evolution, followed by discussion and conclusion and in Section 5 and Section 6.

2. Materials and Methods
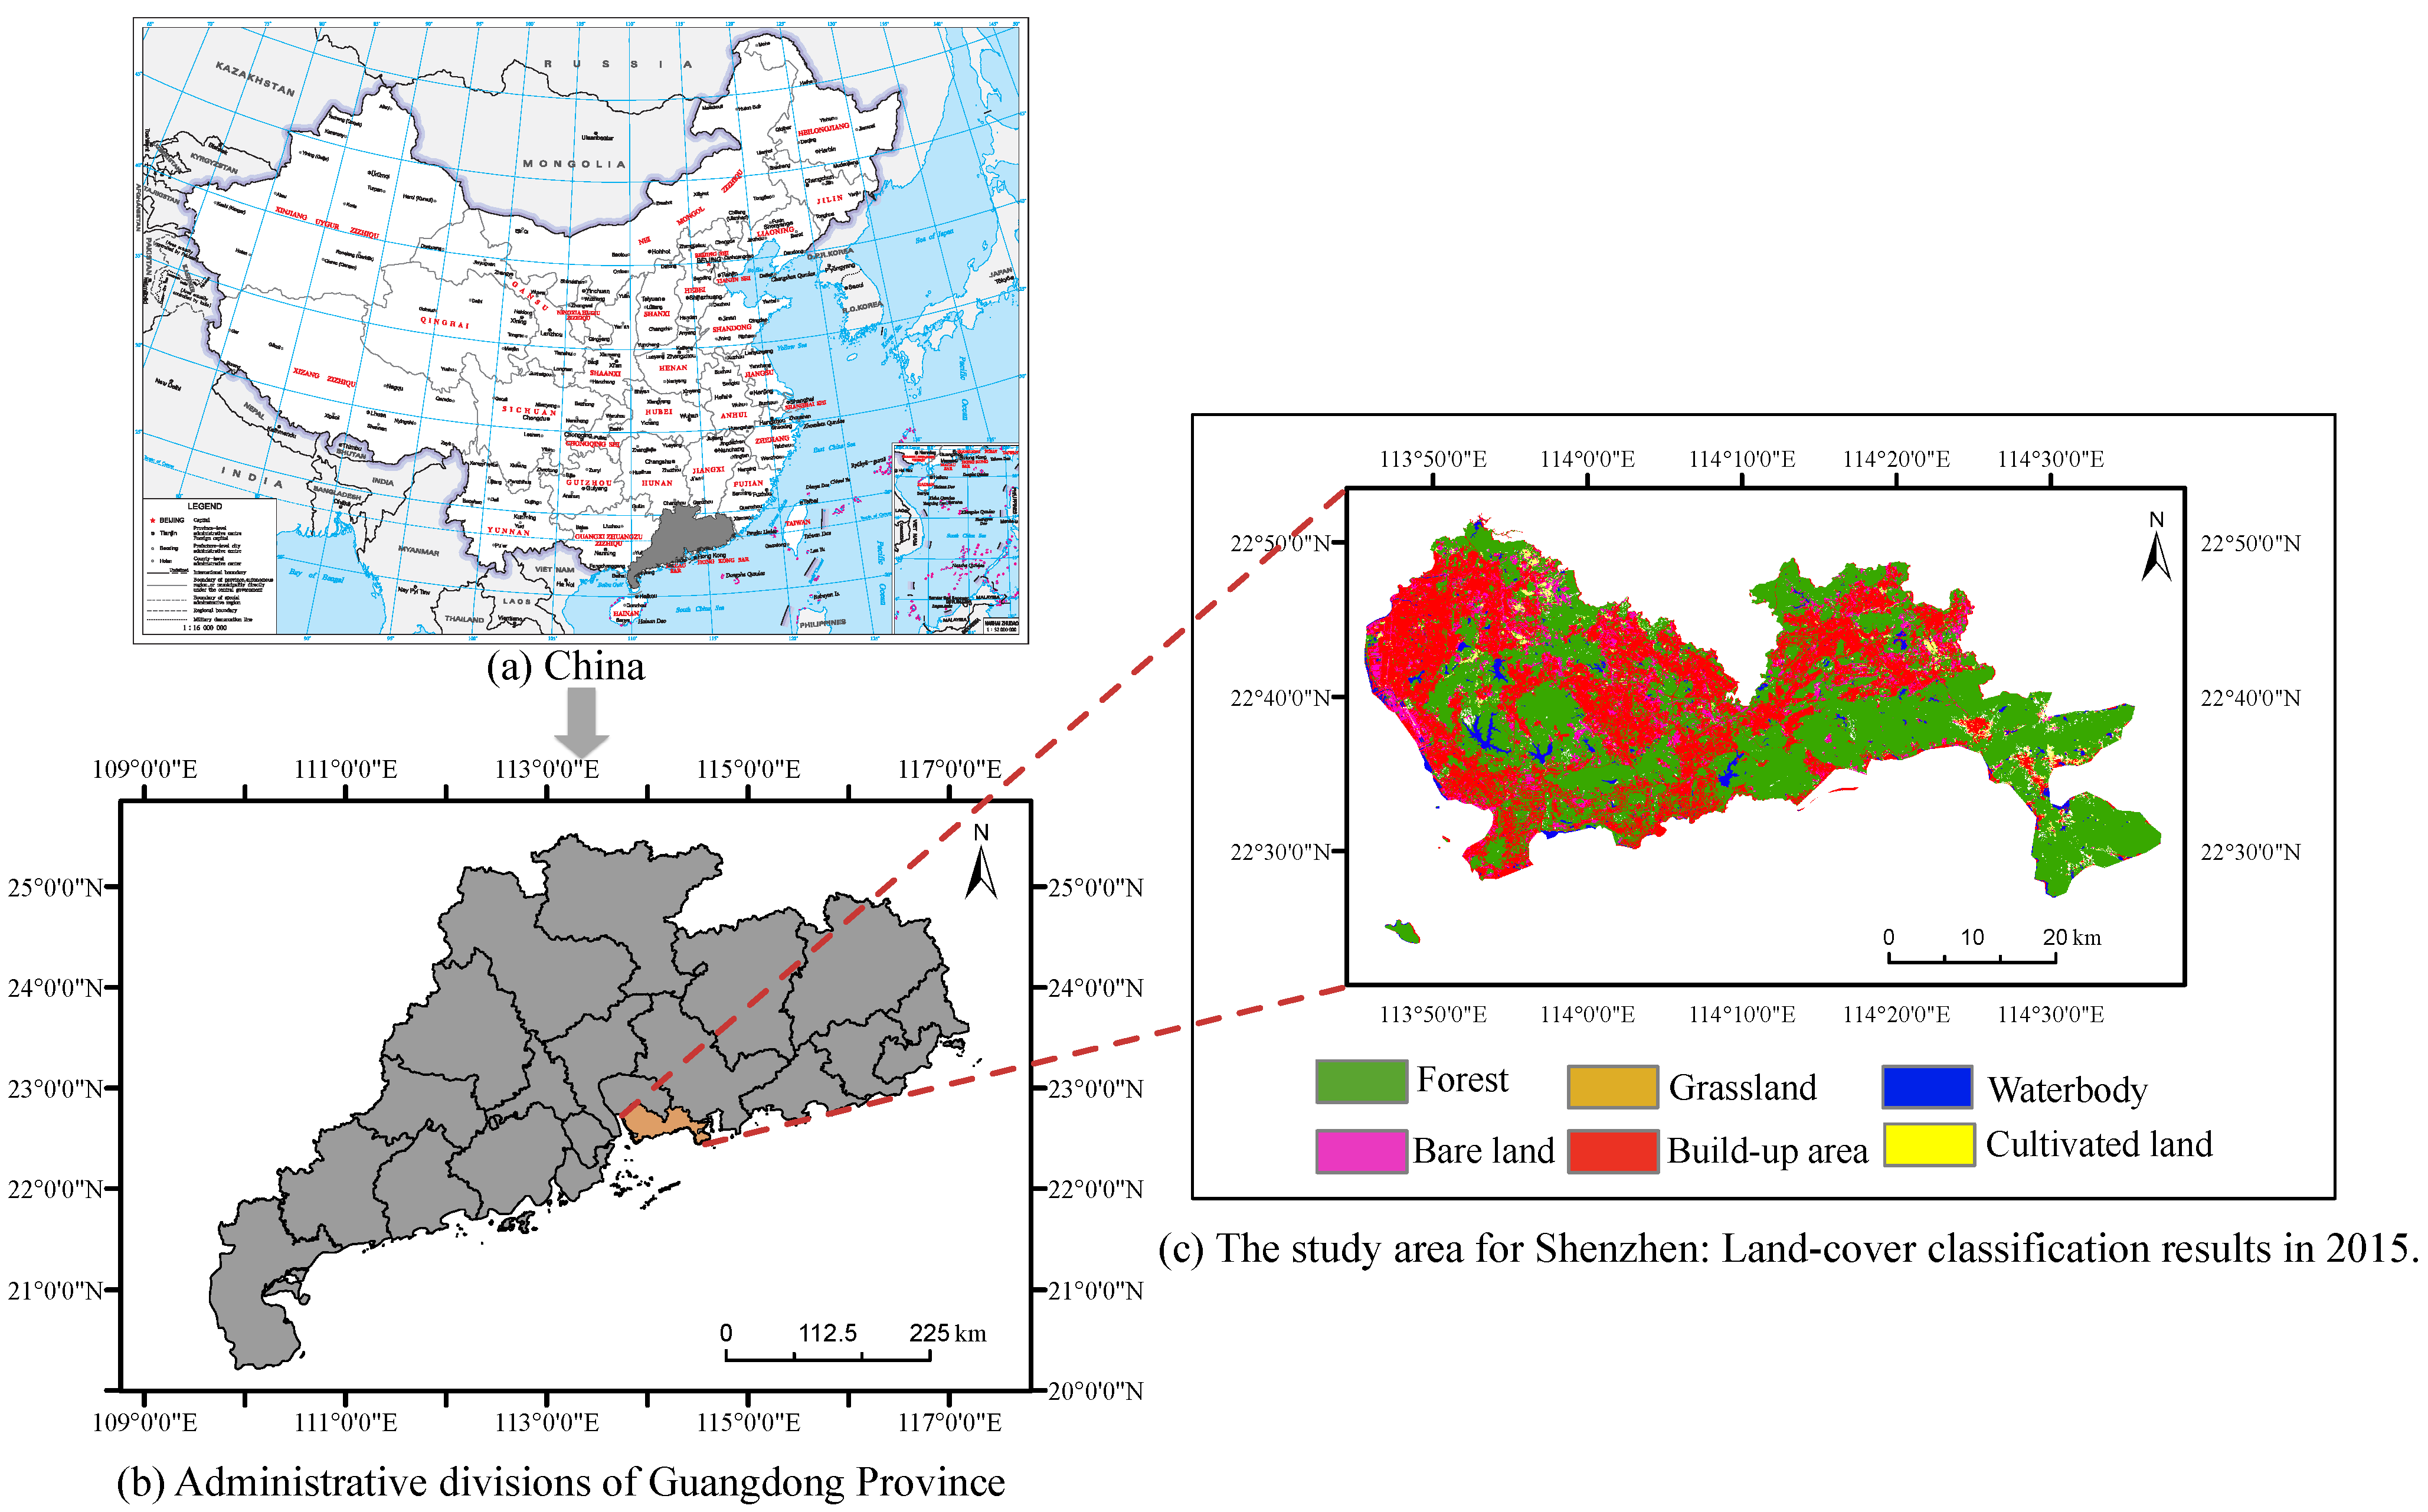
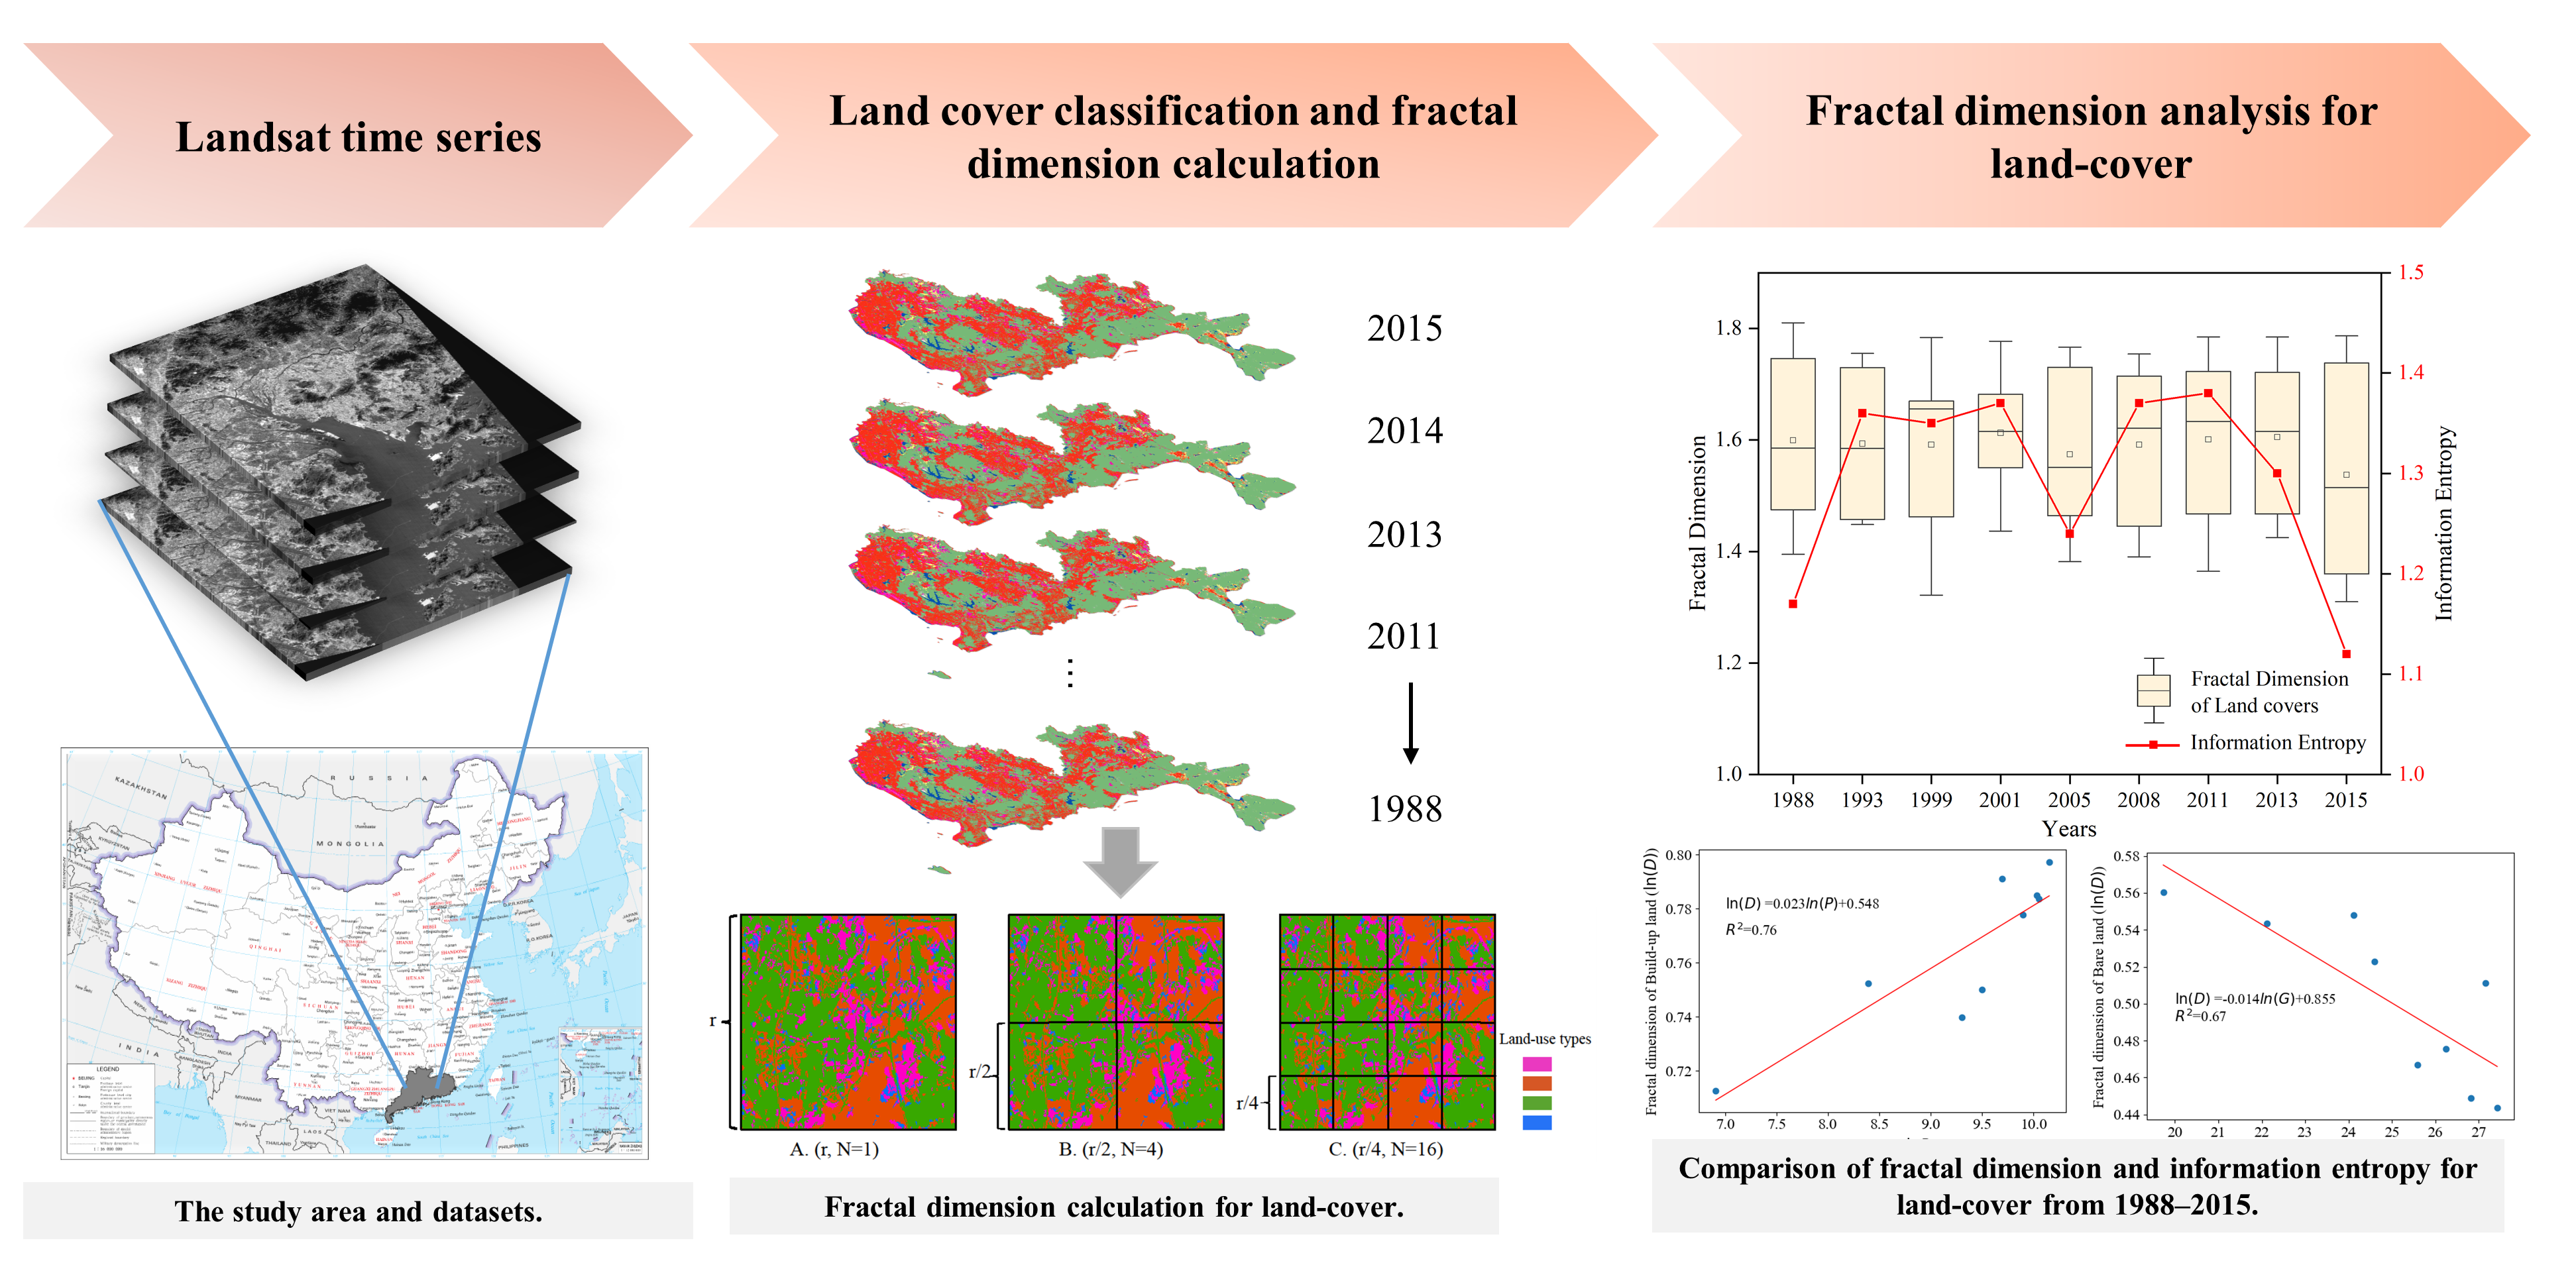
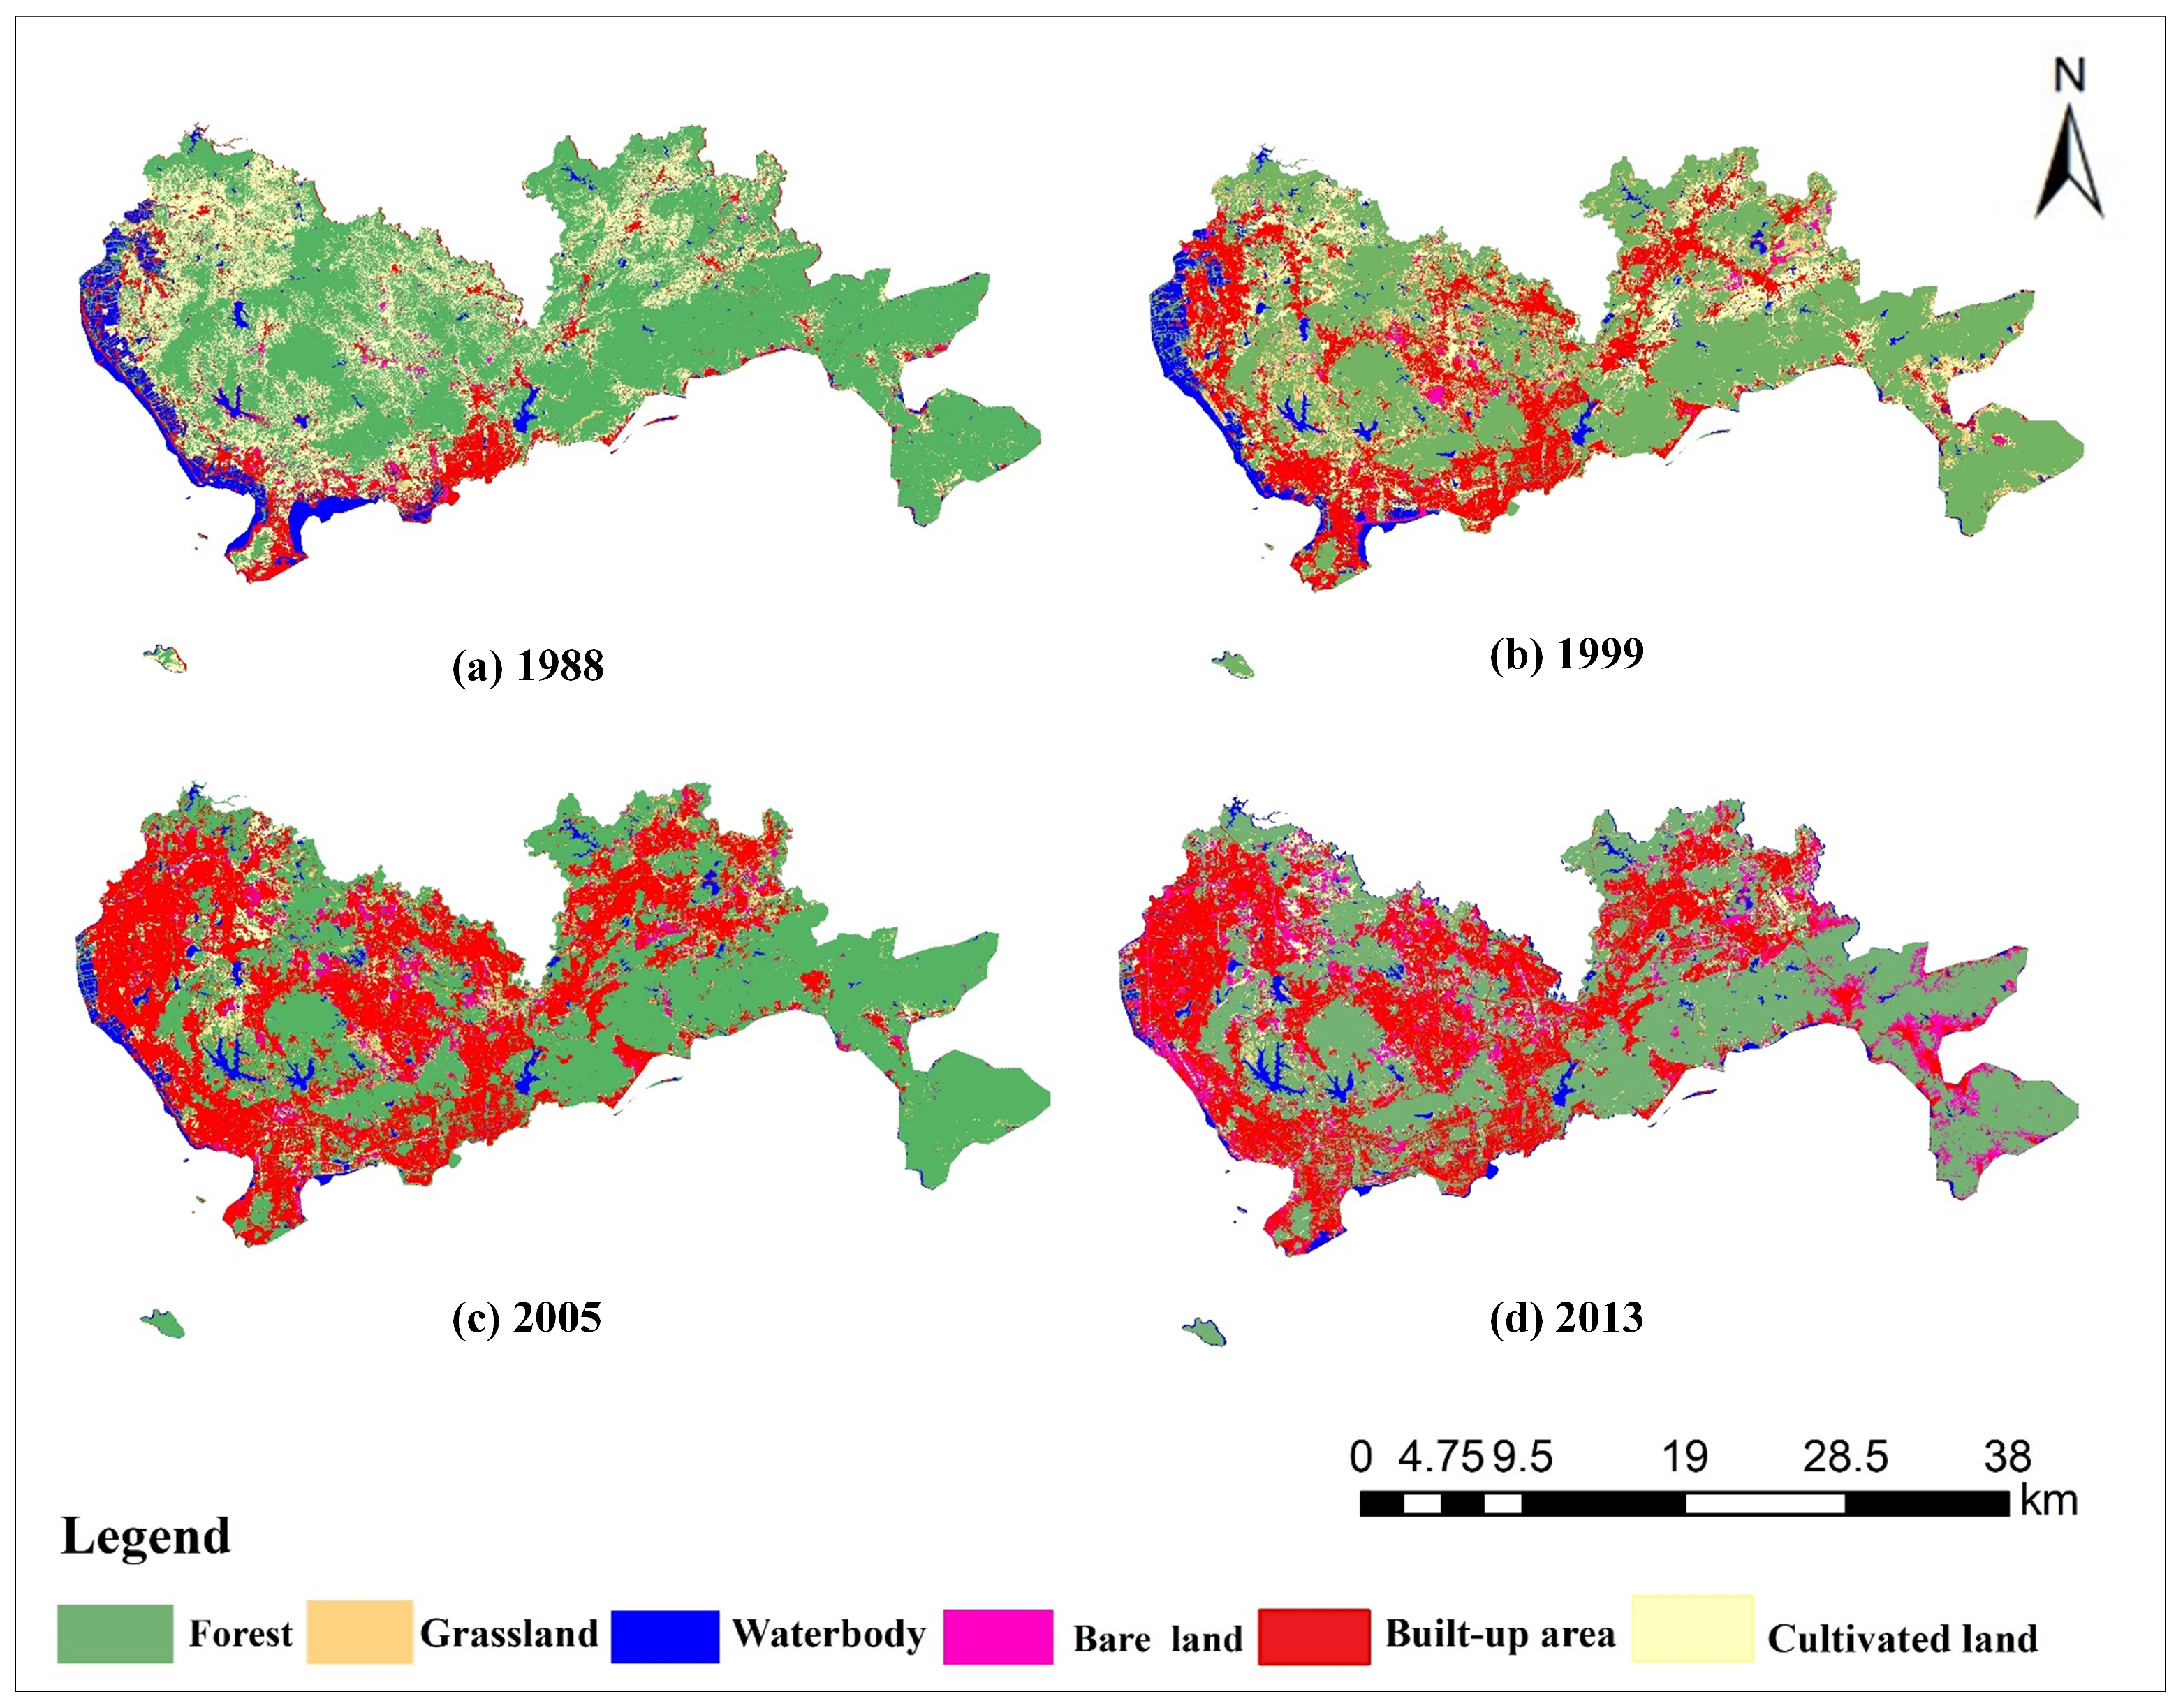
2.1. Study Area

Shenzhen, a coastal city located at the southern edge of Guangdong Province, South of China, is adjacent to Hong Kong, shown in Figure 1a,b. It covers an area of 1997.47 km2 with a total resident population of 11.3787 million in 2015. Shenzhen is located at a lower latitude, south of the Tropic of Cancer (113 ° 43 E to 114 ° 38 E, 22 ° 24 N to 22 ° 52 N). The landforms in Shenzhen are mainly low mountains, flat platform, and terraced hills. It has a subtropical marine climate with a mean annual temperature of 22.4 . Activate as Chinese first fully urbanized city and one of the most economically efficient cities in China, Shenzhen has witnessed rapid land expansion and urbanization in the past 30 years. The geographic location of Shenzhen is shown in Figure 1. Land-cover classification results in 2015 for Shenzhen is shown in Figure 1c, including forest, grassland, waterbody, bare land, build-up land, and cultivated land.

2.2. Data and Processing

Cloudless (cloud coverage less than 10%) Landsat 5 TM, Landsat 7 ETM+, and Landsat 8 OLI images (see Table 1) with a spatial resolution of 30 m were used for analyzing the land-cover spatial patterns in Shenzhen. The Landsat remote sensing data can be downloaded free from the US Geological Survey (USGS) website (https://earthexplorer.usgs.gov, accessed on 10 May 2015). Significantly, the data products are all subjected to radiation correction, atmospheric correction, and geometric precision correction.
This paper used the decision tree supervised classification tool in ENVI (Version 5.3) software to classify land cover from multi-source remote sensing images. The land-cover classification results are used for fractal dimension calculation in Section 3. Here, we roughly divided land-cover types into six classes: forest land, grassland, cultivated land, build-up land, bare land, and waterbody. The data process can be divided into three steps. First, we applied visual interpretation methods to label the training data according to the Google Earth high-resolution images. Google Earth provided high-resolution remote sensing images from 2002 to 2015 that were used as reference data. The Data Management tool in ArcGIS was applied to randomly generate 700 sample sites in the study area for training samples selection. In the sample selection process, we ensure that more than 100 sample sites are evenly distributed in the study area for each land-cover category. The samples are divided into training samples and validation samples in a ratio of 3:7. Secondly, we used the feature extraction toolbox in the ENVI to statistic spectral features from the manually identified samples. Since the remote sensing data are acquired in the dry season, the spectral characteristics change relatively little. The Tasseled Cap Transformation method was adopted to transform the original data for removing the redundancy between the bands of the original image information [39]. The transformation results have essential physical meaning. With the Tasseled Cap Transformation method, brightness, greenness, and wetness bands were obtained. Greenness reflects the vegetation distribution. Brightness characteristics can identify build-up area and bare land. Grassland, forestland, and waterbody area are characterized by wetness. Finally, the C4.5-based AdaBoost classification method proposed by Dou et al. [40] was adopted as the classification method. The C4.5-based AdaBoost method is consists of base classifier training and base classifier decision combination. The classification results are produced by combining its base classifiers through voting. Significantly, the C4.5 decision tree was used to train the based classifiers for AdaBoost. The number of experimental iterations is set to 50.
The decision tree-based classification used in this study still has some limitations: one is caused by the defect in the data quality; the other is caused by the homogeneity or heterogeneity of the image features. The problems caused by the former include that the matching accuracy of multi-source data affects the condition judgment of the decision point in the decision tree. The problems caused by the latter, such as grassland and cultivated land in urban green space, need to be solved by combining texture features and multiple periods. Their boundaries cannot be accurately identified even for features with prominent geometric characteristics, such as roads and buildings. There are still many errors in the land-cover classifications in build-up areas. The wrong classification results may influence the accuracy of the fractal dimension.
We adopted manual correction to correct the classification results referring to the high-resolution Google Earth remote sensing images. Manual comparison of earlier and later land-cover classification results was conducted to identify unreasonable land-cover transformation. For all verification images, the overall accuracy of classification was above 90.7% and the kappa coefficients were above 0.78. Figure 2 exhibits land-cover classification results, showing the immense land-cover changes between 1988 and 2015 in Shenzhen. Table 2 illustrates the land-cover changes for Shenzhen. It can be clearly seen that build-up area extended from 1988 to 2015. The land-cover classification results will be used for fractal dimension and information entropy calculation.

3. Methodology

In this section, we introduced the basic theory and fractal dimension calculation method in detail. Meanwhile, the information entropy was used to support the fractal dimension results.

3.1. Fractal Measurement

Fractals have apparent particularity, and general geometric measurement methods cannot describe those structure well [41]. The basic idea is to measure texture under consideration at different scales [42]. Based on this idea, a measurement scale parameter r is introduced and the number of elements N ( r ) lying within this range is determined. As the value r is changed, this procedure is repeated. For fractals, the following power-law relationship exists between the number of elements N ( r ) and the measurement scale r:
N ( r ) = α × r D
which is used to estimate the fractal dimension D and the factor α .
The urban land-cover fractal study is based on the following theoretical assumptions [43]: To measure urban land cover by certain r scale, there is a measure M in the corresponding scale, when the scale r is changed, the measure M ( r ) is also changed, which can be described as Equation (2)
M ( λ r ) λ d M ( r )
where the λ denotes scaling ratio, d represents scaling exponent.
If urban land cover form measurement satisfies Equation (2), we consider that urban land cover form is of fractal property. The urban land-cover structure pattern exhibits the fractal feature, the scale (r) and measure (M) follow scale invariance. The power-law relationship between r and M can be expressed as Equation (3):
M ( r ) r d
Equation (3) satisfies functional Equation (2). Combining the above Formulas (2) and (3), λ denotes scaling ratio, and d represents scaling exponent. d is usually the fractal dimension function or the fractal dimension itself. Here, we consider that d = D , where D is the fractal dimension.

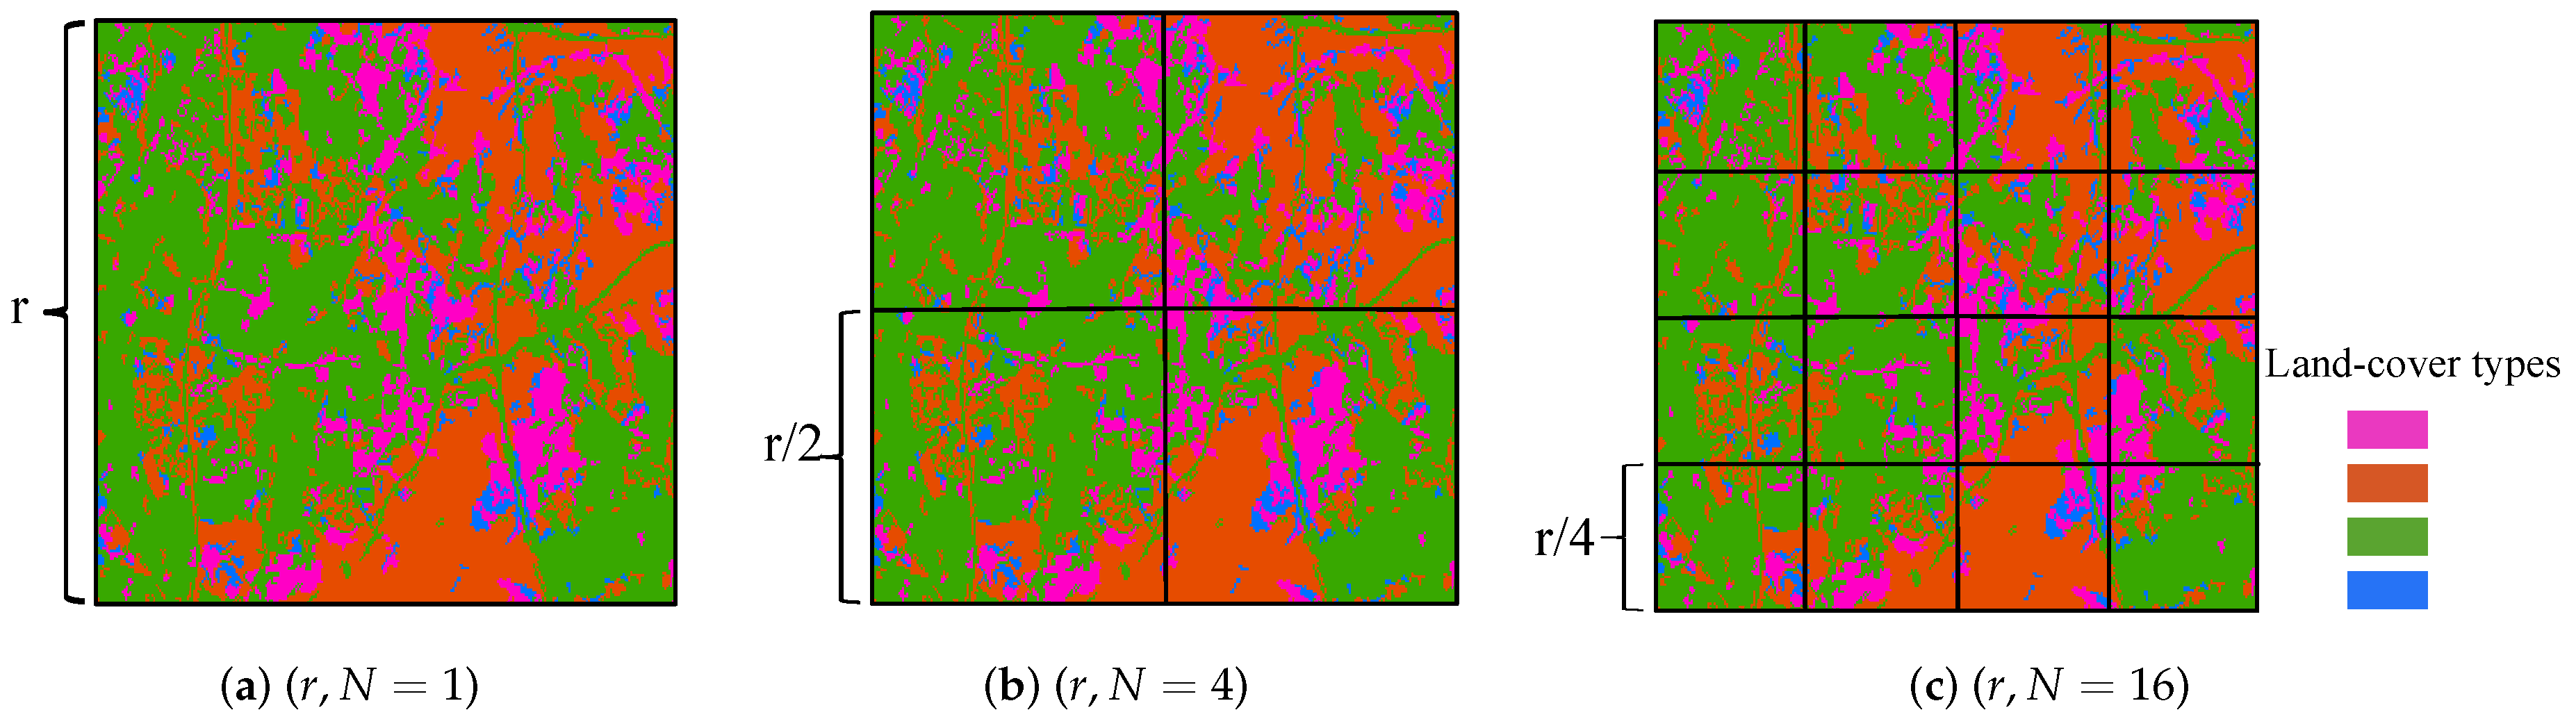
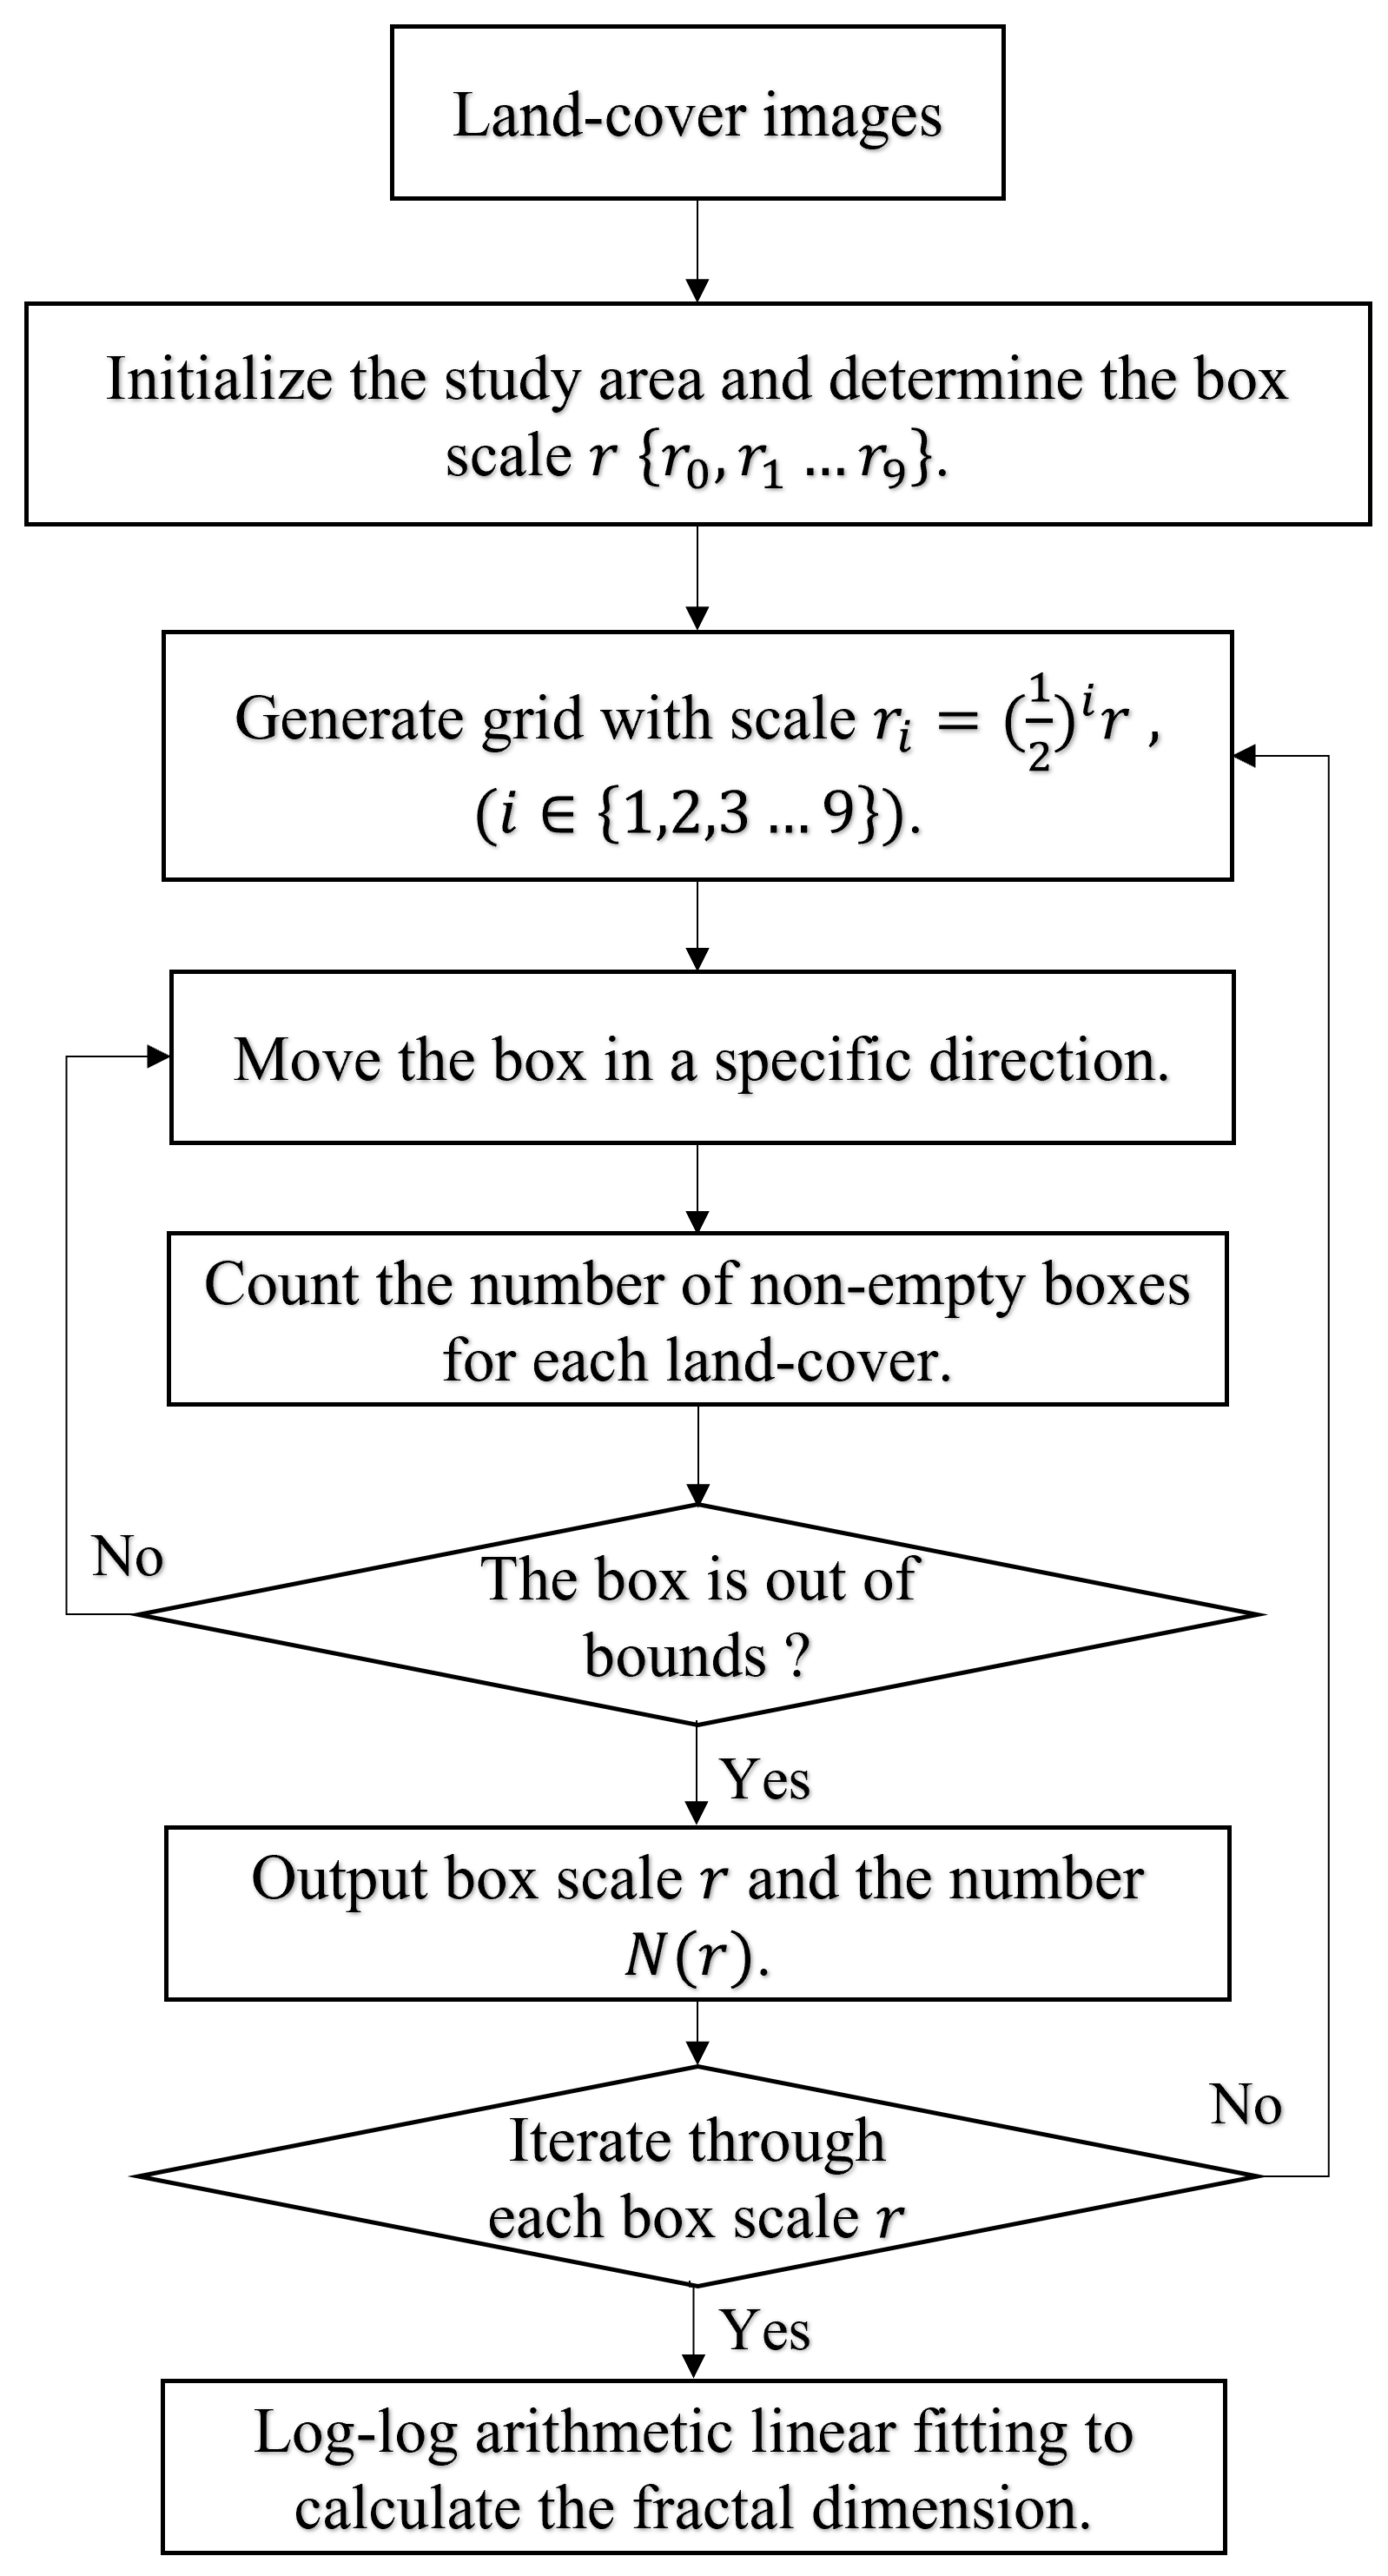
3.2. Fractal Measurement Method of Urban Land-Cover Spatial Structure

Urban fractals are not strictly regular fractals [44]. Introducing random factors into the fractal generation process will form a random fractals. Random fractals can better simulate the land-cover spatial structure [45]. In this study, the box-counting method is used to measure the fractal dimension of land-cover spatial structure. The box-counting method is a top-down measurement [46]. Its scale relationship is expressed as a negative power law. The box-counting method ideas is summarized as follows: the best coverage is adopted; the box scale is a geometrically decreasing or increasing sequence. The corresponding nonempty boxes is also a geometrically increasing sequence. In short, the measurement scale and the hierarchical structure system form a corresponding scale relationship.
The random fractals cannot find the best coverage, which endless subdivisions can gradually approximate. Theoretically, when the box scale tends to be infinitely small, it is expected to approximate the fractal dimension better. This process can be expressed mathematically as Equation (4):
D = lim r 0 ln ( N ( r ) ) ln ( r )
The exponent D is the fractal dimension that the form-factor measures the general features of the structure. r represents the box scale. N ( r ) represents the number of nonempty box. The theory assumes that urban land-cover spatial distribution is a random fractal. This assumption is helpful for the macroscopic and dynamic analysis of a city. The size of D represents the complexity of the land-cover spatial form. In 2-dimension digital maps, D = 2 indicates that a homogeneity spatial distribution of the object in the plane; the other extreme limit is D = 0 , which reflect a high local concentration [27].
Box-counting-based fractal analysis is used to extract spatial information and calculate the fractal dimensions in this study, which is an efficient approach for estimating the fractal parameters of the urban form [47]. The principle of the fractal dimension is as follows: The process starts with covering the whole research area with grids of different scales; the fitting relationship between the number of nonempty grids and the grid scale is determined statistically. This fitting relationship is used as a measure of the urban fractal dimensions. If the urban land-cover pattern has fractal characteristics, the corresponding relationship from the box-counting method can be represented, according to Equation (3), which is as follows:
N ( r ) r D 0
D 0 denotes the capacity dimension, which is an important parameter of the fractal dimension, and N ( r ) is the number of the nonempty grid of scale r. Perform a double logarithmic transformation on Equation (5):
ln N ( r ) = ln ( N 0 ) + D 0 ln ( 1 r )
where N 0 denotes the proportional coefficient. Formally, the box-counting method in geospatial analysis can be processed using the grid method to obtain the grid dimension, which represents the capacity dimension of a fractal. The capacity dimension of fractal is the space-filling index, which represents a kind of space information. In this paper, the capacity dimension is treated as an important parameter of the fractal dimension in the analysis.
Figure 3 shows the concept process of land-cover fractal dimension based on the box-counting method. Suppose that there is a square box with the length r that is covering the while fractal system as in Figure 3a. As shown in Figure 3b,c, the box scale of the geometrically decreasing sequence continuously covers the study area.
The flowchart of fractal dimension calculation based on box-counting method is shown in Figure 4. The detailed process is as follows:
(1) Initialize the rectangular and determine the box-counting scale.
The selection of the initial rectangle to extract the digital map of the urban structure was mainly based on the urban administrative boundaries. The urban land cover in 2015 encompassed the scope of the urban land cover for the previous eight years. Thus, the minimum outsourcing rectangular area of the Shenzhen administrative district is defined on the 2015 urban structure map. A rectangle with the length and width of 90 km and 48 km is initialized, which completely covers the whole study region. We divided the grid scale into ten scales ( r 0 , r 1 , r 2 , . . . , r 9 ), covering various scales, including district, sub-district, community, block levels.
(2) Generate grid with various scales.
Based on the box size, we applied the data management tool (Create Fishnet) in ArcGIS (version 10.5) software to generate rectangular grids from r 0 = ( 1 2 ) 0 to r 9 = ( 1 2 ) 9 . Taking the remote sensing imagery of 2015 as an example, Table 3 shows the multi-scale patch data. Based on the image resolution, the grid is divided into 10 levels (first column), corresponding to the different grid side length, regional spatial recognition levels and grid sizes (second, third and fourth columns, respectively). There are more than 281,000 grids within the research region in the final step of subdivision, of which more than 100,000 grids covered different land-cover types.
(3) Box with r scale was moving in a specific direction to cover the study region.
Box with r scale was moving to cover the study region. If the box is not out of the Shenzhen boundary, we count the number of nonempty grids N ( r ) for each land cover type. Iterate the whole process with r 0 to r 9 . The international tool in ArcGIS was used to judge nonempty grid in this process.
(4) Calculate the fractal dimension by last square regression.
With the ln ( 1 r ) ln ( N ( r ) ) log-log plot, trends can be observed, and a log-log arithmetic linear fitting is performed to obtain the regression model for the nine years. With the results of the grid dimension, the fractal characteristics of the land-cover structure in Shenzhen can be obtained.

3.3. The Information Entropy for Urban Land-Cover Structure

This paper used the information entropy to verify the fractal dimension results calculated by the box-counting method. The information entropy of land-use structure reflects the number of land-cover types and the uniformity of each land cover type [48,49]. The Shannon information function of urban land cover is defined as Equation (7). Assuming that the city’s total area is A, the land cover can be divided into N types according to the type of coverage in the city. The area of each land cover is A i ( i = 1 , 2 , . . . , N ) .
A = i = 1 N A i
According to the equation, the percentage of land area available is as follows:
P i = A i / A = A i / i = 1 N A i
The P i is equivalent to the probability of the event, so that the information of the land-cover structure is defined as follows according to the Shannon formulation:
H = i N P i log ( P i )
Here, H is the information entropy for land cover. The level of information entropy can reflect the degree of balance of the urban land cover. With higher information entropy, there are more types of land-cover functions, smaller area difference for each function type, and a more balanced land distribution [50]. Theoretically, when the area of various land-cover changes to the same ( A 1 = A 2 = A 3 = A n ) , the information entropy reaches the maximum. In practical applications, when the area of built-up land is increased to be equal to other land cover, the information entropy is relatively maximized.
Bourne et al. [51] divides the urban change of city systems into three components: random, predictable, and controlled. The urban self-organization process impacts the random and predictable components, but this can be affected by the control of government policy planning. Studies show that China’s urban development is a self-organizing process [52], and the spatial fractal pattern of the urban structure is an important quantitative evidence process [53]. Information entropy can also reflect the urban land-cover structure, so this study combines fractal geometry with information entropy to examine the mechanism of urban land-cover structure change.

4. Results and Analysis

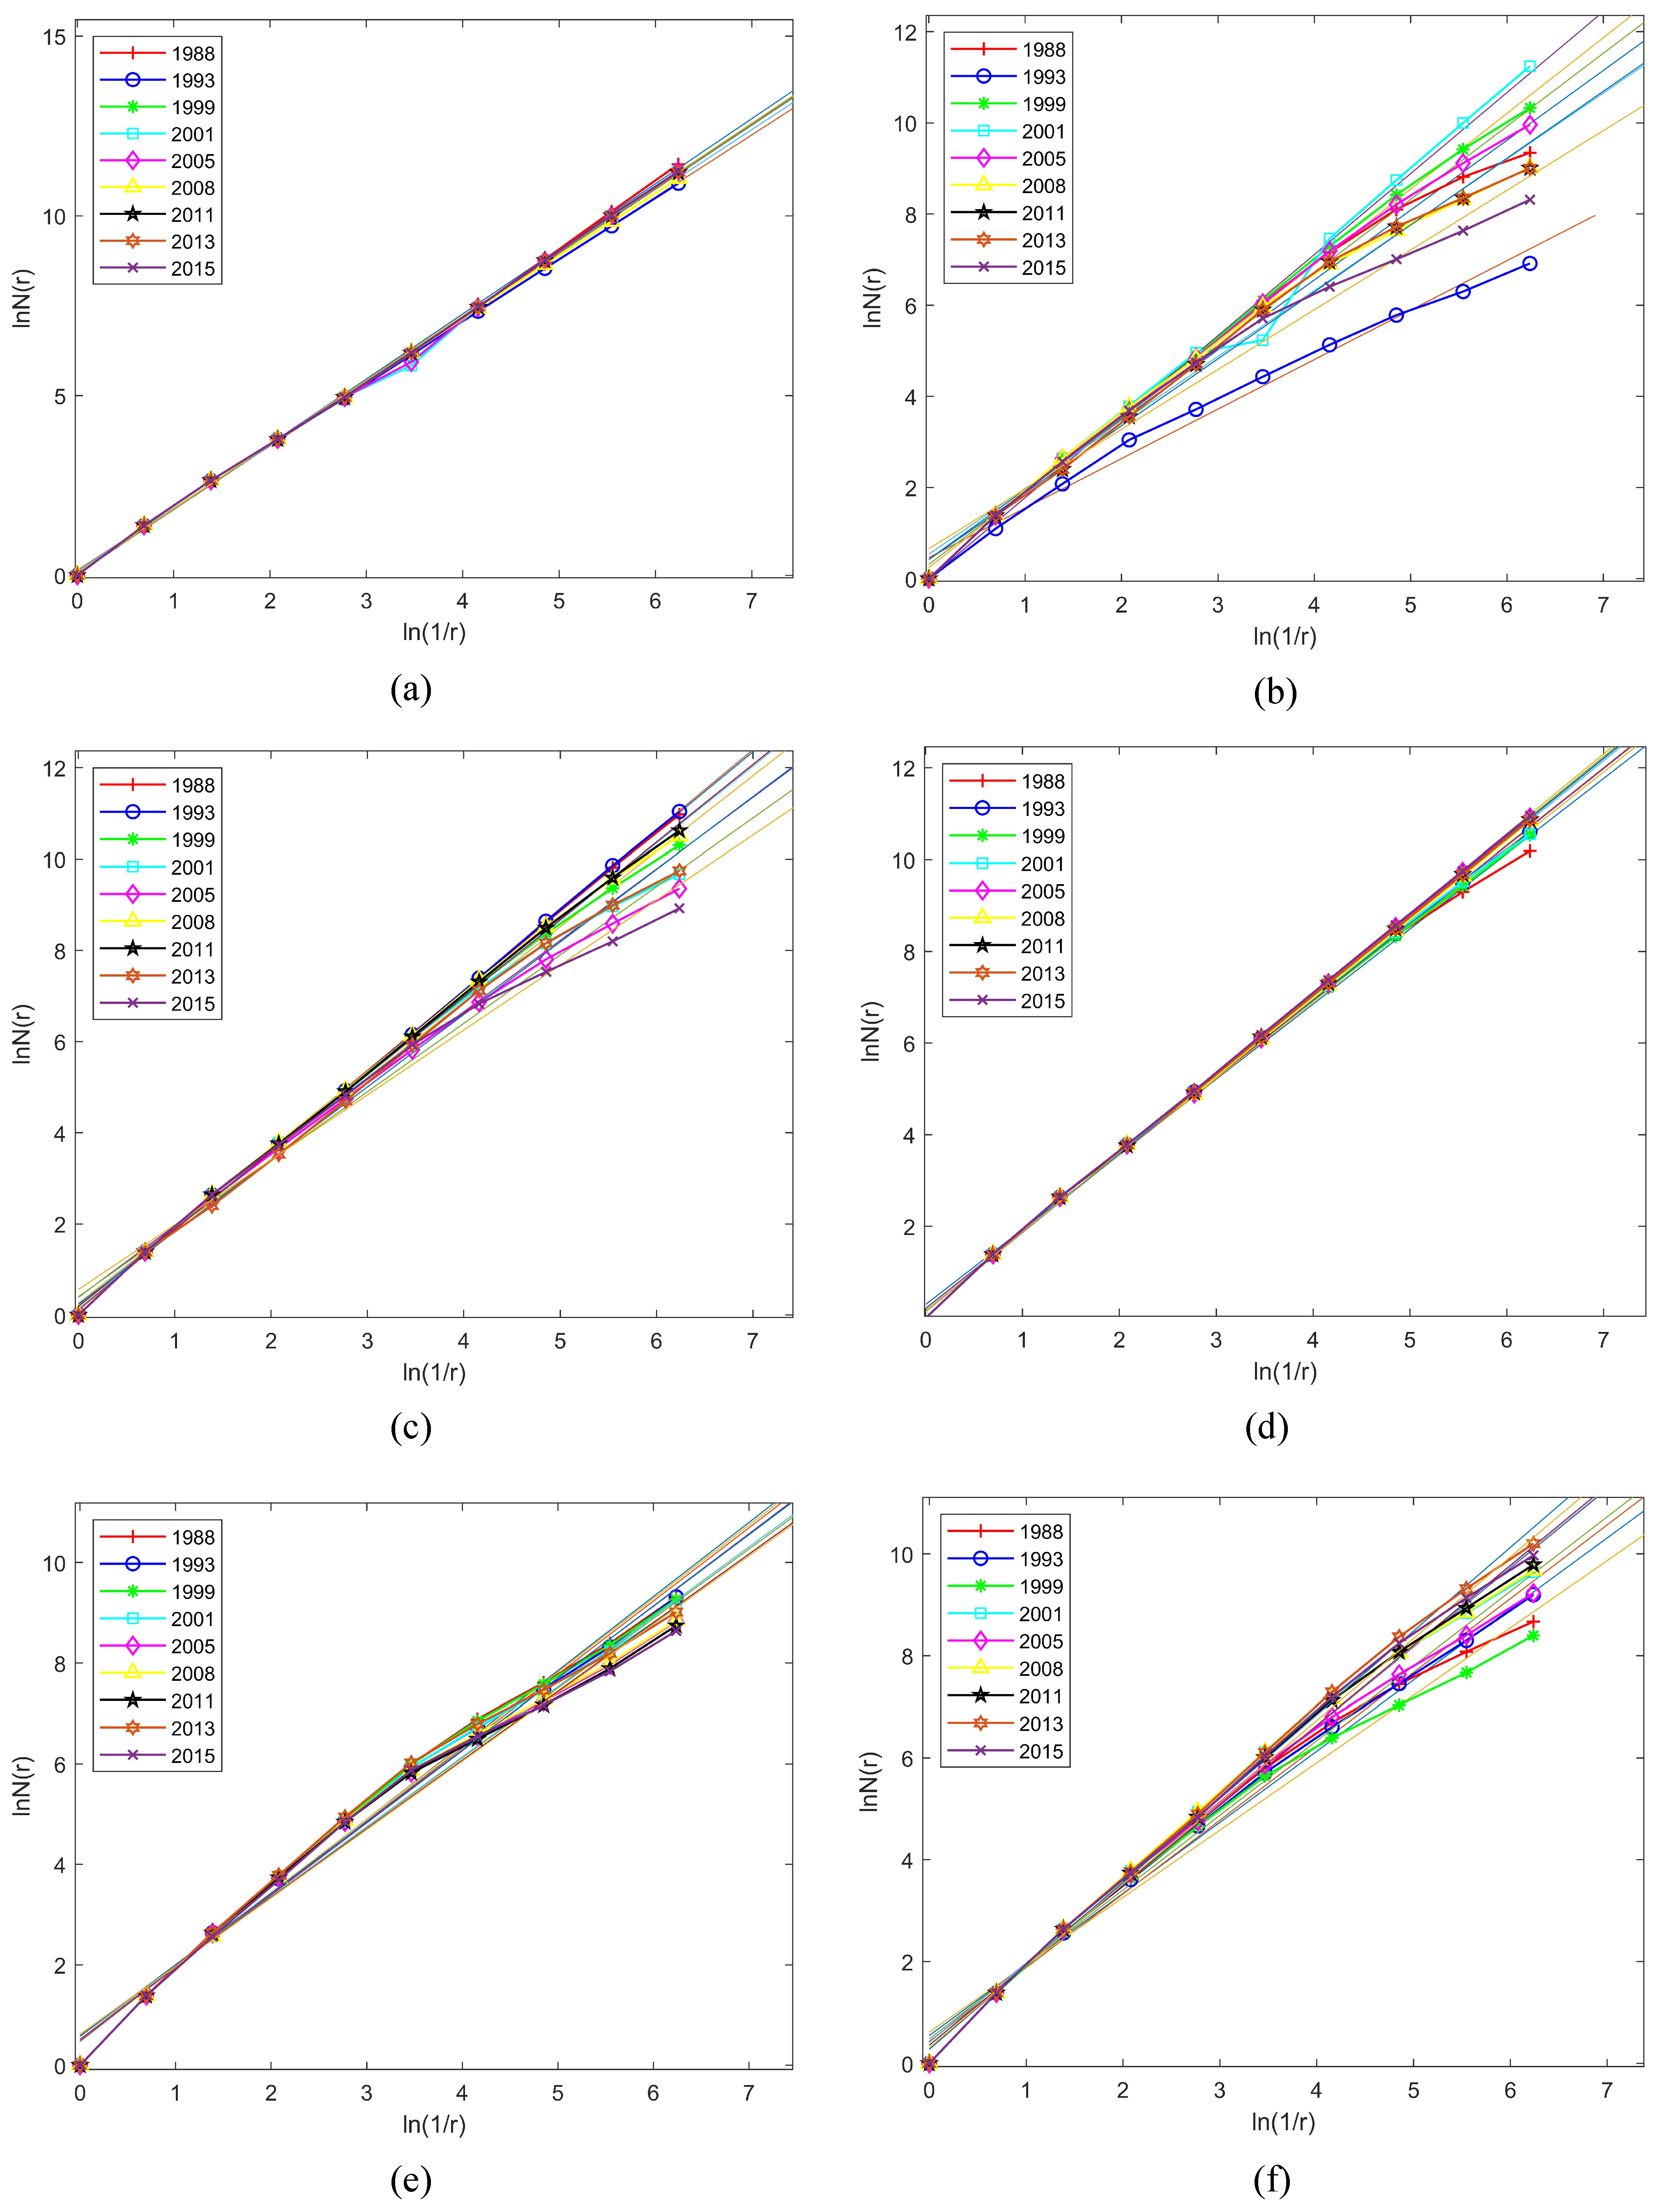
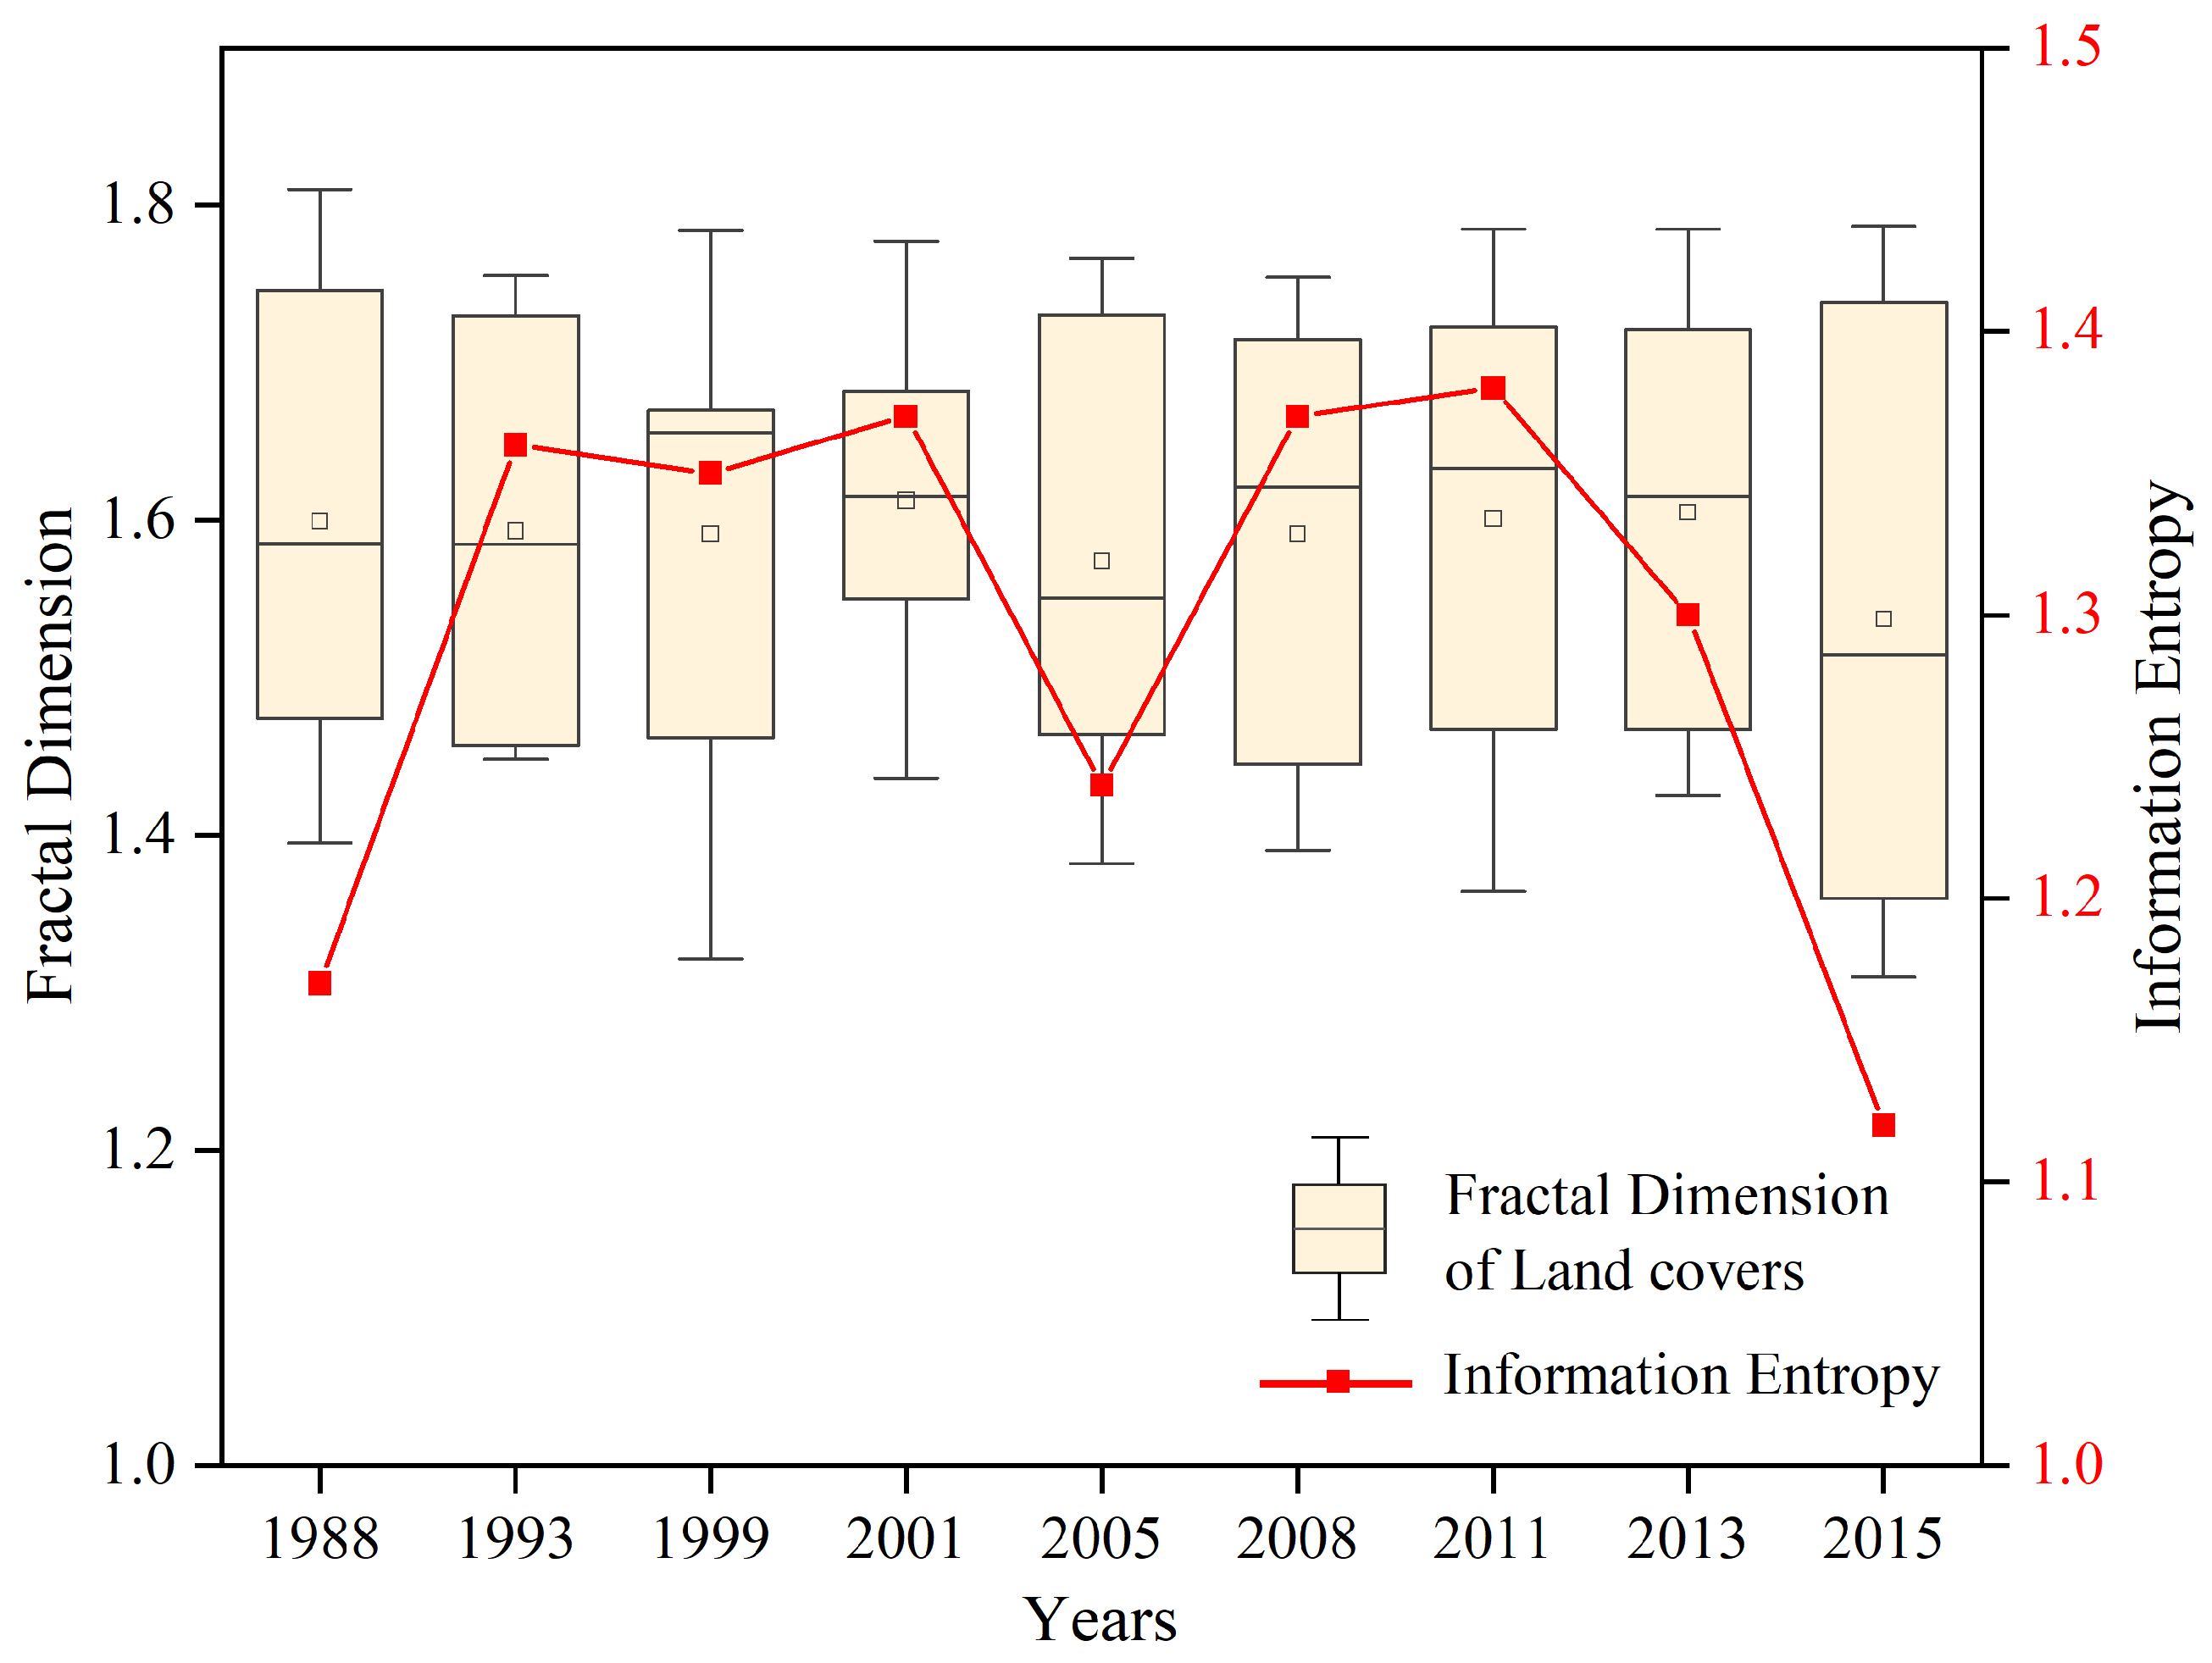
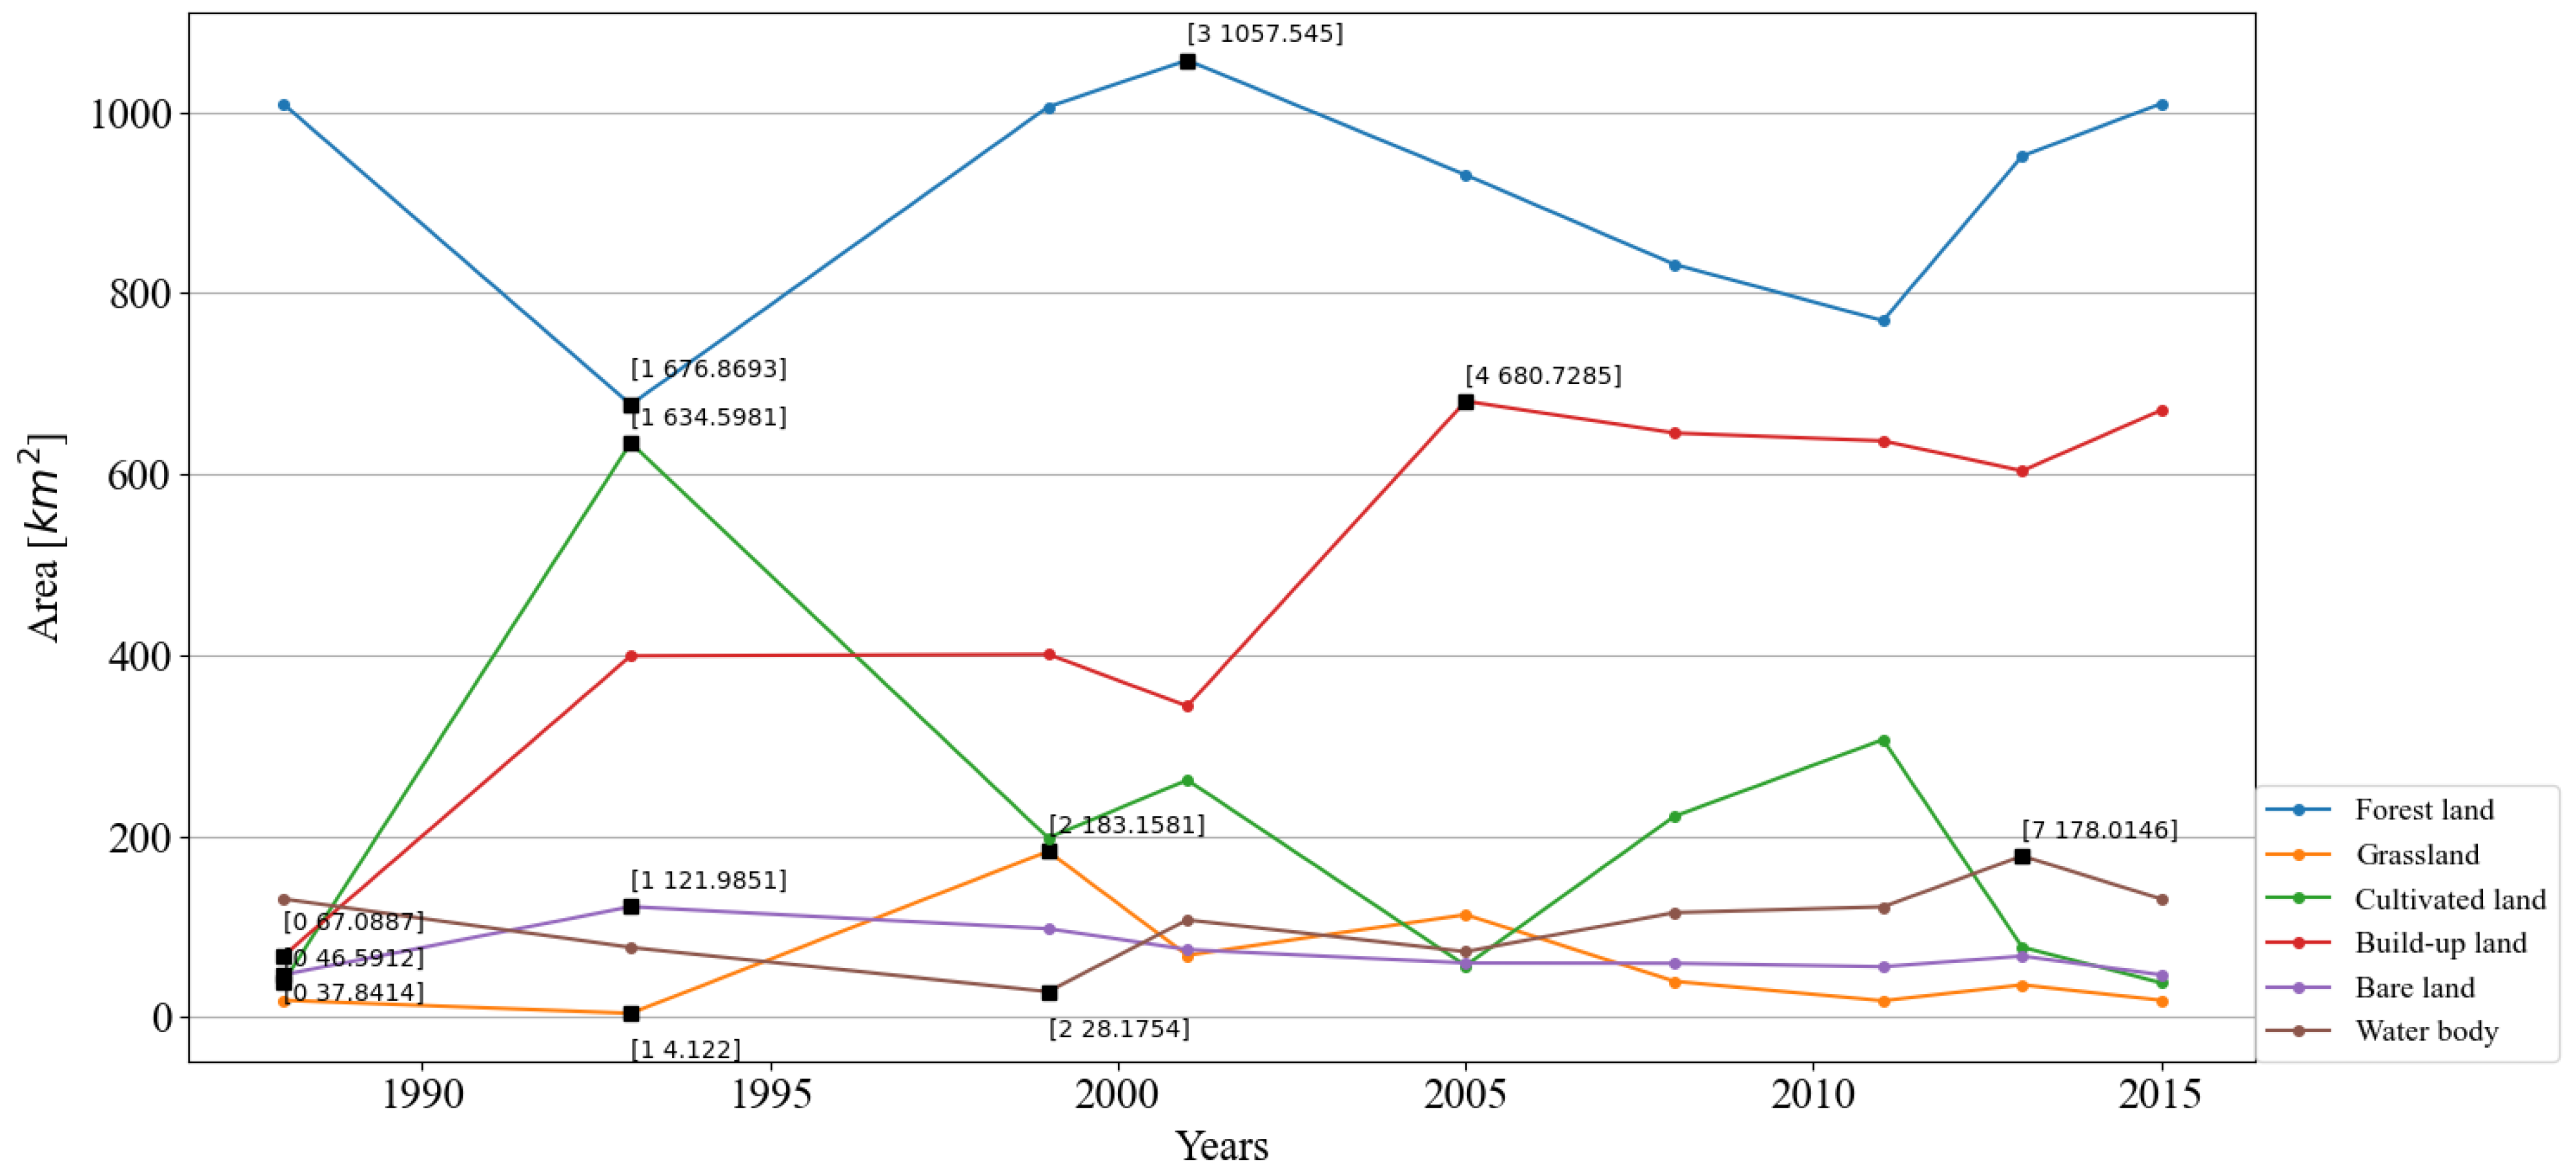
4.1. Fractal Dimension Analysis of Urban Land-Cover Spatial Structure

The log-log logarithm linear regression based on the least square method was employed to estimate fractal dimension. Fitting results based on the box-counting method showed that each land-cover spatial structure exhibit a strong linear association between ln N ( r ) and ln ( 1 / r ) from 1988 to 2015. To show the fractal dimension changes of the land-cover types more clearly, the logarithm linear regression curve of the six land-cover types is shown in Figure 5. Significant bifractals can be seen in the fractal dimensions of the different land-cover types, and these implies a self-affine characteristic that unsynchronized fractals develop in different directions, scales, and regions [14]. Theoretically, healthy urban development of urban should be a self-organizing optimization process, which would be reflected in the evolution of fractal features from double-index self-affine fractal to single-scale similarity fractal [54]. Therefore, self-similarity is the optimal structure of urban systems in an ideal relationship between structure and function in a city. Compared with the other land-cover types, the trend of the scatter fitting line of forest land is roughly stable between 1988 and 2015 (Figure 5a). The fractal dimension of forest land fluctuates at around 1.77, with the deviation not exceeding 0.05 (Table 4). However, the variation of grassland (Figure 5b) fractal dimension is more considerable, with the largest fractal dimension seen in 2001 ( D = 1.66 ) (the cyan line with squares) and the smallest in 1993 ( D = 1.08 ) (the blue line with circles). Surprisingly, the log-log plots of grassland, cultivated land, bare land, and waterbody showed a sudden change. Both ends of the mutation point showed an approximately linear relationship, consistent with the bi-fractal feature. Figure 5c show that the difference in the fractal dimension of cultivated land increases every year and that the bifractals trend is increasing. Figure 5d show that the fractal dimension of the build-up area is increasing every year, and the goodness-of-fit R 2 is also increasing (close to 0.996 ), indicating that its fractal characteristics are more prominent. Similar to the changing trend of the cultivated land, the difference in the fractal dimension of waterbody (Figure 5e) land increases every year. This means that the development patterns of cultivated land and bare land in Shenzhen show the fractal characteristics of anisotropic expansion. The fractal dimension of the waterbody (Figure 5f) decrease every year, and the bifractals tend gradually toward a single fractal, which means that the development and evolution probability of different regions is quite different. From the whole Figure 5, it can be concluded that the anisotropic self-affine feature gradually weakens and that the isotropic self-similarity feature gradually strengthens.
Table 4 presents the detailed results of the fractal dimension estimates of each land cover in Shenzhen from 1988 to 2015. Fractal dimension values of each land cover are between 1 and 2, with the goodness-of-fit R 2 values are all above 0.98. It is powerful proof that each land-cover spatial structure is statistically fractal during 1988–2015. They all increased over time gradually, but the growth trend is different. Benguigui [27] examined the view of urban fractal evolution and found that the self-similarity feature of the city appears in a time-space range. He proposed the statistical criterion of an urban fractal: when the standard error of dimension D is less than the critical value of 0.04, it is equivalent to the goodness-of-fit R 2 being less than or equal to 0.996. For realistic fractal objects such as cities, the measurement results in log-log plots as a significant straight-line segment, as the scale is too large or too small to appear as a curve [34]. The fractal dimensions (D) and the goodness-of-fit ( R 2 ) of forestland, cultivated land, and build-up area are higher than the others, with an apparent fractal. It indicates that their evolution was relatively stable. The fractal dimension of cultivated land and grassland can be seen decreasing year by year, while that of waterbody is increasing. It illustrates that Shenzhen city sprawl process has occupied part of the cultivated land and grassland during rapid urbanization, resulting in the fragmentation of the cultivated land and grassland. In addition. it can also be noticed that the R 2 values of grassland, bare land, and waterbody are lower than 0.996, meaning that they are influenced by the urbanization development and shows a low filling degree of urban space. However, the overall structure of forestland in the city is relatively stable, with no significant changes.

4.2. Information Entropy Results of Urban Land-Cover Spatial Structure

The information entropy of the land-cover composition was calculated using the Shannon entropy to determine each land-cover area’s ratios each year. The information entropy of land-cover composition was calculated from 1988 to 2015, which is shown in Table 5. As shown in Figure 6, the information entropy increased from 1.17 in 1988 to a peak at 1.38 in 2011, then decreased gradually after that to a low of 1.12 in 2015. The peak information entropy around 2011 indicates that the area gap between each land-cover type was small.
We compared the fractal dimension of land cover with the information entropy to verify the proposed method. Information entropy can reflect the complexity of a system [55]. An orderly system has low information entropy. The higher information entropy of the city, the more complex it is [56]. We calculated boxplots of different land-cover fractal dimensions, which can reflect the data distribution characteristics (see Figure 6). These boxplots can reflect the average level, volatility degree, and outliers in the fractal dimension of land cover. Specifically, the box height in the box plots reflects the volatility, the edge lines represent the maximum and minimum values in the data. The horizontal line and point in the box symbolize the mid-value and outliers. The information entropy of land-cover structure reflects the balance of the spatial distribution. The greater the volatility of fractal dimension in land cover, the more unbalanced the spatial structure distribution. Accordingly, the corresponding information entropy value is lower. Figure 6 explains that the variation tendency of the fractal dimension in land cover is consistent with the information entropy during 1988–2015: The overall increases and the variation range decreases in land-cover fractal dimensions, implying that the land-cover spatial structure changes from chaos to order during 1988–2001. This change is reflected in the pronounced growth in information entropy. From 2011 to 2015, the variation range increases in the land-cover fractal dimension, which indicated the decrease in spatial structure balance. This change is reflected in the obvious downtrend in information entropy. The fractal dimension in 2005 was more separated and was lower in mid-value than in 2011 and 2008. Its information entropy dropped sharply, indicating the diversification and imbalance of the land structure driven by economic development and policies in 2005. In summary, the results of information entropy in land-cover spatial structure verified the fractal dimension results of this research.

4.3. Analysis of Factors Associated with Urban Spatial Structure

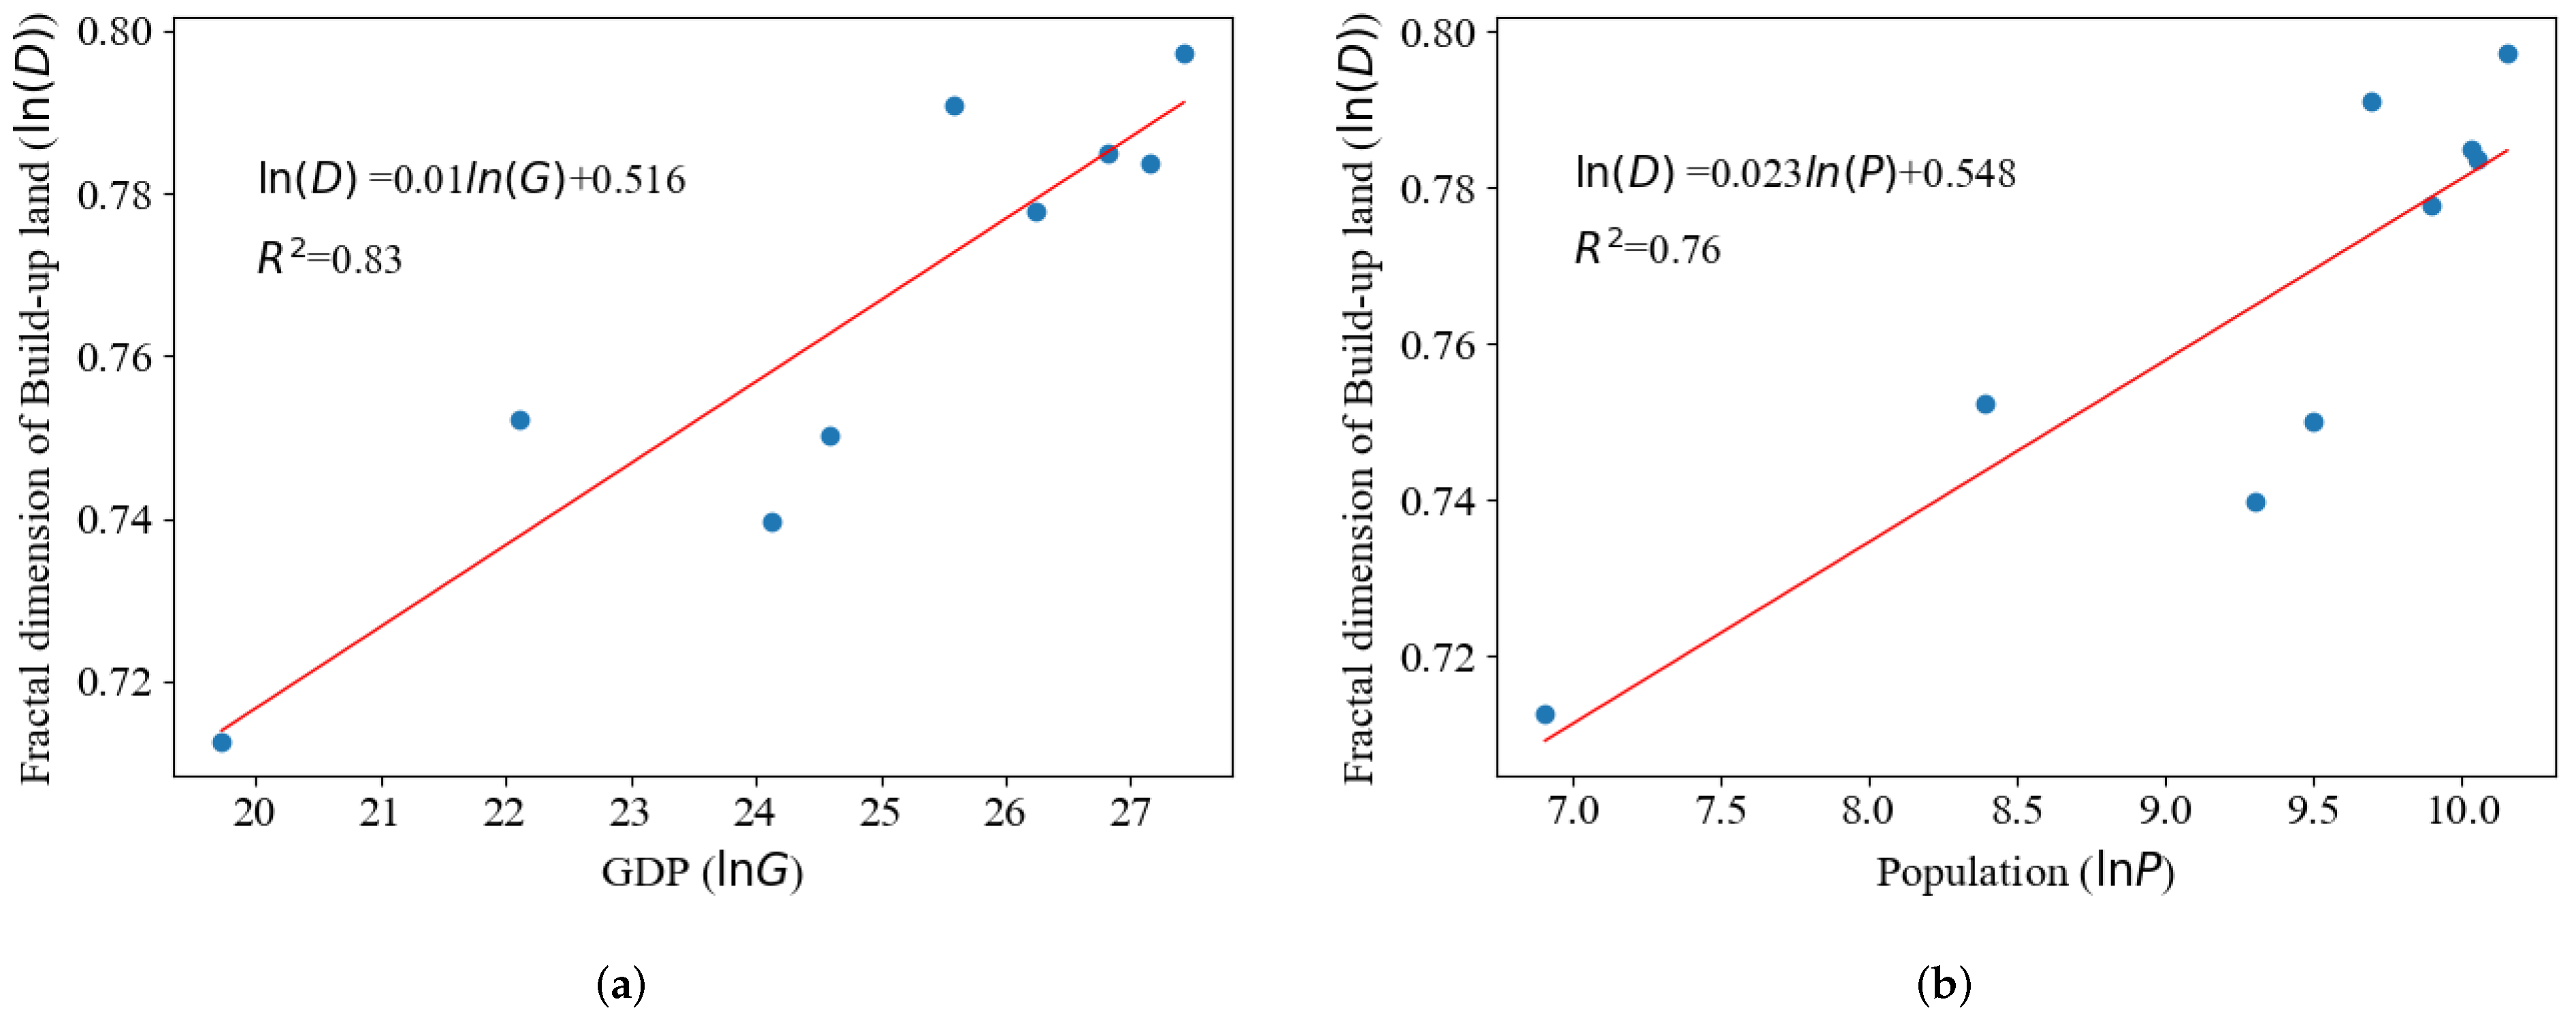
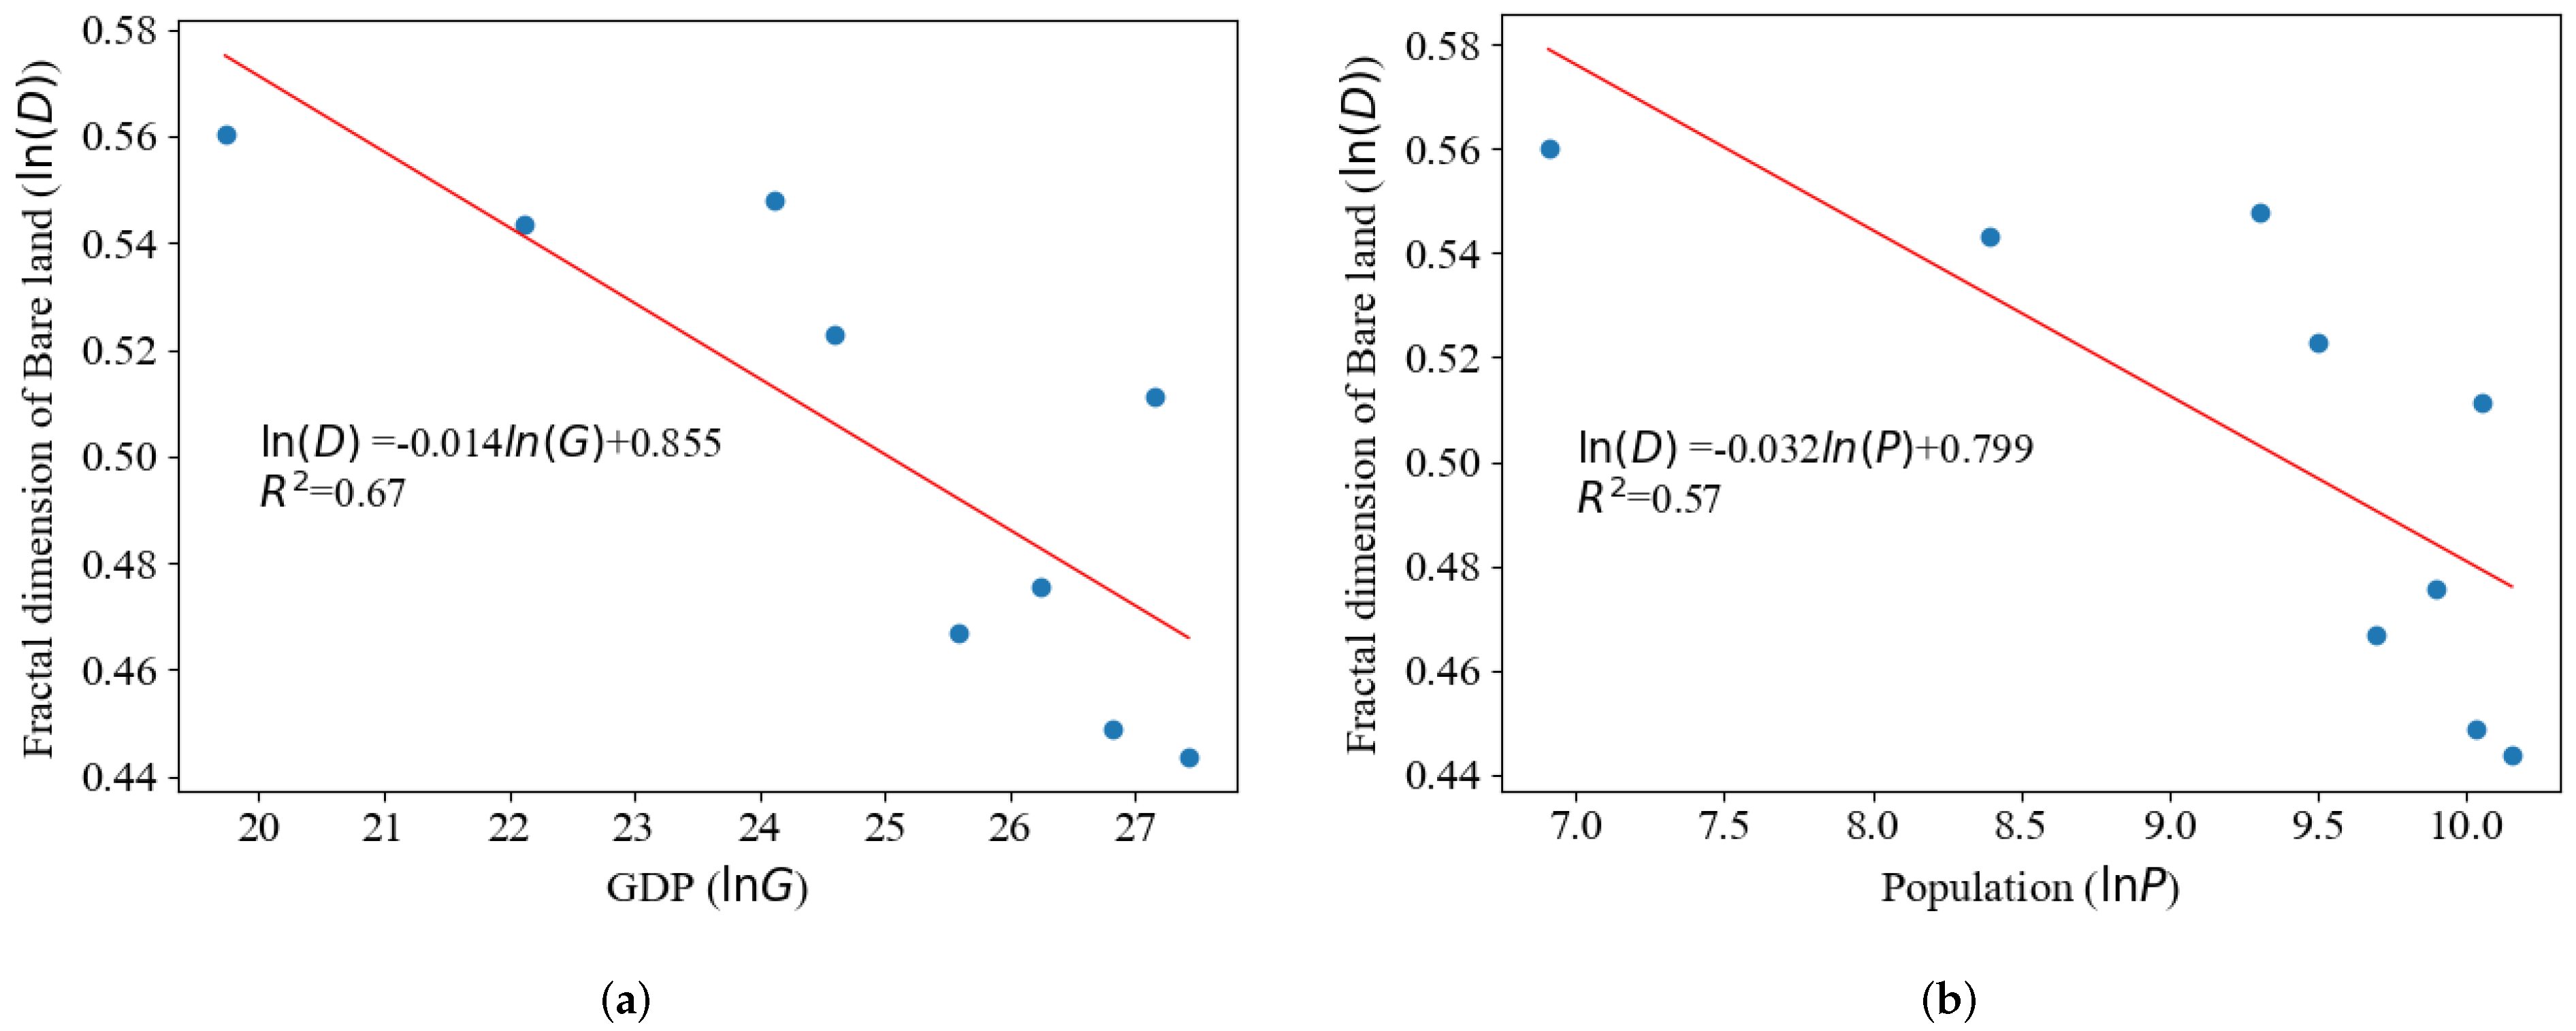
4.3.1. Fractal Analysis for Urban Land Cover

The fractal dimension and annual information entropy of land cover reveal that urbanization has led to changes in land cover in Shenzhen. The fractal dimension results showed that the fractal structure has prominent evolutionary characteristics, whether looking at the entire urban area, built-up area, or various land cover. The evolutionary characteristics are mainly manifested in two ways: The first is that the structure of urban land-cover fractal form is gradually improving. From Table 4, it can be seen that the goodness-of-fit r 2 has an overall upward trend, while the standard error has a downward trend. The structure of each land-cover type is relatively complicated. The seconds is the fractal dimensions of various land cover in Shenzhen city have been rising and falling over the past 30 years. Specifically, the fractal dimension of the build-up land is always greater than that of others, indicating the complexity of the intertwined penetration of the building areas. The green space dimension undergoes dramatic changes in 2005, mainly because of the economic construction-focused strategy of urban development after that date, which was a result of the government paying more attention to the ecological environment and the human settlement environment. The distribution of built-up land is in a relatively balanced state. The fractal dimension of build-up land is at a high level, while the bare land and public green space is small, reflecting the uneven distribution of urban green space and bare land and the low green space sharing rate. The fractal structure of the waterbody in Shenzhen has evolved from a self-affine structure to a self-similar structure, indicating that the trend toward integration of the waterbody space structure is gradually strengthening.
The fractal dimension of various land cover remains relatively high, indicating that urban land cover is not apparent enough, making the city in a state of disorder and weakening its functional strength [24,57]. Therefore, the fractal dimension of various land cover in the city should be up and down to maintain its regular operation [58]. Forest land always maintains a stable fractal pattern. The fractal dimension of cultivated land and grassland shows a downward trend, while the build-up area and waterbody show an upward trend. The fractal dimension of these land-cover types are different gradually. As the urban development has entered a stable period and its self-organization characteristics, the fractal pattern of build-up area and waterbody have enhanced gradually, indicating that the urban land cover has become increasingly obvious.

4.3.2. Power-Law Analysis with Population Size and GDP

The increase in the fractal dimension indicates urban sprawl [59]. Urban sprawl is generally related to population size and economic development factors [60]. It implies that both population size and economic are the driving factors of promoting the urban sprawl in Shenzhen in the past 30 years. Considering that the apparent changes in the fractal dimension of the build-up land and bare land in Shenzhen, we analyze the power-law relationship between the land cover and population size and GDP, respectively. The results of the population size, GDP, and fractal dimension values of the build-up land from 1988 to 2015 are shown in Figure 7. Between population size, GDP, and fractal dimension with build-up land exist significant law relations, and the values of goodness-of-fit R 2 are higher than 0.76 . However, there is a negative correlation between them, and the goodness-of-fit R 2 is lower than build-up land, which are shown in Figure 8. The acceleration effect of population on urban sprawl is far more significant than GDP in terms of their power index. It implied that there is no need to promote economic development at the expense of urban sprawl for Shenzhen city. Whether government policy intervention plays a key role in urban population and economic growth is also worth considering.

4.3.3. Management Implications

Shenzhen is a symbol of rapid development in China [61]. Shenzhen city was established as a special economic zone by the government in 1980. It has been continuously expanding during 1988 to 2015. In the 1990s, a system of paid use of urban land was implemented, resulting in land-cover changes in the suburbs [62]. The urban spatial pattern is driven by natural, economic, and political factors. The fractal characteristics of land-cover spatial patterns is the result of urbanization. Notably, the information entropy declined year on year from 2000 to 2005 (see Figure 6), reaching a trough in 2005, coincident with the continuous expansion and development of the Shenzhen Special Economic Zone from around 2000. It led to an imbalance in land-cover types with different functions and an imbalance inland distribution. The State Council of China issued the “Decision of the State Council on Deepening the Reform of Land Management” in 2004, which required improvements in the land-cover consolidation, urban construction, and the implementation and management of village and township planning [63]. This policy had a significant impact on the evolution of the land-cover structure in Shenzhen. The information entropy increased year by year after 2005 and reached the highest in 2011, which has made the land-cover structure more diverse and increasingly balanced state. Figure 9 shows the area changes in six land-cover types. The differences in the areas of the various land-cover types are most considerable in 1988 and 2011, which indicates that the internal distribution of urban land is hugely uneven. After 2015, the different types of land gaps become smaller gradually. This is a process of returning forest to farmland. The build-up area had increased every year, and the cultivated area was most extensive in 1993 and then decreasing every year. Relatively, the grassland, bare land, and waterbody area were relatively small. The significant increase in build-up area indicates that city is sprawling in the development process.
This demonstrates that the evolution of urban spatial structure can be seriously affected by the land policy. And the various land-cover distribution was relatively balanced, consistent with China‘s “Eleventh Five-Year Plan”, which advocated comprehensive, coordinated, and sustainable development [64]. The land-cover evolution also reveals the role of policies in promoting urban development.

5. Discussion

The urban fractal is a state that gradually evolves through self-organization. The fractal state is the most intensive and efficient urban spatial structure, which can enable humans to make reasonable use of limited geographical space resource [24]. Moreover, if the city management measures are improper, the evolutionary fractal results and self-similar distribution may be disturbed and destroyed. This study showed that using fractal dimension to measure the land-cover spatial structure can well explain the changes in urban land structure driven by urban policies. We study the urban land structure of Shenzhen from a fine-grained spatial perspective, which is more detailed than that at the administrative district level. From the perspective of urban land cover, we systematically diagnosed the problems in the spatial structure of Shenzhen’s urban form. We provided new ideas and examples for the characterization of urban spatial heterogeneity and pathological diagnosis.
By calculating and analyzing the fractal dimension for the land-cover spatial structure, we have gained much new knowledge about the land-cover evolution in Shenzhen. Some general knowledge can also be extended to other cities in China. Combining the results of the fractal dimension and information entropy for land cover, we summarized the rapidly expanding cities from the perspective of spatial filling, spatial balance, and spatial complexity.
(1) Spatial filling: The process of urban growth is necessarily accompanied by the process of filling the interior space. Fractals can reflect the system’s ability to fill space. The higher the space-filling of urban land cover is, the higher the fractal dimension is. The fractal dimension of the various land cover in Shenzhen has shown an increasing trend, reflecting the process of filling the inner space of the city. Both the area and fractal dimension of built-up land are increasing, demonstrating that the built-up land is a significant factor in the process of urban filling, compared with other land-cover types. In recent years, the urban land-cover spatial structure of Shenzhen has developed into a balanced state. The area gap of various land-cover types has gradually decreased, and the homogeneity of the urban land structure has increased.
(2) Spatial balance: For urban systems, the more uniform the urban spatial distribution is, the higher the fractal dimension is. The distribution of the built-up area is in a relatively balanced state, and the fractal dimension is also at a high level. The fractal dimension of bare land and public green space is small, which reflects the uneven distribution of urban green space and bare land, as well as the low sharing rate of the green space. After 30 years of development in Shenzhen, the fractal dimension of grassland has not increased but decreased. Therefore, it is worth thinking about Shenzhen’s urban construction processes over the years. However, the small part of the changes in the structure of cultivated land and bare land shows an anisotropic expansion trend compared with other land-cover spatial structures. The difference in information entropy and fractal dimension of land cover can be jointly proved that the distribution of land in the built-up area is concentrated with a large proportion, while the grassland is concentrated with a smaller proportion. This also confirms the spatial imbalance caused by the process of urban development.
(3) Spatial complexity: The land-cover structure is relatively complex in Shenzhen. In the past 30 years, the standard deviation of area of the various types of land has declined, indicating that the growth of Shenzhen has a trend of self-organization optimization. The complexity of the spatial evolution for land structure shows a highly nonlinear relationship. During this period of studies, the overall fractal dimension of land-cover fluctuated, indicating that urban land cover has been both changing and reasonable, reflecting the control of urban planning.
Overall, the land-cover structure in Shenzhen is relatively reasonable, but the government should adjust relevant land policies to address the fragmented distribution of grassland, bare land, and cultivated land, to better control land development.

6. Conclusions

The scale-free spatial of urban land-cover revealed the fractal structure and evolution characteristics for Shenzhen city. This analysis is not only helpful for understanding the development of Shenzhen. However, it is also helpful in understanding urban evolution regularities and dynamic mechanisms in different regions and countries. This paper has presented a novel study of the urban land-cover evolution characteristics based on a land-cover dataset with a long-term sequence for Shenzhen. Multitemporal remote sensing data were also used to investigate the fractal dimension and information entropy characteristics of a modern coastal city, Shenzhen, China. The main conclusion of this study is summarized as follows: First, the land-cover spatial structure of Shenzhen city has significant fractal characteristics. The fractal dimension box-counting method revealed that the spatial patterns show scale invariance during the study period. However, the distribution of various land cover has heterogeneity, as fractal dimension values vary in different land cover at the same time. Secondly, the fractal structure of the land-cover patterns of Shenzhen shows a clear evolutionary process. The land-cover patterns dramatically changed as the city and surroundings were urbanized, and areas of Shenzhen maintained expansion along with the development from 1988 to 2015. The economic development and the changes in urban spatial structure over the past 30 years show that its fractal dimension was relatively low at the early stage of the development. As the city developed more rapidly, its fractal dimension increased. Shenzhen city has prominent fractal characteristics, reflecting the growing infrastructure building to accommodate the population and GDP growth. Thirdly, there are also some problems in Shenzhen’s urbanization process: The degree of spatial filling in the city is increasing, but its spatial balance is weakening; spatial complexity is growing. The increased bifractals features of the bare land indicate that the grassland, bare land, and farmland in the city are becoming more fragmented. Finally, the fractal dimension tends to a stable maximum, indicating that the spatial-filling degree is close to the limit in Shenzhen, and few land resources are available.
This study suggests that the government should promote the efficient use of urban land by limiting its unreasonable expansion. Effectively controlling the self-organizing regulatory mechanism of urban evolution can promote healthier urbanization management. For future work, more impact factors, such as population flow, can be examined to further detail urban evolution. Furthermore, although the fractal dimension can measure land-cover spatial structure characteristics well, there is no standard for evaluating the fractal dimension of each land-cover type in a particular city. There are often fractals in the fractals, forming a composite structure and multiple fractals, which does not make a good partition. Nevertheless, fractal theory can be used to examine long-term data for fast-developing cities, conduct fine-grained research on urban land-cover patterns, and qualitatively characterize urban internal space patterns.

Author Contributions

Conceptualization, L.C. and L.W.; methodology, R.F.; validation, formal analysis, investigation, resources, L.C. and R.F.; writing—original draft preparation, L.C.; writing—review and editing, R.F.; supervision, L.W.; funding acquisition, L.W. All authors have read and agreed to the published version of the manuscript.

Funding

This research was funded by the National Natural Science Foundation of China (No. U1711266 and No. 41925007), and the Strategic Priority Research Program of the Chinese Academy of Sciences (grant number XDA19090128).

Institutional Review Board Statement

Not applicable.

Informed Consent Statement

Not applicable.

Data Availability Statement

The data we utilize can be reached at (https://github.com/MissChengLX/Fractal-dimension-Calculation, accessed on 15 October 2021).

Acknowledgments

We acknowledge the funding received from the National Natural Science Foundation of China (No. U1711266 and No. 41925007), and the Strategic Priority Research Program of the Chinese Academy of Sciences (grant number XDA19090128).

Conflicts of Interest

The authors declare no conflict of interest.

References

  1. Deng, F.F.; Huang, Y. Uneven land reform and urban sprawl in China: The case of Beijing. Prog. Plan. 2004, 61, 211–236. [Google Scholar] [CrossRef]
  2. Frumkin, H. Urban sprawl and public health. Public Health Rep. 2002, 117, 201–217. [Google Scholar] [CrossRef]
  3. Dear, M.; Scott, A.J. Urbanization and Urban Planning in Capitalist Society; Routledge: London, UK, 2018; Volume 7. [Google Scholar]
  4. Bourne, L.S. Internal Structure of the City: Readings on Urban Form, Growth, and Policy; Oxford University Press: Oxford, UK, 1982. [Google Scholar]
  5. Chen, Y. Multi-scaling allometric analysis for urban and regional development. Physica A 2017, 465, 673–689. [Google Scholar] [CrossRef] [Green Version]
  6. Batty, M. New ways of looking at cities. Nature 1995, 377, 574. [Google Scholar] [CrossRef]
  7. Bosch, M.; Jaligot, R.; Chenal, J. Spatiotemporal patterns of urbanization in three Swiss urban agglomerations: Insights from landscape metrics, growth modes and fractal analysis. Landsc. Ecol. 2020, 34, 879–891. [Google Scholar] [CrossRef]
  8. Mu, L.; Wang, L.; Wang, Y.; Chen, X.; Han, W. Urban Land Use and Land Cover Change Prediction via Self-Adaptive Cellular Based Deep Learning With Multisourced Data. IEEE J. Sel. Top. Appl. Earth Obs. Remote Sens. 2019, 12, 5233–5247. [Google Scholar] [CrossRef]
  9. Li, X.; Tang, Z.; Chen, W.; Wang, L. Multimodal and Multi-Model Deep Fusion for Fine Classification of Regional Complex Landscape Areas Using ZiYuan-3 Imagery. Remote Sens. 2019, 11, 2716. [Google Scholar] [CrossRef] [Green Version]
  10. Chen, W.; Li, X.; Wang, L. Fine Land Cover Classification in an Open Pit Mining Area Using Optimized Support Vector Machine and WorldView-3 Imagery. Remote Sens. 2020, 12, 82. [Google Scholar] [CrossRef] [Green Version]
  11. Wang, L.; Chen, L. The impact of new transportation modes on population distribution in Jing-Jin-Ji region of China. Sci. Data. 2018, 5, 170204. [Google Scholar] [CrossRef] [PubMed] [Green Version]
  12. Liu, P.; Wang, M.; Wang, L.; Han, W. Remote-Sensing Image Denoising with Multi-Sourced Information. IEEE J. Sel. Top. Appl. Earth Observ. Remote Sens. 2019, 12, 660–674. [Google Scholar] [CrossRef]
  13. Cheng, L.; Wang, L.; Feng, R.; Yan, J. Remote Sensing and Social Sensing Data Fusion for Fine-Resolution Population Mapping With a Multimodel Neural Network. IEEE J. Sel. Top. Appl. Earth Obs. Remote Sens. 2021, 14, 5973–5987. [Google Scholar] [CrossRef]
  14. White, R.; Engelen, G. Cellular automata and fractal urban form: A cellular modelling approach to the evolution of urban land-use patterns. Environ. Plan. A 1993, 25, 1175–1199. [Google Scholar] [CrossRef] [Green Version]
  15. Frankhauser, P. From Fractal Urban Pattern Analysis to Fractal Urban Planning Concepts. In Computational Approaches for Urban Environments; Helbich, M., Jokar Arsanjani, J., Leitner, M., Eds.; Springer International Publishing: Cham, Switzerland, 2015; pp. 13–48. [Google Scholar]
  16. Lagarias, A.; Prastacos, P. Comparing the urban form of South European cities using fractal dimensions. Environ. Plan B-Urban. 2020, 47, 1149–1166. [Google Scholar] [CrossRef]
  17. White, R.; Engelen, G.; Uljee, I. The use of constrained cellular automata for high-resolution modelling of urban land-use dynamics. Environ. Plan. B 1997, 24, 323–343. [Google Scholar] [CrossRef]
  18. Chen, Y.; Li, X.; Liu, X.; Ai, B. Modeling urban land-use dynamics in a fast developing city using the modified logistic cellular automaton with a patch-based simulation strategy. Int. J. Geogr. Inf. Sci. 2014, 28, 234–255. [Google Scholar] [CrossRef]
  19. Liu, Y.; He, Q.; Tan, R.; Liu, Y.; Yin, C. Modeling different urban growth patterns based on the evolution of urban form: A case study from Huangpi, Central China. Appl. Geogr. 2016, 66, 109–118. [Google Scholar] [CrossRef]
  20. Chen, Y. Fractal dimension evolution and spatial replacement dynamics of urban growth. Chaos Soliton Fract. 2012, 45, 115–124. [Google Scholar] [CrossRef] [Green Version]
  21. Batty, M.; Longley, P.A. Fractal Cities: A Geometry of Form and Function; Academic Press: Cambridge, MA, USA, 1994. [Google Scholar]
  22. Batty, M. Cities as fractals: Simulating growth and form. In Fractals and Chaos; Springer: Berlin/Heidelberg, Germany, 1991; pp. 43–69. [Google Scholar]
  23. Chen, Y.; Wang, J. Multifractal characterization of urban form and growth: The case of Beijing. Environ. Plan. B Plan. Des. 2013, 40, 884–904. [Google Scholar] [CrossRef]
  24. Shen, G. Fractal dimension and fractal growth of urbanized areas. Int. J. Geogr. Inf. Sci. 2002, 16, 419–437. [Google Scholar] [CrossRef]
  25. Irwin, E.G.; Bockstael, N.E. The evolution of urban sprawl: Evidence of spatial heterogeneity and increasing land fragmentation. Proc. Natl. Acad. Sci. USA 2007, 104, 20672–20677. [Google Scholar] [CrossRef] [Green Version]
  26. Sémécurbe, F.; Tannier, C.; Roux, S.G. Applying two fractal methods to characterise the local and global deviations from scale invariance of built patterns throughout mainland France. J. Geogr. Syst. 2019, 21, 271–293. [Google Scholar] [CrossRef] [Green Version]
  27. Benguigui, L.; Czamanski, D.; Marinov, M.; Portugali, Y. When and where is a city fractal? Environ. Plan. B 2000, 27, 507–519. [Google Scholar] [CrossRef] [Green Version]
  28. Chen, Y.; Wang, Y.; Li, X. Fractal dimensions derived from spatial allometric scaling of urban form. Chaos Soliton Fract. 2019, 126, 122–134. [Google Scholar] [CrossRef] [Green Version]
  29. Murcio, R.; Masucci, A.P.; Arcaute, E.; Batty, M. Multifractal to monofractal evolution of the London street network. Phys. Rev. E 2015, 92, 062130. [Google Scholar] [CrossRef] [PubMed] [Green Version]
  30. Zhao, J.; Chen, Y.; Li, S. Bi-fractal structure and evolution of the Beijing–Tianjin–Hebei region urban land-use patterns. Prog. Geogr. 2019, 38, 77. [Google Scholar]
  31. Nie, Q.; Xu, J.; Liu, Z. Fractal and multifractal characteristic of spatial pattern of urban impervious surfaces. Earth Sci. Inform. 2015, 8, 381–392. [Google Scholar] [CrossRef]
  32. Purevtseren, M.; Tsegmid, B.; Indra, M.; Sugar, M. The fractal geometry of urban land use: The case of Ulaanbaatar city, Mongolia. Land 2018, 7, 67. [Google Scholar] [CrossRef] [Green Version]
  33. Cheng, L.; Wang, L.; Feng, R. Fractal Characteristics and Evolution of Urban Land-Use: A Case Study in the Shenzhen City (1988–2015). In Proceedings of the IEEE International Geoscience and Remote Sensing Symposium, IGARSS 2020, Waikoloa, HI, USA, 26 September–2 October 2020; pp. 4275–4278. [Google Scholar] [CrossRef]
  34. Chen, Y.; Wang, J.; Feng, J. Understanding the Fractal Dimensions of Urban Forms through Spatial Entropy. Entropy 2017, 19, 600. [Google Scholar] [CrossRef] [Green Version]
  35. Meng, L.; Sun, Y.; Zhao, S. Comparing the spatial and temporal dynamics of urban expansion in Guangzhou and Shenzhen from 1975 to 2015: A case study of pioneer cities in China’s rapid urbanization. Land Use Pol. 2020, 97, 104753. [Google Scholar] [CrossRef]
  36. Chuang-Lin, F. The urbanization and urban development in China after the reform and opening-up. Econ. Geogr. 2009, 29, 19–25. [Google Scholar]
  37. Deng, Y.; Fu, B.; Sun, C. Effects of urban planning in guiding urban growth: Evidence from Shenzhen, China. Cities 2018, 83, 118–128. [Google Scholar] [CrossRef]
  38. Ng, M.K. Sustainable urban development issues in Chinese transitional cities: Hong Kong and Shenzhen. Int. Plan. Stud. 2002, 7, 7–36. [Google Scholar] [CrossRef]
  39. Han, T.; Wulder, M.A.; White, J.C.; Coops, N.C.; Álvarez-Taboada, M.F.; Butson, C. An Efficient Protocol to Process Landsat Images for Change Detection With Tasselled Cap Transformation. IEEE Geosci. Remote Sens. Lett. 2007, 4, 147–151. [Google Scholar] [CrossRef]
  40. Dou, P.; Chen, Y. Dynamic monitoring of land-use/land-cover change and urban expansion in Shenzhen using Landsat imagery from 1988 to 2015. Int. J. Remote Sens. 2017, 38, 5388–5407. [Google Scholar] [CrossRef]
  41. Jevric, M.; Romanovich, M. Fractal dimensions of urban border as a criterion for space management. Procedia Eng. 2016, 165, 1478–1482. [Google Scholar]
  42. Batty, M.; Longley, P.A. The fractal simulation of urban structure. Environ. Plan. A 1986, 18, 1143–1179. [Google Scholar] [CrossRef]
  43. Chen, Y. Fractal Modeling and fractal dimension description of urban morphology. Entropy 2020, 22, 961. [Google Scholar] [CrossRef]
  44. Man, W.; Nie, Q.; Li, Z.; Li, H.; Wu, X. Using fractals and multifractals to characterize the spatiotemporal pattern of impervious surfaces in a coastal city: Xiamen, China. Physica A 2019, 520, 44–53. [Google Scholar] [CrossRef]
  45. Zhang, Z.; Xiao, R.; Yu, W.; Liu, Y.; Lin, M.; Wang, M. Characterizing factors associated with built-up land expansion in urban and non-urban areas from a morphological perspective. Sustainability 2017, 9, 1411. [Google Scholar] [CrossRef] [Green Version]
  46. Liebovitch, L.S.; Toth, T. A fast algorithm to determine fractal dimensions by box counting. Phys. Lett. A 1989, 141, 386–390. [Google Scholar] [CrossRef]
  47. Lovejoy, S.; Schertzer, D.; Tsonis, A. Functional box-counting and multiple elliptical dimensions in rain. Science 1987, 235, 1036–1038. [Google Scholar] [CrossRef]
  48. Cabral, P.; Augusto, G.; Tewolde, M.; Araya, Y.H. Entropy in Urban Systems. Entropy 2013, 15, 5223–5236. [Google Scholar] [CrossRef]
  49. Zhao, S.; Chai, L. A new assessment approach for urban ecosystem health basing on maximum information entropy method. Stoch. Environ. Res. Risk Assess 2015, 29, 1601–1613. [Google Scholar] [CrossRef]
  50. Binyao, L. The Calculation Method of Urban Spatial Form and its Evaluation. Urban Plan. Rev. 1998, 41, b38017. [Google Scholar]
  51. Bourne, L.S.; Simmons, J.W.; Bourne, L.S. Systems of Cities: Readings on Structure, Growth and Policy; Oxford University Press: Oxford, UK, 1978. [Google Scholar]
  52. Feng, J.; Chen, Y. Spatiotemporal evolution of urban form and land-use structure in Hangzhou, China: Evidence from fractals. Environ. Plan. B 2010, 37, 838–856. [Google Scholar] [CrossRef]
  53. Portugali, J. Self Organization and the City. In Encyclopedia of Complexity and Systems Science; Meyers, R.A., Ed.; Springer: Berlin/Heidelberg, Germany, 2009; pp. 7953–7991. [Google Scholar]
  54. Chen, Y. A wave-spectrum analysis of urban population density: Entropy, fractal, and spatial localization. Discrete Dyn. Nat. Soc. 2008, 2008. [Google Scholar] [CrossRef] [Green Version]
  55. Wang, K.; He, C. A remark on Wang’s fractal variational principle. Fractals 2019, 27, 1950134. [Google Scholar] [CrossRef]
  56. Chen, Y.; Jiang, S. An analytical process of the spatio-temporal evolution of urban systems based on allometric and fractal ideas. Chaos Soliton Fract. 2009, 39, 49–64. [Google Scholar] [CrossRef]
  57. Chen, Y. Multifractals of central place systems: Models, dimension spectrums, and empirical analysis. Physica A 2014, 402, 266–282. [Google Scholar] [CrossRef] [Green Version]
  58. Tan, X.; Huang, B.; Batty, M.; Li, J. Urban Spatial Organization, Multifractals, and Evolutionary Patterns in Large Cities. Ann. Am. Assoc. Geogr. 2020, 111, 1539–1558. [Google Scholar] [CrossRef]
  59. Moroni, S.; Rauws, W.; Cozzolino, S. Forms of self-organization: Urban complexity and planning implications. Environ. Plan. B-Urban 2020, 47, 220–234. [Google Scholar] [CrossRef]
  60. Li, G.; Li, F. Urban sprawl in China: Differences and socioeconomic drivers. Sci. Total Environ. 2019, 673, 367–377. [Google Scholar] [CrossRef]
  61. Tong, D.; Wu, Y.; MacLachlan, I.; Zhu, J. The role of social capital in the collective-led development of urbanising villages in China: The case of Shenzhen. Urban Stud. 2021, 58, 42098021993353. [Google Scholar] [CrossRef]
  62. Zhang, J.; Yu, L.; Li, X.; Zhang, C.; Shi, T.; Wu, X.; Yang, C.; Gao, W.; Li, Q.; Wu, G. Exploring annual urban expansions in the Guangdong-Hong Kong-Macau Greater Bay Area: Spatiotemporal features and driving factors in 1986–2017. Remote Sens. 2020, 12, 2615. [Google Scholar] [CrossRef]
  63. Long, H.; Qu, Y. Land use transitions and land management: A mutual feedback perspective. Land Use Policy 2018, 74, 111–120. [Google Scholar] [CrossRef]
  64. Shi, X.; Xu, Z. Environmental regulation and firm exports: Evidence from the eleventh Five-Year Plan in China. J. Environ. Econ. Manag. 2018, 89, 187–200. [Google Scholar] [CrossRef]
Figure 1. Geographic location of the study area: (a) Location map of China; (b) Administration division of Guangdong Province; (c) Location map of and the land-cover classification results in 2015. The boundary map of China comes from China Natural Resources Bureau. The boundaries map of Guangdong Province and Shenzhen city come from Guangdong Natural Resources Bureau.
Remotesensing 13 04640 g001
Figure 2. Land-cover classification data: (a) 1988, (b) 1999, (c) 2005, (d) 2013. The boundaries of the map come from Guangdong Natural Resources Bureau.
Remotesensing 13 04640 g002
Figure 3. Schematic diagram of the box-counting method.
Remotesensing 13 04640 g003
Figure 4. Flowchart of the fractal dimension calculation based on box-counting method.
Remotesensing 13 04640 g004
Figure 5. Example of log-log plots of scaling relations of urban land cover in Shenzhen for 1988–2015: (a) forest land; (b) grassland; (c) cultivated land; (d) build-up area; (e) bare land; (f) waterbody.
Remotesensing 13 04640 g005
Figure 6. Comparison of fractal dimension and information entropy for land cover from 1988–2015.
Remotesensing 13 04640 g006
Figure 7. Log-log plot for Population ( ln ( P ) ), GDP ( ln ( G D P ) ), with fractal dimension of Build-up land ( ln D ) in Shenzhen, 1988–2015: (a) Log-log plot for GDP ( ln G D P ) and fractal dimension of Build-up land ( ln D ); (b) Log-log plot for population ( ln P ) and fractal dimension of Build-up land ( ln D ); Population and GDP data from Shenzhen Statistical Yearbook-2016.
Remotesensing 13 04640 g007
Figure 8. Log-log plot for Population ( ln ( P ) ), GDP ( ln ( G D P ) ), with fractal dimension of Bare land ( ln D ) in Shenzhen, 1988–2015: (a) Log-log plot for GDP ( ln G D P ) and fractal dimension of Bare land ( ln D ); (b) Log-log plot for population ( ln P ) and fractal dimension of Bare land ( ln D ); Population and GDP data from Shenzhen Statistical Yearbook-2016.
Remotesensing 13 04640 g008
Figure 9. Area change of different land-cover types of Shenzhen during the period 1988–2015. The black markers represent the maximum and minimum areas in each land cover.
Remotesensing 13 04640 g009
Table 1. Remote sensing data information.
Year198819931999200120052008201120132015
PlatformLandsat 5Landsat 5Landsat 5Landsat 7Landsat 5Landsat 5Landsat 5Landsat 8Landsat 8
SensorTMTMTMETM+TMTMTMOLIOLI
Spatial
resolution(m)
303030303030303030
Table 2. The area changes in the classification results for land cover.
YearsForest LandGrass LandCultivated LandBuild-Up LandBare LandWater Body
198853.54%1.21%21.67%8.86%5.69%8.93%
199352.31%1.24%20.16%9.01%9.38%8.01%
199947.78%1.30%18.86%20.28%3.01%8.31%
200145.53%1.98%17.71%23.54%3.52%7.55%
200545.49%2.10%11.04%35.16%3.55%5.97%
200845.49%1.81%10.25%35.73%5.62%4.83%
201145.51%2.07%10.05%36.71%3.01%3.74%
201340.02%2.07%8.26%40.10%5.81%9.16%
201540.00%2.20%8.17%40.13%5.63%9.15%
Table 3. Multiscale patch data.
Data LevelrRegion Spatial LevelGrid Size (m) (Width × Height)Grid CountNumber of Nonempty Grid
01City level91,290.43 × 54,436.8411
11/2District level45,645.22 × 27,218.4244
21/4District level22,822.61 × 13,609.211514
31/8Sub-district level11,411.30 × 6804.606344
41/16Sub-district level5705.65 × 3402.30255144
51/32Block level2852.83 × 1701.15991850
61/64Road level1426.41 × 850.5838421798
71/128Residential compound level713.21 × 425.2915,2496761
81/512Community level356.60 × 212.6427,92426,113
91/1024Community level178.30 × 106.32281,744102,535
Table 4. Fractal dimension of Shenzhen land cover based on box-counting method.
YearsForest LandGrass LandCultivated LandBuild-up LandBare LandWater Body
D R 2 D R 2 D R 2 D R 2 D R 2 D R 2
19881.81040.99951.53210.98981.74590.99971.63870.99711.47150.99051.39510.9853
19931.72970.99971.08520.98721.75540.99991.68450.99931.45730.99141.44830.9944
19991.78380.99981.56020.99821.65150.99821.66990.99921.4620.98971.32190.983
20011.77720.99221.66520.99351.6820.99921.65390.99931.43670.9891.55030.9926
20051.76680.99981.60180.99671.49920.99421.73020.99971.38210.98541.46410.9919
20081.75450.99981.4450.9871.68840.99871.71440.99961.39050.98511.55450.9933
20111.72480.99971.26550.98481.69750.99931.7230.99971.36490.98381.56910.9956
20131.78490.99971.46720.98881.58910.99621.72150.99971.42530.9851.64190.9975
20151.78690.99971.31040.97891.42360.9861.73790.99971.360.98161.60520.9967
Max 1 . 8104 1 . 6652 1 . 7554 1 . 7379 1 . 4715 1 . 6419
Min 1 . 7248 1 . 0852 1 . 4236 1 . 6387 1 . 36 1 . 3219
Average 1 . 7688 1 . 4370 1 . 6370 1 . 6971 1 . 4167 1 . 5056
Table 5. Information entropy of land-cover spatial structure.
Year198819931999200120052008201120132015
Information entropy1.171.361.351.371.241.371.381.31.12
Publisher’s Note: MDPI stays neutral with regard to jurisdictional claims in published maps and institutional affiliations.

