
Crop Mapping with Combined Use of European and Chinese Satellite Data

 ,
,
Abstract
:1. Introduction
2. Data and Methods
2.1. High-Resolution Crop Mapping (Sub-Project 1)
2.1.1. Study Area
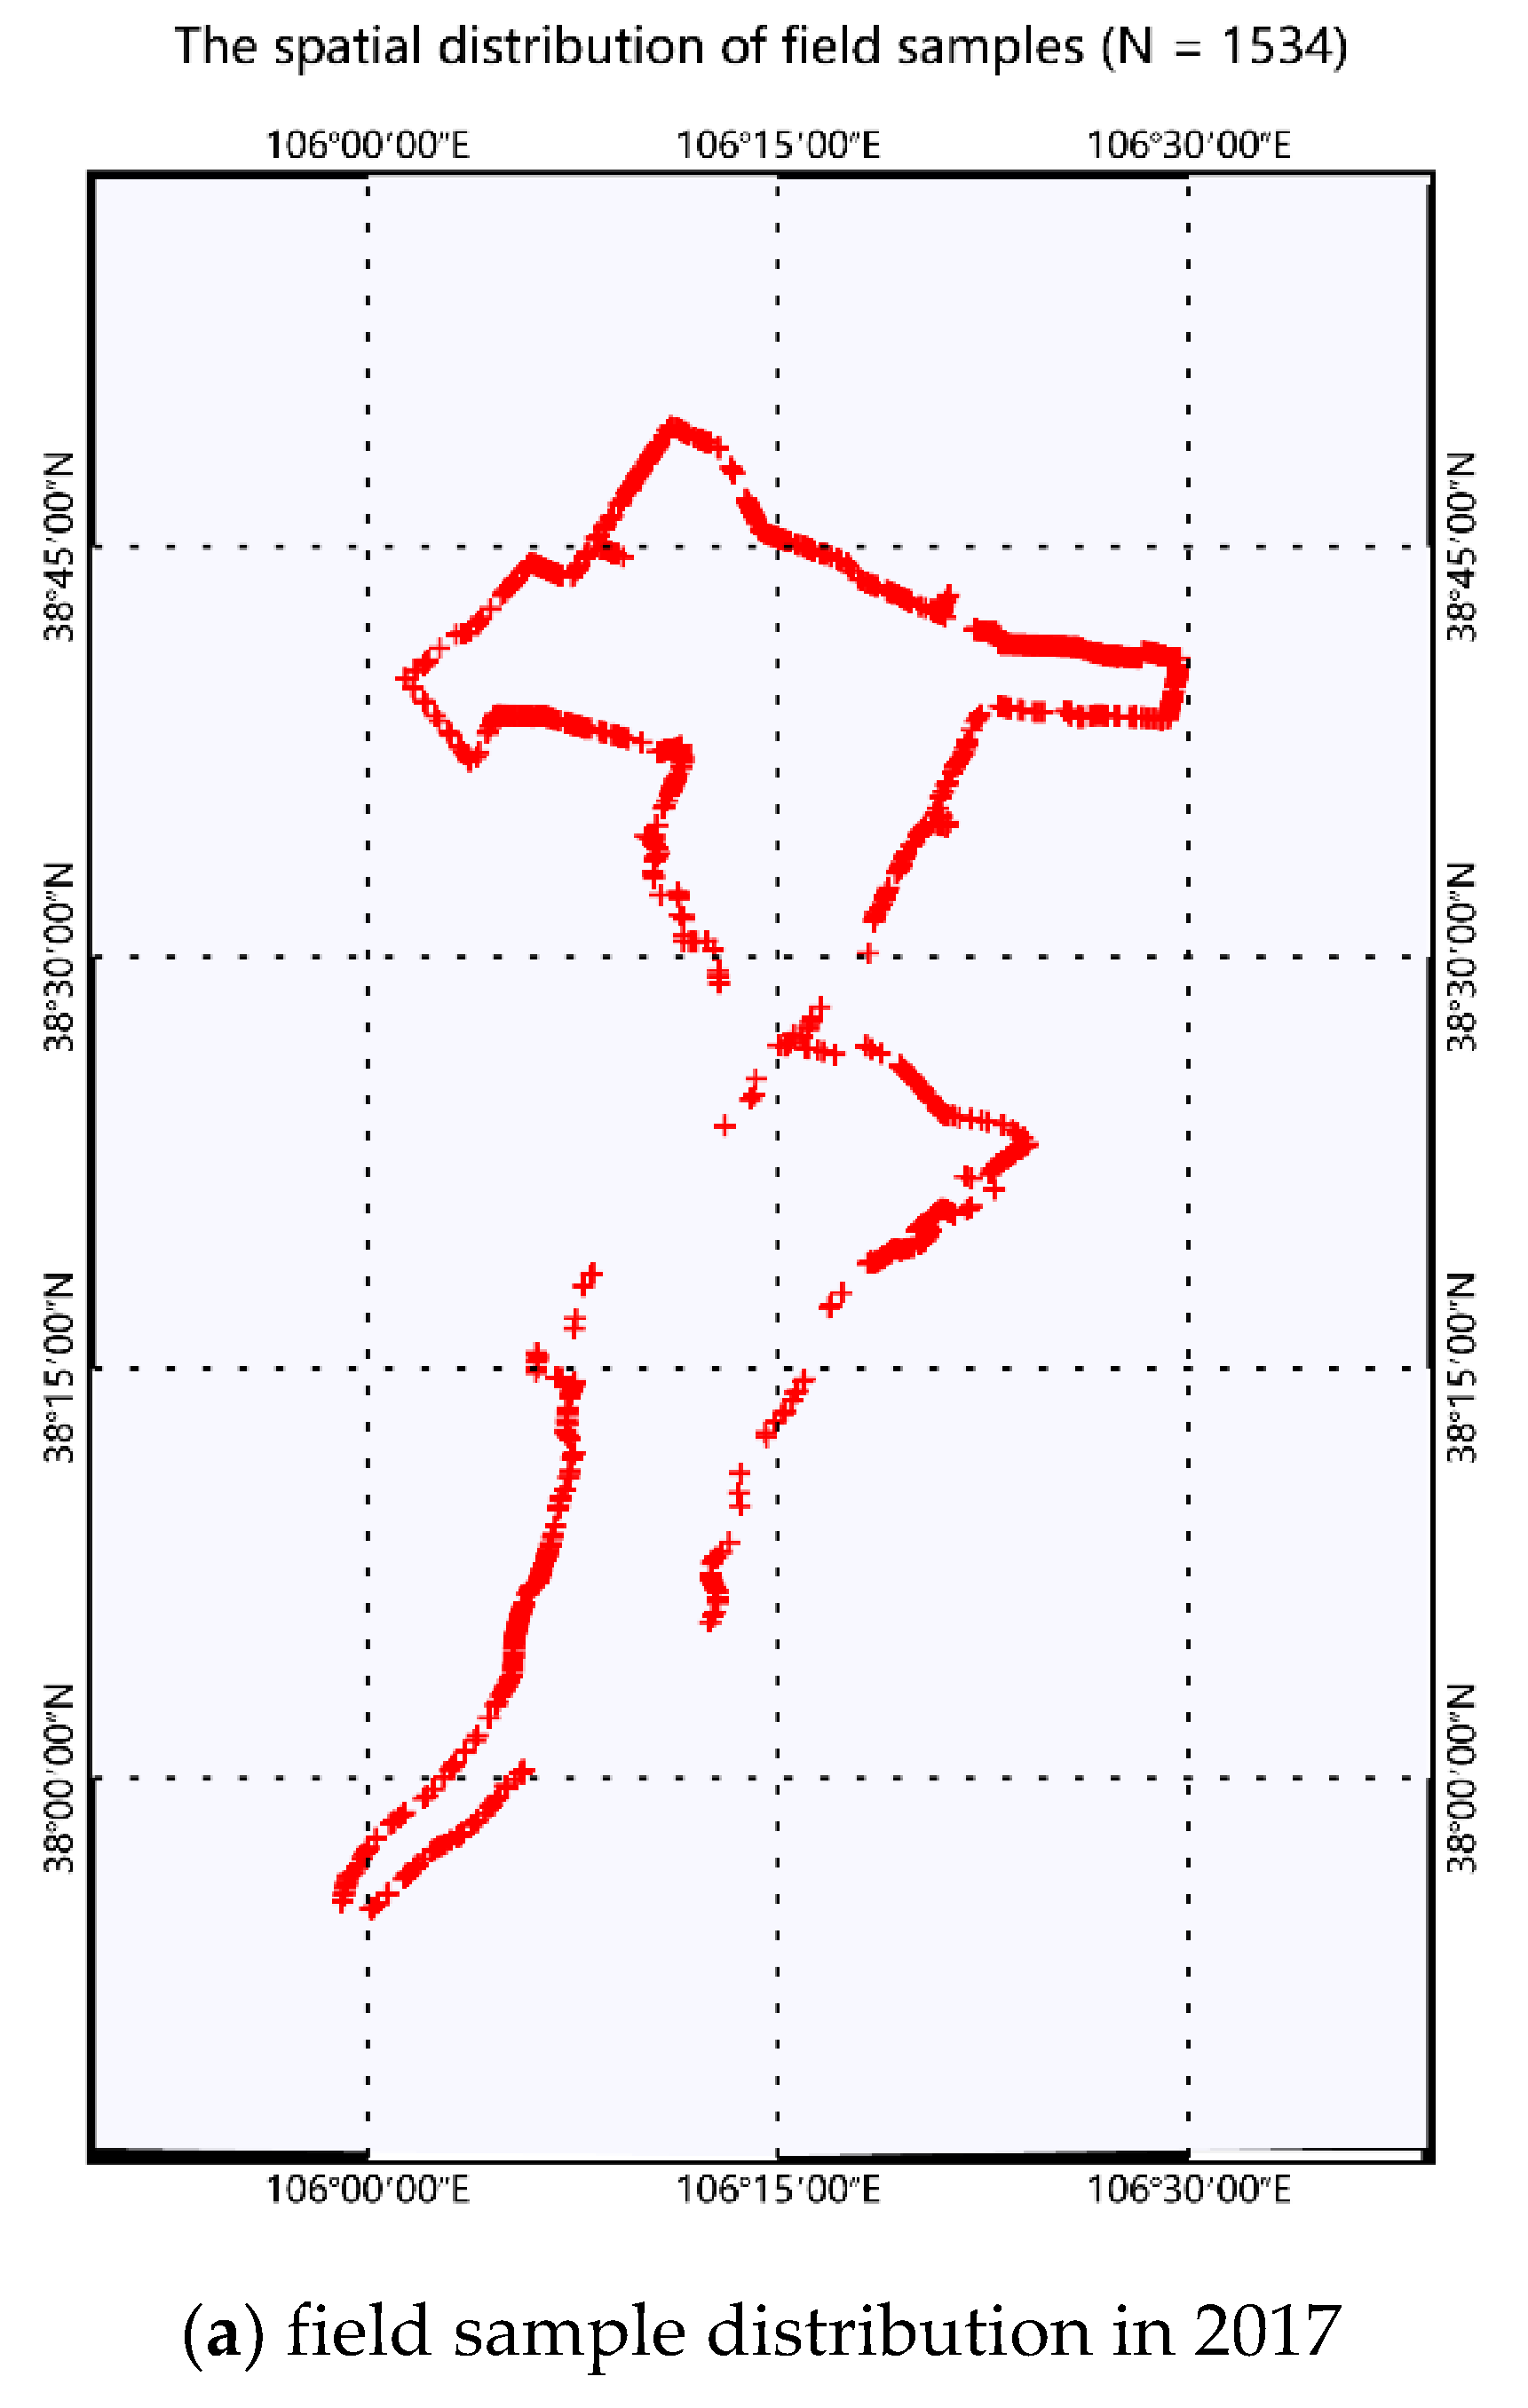
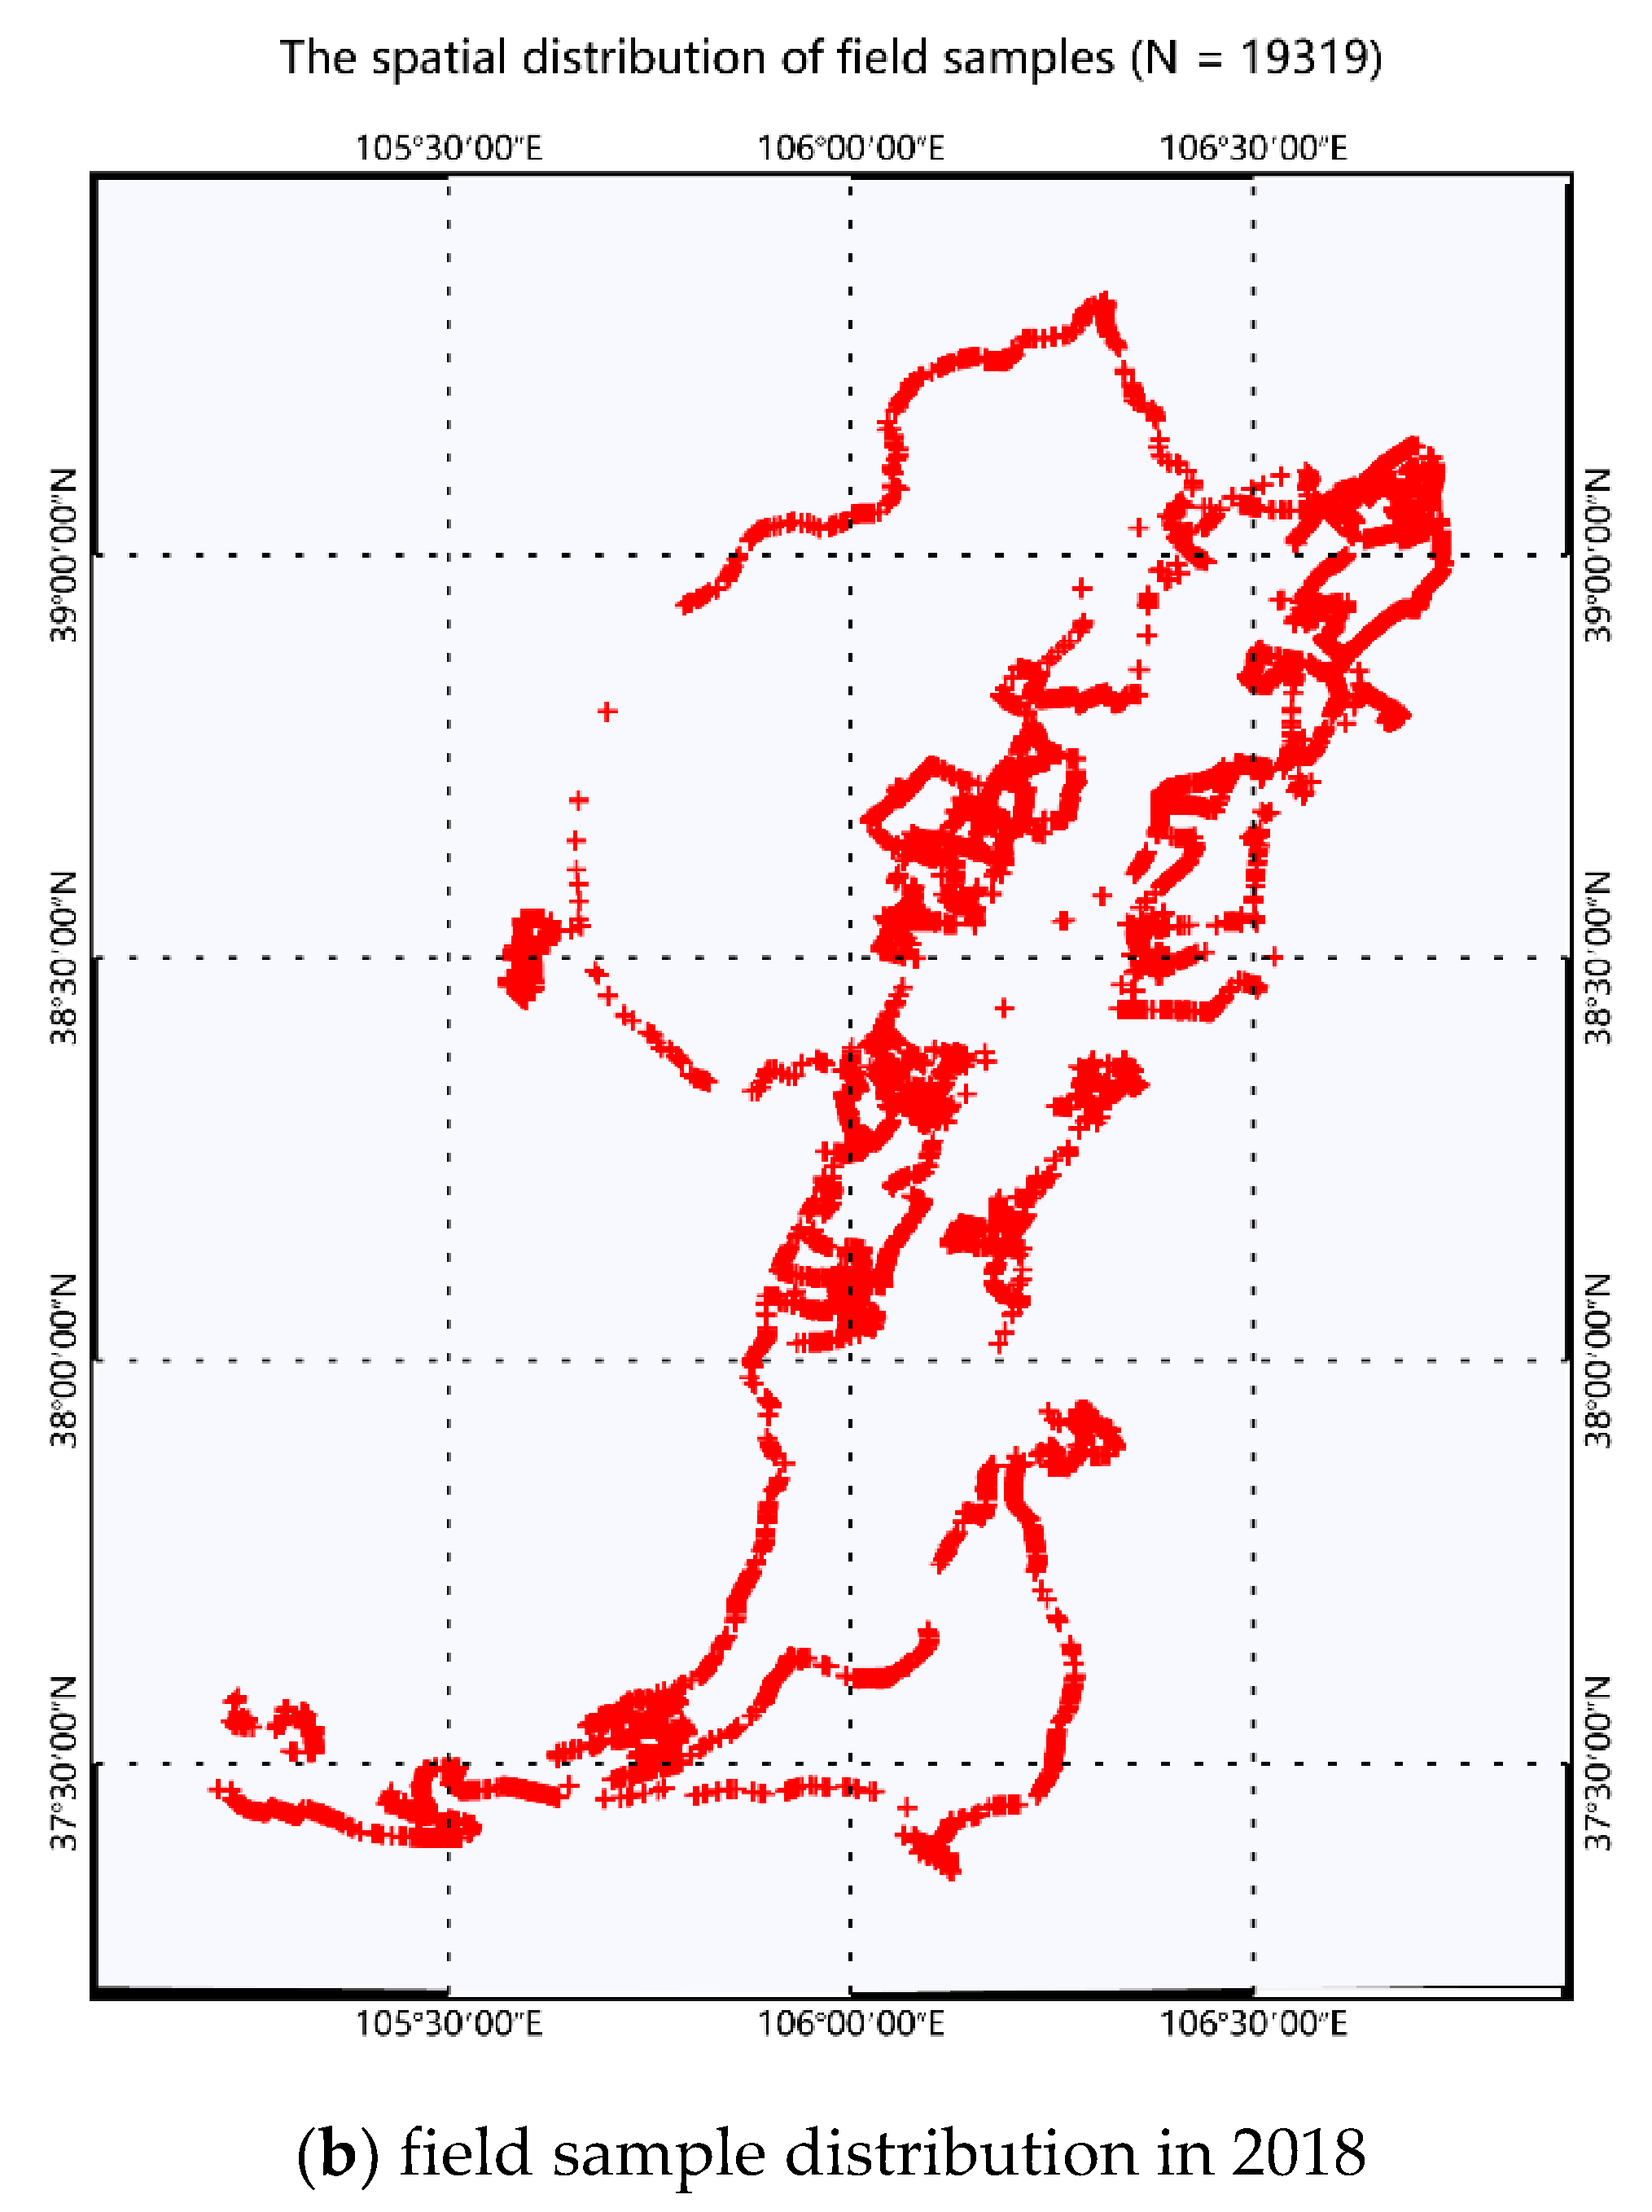
2.1.2. Field Data and Training Samples
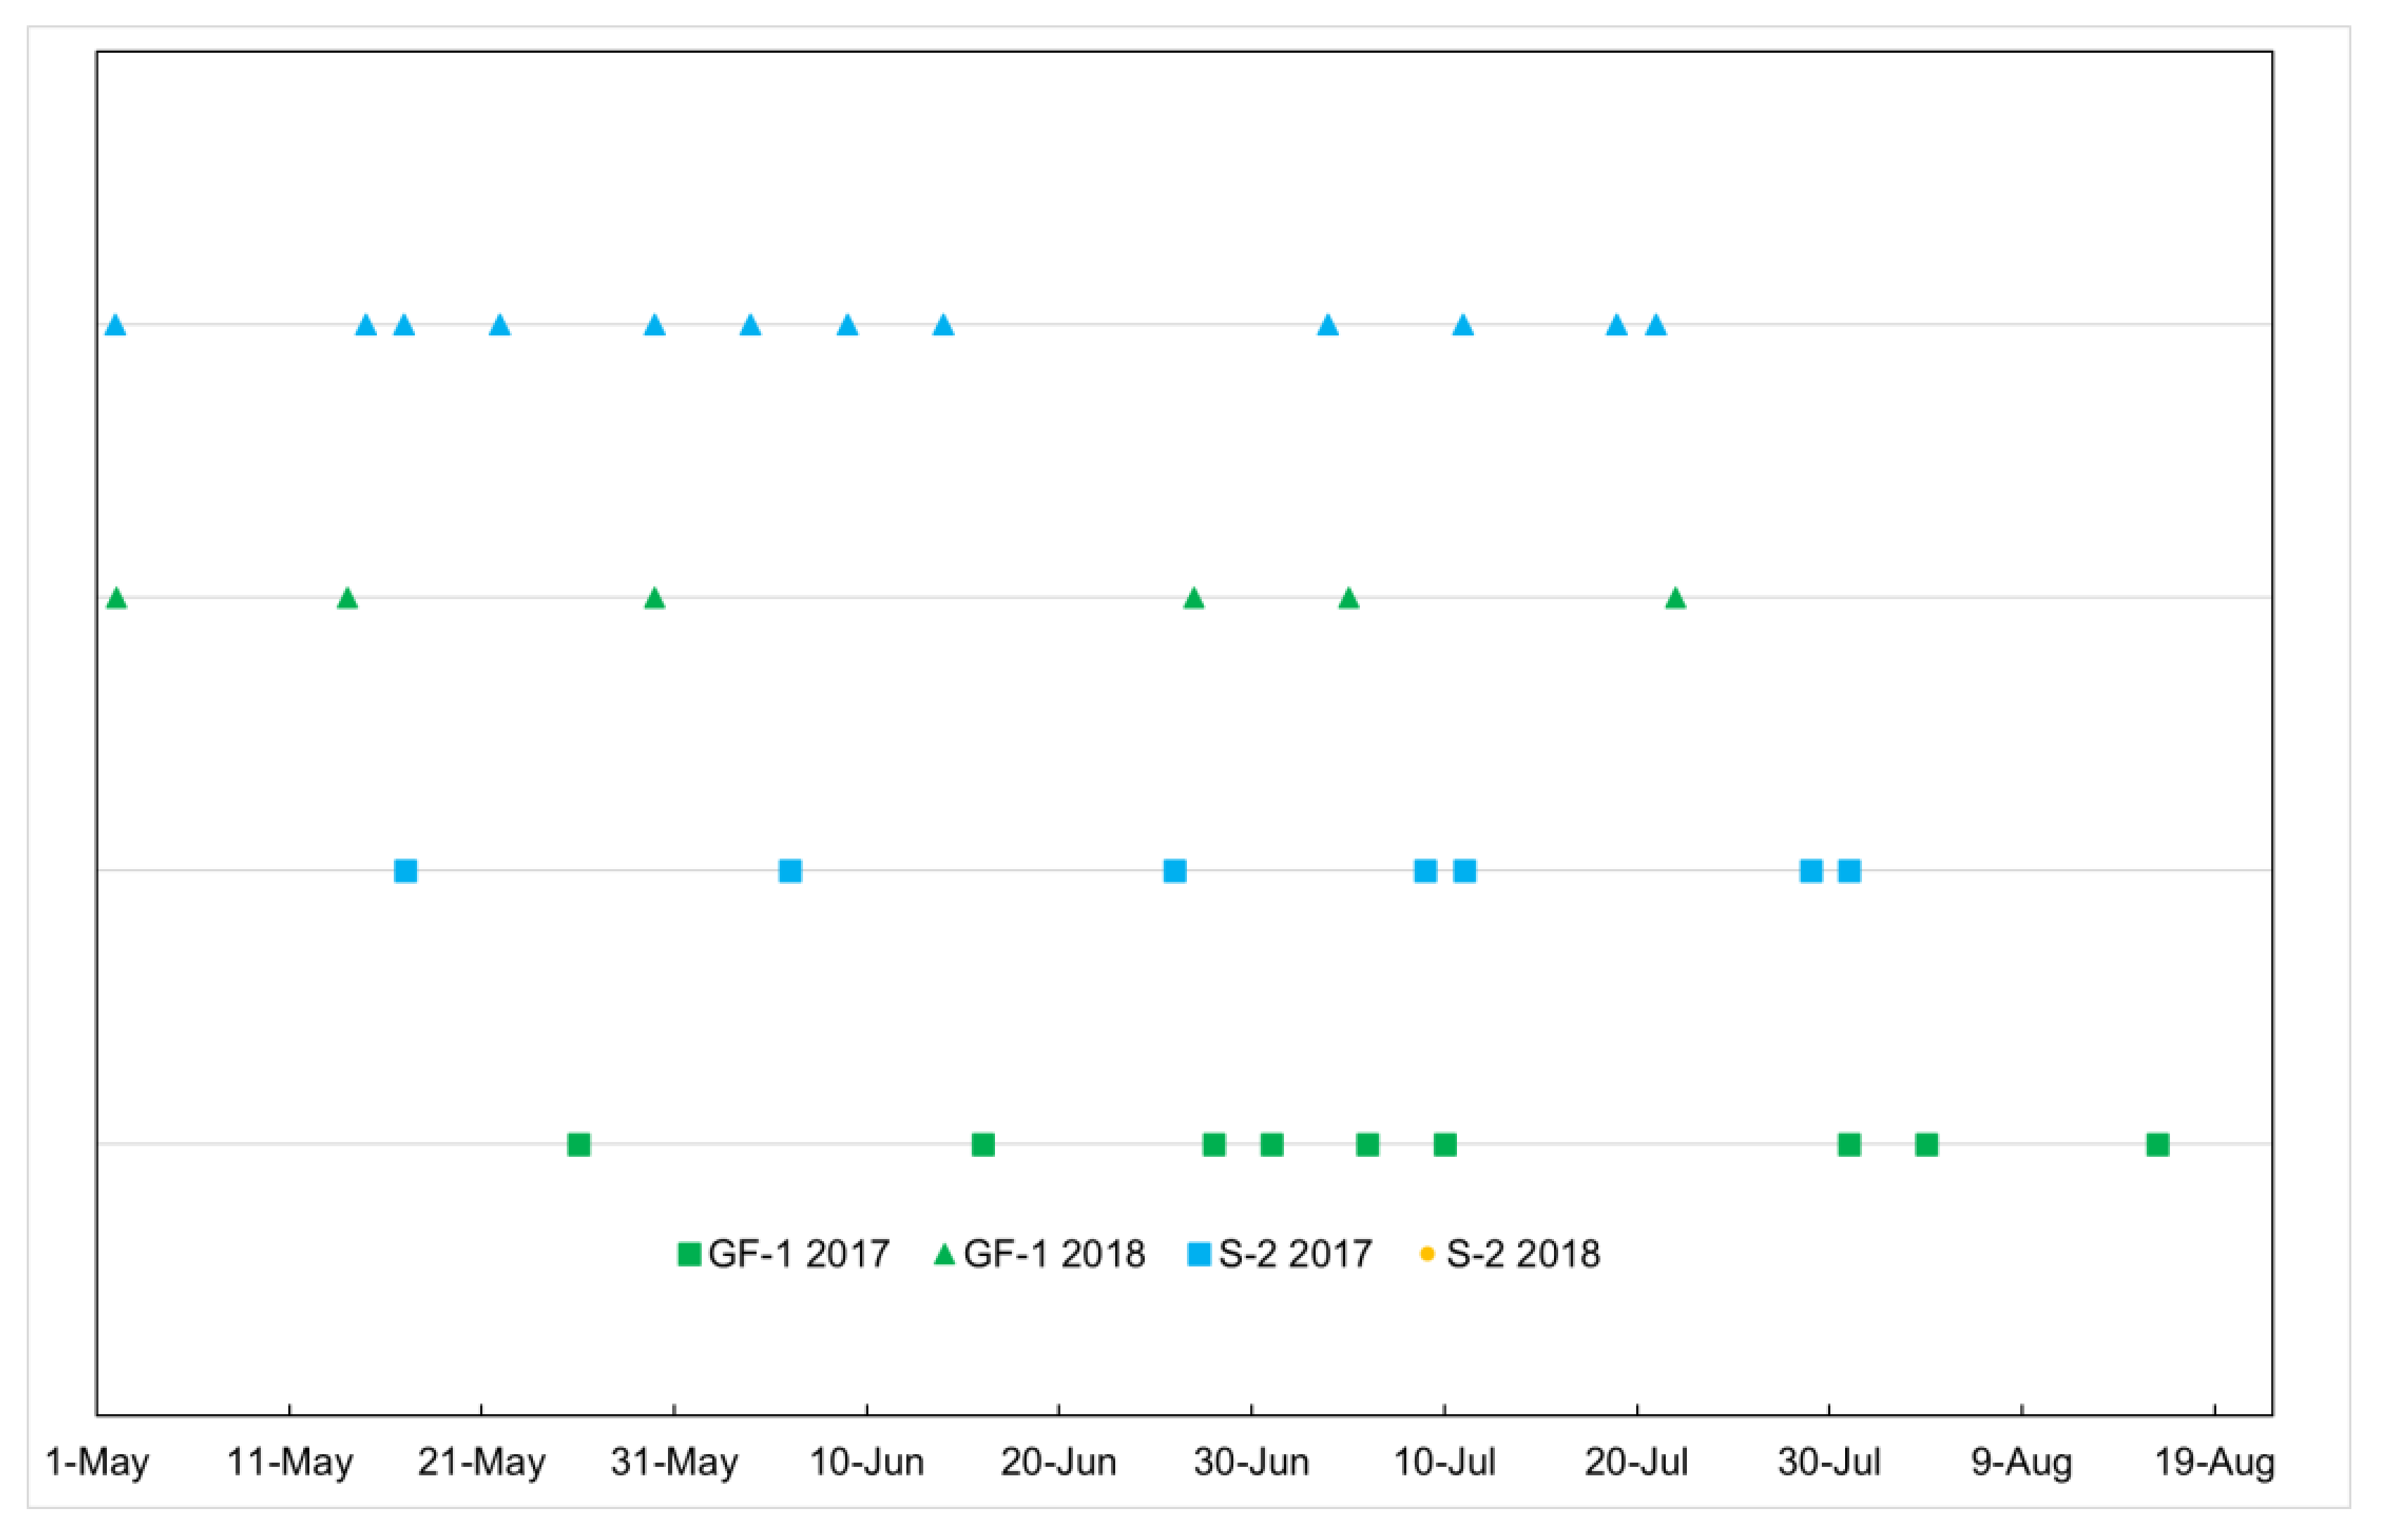
2.1.3. Satellite Data
2.1.4. Classification Algorithm
2.1.5. Validation Method
2.2. Medium Resolution Crop Mapping (Sub-Project 2)
2.2.1. Study Area
2.2.2. Field Data and Training Samples
2.2.3. Satellite Data
2.2.4. Classification Algorithm and Validation
3. Results and Analysis
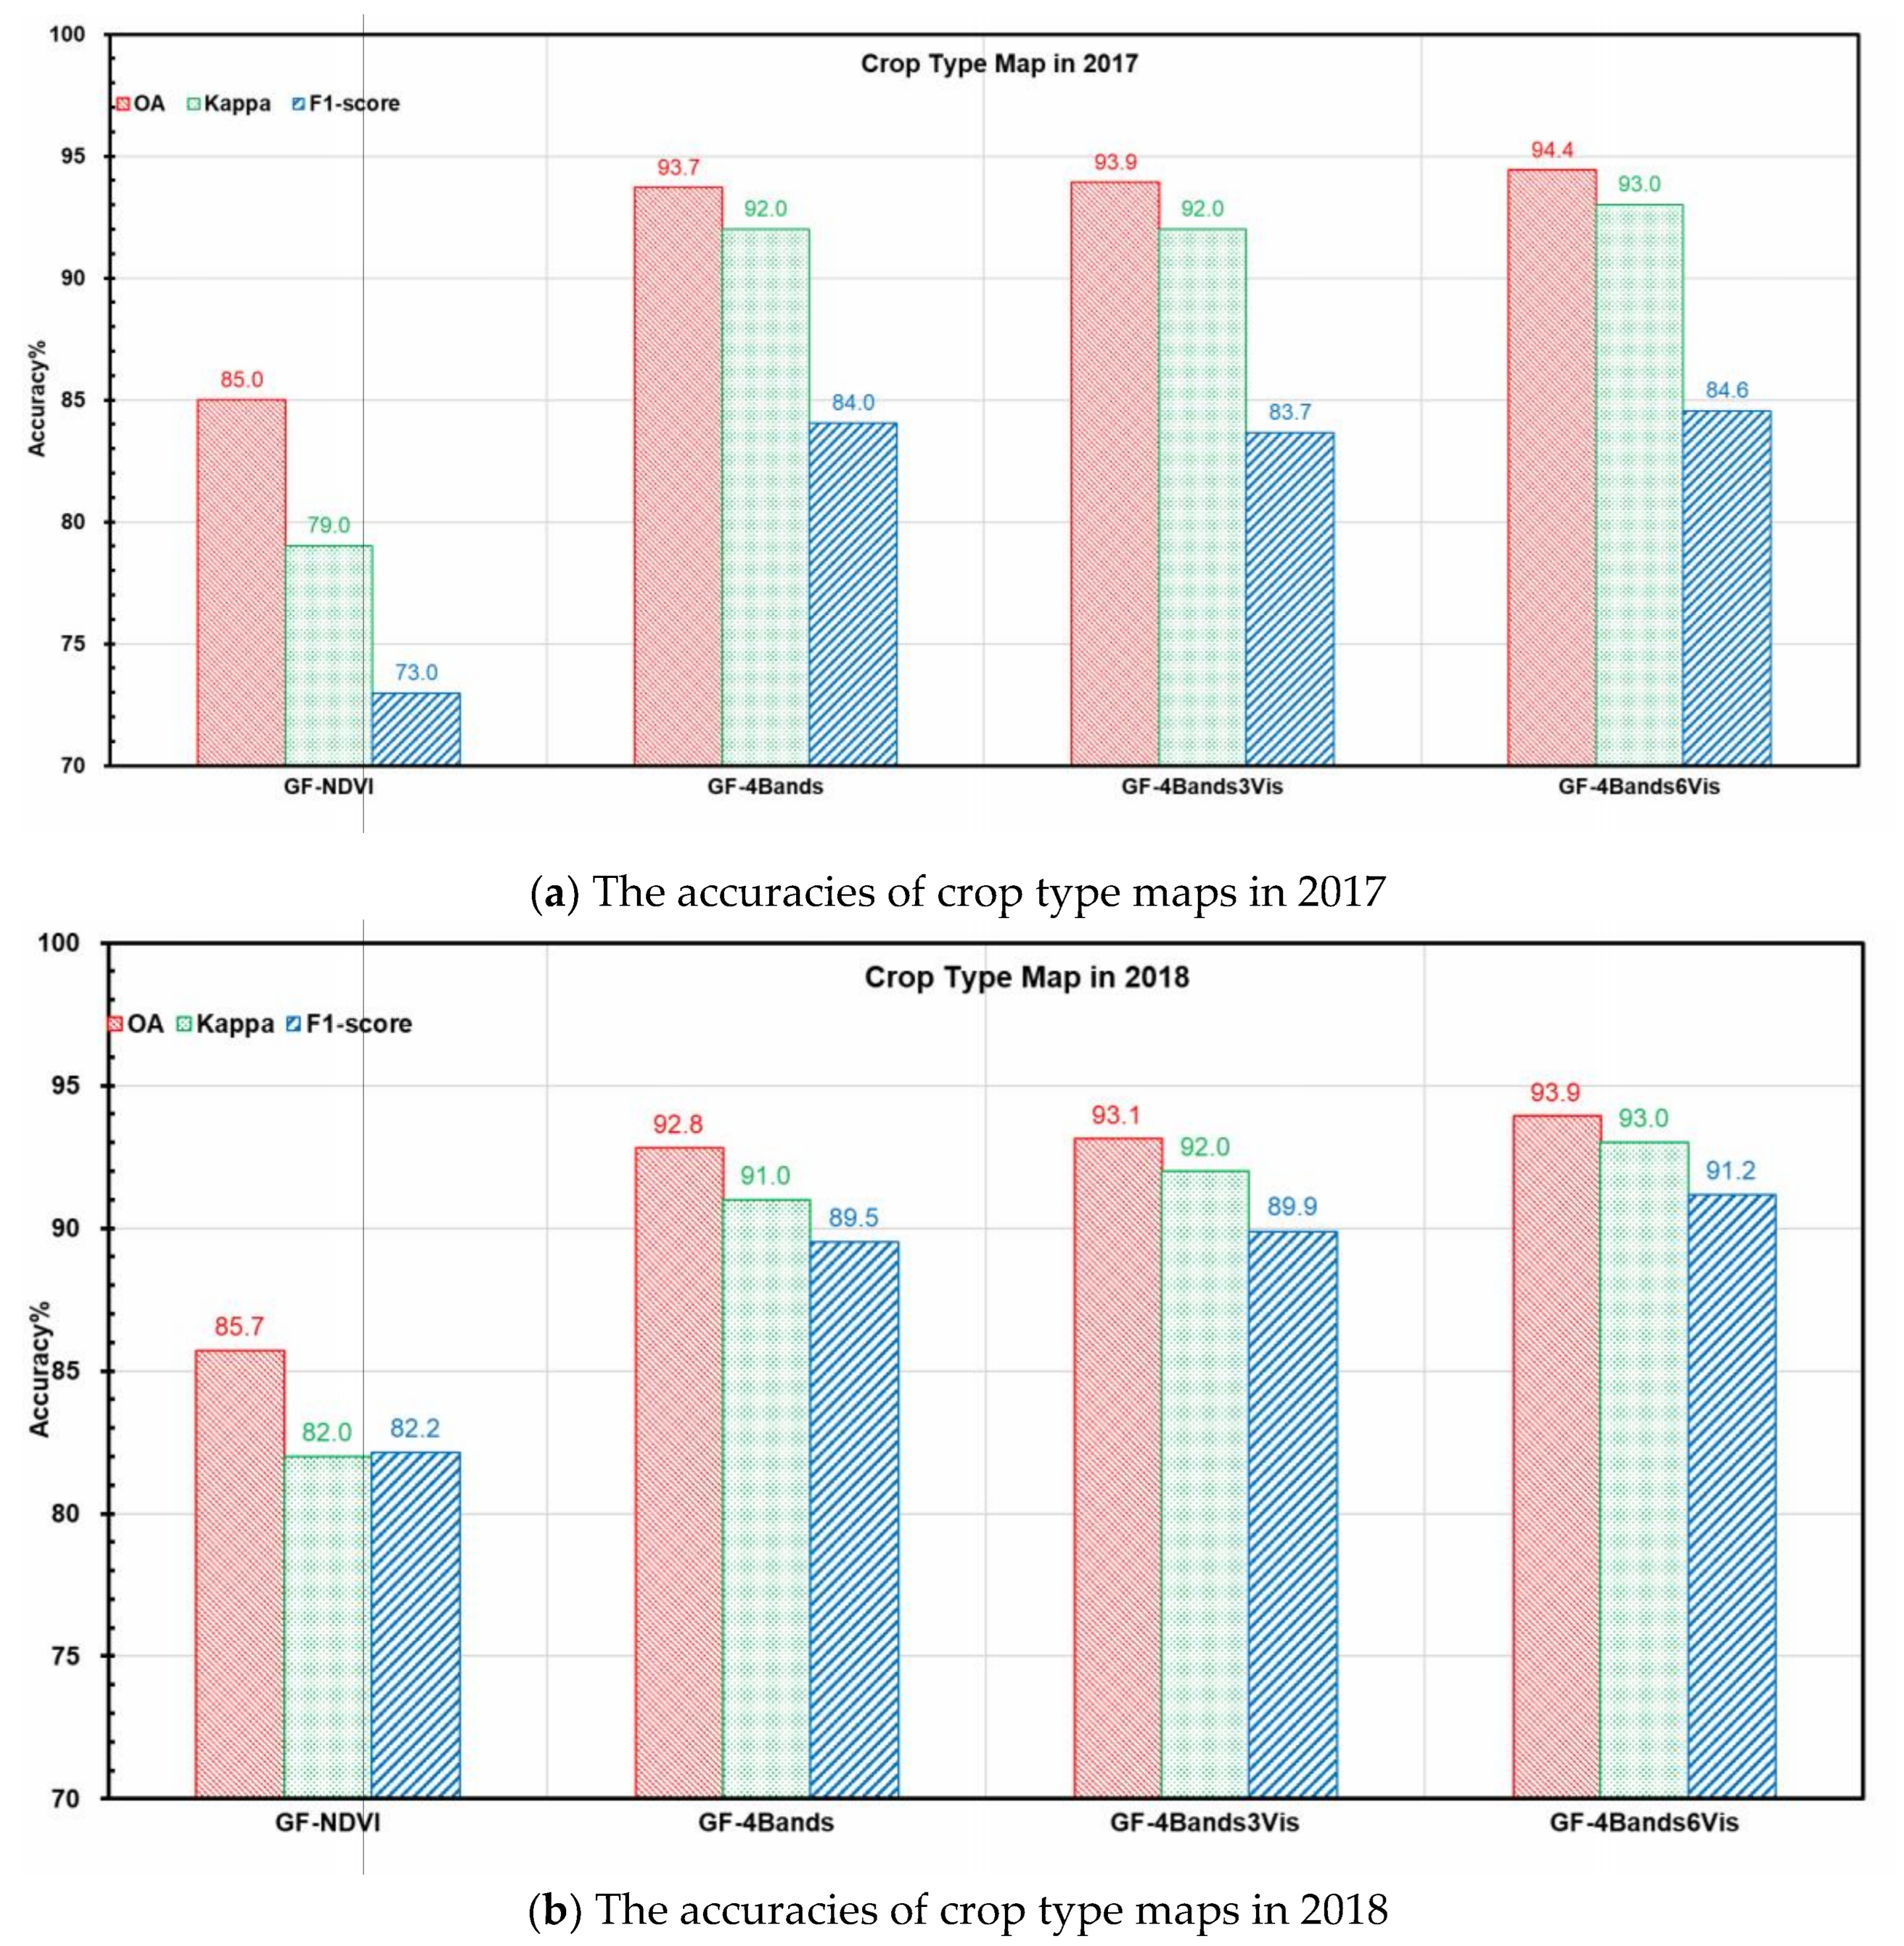
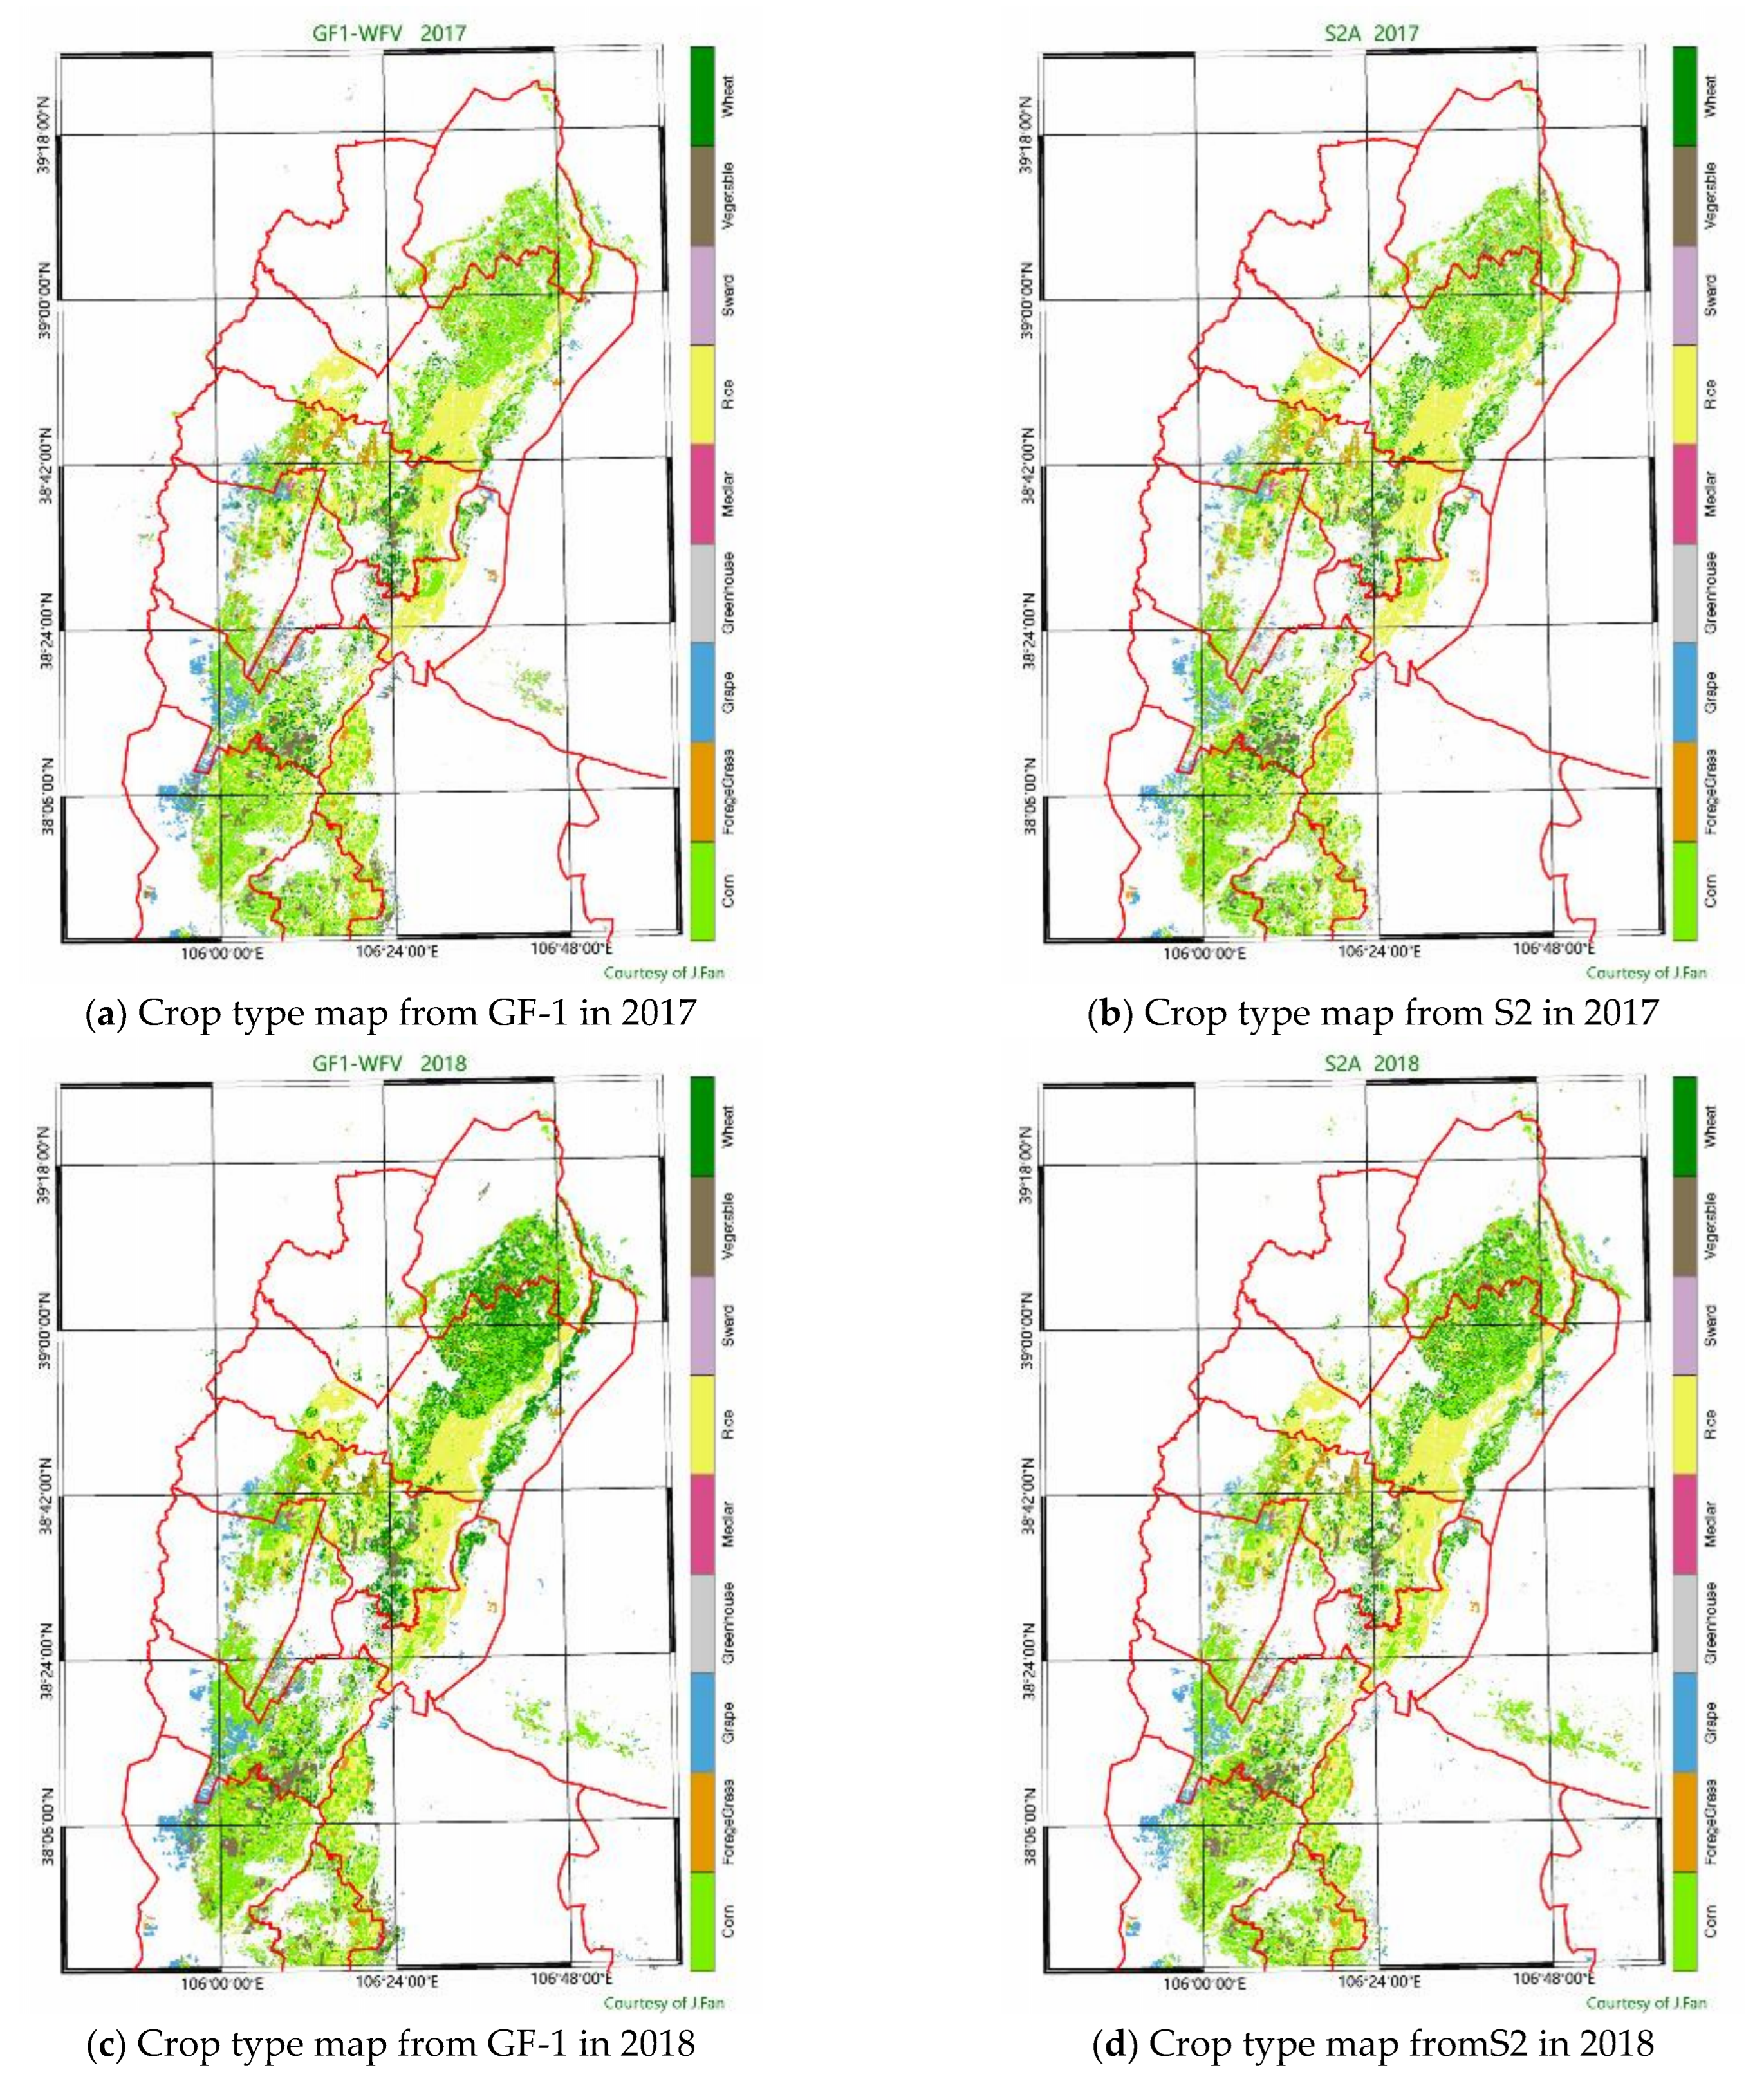
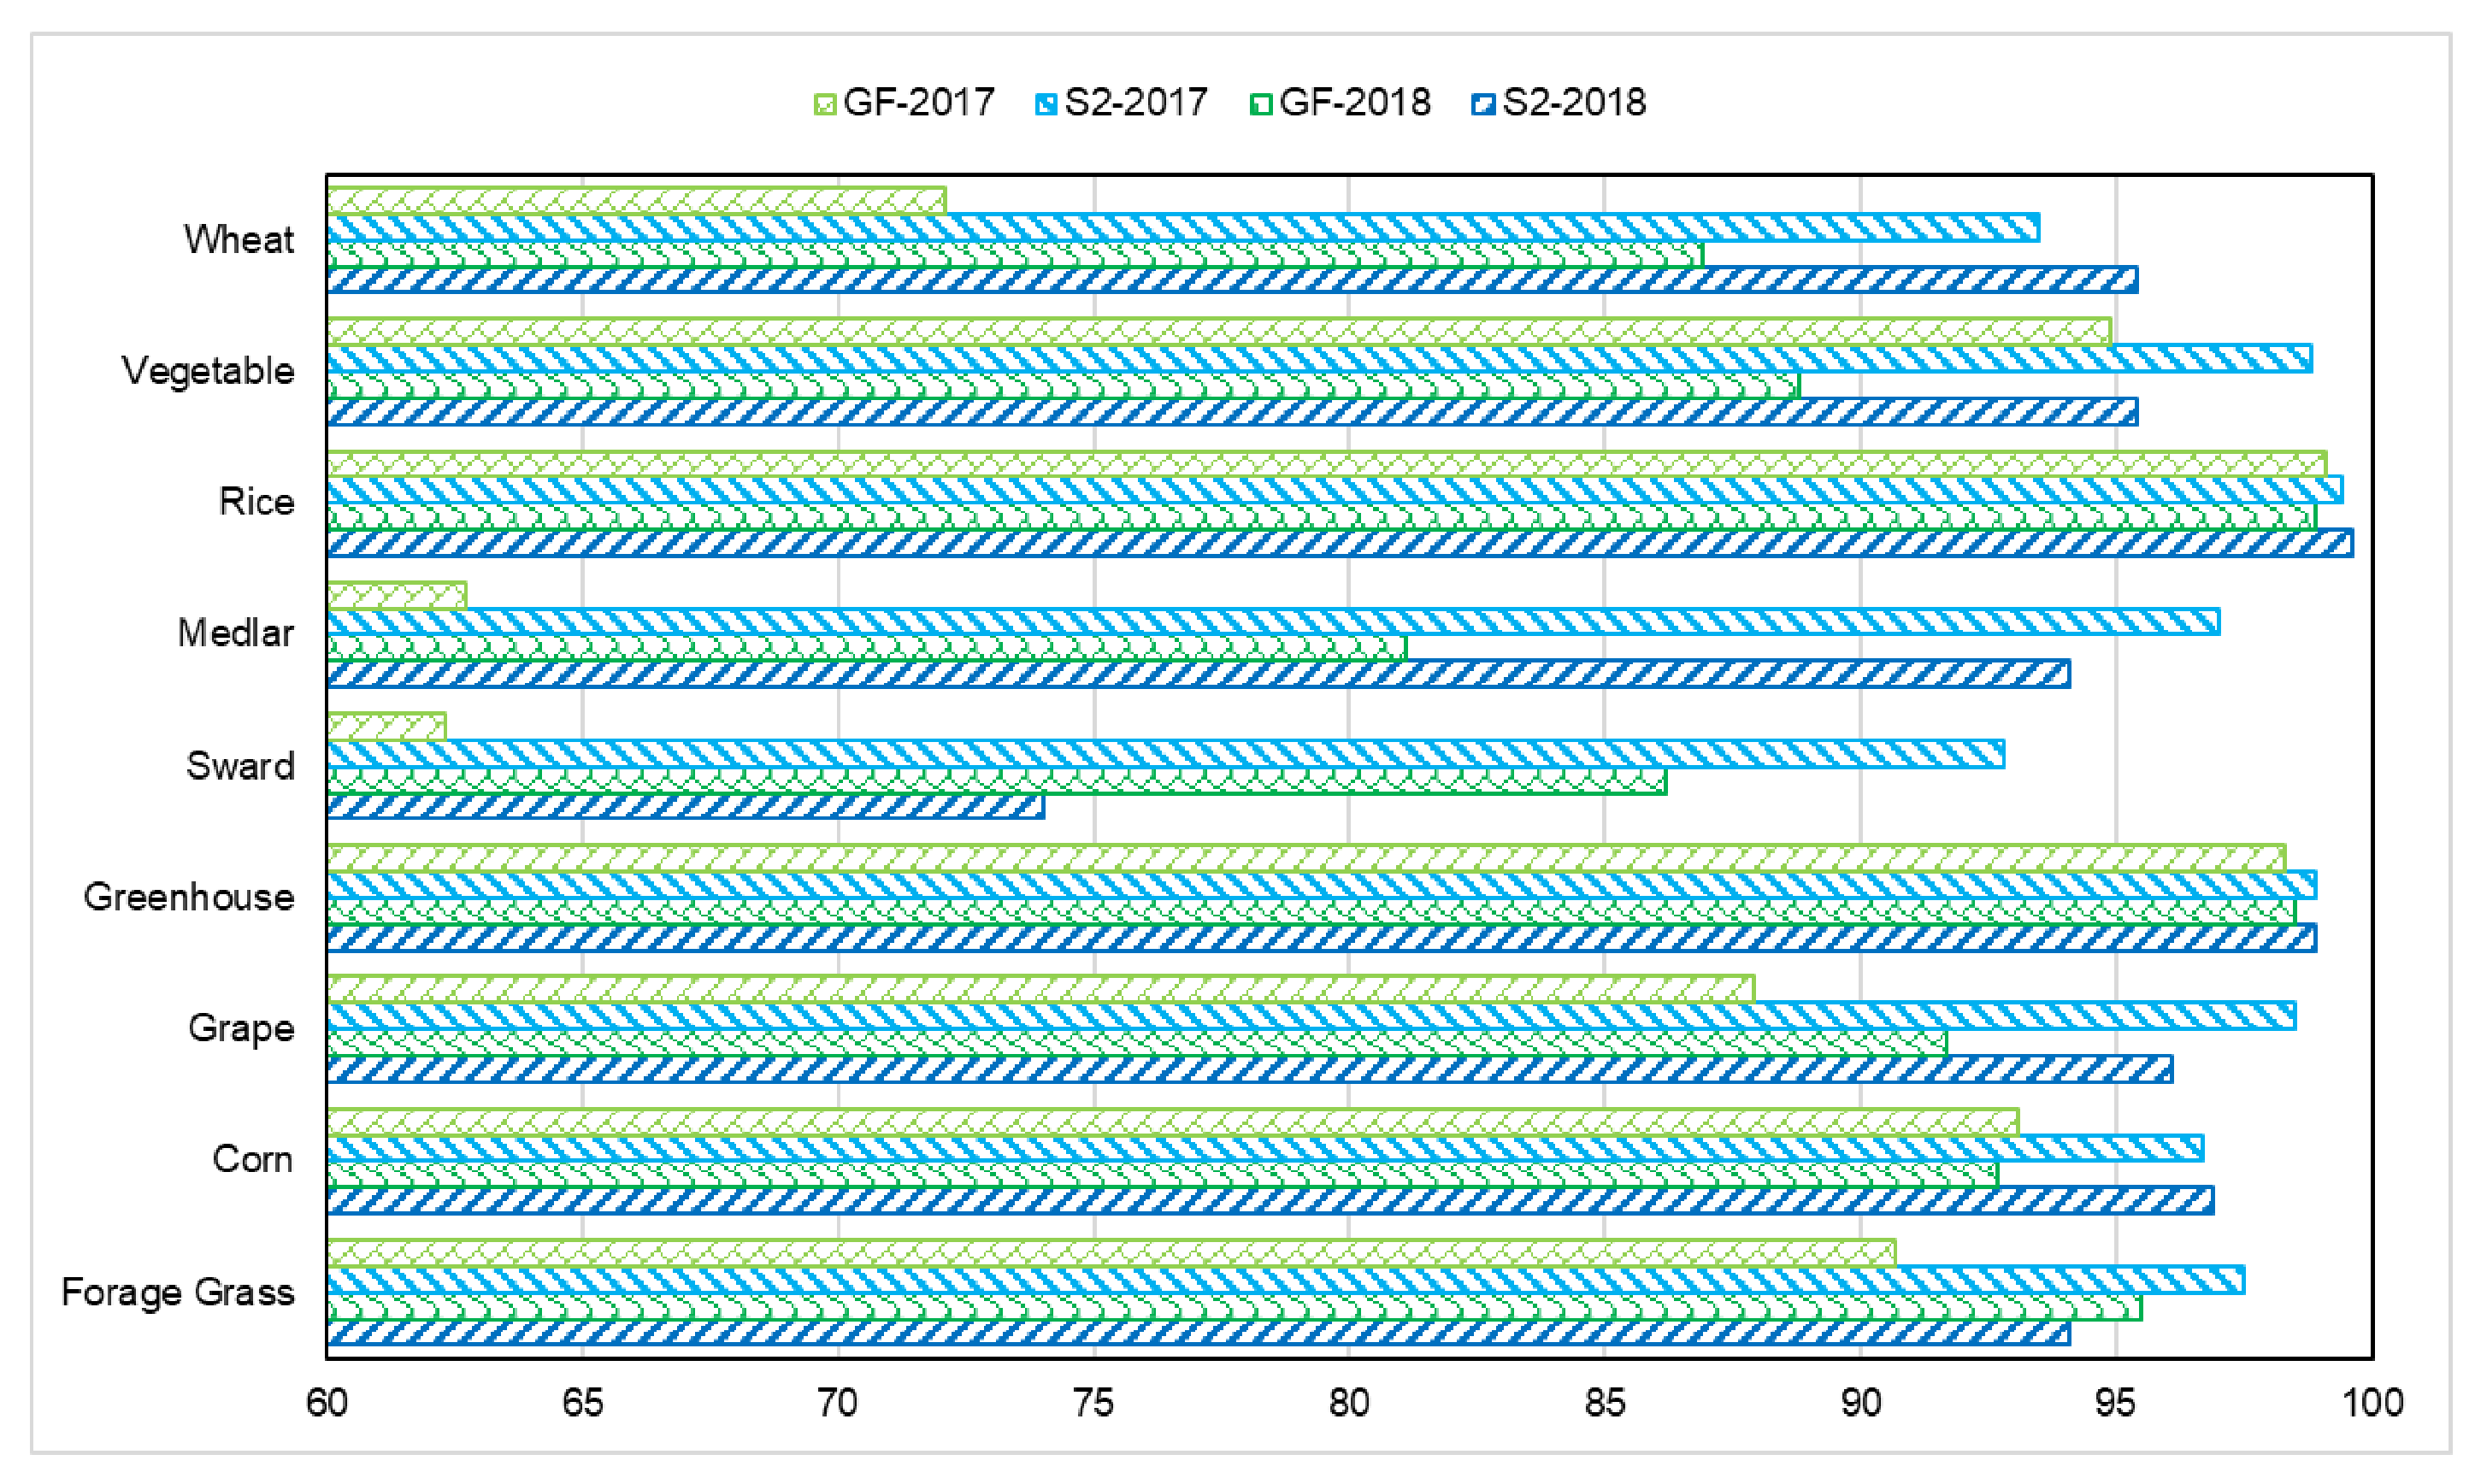
3.1. Crop Mapping with High-Resolution Sentinel-2 and Gaofen-1
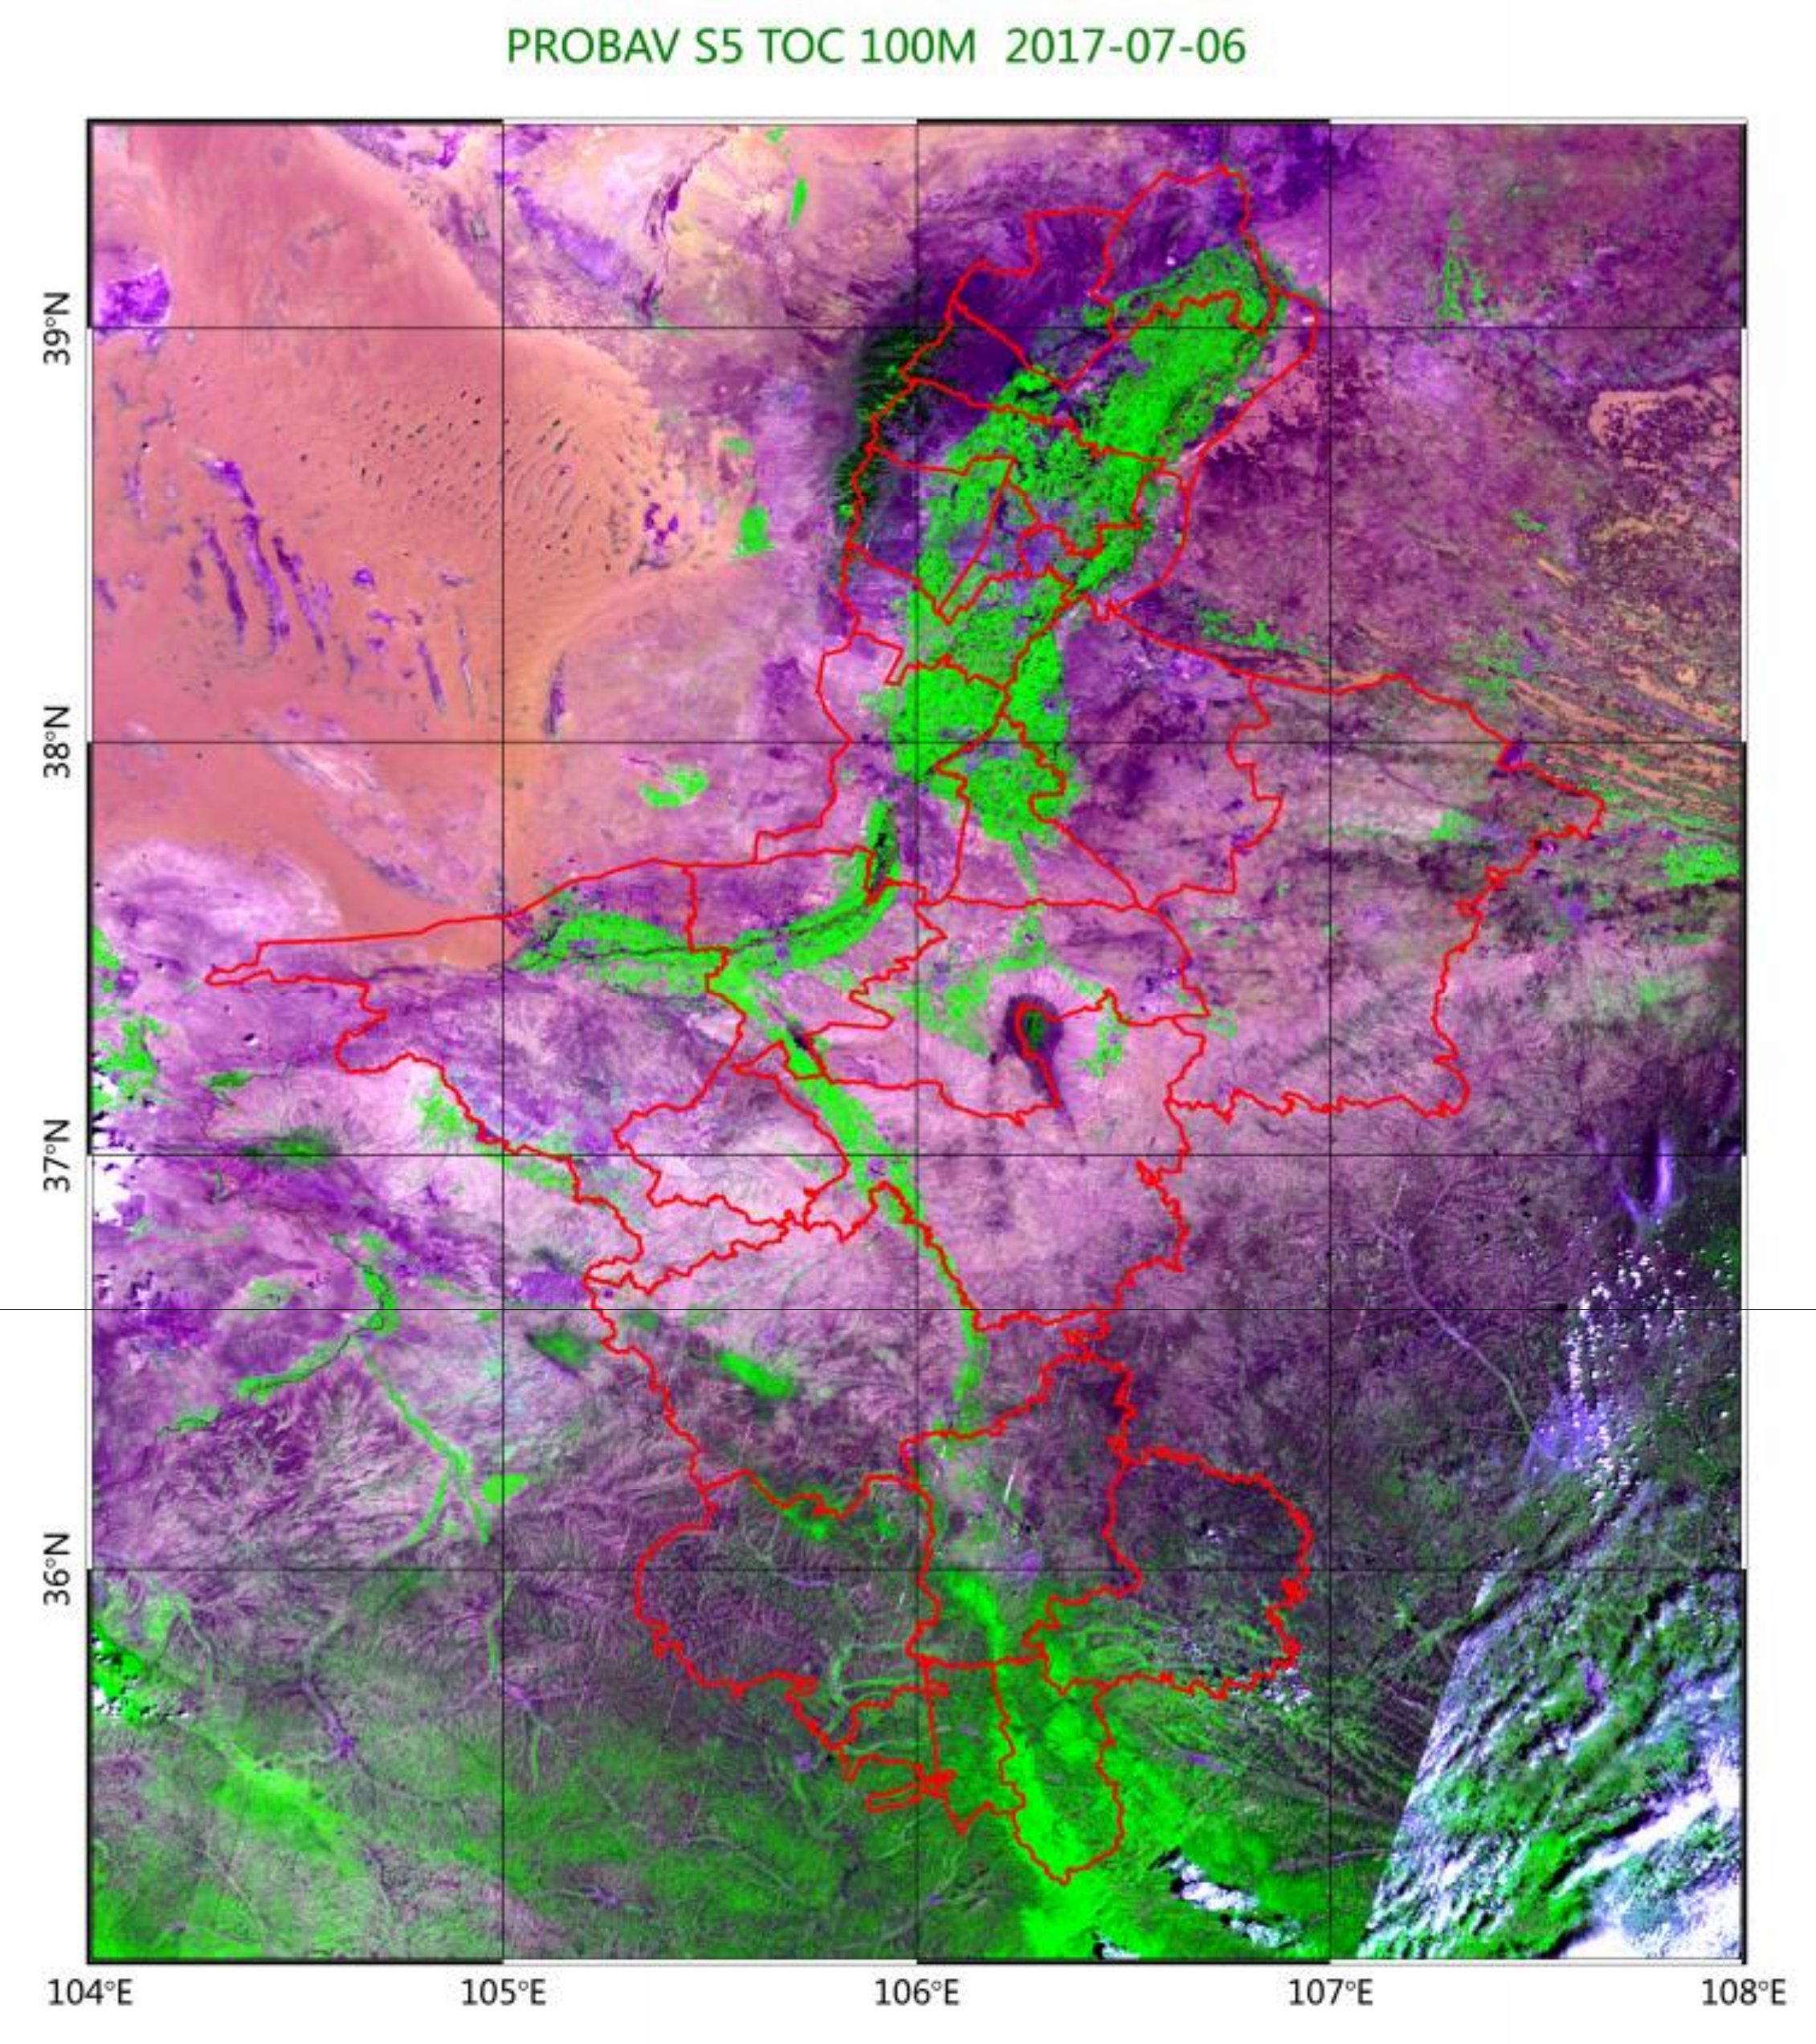
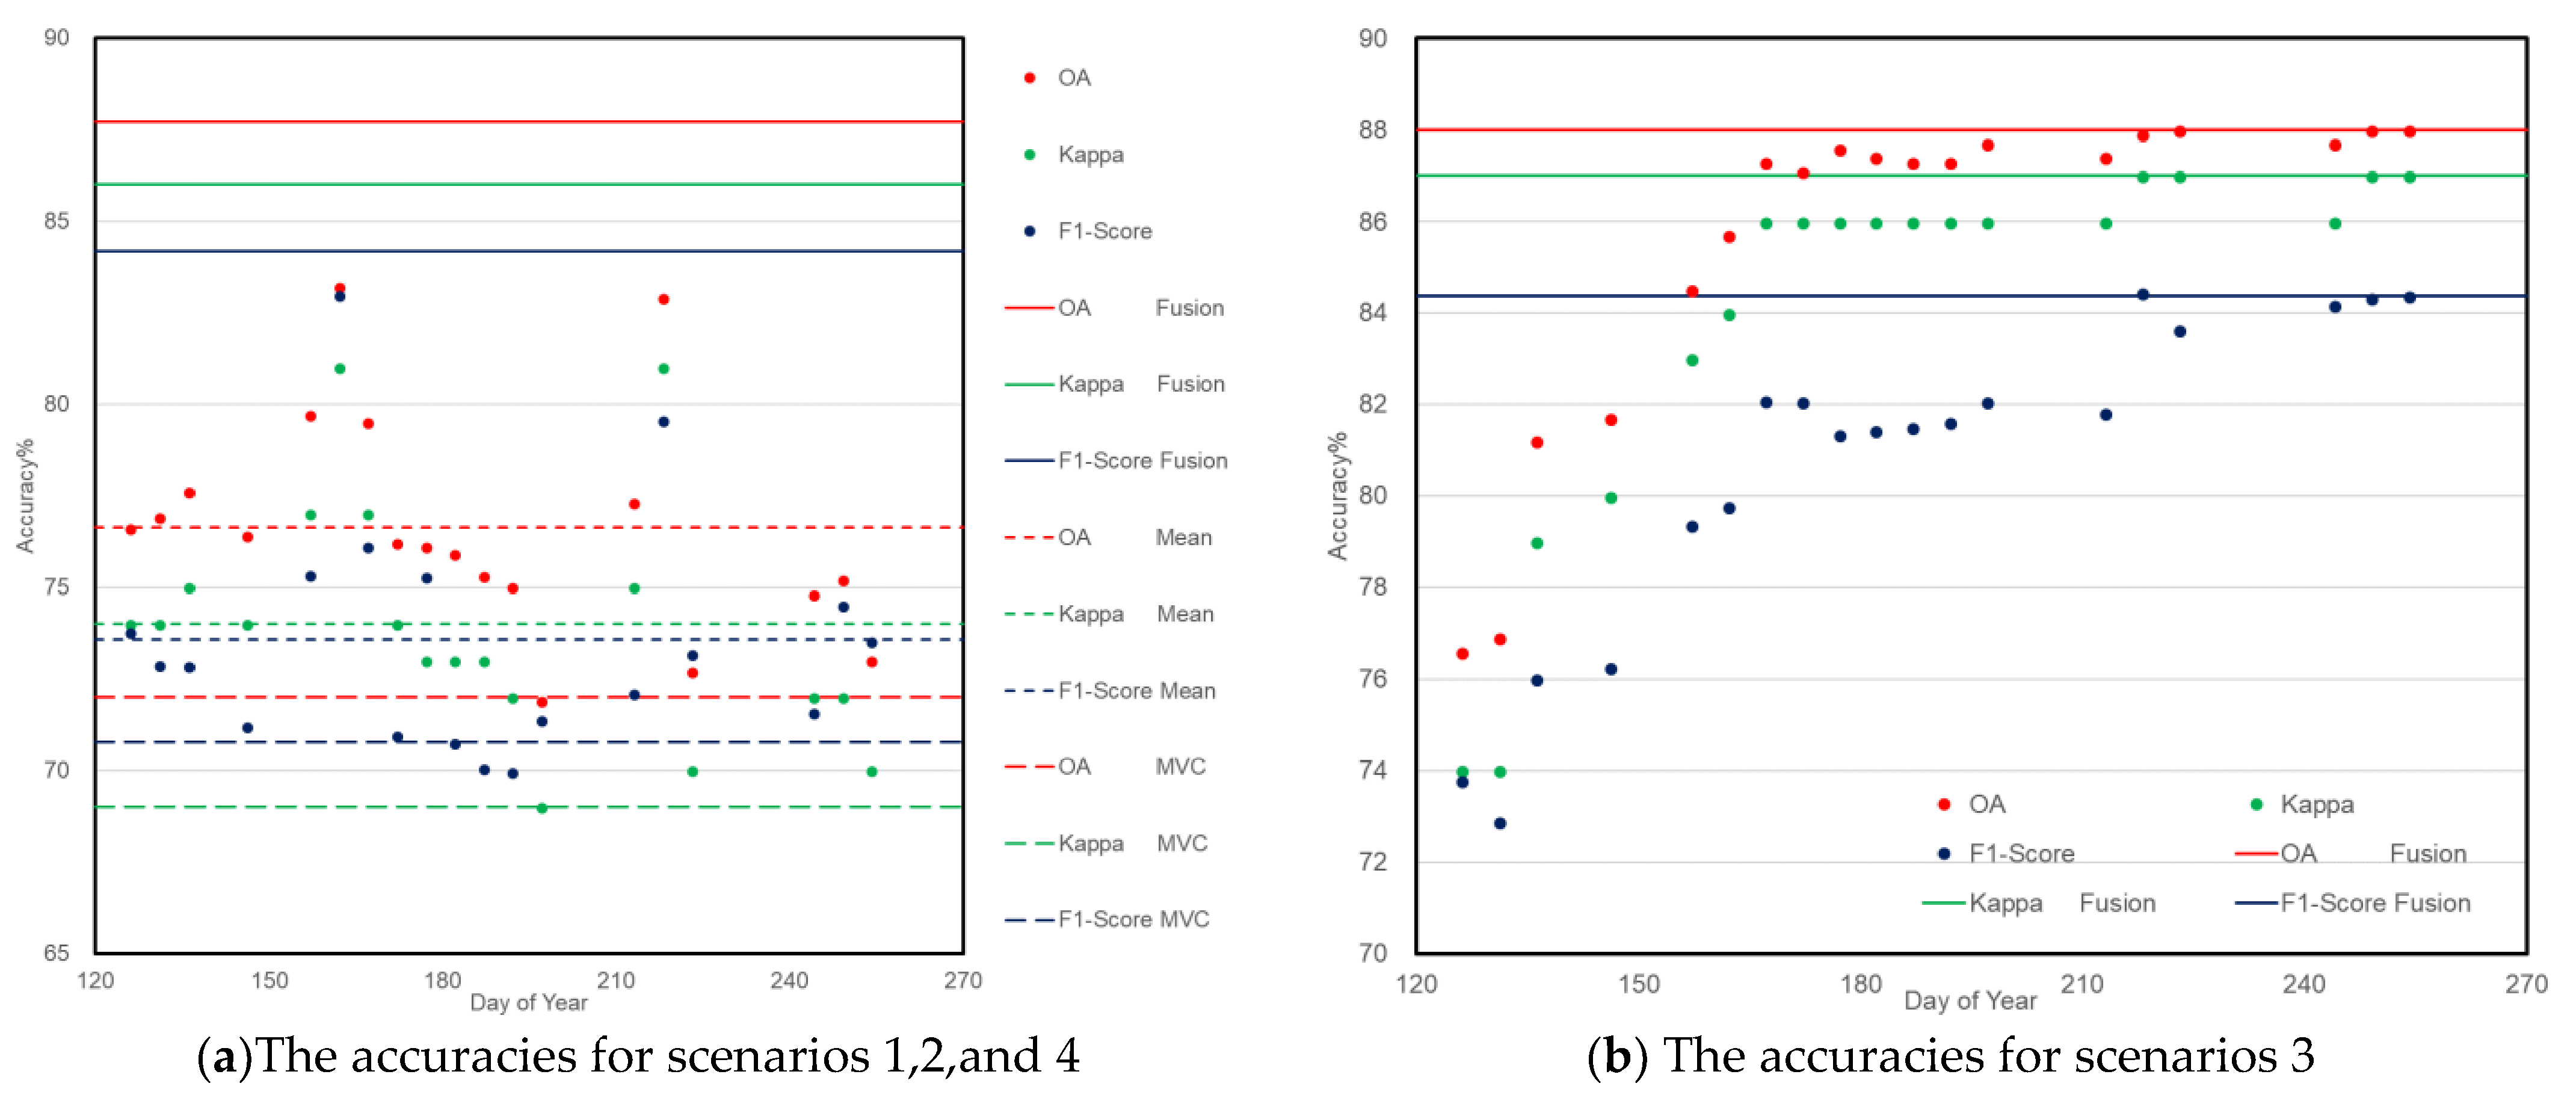
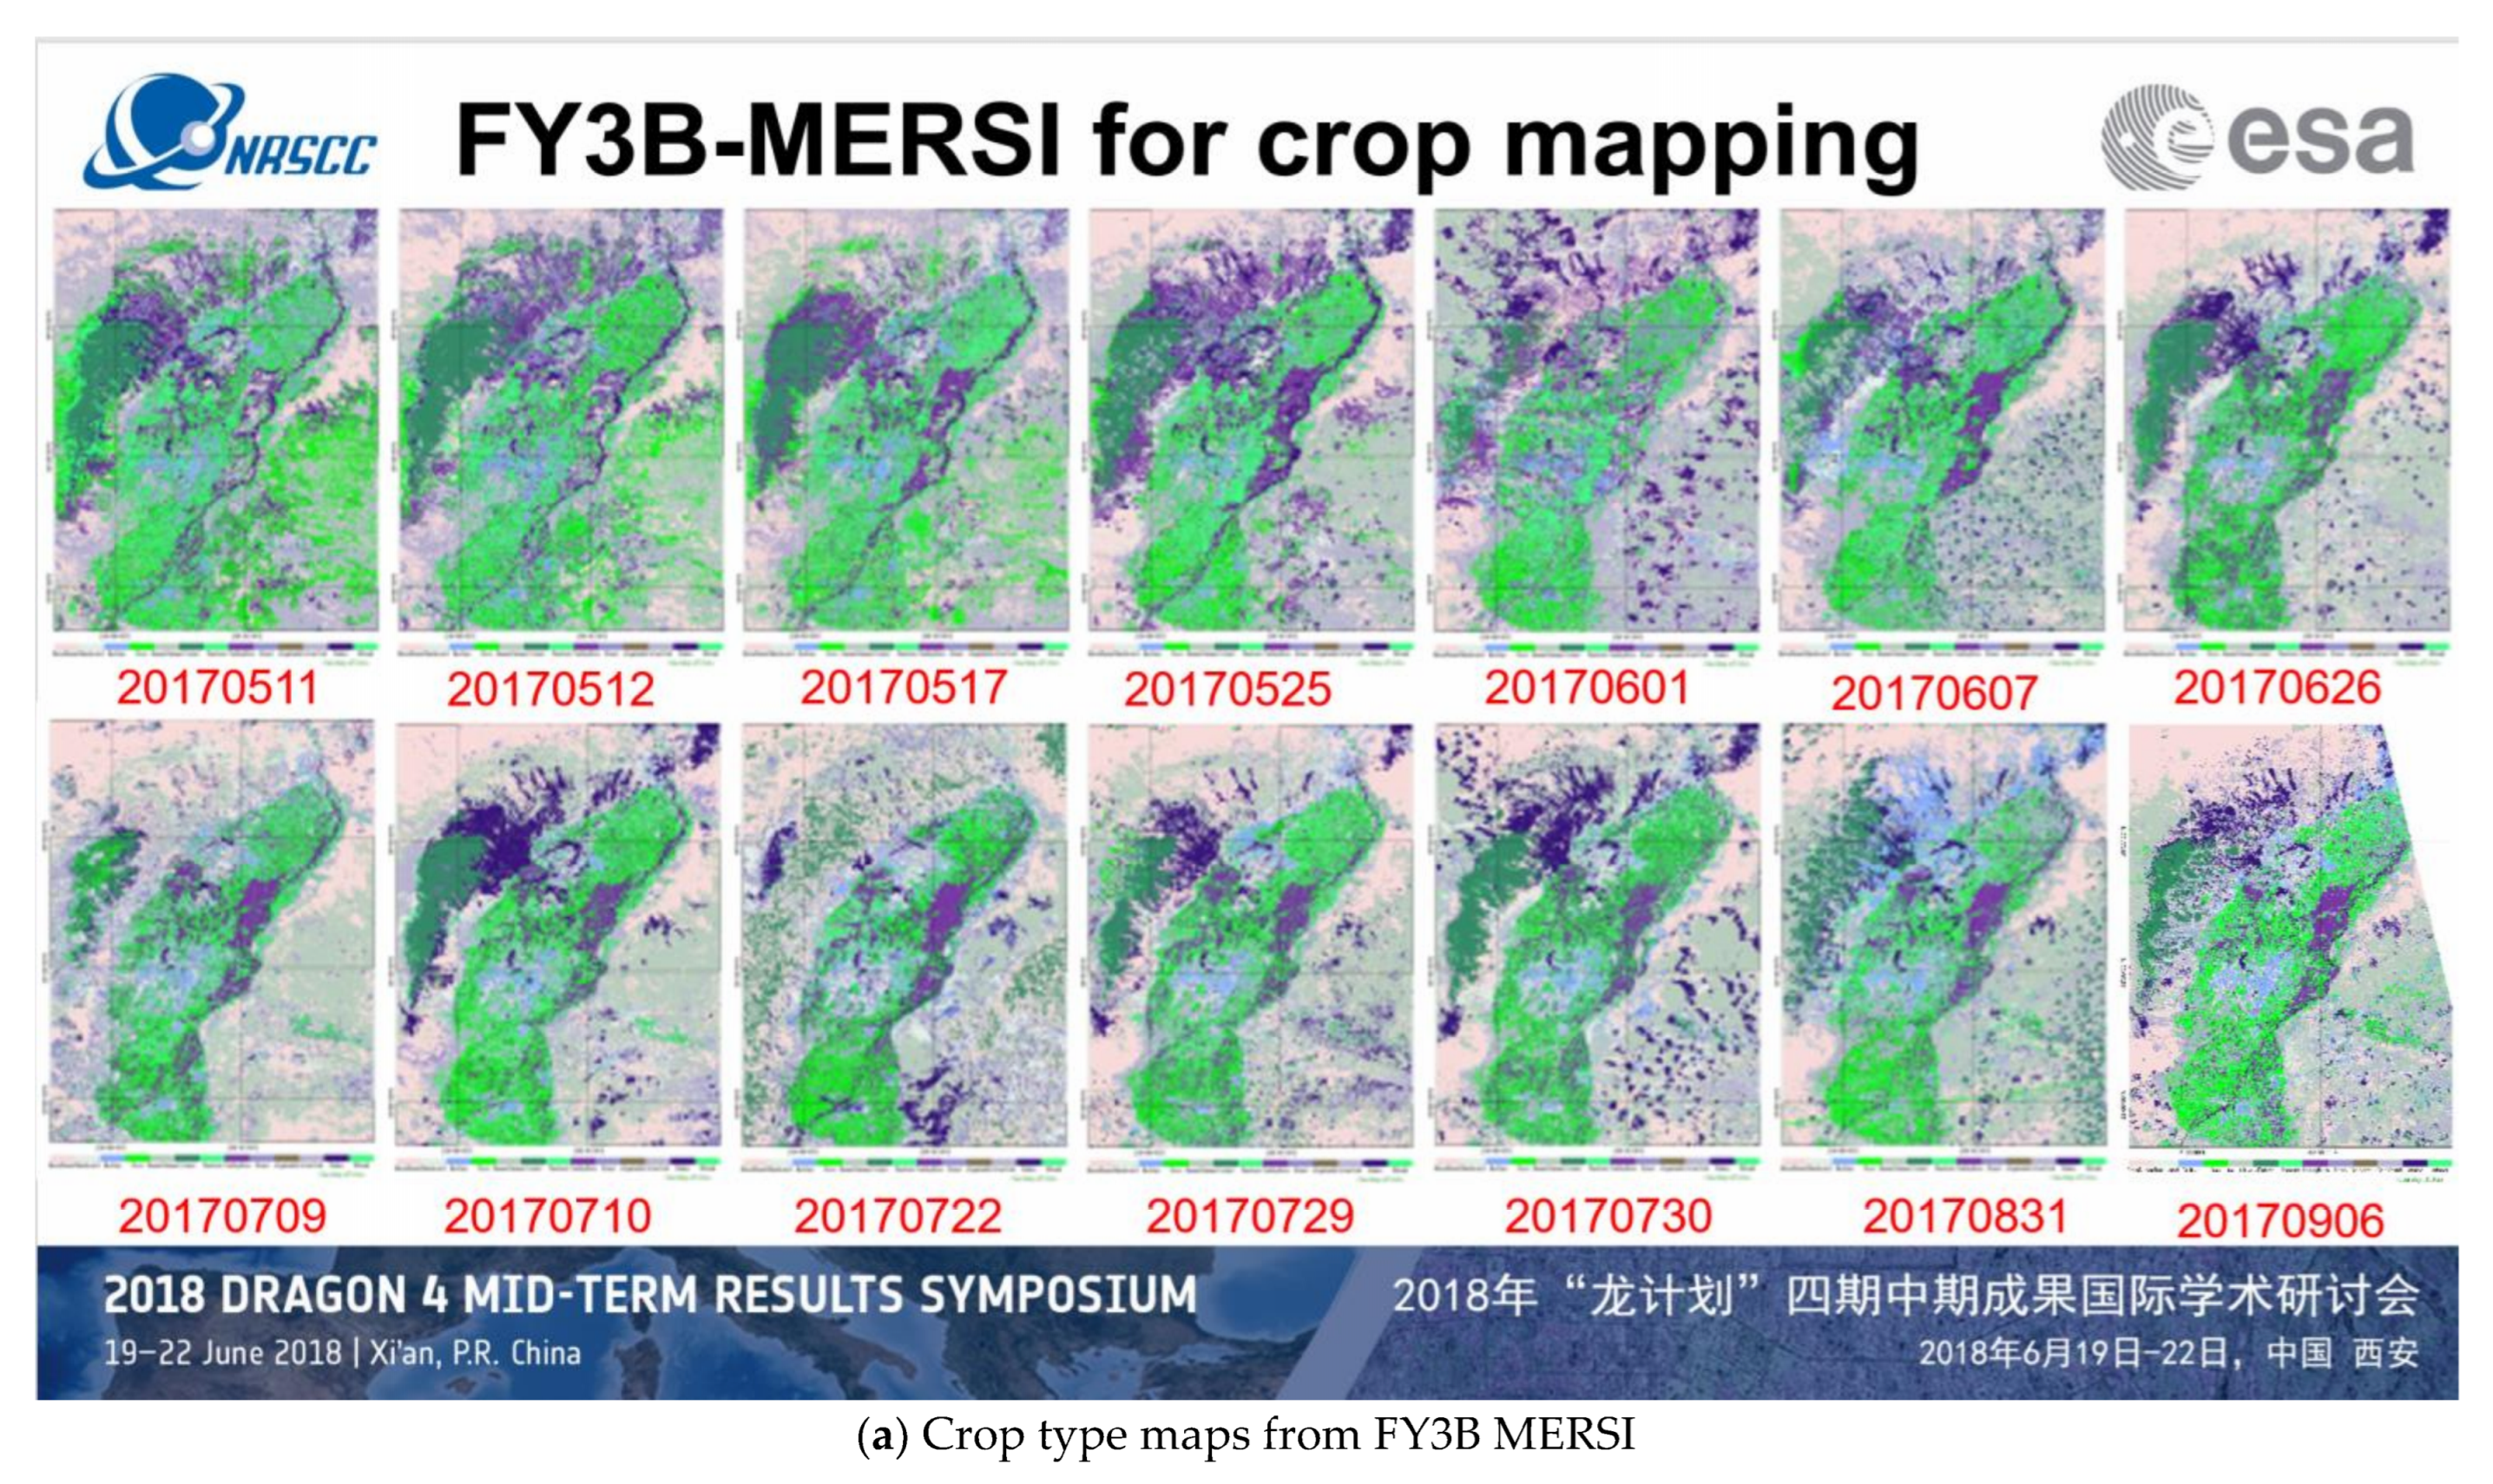
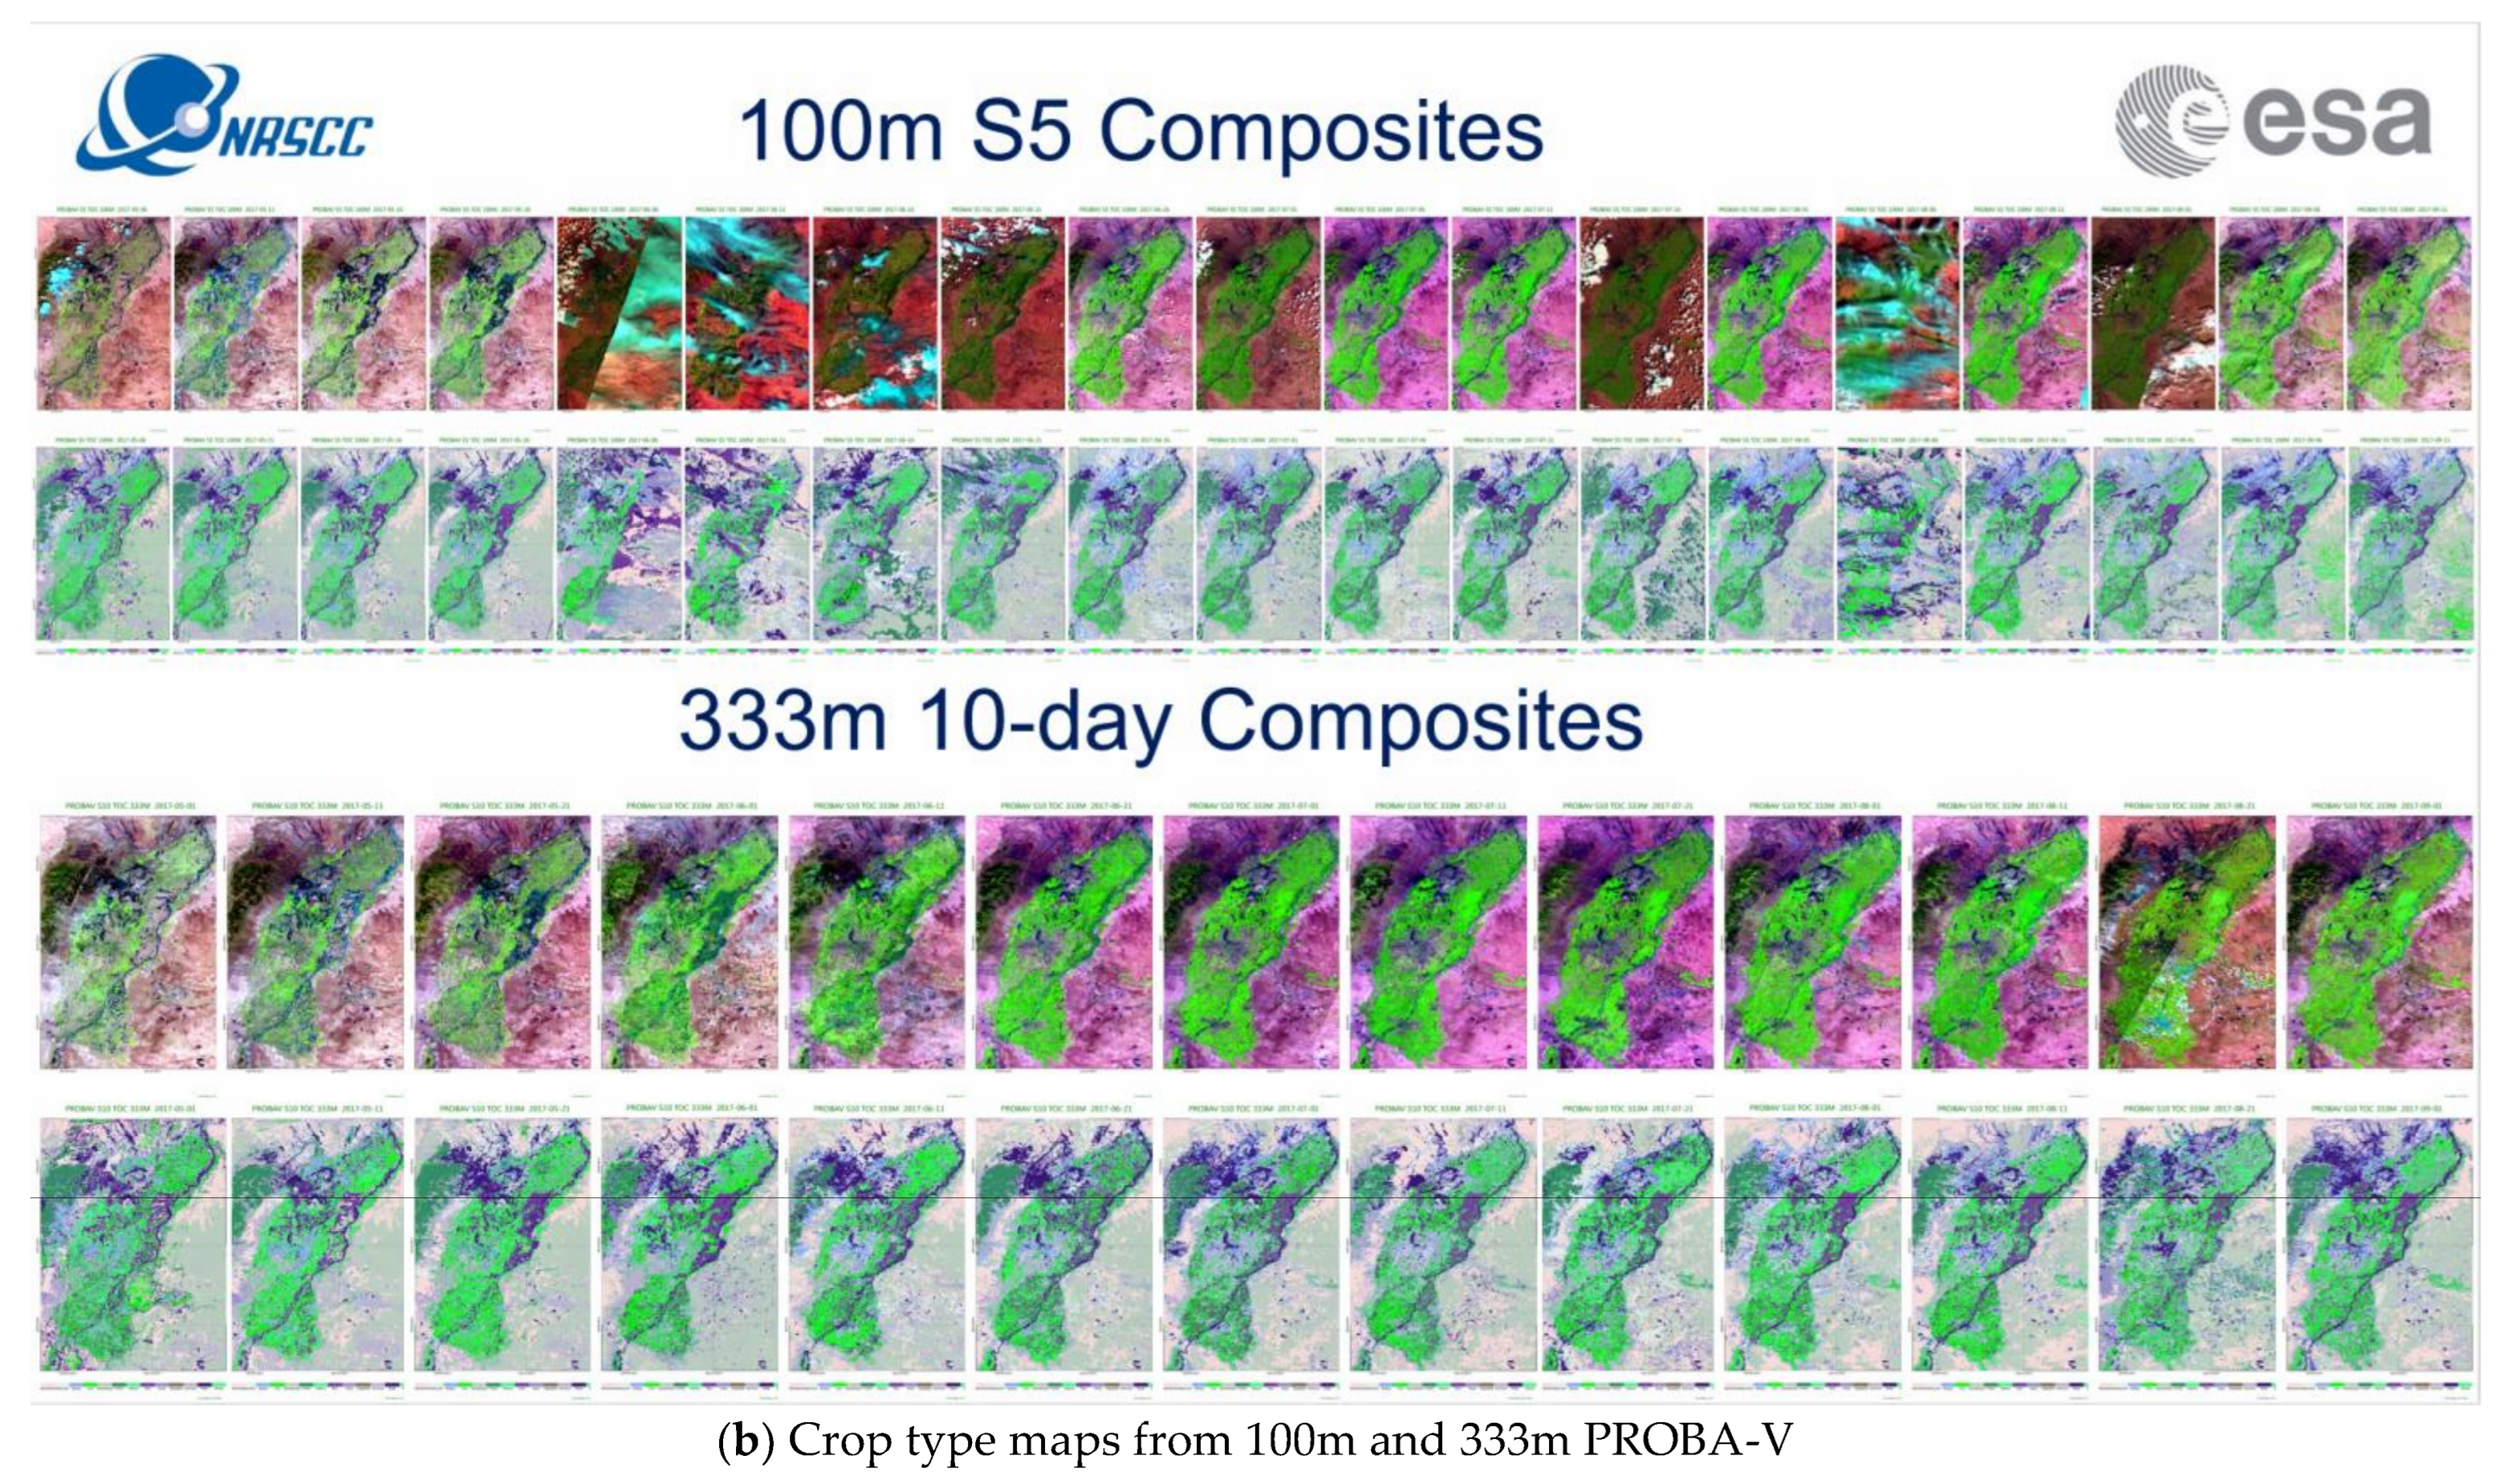
3.2. Crop Mapping with Medium Resolution PROBA-V and FY-3 MERSI
4. Discussion
5. Conclusions
Author Contributions
Funding
Acknowledgments
Conflicts of Interest
References
- Defourny, P.; Bontemps, S.; Bellemans, N.; Cara, C.; Dedieu, G.; Guzzonato, E.; Hagolle, O.; Inglada, J.; Nicola, L.; Rabaute, T.; et al. Near real-time agriculture monitoring at national scale at parcel resolution: Performance assessment of the Sen2-Agri automated system in various cropping systems around the world. Remote Sens. Environ. 2019, 221, 551–568. [Google Scholar] [CrossRef]
- Zhao, S.H.; Wang, Q.; Yang, Y.P.; Zhu, L.; Wang, Z.T.; Jiang, D. The demonstration research of GF-1 satellite data monitoring environment application. Satell. Appl. 2015, 3, 37–40. [Google Scholar]
- Griffiths, P.; Nendel, C.; Hostert, P. Intra-annual reflectance composites from sentinel-2 and Landsat for national-scale crop and land cover mapping. Remote Sens. Environ. 2019, 220, 135–151. [Google Scholar] [CrossRef]
- Fan, J.; Zhang, X.; Zhao, C.; Qin, Z.; De Vroey, M.; Defourny, P. Evaluation of Crop Type Classification with Different High Resolution Satellite Data Sources. Remote Sens. 2021, 13, 911. [Google Scholar] [CrossRef]
- Meng, S.; Zhong, Y.; Luo, C.; Hu, X.; Wang, X.; Huang, S. Optimal Temporal Window Selection for Winter Wheat and Rapeseed Mapping with Sentinel-2 Images: A Case Study of Zhongxiang in China. Remote Sens. 2020, 12, 226. [Google Scholar] [CrossRef] [Green Version]
- Song, Q.; Hu, Q.; Zhou, Q.; Hovis, C.; Xiang, M.; Tang, H.; Wu, W. In-Season Crop Mapping with GF-1/WFV Data by Combining Object-Based Image Analysis and Random Forest. Remote Sens. 2017, 9, 1184. [Google Scholar] [CrossRef] [Green Version]
- Song, R.; Lin, H.; Wang, G.; Yan, E.; Ye, Z. Improving Selection of Spectral Variables for Vegetation Classification of East Dongting Lake, China, Using a Gaofen-1 Image. Remote Sens. 2018, 10, 50. [Google Scholar] [CrossRef] [Green Version]
- Li, H.; Wang, G.; Dong, Z.; Wei, X.; Wu, M.; Song, H.; Amankwah, S.O.Y. Identifying Cotton Fields from Remote Sensing Images Using Multiple Deep Learning Networks. Agronomy 2021, 11, 174. [Google Scholar] [CrossRef]
- Skakun, S.; Vermote, E.; Roger, J.C.; Franch, B. Combined use of Landsat-8 and Sentinel-2A images for winter crop mapping and winter wheat yield assessment at regional scale. AIMS Geosci. 2017, 3, 163–186. [Google Scholar] [CrossRef]
- Zhan, Z.; Yu, L.; Li, Z.; Ren, L.; Gao, B.; Wang, L.; Luo, Y. Combining GF-2 and Sentinel-2 Images to Detect Tree Mortality Caused by Red Turpentine Beetle during the Early Outbreak Stage in North China. Forests 2020, 11, 172. [Google Scholar] [CrossRef] [Green Version]
- Nguyen, M.D.; Baez-Villanueva, O.M.; Bui, D.D.; Nguyen, P.T.; Ribbe, L. Harmonization of Landsat and Sentinel 2 for Crop Monitoring in Drought Prone Areas: Case Studies of Ninh Thuan (Vietnam) and Bekaa (Lebanon). Remote Sens. 2020, 12, 281. [Google Scholar] [CrossRef] [Green Version]
- Wang, Q.; Li, J.; Jin, T.; Chang, X.; Zhu, Y.; Li, Y.; Sun, J.; Li, D. Comparative Analysis of Landsat-8, Sentinel-2, and GF-1 Data for Retrieving Soil Moisture over Wheat Farmlands. Remote Sens. 2020, 12, 2708. [Google Scholar] [CrossRef]
- VITO. Product Distribution Portal (PDF). Available online: http://www.vito-eodata.be/PDF/portal/Application.html#Home (accessed on 27 April 2021).
- Fan, J. Updates on the FY-3 MERSI Satellite Data Processing and Delivering. In Proceedings of the SIGMA Project Annual Meeting, Brussels, Belgium, 9–13 November 2015. [Google Scholar]
- WMO. OSCAR Satellite: FY-3B. Available online: https://www.wmo-sat.info/oscar/satellites/view/fy_3b (accessed on 27 April 2021).
- Eberenz, J.; Verbesselt, J.; Herold, M.; Tsendbazar, N.-E.; Sabatino, G.; Rivolta, G. Evaluating the Potential of PROBA-V Satellite Image Time Series for Improving LC Classification in Semi-Arid African Landscapes. Remote Sens. 2016, 8, 987. [Google Scholar] [CrossRef] [Green Version]
- Lambert, M.J.; Waldner, F.; Defourny, P. Cropland Mapping over Sahelian and Sudanian Agrosystems: A Knowledge-Based Approach Using PROBA-V Time Series at 100-m. Remote Sens. 2016, 8, 232. [Google Scholar] [CrossRef] [Green Version]
- Durgun, Y.Ö.; Gobin, A.; Van De Kerchove, R.; Tychon, B. Crop Area Mapping Using 100-m PROBA-V Time Series. Remote Sens. 2016, 8, 585. [Google Scholar] [CrossRef] [Green Version]
- Zhang, X.; Zhang, M.; Zheng, Y.; Wu, B. Crop Mapping Using PROBA-V Time Series Data at the Yucheng and Hongxing Farm in China. Remote Sens. 2016, 8, 915. [Google Scholar] [CrossRef] [Green Version]
- Roumenina, E.; Atzberger, C.; Vassilev, V.; Dimitrov, P.; Kamenova, I.; Banov, M.; Filchev, L.; Jelev, G. Single- and Multi-Date Crop Identification Using PROBA-V 100 and 300 m S1 Products on Zlatia Test Site, Bulgaria. Remote Sens. 2015, 7, 13843–13862. [Google Scholar] [CrossRef] [Green Version]
- Dimitrov, P.; Dong, Q.; Eerens, H.; Gikov, A.; Filchev, L.; Roumenina, E.; Jelev, G. Sub-Pixel Crop Type Classification Using PROBA-V 100 m NDVI Time Series and Reference Data from Sentinel-2 Classifications. Remote Sens. 2019, 11, 1370. [Google Scholar] [CrossRef] [Green Version]
- Goor, E.; Dries, J.; Daems, D.; Paepen, M.; Niro, F.; Goryl, P.; Mougnaud, P.; Della Vecchia, A. PROBA-V Mission Exploitation Platform. Remote Sens. 2016, 8, 564. [Google Scholar] [CrossRef] [Green Version]
- Fan, X.S.; Xu, W.B.; Fan, J.L. Mapping winter wheat growing areas in the North China Plain with FY-3 250 m resolution data. J. Remote Sens. 2015, 19, 586–593. [Google Scholar] [CrossRef]
- Jinlong, F.; Mingwei, Z. Supporting Agricultural Monitoring in APEC with FengYun Satellite data. In Proceedings of the Workshop on the Application of Remote Sensing and GIS on Crops Productivity among APEC Economies, Beijing, China, 30–31 July 2012. [Google Scholar]
- Xu, Q.; Li, Q.; Zhang, W.; Zhang, Y.; Zhang, M.; Gao, H.; Fan, J. Overview of Agricultural Application of China’s FY Satellite Data. Adv. Meteorol. Sci. Technol. 2019, 9, 32–36. [Google Scholar]
- Li, C.; Zhang, X.; Shi, Y.; Yang, Z. Extraction and Analysis of Vegetation Index in Xinjiang Area Based on Multitemporal FY-3/MERSI. Mod. Agric. Sci. Technol. 2016, 8, 199–200, 208. [Google Scholar]
- Hu, B.; Qin, X.; Yang, F.; Zhou, R. Method of Processing and Compositing 10 Days’Vegetation Indices Based on MERSI Data. Chin. Agric. Sci. Bull. 2012, 28, 63–68. [Google Scholar]
- Zhu, B.; Huang, S.; Chen, X.; Fan, J. Monitoring of Rice Growth Based on FY3B/MERSI with AQUA/MODIS Data Contrastive Analysis. Acta Agric. Univ. Jiangxiensis 2014, 36, 1009–1015. [Google Scholar]
- Liang, F.; Cheng, H.; Hu, L.; Li, S.; Ma, L. Method for Monitoring Cotton Growth during Growing Season Base on FY-3/MERSI Data. Xinjiang Agric. Sci. 2014, 51, 1381–1387. [Google Scholar]
- Yu, C.; Liu, D.; Zhang, Z. Detecting Major Growth Stages of Paddy Rice Based on FY-3 Data in Heilongjiang Province. Chin. Agric. Sci. Bull. 2014, 30, 55–60. [Google Scholar]
- Wang, X.; Li, G. Comparative Study of Two Supervised Classification Methods Based on MERSI and MODIS Data. Mod. Agric. Sci. Technol. 2009, 7, 266–268. [Google Scholar]
- Wu, Y.; Zhao, Y.; Jin, N. Monitoring of Winter Wheat Area Based on Mono Temporal MERSI Data. Chin. Agric. Sci. Bull. 2011, 27, 127–131. [Google Scholar]
- Chen, X.; Huang, S.; Zhu, B.; Fan, J. Study on Decision—Tree Algorithm for Automatically Extracting Paddy Rice Information from FY-3C/MERSI Images. Acta Agric. Jiangxi 2016, 28, 85–89. [Google Scholar]
- Abbasi, B.; Qin, Z.; Du, W.; Fan, J.; Zhao, C.; Hang, Q.; Zhao, S.; Li, S. An Algorithm to Retrieve Total Precipitable Water Vapor in the Atmosphere from FengYun 3D Medium Resolution Spectral Imager 2 (FY-3D MERSI-2) Data. Remote Sens. 2020, 12, 3469. [Google Scholar] [CrossRef]
- He, J.; Liu, Z. Water vapor retrieval from MERSI NIR channels of Fengyun-3B satellite using ground-based GPS data. Remote Sens. Environ. 2021, 258, 112384. [Google Scholar] [CrossRef]
- NERC; ESRC; DFID. 2008, China Ecosystem Services and Poverty Alleviation Situation Analysis and Research Strategy—Ningxia Case Study Ningxia Statistics Bureau, 2017, Ningxia Statistical Yearbook; China Statistics Press: Beijing, China, 2017. [Google Scholar]
- Fan, J.; Defourny, P.; Dong, Q.; Zhang, X.; De Vroey, M.; Belleman, N.; Xu, Q.; Li, Q.; Zhang, L.; Gao, H. Sent2Agri System Based Crop Type Mapping in Yellow River Irrigation Area. J. Geod. Geoinf. Sci. 2020, 3, 110–117. [Google Scholar] [CrossRef]
- Wei, J.; Guojin, H.; Huichan, L.; Tengfei, L.; Wei, W.; Shouzhu, Z.; Xiaoxiao, M. Research on China’s land image mosaicking and mapping technology based on GF-1 satellite WFV data. Remote Sens. Land Resour. 2017, 29, 190–196. [Google Scholar] [CrossRef]
- Liu, J.; Wang, L.; Yang, L.; Teng, F.; Shao, J.; Yang, F.; Fu, C. GF-1 satellite image atmospheric correction based on 6S model and its effect. Trans. Chin. Soc. Agric. Eng. 2015, 31, 159–168. [Google Scholar]
- Sentinel-2 for Agriculture. Available online: http://www.esa-sen2agri.org/ (accessed on 10 December 2020).
- Orfeo ToolBox. Available online: https://www.orfeo-toolbox.org/ (accessed on 10 December 2020).
- Martins, V.S.; Barbosa, C.C.F.; de Carvalho, L.A.S.; Jorge, D.S.F.; Lobo, F.L.; Novo, E.M.L.M. Assessment of Atmospheric Correction Methods for Sentinel-2 MSI Images Applied to Amazon Floodplain Lakes. Remote Sens. 2017, 9, 322. [Google Scholar] [CrossRef] [Green Version]
- Congalton, R.G. Assessing the Accuracy of Remotely Sensed Data: Principles and Practices; CRC Press: London, UK, 1999. [Google Scholar]
- Bradley, A.P. The use of the area under the roc curve in the evaluation of machine learning algorithms. Pattern Recogn. 1997, 30, 1145–1159. [Google Scholar] [CrossRef] [Green Version]
- Jeevalakshmi, D.; Reddy, S.N.; Manikiam, B. Land Cover Classification based on NDVI Using LANDSAT8 Time Series: A Case Study of Tirupati Region. In Proceedings of the International Conference on Communication and Signal Processing (ICCSP), Melmaruvathur, India, 6–8 April 2016; pp. 1332–1335. [Google Scholar] [CrossRef]
- Xing, L.; Wang, H.; Fan, W.; Chen, C.; Li, T.; Wang, G.; Zhai, H. Optimal Features Selection for Wetlands Classification Using Landsat Time Series. In Proceedings of the 2018 IEEE International Geoscience and Remote Sensing Symposium, Valencia, Spain, 22–27 July 2018; pp. 8385–8388. [Google Scholar] [CrossRef]
- Mira Nuno, C.; Catalao, J.; Giovanni, N. Multi-Temporal Crop Classification with Machine Learning Techniques. Proc. SPIE 2019, 11149, 111490. [Google Scholar] [CrossRef]
- Oki, K.; Shan, L.U.; Saruwatari, T.; Suhama, T.; Omasa, K. Evaluation of supervised classification algorithms for identifying crops using airborne hyperspectral data. Int. J. Remote. Sens. 2006, 27, 1993–2002. [Google Scholar] [CrossRef]
- Ok, A.O.; Akar, O.; Gungor, O. Evaluation of random forest method for agricultural crop classification. Eur. J. Remote Sens. 2012, 45, 421–432. [Google Scholar] [CrossRef]
- Chakhar, A.; Ortega-Terol, D.; Hernández-López, D.; Ballesteros, R.; Ortega, J.F.; Moreno, M.A. Assessing the Accuracy of Multiple Classification Algorithms for Crop Classification Using Landsat-8 and Sentinel-2 Data. Remote Sens. 2020, 12, 1735. [Google Scholar] [CrossRef]
- Yi, Z.; Jia, L.; Chen, Q. Crop Classification Using Multi-Temporal Sentinel-2 Data in the Shiyang River Basin of China. Remote Sens. 2020, 12, 4052. [Google Scholar] [CrossRef]
- Yang, Z.; Willis, P.; Mueller, R. Impact of Band-Ratio Enhanced AWIFS Image on Crop Classification Accuracy. Available online: https://www.asprs.org/a/publications/proceedings/pecora17/0041.pdf (accessed on 5 November 2021).
- Immitzer, M.; Neuwirth, M.; Böck, S.; Brenner, H.; Vuolo, F.; Atzberger, C. Optimal Input Features for Tree Species Classification in Central Europe Based on Multi-Temporal Sentinel-2 Data. Remote Sens. 2019, 11, 2599. [Google Scholar] [CrossRef] [Green Version]
- Van der Linden, S.; Rabe, A.; Held, M.; Jakimow, B.; Leitão, P.J.; Okujeni, A.; Schwieder, M.; Suess, S.; Hostert, P. The EnMAP-Box—A Toolbox and Application Programming Interface for EnMAP Data Processing. Remote Sens. 2015, 7, 11249–11266. [Google Scholar] [CrossRef] [Green Version]
- Chaves, E.D.M.; Picoli, C.A.M.; Sanches, D.I. Recent Applications of Landsat 8/OLI and Sentinel-2/MSI for Land Use and Land Cover Mapping: A Systematic Review. Remote Sens. 2020, 12, 3062. [Google Scholar] [CrossRef]


| Counts and Proportion | Forage Grass | Corn | Grape | Greenhouse | Sward | Medlar | Rice | Vegetables | Wheat | SUM |
|---|---|---|---|---|---|---|---|---|---|---|
| Pixel Counts 2017 | 8171 | 9584 | 5476 | 6036 | 1780 | 928 | 30,600 | 3692 | 2272 | 68,539 |
| Pixel Counts 2018 | 4201 | 16,129 | 4508 | 4330 | 338 | 645 | 14,117 | 6359 | 6205 | 56,832 |
| Proportion 2017 | 11.9 | 14.0 | 8.0 | 8.8 | 2.6 | 1.4 | 44.6 | 5.4 | 3.3 | 100 |
| Proportion 2018 | 7.4 | 28.4 | 7.9 | 7.6 | 0.6 | 1.1 | 24.8 | 11.2 | 10.9 | 100 |
| Counts and Proportion | Forage Grass | Corn | Grape | Greenhouse | Sward | Medlar | Rice | Vegetables | Wheat | SUM |
|---|---|---|---|---|---|---|---|---|---|---|
| Pixel Counts 2017 | 18,846 | 21,897 | 11,718 | 14,778 | 4446 | 2529 | 69,129 | 8919 | 4581 | 156,843 |
| Pixel Counts 2018 | 10,926 | 41,031 | 11,493 | 11,178 | 873 | 1602 | 38,124 | 14,499 | 15,381 | 145,107 |
| Proportion 2017 | 12.0 | 14.0 | 7.5 | 9.4 | 2.8 | 1.6 | 44.1 | 5.7 | 2.9 | 100 |
| Proportion 2018 | 7.5 | 28.3 | 7.9 | 7.7 | 0.6 | 1.1 | 26.3 | 10.0 | 10.6 | 100 |
| Product | Product Type | Number of Data Needed (No. of Archived and New Scenes) |
|---|---|---|
| S-2 MSI | L1C | 100 |
| S-2 MSI | L2A | 100 |
| GF-1 WFV | L1B | 100 |
| PROBA-V | S1 TOC 100M | 200 |
| PROBA-V | S5 TOC 100M | 40 |
| FY3B-MERSI | L1B | 300 |
| Classified | |||||
|---|---|---|---|---|---|
| j = 1 | j = 2 | … | j = J | ||
| Ground Truth | i = 1 | N11 | N12 | N1J | |
| i = 2 | N21 | N22 | N2J | ||
| … | |||||
| i = J | NJ1 | NJ2 | NJJ | ||
| Counts and Proportion | Forage Grass | Corn | Grape | Greenhouse | Sward | Medlar | Rice | Vegetables | Wheat | SUM |
|---|---|---|---|---|---|---|---|---|---|---|
| Pixel Counts | 295 | 322 | 182 | 233 | 51 | 36 | 1026 | 137 | 78 | 2360 |
| Proportion | 12.5 | 13.6 | 7.8 | 9.8 | 2.2 | 1.5 | 43.5 | 5.8 | 3.3 | 100 |
| Band Number | Central Wavelength (nm) | Bandwidth (nm) | Resolution (m) | Central Wavelength (nm) | Bandwidth (nm) | Resolution (m) |
|---|---|---|---|---|---|---|
| FY3B MERSI | PROBA-V | |||||
| 1 | 470 | 50 | 250 | 464 | 47 | 100 |
| 2 | 550 | 50 | 250 | |||
| 3 | 650 | 50 | 250 | 655 | 82 | 100 |
| 5 | 865 | 50 | 250 | 837 | 130 | 100 |
| 5 | 1603 | 65 | 100 | |||
| Accuracy | GF-2017 | S2-2017 | GF-2018 | S2-2018 |
|---|---|---|---|---|
| OA | 94.4 | 98.4 | 93.9 | 96.7 |
| Kappa | 93.0 | 98.0 | 93.0 | 96.0 |
| F1 score | 84.6 | 97.0 | 91.2 | 94.0 |
Publisher’s Note: MDPI stays neutral with regard to jurisdictional claims in published maps and institutional affiliations. |
© 2021 by the authors. Licensee MDPI, Basel, Switzerland. This article is an open access article distributed under the terms and conditions of the Creative Commons Attribution (CC BY) license (https://creativecommons.org/licenses/by/4.0/).
Share and Cite
Fan, J.; Defourny, P.; Zhang, X.; Dong, Q.; Wang, L.; Qin, Z.; De Vroey, M.; Zhao, C. Crop Mapping with Combined Use of European and Chinese Satellite Data. Remote Sens. 2021, 13, 4641. https://doi.org/10.3390/rs13224641
Fan J, Defourny P, Zhang X, Dong Q, Wang L, Qin Z, De Vroey M, Zhao C. Crop Mapping with Combined Use of European and Chinese Satellite Data. Remote Sensing. 2021; 13(22):4641. https://doi.org/10.3390/rs13224641
Chicago/Turabian StyleFan, Jinlong, Pierre Defourny, Xiaoyu Zhang, Qinghan Dong, Limin Wang, Zhihao Qin, Mathilde De Vroey, and Chunliang Zhao. 2021. "Crop Mapping with Combined Use of European and Chinese Satellite Data" Remote Sensing 13, no. 22: 4641. https://doi.org/10.3390/rs13224641
APA StyleFan, J., Defourny, P., Zhang, X., Dong, Q., Wang, L., Qin, Z., De Vroey, M., & Zhao, C. (2021). Crop Mapping with Combined Use of European and Chinese Satellite Data. Remote Sensing, 13(22), 4641. https://doi.org/10.3390/rs13224641