Abstract
As the population has increased and the economy has developed in the Qaidam Basin, the demand for food and energy in the basin has increased, and the contradiction between economic development and ecological protection is gradually becoming prominent. In this study, the eco-environmental quality of the Qaidam Basin from 1986 to 2019 was evaluated and analyzed based on the Modified Remote Sensing Ecological Index (MRSEI) retrieved by the Google Earth Engine (GEE) and meteorological and socioeconomic auxiliary data. The results show that (1) the Qaidam Basin had a lower overall level of eco-environmental quality, with higher eco-environmental quality in the southeastern part of the basin and lower eco-environmental quality in the central and northwestern parts of the basin. (2) During the period of 1986 to 2019, the eco-environmental quality of the Qaidam Basin started to reverse in 2003; it decreased first and then increased, and the overall performance showed an upward trend over the past 34 years. The most obvious changes were in the northwestern, northeastern, southwestern and central parts of the basin. The eco-environmental quality continued to decline in the northwestern and rise in the northeastern and southwestern regions, and in the central part, it decreased first and then plateaued. (3) The eco-environmental quality of the Qaidam Basin was affected by both natural and human factors. From 1986 to 2019, the “warm and wet” climate in the basin promoted the growth of vegetation. Furthermore, the optimization of industrial structures alleviated the pressure of agriculture and livestock and jointly improved the ecological environment in the Qaidam Basin.
1. Introduction
Providing natural resources, space and basic material conditions for human survival, the ecological environment is a basic guarantee of human survival and is the basis of social development [1]. In recent decades, the eco-environment in various regions of China has been increasingly disturbed by global climate change and human activities [2,3,4]. Located in the northern part of the Tibetan Plateau, the Qaidam Basin has an inherently fragile and sensitive ecological environment [5]. According to the Chinese Ministry of Environmental Protection’s national ecological zoning, the Qaidam Basin is part of the ecological zone of windbreak and sand fixation and is a critical sand control barrier in China [6,7]. However, in recent years, with the implementation of the western development drive and the “Qaidam Circular Economy Experimental Zone”, natural resources, such as natural gas, salt lakes and nonferrous metals in the basin, have been developed with a high intensity, and the pressure of eco-environmental protection has been increasing [8,9,10]. With the continuous increase in the intensity of human activities, the inherently fragile ecological environment of the Qaidam Basin will be threatened to varying degrees, influencing the stability of the local ecosystem and the sustainable development of the economy [11,12]. Therefore, how to reliably and quantitatively evaluate the eco-environmental quality of the Qaidam Basin has become an urgent scientific problem to be solved.
The monitoring of eco-environmental quality is mainly dependent upon means such as humanistic statistics and ground observations to obtain ground-surface environmental information in the initial stage of research [13,14]. With the development of remote sensing technology, scholars have gradually begun to obtain surface information from satellite images [15,16,17,18]. In the past 30 years, many scholars have studied the desertification, vegetation coverage, climate change, terrestrial water storage, and runoff change in the Qaidam Basin with the Moderate Resolution Imaging Spectroradiometer (MODIS) and the NOAA Advanced Very High Resolution Radiometer (AVHRR) [19,20,21,22]. However, due to the restriction of spatial resolutions, ranging from 250 to 8000 m, these products are incapable of capturing spatial details necessary for monitoring land cover and ecosystem changes in heterogeneous areas [23,24]. The above studies were aimed at monitoring a single field of the eco-environment, while the ecological environment is comprehensively controlled by complex variables. Eco-environmental quality assessment should be based on a variety of environmental elements, instead of focusing on the direct effects of a specific stressor [25]. In addition, due to terrain undulation in the Qaidam Basin, slope and other topographic elements had a certain effect on surface reflectance, leading to spectral mixing problems such as “different objects with the same spectrum” [26], which make it more difficult to capture the spatial detail needed for ecosystem change. Currently, there is still a lack of comprehensive, quantitative, high-resolution and long time-series eco-environmental quality assessments in the Qaidam Basin.
The modified remote sensing ecological index (MRSEI), using Landsat images as the data source, can be used to quantitatively and comprehensively evaluate the quality of the regional eco-environment by performing principal component analysis (PCA) on four sub-indices closely related to the eco-environment (i.e., greenness, wetness, heat, and dryness) [27]. Data derived from Landsat sensors can successfully capture the spatial details and alleviate the spectral mixture issue to some extent [28,29,30]. This type of index has been widely used in forests, cities, deserts, oases and other regions [31,32,33,34,35]. However, longer observation cycles of these satellites and frequent cloud contamination in some regions limit their application for detecting rapid changes in the ecosystem. As a result, the above research carries out the inversion of only equal-interval years, resulting in the discontinuity of time series. Thus, the trend analysis of the MRSEI index provides conclusions via the difference between equal interval years. The accuracy of these conclusions is closely related to the selection of interval years. Therefore, there is an error in the influence caused by human factors.
In this study, the influence of cloudy conditions is overcome, and long time-series MRSEI indices are calculated based on the advantages of the GEE platform [36] and the images in the same season in the Qaidam Basin from 1986 to 2019. Sen’s slope and the Mann–Kendall test are used to analyze the change in the MRSEI index for the first time to obtain the changing characteristics of ecological environment quality in the Qaidam Basin and to ensure that the results are not disturbed by human factors. Furthermore, this study combined grid meteorological and statistical data to discuss the main factors that affect eco-environmental quality changes, which can provide basic data for the implementation for further ecological restoration projects. Overall, the objectives of this study are to (1) assess the eco-environmental quality changes in the Qaidam Basin in recent decades; (2) analyze the driving mechanisms of ecological and environmental quality changes in the Qaidam Basin.
2. Data Sources and Research Methods
2.1. Overview of the Study Area
The Qaidam Basin is approximately 800 km long from east to west and 300 km long from north to south, with a total area of approximately 274,800 km2. The altitude ranges from 2625 to 6824 m. The central part of the basin is at a low altitude, while the surrounding area is surrounded by tall mountain systems such as the Arjinshan, Qilian and Kunlun Mountains, which are at a high altitude, thereby forming a basin–mountain system of “three mountains and one basin” (Figure 1). It is the highest basin in China. The Qaidam Basin has a plateau continental climate, with aridity as its main feature. The mountains around the basin are cold and rainy, while the central part is warm and hot with sparse rain.
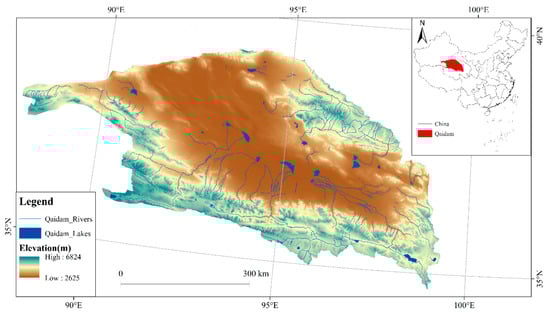
Figure 1.
The location map of Qaidam Basin of China.
2.2. Data Source
As this study involves the quantitative inversion calculation of remote sensing indices, atmospheric correction of the images was required. The Landsat surface reflectance (Landsat_SR) dataset provided within the GEE was accurately atmospherically corrected in all bands using the Land Surface Reflectance Code (LaSRC) [37]. Therefore, Landsat surface reflectance from the GEE was chosen as the data source for the inversion of the MRSEI (Table 1).

Table 1.
Landsat data source.
Meteorological data were obtained from the China Meteorological Data Network (https://data.cma.cn/ accessed on 3 November 2021), including the annual average temperature and annual precipitation of the Qaidam Basin and 9 surrounding meteorological stations (Lenghu, Xiaozaohuo, Golmud, Nomuhong, Dulan, Wudaoliang, Maduo, Qumalai and Subei) from 1986 to 2019. In this study, the ANUSPLIN program [38], developed based on the thin disk smooth spline function, was selected to interpolate climate data, and the method introduced elevation factors as covariates, thus improving the interpolation accuracy. In addition, the data of rivers and lakes in the Qaidam Basin were obtained from National Cryosphere Desert Data National Cryosphere Desert Data Center (http://www.ncdc.ac.cn/portal/ accessed on 3 November 2021), Collected on 1 January 2000.
As Haixi Mongolian-Tibetan Autonomous Prefecture covers most of the Qaidam Basin, this study uses the Haixi Prefecture statistical yearbook to compile statistics on GDP, rural per capita income, population and livestock volume within the Qaidam Basin. The specific data were obtained from the 1986–2019 Qinghai Provincial Statistical Yearbook (http://tjj.qinghai.gov.cn/ accessed on 3 November 2021). In addition, the types of livestock grazing in the study area are mainly cattle and sheep. In this study, one large livestock unit was uniformly converted into four sheep, and the number of heads of sheep in the stock at the end of the year was used to represent the number of livestock in the study area.
2.3. MRSEI
The MRSEI integrates the four indices of greenness, wetness, dryness, and heat in the study area by PCA and is expressed as:
where f refers to the principal component analysis.
2.3.1. Selection and Calculation of Ecological Factor Indices
In this study, the normalized difference vegetation index (NDVI) [39], wetness component (WET) obtained by tasseled cap transformation [40,41,42], normalized difference soil index (NDSI) [43,44] and land surface temperature (LST) [45] were selected as the evaluation indices for the four ecological factors: greenness, wetness, dryness and heat [46]. The formulas of these indices mentioned above are listed in Table 2.
Table 2.
Indexes of Ecological factors.
2.3.2. Normalization
Because the dimensions of the NDVI, WET, NDSI and LST are not uniform, it is necessary to normalize each index and unify their dimensions between 0 and 1, which is expressed as:
where refers to a normalized index value, refers to the value of an index at pixel i, refers to the minimum value of the index, and refers to the maximum value of the index.
2.3.3. PCA
The covariance matrix between the normalized WET, NDVI, NDSI and LST is calculated, the eigenvalues and eigenvectors of the covariance matrix are obtained, and the principal components PC1, PC2, PC3 and PC4 are calculated according to the eigenvectors. The MRSEI is derived from the weighted sum of the first three principal components (Figure 2), and the weight of the weighted sum is the eigenvalue contribution rate of each independent component [27], which is expressed as:
where refers to the eigenvalue contribution rate corresponding to the ith principal component and refers to the principal component.
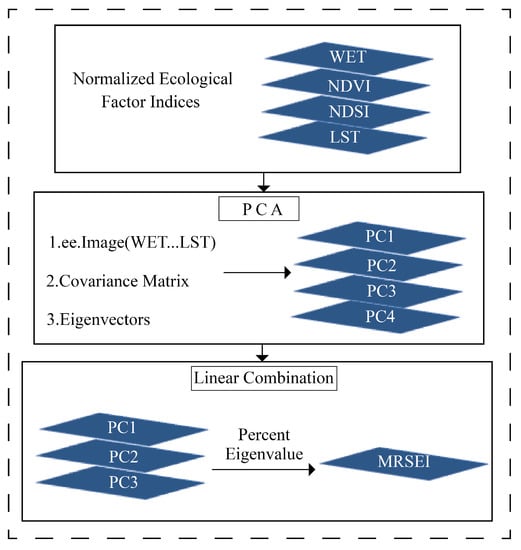
Figure 2.
Flowchart of the derivation of the MRSEI.
To enable comparison between MRSEI images from different time periods, the MRSEI results of each year were normalized. The closer the MRSEI was to 1, the better the eco-environmental quality was; the closer the index was to 0, the worse the eco-environmental quality was.
2.4. Landsat_SR Preprocessing in the GEE
To reduce the error caused by phenological changes and ensure the comparability between MRSEI indices for various years, the images from 1 July to 31 August of the target year were selected in this study. Due to the high altitude and wide range of the Qaidam Basin, the images in the region are often covered by clouds, which affects the parameter inversion calculation. To ensure minimum cloud coverage in each image and fill in missing areas, the images for the target year of this study were synthesized from images of the target year and adjacent years of the same season (three years in total). This article took the image acquisition process in 2018 as an example to describe the image preprocessing in the GEE (Figure 3).
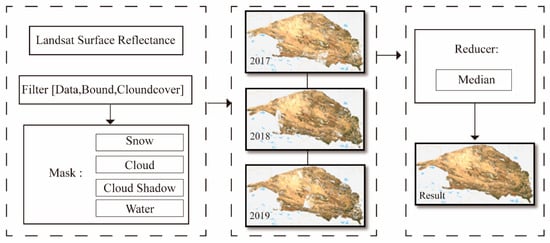
Figure 3.
Flowchart of remote sensing image preprocess in Qaidam Basin on GEE.
2.4.1. Cloud Mask Processing
Landsat 8_ SR data of the Qaidam Basin for 2018 and one year before and after (2017 and 2019) were selected. The cloud content of the Landsat_ SR image in the GEE was marked in the “CLOUD_COVER” field [47]. This field was used to screen all images with cloud contents of less than 80% in the study area to obtain most of the remote sensing images in the study area. The mask function established according to cloud shadow and cloud attribute fields contained in the quality evaluation band “pixel_qa” in the Landsat_SR dataset image removed the cloud-containing area in each image. After cloud screening, 80, 84 and 77 images were available in 2017, 2018 and 2019, respectively.
2.4.2. Mask for Water and Snow
Because the wetness component (WET) in the tasseled cap transformation reflects the wetness of vegetation and soil, the water area in the study area is a large proportion of the WET, which weakens the advantage of vegetation in the WET against bare soil, rock and other dry ground features, meaning that the normalized WET cannot truly reflect the wetness difference between vegetation and soil; moreover, the similarity of the WET between solid and liquid water bodies is very high, and there is no obvious difference. Therefore, it was necessary to mask the water and snow in the images.
Based on the snow attribute field in the quality evaluation band “pixel_qa”, a mask was established to remove the snow in the images; in addition, the MNDWI proposed by [48] was used to mask the water, and is expressed as:
where and are the green band reflectance and mid-infrared band reflectance, respectively.
2.4.3. Image Synthesis Method
All mask-processed images in three years (2017, 2018, and 2019) were overlayed, and the median function was used to extract the median value of the image to eliminate outliers and improve the influence of chromatic aberration. This is expressed as:
where n represents the total number of images contained, pix represents the pixel value of the ith image, and pix_ f represents the final pixel value after the median is obtained.
2.5. Average Correlation Model
To test the comprehensive representativeness of the MRSEI, this study calculated the correlation coefficients among the five indices of the MRSEI, WET, NDVI, NDSI and LST in the same period and used the average correlation model to test the applicability of the MRSEI index. The average correlation was calculated based on the absolute value of the correlation coefficient between one index and the other indices [49]. The closer the result was to 1, the stronger the comprehensive representativeness of the index was, which is expressed as:
where r represents the Pearson correlation coefficient, Xi and Yi represent the pixel values, X and Y represent the type of indices, and
refer to the average of indices, and i refers to the number of samples.
where represents the average correlation degree; p, q, r and s refer to the indicators for the correlation analysis; n represents the number of indicators for the correlation analysis; and , , and represent the Pearson correlation coefficients between the indicators.
2.6. Trend Analysis Method
In this study, the Mann–Kendall (M-K) nonparametric test was used to determine the trend and significance of the MRSEI, meteorological data (temperature and precipitation) and socio-economic data, Sen’s slope method was used to analyze the rate of change of the MRSEI and socio-economic data (Table 3), a T test was used to test the significance of the correlation between the MRSEI and meteorological data in the same period, and a nonparametric Pettitt test was used to determine the mutation point.
Table 3.
Significance of changing trends.
3. Research Results
3.1. Model Test
To test the comprehensive representativeness of the MRSEI index, this study adopts the method of equal interval extraction and successively selects the data in 1986, 1996, 2006, 2016 and 2019 as test samples for the model test. Based on the principal component analysis results of the sample years, the sum of the cumulative contribution rates of the first three principal components, PC1, PC2 and PC3, in 1986, 1996, 2006, 2016 and 2019 were 96.5%, 96.3%, 97.0%, 98.0% and 98.2%, respectively; they were all greater than 85% (Figure 4 and Table 4), indicating that the MRSEI integrates most of the information of various ecological indicators. In addition, dryness and greenness contributed the most to the MRSEI.
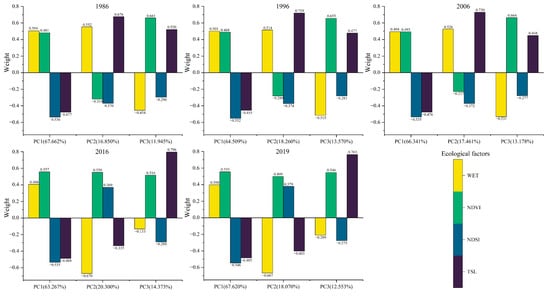
Figure 4.
Principal component analysis of the MRSEI.
Table 4.
The finalized formula of the MRSEI.
The Pearson correlation coefficient between the MRSEI and various ecological factor indices in the same period was calculated, and the applicability of the MRSEI was tested through the average correlation (Figure 5). The results show that the MRSEI was positively correlated with the WET and NDVI and negatively correlated with the NDSI and LST; in addition, the average correlation of the MRSEI was the largest, ranging from 0.714 to 0.774; NDVI and NDSI took second place, ranging from 0.465 to 0.645; and the WET and LST were the smallest, ranging from 0.433 to 0.524. The average value of the average correlation within 5 years was 0.748, which was also the largest in the MRSEI, which was 52.033%, 43.846%, 19.872% and 64.396% higher than the WET, NDVI, NDSI and LST, respectively. This shows that the MRSEI is more representative than any single index and can better reflect the ecological status.
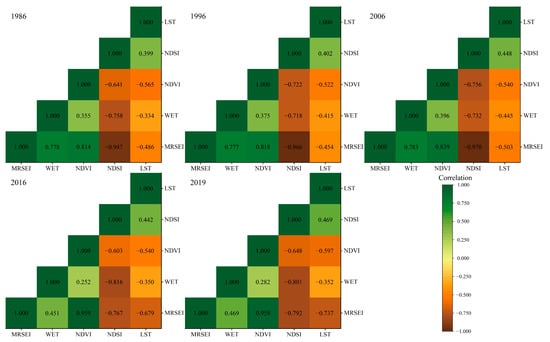
Figure 5.
Correlation of MRSEI and ecological factors.
3.2. Annual Mean Value and Spatial Distribution of the MRSEI in the Qaidam Basin
The range of MRSEI values is 0 to 1. The closer the index is to 1, the better its eco-environmental quality is. This study shows the spatial distribution of the eco-environmental quality of the Qaidam Basin through MRSEI images from 2019. The black area in the figure represents the masked water, clouds and snow. The areas with higher eco-environmental quality in the Qaidam Basin are mainly concentrated in the southeastern part of the basin is mainly located in, extending from the Qilian Mountains in the northeastern part of the basin to the Kunlun Mountains in the southern part of the basin in the form of circles. The areas with lower ecological environmental quality are mainly distributed in the low altitude areas in the middle and northwestern parts of the basin (Figure 6).
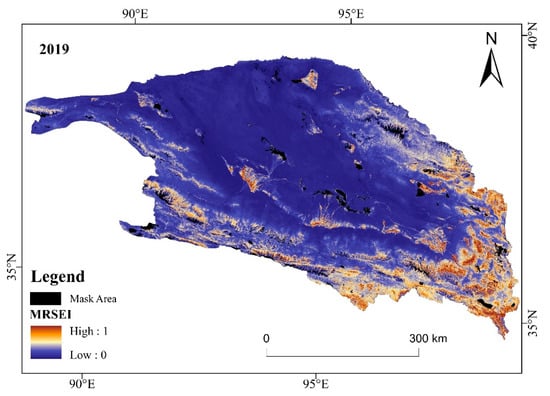
Figure 6.
Spatial distribution of MRSEI in Qaidam Basin, 2019.
The annual mean value of 34 successive MRSEI indices is 0.191, indicating that the overall eco-environmental quality of the Qaidam Basin is low. In addition, the annual mean value of the MRSEI shows different trends in different periods (Figure 7). From 1986 to 2019, the ecological quality first decreased and then increased, reaching the minimum value of the MRSEI in the last 34 years by 2000 and the maximum value of the MRSEI in the last 34 years by 2009. The Pettitt test shows that there is a significant mutation point in the annual mean value of the MRSEI in 2003 (p < 0.05). Therefore, 2003 is selected as the inflection point in this study. The study period is divided into an eco-environmental degradation period from 1986 to 2002 and an eco-environmental restoration period from 2003 to 2019.
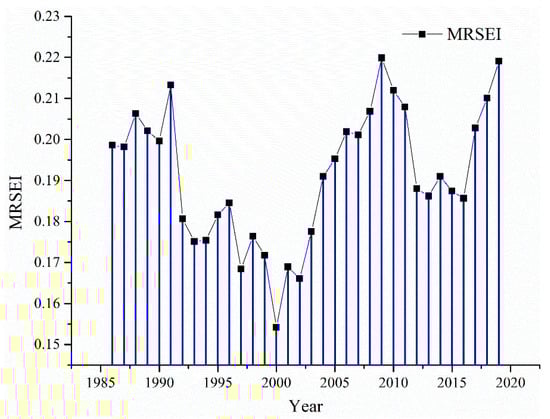
Figure 7.
Annual mean value of the MRSEI in the Qaidam Basin from 1986 to 2019.
3.3. Trend and Rate of Change in the MRSEI in Different Time Periods
From 1986 to 2019, the MRSEI in the Qaidam Basin showed an overall increasing trend (Figure 8), with 34.7% of the total area showing a significant and highly significant increasing trend, with increase rates of 1.62 × 10⁻³ and 3.18 × 10⁻³ year−1 (Table 5), respectively, mainly in the northeastern and southwestern part of the basin, and with 17.34% of the total area showing a significant and highly significant decreasing trend, mainly in the northwestern part of the basin. From 1986 to 2002, the MRSEI of the Qaidam Basin showed an overall decreasing trend, with 45.98% of the total area showing a significant and highly significant decreasing trend, and the decreasing rates were −4.81 × 10⁻³ and −6.68 × 10⁻³ year−1, respectively, mainly in the northwestern and central regions of the basin. The image elements with significant and highly significant increasing MRSEI values accounted for 10.63% of the total area and were mainly distributed in the northeastern part of the basin. From 2003 to 2019, the MRSEI of the Qaidam Basin showed an overall increasing trend, with 27.65% of the total area showing a significant and highly significant increasing trend, with increase rates of 4.51 × 10⁻³ and 6.55 × 10⁻³ year−1, respectively, mainly in the northeastern and southwestern parts of the basin, and with 15.20% of the total area showing a significant and highly significant decreasing MRSEI trends, mainly in the northwestern part of the basin.
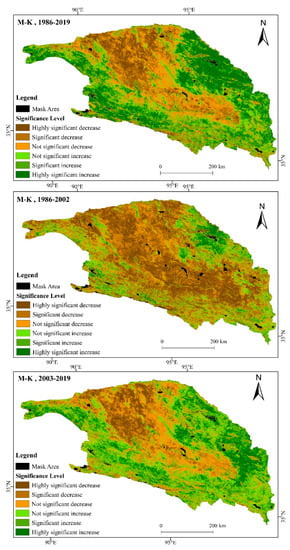
Figure 8.
Spatial distribution of the M–K test for the MRSEI in Qaidam Basin from 1986 to 2019.
Table 5.
Trends and rate of MRSEI change in Qaidam Basin from 1986 to 2019.
From 1986 to 2019, the ecological environment of the Qaidam Basin first deteriorated and then improved, and the degree of environmental improvement was greater than that of deterioration, with the most obvious changes in the northwestern, northeastern, southwestern and central parts of the basin over the past 34 years, with the quality of the ecological environment decreasing in the northwestern part, increasing in the northeastern and southwestern part, and decreasing and then plateauing in the central part.
4. Driving Factors
The MRSEI is the synthesis of greenness, wetness, heat and dryness in the regional environment. It is positively correlated with wetness and greenness and negatively correlated with dryness and heat. The four ecological indices are affected by a variety of environmental factors [50,51,52]. In this study, the reasons for the evolution of eco-environmental quality in the Qaidam Basin are analyzed in terms of temperature, precipitation, population, livestock, GDP and rural per capita income under the comprehensive consideration of natural and human factors.
4.1. Change Characteristics of Climate Factors
From 1986 to 2002, the temperature in the Qaidam Basin showed an increasing trend (Figure 9), in which the significant and highly significant increase accounted for 26.84% of the total area (Table 6), while the precipitation showed an increasing trend in the west and a decreasing trend in the east; the significant and highly significant areas showed an increasing trend, accounting for only 11.08% of the total area. Therefore, the change in precipitation during this period is not significant and the climate is dominated by an increase in temperature. From 2003 to 2019, the temperature and precipitation in the Qaidam Basin showed an increasing trend. The areas with significant and highly significant increases accounted for 6.35% and 48.19% of the total area, respectively. The significance of precipitation was much higher than that from 1986 to 2002, while the significance of temperature decreased. In general, from 1986 to 2019, both temperature and precipitation in the basin showed an increasing trend, with areas with significant and high significant increases accounting for 100% and 12.32% of the total area, respectively, meaning that the climate of the basin shows a “warm and humid” tendency.
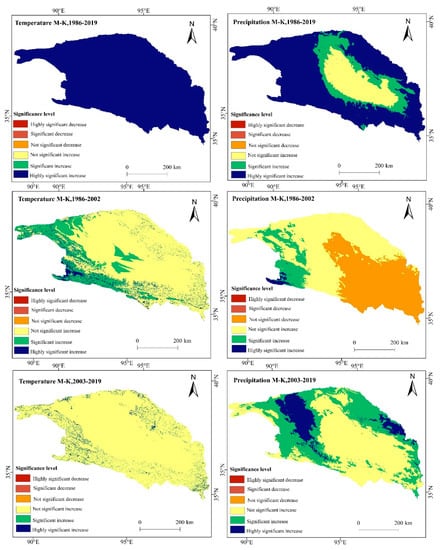
Figure 9.
Spatial distribution of climate factor change in Qaidam Basin from 1986 to 2019.
Table 6.
Changing trends of the climate factors in Qaidam Basin from 1986 to 2019 (km2, %).
4.2. Correlation Analysis between the MRSEI and Climatic Factors
From 1986 to 2002, the correlation between MRSEI and climate factors was weak, with Only 1.12% of the area between the MRSEI and temperature passing the significance test of p < 0.05 (Table 7), and only 3.17% of the area between the MRSEI and precipitation passing the significance test of p < 0.05 for MRSEI and precipitation (Figure 10). From 2003 to 2019, 1.36% of the area between the MRSEI and temperature passed the significance test of p < 0.05, and 23.46% of the area between the MRSEI and precipitation passed the significance test of p < 0.05. The correlation between MRSEI and precipitation increased significantly during this period and was mainly distributed in the mountainous areas surrounding the Qaidam Basin. From 1986 to 2019, 33.37% of the area between the MRSEI and temperature passed the significance test of p < 0.05 and was predominantly positively correlated, mainly in the mountainous areas surrounding the basin. Meanwhile, 39.17% of the area between the MRSEI and precipitation passed the significance test of p < 0.05, still predominantly positively correlated, mainly in the mountainous areas of the northeastern and southwestern parts of the basin (Figure 11). In general, the correlation between MRSEI and climate factors from 1986 to 2019 shows clear regional differences, with higher correlations in mountainous areas at higher elevations, and poorer correlations in central and western regions at lower elevations.
Table 7.
The correlation between MRSEI and climate factors in Qaidam Basin from 1986 to 2019 (km2, %).
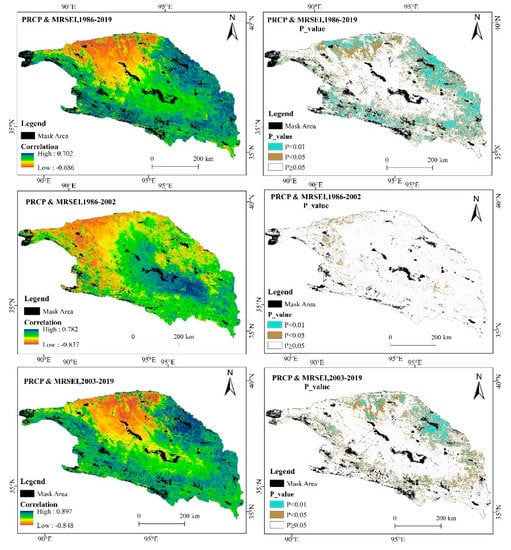
Figure 10.
The correlation between MRSEI and precipitation from 1986 to 2019.
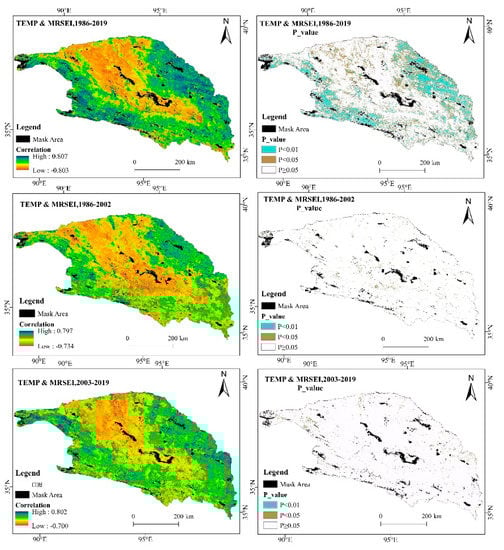
Figure 11.
The correlation between MRSEI and temperature from 1986 to 2019.
4.3. Change Characteristics of Human Activities
From 1986 to 2002, the GDP, population and rural per capita income in the Qaidam Basin increased significantly (p < 0.01), and the change in livestock was not significant (p > 0.1). In terms of the rate of change, the GDP growth rates for the three main industries were RMB 0.16, 2.13, 1.15 and 0.11 billion, and the annual growth rates of rural per capita income and population were RMB 96.49 and 3300 people (Figure 12). The three major industries accounted for a relatively small difference in GDP and growth rates during the period, and the economy developed slowly. From 2003 to 2019, the GDP, population, livestock population and rural per capita income of the Qaidam Basin increased significantly (p < 0.01). The annual growth rates of the three major industries were RMB 2.32, 25.00 and 9.17 billion. The annual growth rate of rural per capita income was RMB 668.15, the annual growth rate of the population was 4100, and the annual growth rate of livestock was 53,200. As a result, the rate of economic development within the basin increased significantly after 2003, the industrial structure changed and people’s living standards improved significantly.
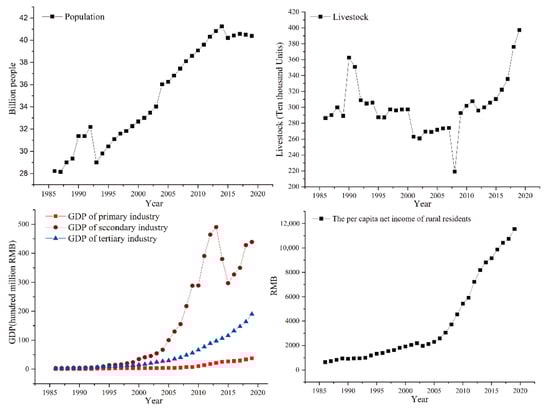
Figure 12.
Socio-economic background of Qaidam Basin from 1986 to 2019.
5. Discussion
The Qaidam Basin is a unique ecosystem, wherein elevation gradients, low temperature, and drought lead to slow growth and uneven distribution of natural vegetation. The vegetation in the basin is mainly located in the higher-altitude mountains, while in the lower altitude areas, vegetation is sparse [53]. In this study, the eco-environmental quality of the Qaidam Basin showed a spatial pattern of high in the southeast and low in the northwest, and the quality was overall low (Figure 6). These results are consistent with the commonly accepted knowledge in this area of research [54]. During the period of 1986 to 2019, the eco-environmental quality of the Qaidam Basin started to reverse in 2003 (Figure 7); it decreased first and then increased, and the overall performance showed an upward trend in the past 34 years (Table 5). Changes in eco-environmental quality in the Qaidam Basin are influenced by a variety of factors.
In the long term, both temperature and precipitation increased significantly in the Qaidam Basin from 1986 to 2019, and showed a significant positive correlation with the MRSEI at high altitudes in the southwest and east of the basin (Figure 9, Figure 10 and Figure 11), Due to the altitude factor, the climate of this region is already cold and humid [55], and the “warm and humid” climate tendency promotes the recovery of the vegetation in the area, leading to an increase in eco-environmental quality. The correlation between MRSEI and temperature and precipitation is weak in the central and northwestern regions at lower altitudes, where the topography is closed and surrounded by high mountains, making it difficult for marine moisture to enter, resulting in scarce precipitation, long sunshine hours, annual evaporation much higher than annual precipitation, and an innate lack of effective soil moisture [56], meaning that the background temperature in this region is already at a high level, which is not conducive to vegetation growth, and previous studies have also confirmed the poor correlation between climate factors and NDVI in non-vegetation growth areas at low elevations [57,58]. In general, the recovery of vegetation in the peripheral regions of the basin due to climate change resulted in better environmental quality, while the non-vegetated growing areas in the central and northwestern regions were less responsive to climate change.
In the short term, from 1986 to 2002, the temperature in the basin increased without significant changes in precipitation (Figure 9), and both correlated poorly with the MRSEI (Table 7). In addition, the GDP in the basin during this period was dominated by primary industry for a long time, and the output of grain and livestock was mostly used to meet farmers’ own living needs, coupled with a significant increase in population, resulting in high pressure on agriculture and livestock, and the phenomenon of overgrazing and excessive reclamation clearing [19,59]. This had a negative impact on the eco-environmental quality in the basin. From 2003 to 2019, the increasing trend of temperature slowed down (Figure 9), while precipitation increased significantly and showed a significant positive correlation with MRSEI in higher-altitude mountainous areas (Figure 10), and the increased precipitation promoted the growth of vegetation within the mountainous areas around the basin. In addition, the GDP of secondary and tertiary industries in the basin grew rapidly during this period, and the industrial structure in the basin changed dramatically, and the previously decentralized livestock began to move toward industrialization, the type of grain grown by farmers changed to mainly cash crops, such as wolfberry [60], the agricultural products and livestock produced during this period were more oriented to the provincial and overseas markets, and the pressure on agriculture and animal husbandry was reduced, coupled with the construction of a series of ecological protection projects [61,62], which played a role in the restoration of the ecological environment.
The Qaidam Basin is a complex ecosystem, and the correlation between MRSEI and climatic factors (temperature and precipitation) in the central and central-western parts of the basin is always weak, because the region has exposed bedrock, desert dunes and deserts as its main feature types [63], which are susceptible to natural factors such as wind speed and sunlight [64]; therefore, in future studies, the meteorological factors such as sunshine duration and average wind speed can be added as drivers to facilitate a more comprehensive analysis of the eco-environmental quality changes in the Qaidam Basin.
6. Conclusions
Based on the GEE platform, this study detected and analyzed the ecological environment of the Qaidam Basin from 1986 to 2019. The results show that the ecological environment quality in the southeastern part of the basin was high and that in the middle and northwestern parts of the basin was low. The ecological environment of the Qaidam Basin reversed in 2003, deteriorating and then recovering over the last 34 years, and showed an overall increasing trend. The change in the ecological quality of the Qaidam Basin is due to a combination of natural and human factors. From 1986 to 2019, the “warm and humid” climate in the basin promoted the growth of vegetation in the basin, while the optimization of the industrial structure eased the pressure on agriculture and animal husbandry, which together led to the improvement of the ecological environment of the Qaidam Basin.
Among the four ecological factors, dryness and greenness not only contribute the most to the MRSEI but also have the highest correlation, indicating that vegetation and precipitation play an important role in the ecology of the Qaidam Basin. In future economic construction and resource development, the protection of forest and grassland ecosystems should be strengthened, and water resources should be utilized rationally to promote the joint success of economic development and ecological protection.
The composition of ecosystems varies from one study area to another, and the natural characteristics of different ecosystems also vary greatly, meaning that different ecosystems should select different natural factors to construct an ecological environment evaluation model. Therefore, we suggest that in evaluating the quality of the ecological environment, we can combine land-use data and select ecological factors according to the natural characteristics of different land-use types, and build a more diverse ecological environment evaluation model in order to better analyze the ecological environment.
Author Contributions
Conceptualization, H.J.; Data curation, H.J. and X.X.; Formal analysis, H.J.; Funding acquisition, C.Y.; Investigation, H.J.; Methodology, H.J. and X.X.; Software, H.J.; Supervision, C.Y.; Validation, C.Y.; Writing—original draft, H.J.; Writing—review and editing, X.X. and C.Y. All authors have read and agreed to the published version of the manuscript.
Funding
This work was funded by the Natural Science Foundation of China (Grant No. 41730752).
Institutional Review Board Statement
Not applicable.
Informed Consent Statement
Not applicable.
Data Availability Statement
The Landsat_SR data can be downloaded from the GEE (https://developers.google.com/earth-engine/datasets/catalog/landsat/ accessed on 3 November 2021).
Acknowledgments
We would like to thank the editors and anonymous reviewers for their constructive comments and suggestions, which helped to improve the quality of the paper.
Conflicts of Interest
The authors declare no conflict of interest.
References
- Zhao, Q.; Huang, G.; Ma, Y. The ecological environment conditions and construction of an ecological civilization in China. Acta Ecol. Sin. 2016, 36, 6328–6335. [Google Scholar]
- Fan, Y.; Fang, C.; Zhang, Q. Coupling coordinated development between social economy and ecological environment in Chinese provincial capital cities-assessment and policy implications. J. Clean. Prod. 2019, 229, 289–298. [Google Scholar] [CrossRef]
- Teng, Y.; Zhan, J.; Liu, W.; Sun, Y.; Agyemang, F.B.; Liang, L.; Li, Z. Spatiotemporal dynamics and drivers of wind erosion on the Qinghai-Tibet Plateau, China. Ecol. Indic. 2021, 123, 107340. [Google Scholar] [CrossRef]
- Liu, C.; Cai, W.; Zhai, M.; Zhu, G.; Zhang, C.; Jiang, Z. Decoupling of wastewater eco-environmental damage and China’s economic development. Sci. Total Environ. 2021, 789, 147980. [Google Scholar] [CrossRef] [PubMed]
- Bohua, Y.; Changhe, L. Assessment of ecological vulnerability on the Tibetan Plateau. Geogr. Res. 2011, 30, 2289–2295. [Google Scholar]
- Xu, J.; Xiao, Y.; Xie, G.; Wang, Y.; Jiang, Y.; Chen, W. Assessment of wind erosion prevention service and its beneficiary areas identification of national key ecological function zone of windbreak and sand fixation type in China. Acta Ecol. Sin. 2019, 39, 5857–5873. [Google Scholar]
- Xu, K.; Wang, J.; Wang, J.; Wang, X.; Chi, Y.; Zhang, X. Environmental function zoning for spatially differentiated environmental policies in China. J. Environ. Manag. 2020, 255, 109485. [Google Scholar] [CrossRef] [PubMed]
- Wei, M.; Jianmin, S.; Rongjin, Y.; Yanwu, L.I. Development and Utilization of Saline Lake Resources and Protection of Ecological Environment in Qaidam Basin in Qinghai Province. Acta Geol. Sin. 2014, 88, 191–193. [Google Scholar]
- Gao, C.; Yu, J.; Min, X.; Cheng, A. Heavy metal concentrations and ecological risk assessment for surface sediment of Da Qaidam Salt Lake in Qaidam Basin, northern Tibetan Plateau. IOP Conf. Ser. Earth Environ. Sci. 2020, 513, 12069. [Google Scholar] [CrossRef]
- Chuang-lin, F.; Chao, B. Water resources optimization and eco-environmental protection in Qaidam Basin. J. Geogr. Sci. 2001, 11, 231–238. [Google Scholar] [CrossRef]
- Li, L.; Fan, Z.; Xiong, K.; Shen, H.; Guo, Q.; Dan, W.; Li, R. Current situation and prospects of the studies of ecological industries and ecological products in eco-fragile areas. Environ. Res. 2021, 201, 111613. [Google Scholar] [CrossRef]
- Avram, S.; Ontel, I.; Gheorghe, C.; Rodino, S.; Roșca, S. Applying a Complex Integrated Method for Mapping and Assessment of the Degraded Ecosystem Hotspots from Romania. Int. J. Environ. Res. Public Health 2021, 18, 11416. [Google Scholar] [CrossRef]
- Morris, P.; Therivel, R. Methods of Environmental Impact Assessment; Taylor & Francis: London, UK, 2001. [Google Scholar]
- Bromberg, S.M. Identifying Ecological Indicators: An Environmental Monitoring and Assessment Program. J. Air Waste Manag. 1990, 40, 976–978. [Google Scholar] [CrossRef][Green Version]
- Hu, L.; Sun, Y.; Collins, G.; Fu, P. Improved estimates of monthly land surface temperature from MODIS using a diurnal temperature cycle (DTC) model. ISPRS J. Photogramm. Remote Sens. 2020, 168, 131–140, Corrigendum in 2021, 171, 118. [Google Scholar] [CrossRef]
- Yan, Y.; Wu, C.; Wen, Y. Determining the impacts of climate change and urban expansion on net primary productivity using the spatio-temporal fusion of remote sensing data. Ecol. Indic. 2021, 127, 107737. [Google Scholar] [CrossRef]
- Deng, C.; Zhang, B.; Cheng, L.; Hu, L.; Chen, F. Vegetation dynamics and their effects on surface water-energy balance over the Three-North Region of China. Agric. Forest Meteorol. 2019, 275, 79–90. [Google Scholar] [CrossRef]
- Zhang, Z.; Ming, D.; Xing, T. Eco-environmental Monitoring and Evaluation of the Tekes Watershed in Xinjiang Using Remote Sensing Images. Procedia Environ. Sci. 2011, 10, 427–432. [Google Scholar] [CrossRef][Green Version]
- Han, J.; Wang, J.; Chen, L.; Xiang, J.; Ling, Z.; Li, Q.; Wang, E. Driving factors of desertification in Qaidam Basin, China: An 18-year analysis using the geographic detector model. Ecol. Indic. 2021, 124, 107404. [Google Scholar] [CrossRef]
- Wei, L.; Jiang, S.; Ren, L.; Tan, H.; Ta, W.; Liu, Y.; Yang, X.; Zhang, L.; Duan, Z. Spatiotemporal changes of terrestrial water storage and possible causes in the closed Qaidam Basin, China using GRACE and GRACE Follow-On data. J. Hydrol. 2021, 598, 126274. [Google Scholar] [CrossRef]
- Zhang, M.; Liu, X. Climate changes in the Qaidam Basin in NW China over the past 40 kyr. Palaeogeogr. Palaeoclimatol. Palaeoecol. 2020, 551, 109679. [Google Scholar] [CrossRef]
- Jia, S.; Zhu, W.; Lű, A.; Yan, T. A statistical spatial downscaling algorithm of TRMM precipitation based on NDVI and DEM in the Qaidam Basin of China. Remote Sens. Environ. 2011, 115, 3069–3079. [Google Scholar] [CrossRef]
- Rao, Y.; Zhu, X.; Chen, J.; Wang, J. An Improved Method for Producing High Spatial-Resolution NDVI Time Series Datasets with Multi-Temporal MODIS NDVI Data and Landsat TM/ETM+ Images. Remote Sens. 2015, 7, 7865–7891. [Google Scholar] [CrossRef]
- Xing, X.; Yan, C.; Jia, Y.; Jia, H.; Lu, J.; Luo, G. An Effective High Spatiotemporal Resolution NDVI Fusion Model Based on Histogram Clustering. Remote Sens. 2020, 12, 3774. [Google Scholar] [CrossRef]
- Nip, M.J.; Udo De Haes, H.A. Ecosystem approaches to environmental quality assessment. Environ. Manag. 1995, 19, 135–145. [Google Scholar] [CrossRef]
- Riano, D.; Chuvieco, E.; Salas, J.; Aguado, I. Assessment of different topographic corrections in Landsat-TM data for mapping vegetation types (2003). IEEE Trans. Geosci. Remote 2003, 41, 1056–1061. [Google Scholar] [CrossRef]
- Song, M.; Luo, Y.; Duan, L. Evaluation of Ecological Environment in the Xilin Gol Steppe based on Modified Remote Sensing Ecological Index Model. Arid. Zone Res. 2019, 36, 1521–1527. [Google Scholar]
- Lenney, M.P.; Woodcock, C.E.; Collins, J.B.; Hamdi, H. The status of agricultural lands in Egypt: The use of multitemporal NDVI features derived from landsat TM. Remote Sens. Environ. 1996, 56, 8–20. [Google Scholar] [CrossRef]
- Seto, K.; Fleishman, E.; Fay, J.; Betrus, C. Linking spatial patterns of bird and butterfly species richness with Landsat TM derived NDVI. Int. J. Remote Sens. 2004, 25, 4309–4324. [Google Scholar] [CrossRef]
- González-Sanpedro, M.C.; Le Toan, T.; Moreno, J.; Kergoat, L.; Rubio, E. Seasonal variations of leaf area index of agricultural fields retrieved from Landsat data. Remote Sens. Environ. 2008, 112, 810–824. [Google Scholar] [CrossRef]
- Xiong, Y.; Xu, W.; Lu, N.; Huang, S.; Wu, C.; Wang, L.; Dai, F.; Kou, W. Assessment of spatial–temporal changes of ecological environment quality based on RSEI and GEE: A case study in Erhai Lake Basin, Yunnan province, China. Ecol. Indic. 2021, 125, 107518. [Google Scholar] [CrossRef]
- Yuan, B.; Fu, L.; Zou, Y.; Zhang, S.; Chen, X.; Li, F.; Deng, Z.; Xie, Y. Spatiotemporal change detection of ecological quality and the associated affecting factors in Dongting Lake Basin, based on RSEI. J. Clean. Prod. 2021, 302, 126995. [Google Scholar] [CrossRef]
- Firozjaei, M.K.; Kiavarz, M.; Homaee, M.; Arsanjani, J.J.; Alavipanah, S.K. A novel method to quantify urban surface ecological poorness zone: A case study of several European cities. Sci. Total Environ. 2021, 757, 143755. [Google Scholar] [CrossRef] [PubMed]
- Jiang, C.; Wu, L.; Liu, D.; Wang, S. Dynamic monitoring of eco-environmental quality in arid desert area by remote sensing:Taking the Gurbantunggut Desert China as an example. Chin. J. Appl. Ecol. 2019, 30, 877–883. [Google Scholar]
- Shi, F.; Li, M. Assessing Land Cover and Ecological Quality Changes under the New-Type Urbanization from Multi-Source Remote Sensing. Sustainability 2021, 13, 11979. [Google Scholar] [CrossRef]
- Gorelick, N.; Hancher, M.; Dixon, M.; Ilyushchenko, S.; Thau, D.; Moore, R. Google Earth Engine: Planetary-scale geospatial analysis for everyone. Remote Sens. Environ. 2017, 202, 18–27. [Google Scholar] [CrossRef]
- Vermote, E.; Justice, C.; Claverie, M.; Franch, B. Preliminary analysis of the performance of the Landsat 8/OLI land surface reflectance product. Remote Sens. Environ. 2016, 185, 46–56. [Google Scholar] [CrossRef] [PubMed]
- Hutchinson, M.F. Interpolating mean rainfall using thin plate smoothing splines. Int. J. Geogr. Inf. Syst. 1995, 9, 385–403. [Google Scholar] [CrossRef]
- Goward, S.N.; Xue, Y.; Czajkowski, K.P. Evaluating land surface moisture conditions from the remotely sensed temperature/vegetation index measurements: An exploration with the simplified simple biosphere model. Remote Sens. Environ. 2002, 79, 225–242. [Google Scholar] [CrossRef]
- Huang, C.; Wylie, B.; Yang, L.; Homer, C.; Zylstra, G. Derivation of a tasselled cap transformation based on Landsat 7 at-satellite reflectance. Int. J. Remote Sens. 2002, 23, 1741–1748. [Google Scholar] [CrossRef]
- Crist, E.P. A TM Tasseled Cap equivalent transformation for reflectance factor data. Remote Sens. Environ. 1985, 17, 301–306. [Google Scholar] [CrossRef]
- Shan, W.; Jin, X.; Ren, J.; Wang, Y.; Xu, Z.; Fan, Y.; Gu, Z.; Hong, C.; Lin, J.; Zhou, Y. Ecological environment quality assessment based on remote sensing data for land consolidation. J. Clean. Prod. 2019, 239, 118126. [Google Scholar] [CrossRef]
- Xu, H. A new index for delineating built-up land features in satellite imagery. Int. J. Remote Sens. 2008, 29, 4269–4276. [Google Scholar] [CrossRef]
- Rikimaru, A.; Roy, P.; Miyatake, S. Tropical forest cover density mapping. Trop. Ecol. 2002, 43, 39–47. [Google Scholar]
- Nichol, J. Remote Sensing of Urban Heat Islands by Day and Night. Photogramm. Eng. Remote Sens. 2005, 71, 613–621. [Google Scholar] [CrossRef]
- Xu, H. A remote sensing urban ecological index and its application. Acta Ecol. Sin. 2013, 33, 7853–7862. [Google Scholar]
- Foga, S.; Scaramuzza, P.L.; Guo, S.; Zhu, Z.; Dilley, R.D.; Beckmann, T.; Schmidt, G.L.; Dwyer, J.L.; Joseph Hughes, M.; Laue, B. Cloud detection algorithm comparison and validation for operational Landsat data products. Remote Sens. Environ. 2017, 194, 379–390. [Google Scholar] [CrossRef]
- Xu, H. A Study on Information Extraction of Water Body with the Modified Normalized Difference Water Index (MNDWI). J. Remote Sens. 2005, 5, 589–595. [Google Scholar]
- Xu, H. A remote sensing index for assessment of regional ecological changes. China Environ. Sci. 2013, 33, 889–897. [Google Scholar]
- Lihong, C.; Puxing, L.; Yaping, H. Comprehensive Evaluation of Ecological Quality and its Factors Analysis in the Shule River Basin Based on RSEI. Chin. J. Soil Sci. 2021, 52, 25–33. [Google Scholar]
- Hua, Z.; Jinyue, S.; Ming, L.; Wuhong, H. Eco-environmental quality assessment and cause analysis of Qilian Mountain National Park based on GEE. Chin. J. Ecol. 2021, 1883–1894. [Google Scholar] [CrossRef]
- Guo, L.; Hongyan, L.; Yi, Y. Global patterns of NDVI-indicated vegetation extremes and their sensitivity to climate extremes. Environ. Res. Lett. 2013, 8, 025009. [Google Scholar]
- Wenbin, Z.; Lv, A.; Jia, S. Spatial distribution of vegetation and the influencing factors in Qaidam Basin based on NDVI. J. Arid Land. 2011, 3, 85–93. [Google Scholar]
- Zhu, W.; Jia, S.; Lü, A.; Yan, T. Analyzing and modeling the coverage of vegetation in the Qaidam Basin of China: The role of spatial autocorrelation. J. Geogr. Sci. 2012, 22, 346–358. [Google Scholar] [CrossRef]
- Jin, X.; Liu, J.; Wang, S.; Xia, W. Vegetation dynamics and their response to groundwater and climate variables in Qaidam Basin, China. Int. J. Remote Sens. 2016, 37, 710–728. [Google Scholar] [CrossRef]
- Zeng, B.; Yang, T. Impacts of climate warming on vegetation in Qaidam Area from 1990 to 2003. Environ. Monit. Assess. 2008, 144, 403–417. [Google Scholar] [CrossRef]
- Zeng, B.; Yang, T. Natural vegetation responses to warming climates in Qaidam Basin 1982–2003. Int. J. Remote Sens. 2009, 30, 5685–5701. [Google Scholar] [CrossRef]
- Lou, J.; Xu, G.; Wang, Z.; Yang, Z.; Ni, S. Multi-Year NDVI Values as Indicator of the Relationship between Spatiotemporal Vegetation Dynamics and Environmental Factors in the Qaidam Basin, China. Remote Sens. 2021, 13, 1240. [Google Scholar] [CrossRef]
- Jun, Y. Discussion on the Genesis and Mechanism of Desertification in Qaidam Basin; Changan University: Xi’an, China, 2004. [Google Scholar]
- Ying, Y.; Yourui, S.; Lijuan, H.; Na, H. Analysis of the Research Status and Prospects of Lycium barbarum from Qaidam Basin. Food Ind. 2014, 35, 210–213. [Google Scholar]
- Xiu, L.; Yao, X.; Chen, M.; Yan, C.Z. Effect of Ecological Construction Engineering on Vegetation Restoration: A Case Study of the Loess Plateau. Remote Sens. 2021, 13, 1407. [Google Scholar] [CrossRef]
- Wang, C.; Lin, Z. Environmental Policies in China over the Past 10 Years: Progress, Problems and Prospects. Procedia Environ. Sci. 2010, 2, 1701–1712. [Google Scholar]
- Liu, X.; Lai, Z.; Ma, Y.; Yu, L. Land Cover Changes in Qaidam Area from 2000 to 2008. In Proceedings of the International Conference on Multimedia Technology, Ningbo, China, 29–31 October 2010; pp. 1–4. [Google Scholar]
- Rohrmann, A.; Heermance, R.; Kapp, P.; Cai, F. Wind as the primary driver of erosion in the Qaidam Basin, China. Earth Planet. Sci. Lett. 2013, 374, 1–10. [Google Scholar] [CrossRef]


Publisher’s Note: MDPI stays neutral with regard to jurisdictional claims in published maps and institutional affiliations. |
© 2021 by the authors. Licensee MDPI, Basel, Switzerland. This article is an open access article distributed under the terms and conditions of the Creative Commons Attribution (CC BY) license (https://creativecommons.org/licenses/by/4.0/).