Article

Spatio-Temporal Analysis of Impervious Surface Expansion in the Qinhuai River Basin, China, 1988–2017

1
School of Geography and Ocean Science, Nanjing University, Nanjing 210023, China
2
Jiangsu Provincial Key Laboratory of Geographic Information Science and Technology, Nanjing 210023, China
3
Jiangsu Center for Collaborative Innovation in Geographical Information Resource Development and Application, Nanjing 210023, China
*
Author to whom correspondence should be addressed.
Remote Sens. 2021, 13(22), 4494; https://doi.org/10.3390/rs13224494
Submission received: 14 August 2021 / Revised: 4 November 2021 / Accepted: 4 November 2021 / Published: 9 November 2021
(This article belongs to the Special Issue Advances in Geospatial Data Analysis for Change Detection)

Abstract

:
Impervious surfaces are key indicators for urbanization monitoring and watershed degradation assessment over space and time. However, most empirical studies only extracted impervious surface from spatial, temporal or spectral perspectives, paying less attention to integrating multiple dimensions in acquiring continuous changes in impervious surfaces. In this study, we proposed a neighborhood-based spatio-temporal filter (NSTF) to obtain the continuous change information of impervious surfaces from multi-temporal Landsat images in the Qinhuai River Basin (QRB), Jiangsu, China from 1988–2017, based on the results from semi-automatic decision tree classification. Moreover, we used the expansion intensity index (EII) and the landscape extension index (LEI) to further characterize the spatio-temporal characteristics of impervious surfaces on different spatial scales. The preliminary results showed that the overall accuracies of the final classification were about 95%, with the kappa coefficients ranging between 0.9 and 0.96. The QRB underwent rapid urbanization with the percentage of the impervious surfaces increasing from 2.72% in 1988 to 25.6% in 2017. Since 2006, the center of urbanization expansion was shaped from the urban built-up areas of Nanjing and Jiangning to non-urban built-up areas of the Jiangning, Lishui, and Jurong districts. The edge expansion occupied 73% on average among the different landscape expansion types, greatly beyond outlying (12%) and infilling (15%). The window size in the NSTF has a direct impact on the subsequent analysis. Our research could provide decision-making references for future urban planning and development in the similar basins.

1. Introduction

Urbanization has significantly promoted regional economic and social development, impacting the structure, function, and evolution of related ecosystems [1,2]. Impervious surface areas, accompanied by the transformation of large amounts of agricultural lands into roads, residential areas, and industrial lands, have changed the underlying surface conditions of the land, and resulted in urban heat islands and rainstorm flash flooding [3,4,5,6]. The extraction of impervious surface information is critical for urbanization monitoring and watershed degradation assessment [7,8,9,10,11,12,13]. The technological breakthroughs in remote sensing and GIS, especially the free acquisition of Landsat data (30 m), have made extracting long-term impervious surface information possible [14,15,16]. Conventional extraction methods mainly include visual interpretation and automatic computer classification [5,17]. The former has a high interpretation accuracy, but it involves large manual inputs, difficult precision control, and the need for high manual-interpretation experience. For the latter, ISODATA, K-mean, minimum distance, and other parameter classifiers have simple inference rules with low classification accuracies for complex areas, making the use of other auxiliary data inconvenient. Non-parametric classifiers in automatic computer classification, such as artificial neural networks, decision trees, and support vector machines, can potentially use a variety of auxiliary data in the classification process, thus greatly improving the classification accuracy [17]. However, the aforementioned methods do not guarantee the integrity and continuity of spatial and temporal changes in extracting impervious surface information from long-term images.
To monitor urban land use change, researchers have attempted to extract dynamic impervious surfaces [18,19]. Currently, there are two major approaches for multi-temporal urban extraction, namely “stacked images” and “spatio-temporal consistency check”. The former refers to images from different dates stacked together as combined features for classification [20,21], which not only requires many changed samples and classification labels, but also needs auxiliary information, such as types of LUCC and change time [22]. As changed samples were critical to the classification accuracy, the spectral similarity map [23] and the signature extension [24] were proposed to reduce the workhorses of sample selection. Conversely, the latter refers to a spatial–temporal consistency check after an initial classification of every image [19,25], which uses time, space, and spectrum information to refine the initial classification results and to obtain the continuous changes of the target [16,18]. In addition, others used phenology as the information to train a single classifier and then combined it with new images to iterate in the classification [26]. In comparison, a “spatio-temporal consistency check” is more suitable for extracting long-term and continuous changes of impervious surface information [14]. Furthermore, although some studies used the patch size threshold in a spatial filtering of the spatio-temporal check to improve the classification accuracy [18], the inherent spatial association relationship between different pixels is not fully exploited.
Traditional decision tree algorithms follow the classic assumption that learning samples are independently and identically distributed, which is not held for remotely sensed image data leading to salt-and-pepper noise. Jiang et al. [27] proposed a focal-test-based spatial decision tree for learning to minimize classification errors in land cover classification for natural resource management. However, this algorithm is only tested in a single image. Based on the framework of the spatio-temporal refinement method proposed by Chai and Li [18] and the GAMMA index [27,28], we proposed a neighborhood-based spatio-temporal filter (NSTF) to incorporate the spatial, temporal, and spectral information together.
The Qinhuai River Basin (QRB), located in Nanjing Metropolitan Circle, Jiangsu, China, has undergone rapid urbanization over the past 30 years. The rapid increase in construction lands has led to the continuous expansion of urban land, which has gradually changed the internal ecological and hydrological processes and impacted the water environment [29,30]. Previous studies on impervious surfaces in the QRB have mainly focused on the land cover change and landscape patterns [31,32,33]. Herein, we attempt to make two improvements in the following: (1) to propose a new filter to further refine the extraction of impervious surfaces on different spatial scales; (2) to quantitatively analyze the patterns and evolution of the impervious surface expansion in the QRB for the first time.
The organization of the rest is as follows: Section 2 defines the study area and data processing. Specifically, we selected several Landsat remote sensing images of the QRB in 1988, 1994, 2001, 2006, 2011, and 2017, and used a semi-automatic decision tree classification model to extract basic impervious surface datasets. Section 3 constructs an NSTF method to extract the continuous changes of the impervious surface datasets. Section 4 further derives the spatio-temporal distribution characteristics of impervious surfaces by analyzing the expansion intensity index (EII) and the landscape expansion index (LEI). Section 5 discusses window sizes, accuracy comparison, main expansion patterns, and others. Finally, several conclusions and future research directions are drawn in Section 6.

2. Study Area and Data Processing
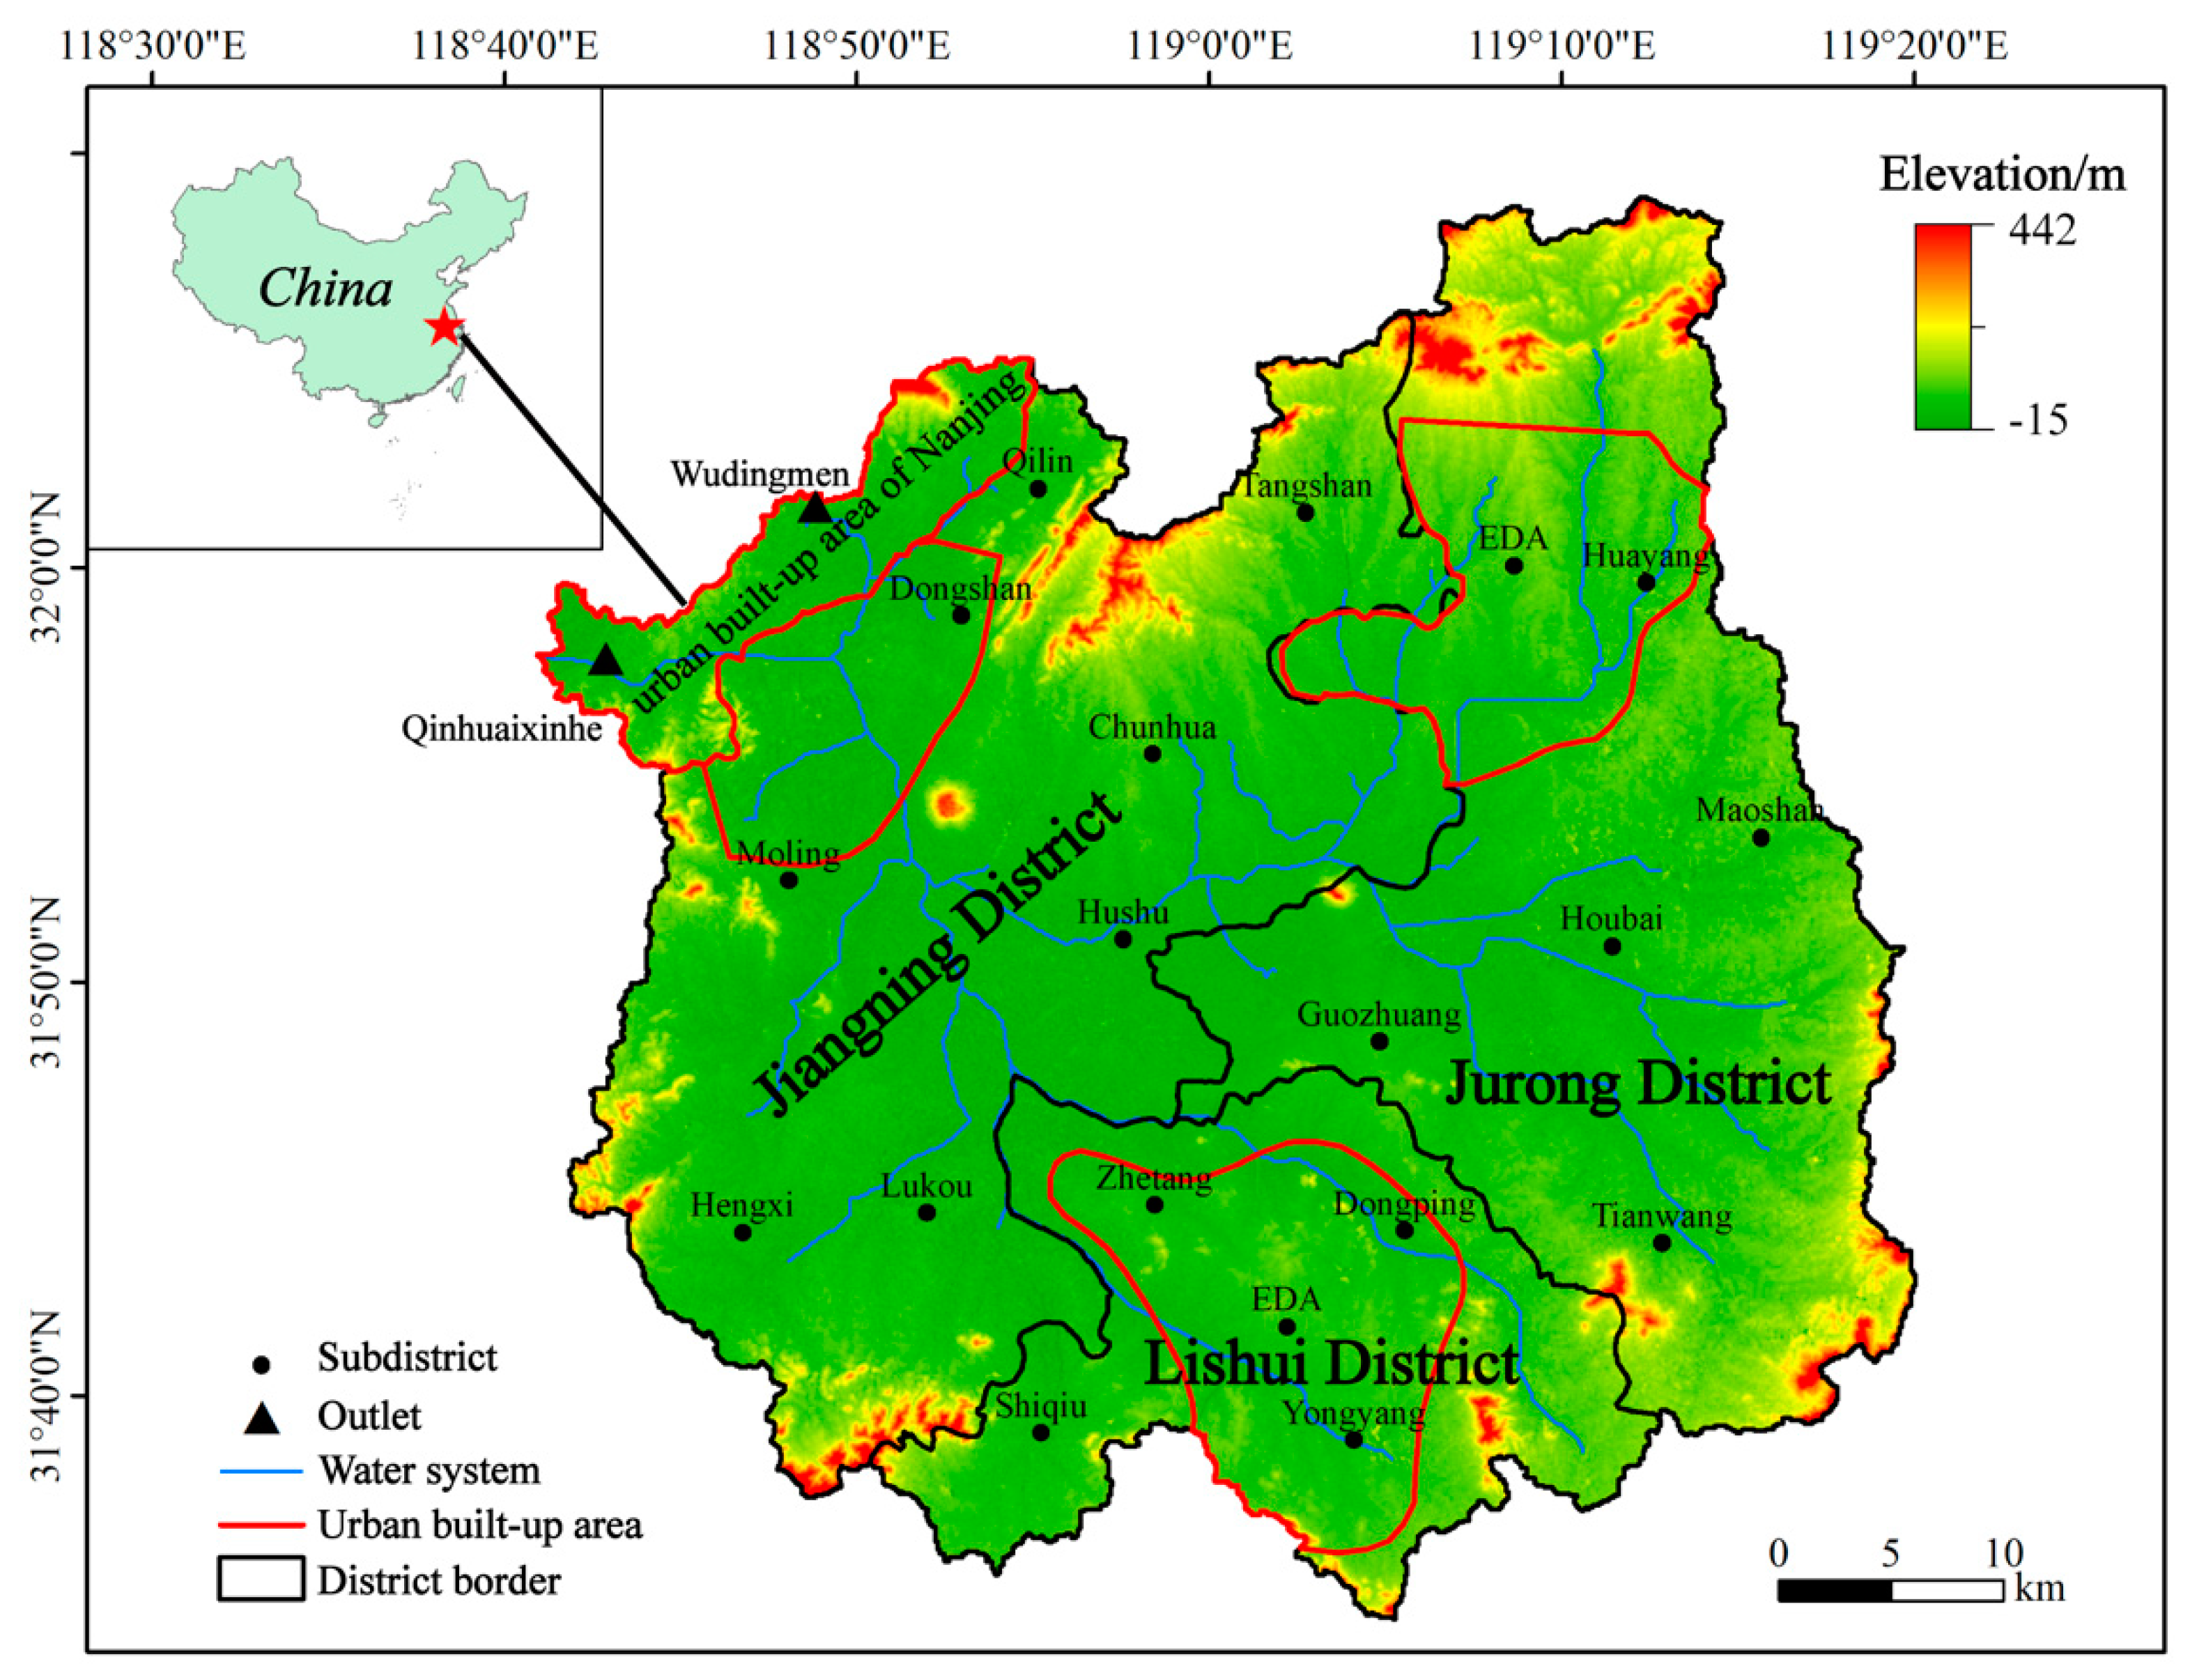
2.1. Study Area

The QRB (31°34′ N–32°10′ N, 118°39′ E–119°19′ E) is located in the southwestern part of Jiangsu Province, China. It is a closed square watershed (each side has a length of approximately 50 km) surrounded by mountains, covering an area of 2588 km2. The Qinhuai River runs through the entire basin. The terrain elevation varies between −15 m and 442 m, being low and flat in the middle. The basin has a subtropical, humid, monsoon climate with noticeable seasonal changes—warmer in the winter and hotter in the summer. The monthly average temperature and rainfall change almost simultaneously. The basin receives adequate amounts of sunlight [30]. The two outlets of the QRB, namely the Qinhuaixinhe and Wudingmen hydrological stations, are located in the northwest corner of the basin.
The QRB’s administrative units include one part of Nanjing city (the urban built-up area, Jiangning District, and Lishui District) and Jurong District (belonging to Zhenjiang city), as in Figure 1. According to the Nanjing Planning Bureau (2011–2020) (http://tjj.nanjing.gov.cn/, accessed on 3 November 2021) and the Jurong Planning Bureau (2017–2035) (http://www.jurong.gov.cn, accessed on 3 November 2021), these districts are also considered as urban built-up areas, including the Jiangning built-up area (containing parts of the Dongshan, Moling, and Chunhua subdistricts), the Lishui built-up area (mainly containing Yongyang Subdistrict and an Economic–Technological Development Area (EDA) and including part of Zhetang Subdistrict and Dongping Subdistrict), and the Jurong built-up area (mainly containing Huayang Subdistrict and an EDA). Since the 1980s, urbanization has accelerated significantly along with rapid development of socioeconomic activities, resulting in great changes to the land surfaces of the QRB. The total urban built-up area in the QRB was about 620 km2 in 2017 [34,35].

2.2. Data Processing

Based on a comprehensive consideration of data quality, availability, and previous studies [30,32,33], a total of 12 remote sensing images from Landsat TM/ETM+/OLI taken between 1988 and 2017 were obtained from USGS (https://www.usgs.gov/, accessed on 3 November 2021) (Table 1). Each image had a spatial resolution of 30 m with low cloud cover. The data product obtained from Landsat TM/ETM+/OLI was L1T. Preprocessing was conducted using radiometric calibration, FLAASH atmospheric correction, spectral synthesis, and clipping. For the scan line corrector (SLC) failure of Landsat 7 ETM+ in 2011, we used the Landsat_Gapfill patch provided by ENVI® 5.5 and selected the ‘single file gap fill (triangulation)’ method to correct it. The vector data mainly included the QRB border, the administrative boundaries, the water system, and the road network. ENVI® 5.5 and ESRI® ArcGIS 10.2 are two powerful platforms for effectively extracting information from remote sensing images and for spatial data processing and visualization.
The semi-automatic decision tree classification proposed by Song et al. was used to obtain a basic impervious surface dataset of the QRB [36]. During the preprocessing stage, we clipped the images in advance to show the extent of the study area from a total of 12 images, including 6 main images and 6 auxiliary images. Each clipped image had approximately 2.88 million pixels in the semi-automatic decision tree classification. Based on the spectral information of various features, a semi-automatic decision tree classification model was constructed by combining hierarchical classification and supervised classification to extract specific features. This classification model divides the features in the QRB into five land cover classes (Table 2).
The classification process is illustrated in Figure 2. First, the model selected the modified normalized difference water index (MNDWI) to identify and remove water bodies. Second, two images (a main and an auxiliary image) were used for each year of woodland extraction. The collection of an auxiliary image was conducted after November as the woodland retained its leaves while the remaining vegetation mostly withered, and the agricultural land was harvested. The phenology of different vegetation types was considered to identify the woodland. Third, the model selected the normalized difference vegetation index (NDVI) and bare soil index (BSI) to identify and remove agricultural land. Fourth, we identified bare land through supervised classification. Finally, impervious surfaces were obtained accordingly on a pixel scale. The threshold settings of the MNDWI, NDVI, and BSI of the semi-automatic decision tree classification were proposed by Song et al. [33] in the QRB.

3. Methodology

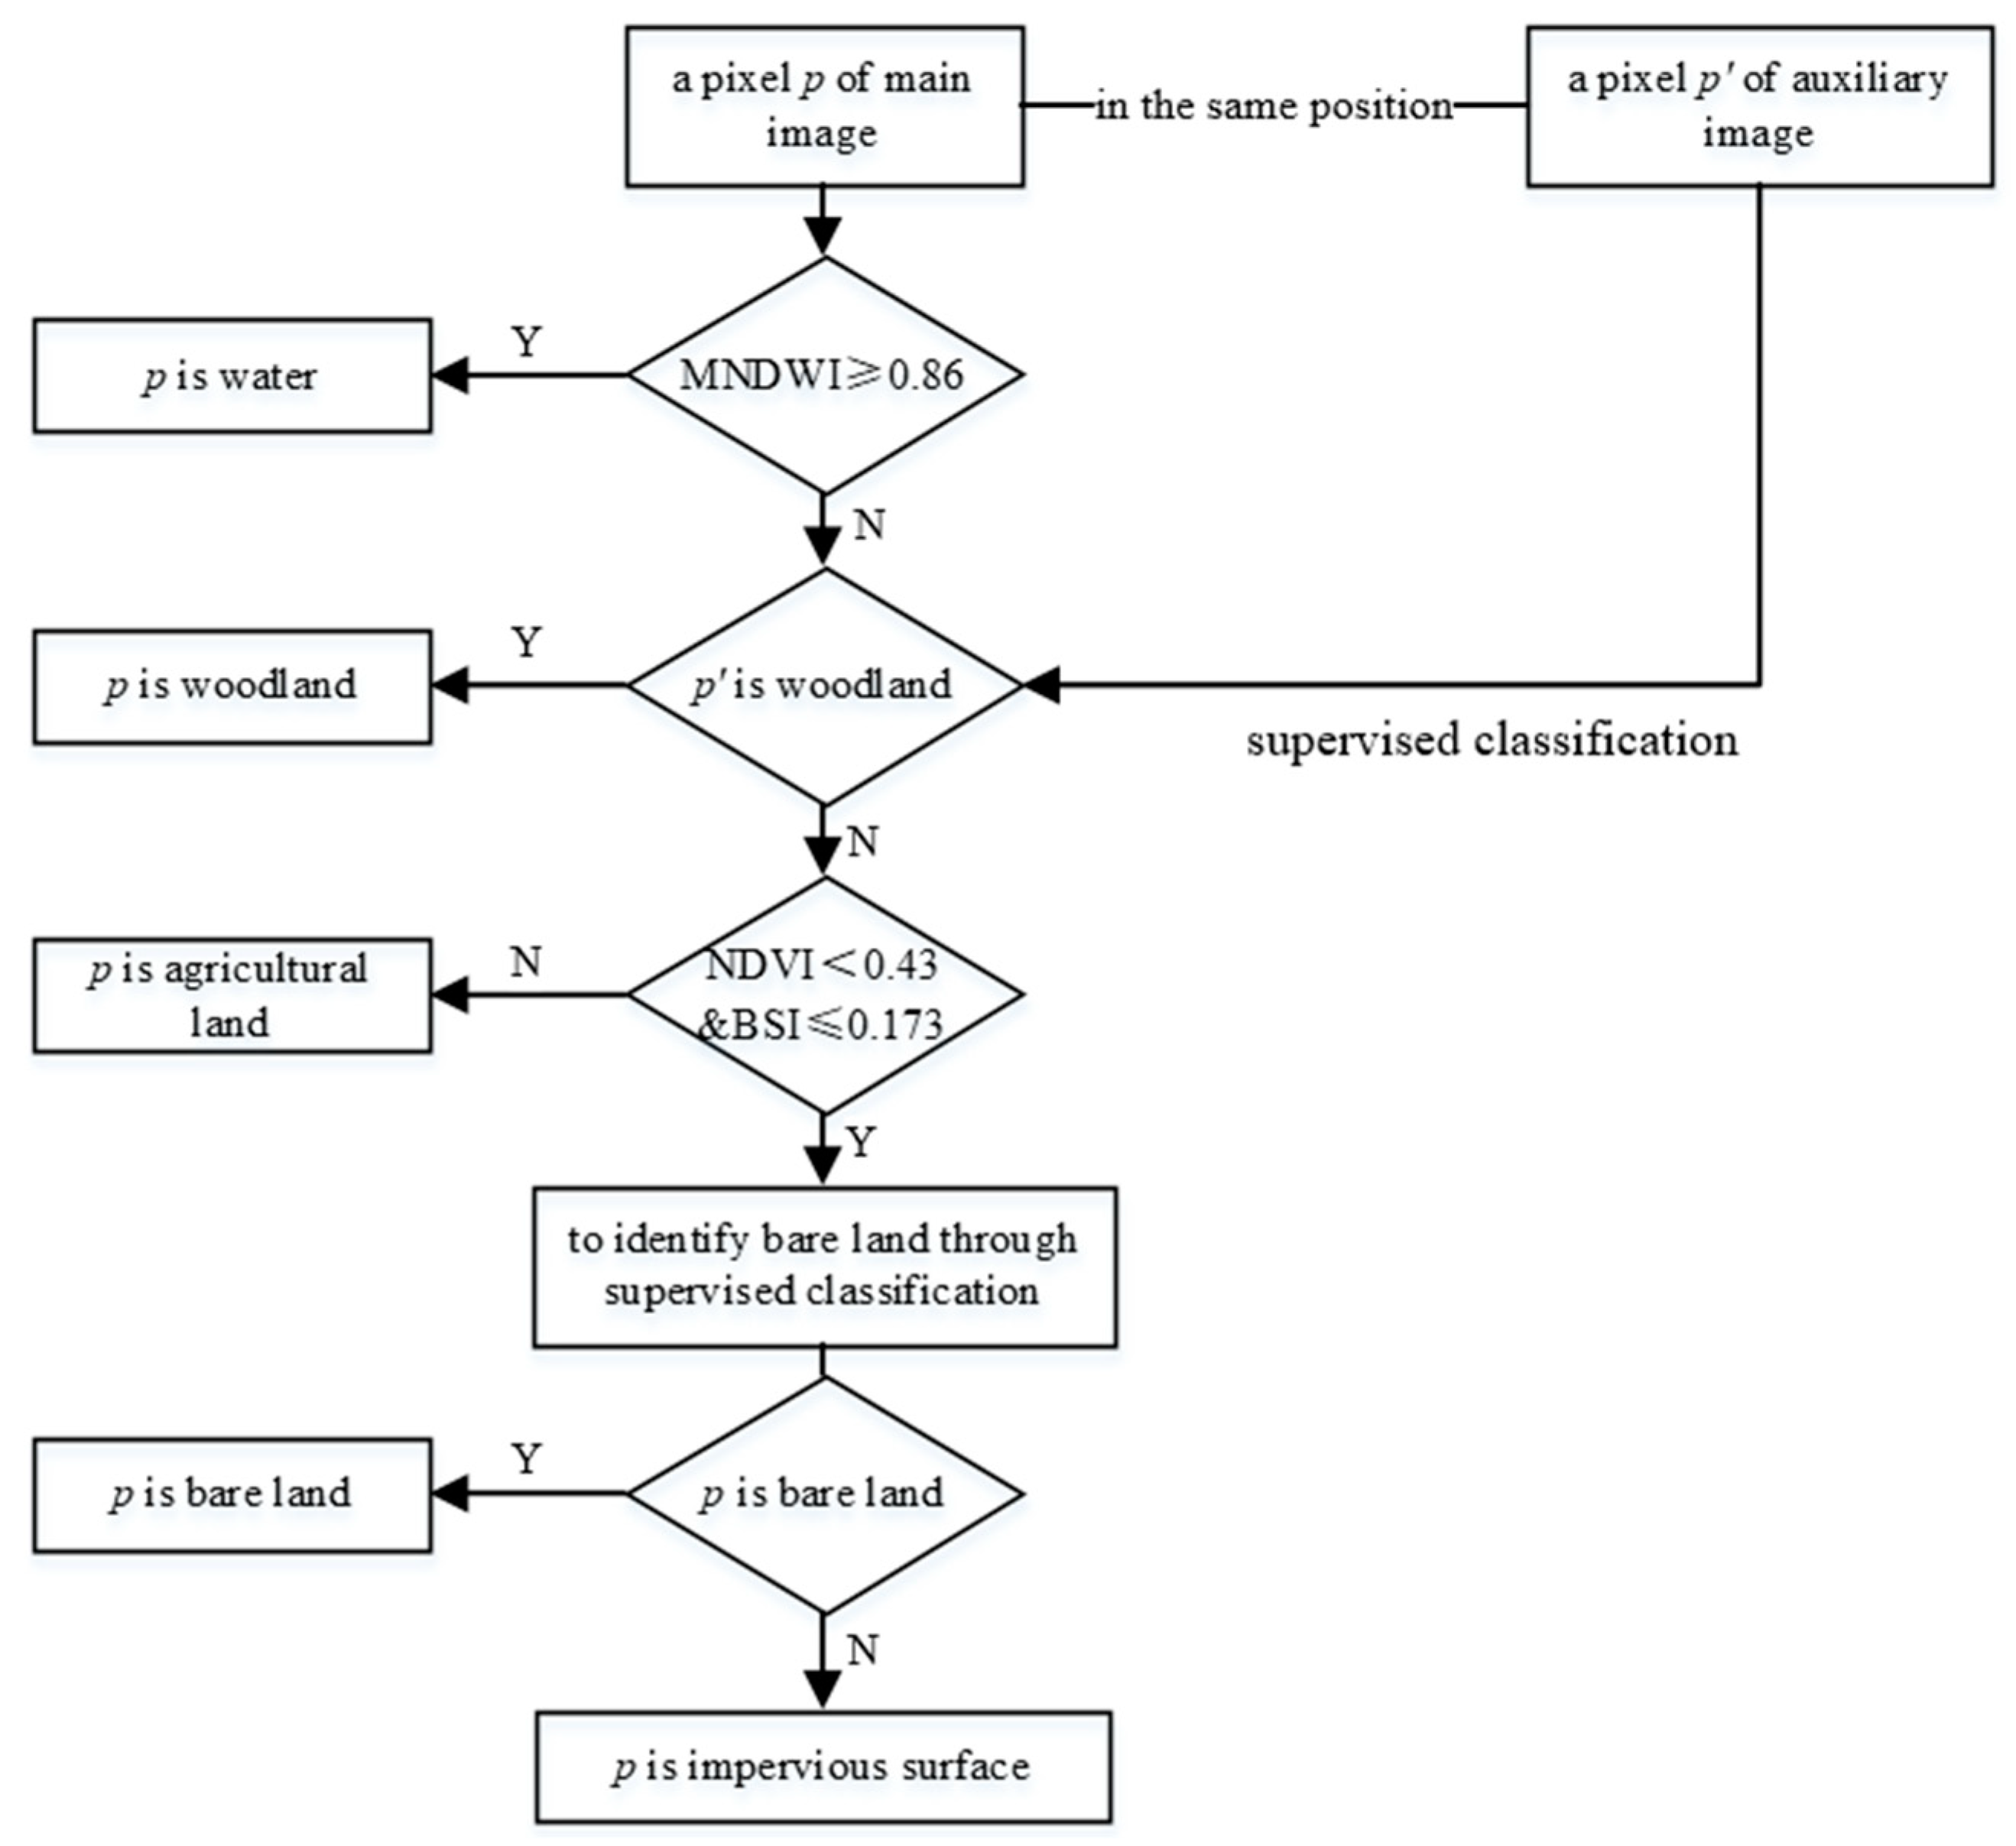
3.1. Extraction of Long-Term Impervious Surface Information

For long-term remote sensing images, the semi-automatic decision tree classification model only considers remote sensing images in a single year and does not use spatial neighborhood information, which leads to poor integrity and continuity of the ground features over space and time. We designed a neighborhood-based spatio-temporal filter (NSTF) method to improve the accuracy in monitoring dynamic changes in impervious surfaces. The algorithm framework integrates previous work of the “spatio-temporal refinement method” proposed by Chai and Li [18] and the GAMMA index in reducing the salt-and-pepper noise by Jiang et al. [27,28]. The NSTF ensured spatio-temporal consistency in terms of the attribute changes of a pixel throughout the entire study period. The detailed NSTF algorithm was programmed in MathWorks® MATLAB R2019a, which is suitable for high-dimensional matrix calculations.

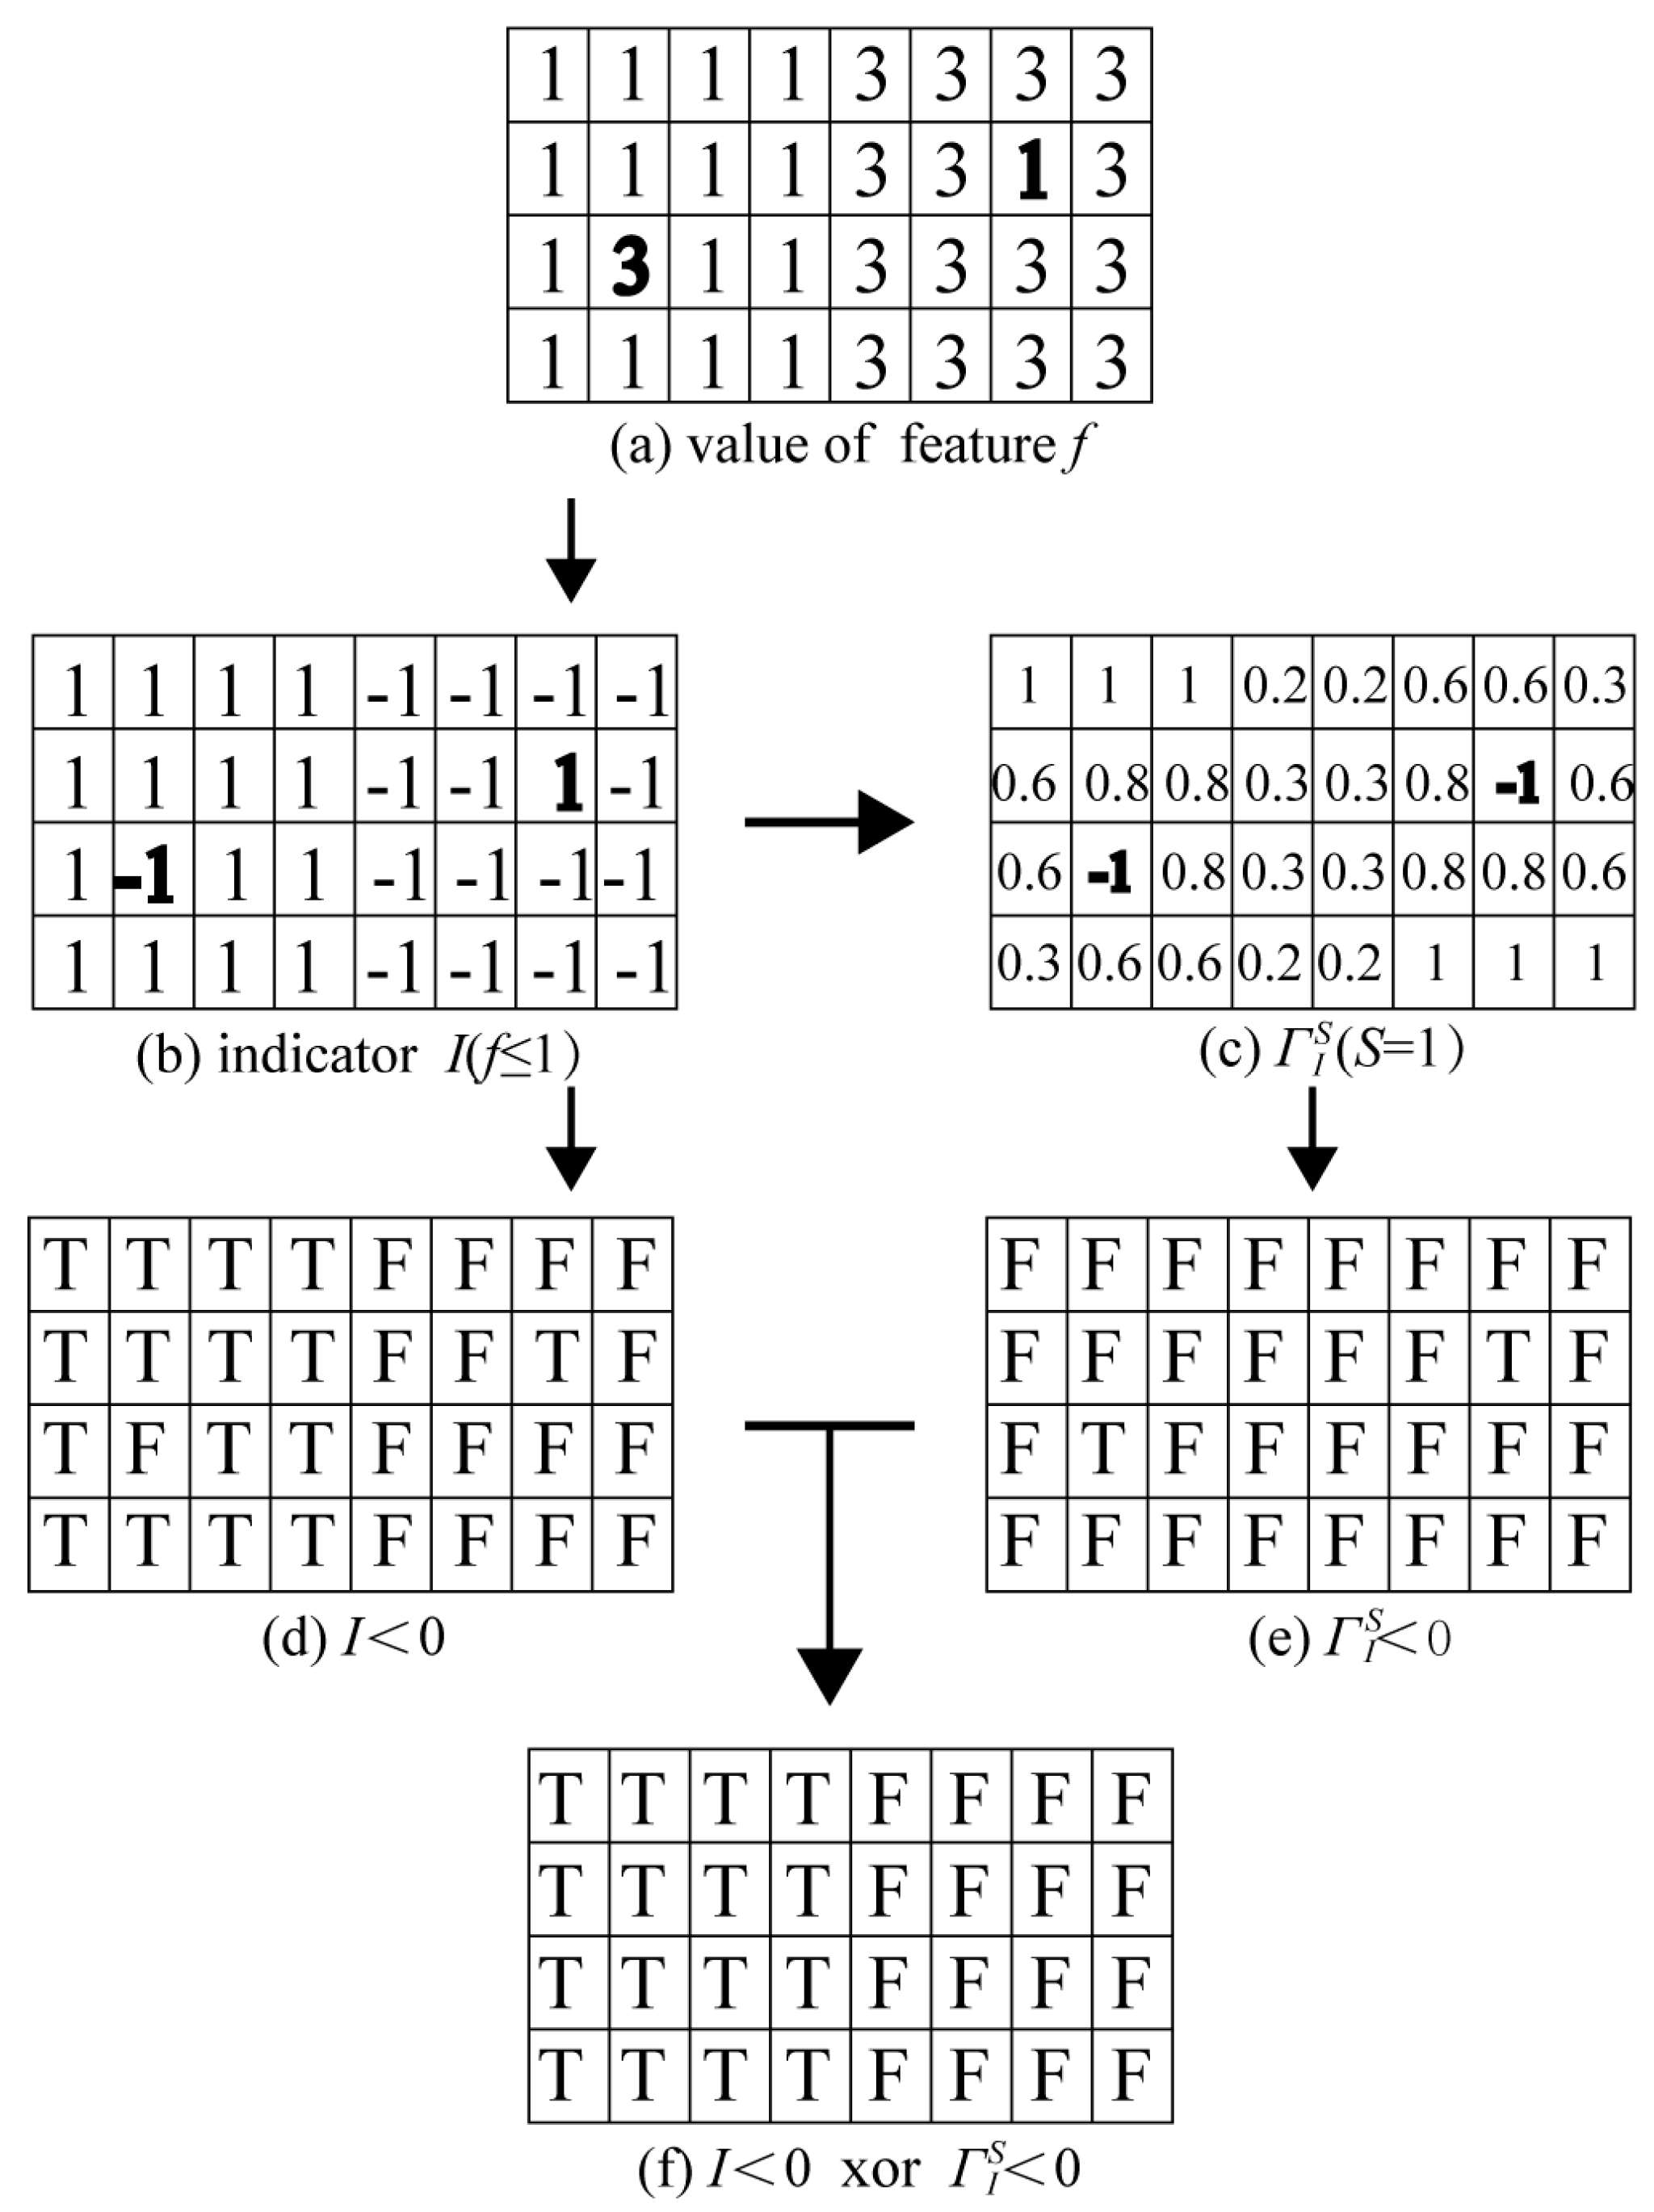
3.1.1. Basic Concepts

1. Indicator variable: An indicator variable represents whether a test result is TRUE. It can be defined as follows,
I ( f δ ) = { 1 ,   f δ 1 ,   f > δ
where f is the attribute value of a pixel in the image (which refers to the classification here), and δ is the threshold.
2. Local spatial autocorrelation statistic: One common local spatial autocorrelation statistic is the Gamma index [28]. The larger the statistics value, the higher the similarity between the attribute of the pixel and that of its adjacent pixels. It can be defined as follows,
Γ I S ( i ) = j W i , j S I ( i ) I ( j ) j W i , j S
where Γ I S ( i ) represents the Gamma value of pixel i and S is the neighborhood window. I ( i ) and I ( j ) refer to the attribute values of pixels i and j, respectively; W i , j S is 1 if the pixel j is in the S window of the pixel i; otherwise, it is 0.

3.1.2. Spatial Filtering

Misclassification (such as salt-and-pepper noise) can result in the underestimation of the size of an impervious surface patch. Such patches were therefore removed from the single images within the basic dataset [18]. Spatial filtering integrates the concept of a focal-test-based spatial decision tree [27]. Considering Figure 3 as an example, there are two classifications in feature f: 1 represents the pervious surface and 3 represents the impervious surface (Figure 3a). First, we assumed that the size of the neighborhood window S was 1 (3 pixels × 3 pixels) and used the indicator variable (Figure 3b) to classify it as T or F (Figure 3d). Second, we calculated its local spatial autocorrelation statistic value based on Figure 3b (Figure 3c) and classified it as T or F (Figure 3e). Third, we used XOR operation for the pixel values at the same position in Figure 3d,e to obtain the final filtering result; thus, the salt-and-pepper noise was effectively identified and corrected (Figure 3f).
In this study, the accuracy of extracting impervious surfaces is sensitive to the specification of the neighborhood window size S. We used Shannon entropy and information gain to assess the optimal window size [27,37]. The larger the information-gain value, the closer the classification result is to the actual situation (according to the window size). Now consider a dataset D with K classes, the entropy and information gain (or entropy reduction) can be defined as Equations (3) and (4), respectively.
E n t ( D ) = k = 1 K p k l o g 2 p k
where E n t ( D ) is the entropy of a dataset D and p k is the probability of a sample in class k (k = 1 ,   2 , , K ).
G a i n ( D , a ) = E n t ( D ) v = 1 V | D v | | D |   E n t ( D v )
where G a i n ( D , a ) is the information gain of a dataset D with its discrete attribute a under different window sizes (S), E n t ( D ) is the entropy in the actual situation, and E n t ( D v ) is the entropy of subsample D v with V possible values of discrete attribute a under different window sizes (S). If the classification is the same with its actual situation, v = 1 V | D v | | D |   E n t ( D v ) = 0 , then G a i n ( D , a ) = E n t ( D ) , the information gain is the maximum.

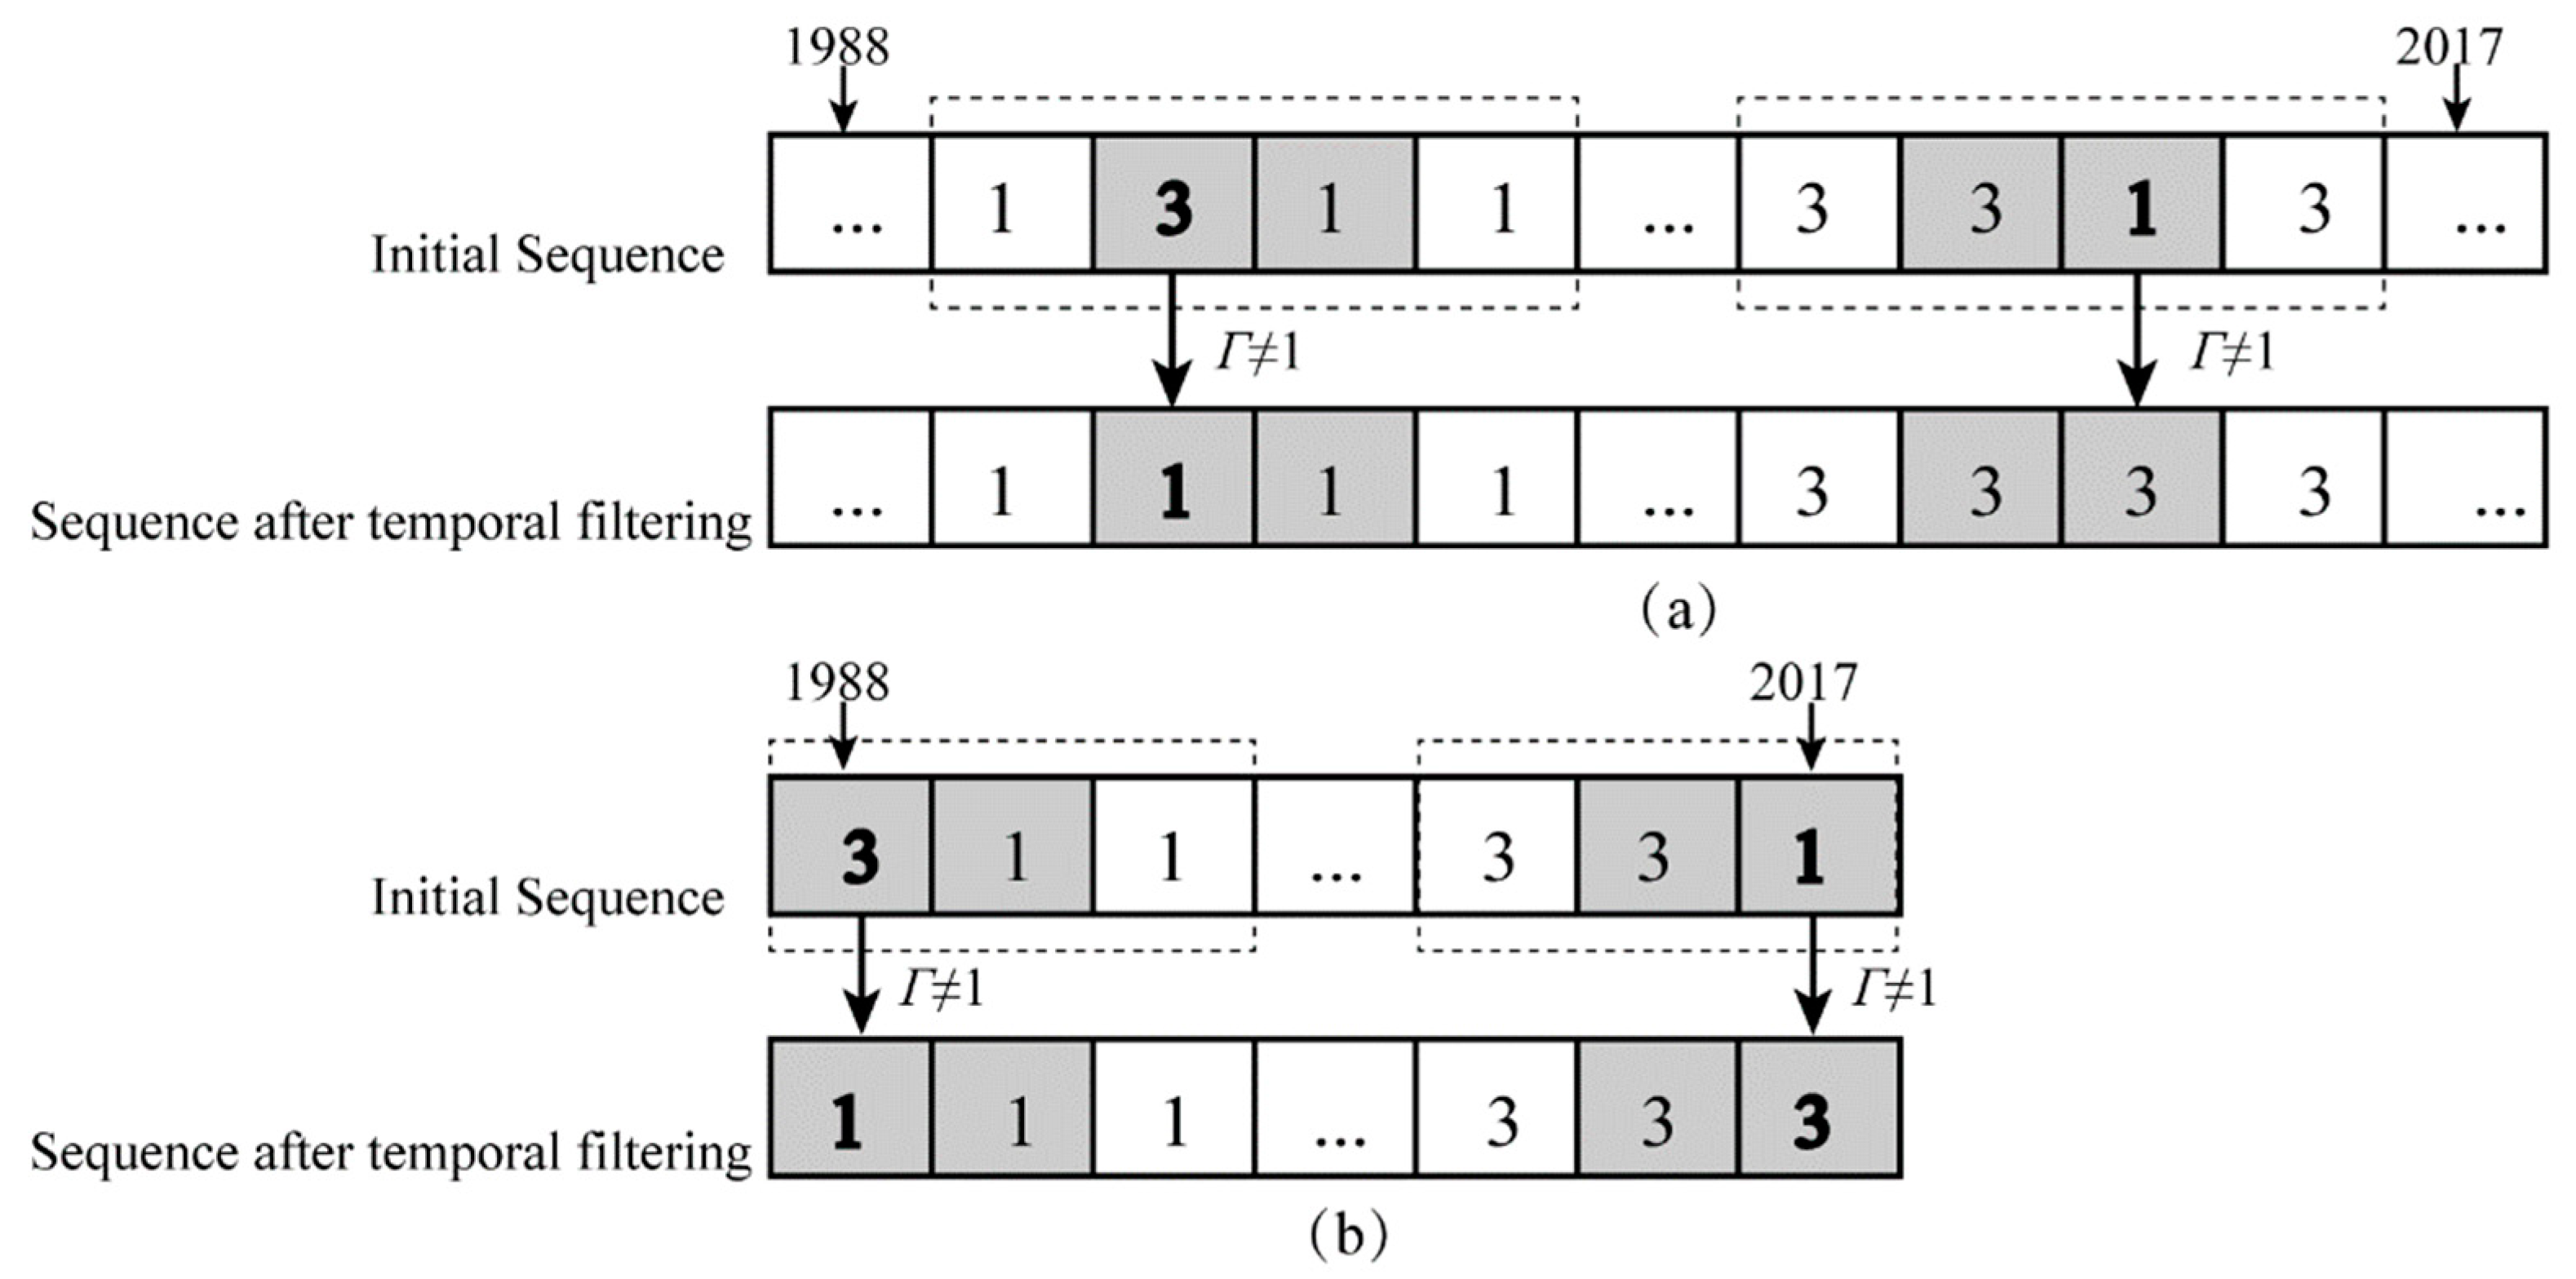
3.1.3. Temporal Filtering

To easily identify urban-expansion patterns, transition from an impervious surface to a pervious surface is supposed not likely to occur and should be avoided [38]. Based on the assumption, a set of simple rules was presented to correct this unlikely transition. In Figure 4a, the correction window comprises four years (in dotted rectangles); the two phases involved in the transformation are basic modification units (BMU) (in solid gray rectangles), if the attributes in these two adjacent phases of the BMU are pervious surfaces (1), and the Γ value is not 1 (if the Γ value is 1, the class of the pixel and that of the surroundings is the same; hence, it is less likely to be wrongly classified as salt-and-pepper noise). The impervious surface attribute (3) of the pixel is modified to a pervious surface (1). Similarly, if the attributes in the two adjacent phases of the BMU are impervious surfaces (3), and the Γ value is not 1, the pervious surface attribute (1) of the pixel in the year is modified to an impervious surface (3). For the pixels at the beginning or end of the study period, the correction reference is only based on the pixel of the following or the preceding phase of the BMU and its Γ value (Figure 4b).

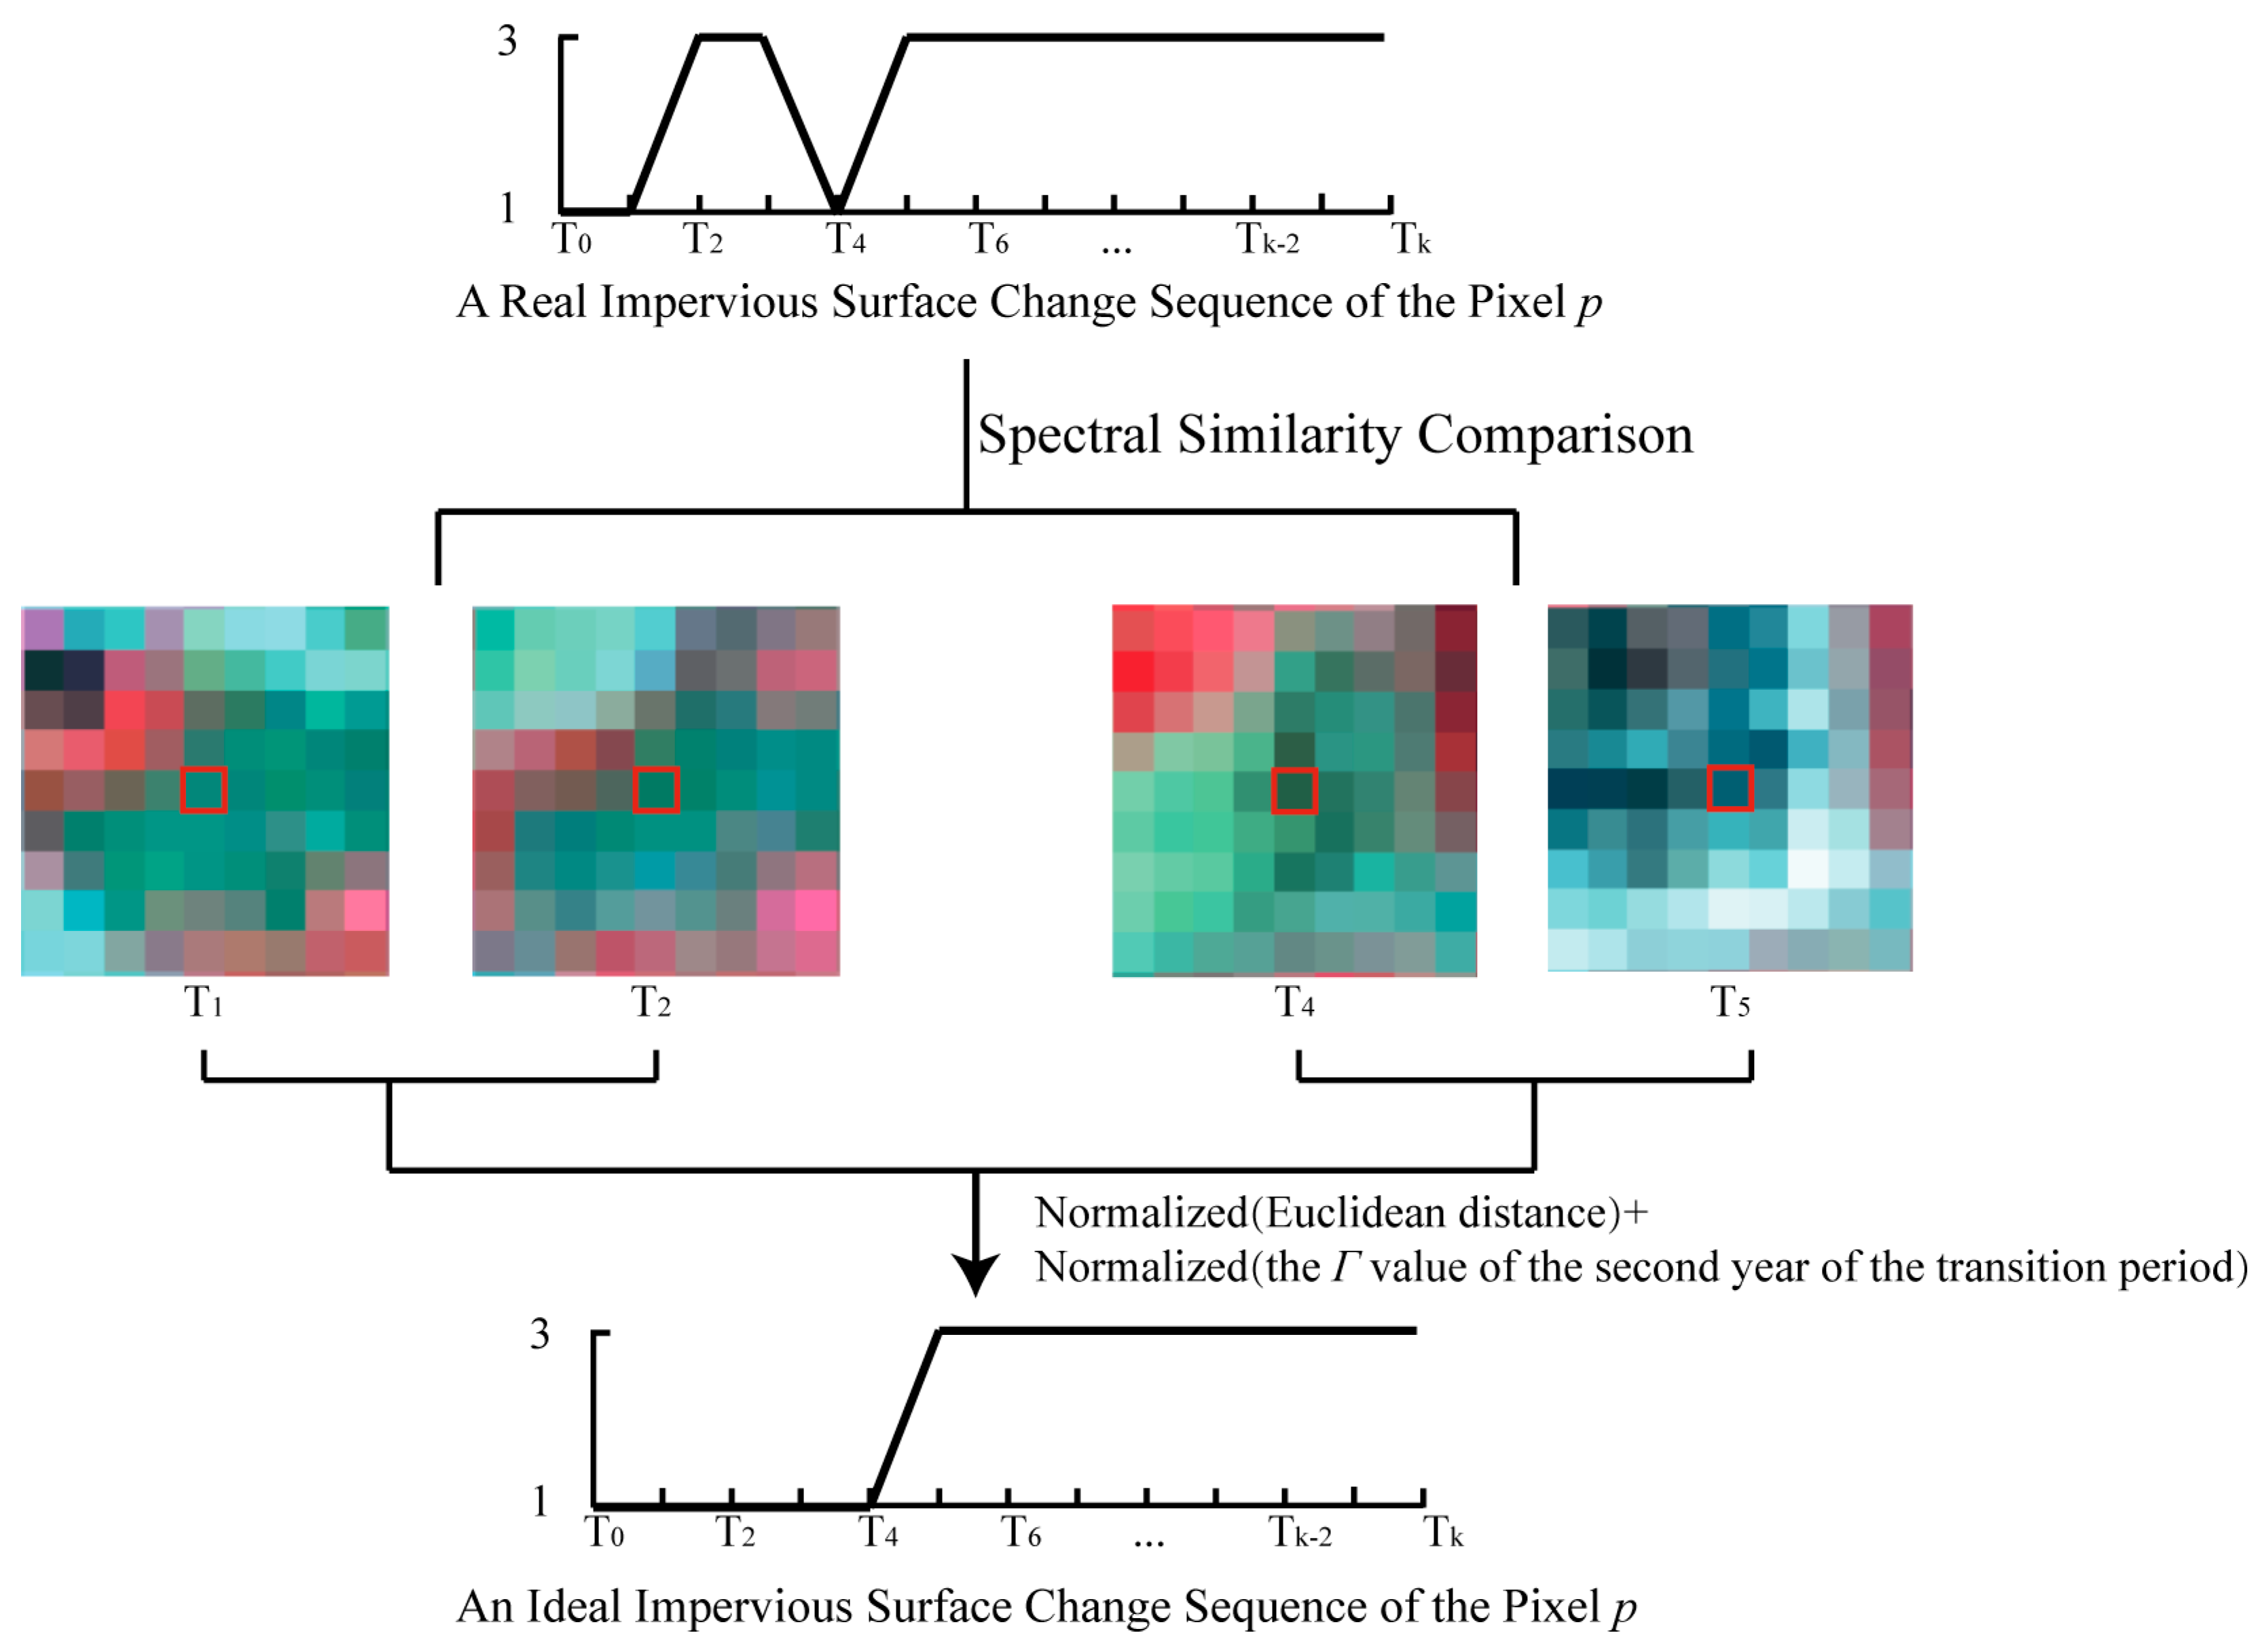
3.1.4. Spectral Filtering

When the pixels’ attributes of the two adjacent phases of the BMU are inconsistent (such as 1313), it implies that the pixel in the BMU has undergone two transitions from a pervious surface to an impervious surface during the study period. In such cases, temporal filtering cannot provide a correction reference. Therefore, spectral information is used to determine the ideal change sequence of impervious surfaces. As shown in Figure 5, the target pixel, p, has two transitional periods, T1T2 and T4T5. The RGB band information of the four years of a pixel p is extracted to form the spectral vector. The Euclidean distance of the RGB of pixel p is calculated in the two transitional periods. The larger Euclidean distance (or smaller spectral similarity) indicates that the actual transition is more likely to happen. At the same time, the Γ value of the second year of the transitional period will be calculated. Practically, there is a strong geographic correlation between different regions. We assume that if there are more impervious surface pixels around a pixel, the greater the Γ value, and the greater the probability that the pixel will grow into an impervious surface. Finally, the Euclidean distance and the Γ value are, respectively, normalized and then summed. The transitional period with the largest value is retained, and an ideal change sequence of impervious surfaces of a pixel p is formed.

3.1.5. Accuracy Assessment

The sample point verification method was used to evaluate the final classification results. The classification accuracy assessment was adopted from visual interpretation to compare the results of each year with the actual scenario before 2006. After that, the high-resolution images of the same month of GOOGLE EARTH were used as a reference for judging the actual pixel. In each year, we generated approximately 1000 samples in the study area, roughly half and half for the impervious and pervious surfaces, respectively. Finally, the classification results were assessed in terms of the confusion matrix, the omission and commission errors, overall accuracy (OA), and the kappa coefficients.

3.2. Analysis Method

3.2.1. Expansion Intensity Index

The expansion intensity index (EII) was adopted to analyze the degree of impervious surface expansion. To quantitatively compare the expansion speed in different periods, the EII was standardized as follows,
EII = U b U a A × 1 T b a × 100
where U a and U b are the impervious surface areas in years a and b, respectively, A is the total area of the study area, and T b a is the temporal difference between years a and b.
According to the values of EII, the expansion intensity of an impervious surface was divided into five types: slow expansion (0–0.28), low expansion (0.28–0.59), medium expansion (0.59–1.05), fast expansion (1.05–1.92), and high expansion (>1.92) [11,39].

3.2.2. Landscape Expansion Index

Three different landscape expansion types are defined based on the relationship between impervious surfaces and the surrounding land: infilling, edge expansion, and outlying [40]. If the newly added impervious surface patch is highly surrounded by developed land (impervious surface), its expansion type is classified as “infilling”; if the newly added patch intersects with the developed land and expands outward, or is sparsely surrounded by the developed land, it is classified as “edge expansion”; if the new patch does not intersect or adjoin the developed land, it is classified as “outlying”. Outlying has the greatest effect on the growth of the urban footprint and the fragmentation of open land. The landscape expansion index (LEI) is used to determine the above three expansion types, which can be defined as follows,
LEI = 100 × A O A o + A v
where A O is the intersection area between the buffer zone of the newly added patch and the occupied patches, and A v is the intersection area between the buffer zone of the newly added patch and a vacant category.
The LEI value ranges between 0 and 100. If LEI > 50, the expansion type of impervious surface is “infilling”; if 0 < LEI ≤ 50, it is “edge expansion”; and if LEI = 0, it is “outlying”. Here, to obtain a stable LEI value, the buffer radius was set to 1 m [40].
There is a certain correspondence between the aforementioned three expansion types and the re-densification, onion/tree, and leapfrog growth types of urban growth theory [41]. To achieve a higher level of urban growth under limited land use, re-densification is used to fill in the original urban built-up areas. Onion/tree growth indicates that new development land is laid out in the land surrounding the city center (seeds), as a circular growth pattern spreading in a certain direction (due to topographical constraints or better traffic conditions), resulting in a tree shape of city development. In terms of leapfrog growth, a newly added urban patch, such as the construction of an EDA, develops isolatedly from the current urban center.

4. Results and Analysis

4.1. Evaluation of Classification Acuracy

Following the sequence of the NSTF algorithms, we could calculate the confusion matrix (Table 3) and the accuracy evaluation results for the final impervious surface datasets in the QRB (Table 4). From Table 3, we could further derive the user accuracy and the producer accuracy of the impervious surfaces (IS) beyond 97.5% and 90.4% on average, respectively. The omission error was below 10%, while the commission error was below 3%. The OAs in all years were about 95%, and all the kappa coefficients were above 0.90. Therefore, the classification accuracies were as good as expected.

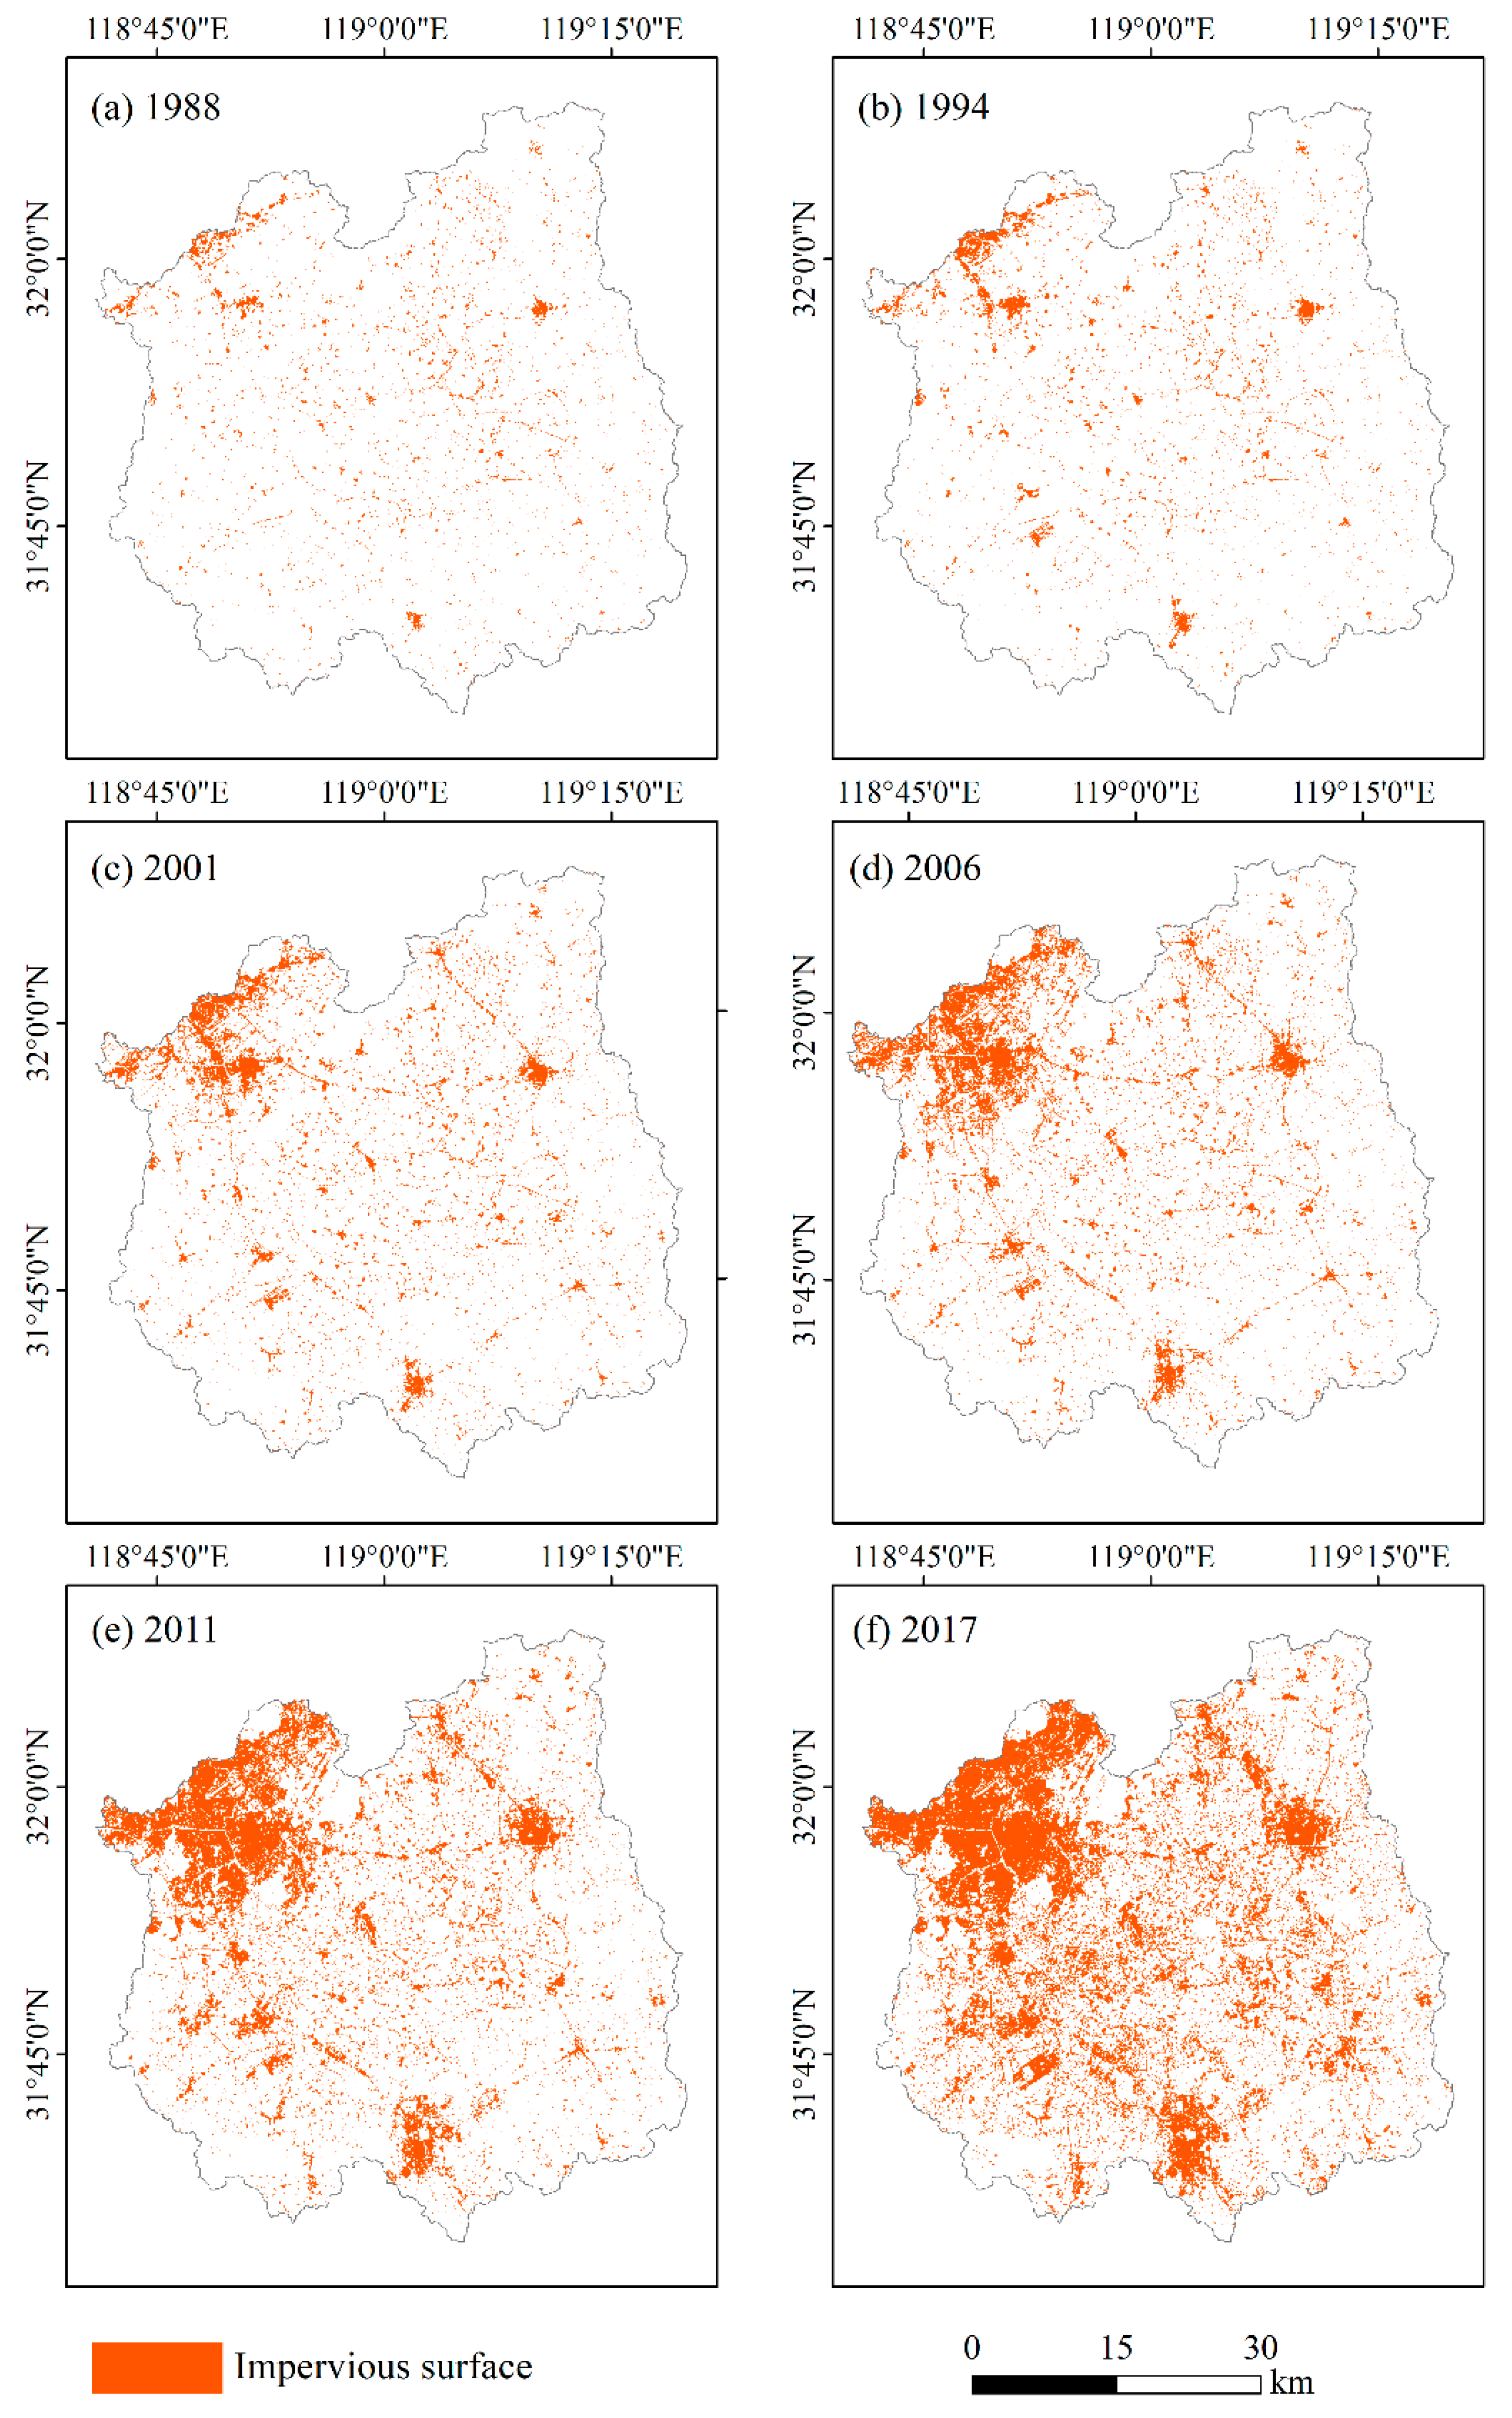
4.2. Spatio-Temporal Distribution Characteristics of Impervious Surfaces in the QRB

To reveal the urban expansion patterns in the QRB, the spatio-temporal distribution characteristics of the impervious surfaces were analyzed in different periods. Figure 6 shows the impervious surface expansion in the QRB, 1988–2017. Overall, impervious surfaces in the QRB have expanded over space and time, and their spatial distribution and shapes have undergone significant changes since 1988. In the late 1980s, impervious surfaces were scattered throughout the basin, mainly in the urban built-up areas of Nanjing and other administrative centers, including Dongshan Subdistrict (urban built-up area of Jiangning), Yongyang Subdistrict (urban built-up area of Lishui), and Huayang Subdistrict (urban built-up area of Jurong) (Figure 6a).
In the 1990s, there were no apparent changes in the spatial distribution of impervious surfaces in the QRB, maintaining the original spatial characteristics. As shown in Figure 6b, new patches were mainly concentrated in the four urban built-up areas and Lukou Subdistrict in Jiangning District, where Nanjing Lukou International Airport is located. As one of the major airports in East China, the construction of this airport in 1995 has been operation since 1997. Expressways, including the Nanjing Airport Expressway and the Nanjing-Xuancheng Intra-provincial Expressway, were simultaneously constructed. They effectively promoted the further construction of the transportation system, accelerating economic development and international exchange. Up to 2001, impervious surfaces in the QRB had grown slowly (Figure 6c). In the period of 1994–2001, the increase in impervious surfaces was mainly related to urban built-up areas with a total increase of 40.85 km2, accounting for more than half (57%) of the increase in the QRB (Table 5).
Since the beginning of the 21st century, impervious surfaces in the QRB have undergone rapid expansion under rapid urbanization processes. In 2011, the total area of impervious surfaces in the QRB reached 405.3 km2, an amount 5.75 times that of 1988 (Table 5). Between 2001 and 2011, the area of impervious surfaces in the basin increased by 232.63 km2, with an average annual growth rate of 23.26 km2/year, being 2.96 times the growth rate (7.86 km2/year) of that between 1988 and 2001 (Table 5). Figure 6c–e shows that impervious surface growth was still concentrated in the urban built-up areas. The area of impervious surfaces in the urban built-up areas in 2011 was 214.71 km2, 7.23 times that in the urban built-up areas in 1988 (29.70 km2) (Table 5). In particular, there was a significant expansion of impervious surfaces in Jiangning District (Figure 6e). The impervious surfaces continued to expand to the southeast, with the upgrade of the administrative status of Jiangning District from county to city level since 2000 [42].
After 2011, the expansion of impervious surfaces in the QRB became more significant. The changes were comparable to the substantial growth in the urban areas and their surroundings (Figure 6e,f). The area of impervious surfaces in the QRB reached 662.51 km2 in 2017, 9.40 times that of 1988 (Table 5). The average annual growth rate of impervious surfaces in the QRB during 2011–2017 was 42.87 km2/year, exceeding the average annual growth rate between 2001–2011. In 2017, the non-urban built-up areas in the QRB reached 375.22 km2 (Table 5). In particular, the growth in impervious surfaces in the non-urban built-up areas exceeded that in the urban built-up areas in 2017, meaning that urbanization in the QRB had entered a relatively mature stage. In this year, the shapes of the urban areas had changed. The various patches of impervious surfaces in the urban built-up area of Nanjing were connected like long and narrow strips, while those of Jiangning in double clusters as well as irregular clusters in Lishui and Jurong Districts.

4.3. EII of Impervious Surfaces in the QRB

The EII of the impervious surfaces in the QRB throughout the five different periods changed significantly (Table 6). Prior to 2006, the expansion intensity of impervious surfaces gradually changed from slow to medium with the increasing demand for urban space development with the EII increasing from 0.19 to 0.68. After that, however, the area of impervious surfaces grew rapidly with the EII higher than 1.05.
There have been obvious changes in the urban built-up area of Nanjing. In 1988, Nanjing was the relatively urbanized area as its EII was the highest among the four regions. Nanjing moved into the fast lane with the EII of 1.30 in 1988 to 2.84 in 2006. After that, the development of Nanjing began to gradually decline to a fast rate (1.69). Considering the other regions, Jiangning District underwent a period of rapid expansion in 2006 and expanded steadily. The expansion intensity of impervious surfaces in Lishui District was relatively slow but entered a period of rapid expansion (1.76) after 2011. The changes of EII in Jurong District were similar to those of Lishui District. Comparatively, Jurong District was the slowest in the initial period but developed rapidly after 2011.
Overall, with regional economic development and policy promotion, the area of impervious surfaces in the QRB continued to expand and eventually entered a period of rapid expansion. In 2000, Jiangning’s administrative level was upgraded from a county level to a district one, leading to the rapid expansion of impervious surfaces southeast. In 2003, with the release of the “Nanjing Metropolitan Circle Plan (2002–2020)”, Nanjing was established as the central city in the Yangtze River Basin. With Jiangning District being a part of the center of the Nanjing Metropolitan Circle, its rapid expansion was maintained. In 2011, Jiangning District became the new economic center with its EII beyond that of the urban built-up area of Nanjing. As Lishui District and Jurong District also belong to the core of the Nanjing Metropolitan Circle, their urbanization development is also significant with the improvement in their administrative levels and transportation facilities.

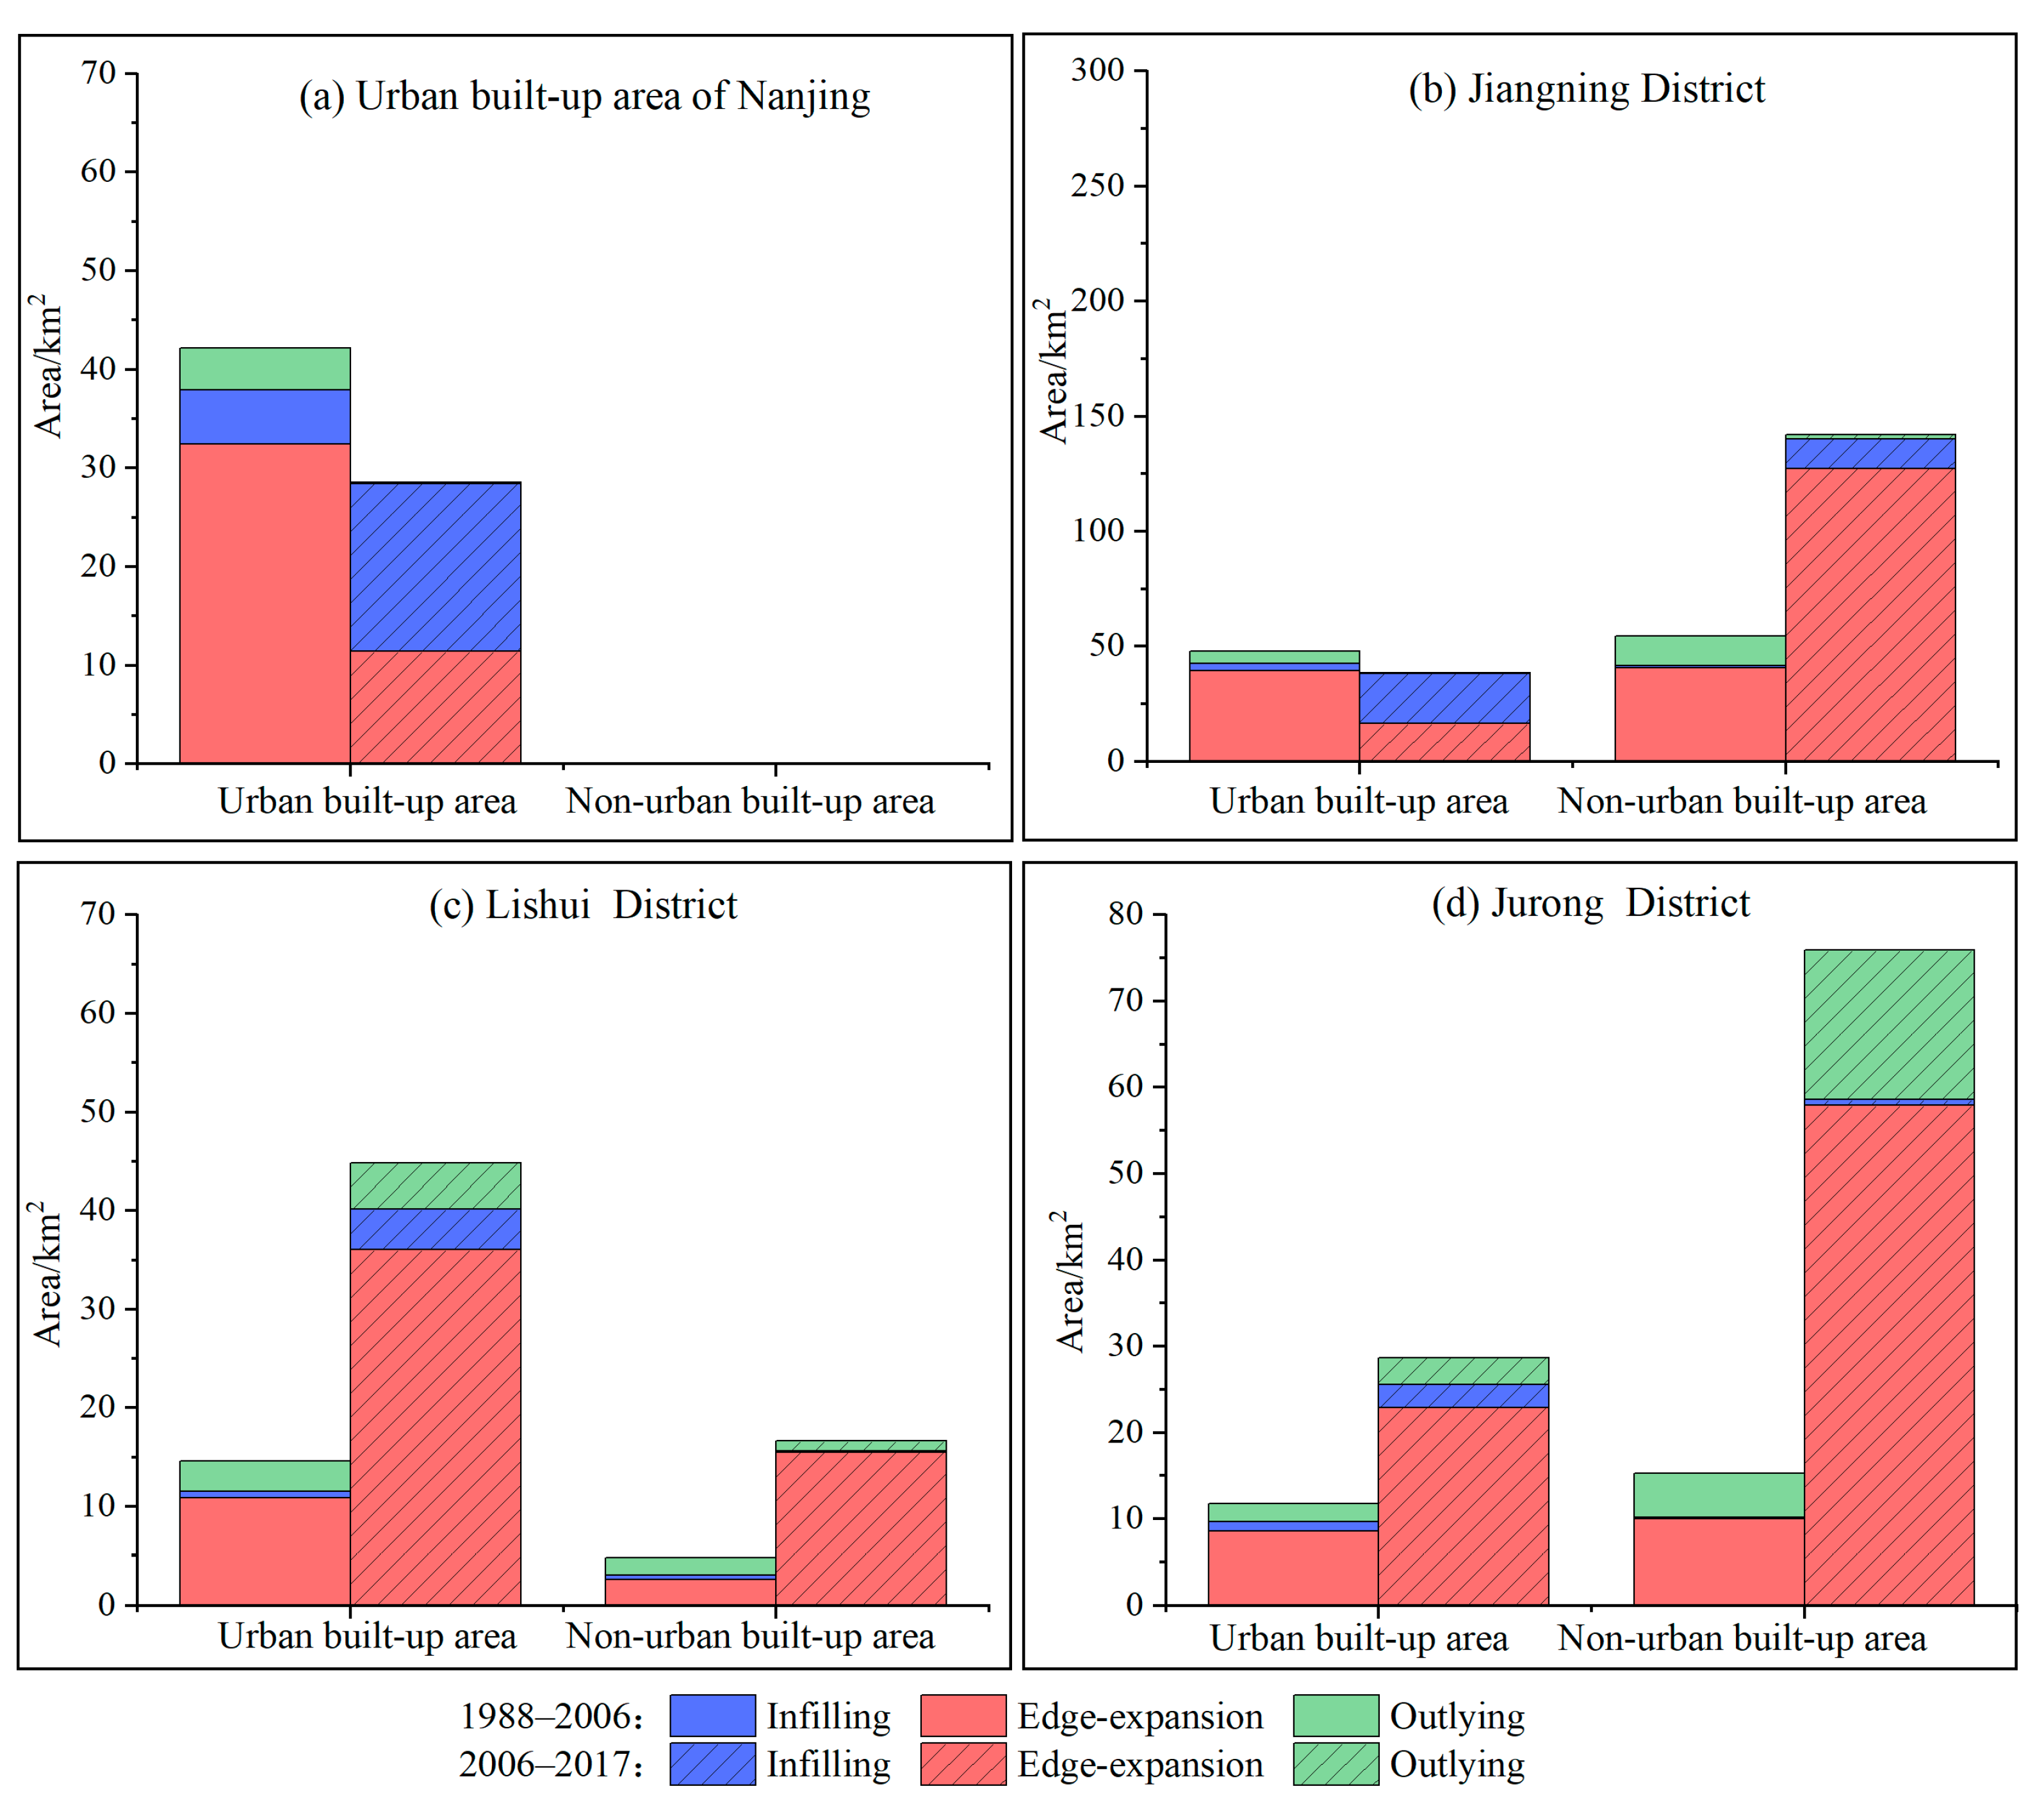
4.4. Expansion Pattern of Impervious Surfaces in the QRB

The expansion of impervious surfaces is directly related to urbanization. In terms of the LEI, the types of impervious surface expansion in the QRB were obtained (Figure 7). Edge expansion was the main type of impervious surface expansion. New construction lands were laid out in the surroundings, beginning as the existing urban centers and eventually in onion/tree growth patterns. Due to the different geographical locations and topographical conditions, the expansion of impervious surfaces was obviously presented as spatial heterogeneity. Over time, infilling expansion steadily increased the impervious surfaces in the urban built-up areas, indicating the development patterns gradually changing from external to internal construction. The proportion of outlying areas was generally relatively small; however, it had increased only in 1994–2001 and 2011–2017 (Table 7). During these two periods, the location of outlying areas gradually shifted from the middle (Jiangning District and surrounding land) to the upper reaches (including Hushu Subdistrict, Houbai Subdistrict, and Tianwang Subdistrict), indicating that the development of the subdistricts was in line with the goals of urban and rural planning [34,35].
We further counted three expansion types of newly added impervious surfaces in the QRB in each period (Table 7). Between 1988 and 1994, the proportion of edge expansion was the highest (77%), while infilling was the lowest (6%). From 2006, the proportion of infilling began to increase in the QRB (over 14%). The percentage of the outlying was relatively stable (around 15%) during the study period.
To explore the expansion pattern of the impervious surfaces on a smaller spatial scale, the areas of the three landscape expansion types in the urban and non-urban built-up areas of the four district regions in 1988–2006 and 2006–2017 were evaluated (Figure 8).
The center of urban development was in the built-up areas of Nanjing and the Jiangning districts. Before 2006, the total areas of edge expansion, infilling, and outlying of these two regions were 72 km2, 8.48 km2, and 9.58 km2, respectively. Edge expansion as the primary expansion type was mainly concentrated in the urban built-up areas, in accordance with local policies. In 2001, based on the urban planning strategy, the urban built-up areas in Nanjing were directed to the south and the east. This had a major impact on the development of Jiangning District, not only in the improvement of its administrative level, but also the upgrade of Dongshan Subdistrict as a new urban center of Nanjing [34]. To maintain the pace of urban development, several highway roads were constructed in Jiangning District. Dongshan Subdistrict simultaneously continued to expand to the south and the east, accompanied by the construction of the Nanjing Airport Expressway and the Nanjing–Hangzhou Expressway. Furthermore, the series of policies and actions contributed to the urbanization of the subdistricts in the non-urban built-up areas of Jiangning District, such as Moling, Chunhua, and Qilin.
After 2006, the center of impervious surfaces was mainly located in the non-urban built-up areas of Jiangning by edge expansion (127.33 km2). It is worth noting that many patches were formed through infilling in the urban built-up areas (21.74 km2). With the acceleration of the urbanization processes, the amount of available building space in the urban built-up areas considerably shrank, leading to the internal urban development pattern. The re-densification of urban areas originated internally in the existing impervious surfaces. Dense urban structures (e.g., single-family residential dwellings) were replaced by modern structures (e.g., high-rise buildings). After 2011, urban areas began to develop in a leapfrog manner in the Tangshan, Hushu, and Lukou subdistricts, being important development targets in the urban planning strategy. These regions continued to grow towards through edge expansion, contributing to the continuous urbanization in Jiangning District (Figure 8b).
The urbanization process in Lishui District was slow. Before 2006, the impervious surfaces in Lishui were mainly developed by edge expansion (Figure 8c), and the pattern of the urban built-up area was directed toward the northwest. Since the EDA was built in 1993, several provincial and county roads had been constructed from the EDA to the urban built-up areas. Therefore, the EDA gradually dominated the spread direction. After that, the impervious surfaces of the urban built-up area increased by 36.06 km2, 4.08 km2, and 4.73 km2 through edge expansion, infilling, and outlying, respectively. With the investment of Lishui County Government in the EDA in 2008, its administrative level was advanced to a district one in 2013, further accelerating regional urbanization [43].
The Jurong District occupies an important strategic position in the Yangtze River Delta urban agglomerations in the Shanghai–Nanjing development. Before 2006, the newly added impervious surfaces in the urban built-up areas and non-urban built-up areas via edge expansion were 8.56 km2 and 10.02 km2, respectively (Figure 8d). In 2007, the government of Jurong decided to fully develop an EDA as a new economic core through many major projects [44]. The railways and highways of transportation networks in Jurong effectively promoted the development of the Houbai and Tianwang townships. As of 2017, the impervious surfaces in the non-urban built-up areas was still mainly formed by edge expansion as well as a small degree of outlying. The accelerating urbanization in Jurong District has become a modern city in the Nanjing Metropolitan Circle.

5. Discussion

5.1. Window Size S

In general, the specification of window size S in the spatial filtering of the NSTF algorithms directly relates to the classification accuracy. Table 8 lists the information gain of the image classification under different window sizes (S = 1, …, 5). Here, the window size was 3 pixels × 3 pixels for S = 1, 5 pixels × 5 pixels for S = 2, and so on. From this table, we could find that the information-gain values were increasing over time under different window sizes, meaning that the extent of the impervious surfaces had been increasing. However, information gain could obtain the best classification accuracy when the window size was 1 (S = 1).
The larger the study area, the more the spatial stratified heterogeneity may be, indicating that local areas with different geographic features may have different optimal window sizes. To obtain more refined post-processing results, we should self-adjust the particular optimal window size according to local areas in the future.

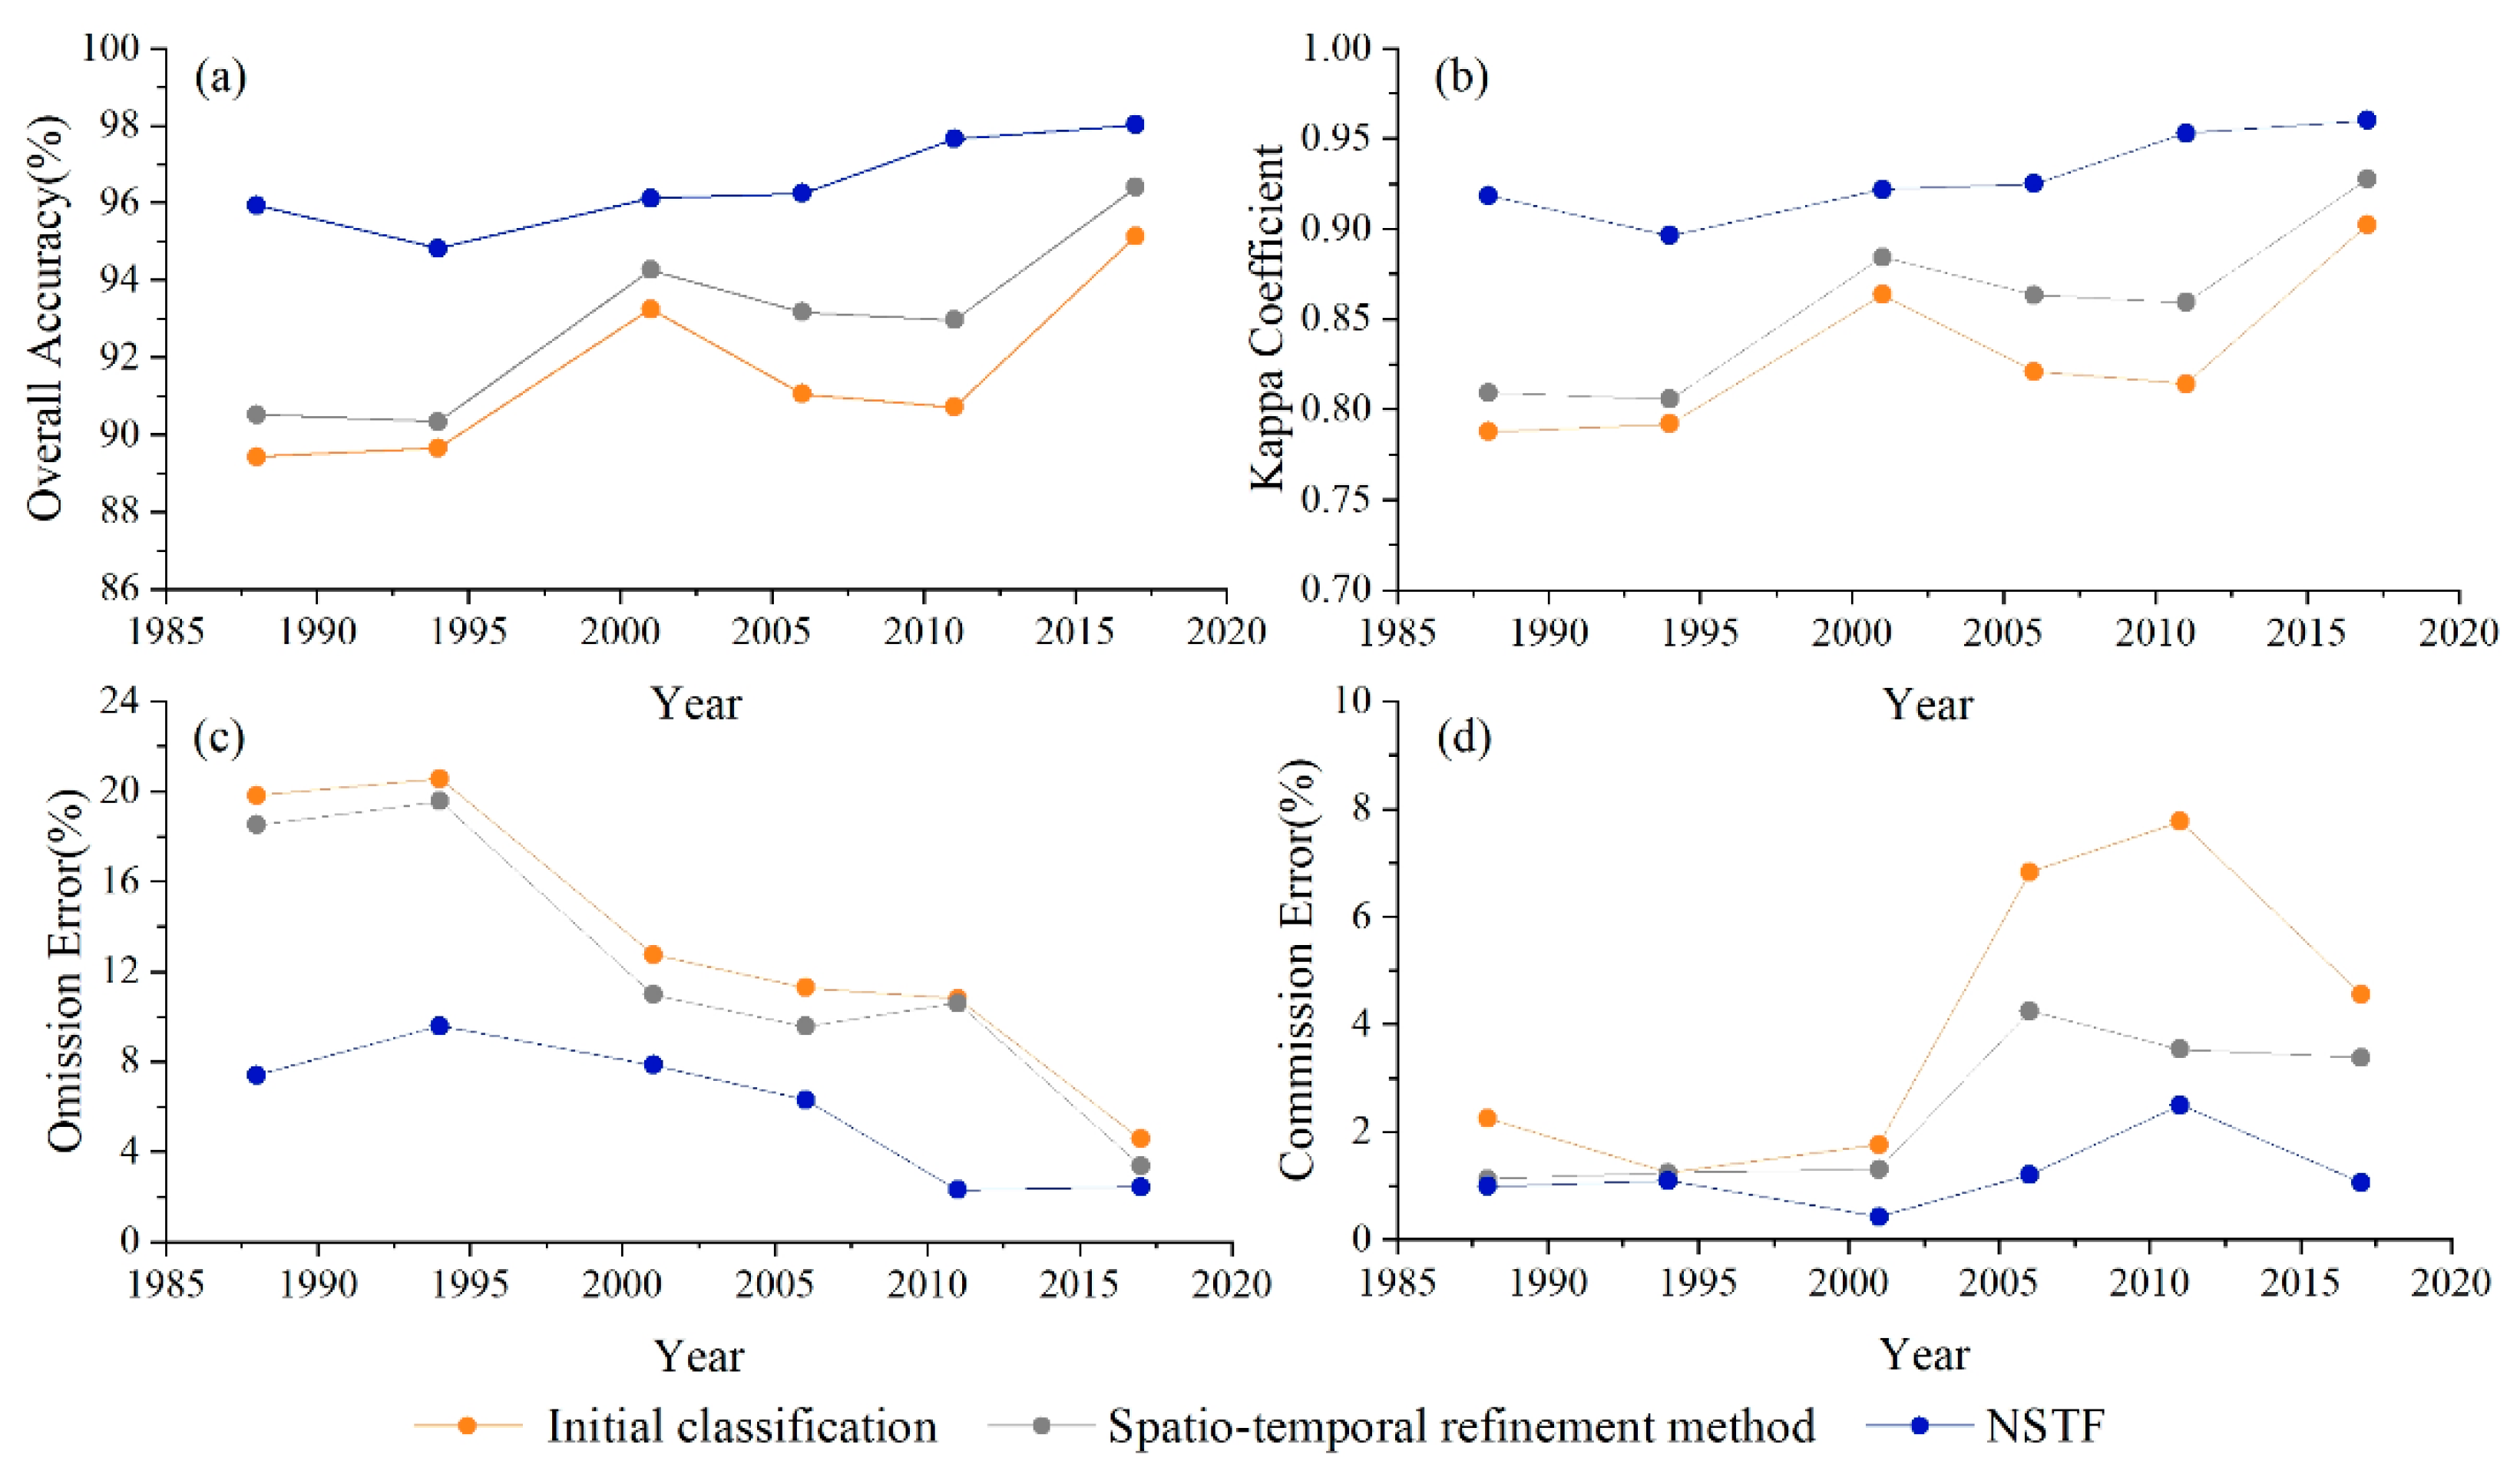
5.2. Accuracy Comparison of NSTF

To better evaluate the classification accuracy of the NSTF, we quantitatively compared the results from the semi-automatic decision tree classification (i.e., the initial classification), spatio-temporal refinement method, and the NSTF in the study. We used overall accuracy (OA), the kappa coefficients, and the omission and commission errors as evaluation criteria. Figure 9 shows the classification accuracy assessment of the impervious surfaces from different methods.
After semi-automatic decision tree classification, the OAs of the initial classification results were between 89.4% and 95.1%, with the kappa coefficients between 0.79 and 0.9, suggesting that the initial classification results could be used as the basic data for the subsequent ones. The OAs and kappa coefficients from spatio-temporal refinement method increased by 2% and 3% on average when compared with those from the initial classification. After the NSTF, the OAs of the six images were improved to about 95%, along with the kappa coefficients of between 0.9 and 0.96. In comparison with those from spatio-temporal refinement method, the NSTF could obtain much higher accuracy with an average increase of 4% in the OAs and 8% in the kappa coefficients, respectively.
There are two reasons for the accuracy improvement in the impervious surface datasets in the NSTF. First, the omission errors (Figure 9c) were greatly reduced. This method could proceed with all the initial results simultaneously to ensure the spatio-temporal consistency of the pixels. The average omission error of the NSTF was as low as 6% compared to those from the initial classification (13.2%) and spatio-temporal refinement method (12.1%). Second, the commission errors (Figure 9d) were also decreased because the incorporation of the Gamma index could reduce the salt-and-pepper noise. The average commission error of the NSTF was 1.2% compared with those from the initial classification (4.1%) and spatio-temporal refinement method (2.5%).

5.3. Main Expansion Patterns

During the past 30 years, “multi-core expansion” in the urban built-up areas and “point-axis expansion” along the roads have become the main expansion patterns of impervious surfaces in the QRB. Their associated manifestations are as follows:
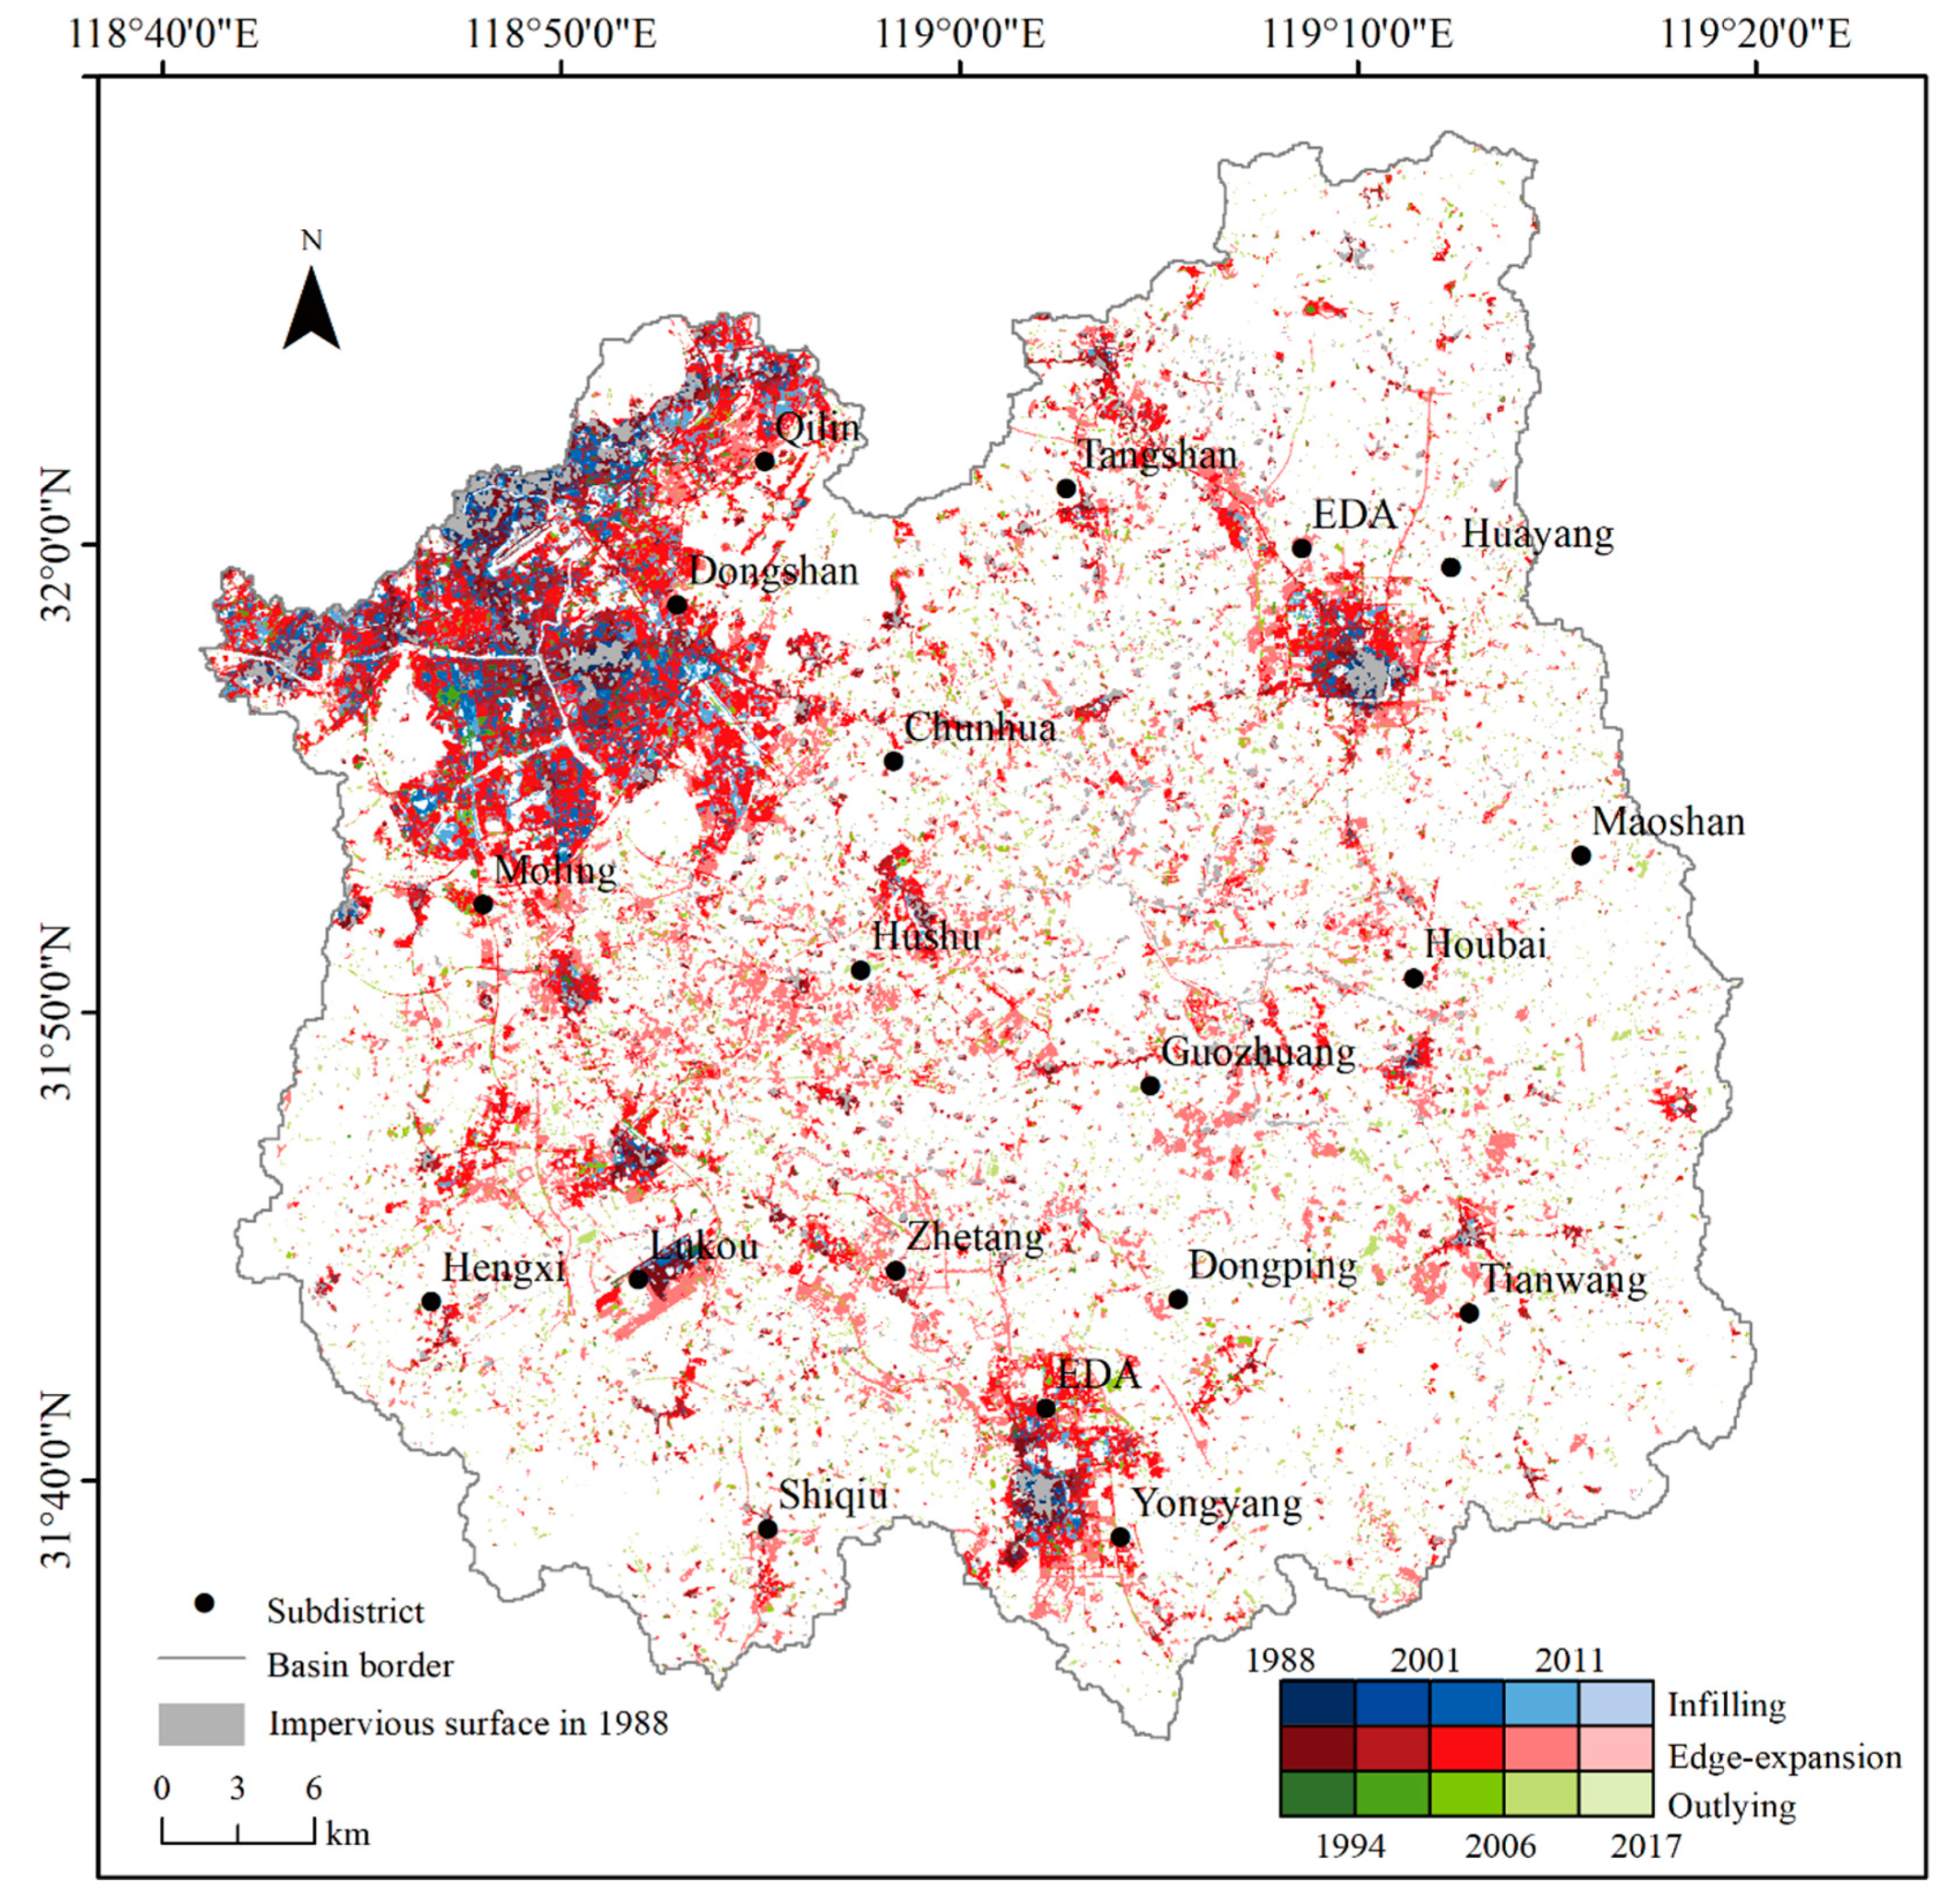
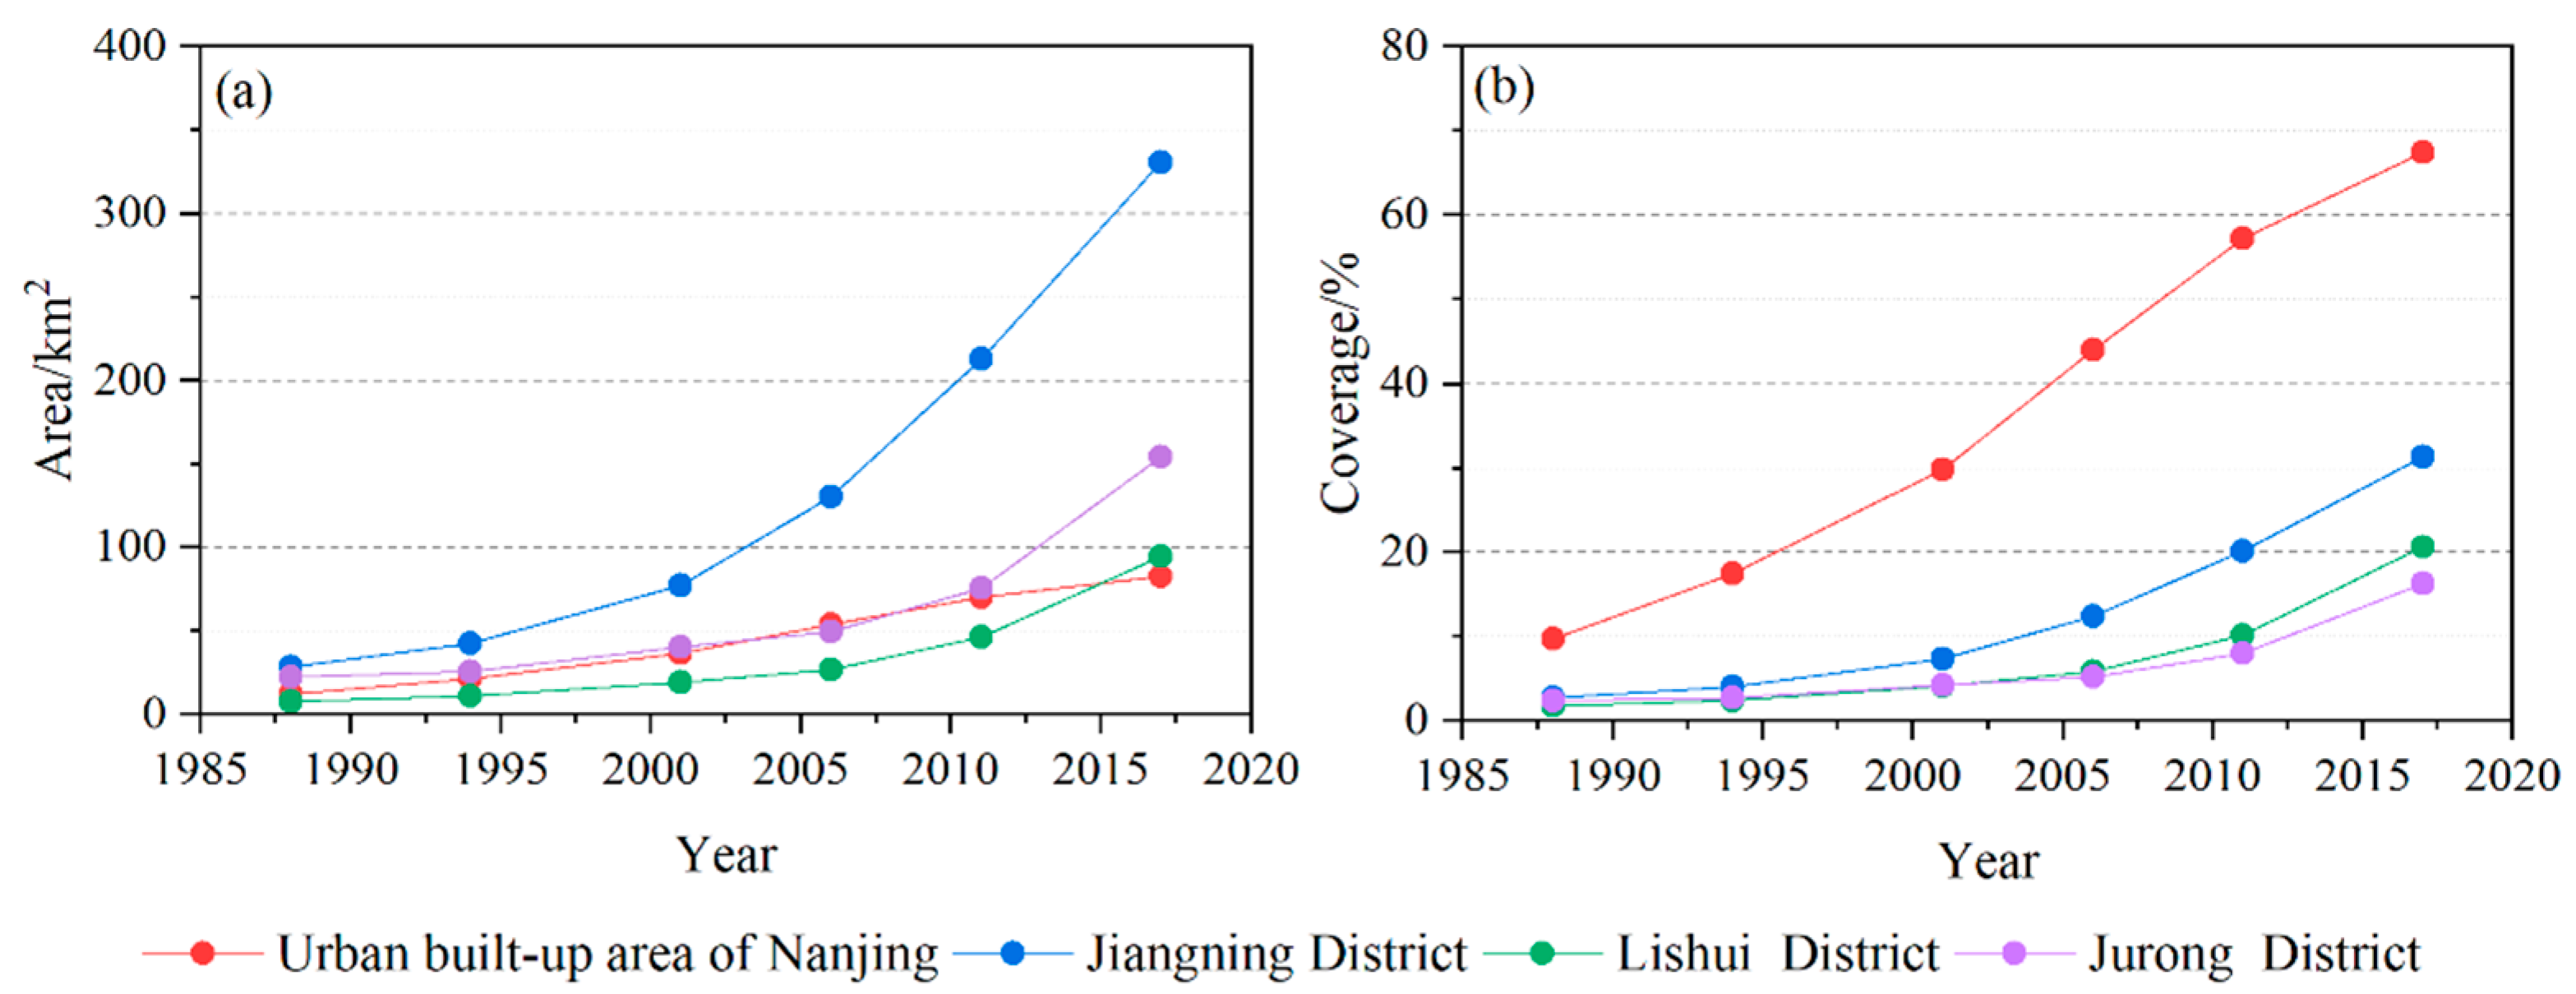
  • “Multi-core expansion” is important for urban growth. During the study period, urban built-up areas in the QRB could act as the “cores (or seeds)” of the impervious surface expansion. Specifically, the urban built-up areas of the Nanjing and Jiangning districts increased significantly, with the impervious surface areas of two regions being 83 km2 and 331 km2 in 2017, and particularly with the coverage in the urban built-up area of Nanjing of approximately 70% (Figure 10). In contrast, the impervious surface coverages of the Lishui and Jurong districts were only 21% and 16% in 2017, respectively.
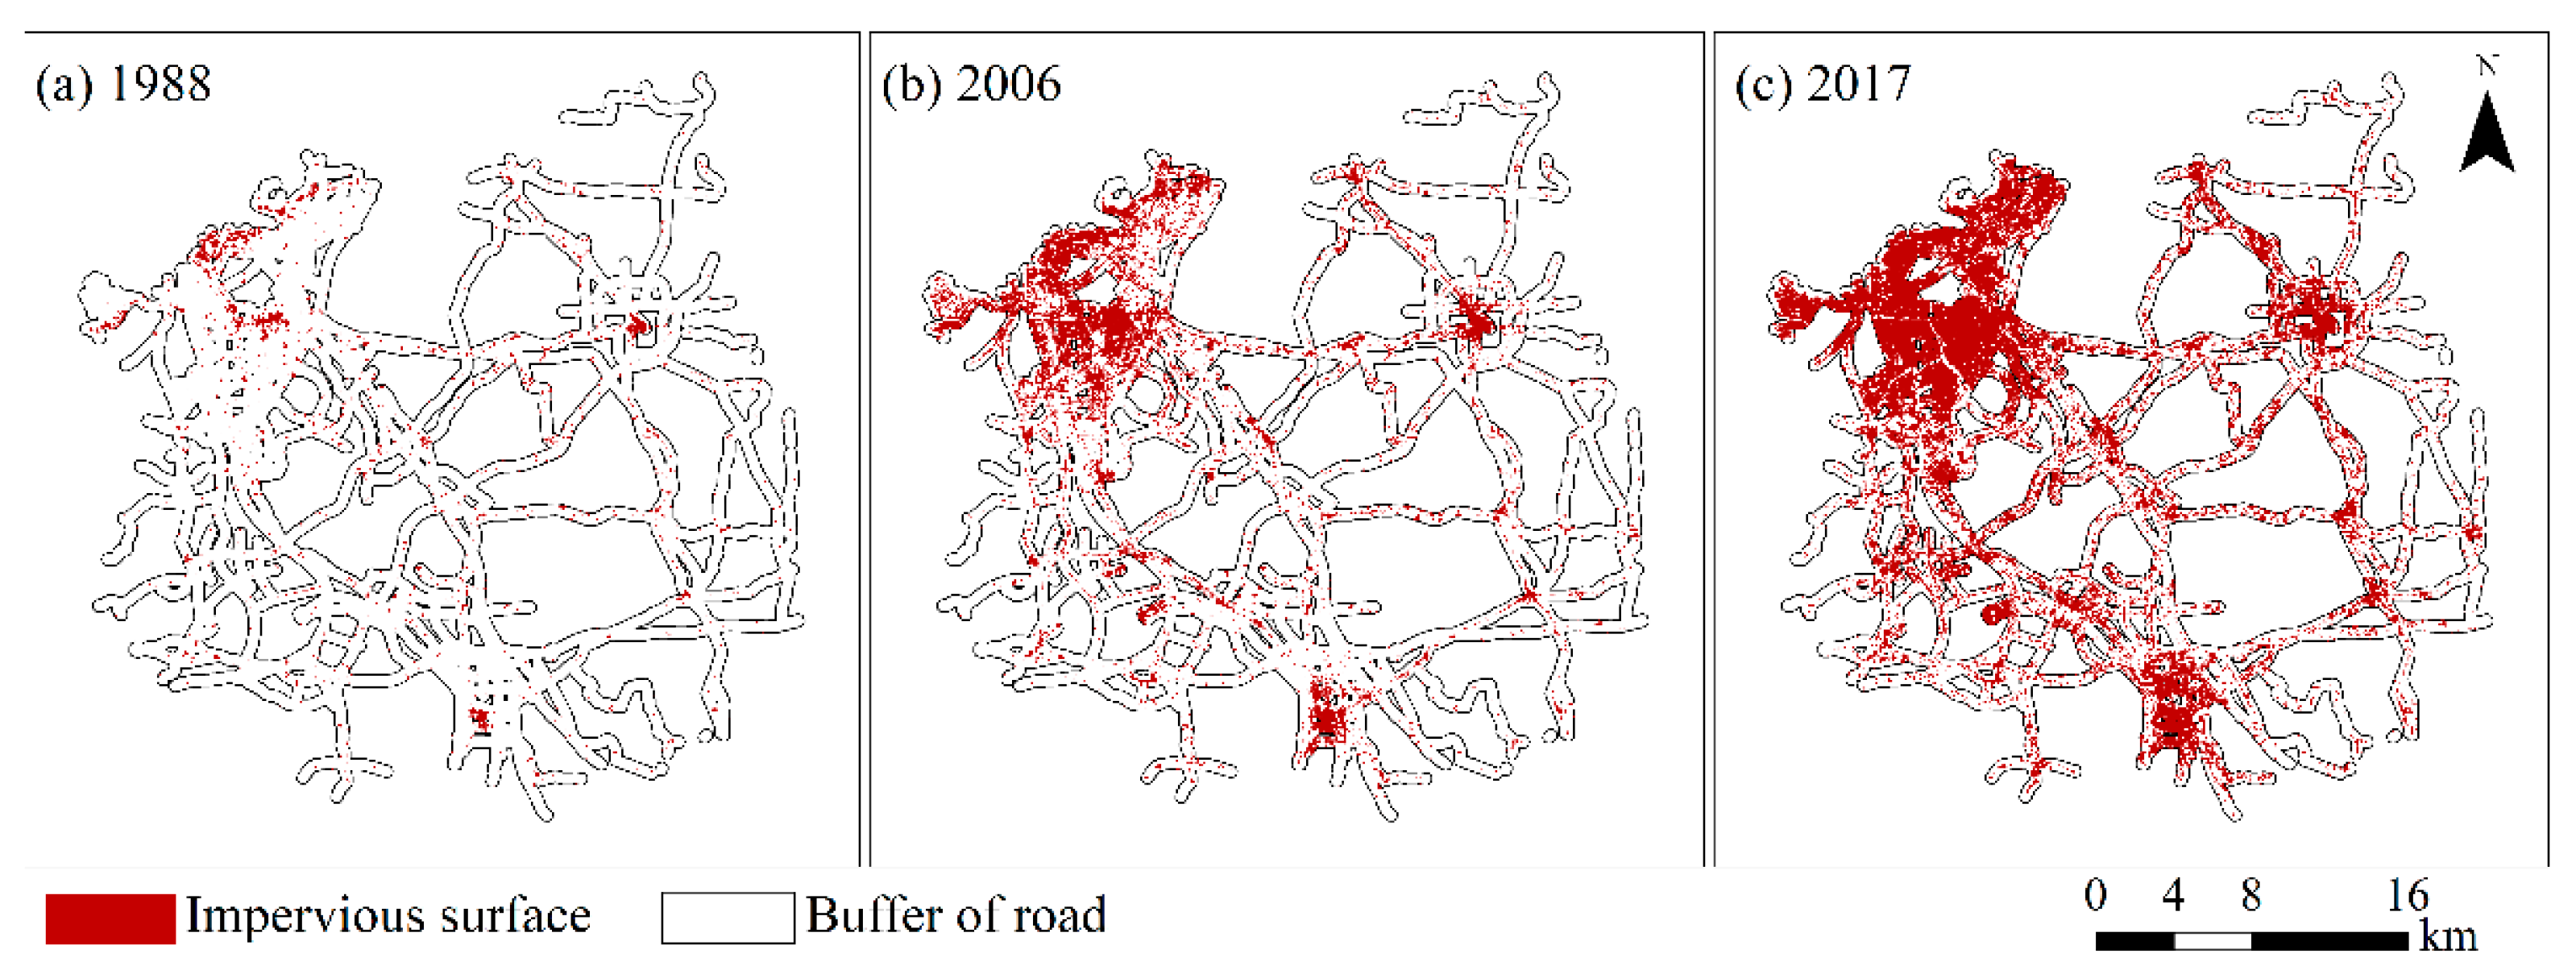
  • “Point-axis expansion” is the main pattern in the rapid development of non-urban built-up areas. The Tangshan, Hushu, Lukou, and Guozhuang subdistricts in the middle and upper reaches of the basin became “points” in the process of impervious surface expansion. Among them, there was a rapid outward expansion of impervious surfaces along the main roads. Specifically, we examined the impervious surface expansion associated with roads as central lines in 2017 (including high-speed railways, expressways, national highways, and provincial highways) and established buffer zones of 500 m along the sides (Figure 11). The impervious surface area in the buffer zones increased from 41.64 km2 in 1988 (Figure 11a) to 194.57 km2 in 2006 (Figure 11b) and 443.63 km2 in 2017 (Figure 11c). Therefore, the proportions of the total buffer area being occupied by impervious surfaces increased from 3.5% in 1988 to 26.36% in 2006, and then to 37.31% in 2017.

5.4. Application of Impervious Surfaces in Hydrology

The impervious surfaces are critical for hydrological research. Silva and Barbosa used them as the input data for the storm water management model (SWMM) and discovered that they greatly affected surface runoff, leading to the reduction in groundwater recharge [45]. In addition, the expansion of impervious surfaces might promote the increase in flood frequency and peak discharge in a distributed hydrological model [32]. Most importantly, as an indicator of non-point source pollution or polluted runoff, impervious surface area is highly connected to the size and density of urban built-up areas [46,47].
The continuous expansion of the impervious surfaces in the QRB may increase ecological risks. In particular, the expansion of the impervious surfaces in Lishui District and Jurong District in the upper reaches has an impact on the water environment and water security of the QRB [48].

6. Conclusions

Based on the previous work, we proposed a neighborhood-based spatio-temporal filter (NSTF) to extract continuous changes in impervious surfaces from multi-temporal Landsat remote sensing images in the Qinhuai River Basin (QRB), 1988–2017. Then, the expansion intensity index (EII) and the landscape expansion index (LEI) were used to quantitatively analyze the spatio-temporal distribution characteristics and expansion patterns of impervious surfaces in the QRB. The main conclusions are as follows:
(1) The NSTF could extract continuous changes of impervious surfaces with high accuracy. On average, the overall accuracies of the NSTF during the study period were about 95%, with the kappa coefficients ranging from 0.9 to 0.96, better than those from the initial classification and spatio-temporal refinement method. Moreover, the NSTF has few parameters to be manually controlled, indicating its suitability for extracting dynamic impervious surfaces in the similar basins.
(2) The QRB has undergone rapid urbanization processes over the past 30 years. Impervious surfaces expanded from 70.46 km2 (2.72%) in 1988 to 662.51 km2 (25.6%) in 2017. Furthermore, the center of urbanization expansion was shaped from the urban built-up areas of Nanjing and Jiangning at lower and medium speeds to the non-urban built-up areas of the Jiangning, Lishui, and Jurong districts since 2006.
(3) The main expansion patterns of the impervious surfaces in the QRB were “multi-core expansion” and “point-axis expansion”. Initially, the impervious surfaces quickly expanded outward through edge expansion (77%) with each urban build-up area as the seed or core. Over time, the expansion patterns gradually shifted into “point-axis expansion”, manifested in outlying and infilling types and the strengthening of the connection among the subdistricts.
The spatial and temporal distribution of impervious surfaces in the QRB in our study demonstrated promise for future hydrological research, including the impact on long-term hydrological processes, flood events, the distribution of water resources, and the evaluation of environmental water quality. In the future, we will construct different urbanization scenarios, combined with statistical and hydrological models, to quantify the impact of urbanization on short-term flood forecasting and long-term streamflow prediction. Understanding the urbanization processes of the whole basin is necessary to enable suitable urban planning and to improve the ecological and hydrological environment.

Author Contributions

Conceptualization, S.W. and Y.P.; data curation and investigation, S.W., S.L., R.L., and M.L.; methodology, S.W.; writing—original draft, S.W.; writing—review and editing, S.W. and Y.P. All authors have read and agreed to the published version of the manuscript.

Funding

This study was supported by the National Natural Science Foundation of China (41771029, 41771417).

Acknowledgments

The authors would warmly thank the academic editors and three anonymous referees for their thoughtful comments and suggestions. They also express their gratitude to Mingming Song for providing semi-automatic decision tree classification method and Kaifeng Liu from University of Michigan.

Conflicts of Interest

The authors declare no conflict of interest.

References

  1. Sun, C.; Wu, Z.; Lv, Z.; Yao, N.; Wei, J. Quantifying different types of urban growth and the change dynamic in Guangzhou using multi-temporal remote sensing data. Int. J. Appl. Earth Obs. Geoinf. 2013, 21, 409–417. [Google Scholar] [CrossRef]
  2. Van de Voorde, T.; Jacquet, W.; Canters, F. Mapping form and function in urban areas: An approach based on urban metrics and continuous impervious surface data. Landsc. Urban. Plan. 2011, 102, 143–155. [Google Scholar] [CrossRef]
  3. Luo, Y.; Zhao, Y.; Yang, K.; Chen, K.X.; Pan, M.; Zhou, X.L. Dianchi Lake watershed impervious surface area dynamics and their impact on lake water quality from 1988 to 2017. Environ. Sci. Pollut. Res. Int. 2018, 25, 29643–29653. [Google Scholar] [CrossRef]
  4. Schueler, T.R. The importance of imperviousness. Watershed Prot. Tech. 1994, 1, 100–111. [Google Scholar]
  5. Arnold, C.L., Jr.; Gibbons, C.J. Impervious surface coverage: The emergence of a key environmental indicator. J. Am. Plann. Assoc. 1996, 62, 243–258. [Google Scholar] [CrossRef]
  6. Weng, Q. Remote Sensing of Impervious Surfaces; CRC Press: Boca Raton, FL, USA; London, UK; New York, NY, USA, 2008. [Google Scholar]
  7. Chen, L.; Zhou, B.; Man, W.; Liu, M. Landsat-Based monitoring of the heat effects of urbanization direction and types in Hangzhou City from 2000 to 2020. Remote Sens. 2021, 13, 4268. [Google Scholar] [CrossRef]
  8. Liu, F.; Zhao, Y.L.; Muhammad, R.; Liu, X.D.; Chen, M.Q. Impervious surface expansion: A key indicator for environment and urban agglomeration—A case study of Guangdong-Hong Kong-Macao greater bay area by using Landsat data. J. Sens. 2020, 3, 3896589. [Google Scholar] [CrossRef]
  9. Zhang, Y.; Liu, Y.F.; Liu, Y. Spatial and temporal patterns analysis of impervious surface in Wuhan City. Sci. Geogr. Sin. 2017, 37, 1917–1924. [Google Scholar]
  10. Aichele, S.S.; Andresen, J.A. Spatial and temporal variations in land development and impervious surface creation in Oakland County, Michigan, 1945–2005. J. Hydrol. 2013, 485, 96–102. [Google Scholar] [CrossRef]
  11. Qiao, K.; Zhu, W.Q.; Hu, D.Y.; Hao, M.; Chen, S.S.; Cao, S.S. Examining the distribution and dynamics of impervious surface in different function zones in Beijing. J. Geogr. Sci. 2018, 28, 669–684. [Google Scholar] [CrossRef] [Green Version]
  12. Xu, J.H.; Zhao, Y.; Zhong, K.W.; Zhang, F.F.; Liu, X.L.; Sun, C.G. Measuring spatio-temporal dynamics of impervious surface in Guangzhou, China, from 1988 to 2015, using time-series Landsat imagery. Sci. Total Environ. 2018, 627, 264–281. [Google Scholar] [CrossRef]
  13. Xie, H.J.; Li, C.W.; Zhang, Y.J.; Song, A.Y. Evolution pattern of impervious surface in the Yuqiao Reservoir Watershed, Tianjin, China during the process of urbanization. Chin. J. Appl. Ecol. 2016, 27, 1069–1076. [Google Scholar]
  14. Li, X.; Gong, P.; Liang, L. A 30-year (1984–2013) record of annual urban dynamics of Beijing City derived from Landsat data. Remote Sens. Environ. 2015, 166, 78–90. [Google Scholar] [CrossRef]
  15. Zhang, L.; Weng, Q. Annual dynamics of impervious surface in the Pearl River Delta, China, from 1988 to 2013, using time series Landsat imagery. ISPRS-J. Photogramm. Remote Sens. 2016, 113, 86–96. [Google Scholar] [CrossRef]
  16. Song, X.P.; Sexton, J.O.; Huang, C.Q.; Channan, S.; Townshend, J.R. Characterizing the magnitude, timing and duration of urban growth from time series of Landsat-based estimates of impervious cover. Remote Sens. Environ. 2016, 175, 1–13. [Google Scholar] [CrossRef]
  17. Wang, H.; Lu, S.L.; Wu, B.F.; Li, X.S. Advances in remote sensing of impervious surfaces extraction and its applications. Adv. Earth Sci. 2013, 28, 327–336. [Google Scholar]
  18. Chai, B.; Li, P. Annual urban expansion extraction and spatio-temporal analysis using Landsat time series data: A case study of Tianjin, China. IEEE J. Sel. Top. Appl. Earth Observ. Remote Sens. 2018, 11, 2644–2656. [Google Scholar] [CrossRef]
  19. Wang, J.; Zhao, Y.Y.; Li, C.C.; Yu, L.; Liu, D.S.; Gong, P. Mapping global land cover in 2001 and 2010 with spatial-temporal consistency at 250 m resolution. ISPRS-J. Photogramm. Remote Sens. 2015, 103, 38–47. [Google Scholar] [CrossRef]
  20. Schneider, A. Monitoring land cover change in urban and peri-urban areas using dense time stacks of Landsat satellite data and a data mining approach. Remote Sens. Environ. 2012, 124, 689–704. [Google Scholar] [CrossRef]
  21. Schneider, A.; Mertes, C.M. Expansion and growth in Chinese cities, 1978–2010. Environ. Res. Lett. 2014, 9, 024008. [Google Scholar] [CrossRef]
  22. Seto, K.C.; Woodcock, C.E.; Song, C.; Huang, X.; Lu, J.; Kaufmann, R.K. Monitoring land-use change in the Pearl River Delta using Landsat TM. Int. J. Remote Sens. 2002, 23, 1985–2004. [Google Scholar] [CrossRef]
  23. Gao, F.; de Colstoun, E.B.; Ma, R.H.; Weng, Q.H.; Masek, J.G.; Chen, J.; Pan, Y.Z.; Song, C.H. Mapping impervious surface expansion using medium-resolution satellite image time series: A case study in the Yangtze River Delta, China. Int. J. Remote Sens. 2012, 33, 7609–7628. [Google Scholar] [CrossRef]
  24. Gray, J.; Song, C.H. Consistent classification of image time series with automatic adaptive signature generalization. Remote Sens. Environ. 2013, 134, 333–341. [Google Scholar] [CrossRef]
  25. Duan, C.; Shi, P.; Song, M.H.; Zhang, X.Z.; Zong, N.; Zhou, C.P. Land use and land cover change in the Kailash sacred Landscape of China. Sustainability 2019, 11, 1788. [Google Scholar] [CrossRef] [Green Version]
  26. Sexton, J.O.; Urban, D.L.; Donohue, M.J.; Song, C.H. Long-Term land cover dynamics by multi-temporal classification across the Landsat-5 record. Remote Sens. Environ. 2013, 128, 246–258. [Google Scholar] [CrossRef]
  27. Jiang, Z.; Shekhar, S.; Zhou, X.; Knight, J.; Corcoran, J. Focus-test-based spatial decision tree learning: A summary of results. In Proceedings of the 2013 IEEE 13th International Conference on Data Mining, Dallas, TX, USA, 7–10 December 2013; Volume 13, pp. 320–329. [Google Scholar]
  28. Anselin, L. Local indicators of spatial association—LISA. Geogr. Anal. 1995, 27, 93–115. [Google Scholar] [CrossRef]
  29. Xu, Z.; Mountrakis, G.; Quackenbush, L.J. Impervious surface extraction in imbalanced datasets: Integrating partial results and multi-temporal information in an iterative one-class classifier. Int. J. Remote Sens. 2017, 38, 43–63. [Google Scholar] [CrossRef]
  30. Gao, Y.Q.; Wang, H.Z.; Lu, X.H.; Wang, D.D.; Yuan, Y. Simulation of rainstorm flood response in Qinhuai River Drainage Basin under land use cover changes. J. Yangtze River Sci. Res. Inst. 2018, 35, 47–52. [Google Scholar]
  31. Qiao, W.F.; Mao, G.X.; Wang, Y.H.; Chen, Y.J. Research on urban expansion and land use change in Nanjing over the past 32 years. J. Geoinf. Sci. 2016, 18, 200–209. [Google Scholar]
  32. Bian, G.D.; Du, J.K.; Song, M.M.; Xu, Y.P.; Xie, S.P.; Zheng, W.L.; Xu, C.Y. A procedure for quantifying runoff response to spatial and temporal changes of impervious surface in Qinhuai River basin of southeastern China. CATENA 2017, 157, 268–278. [Google Scholar] [CrossRef]
  33. Song, M.M.; Du, J.K.; Zheng, W.L.; Li, C.X.; Bian, G.D. Quantifying the spatial-temporal changes of impervious surface landscape pattern from 1988 to 2015 in Qinhuai River Basin. J. Geo-Inf. Sci. 2017, 19, 238–247. [Google Scholar]
  34. Nanjing Planning Bureau. Nanjing Urban Master Plan (2011–2020); Nanjing Planning Bureau: Nanjing, China, 2020.
  35. Jurong Planning Bureau. Jurong Urban Development Planning (2017–2035); Jurong Planning Bureau: Jurong, China, 2018.
  36. Song, M.M.; Zheng, W.L.; Bian, G.D.; Du, J.K. Land use classification of typical ground objects in Qinhuai River Basin based on Multi Temporal Landsat8 OLI Data. Sci. Tech. Eng. 2016, 16, 209–216. [Google Scholar]
  37. Shannon, C.E. A mathematical theory of communication. Bell Syst. Tech. J. 1948, 27, 379–423. [Google Scholar] [CrossRef] [Green Version]
  38. Romano, B.; Zullo, F.; Fiorini, L.; Ciabò, S.; Marucci, A. Sprinkling: An approach to describe urbanization dynamics in Italy. Sustainability 2017, 9, 97. [Google Scholar] [CrossRef] [Green Version]
  39. Shen, F.; Yuan, J.; Huang, W.W.; Zha, L.S. Analysis on spatiotemporal characteristics and driving forces of Hefei urban expansion based on geo-informatic map. Resour. Environ. Yangtze Basin 2015, 24, 202–211. [Google Scholar]
  40. Liu, X.P.; Li, X.; Chen, Y.M.; Tan, Z.Z.; Li, S.Y.; Ai, B. A new landscape index for quantifying urban expansion using multi-temporal remotely sensed data. Landsc. Ecol. 2010, 25, 671–682. [Google Scholar] [CrossRef]
  41. Shahtahmassebi, A.R.; Song, J.; Zheng, Q.; Blackburn, G.A.; Wang, K.; Haung, L.Y.; Pan, Y.; Moore, N.; Shahtahmassebi, G.; Haghighi, R.S.; et al. Remote sensing of impervious surface growth: A framework for quantifying urban expansion and re-densification mechanisms. Int. J. Appl. Earth Obs. Geoinf. 2016, 46, 94–112. [Google Scholar] [CrossRef] [Green Version]
  42. Zhao, L.Y. Comparative study on the development of metropolitan suburbs under the influence of industrialization modes: A case of Jiangning and Yinzhou. Mod. Urb. Res. 2018, 1, 67–77. [Google Scholar]
  43. Nanjing Planning Bureau. Comprehensive Planning of Lishui District (2013–2030); Nanjing Planning Bureau: Nanjing, China, 2014.
  44. Wang, T.T.; Zhu, X.J.; Ren, D. Regional management strategy in the special plan of sponge city in Jurong city. China Water Wastewater 2019, 35, 1–4. [Google Scholar]
  45. Silva, C.; Barbosa, L. Cumulative effect of the disconnection of impervious areas within residential lots on runoff generation and temporal patterns in a small urban are. J. Environ. Manage. 2020, 253, 109719.1–109719.12. [Google Scholar] [CrossRef] [PubMed]
  46. Sleavin, W.J.; Civco, D.L.; Prisloe, S.; Giannotti, L. Measuring impervious surfaces for non-point source pollution modeling. In Proceedings of the ASPRS 2000 Annual Conference, Washington, DC, USA, 1 May 2000; pp. 1–11. [Google Scholar]
  47. Hamilton, B.; Coops, N.C.; Lokman, K. Time series monitoring of impervious surfaces and runoff impacts in Metro Vancouver. Sci. Total. Environ. 2020, 760, 143873. [Google Scholar] [CrossRef] [PubMed]
  48. Sun, Y.W.; Xu, Y.P.; Gao, B.; Wang, Q.; Li, S.F. Influence of impervious surface expansion on flood peak under urbanization–A case study of Qinhuai River in Nanjing. J. Lake Sci. 2021, 33, 1574–1583. [Google Scholar]
Figure 1. Location of the study area with elevation, water system, and administrative divisions.
Remotesensing 13 04494 g001
Figure 2. The flow chart of the semi-automatic decision tree classification.
Remotesensing 13 04494 g002
Figure 3. Schematic diagram of a spatial filtering: (a) Value of feature f, 1 is a pervious surface class and 3 is an impervious surface class; (b) indicator variable; (c) local spatial autocorrelation statistic; (d,e) logical operation; (f) XOR operation.
Remotesensing 13 04494 g003
Figure 4. Schematic diagram of temporal filtering. (a) Temporal filtering for pixels in the middle of the study period; (b) temporal filtering for pixels at the beginning or end of the study period. In both cases, 1 stands for a pervious surface class, while 3 stands for an impervious surface class.
Remotesensing 13 04494 g004
Figure 5. Schematic diagram of spectral filtering.
Remotesensing 13 04494 g005
Figure 6. Impervious surface expansion in the QRB within different years.
Remotesensing 13 04494 g006
Figure 7. Spatial distribution of impervious surfaces with three landscape expansion types in the QRB during different periods.
Remotesensing 13 04494 g007
Figure 8. Changes in three landscape expansion types of impervious surface areas between 1988–2006 and 2006–2017 in the urban and non-urban built-up areas.
Remotesensing 13 04494 g008
Figure 9. Accuracy assessment of each year’s results from initial classification, spatio-temporal refinement method and the NSTF: (a) overall accuracy, (b) kappa, (c) omission error, and (d) commission error.
Remotesensing 13 04494 g009
Figure 10. Impervious surfaces in the urban built-up area of Nanjing and three districts (1988–2017): (a) area, (b) coverage.
Remotesensing 13 04494 g010
Figure 11. Impervious surface growth within road buffers.
Remotesensing 13 04494 g011
Table 1. Imagery data source information.
YearRemote SensorMain Image
Acquisition Time
Auxiliary Image
Acquisition Time
1988Landsat 5 TM1988-07-051988-12-12
1994Landsat 5 TM1994-07-061995-01-30
2001Landsat 7 ETM+2001-07-172001-12-24
2006Landsat 5 TM2006-05-202007-01-31
2011Landsat 7 ETM+2011-09-152012-01-05
2017Landsat 8 OLI2017-07-212017-01-26
Table 2. Land cover classes and their description in the semi-automatic decision tree classification.
Land Cover ClassesDescription
WaterRivers, lakes, and reservoirs
WoodlandForest, garden, and grassland
Agricultural landIrrigated farmland and dry land
Bare landLand under construction and other bare ground
Impervious surfaceArtificial ground surface, such as roads, residential areas, and industrial land
Table 3. The confusion matrix of final impervious surface datasets in the QRB.
1988 Label1994 Label2001 Label
ISPS ISPS ISPS
PredictIS5005PredictIS4535PredictIS4702
PS40562PS48518PS40569
2006 Label2011 Label2017 Label
ISPS ISPS ISPS
PredictIS4906PredictIS50713PredictIS5606
PS33510PS12492PS14502
Note: IS means impervious surface. PS means pervious surface. Label means true situation of a pixel. Predict means classification result of a pixel.
Table 4. Classification accuracy assessment of final impervious surface datasets in the QRB.
Evaluation Index198819942001200620112017
Omission (%)7.4 9.6 7.8 6.3 2.3 2.4
Commission (%)1.0 1.1 0.4 1.2 2.5 1.1
OA (%)95.994.8 96.1 96.2 97.6 98.2
Kappa 0.92 0.90 0.92 0.93 0.95 0.96
Table 5. Area and coverage of impervious surfaces in urban and non-urban built-up areas in the QRB, 1988–2017.
YearBasinUrban Built-Up AreaNon-Urban Built-Up Area
Area (km2)Coverage (%)Area (km2)Coverage (%)Area (km2)Coverage (%)
198870.46 2.72 29.704.79 40.662.07
1994100.49 3.88 48.847.88 51.442.61
2001172.67 6.67 89.6914.47 82.864.21
2006261.22 10.10 146.3423.60 114.765.83
2011405.30 15.66 214.7134.63 190.489.68
2017662.51 25.60 287.1946.32 375.2219.07
Table 6. EII of impervious surfaces in QRB and its four regions, 1988–2017.
PeriodQRBUrban Built-Up Area of NanjingJiangning DistrictLishui DistrictJurong District
1988–19940.19 1.30 0.22 0.12 0.05
1994–20010.40 1.77 0.47 0.25 0.22
2001–20060.68 2.84 1.02 0.34 0.20
2006–20111.11 2.64 1.56 0.85 0.55
2011–20171.66 1.69 1.86 1.76 1.38
Note: slow (0~0.28), low (0.28~0.59), medium (0.59~1.05), fast (1.05~1.92), high (>1.92).
Table 7. Areas and percentages of three landscape expansion types in the QRB, 1988–2017.
PeriodEdge ExpansionInfillingOutlyingTotal
Area
(km2)
Percentage
(%)
Area
(km2)
Percentage
(%)
Area
(km2)
Percentage
(%)
Area
(km2)
Percentage
(%)
1988–199423.19 77 1.91 6 5.14 17 30.24100
1994–200151.77 72 2.53 4 17.92 24 72.22100
2001–200669.95 797.22 811.33 1388.49 100
2006–2011103.73 7223.19 1617.12 12144.04 100
2011–2017183.93 7235.89 1437.32 14257.14 100
Total432.577370.741288.8315592.13100
Table 8. Information gain of image classification under different window sizes S.
YearS = 1S = 2S = 3S = 4S = 5
19880.1210 0.0696 0.04840.03520.0272
19940.1554 0.12540.1105 0.1014 0.0956
20010.23630.16650.1283 0.10490.0906
20060.2555 0.16630.1276 0.10580.0925
20110.37450.27610.2280 0.19890.1793
20170.39840.29740.25080.22400.2059
Publisher’s Note: MDPI stays neutral with regard to jurisdictional claims in published maps and institutional affiliations.

