
Monitoring and Quantitative Human Risk Assessment of Municipal Solid Waste Landfill Using Integrated Satellite–UAV–Ground Survey Approach


 , ,
, ,
Abstract
:
1. Introduction
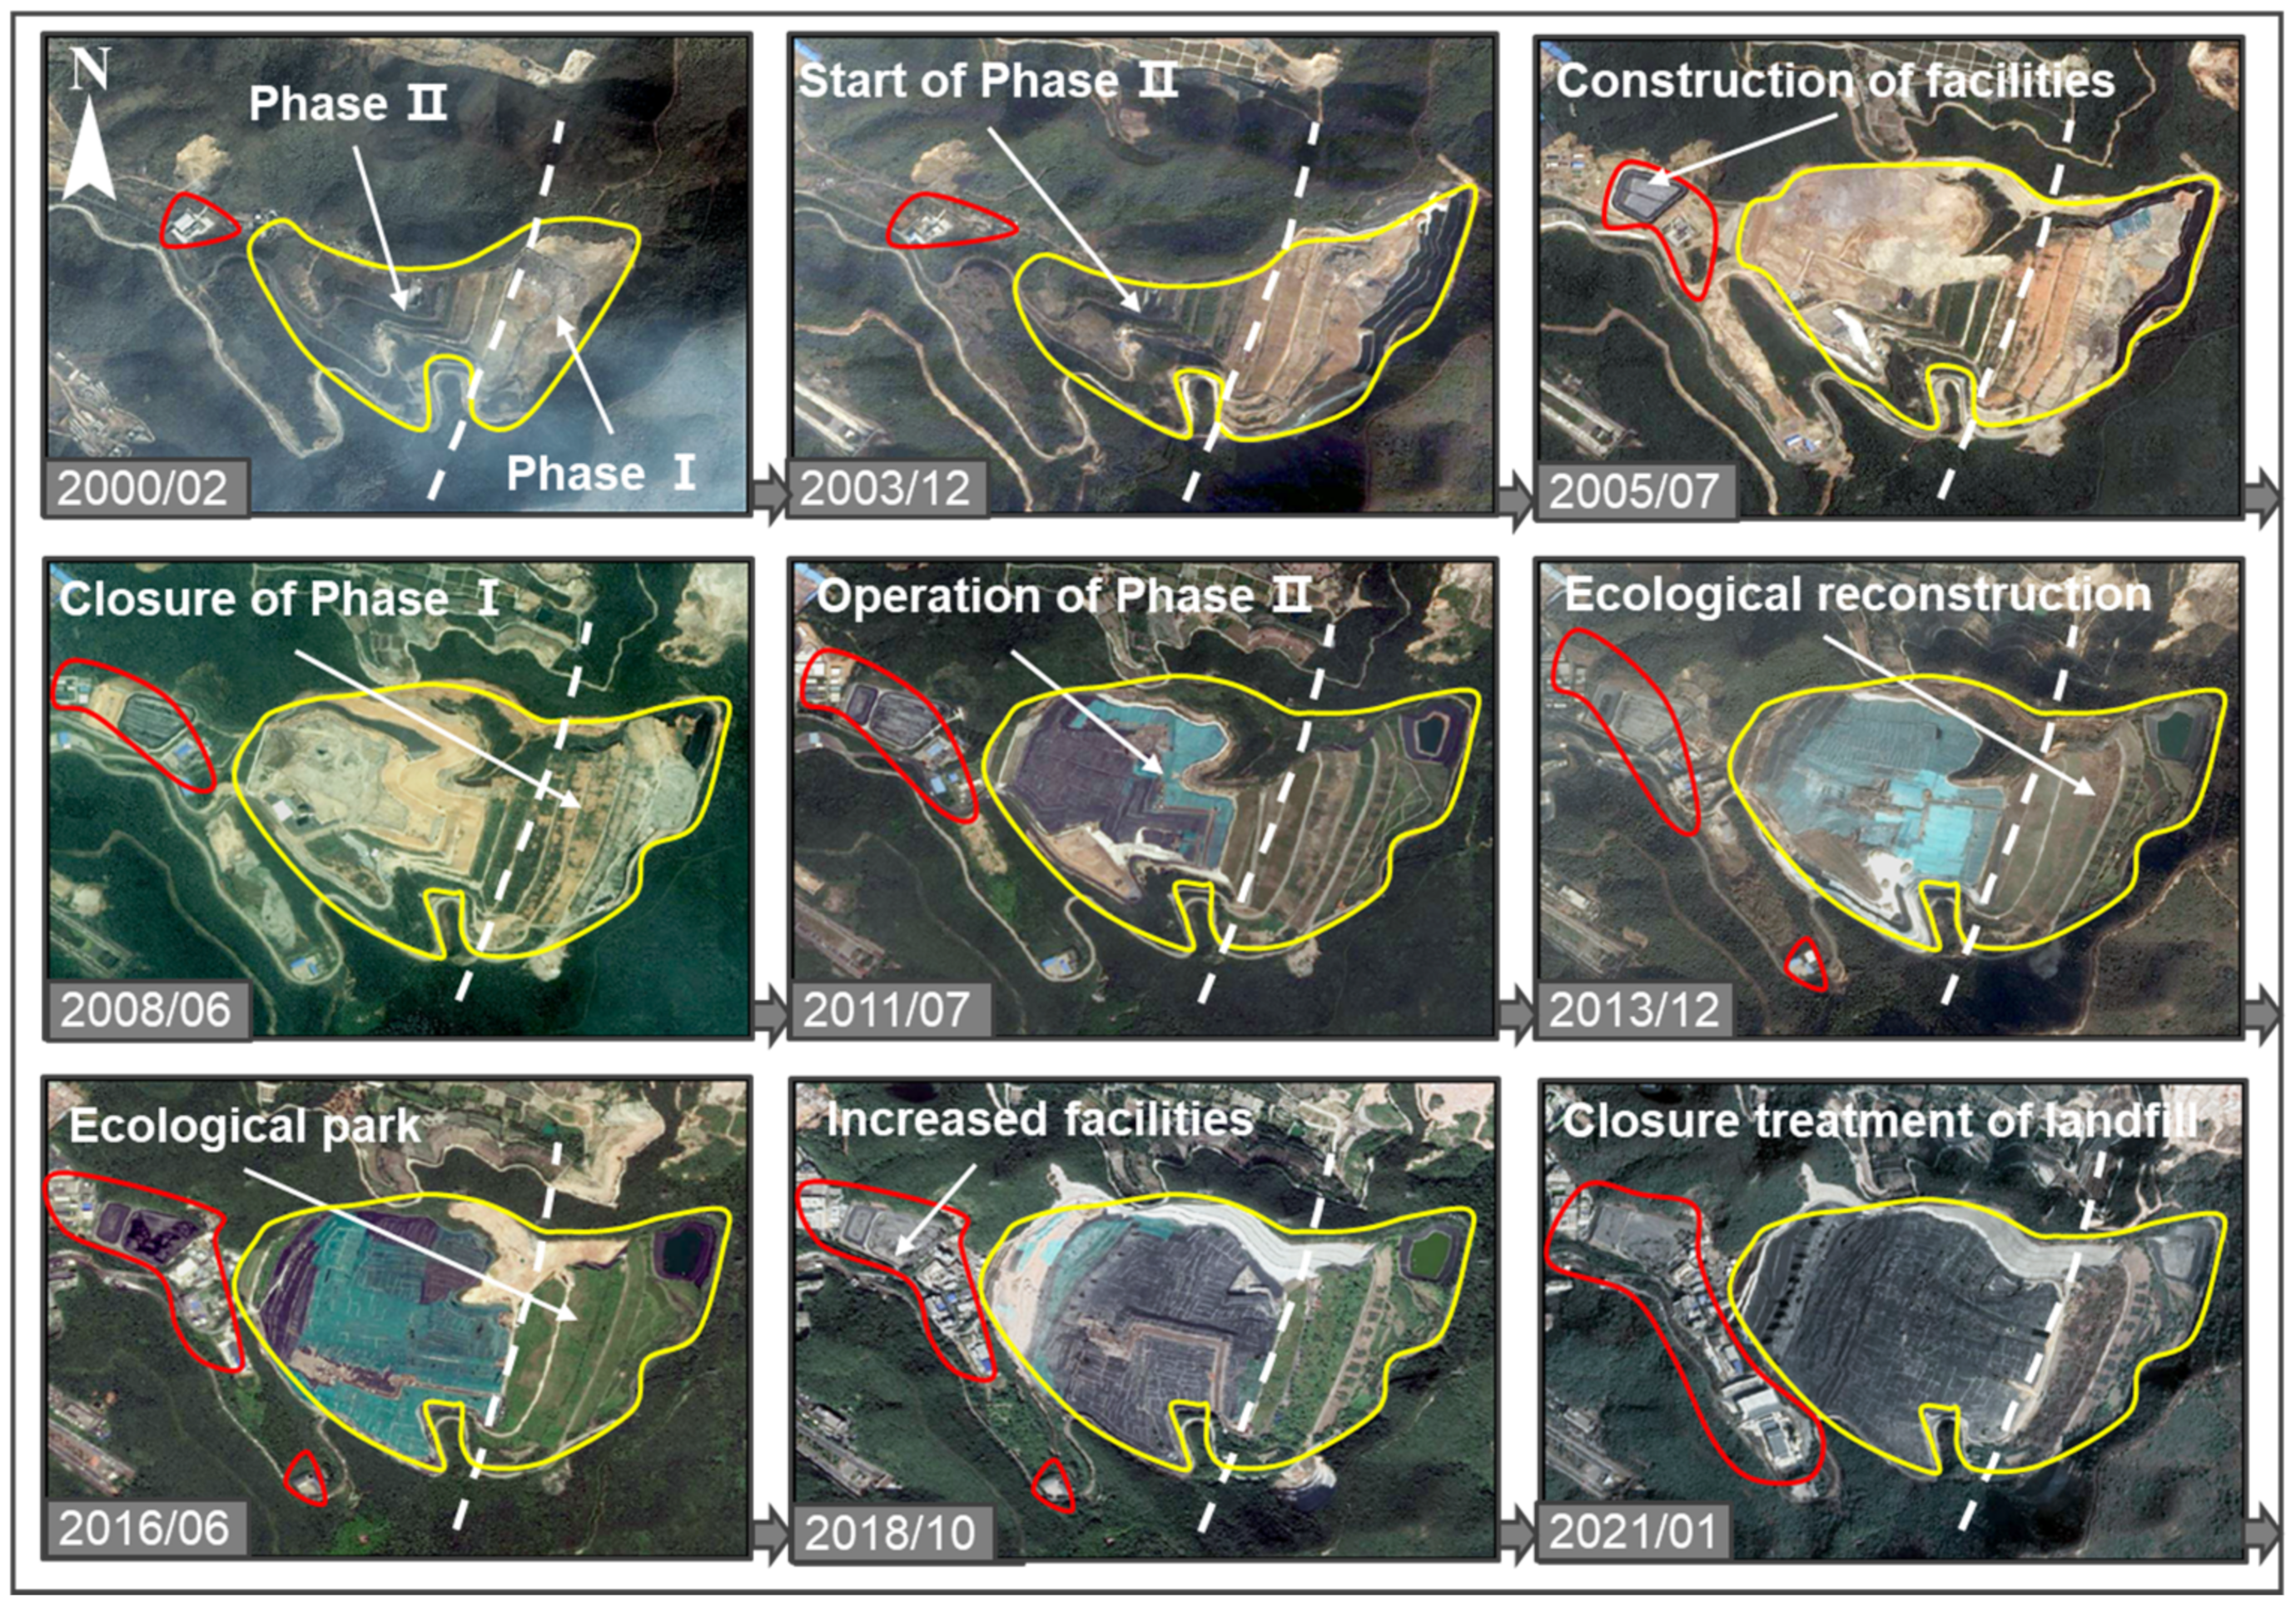
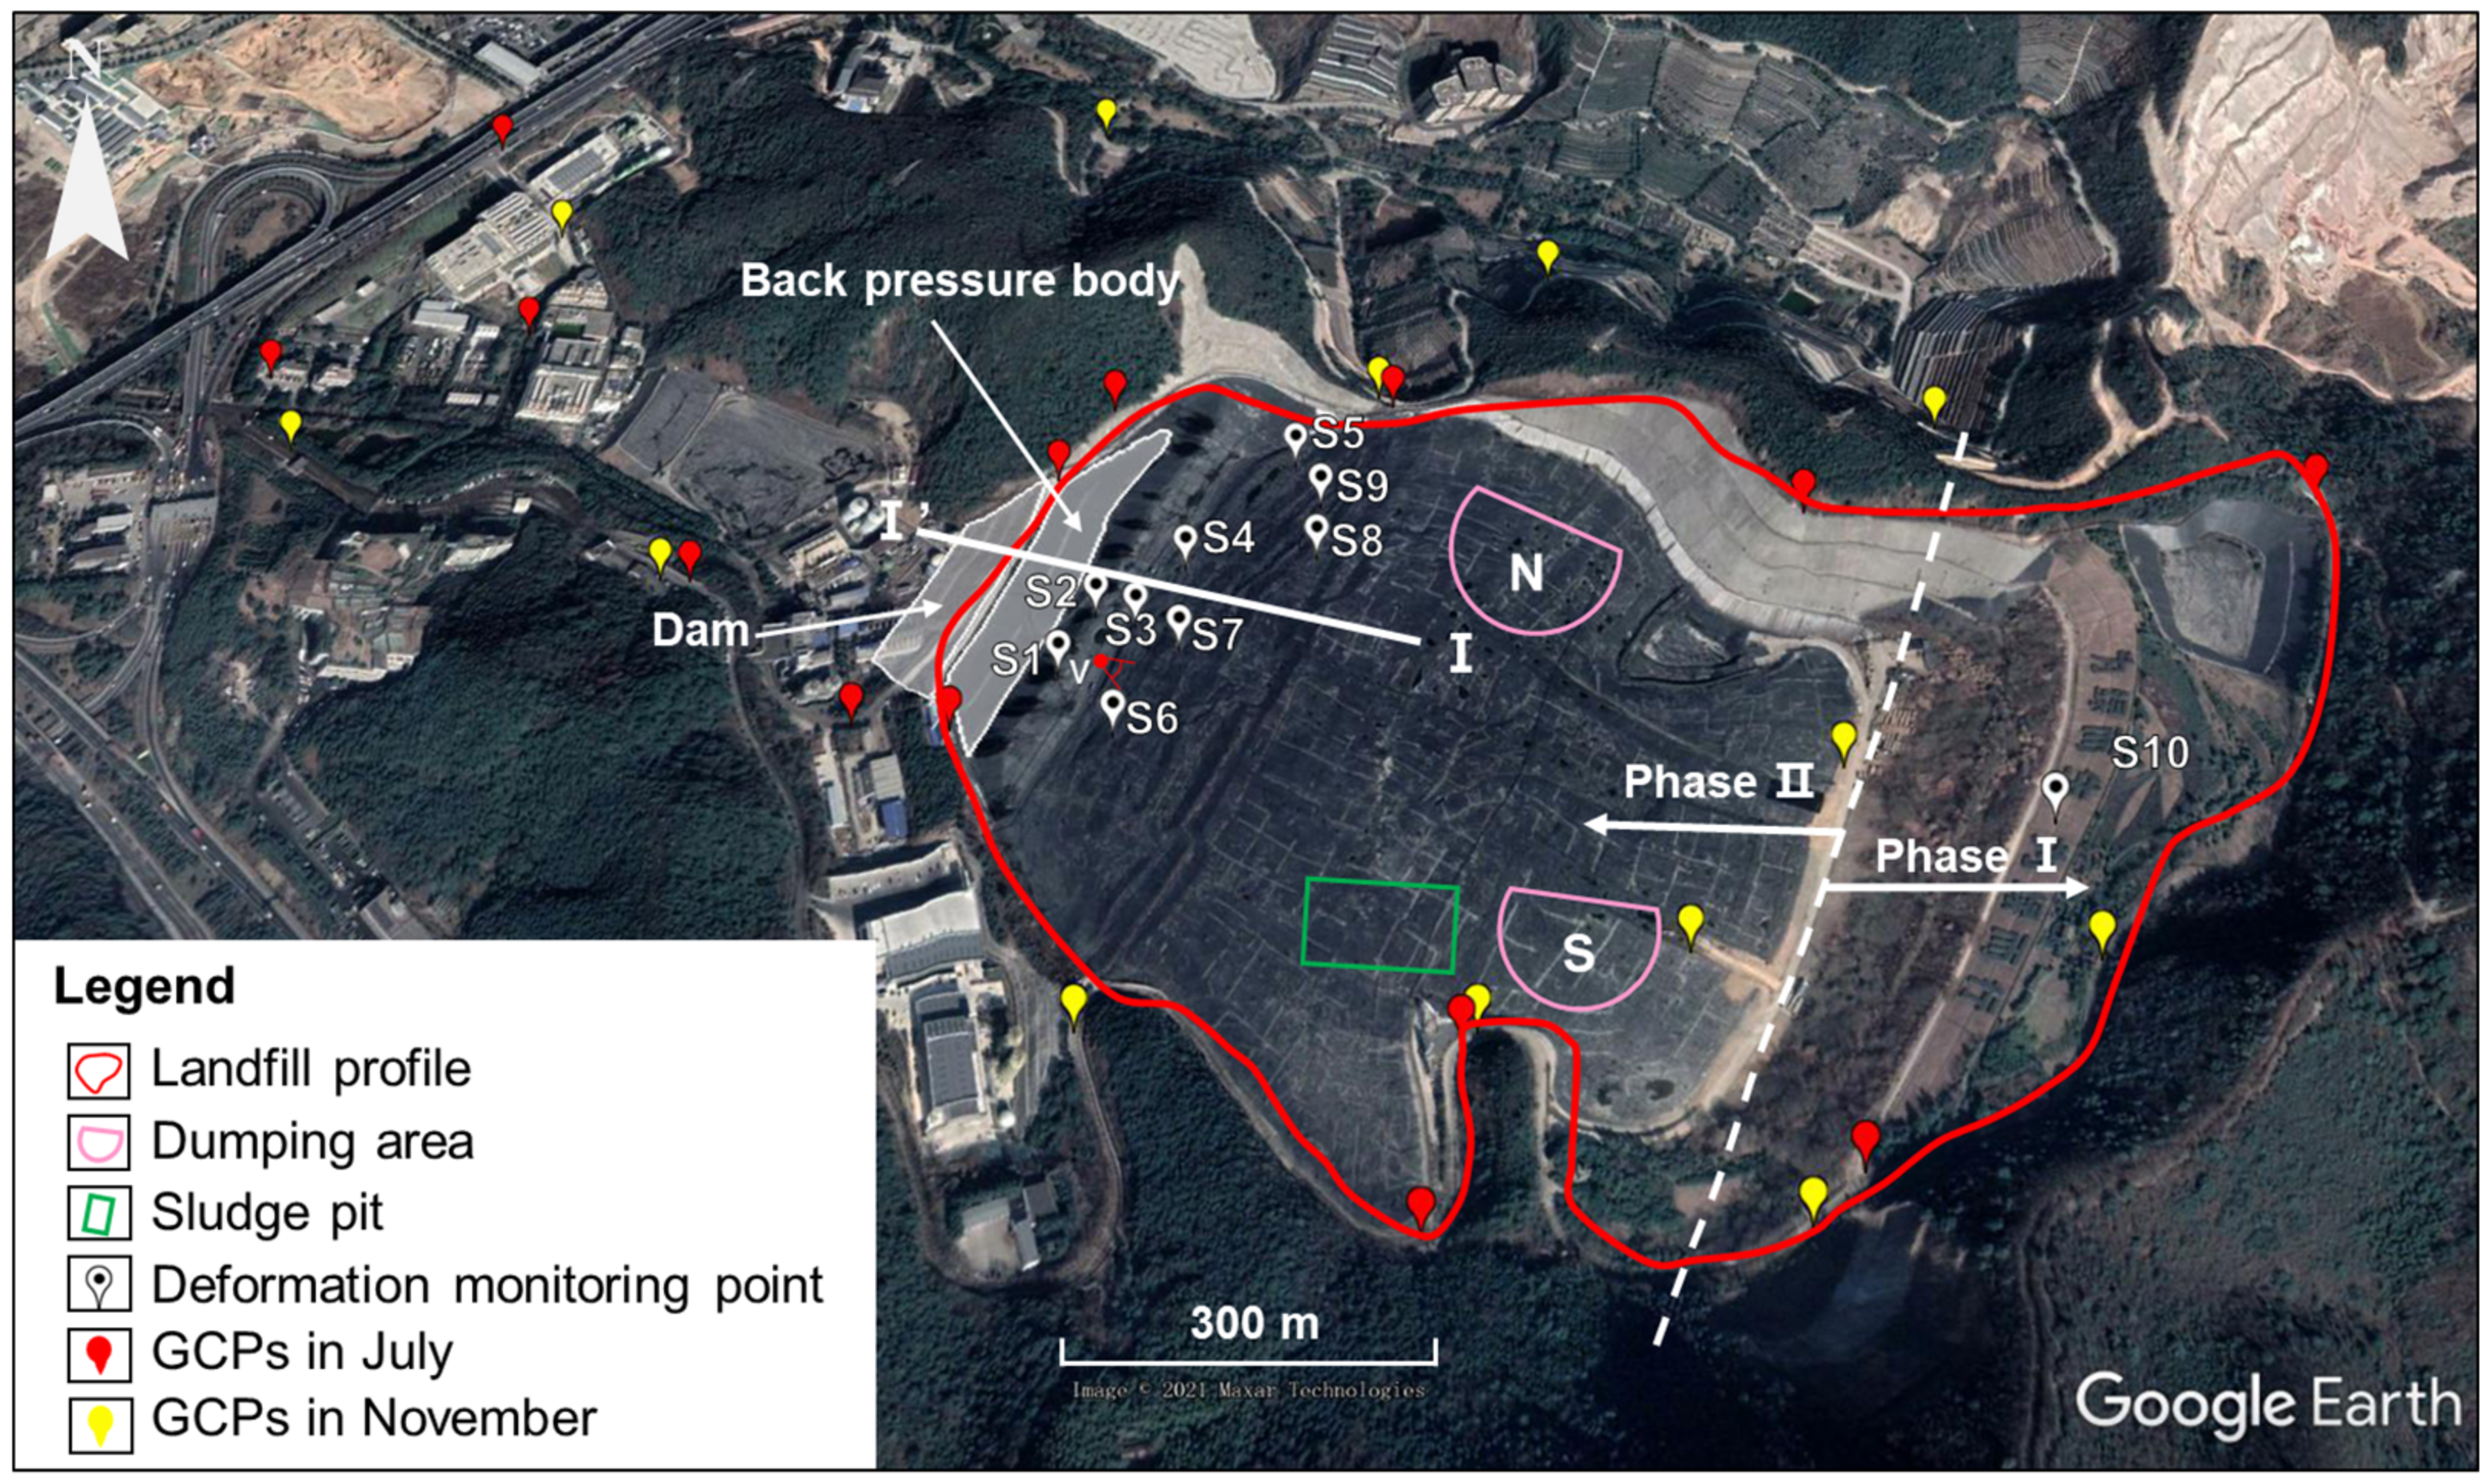
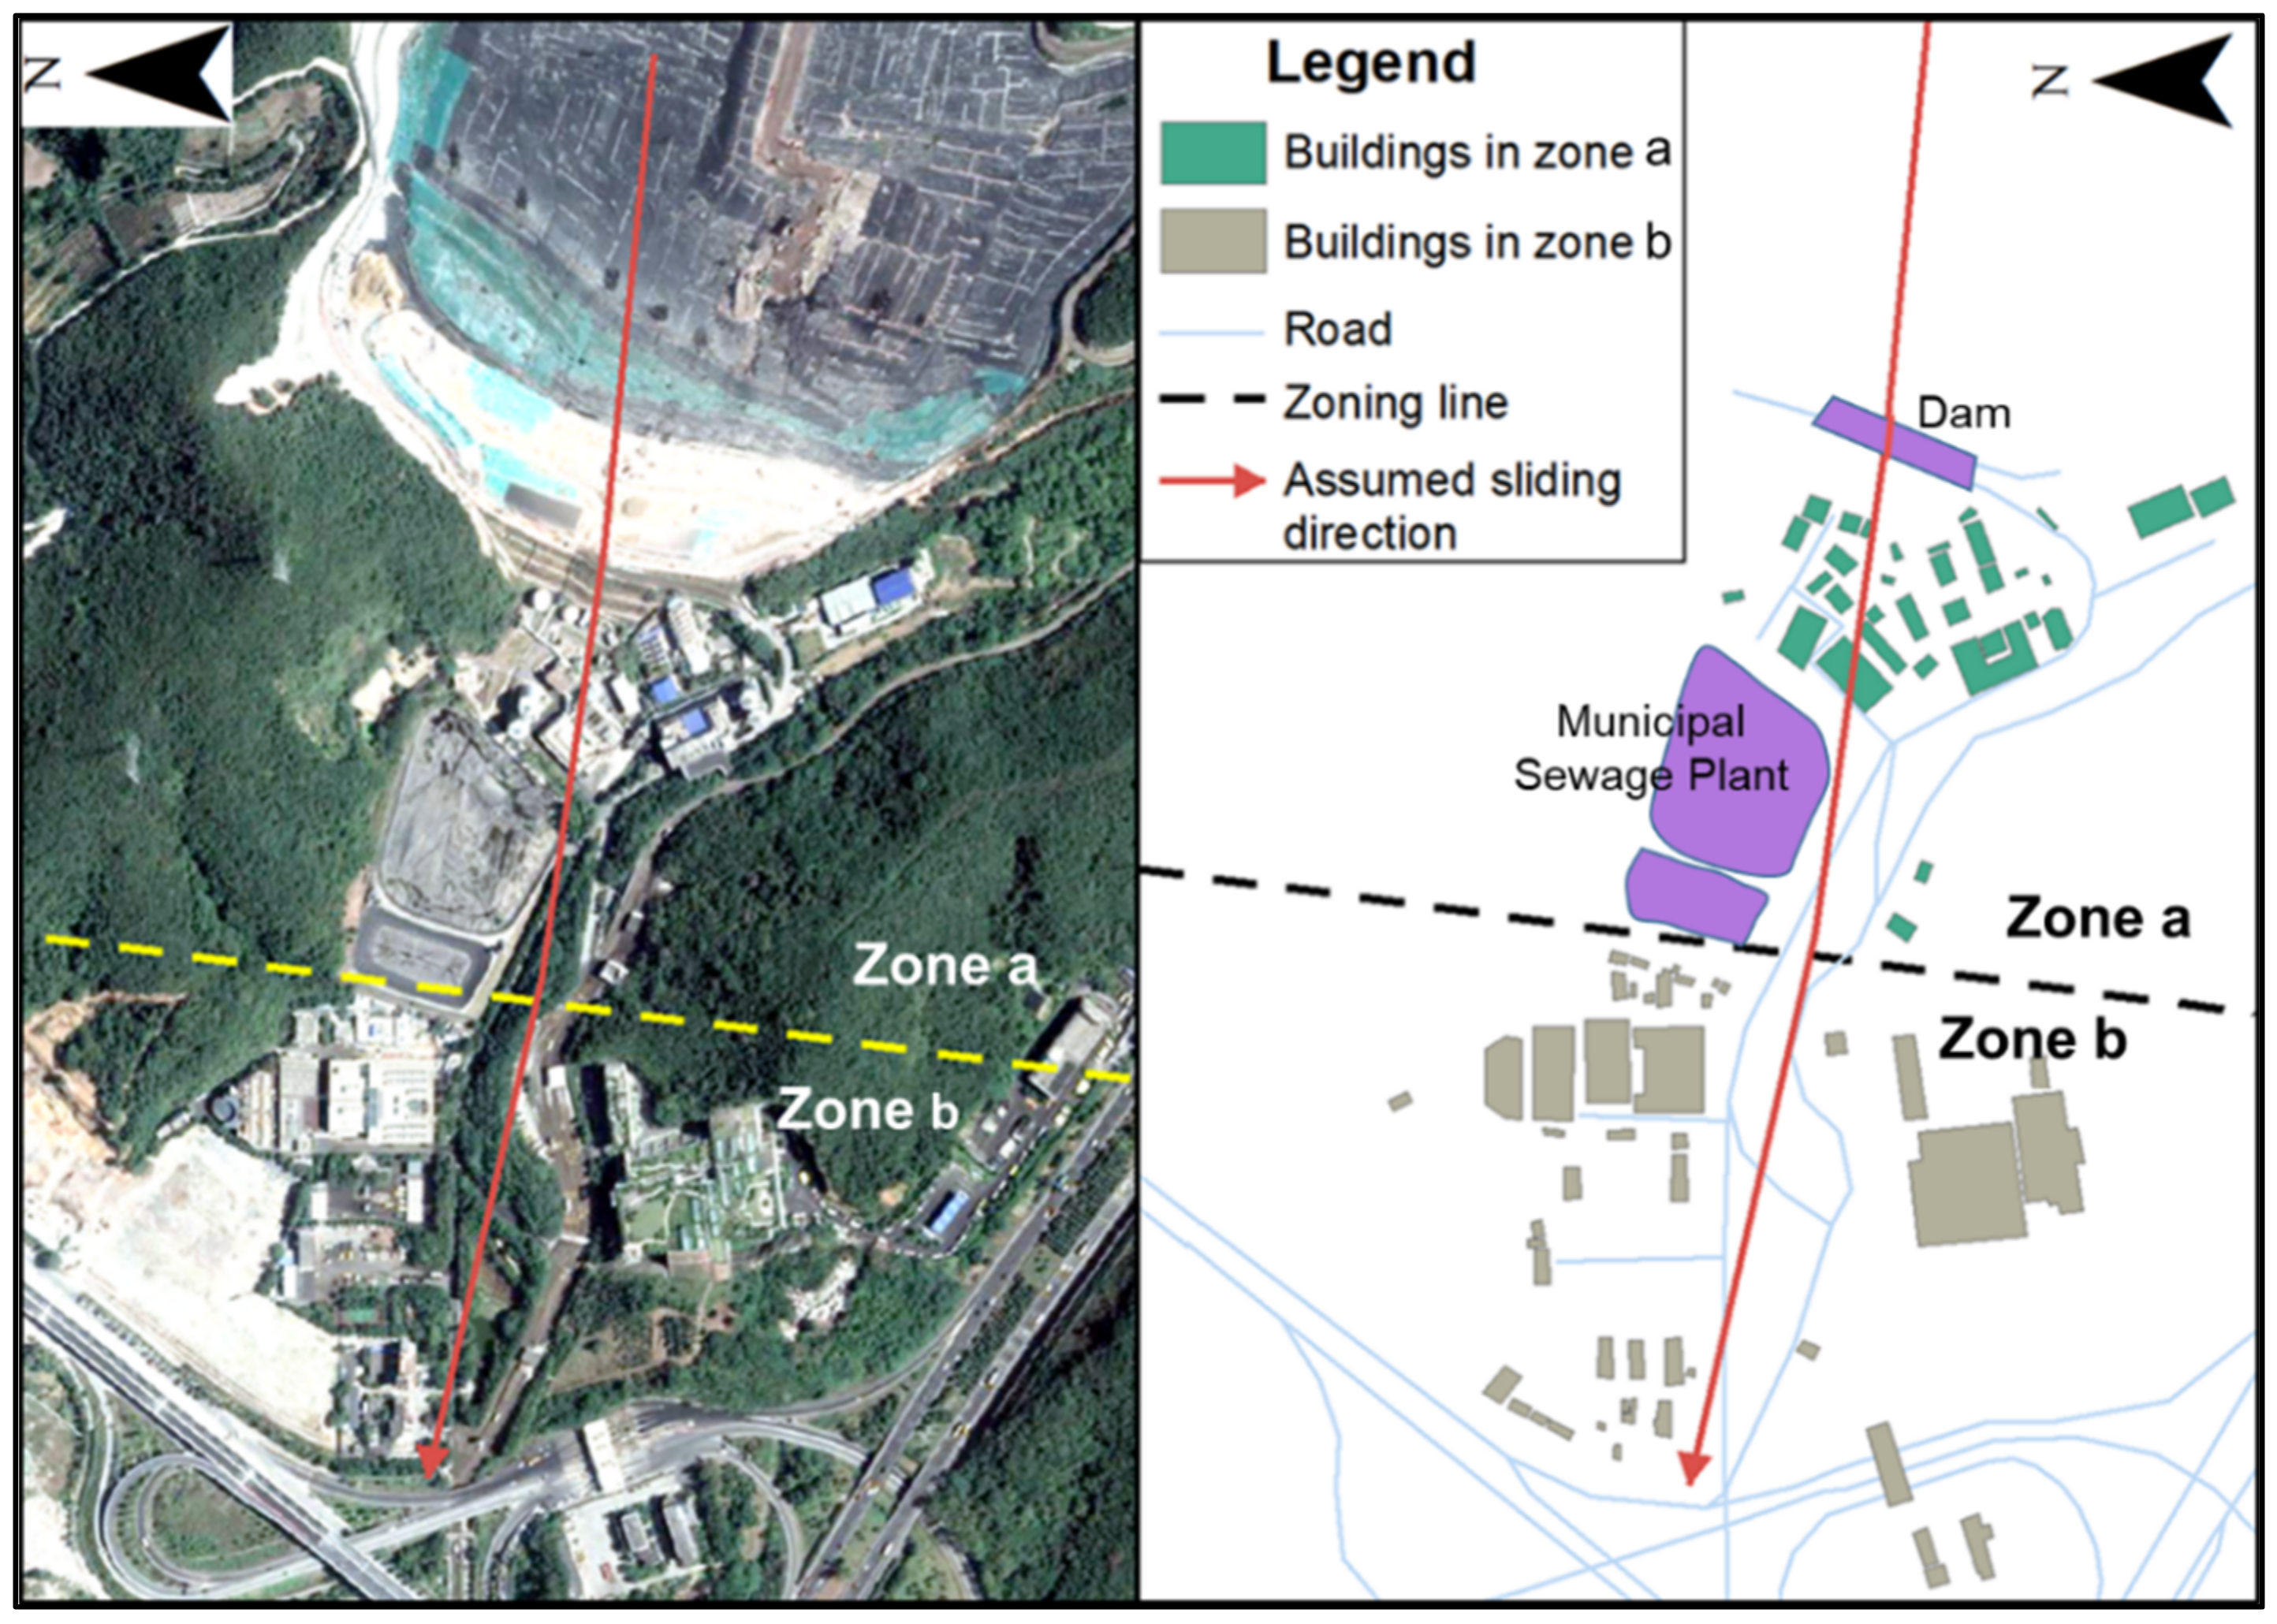
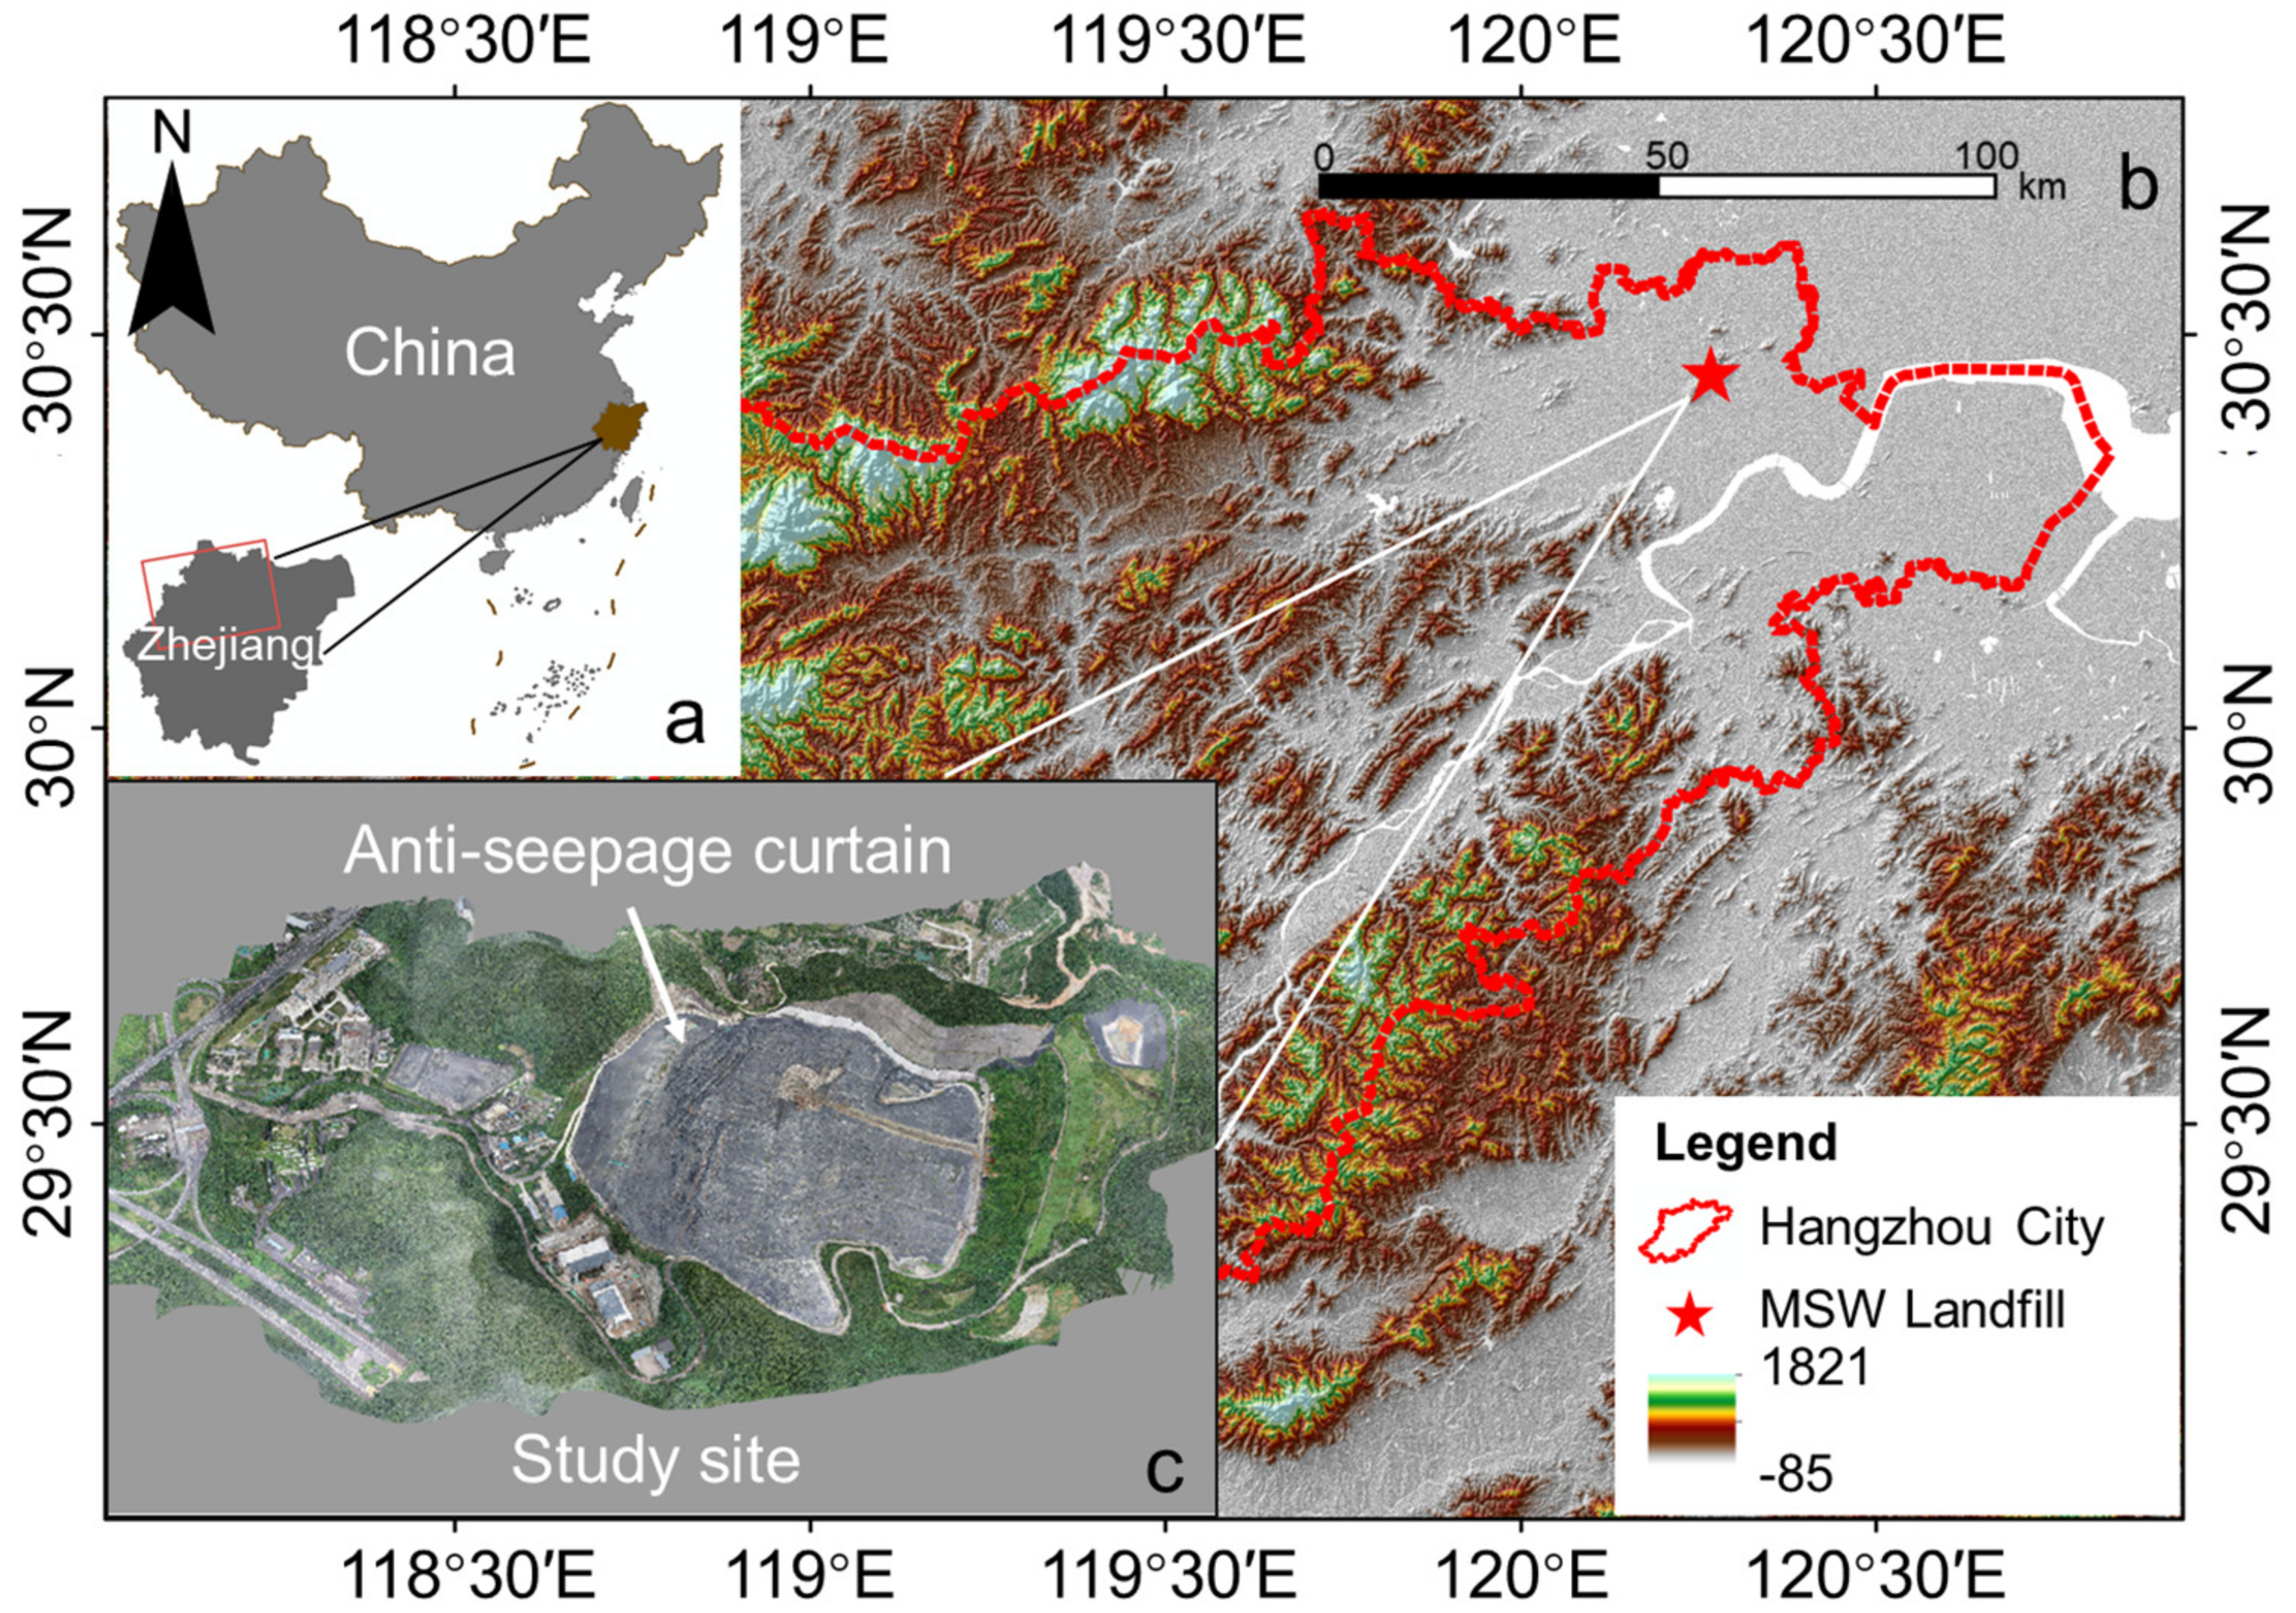
2. Study Area
3. Materials and Methods
3.1. Ground Measurements
3.2. InSAR Technique
3.3. UAV Photogrammetry
3.4. Quantitative Risk Assessment
4. Results
4.1. InSAR Technique
4.2. UAV Photogrammetry
4.3. Analysis of Deformation Mechanism
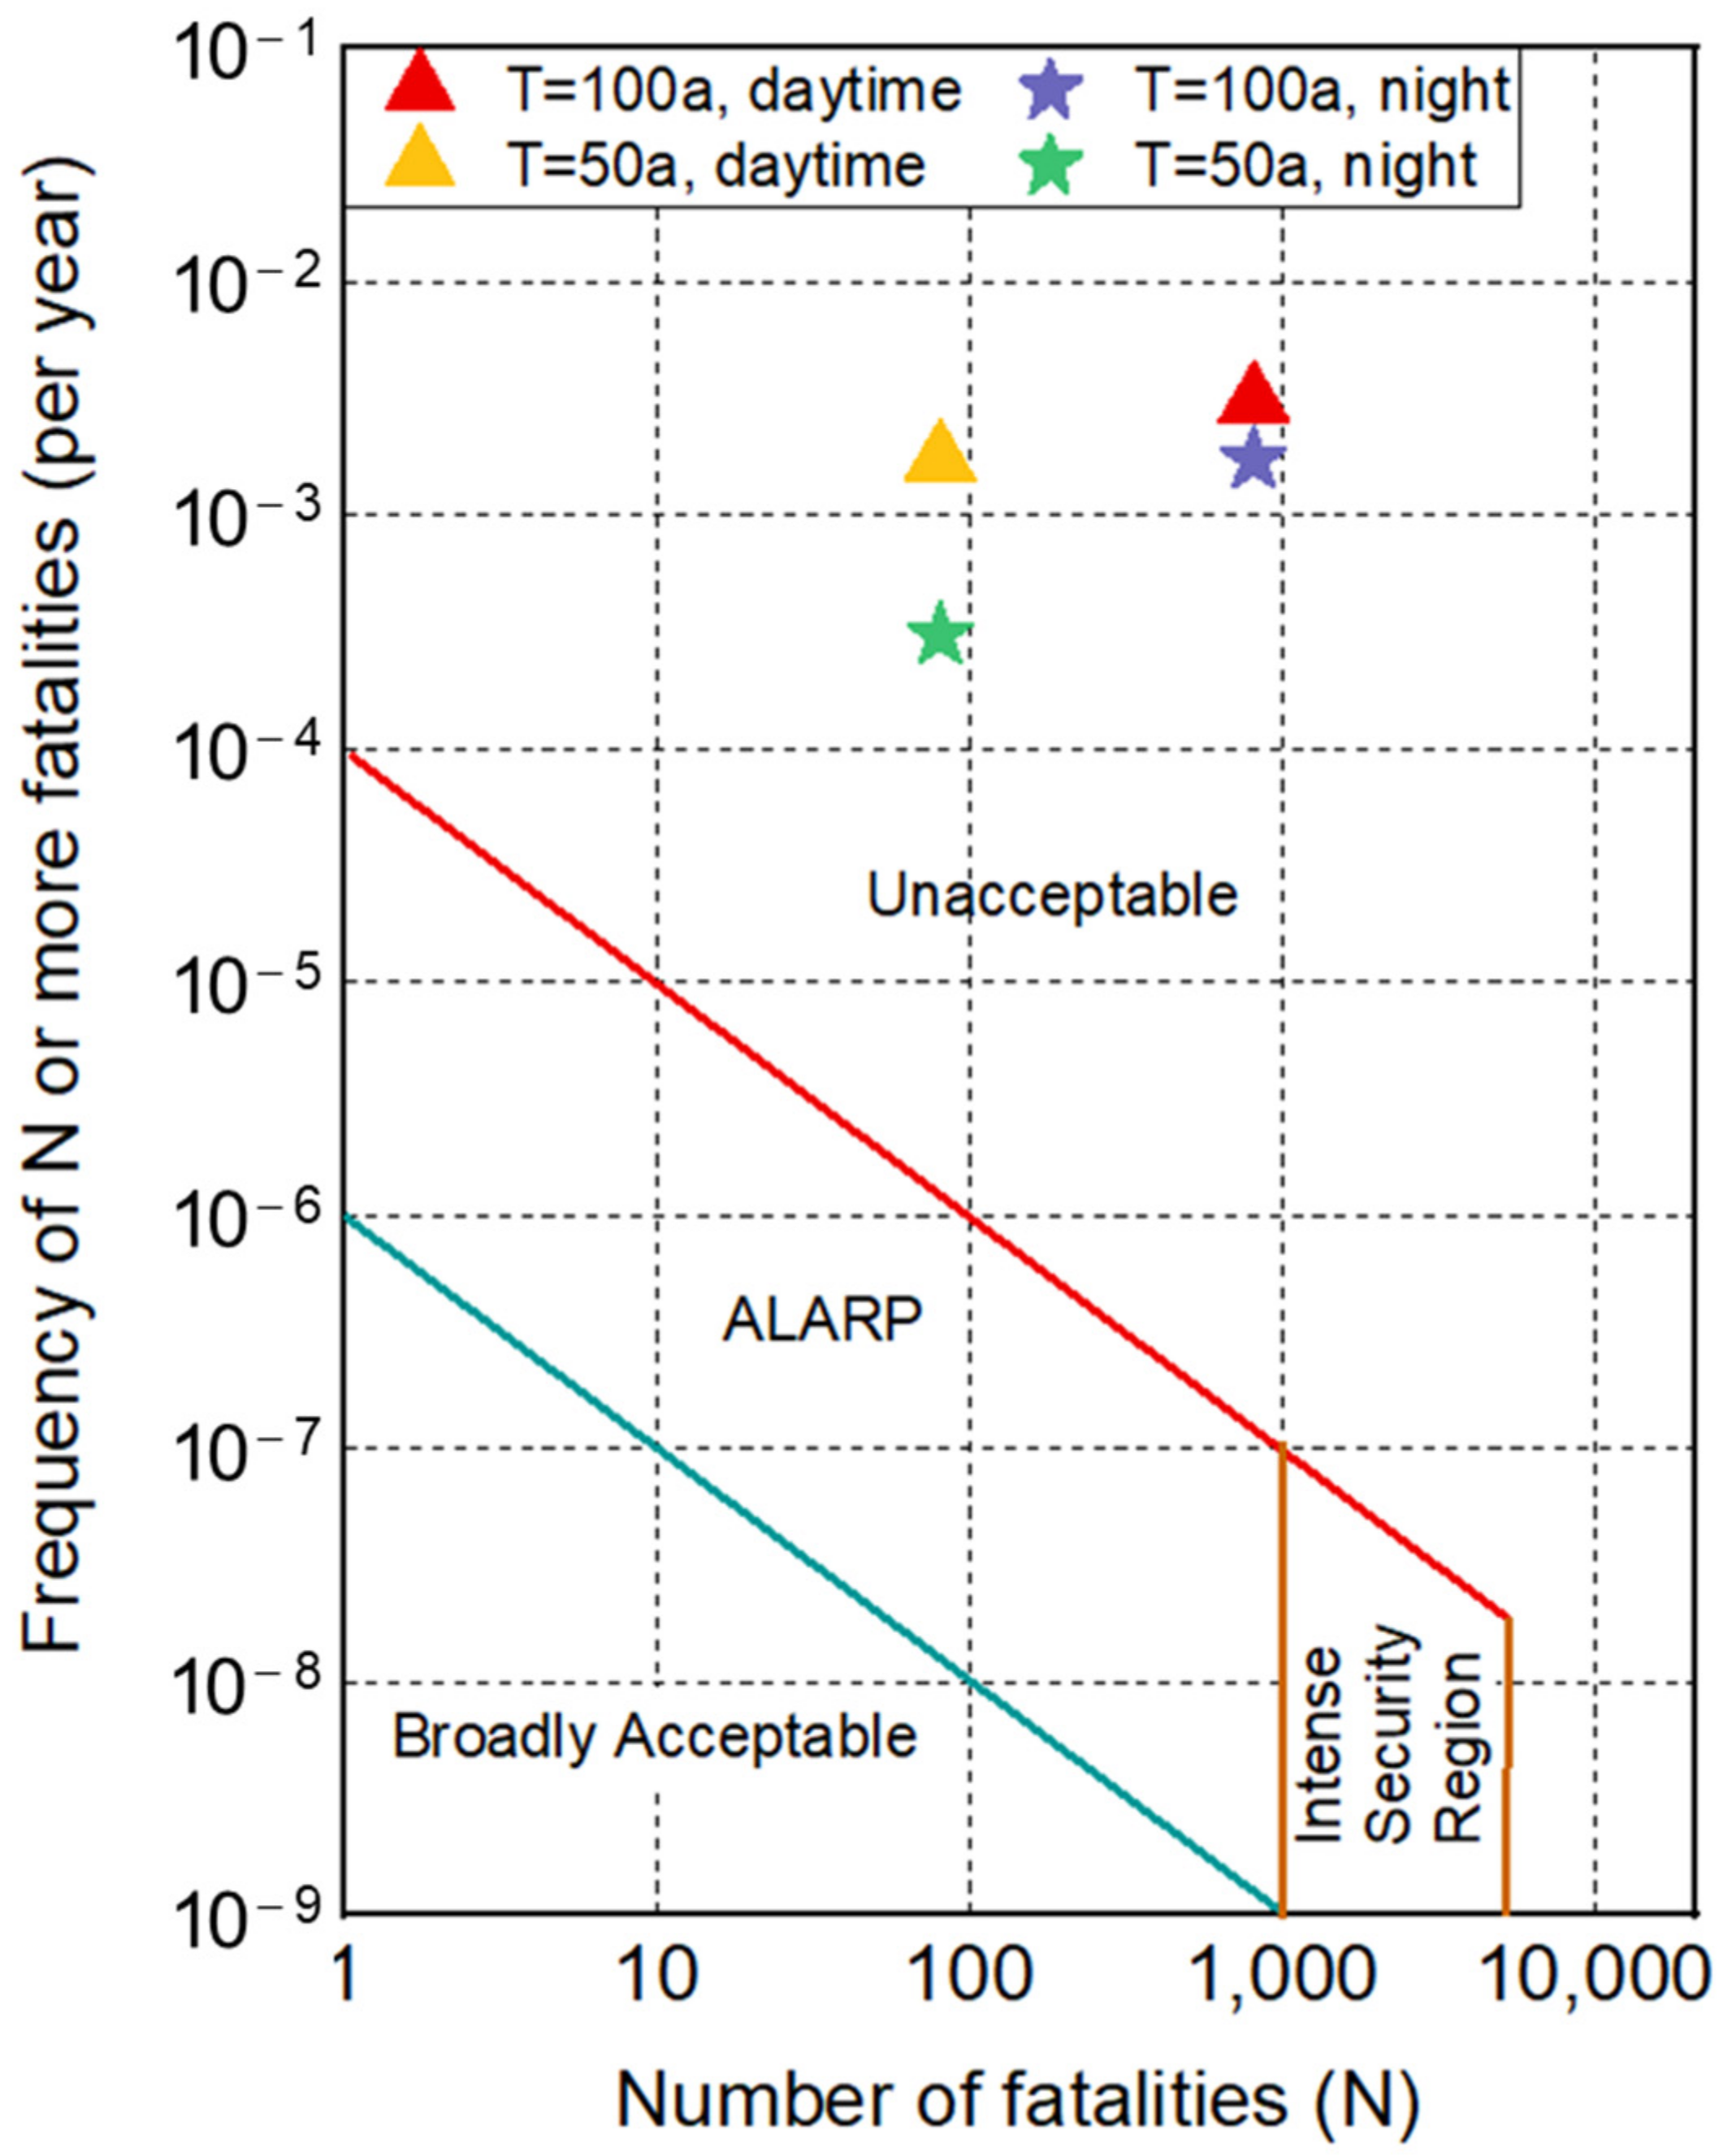
4.4. Quantitative Risk Assessment of Potential Landfill Failure
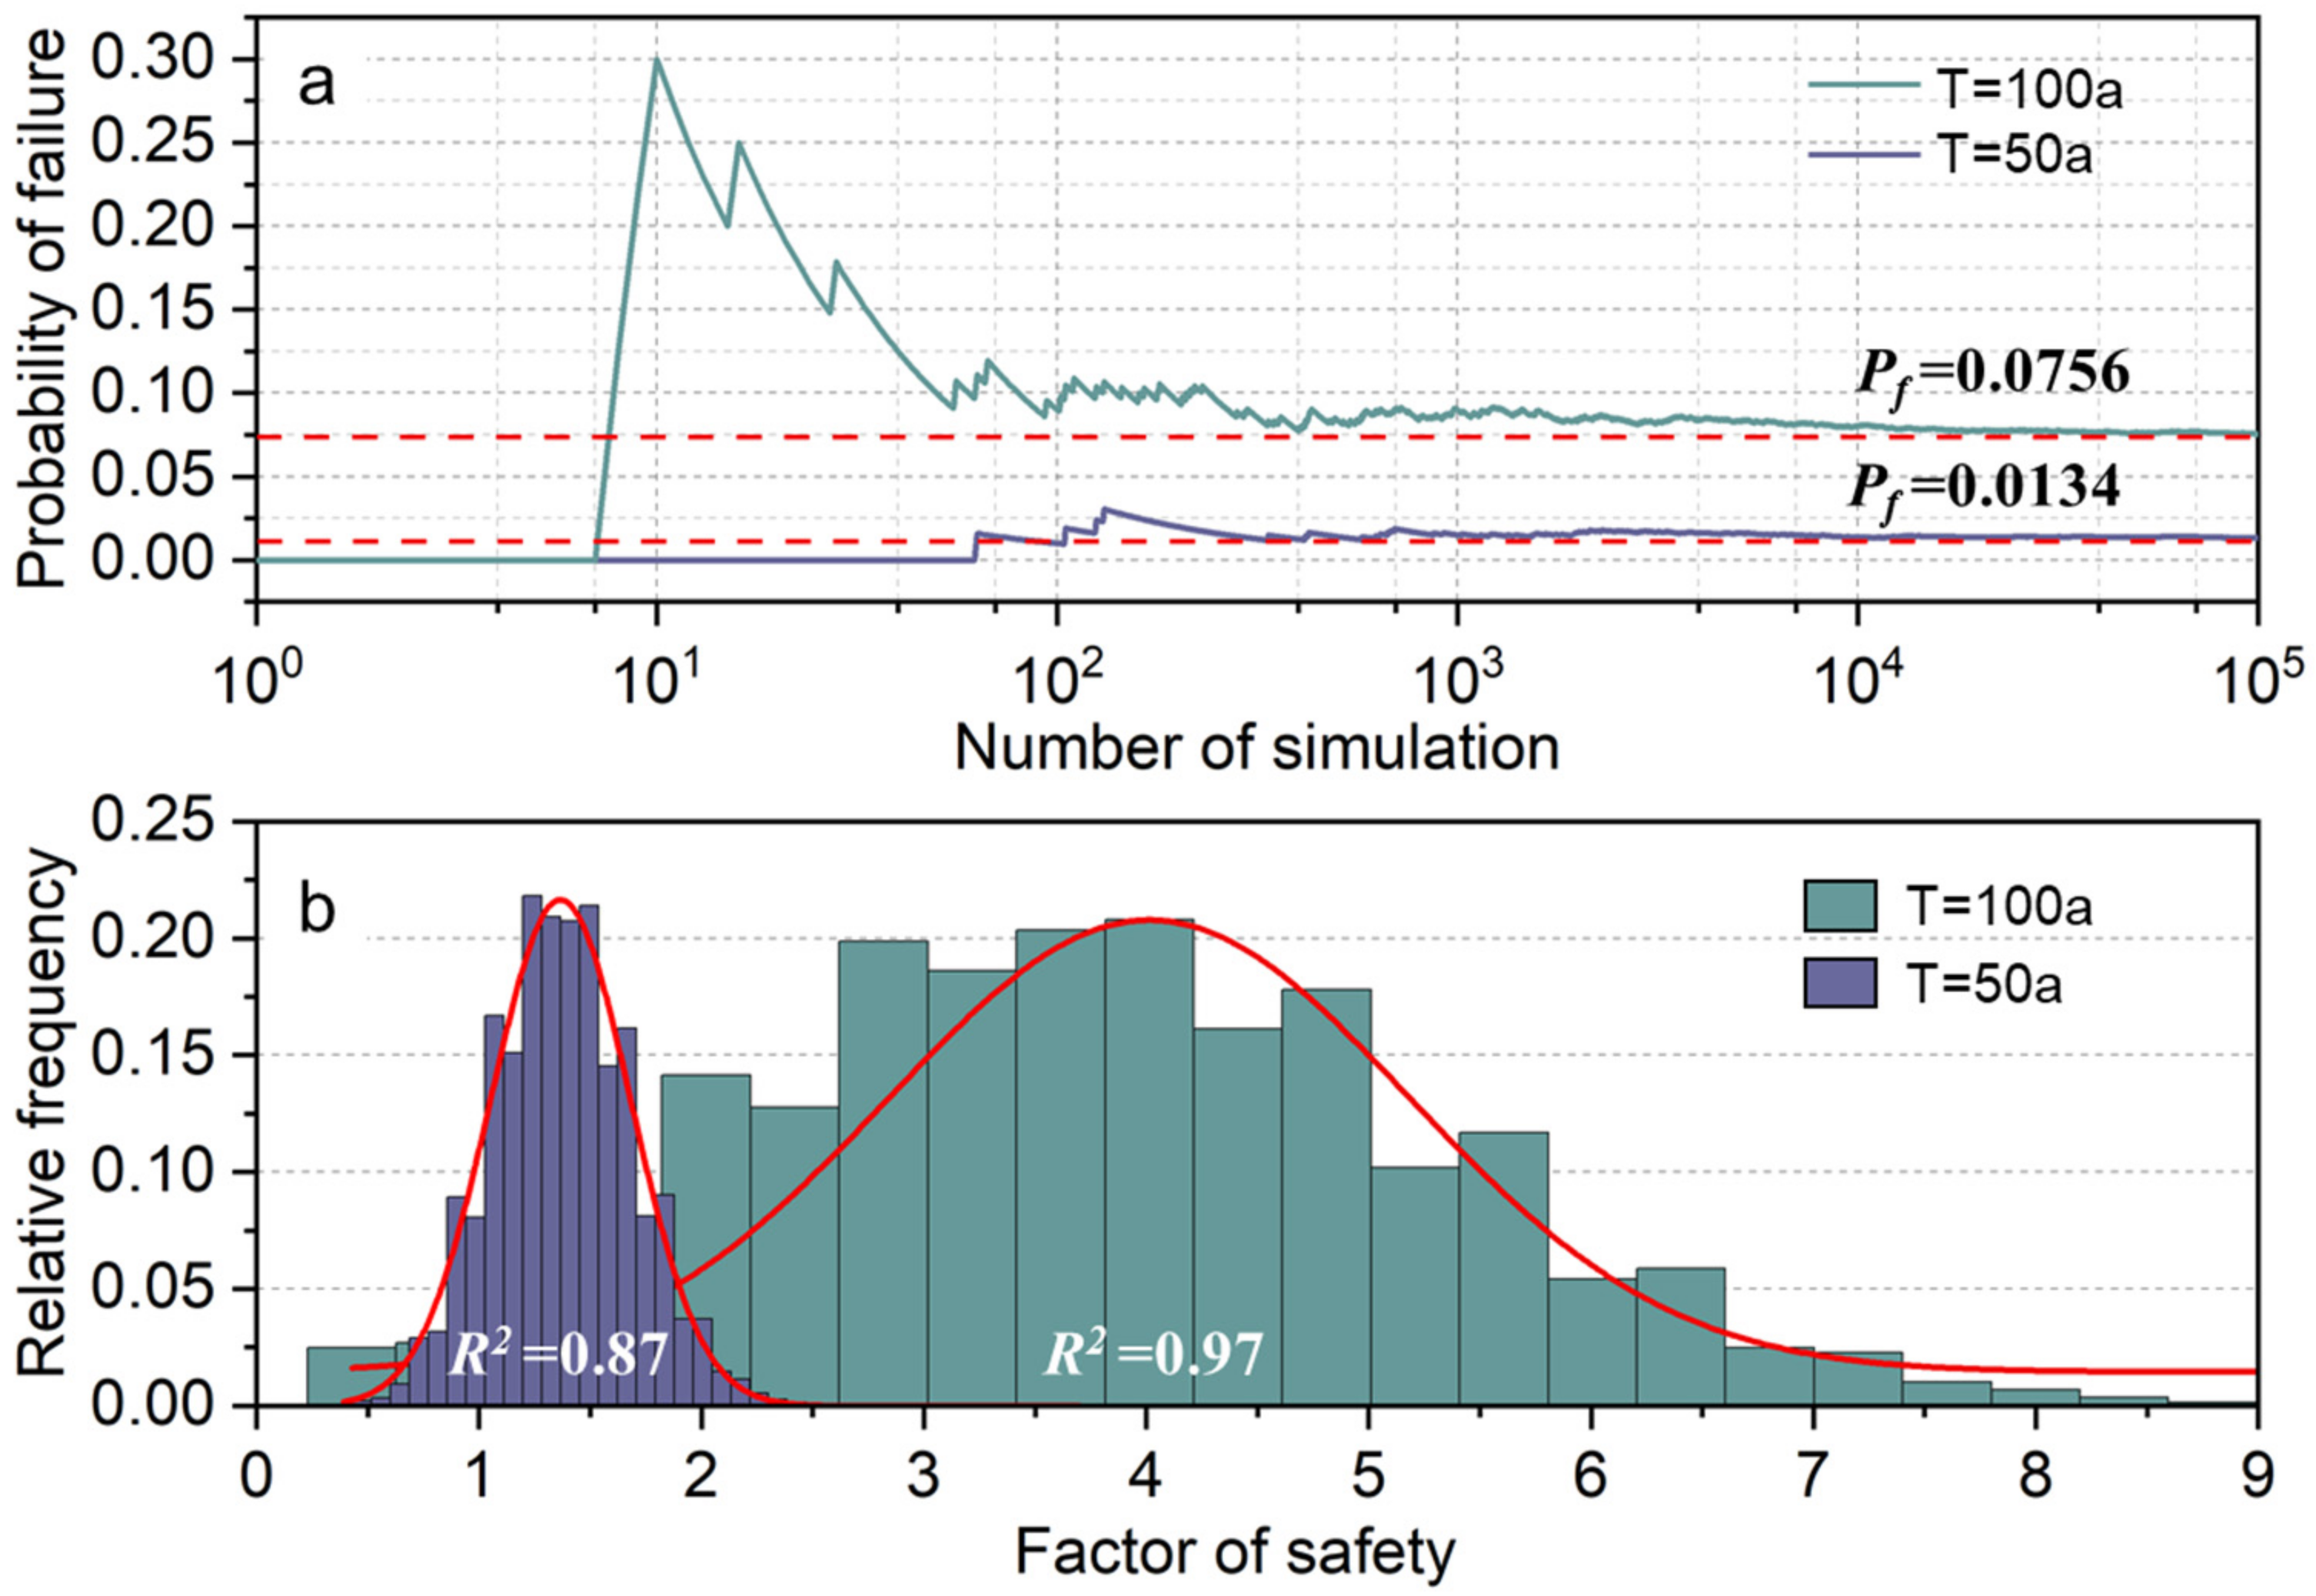
4.4.1. Determination of Failure Probability, Pf
4.4.2. Determination of Temporal Probability (PT:L) and Spatial Probability (PS:T)
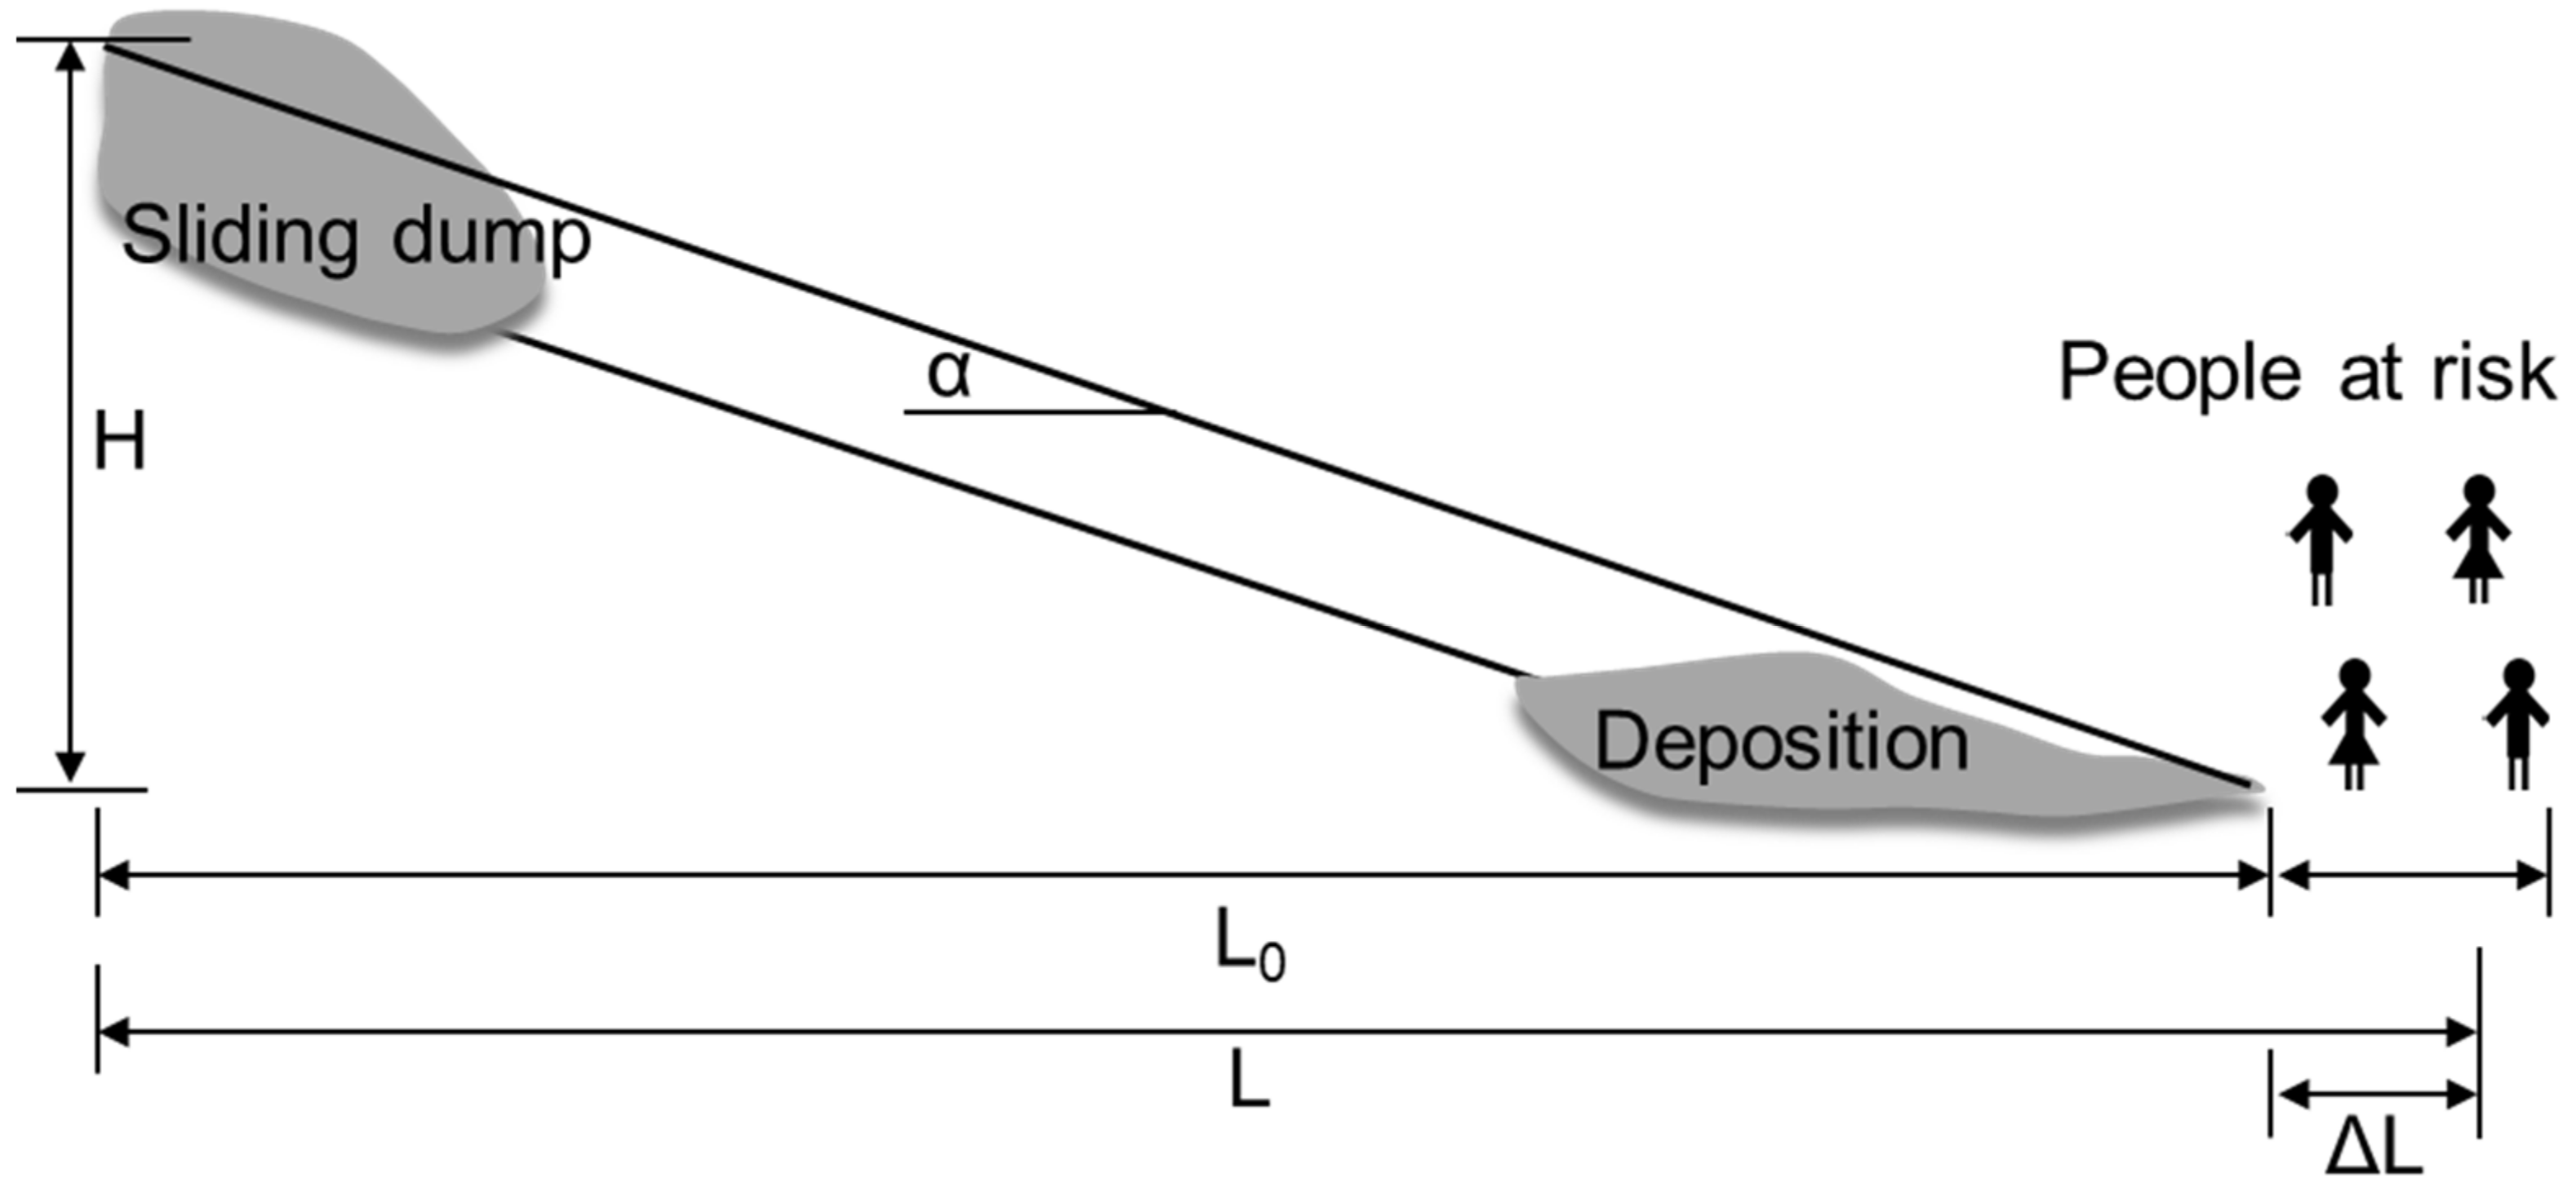
4.4.3. Consequence Analysis
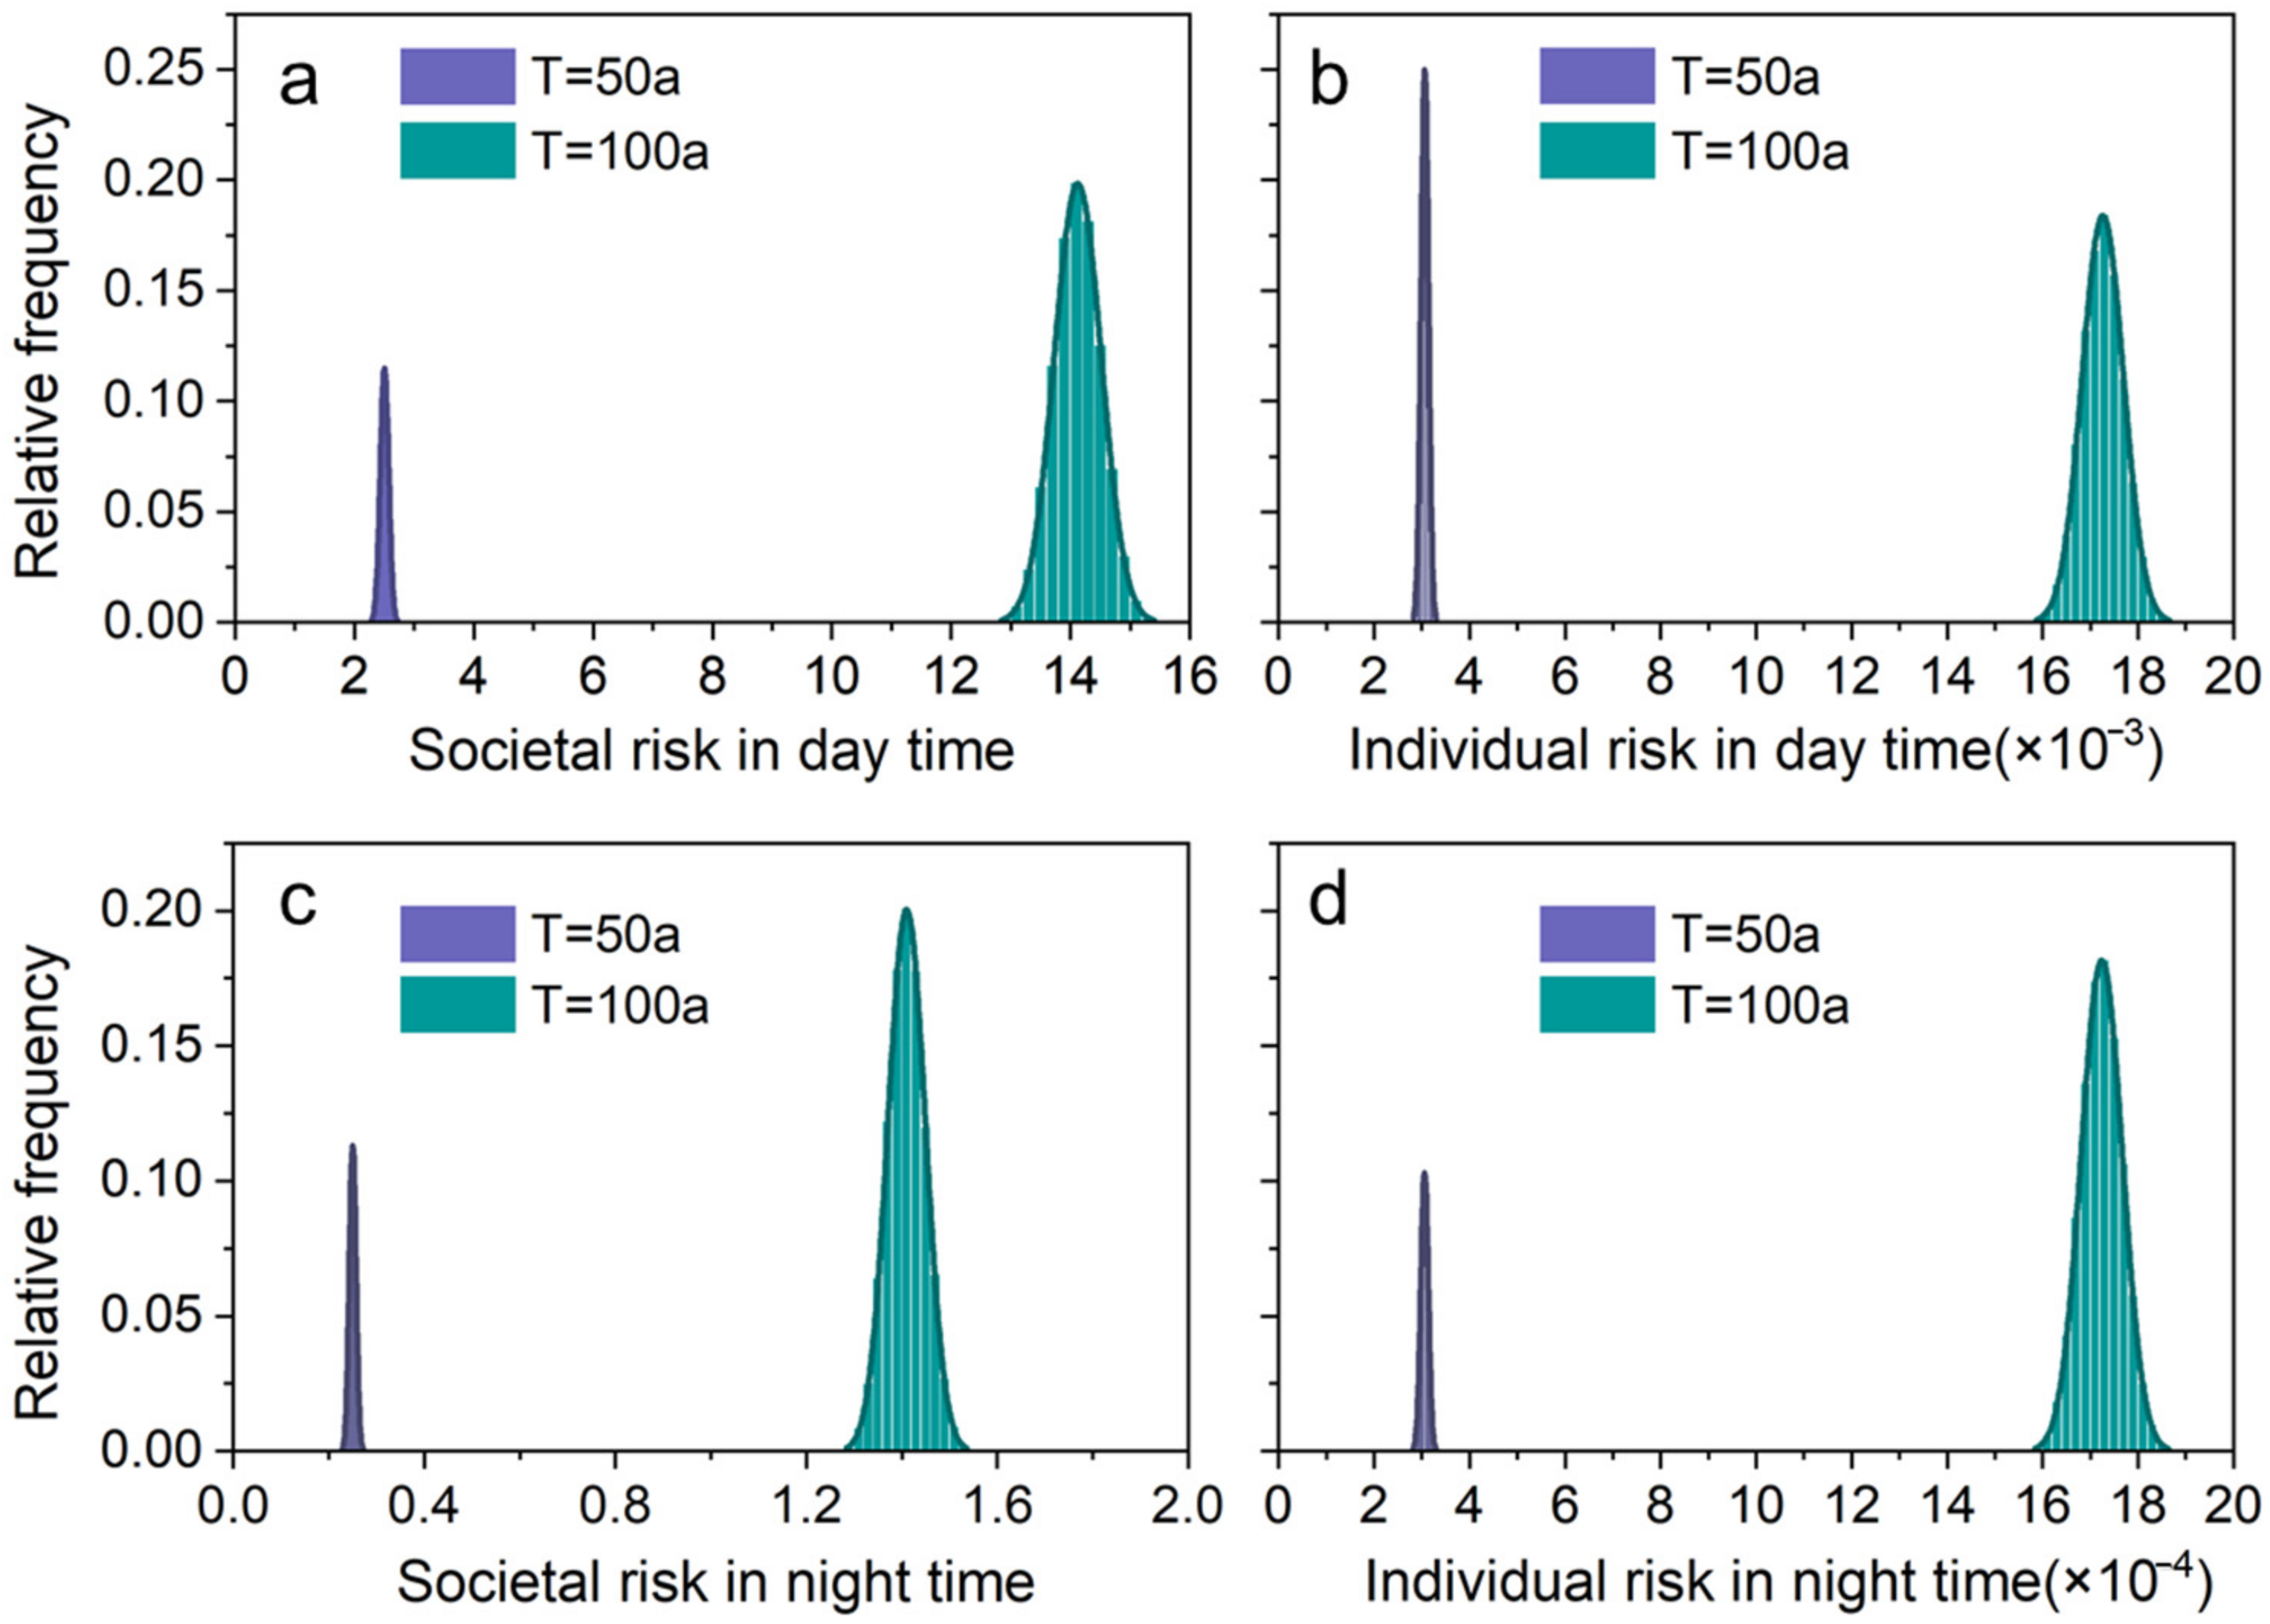
4.4.4. Risk Calculation
4.4.5. Risk Management
5. Discussion
6. Conclusions
Author Contributions
Funding
Institutional Review Board Statement
Informed Consent Statement
Data Availability Statement
Conflicts of Interest
References
- Troschinetz, A.M.; Mihelcic, J.R. Sustainable recycling of municipal solid waste in developing countries. Waste Manag. 2009, 29, 915–923. [Google Scholar] [CrossRef]
- Zhan, L.T.; Xu, H.; Chen, Y.M.; Lan, J.W.; Lin, W.A.; Xu, X.B.; He, P.J. Biochemical, hydrological and mechanical behaviors of high food waste content MSW landfill: Liquid-gas interactions observed from a large-scale experiment. Waste Manag. 2017, 68, 307–318. [Google Scholar] [CrossRef]
- Chen, Y.M.; Ke, H.; Fredlund, D.G.; Zhan, L.T.; Xie, Y. Secondary Compression of Municipal Solid Wastes and a Compression Model for Predicting Settlement of Municipal Solid Waste Landfills. J. Geotech. Geoenvironmental Eng. 2010, 136, 706–717. [Google Scholar] [CrossRef]
- Jahanfar, A.; Amirmojahedi, M.; Gharabaghi, B.; Dubey, B.; McBean, E.; Kumar, D. A novel risk assessment method for landfill slope failure: Case study application for Bhalswa Dumpsite, India. Waste Manag. Res. 2017, 35, 220–227. [Google Scholar] [CrossRef] [Green Version]
- Dai, K.R.; Li, Z.H.; Tomas, R.; Liu, G.X.; Yu, B.; Wang, X.W.; Cheng, H.Q.; Chen, J.J.; Stockamp, J. Monitoring activity at the Daguangbao mega-landslide (China) using Sentinel-1 TOPS time series interferometry. Remote Sens. Environ. 2016, 186, 501–513. [Google Scholar] [CrossRef] [Green Version]
- Fiaschi, S.; Holohan, E.P.; Sheehy, M.; Floris, M. PS-InSAR Analysis of Sentinel-1 Data for Detecting Ground Motion in Temperate Oceanic Climate Zones: A Case Study in the Republic of Ireland. Remote Sens. 2019, 11, 348. [Google Scholar] [CrossRef] [Green Version]
- Papageorgiou, E.; Foumelis, M.; Trasatti, E.; Ventura, G.; Raucoules, D.; Mouratidis, A. Multi-Sensor SAR Geodetic Imaging and Modelling of Santorini Volcano Post-Unrest Response. Remote Sens. 2019, 11, 259. [Google Scholar] [CrossRef] [Green Version]
- Refice, A.; Spalluto, L.; Bovenga, F.; Fiore, A.; Miccoli, M.N.; Muzzicato, P.; Nitti, D.O.; Nutricato, R.; Pasquariello, G. Integration of persistent scatterer interferometry and ground data for landslide monitoring: The Pianello landslide (Bovino, Southern Italy). Landslides 2019, 16, 447–468. [Google Scholar] [CrossRef] [Green Version]
- Tzouvaras, M.; Kouhartsiouk, D.; Agapiou, A.; Danezis, C.; Hadjimitsis, D.G. The Use of Sentinel-1 Synthetic Aperture Radar (SAR) Images and Open-Source Software for Cultural Heritage: An Example from Paphos Area in Cyprus for Mapping Landscape Changes after a 5.6 Magnitude Earthquake. Remote Sens. 2019, 11, 1766. [Google Scholar] [CrossRef] [Green Version]
- Wasowski, J.; Pisano, L. Long-term InSAR, borehole inclinometer, and rainfall records provide insight into the mechanism and activity patterns of an extremely slow urbanized landslide. Landslides 2020, 17, 445–457. [Google Scholar] [CrossRef]
- Intrieri, E.; Raspini, F.; Fumagalli, A.; Lu, P.; Del Conte, S.; Farina, P.; Allievi, J.; Ferretti, A.; Casagli, N. The Maoxian landslide as seen from space: Detecting precursors of failure with Sentinel-1 data. Landslides 2018, 15, 123–133. [Google Scholar] [CrossRef] [Green Version]
- Prasad, K.A.; Ottinger, M.; Wei, C.; Leinenkugel, P. Assessment of Coastal Aquaculture for India from Sentinel-1 SAR Time Series. Remote Sens. 2019, 11, 357. [Google Scholar] [CrossRef] [Green Version]
- Liu, G.X.; Ding, X.L.; Li, Z.L.; Li, Z.W.; Chen, Y.Q.; Yu, S.B. Pre- and co-seismic ground deformations of the 1999 Chi-Chi, Taiwan earthquake, measured with SAR interferometry. Comput. Geosci. 2004, 30, 333–343. [Google Scholar] [CrossRef]
- Wasowski, J.; Bovenga, F. Investigating landslides and unstable slopes with satellite Multi Temporal Interferometry: Current issues and future perspectives. Eng. Geol. 2014, 174, 103–138. [Google Scholar] [CrossRef]
- Dai, C.; Li, W.L.; Wang, D.; Lu, H.Y.; Xu, Q.; Jian, J. Active Landslide Detection Based on Sentinel-1 Data and InSAR Technology in Zhouqu County, Gansu Province, Northwest China. J. Earth Sci. 2021, 32, 1092–1103. [Google Scholar] [CrossRef]
- Rossi, G.; Tanteri, L.; Tofani, V.; Vannocci, P.; Moretti, S.; Casagli, N. Multitemporal UAV surveys for landslide mapping and characterization. Landslides 2018, 15, 1045–1052. [Google Scholar] [CrossRef] [Green Version]
- Shi, B.Q.; Liu, C. UAV for Landslide Mapping and Deformation Analysis. In Proceedings of the International Conference on Intelligent Earth Observing and Applications 2015, Guilin, China, 23–24 October 2015; Volume 9808, p. 98080P. [Google Scholar]
- Baiocchi, V.; Napoleoni, Q.; Tesei, M.; Servodio, G.; Alicandro, M. UAV for monitoring the settlement of a landfill (October, 10.1080/22797254.2019.1683471, 2019). Eur. J. Remote Sens. 2019, 52, 53. [Google Scholar] [CrossRef]
- Dai, F.C.; Lee, C.F.; Ngai, Y.Y. Landslide risk assessment and management: An overview. Eng. Geol. 2002, 64, 65–87. [Google Scholar] [CrossRef]
- Jahanfar, A.; Dubey, B.; Gharabaghi, B.; Movahed, S. Landfill Failure Mobility Analysis: A Probabilistic Approach. World Acad. 2016, 10, 476–484. [Google Scholar]
- Zhang, S.; Zhang, L.M.; Peng, M.; Zhang, L.L.; Zhao, H.F.; Chen, H.X. Assessment of risks of loose landslide deposits formed by the 2008 Wenchuan earthquake. Nat. Hazard. Earth Syst. Sci. 2012, 12, 1381–1392. [Google Scholar] [CrossRef] [Green Version]
- ASF Data Search. Available online: https://search.asf.alaska.edu/ (accessed on 1 February 2021).
- Berardino, P.; Fornaro, G.; Lanari, R.; Sansosti, E. A new algorithm for surface deformation monitoring based on small baseline differential SAR interferograms. IEEE Trans. Geosci. Remote Sens. 2002, 40, 2375–2383. [Google Scholar] [CrossRef] [Green Version]
- Dong, J.; Liao, M.S.; Xu, Q.; Zhang, L.; Tang, M.G.; Gong, J.Y. Detection and displacement characterization of landslides using multi- temporal satellite SAR interferometry: A case study of Danba County in the Dadu River Basin. Eng. Geol. 2018, 240, 95–109. [Google Scholar] [CrossRef]
- Meng, Q.K.; Li, W.L.; Raspini, F.; Xu, Q.; Peng, Y.; Ju, Y.Z.; Zheng, Y.Z.; Casagli, N. Time-series analysis of the evolution of large-scale loess landslides using InSAR and UAV photogrammetry techniques: A case study in Hongheyan, Gansu Province, Northwest China. Landslides 2021, 18, 251–265. [Google Scholar] [CrossRef]
- Wang, X.W.; Liu, G.X.; Yu, B.; Dai, K.R.; Zhang, R.; Chen, Q.; Li, Z.L. 3D coseismic deformations and source parameters of the 2010 Yushu earthquake (China) inferred from DInSAR and multiple-aperture InSAR measurements. Remote Sens. Environ. 2014, 152, 174–189. [Google Scholar] [CrossRef]
- Australian Geomechanics Society Sub-Committee on Landslide Risk Management. Landslide Risk Management Concepts and Guidelines. Aust. Geomech. News J. Aust. Geomech. Soc. 2002, 37, 1–44. [Google Scholar] [CrossRef]
- Morgan, G. Evaluating total risk to communities from large debris flows. In Proceedings of the 1st Canadian Symposium on Geotechnique and Natural Hazards. Geohazards-92 Symposium, Richmond, BC, Canada, 6–9 May 1992; BiTech Publishers: Richmond, BC, Canada, 1992; pp. 225–236. [Google Scholar]
- Chen, Y.M.; Xu, X.B.; Zhan, L.T. Analysis of solid-liquid-gas interactions in landfilled municipal solid waste by a bio-hydro-mechanical coupled model. Sci. China Technol. Sci. 2012, 55, 81–89. [Google Scholar] [CrossRef]
- Li, X.L.; Shi, J.Y. Stress-strain Behaviour and Shear Strength of Municipal Solid Waste (MSW). Ksce J. Civ. Eng. 2016, 20, 1747–1758. [Google Scholar] [CrossRef]
- Raviteja, K.V.N.S.; Basha, B.M. Characterization of Variability of Unit Weight and Shear Parameters of Municipal Solid Waste. J. Hazard. Toxic Radio 2021, 25, 04020077. [Google Scholar] [CrossRef]
- Zhan, L.T.; Luo, X.Y.; Guan, R.Q.; Zeng, X.; Lan, J.W.; Chen, Y.M.; Lin, W.A. Failure mechanism of sludge pit and downstream waste slope of a MSW landfill. Chin. J. Geotech. Eng. 2013, 35, 1189–1196. [Google Scholar]
- Li, Z.H.; Song, L.L.; Liang, Z.R.; Wang, K.; Liu, S.F. Precipitation Characteristics and Projection of Extreme Precipitation Trend in Hangzhou City. Meteorol. Mon. 2018, 44, 781–789. [Google Scholar]
- Luna, B.Q.; Blahut, J.; Camera, C.; van Westen, C.; Apuani, T.; Jetten, V.; Sterlacchini, S. Physically based dynamic run-out modelling for quantitative debris flow risk assessment: A case study in Tresenda, northern Italy. Env. Earth Sci. 2014, 72, 645–661. [Google Scholar]
- Luo, H.Y.; Zhang, L.L.; Zhang, L.M. Progressive failure of buildings under landslide impact. Landslides 2019, 16, 1327–1340. [Google Scholar] [CrossRef]
- Wong, H.; Ko, F. Landslide Risk Assessment: Application and Practice; Geotechnical Engineering Office, Civil Engineering and Development Department: Hongkong, China, 2006.
- Fell, R. Landslide Risk Assessment and Acceptable Risk. Can. Geotech. J. 1994, 31, 261–272. [Google Scholar] [CrossRef]
- Ministry of Housing and Urban-Rural Development of the People’s Republic of China. Technical Code for Geotechnical Engineering of Municipal Solid MSW Sanitary Landfill; China Architecture Publishing & Media Co.Ltd.: Beijing, China, 2012.
- Hangzhou Municipal Government. Announcement of Various Safety Production and Natural Disasters in the City in 2020. Available online: http://www.hangzhou.gov.cn/art/2021/1/22/art_1229063408_3838849.html (accessed on 1 September 2021).
- Hangzhou Bureau of Statistics. Available online: http://tjj.hangzhou.gov.cn/art/2020/10/29/art_1229453592_3819709.html (accessed on 1 September 2021).
- Mateos, R.M.; Azañón, J.M.; Roldán, F.J.; Notti, D.; Pérez-Peña, V.; Galve, J.P.; Pérez-García, J.L.; Colomo, C.M.; Gómez-López, J.M.; Montserrat, O.; et al. The combined use of PSInSAR and UAV photogrammetry techniques for the analysis of the kinematics of a coastal landslide affecting an urban area (SE Spain). Landslides 2017, 14, 743–754. [Google Scholar] [CrossRef]
- Yan, Y.; Doin, M.-P.; Lopez-Quiroz, P.; Tupin, F.; Fruneau, B.; Pinel, V.; Trouve, E. Mexico City Subsidence Measured by InSAR Time Series: Joint Analysis Using PS and SBAS Approaches. IEEE J. Sel. Top. Appl. Earth Obs. Remote Sens. 2012, 5, 1312–1326. [Google Scholar] [CrossRef] [Green Version]
- Emil, M.; Sultan, M.; Alakhras, K.; Sataer, G.; Gozi, S.; Al-Marri, M.; Gebremichael, E. Countrywide Monitoring of Ground Deformation Using InSAR Time Series: A Case Study from Qatar. Remote Sens. 2021, 13, 702. [Google Scholar] [CrossRef]
- Baek, W.K.; Jung, H.S.; Jo, M.J.; Lee, W.J.; Zhang, L. Ground subsidence observation of solid waste landfill park using multi-temporal radar interferometry. Int. J. Urban Sci. 2019, 23, 406–421. [Google Scholar] [CrossRef]


| Year | Region and References | Elevation (m) | Distance of Flow (m) | Volume of Waste Flow (m3) | Cause of Failure | Loss of Life |
|---|---|---|---|---|---|---|
| 2017 | Meethotamualla (Sri Lanka) Karunawardena et al. (2019) | 50 | 280 | 72,342 | Rainfall induced landfill failure | 32 |
| 2015 | Shenzhen (China) Xu et al. (2017) | 111 | 1203 | 2.5 million | Inadequate compaction, insufficient dewatering systems, and increased steepening of the landfill slopes | 82 |
| 2013 | Shiraz City (Iran) (Falamaki et al., 2021) | 42 | 134 | 10,000 | Pressurised water infiltrating through the slope | 7 |
| 2010 | Patras (Greece) G. et al. (2013) | 30 | 50 | 12,000 | The failure was attributed to poor landfill practices, the steep inclination of the waste mass, and the increased percolation of rainfall water in the waste mass (and associated gas pressure generation) due to the absence of daily soil cover and surface water management system | 0 |
| 2005 | Badung (Indonesia) Lavigne et al. (2014) | 100 | 1000 | 2.7 million | Rainfall induced landfill failure | 147 |
| 2000 | Quezon City (Philippines) Huvaj-Sarihan and Stark (2008) | 33 | 122 | 1.2 million | Shear failure followed heavy typhoon rains | 330 |
| 1997 | Bogota (Columbia) Blight (2008) Caicedo et al. (2002) | 80 | 500 | 1.5 million | The pore pressure was the main factor responsible for the instability of the landfill | 0 |
| 1997 | Durban (South Africa) Blight (2008) | 45 | 80 | 180,000 | The liquids were obviously accumulating in the waste body and building up a head of pore pressure | 0 |
| 1993 | Istanbul (Turkey) Kocasoy and Curi (1995) | 40 | 60 | 15,000 | Suddenly applied additional disturbing force and the winter rain triggered the failure | 39 |
| 1977 | Sarajevo (former Yugoslavia) Blight (2008) | 130 | 1000 | 200,000 | Probably resulting from large quantities of winter rain infiltration into the uncompacted and uncovered waste | 0 |
| Monitoring Method | Observable Deformation Direction | Observable Deformation Range | Advantages | Disadvantages |
|---|---|---|---|---|
| InSAR technique | LOS (Line Of Sight) | ≤2.8 cm | High-precision, large coverage, time-efficient. labor-saving | Decorrelations caused by spatial distribution, temporal intervals, single-look directions, and atmospheric delay; difficulties in solving deformation direction |
| UAV photogrammetry | Vertical | ≥5.7 cm | Flexible, macro-scale coverage, labor-saving | Weather-sensitive, relatively low accuracy, deformation monitoring direction limitations |
| Ground measurements | Vertical and horizontal | 1–2 mm | High-precision and stable | High cost, small coverage, labor-intensive |
| Radar Satellite | Sentinel-1 |
|---|---|
| Time | November 2019–November 2020 |
| Orbital direction | Ascending |
| Band | C |
| Radar wavelength | 5.6 cm |
| Spatial resolution | 5 × 20 m |
| Revisit period | 12 days |
| Polarization mode | VV |
| Incidence angle | 39.3° |
| Weight | 1380 g |
| Maximum horizontal flight speed | 72 km/h |
| Maximum allowable wind speed | 10 m/s |
| Maximum flight time | 28~30 min |
| Satellite positioning module | GPS / GLONASS dual mode |
| Controllable rotation range | Pitch: −90° to +30° |
| Image sensor | 1/2.3 inch CMOS 12.4 million effective pixels |
| Precipitation Scenario | Return Period | Rainfall Intensity | Additional Condition |
|---|---|---|---|
| Scenario 1 | 50 years | ≥194 mm/d | Effective drainage facilities |
| Scenario 2 | 100 years | ≥207 mm/d | Failure of drainage facilities |
| Partition | Depth (m) | Unit Weight (kN/m3) | Cohesion (kPa) | Friction Angle (°) | ||
|---|---|---|---|---|---|---|
| Mean | COV | Mean | COV | |||
| Shallow | 0–10 | 11.3 | 20 | 0.15 | 12 | 0.3 |
| Middle | 10–30 | 12.5 | 15 | 0.15 | 18 | 0.3 |
| Deep | Over 30 | 13.9 | 10 | 0.15 | 25 | 0.3 |
| Precipitation Scenario | RDL (Individual Risk) | RLOL (Societal Risk) | |||
|---|---|---|---|---|---|
| Daytime | Nighttime | Daytime | Nighttime | ||
| T = 50a | Min | 2.66 × 10⁻³ | 2.75 × 10⁻⁴ | 2.20 | 0.22 |
| Max | 3.37 × 10⁻³ | 3.39 × 10⁻⁴ | 2.79 | 0.28 | |
| Mean | 3.06 × 10⁻³ | 3.05 × 10⁻⁴ | 2.50 | 0.25 | |
| T = 100a | Min | 0.015 | 1.52 × 10⁻³ | 12.47 | 1.25 |
| Max | 0.019 | 1.91 × 10⁻³ | 16.01 | 1.58 | |
| Mean | 0.017 | 1.72 × 10⁻³ | 14.12 | 1.41 | |
| Year | Fatalities | Registered Residents/×104 | Probability of Death/×10−5 |
|---|---|---|---|
| 2013 | 89 | 707 | 1.26 |
| 2014 | 72 | 716 | 1.01 |
| 2015 | 75 | 724 | 1.04 |
| 2016 | 107 | 736 | 1.45 |
| 2017 | 85 | 754 | 1.13 |
| 2018 | 54 | 774 | 0.70 |
| 2019 | 30 | 795 | 0.38 |
| 2020 | 33 | 823 | 0.40 |
Publisher’s Note: MDPI stays neutral with regard to jurisdictional claims in published maps and institutional affiliations. |
© 2021 by the authors. Licensee MDPI, Basel, Switzerland. This article is an open access article distributed under the terms and conditions of the Creative Commons Attribution (CC BY) license (https://creativecommons.org/licenses/by/4.0/).
Share and Cite
Zhang, S.; Lv, Y.; Yang, H.; Han, Y.; Peng, J.; Lan, J.; Zhan, L.; Chen, Y.; Bate, B. Monitoring and Quantitative Human Risk Assessment of Municipal Solid Waste Landfill Using Integrated Satellite–UAV–Ground Survey Approach. Remote Sens. 2021, 13, 4496. https://doi.org/10.3390/rs13224496
Zhang S, Lv Y, Yang H, Han Y, Peng J, Lan J, Zhan L, Chen Y, Bate B. Monitoring and Quantitative Human Risk Assessment of Municipal Solid Waste Landfill Using Integrated Satellite–UAV–Ground Survey Approach. Remote Sensing. 2021; 13(22):4496. https://doi.org/10.3390/rs13224496
Chicago/Turabian StyleZhang, Shuai, Yunhong Lv, Haiben Yang, Yingyue Han, Jingyu Peng, Jiwu Lan, Liangtong Zhan, Yunmin Chen, and Bate Bate. 2021. "Monitoring and Quantitative Human Risk Assessment of Municipal Solid Waste Landfill Using Integrated Satellite–UAV–Ground Survey Approach" Remote Sensing 13, no. 22: 4496. https://doi.org/10.3390/rs13224496
APA StyleZhang, S., Lv, Y., Yang, H., Han, Y., Peng, J., Lan, J., Zhan, L., Chen, Y., & Bate, B. (2021). Monitoring and Quantitative Human Risk Assessment of Municipal Solid Waste Landfill Using Integrated Satellite–UAV–Ground Survey Approach. Remote Sensing, 13(22), 4496. https://doi.org/10.3390/rs13224496