Abstract
The SHETLAND-NET research project aims to build an Internet of Things (IoT) telemetry service in Antarctica to automatize the data collection of permafrost research studies on interconnecting remote wireless sensor networks (WSNs) through near vertical incidence skywave (NVIS) long fat networks (LFN). The proposed architecture presents some properties from challenging networks that require the use of delay tolerant networking (DTN) opportunistic techniques that send the collected data during the night as a bulk data transfer whenever a link comes available. This process might result in network congestion and packet loss. This is a complex architecture that demands a thorough assessment of the solution’s viability and an analysis of the transport protocols in order to find the option which best suits the use case to achieve superior trustworthiness in network congestion situations. A heterogeneous layer-based model is used to measure and improve the trustworthiness of the service. The scenario and different transport protocols are modeled to be compared, and the system’s trustworthiness is assessed through simulations.
1. Introduction
Research studies from multiple disciplines are carried out every year in Antarctica [1]. Researchers are temporarily placed in Antarctic base stations, normally located in the peripheral areas of the continent. One of the main challenges in Antarctica is its lack of conventional telecommunication systems [1], which hinders the deployment of wireless sensor networks (WSNs). This fact reduces the possibilities of carrying out research studies (e.g., automation of data collection and remote bases interconnection).
To overcome these difficulties, our research project, the SHETLAND-NET, proposes the use of near vertical incidence skywave (NVIS) high-frequency (HF) radio links to provide low-consumption Antarctic communications, continuing previous research on ionospheric communications [2]. The ionosphere reflects this signal, providing a long backhaul link of a 250 km radius coverage area [3,4]. Networks using this type of links can be classified as long fat networks (LFNs), which are characterized by having long links with a bandwidth delay product (BDP) greater than 1 × 105 bits (12,500 bytes) [5], following Equation (1), where the link bandwidth (BW) is expressed in bits per second (bps) and the round-trip time (RTT) in seconds (s).
The NVIS technology can be used to interconnect remote base stations [6]. Our final goal is to deploy a telemetry service by interconnecting remote WSNs [7], which will help in the automatization of data gathering for Antarctic research studies. This deployment will be carried out during the next Antarctic campaign in the field. However, this communication technique can be error-prone due to the variant properties of the ionosphere. It may present typical challenging network issues [8], such as intermittent connectivity, end-to-end disconnection, and variable error rates, which could degrade the performance of the overall offered IoT service.
Therefore, before the deployment phase of our project, we had to study and try to anticipate the expected trustworthiness of the IoT telemetry service we want to deploy. For this reason, we defined a model to assess the trustworthiness of our proposed system [7]. This enabled us to foresee the possible trustworthiness issues that might arise during the campaign in the field and decide on the respective countermeasures.
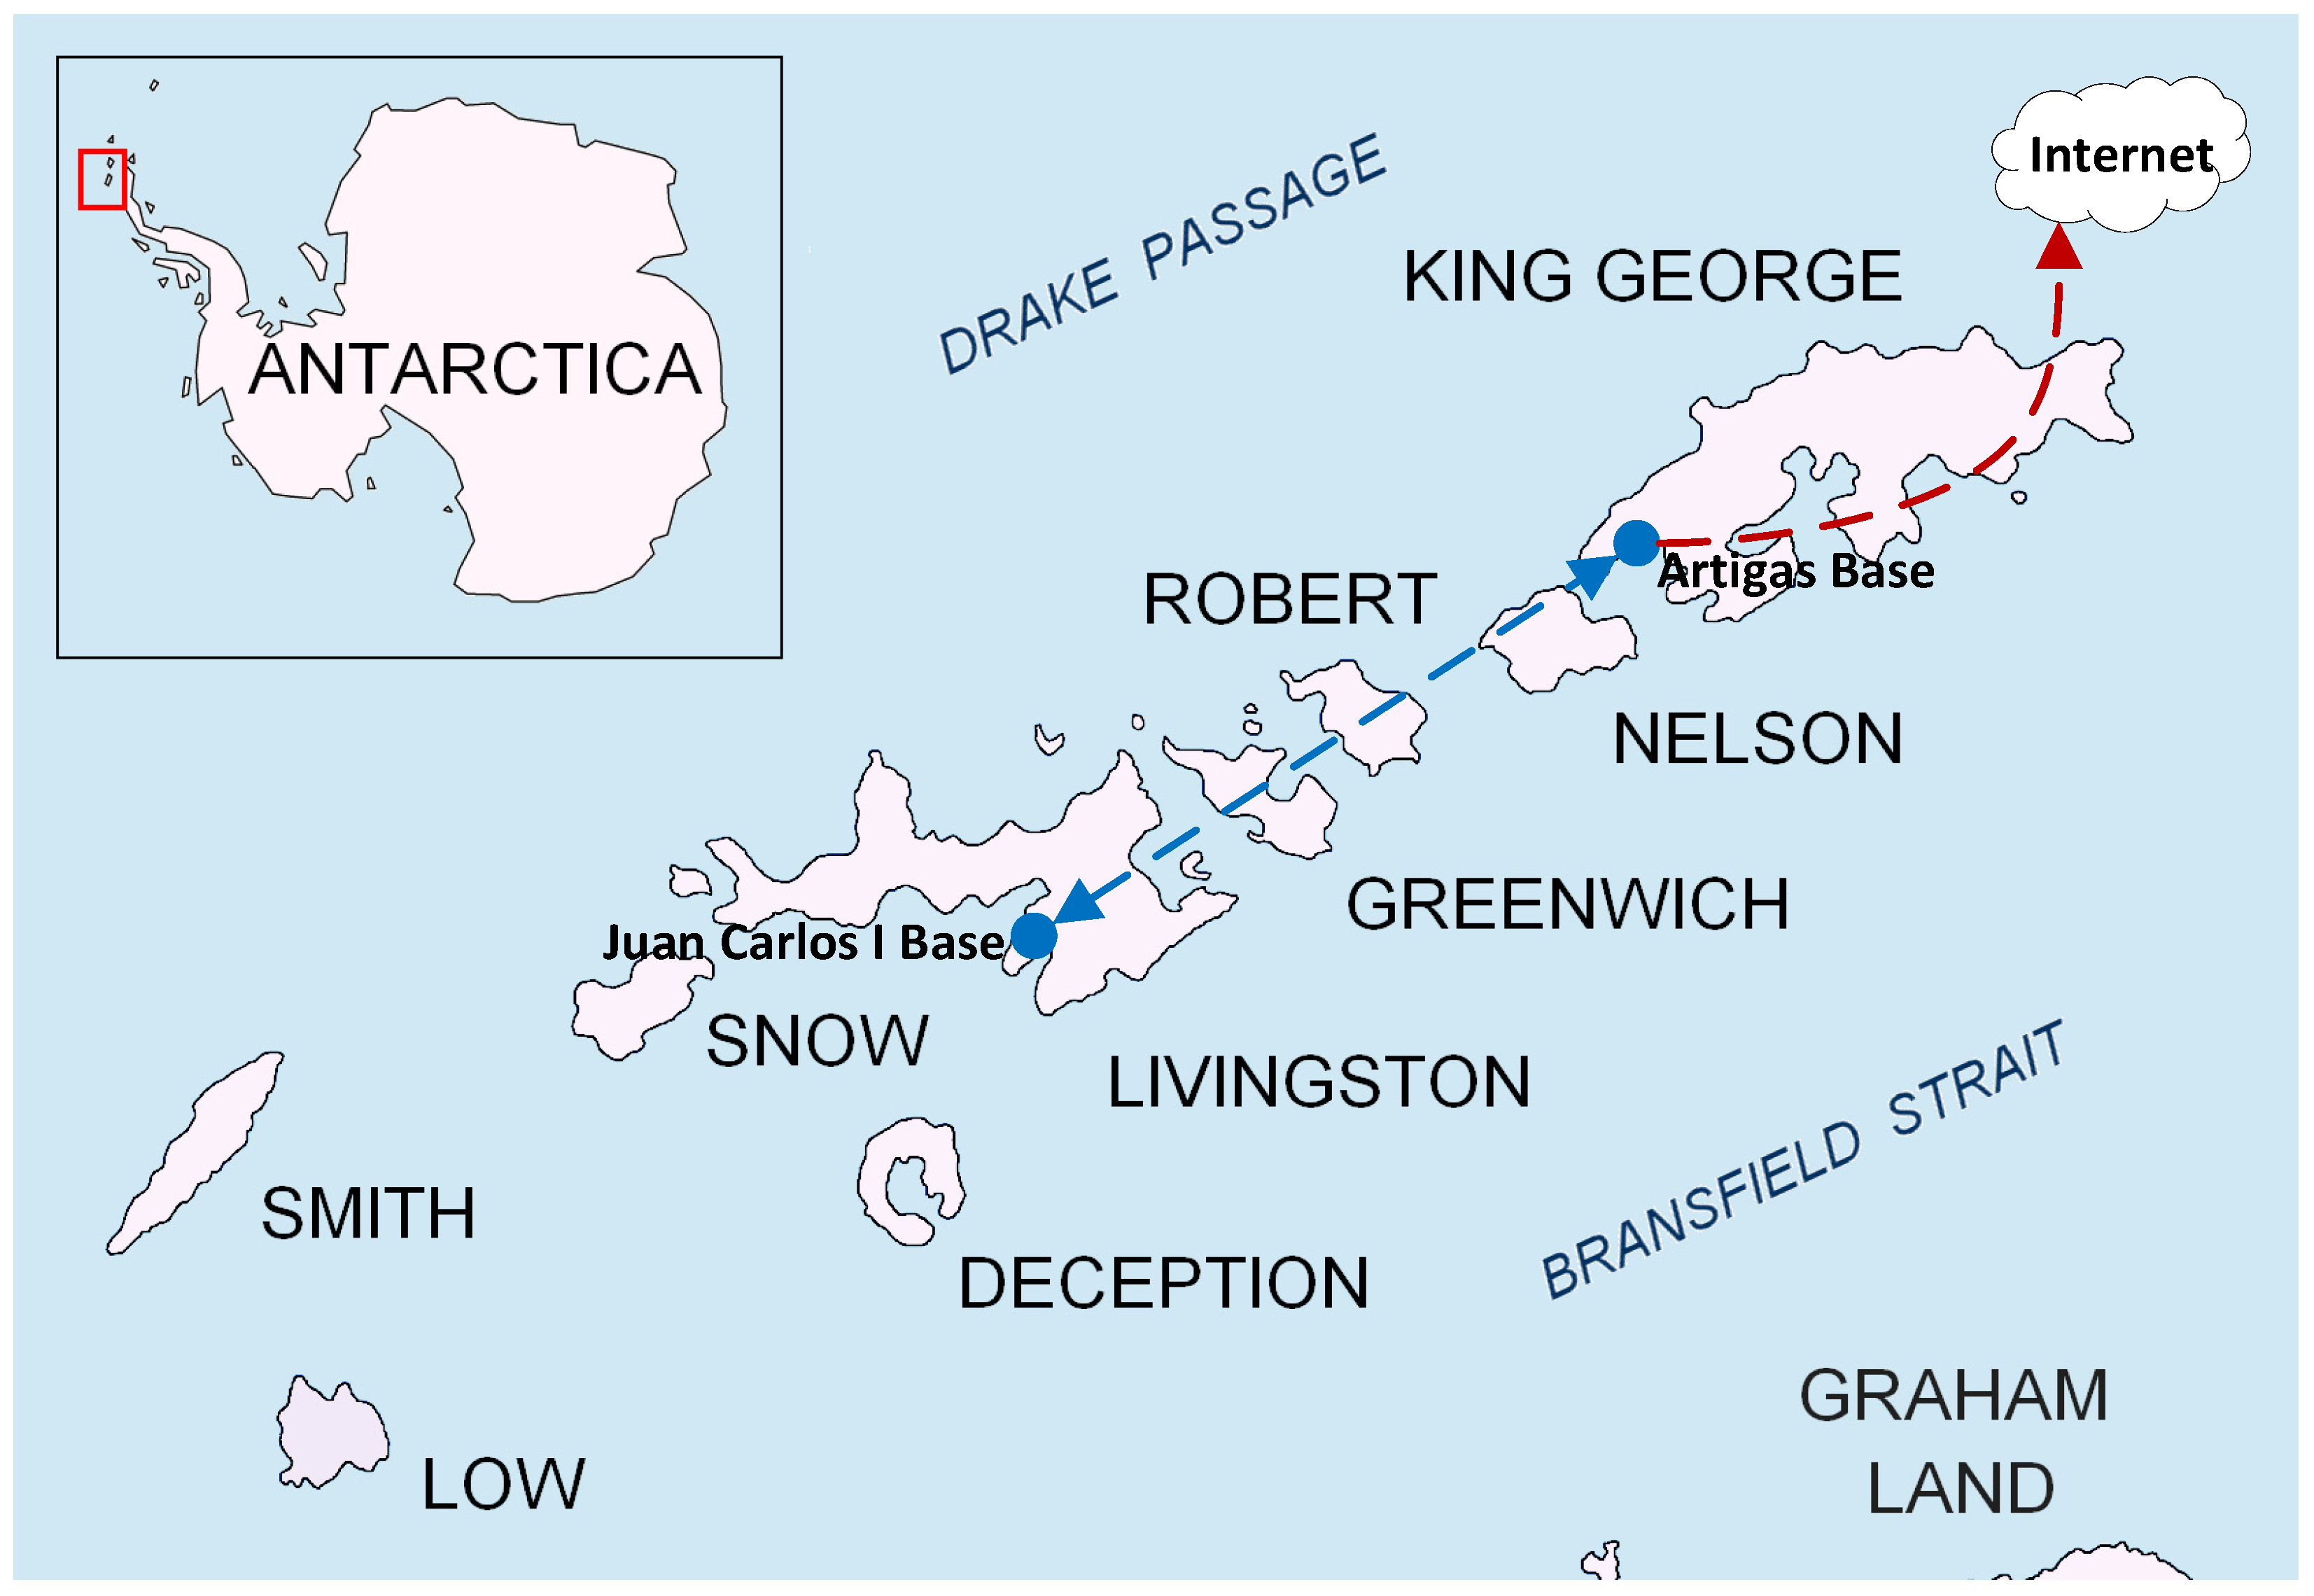
For our work, we focus on the use case of automating the monitoring of Ground Terrestrial Network-Permafrost (GTN-P) stations [9], which are used in permafrost research studies. Each of these GTN-P stations senses 32 different values hourly, which need to be remotely monitored from a control center. During the Antarctic campaign, we will deploy a test scenario. WSNs will be placed in two locations: the Spanish Juan Carlos I Base in Livingston Island, and the Uruguayan Artigas Base in King George Island, both part of the South Shetland Islands. The Artigas Base will provide Internet connectivity, so data gathered from the WSNs can be reached remotely. However, sensors in the Juan Carlos I Base will not have direct Internet connectivity, and the data from these sensors will need to be sent through an NVIS link to the Artigas base in order to reach the Internet. Figure 1 shows the test scenario in Antarctica.
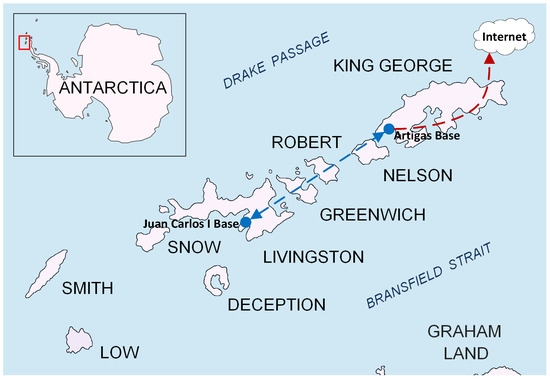
Figure 1.
Map of the South Shetland Islands in Antarctica [10], showing the position of the WSNs (blue circles) during the test scenario of the campaign. The NVIS link is represented with the discontinuous blue line, and the Internet connectivity is represented with the discontinuous red line. The reproduction of the image was slightly modified under a Creative Commons License (CC BY-SA 3.0).
As seen in previous research [4], the main drawback of the NVIS link is its unavailability during the night, given that the ionosphere’s characteristics vary drastically due to solar activity. For this reason, we decided to adopt a delay tolerant network (DTN) technique to opportunistically send all the data collected during the night as a bulk data transfer when the NVIS link becomes available in the morning. This complex scenario required a trustworthiness assessment to analyze its feasibility to be deployed in Antarctica before the campaign [7]. As shown in our first round of simulations, performing this opportunistic bulk data transfer in an LFN that presents network challenges could degrade the system’s performance (packet losses) due to network congestion caused by the large quantity of data sent. On the other hand, in prior work, we also analyzed the suitability of different transport protocols for LFNs and designed a new one, the Enhanced Adaptive and Aggressive Transport Protocol [5,11]. Given that the NVIS links can also be considered as LFNs and given the strong performance that some modern transport protocols showed in our tests, we believed that it was crucial to assess how the use of modern transport protocols could improve or affect the performance and trustworthiness of the service, especially in this congestion situation provoked by the DTN technique. Having collected the initial results and analyzed the system’s trustworthiness in previous work with the standard transport protocols of the devices’ operative systems, this paper studies the trustworthiness and compares the usage of different transport protocols by modeling the scenario in the Riverbed Modeler. The paper contributions are as follows:
- The definition and concretion of the remote sensor network architecture that will be deployed in Antarctica, detailing the type of nodes, protocol stack, and communication techniques that will be used.
- The modeling of the Antarctic scenario in the simulator. To perform the simulation tests, we modeled the communication media (LoRa and NVIS), the telemetry application, the faulty behavior of Byzantine nodes, the social trust management and the consensus algorithms, the DTN technique, and the tested transport protocols.
- The assessment and analysis of the results using our proposed trustworthiness model. From this analysis, we conclude which transport protocol best suits our use case and propose a modification of the scenario to be deployed in Antarctica.
The rest of this paper is structured as follows. Section 2 describes the related work in DTNs, transport protocols, and a system’s trustworthiness. Section 3 defines our use case’s network architecture. Section 4 reminds our proposed model to measure and evaluate a system’s trustworthiness. Section 5 describes the simulation tests. Section 6 and Section 7 present and discuss the obtained results, respectively. Finally, Section 8 concludes the paper.
2. Related Work
2.1. Delay Tolerant Networks
The DTN was first presented as an alternative network architecture designed for challenging networks [8] which suffer from high bit error rates, lack of end-to-end connectivity, and long delays [12]. It was initially designed for interplanetary communications in space [13], given the number of disconnections that this network suffers. However, over the years, many other types of terrestrial networks have emerged in response to similar problems (e.g., underwater networks [14], wildlife tracking networks [15], sparse wireless sensor networks [16], and vehicular networks [17]).
Conventional TCP/IP protocols are not suitable for these kinds of environments. In contrast, the RFC 5050 presented a DTN protocol, the Bundle Protocol (BP) [18], which enabled message delivery to cope with all the issues of challenging networks, even if the source and the destination were never connected to the network simultaneously. The BP is based on a store–carry–forward overlay network, where “bundles” are transported through endpoints on top of the transport layer of the OSI model when a connection opportunity is present between two endpoints. The BP version 7 draft was recently released [19], which introduces new features, such as optional CRCs for nonprimary blocks, and proposes other changes to make it simpler, more capable, and easier to use. Many implementations of the Bundle Protocol adapted to the constraints of IoT and WSNs exist nowadays, such as IBR-DTN [20], µDTN [21], and DTN7 [19], among others.
However, other DTN approaches are not based on the BP but use their own routing protocol designed to be disruption- and delay-tolerant [8]. DISRN [22], PASR [23], RMDTN [24], and PROPHET [25] are some examples of this kind of approach. Moreover, we can find other schemes that mix DTN with other kinds of technologies, such as opportunistic networking [26,27], machine to machine (M2M) communications [28], information-centric networking (ICN) [29], and fog computing [30].
As stated before, in our use case, we will use an opportunistic networking technique to send all the data collected during the night in the morning, when the NVIS link comes available, as a bulk data transfer. This kind of approach is possible because our research group has studied the behavior of the ionosphere and NVIS links in prior research [4], and were aware that the link is down at nighttime and becomes available at sunrise. However, we also know this bulk data transfer provokes network congestion, degrading the system’s performance with packet losses. For this reason, it is crucial to study how modern transport protocols can help improve this performance, especially in LFNs such as the NVIS links.
2.2. Transport Protocols
The performance of transport protocols for network communications has been a topic under discussion and development since the Internet was conceived [5]. The first extensions of the original Transmission Control Protocol (TCP) were [31] TCP Tahoe, TCP Reno, TCP New-Reno, TCP SACK, and TCP-Vegas, which included new mechanisms such as the fast retransmit, the fast recovery, the packet pair link estimation, the duplicated acknowledgment (DUACK), and the selective acknowledgment (SACK).
However, these legacy transport protocols suffered performance degradation over some types of networks, including LFNs. The LFN concept and its effects on TCP performance were firstly defined and detailed in the Request For Comments (RFC) 1072, which was obsoleted by the RFC 1323 to finally become the standard RFC 7323. Some TCP variants and other transport protocols developed during the last decade have improved their performance over LFNs [5]. Some of these are Scalable TCP (S-TCP) [32], FAST TCP [33], High-Speed TCP (H-TCP) [34], Binary Increase Control TCP (BIC-TCP) [35], and its evolution: TCP CUBIC [36]. TCP CUBIC (RFC 8312) is the most commonly used transport protocol nowadays, given that it is the TCP variant used by default on most operating systems. However, most of these protocols consider that packet loss always occurs due to network congestion, reducing the congestion window. This assumption is false for wireless links, where packets can also be dropped for other reasons (e.g., fading, channel interference) [11]. Under these circumstances, reducing the congestion windows might also degrade the transmission performance, achieving lower throughput [11].
For this reason, other transport protocols, such as Performance-oriented Congestion Control (PCC) [37], TCP Veno [38], TCP Westwood+ [39], Dynamic TCP [40], Jitter TCP [41], and Jitter Stream Control Transmission Protocol (JSCTP) [42] are focused on implementing mechanisms to detect if lost packets occur due to network congestion or random channel loss. They only reduce the congestion window in the first case, achieving better performance [11].
In addition, other modern transport protocols, such as TCP BBR [43], Copa [44], Indigo [45], and Verus [46], can achieve high performance, as proven in several physical tests carried out by Stanford University’s platform Pantheon [45]. TCP BBR is one of the top-performance protocols, managing the maximum bandwidth with the minimum RTT. Copa is a practical delay-based protocol that fixes an RTT target and adjusts its congestion windows based on the minimum RTT and the standing RTT measured during data transfers. Indigo is a data-driven protocol that uses a machine-learning congestion control scheme that learns from previous performance data. Verus is a transport protocol oriented to cellular networks that relates the congestion windows with delay variations through short-term RTT measurement.
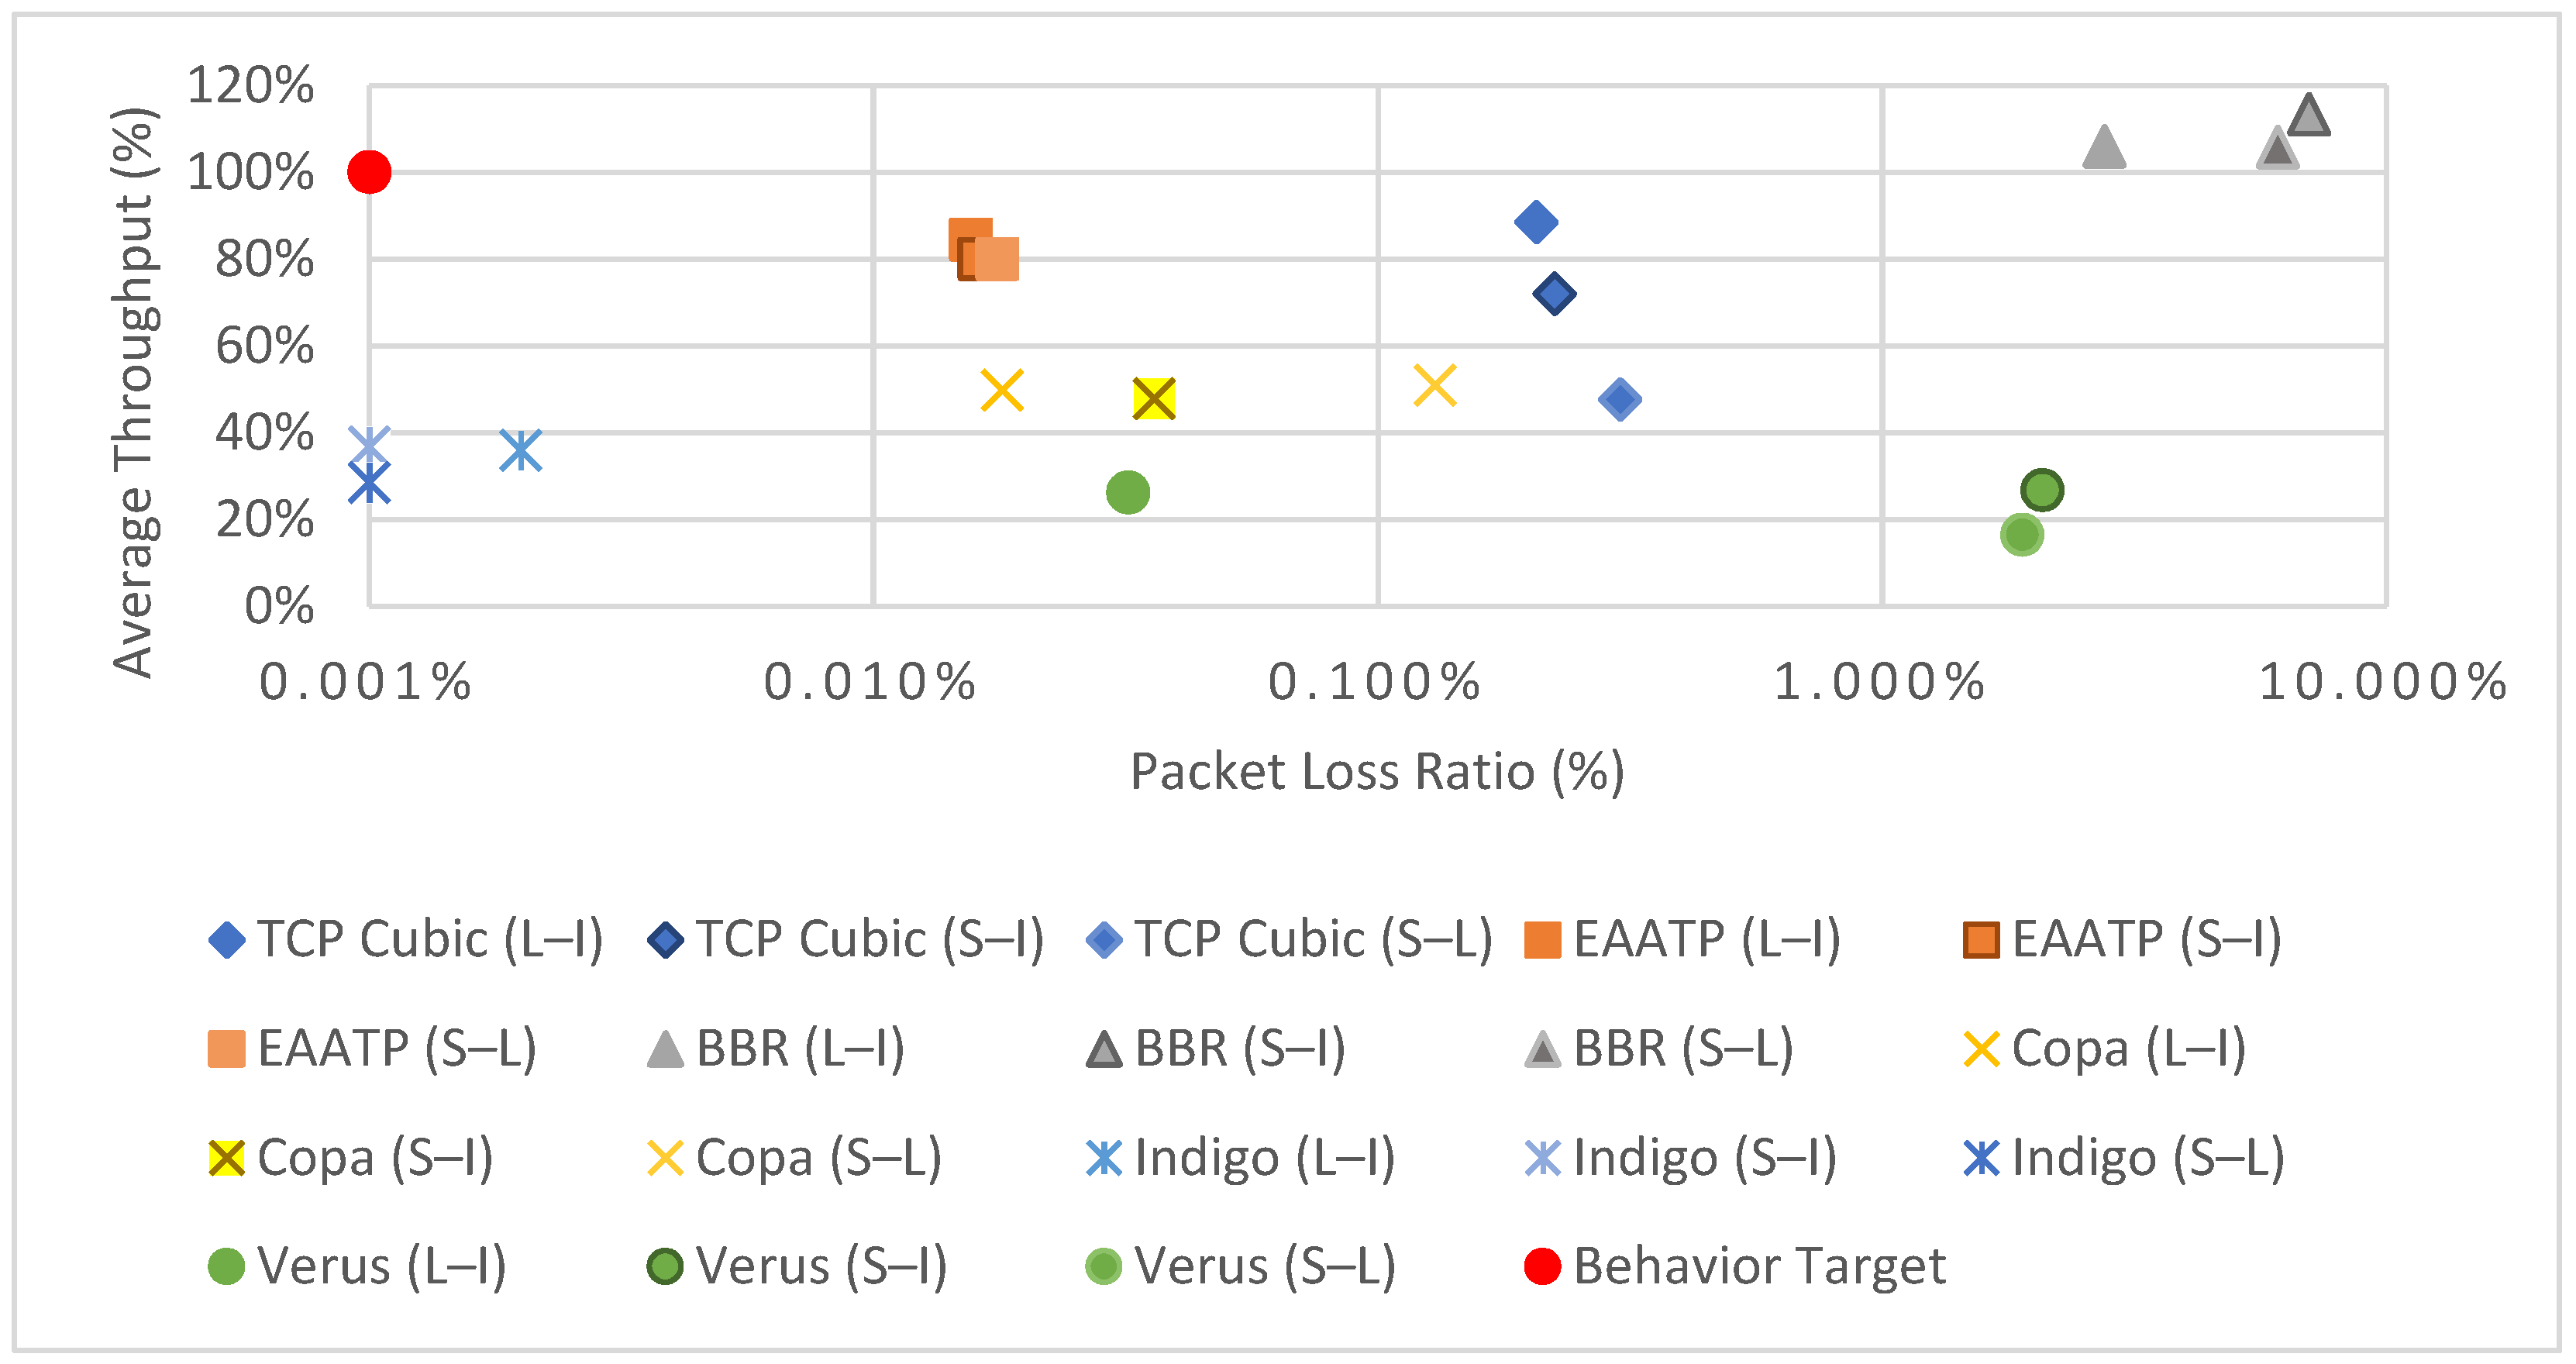
Moreover, given that the aforementioned protocols did not meet the performance requirements of our cloud data-sharing use case from previous work [11], we presented the Adaptive and Aggressive Transport Protocol (AATP) [5] and its evolution, the Enhanced AATP (EAATP) [11], which incorporates mechanisms to differentiate the packet losses’ cause, fairly adapting its sending rate accordingly to the network circumstances. The performance in these tests was solid, both in simulations and in a physical testbed with an LFN emulator, showing better results than other protocols, maximizing throughput and minimizing packet losses [5,11]. Figure 2 shows a summary of the tests’ results. However, we did not know how these protocols (including ours) could affect the trustworthiness of a system, especially in the use case of this paper. For this reason, we thought that we needed to assess whether using the EAATP in the remote Antarctic WSN use case could improve the system’s performance and trustworthiness, especially in congestion situations.
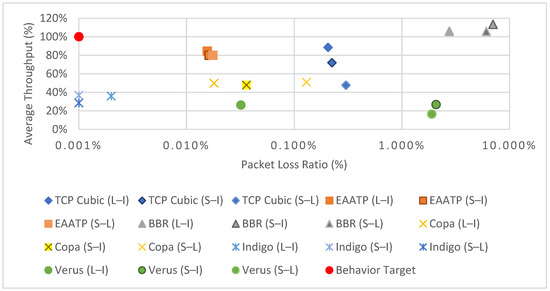
Figure 2.
Results of average throughput (%) vs. packet loss ratio (%) of the transport protocols tested in previous work [11]. To represent the graph in semilogarithmic scale, the packet loss ratio values of 0% are represented as 0.001% in the graph. Each transport protocol was tested in three LFN scenarios: London to Iowa (L–I), Sidney to Iowa (S–I), and Sidney to London (S–L).
2.3. Trustworthiness in Cyber Physical Systems
A cyber physical system (CPS) is defined as a system with integrated computational and physical capabilities. Wireless sensor networks, smart grids, and some IoT devices are examples of CPSs [47]. Even though there is no consensus in the literature to define the trustworthiness property and its scope [48], we can define a CPS’s trustworthiness, in general terms, as the property of behaving as expected under adversarial conditions [47]. Network malfunction, Byzantine errors, and faulty nodes are examples of adverse conditions that can affect a system’s trustworthiness. Some authors limit this definition to system security issues only [49], while others propose a broader scope and relate trustworthiness with other terms such as resilience, availability, reliability, scalability, maintainability, heterogeneity, data quality, hardware resources, and fault management policies [48]. We can find many approaches to measuring or providing trustworthiness in literature, referring to different elements. We classify them into four main categories [7]:
- Data trustworthiness: It is defined as the possibility to ascertain the correctness of the data provided by the source [50]. Many methods use different approaches that try to detect faulty nodes, false alarms, and sensor misreading using. For instance, authors in [51] use a fog computing architecture to detect, filter, and correct abnormal sensed data. In addition, authors in [52] present a data intrusion detection system to trigger false data from malicious attacks.
- Network trustworthiness: Defined as the likelihood of a packet to reach its destination unaltered despite the adversities (e.g., link failure, link saturation, or malicious attacks, among others), it is a relevant aspect to consider in challenging networks [53], such as the use case we propose. The network’s performance and trustworthiness have been addressed from several perspectives, such as channel coding [54], transport protocols [11], dynamic routing and topology control protocols [55,56], and DTN architectures and protocols [8].
- Social trustworthiness: This field has become more popular since the appearance of the Social Internet of Things (SIoT) [57,58]. In SIoT trustworthiness, objects or network nodes interact and establish social relationships, which are used to define trust and reputation models that take into account several input parameters. Authors in [59] present a model that considers factors as the computational capabilities of the nodes, the type of relationship between them, the total number of transactions, the credibility of a node, and the feedback provided by other nodes, among others. Authors in [60] present an evolution of the aforementioned trust management model, which applies a machine learning algorithm to calculate novel parameters such as the goodness, usefulness, and perseverance of a node. Thanks to these parameters, this upgraded trust model is resilient to more types of malicious node attacks. Authors in [61] propose another model that defines the input parameters as the expected gain on success, the expected damage on a failure, the expected cost, the expected result, and the goal. Authors in [62] define a decentralized self-enforcing trust management system which is based on a feedback system and reputational secure multiparty calculations to ensure the privacy of each party’s provided data.
- Consensus: It represents a state where all the participants of the same distributed system agree on the same data values [63]. Consensus protocols can be classified into two major groups: proof-based consensus and Byzantine consensus. The first group is related to blockchain technology, where all participants compete against each other to mine a block, and the most commonly used protocols are proof-of-work, proof-of-stake, and their variants [63]. The main drawback of these protocols for the IoT is that devices usually have lesser hardware resources and low processing power, which make the mining tasks of blockchain extremely difficult [63]. On the other hand, Byzantine-based protocols implement voting-based mechanisms to reach an agreement rather than competing among them, generating less resource consumption in general. Their main drawback is the number of messages that need to be delivered through the network to reach an agreement. Some well-known protocols from this category are Practical Byzantine Fault Tolerance (PBFT), RAFT, PaXoS, and Ripple, among others [63].
3. Remote Sensor Network Architecture
As stated before, the use case of this article is an IoT telemetry service to monitor remote WSNs in Antarctica interconnected through NVIS LFNs. The monitored data are used for permafrost studies and are gathered by GTN-P stations [9], which are the sensors of our network. Each of these GTN-P stations senses 32 different values hourly, and these values must reach the remote control center in Europe.
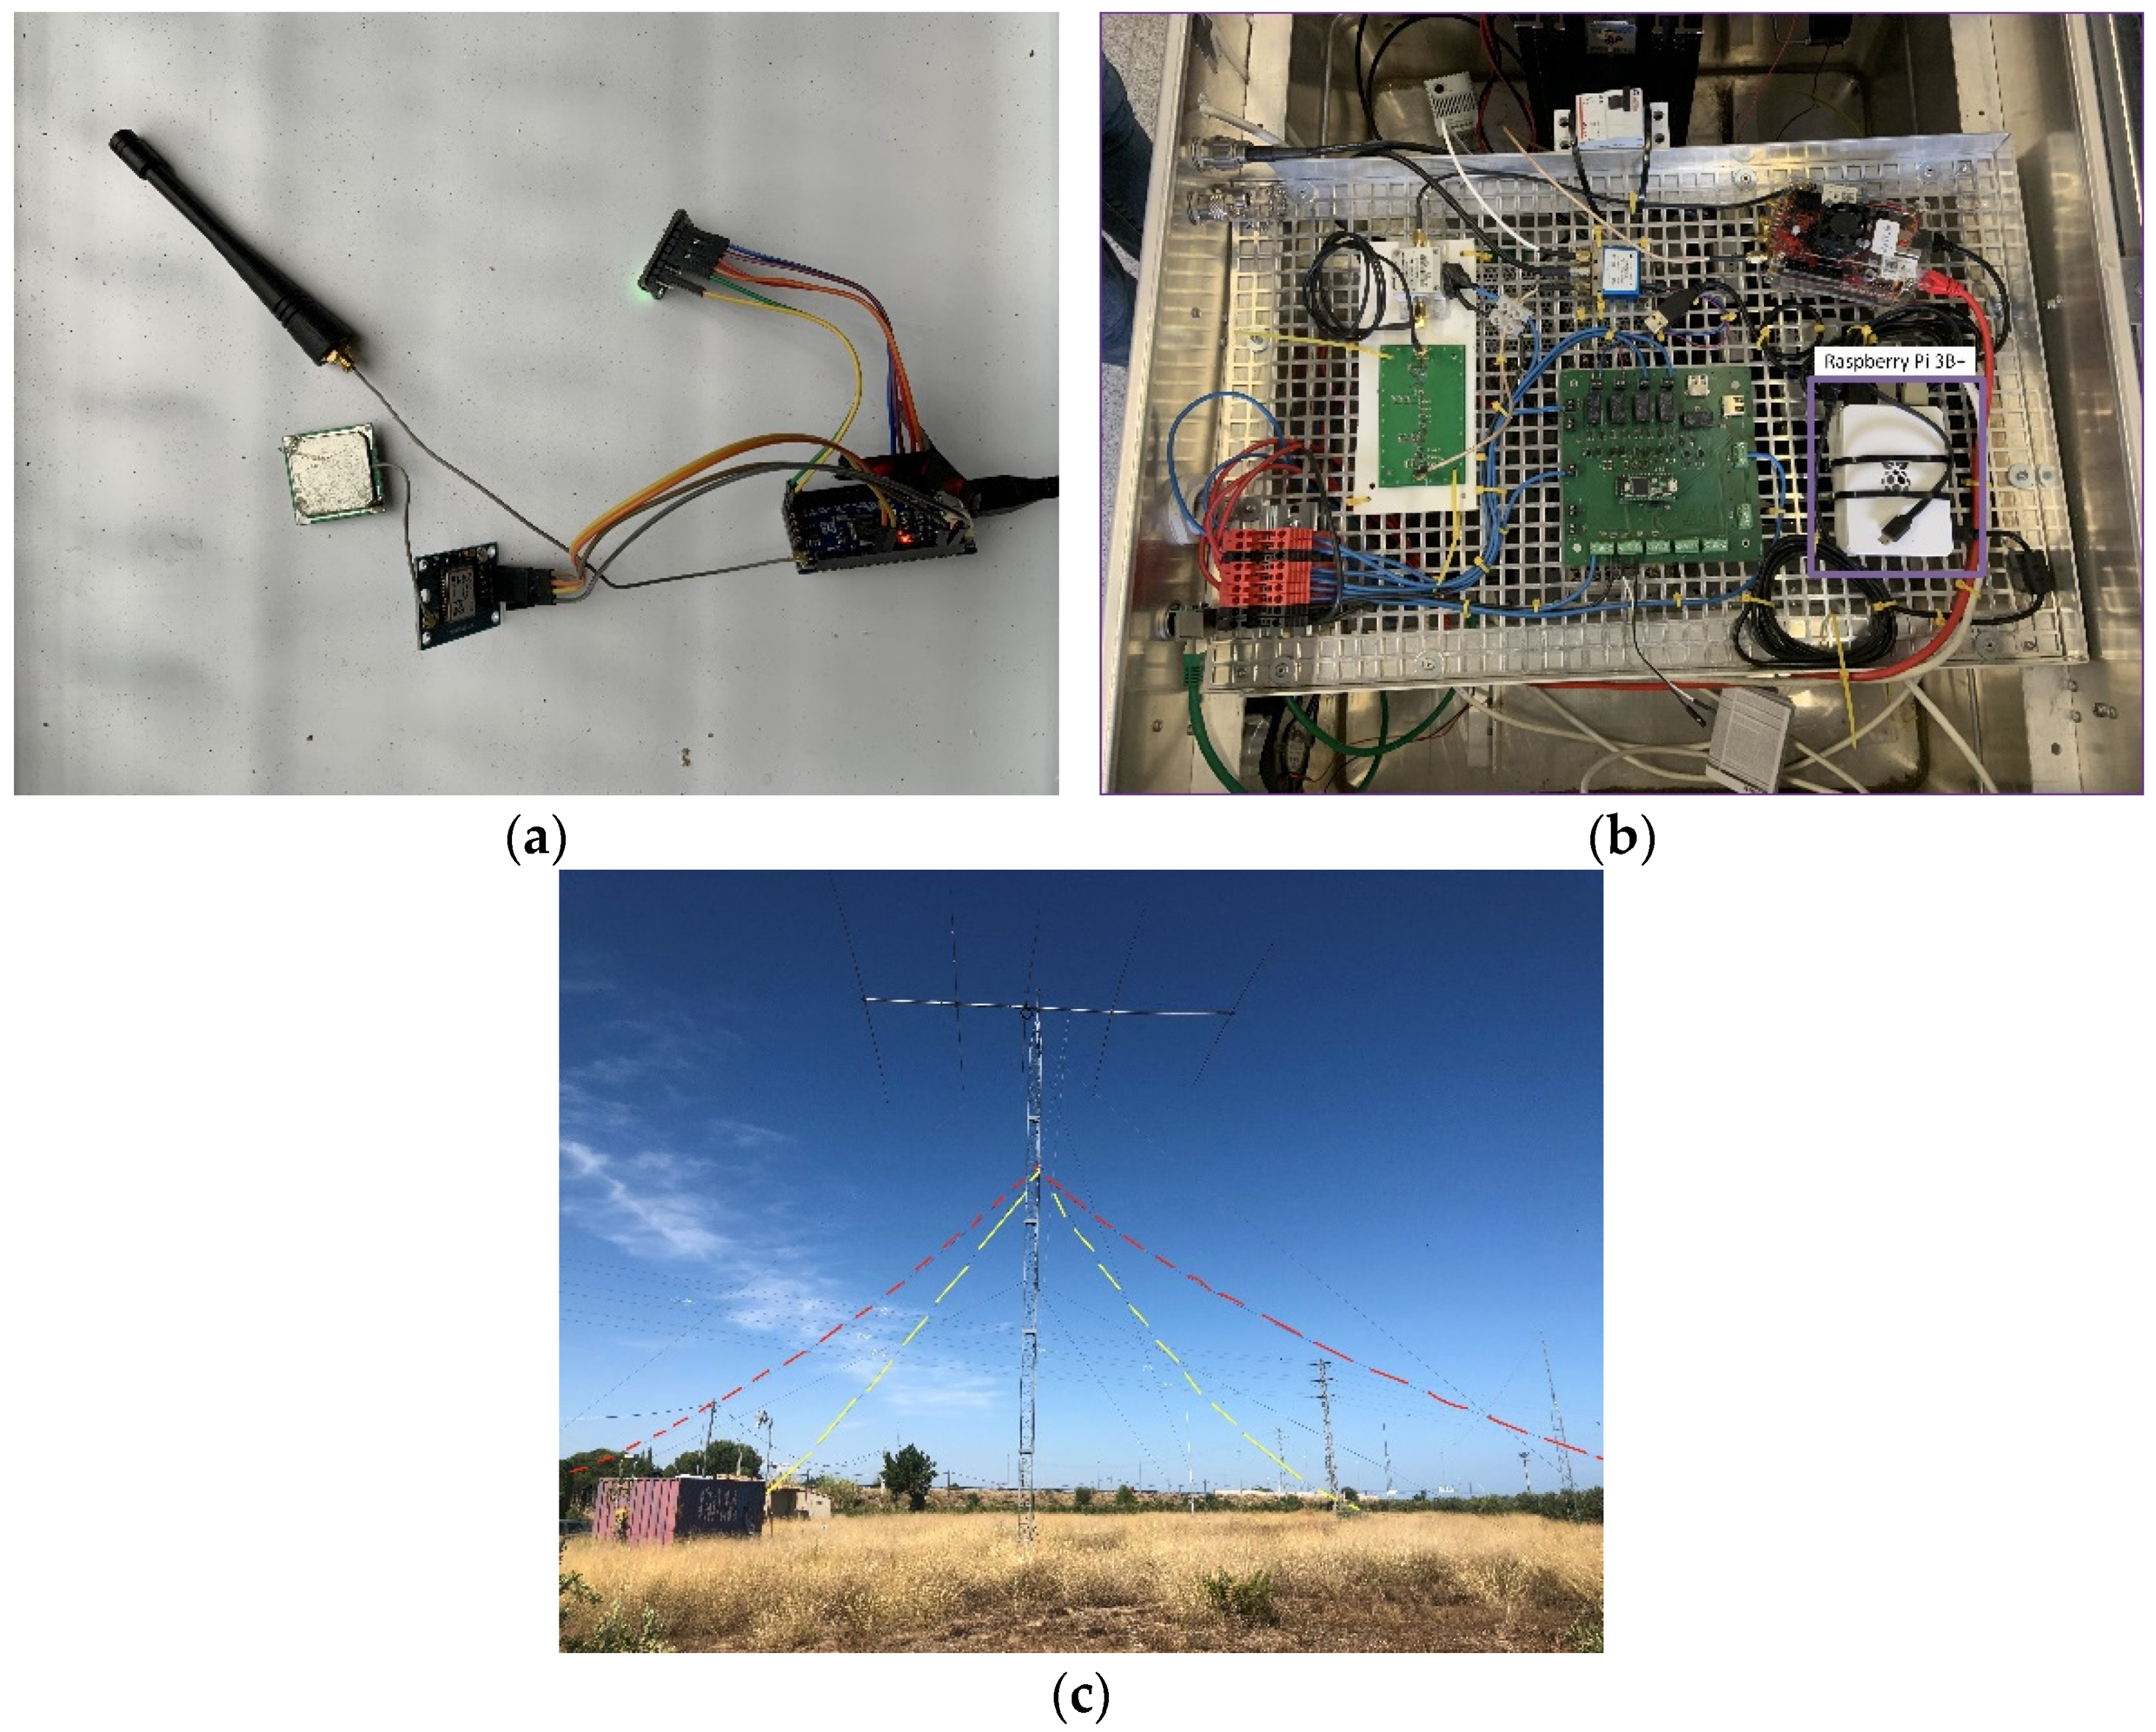
The GTN-P stations are equipped with a Moteino [64], an Arduino-based board designed for low-power consumption applications. The Moteino will send, through LoRa, its sensed values to a Raspberry Pi 3B+ gateway acting as a concentrator (access network). LoRa was preferred over other alternatives (e.g., Sigfox, NB-IoT) as the access network protocol because of its teleoperator independence. The LoRa network will be configured with a transmission frequency of 868 MHz, a code rate CR3 (4/7), and a spreading factor SF7, obtaining a 125 kHz channel bandwidth with a bit rate of 5.47 kbps. As proved in [65], this configuration can offer a coverage range of up to 30 km in Antarctica. Figure 3a shows the Moteino board with the LoRa transceiver that will be used during the campaign to collect and forward the data from the GTN-P stations.
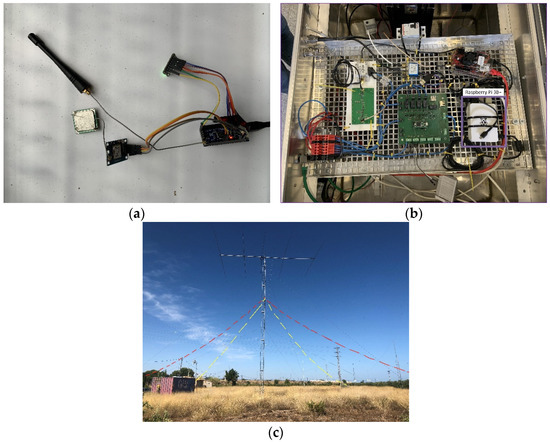
Figure 3.
Antarctic WSN Hardware. (a) Moteino node with LoRa transceiver. (b) NVIS node with Raspberry Pi 3B+ gateway. (c) NVIS inverted vee antenna.
The Raspberry Pi 3B+ gateway will forward these data through NVIS links (backbone network) to the Internet edge router in the Uruguayan Artigas Base in Antarctica. NVIS was preferred over satellite communication because the latter presents coverage issues in polar zones and has a higher economic cost [3]. The NVIS nodes will be configured to transmit at the 4.3 MHz transmission band, with a channel bandwidth of 2.3 kHz and a bit rate of 4.6 kbps. As in [3], we will increase the NVIS transmission reliability with an FEC convolutional code (1/2 rate code) and interleaving. With this configuration, an NVIS link range is up to 250 km. Figure 3b shows the NVIS node with the Raspberry Pi 3B+ gateway, and Figure 3c shows the NVIS antenna (inverted vee antenna).
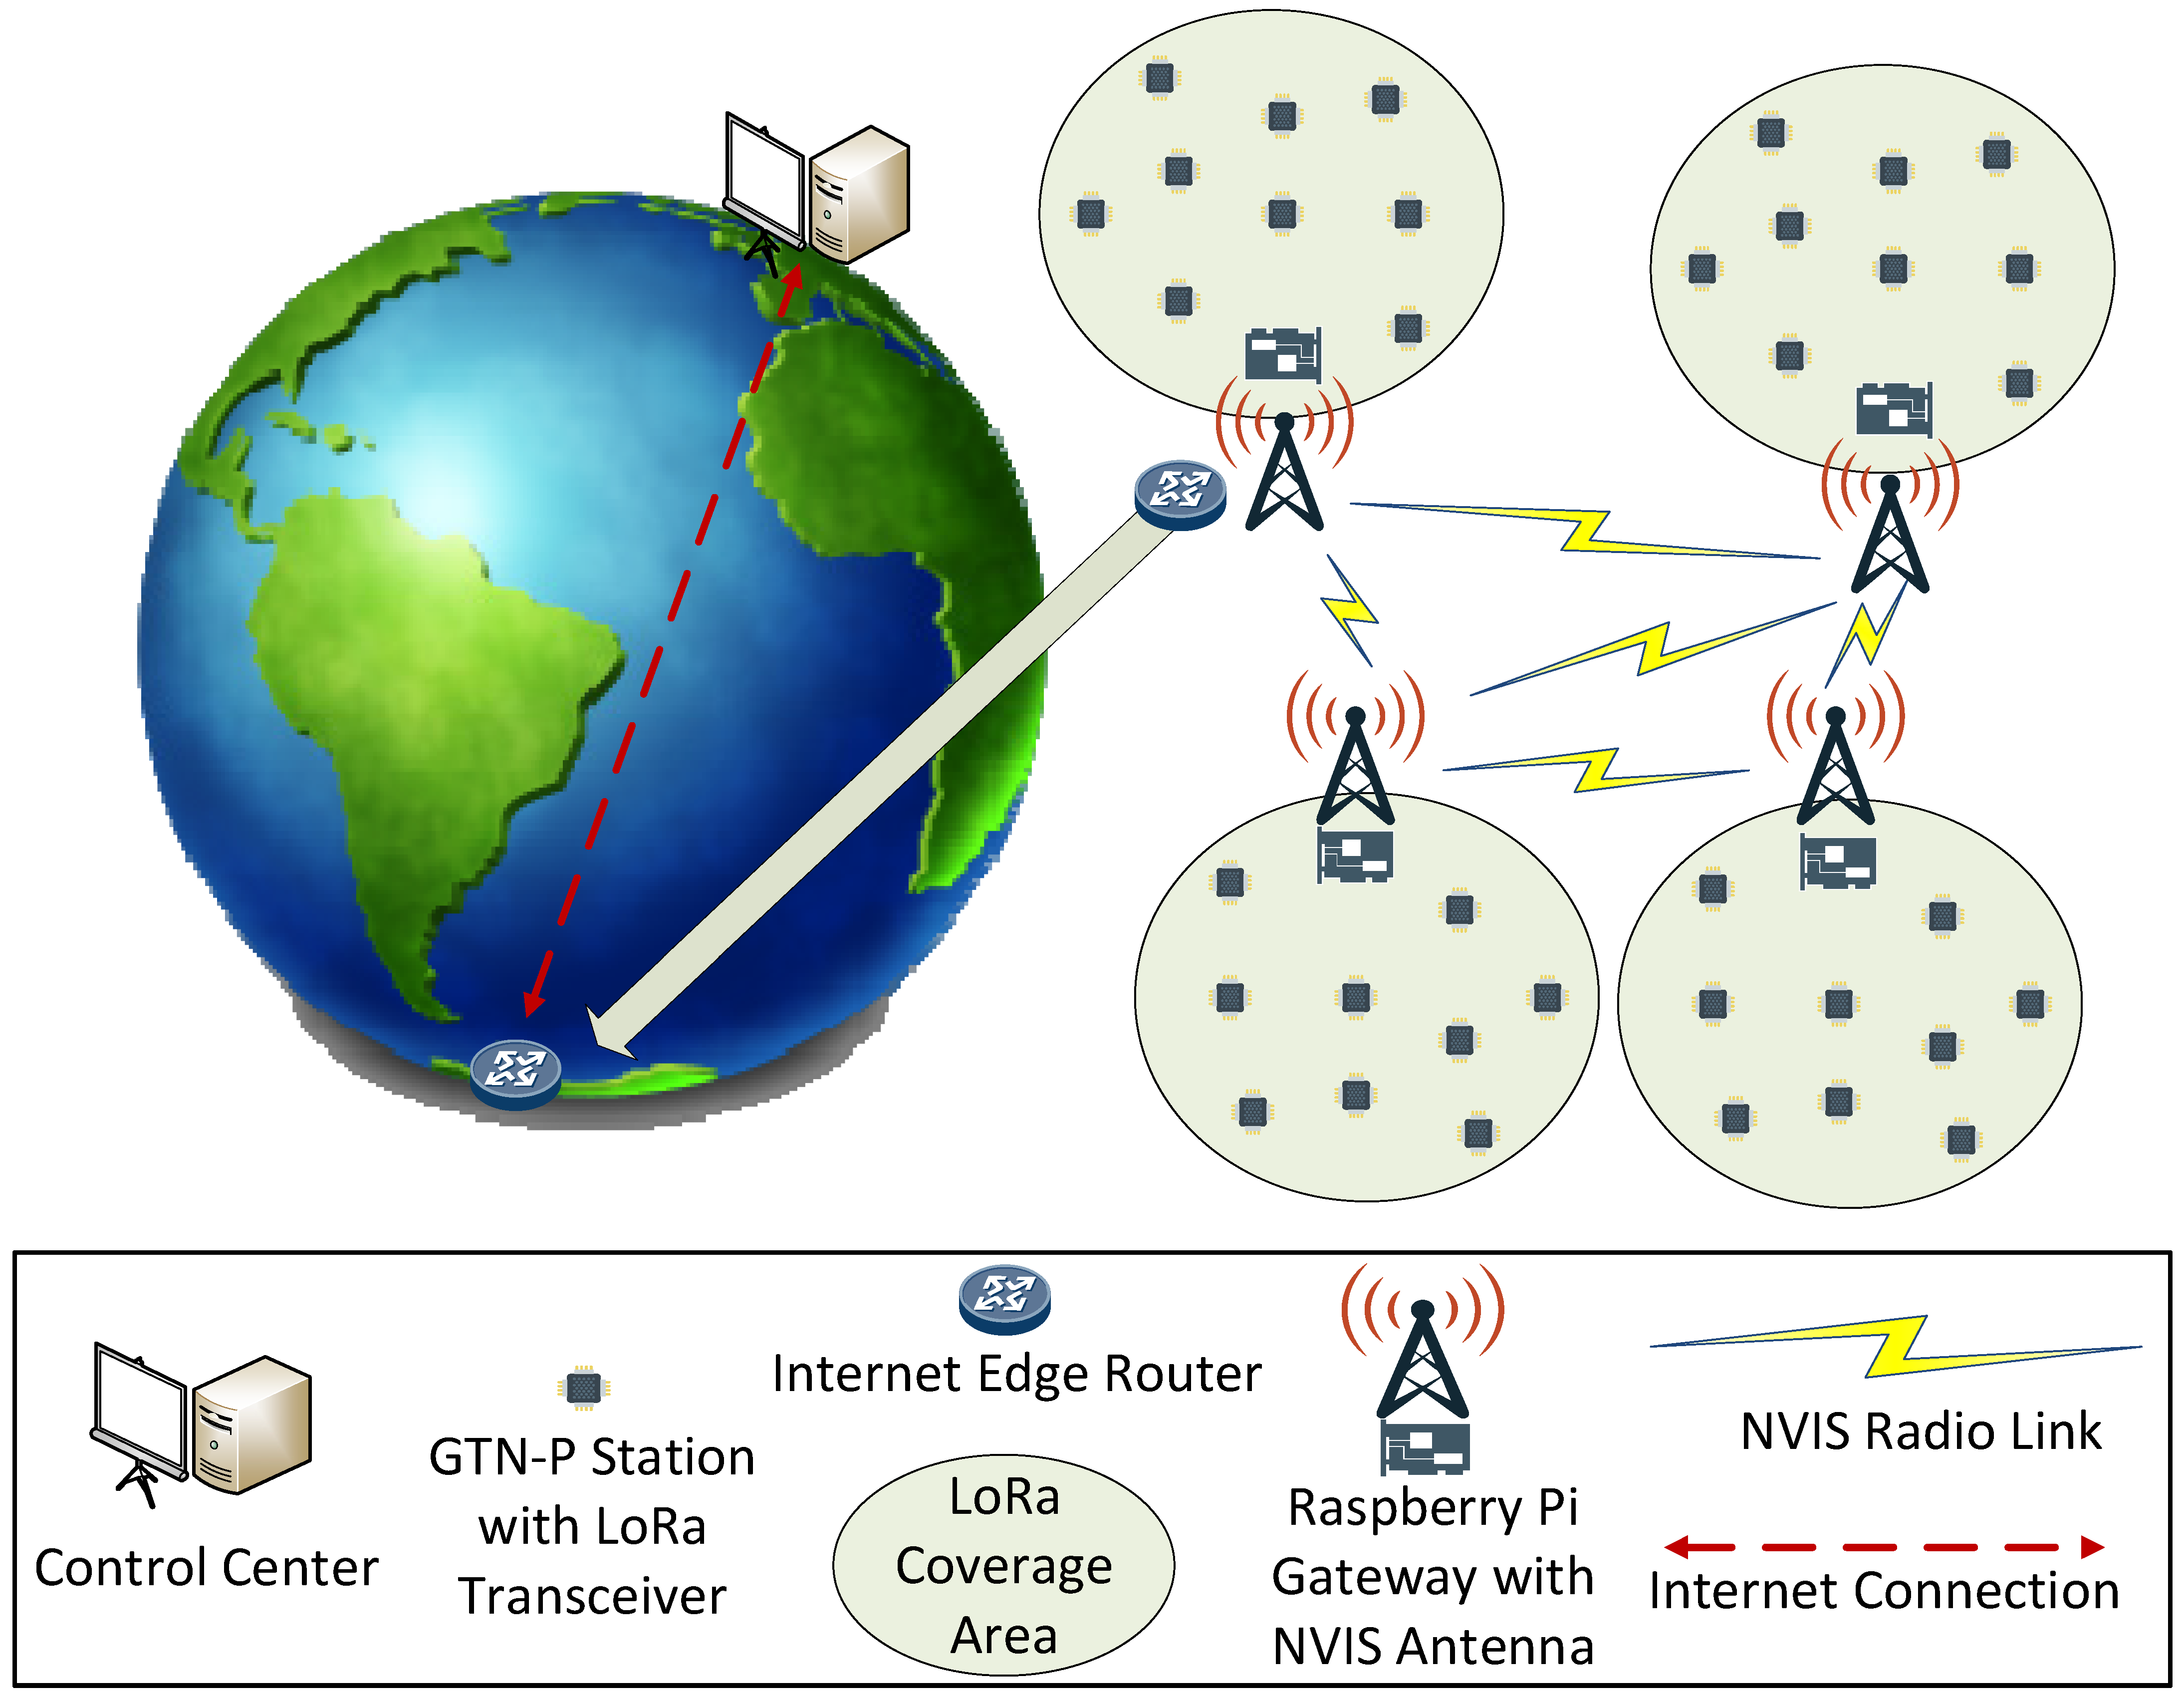
From the closest NVIS node to the Internet edge router (the one with Internet connectivity), data will be pushed to the Internet. From this moment, data monitoring and gathering will be available remotely from the control center. Figure 4 shows the network architecture diagram of the remote WSN.
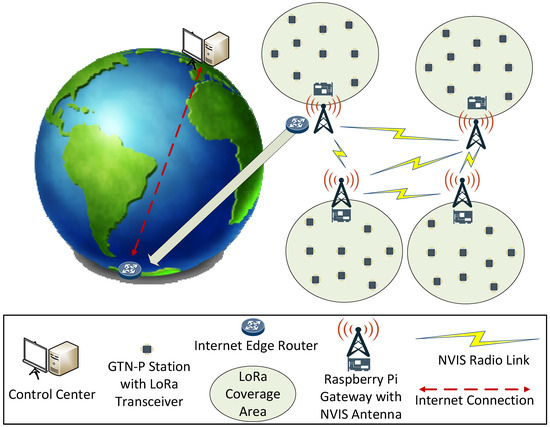
Figure 4.
Network architecture of the remote WSN providing the IoT telemetry service.
The Artigas Base’s Internet connectivity is supposed to have high reliability, so our trustworthiness assessment is focused on the access network (LoRa) and the backbone network (NVIS). As mentioned before, the reliability of NVIS links is very dependent on the ionosphere state, so it is not possible to send data during the night as all of it would be lost. For this reason, we believed it was necessary to apply a DTN technique to prevent the loss of data gathered during the night. In our case, we apply the DTN in the backbone network, as it is more likely to suffer from a lack of end-to-end connectivity, long delays, and network disruption.
Given that, in our case, we can predict a specific time slot when the NVIS links do not work (nighttime), we opted to implement a lightweight DTN approach, opportunistically sending the data collected during the whole night as a bulk transfer when the NVIS channel becomes available in the morning. Each concentrator should have collected 13 different sets of sensed values from each GTN-P station during the night. Our project requires that, on average, at least 9 out of the 13 datasets gathered from each station (around 70%) reach the control center correctly [7].
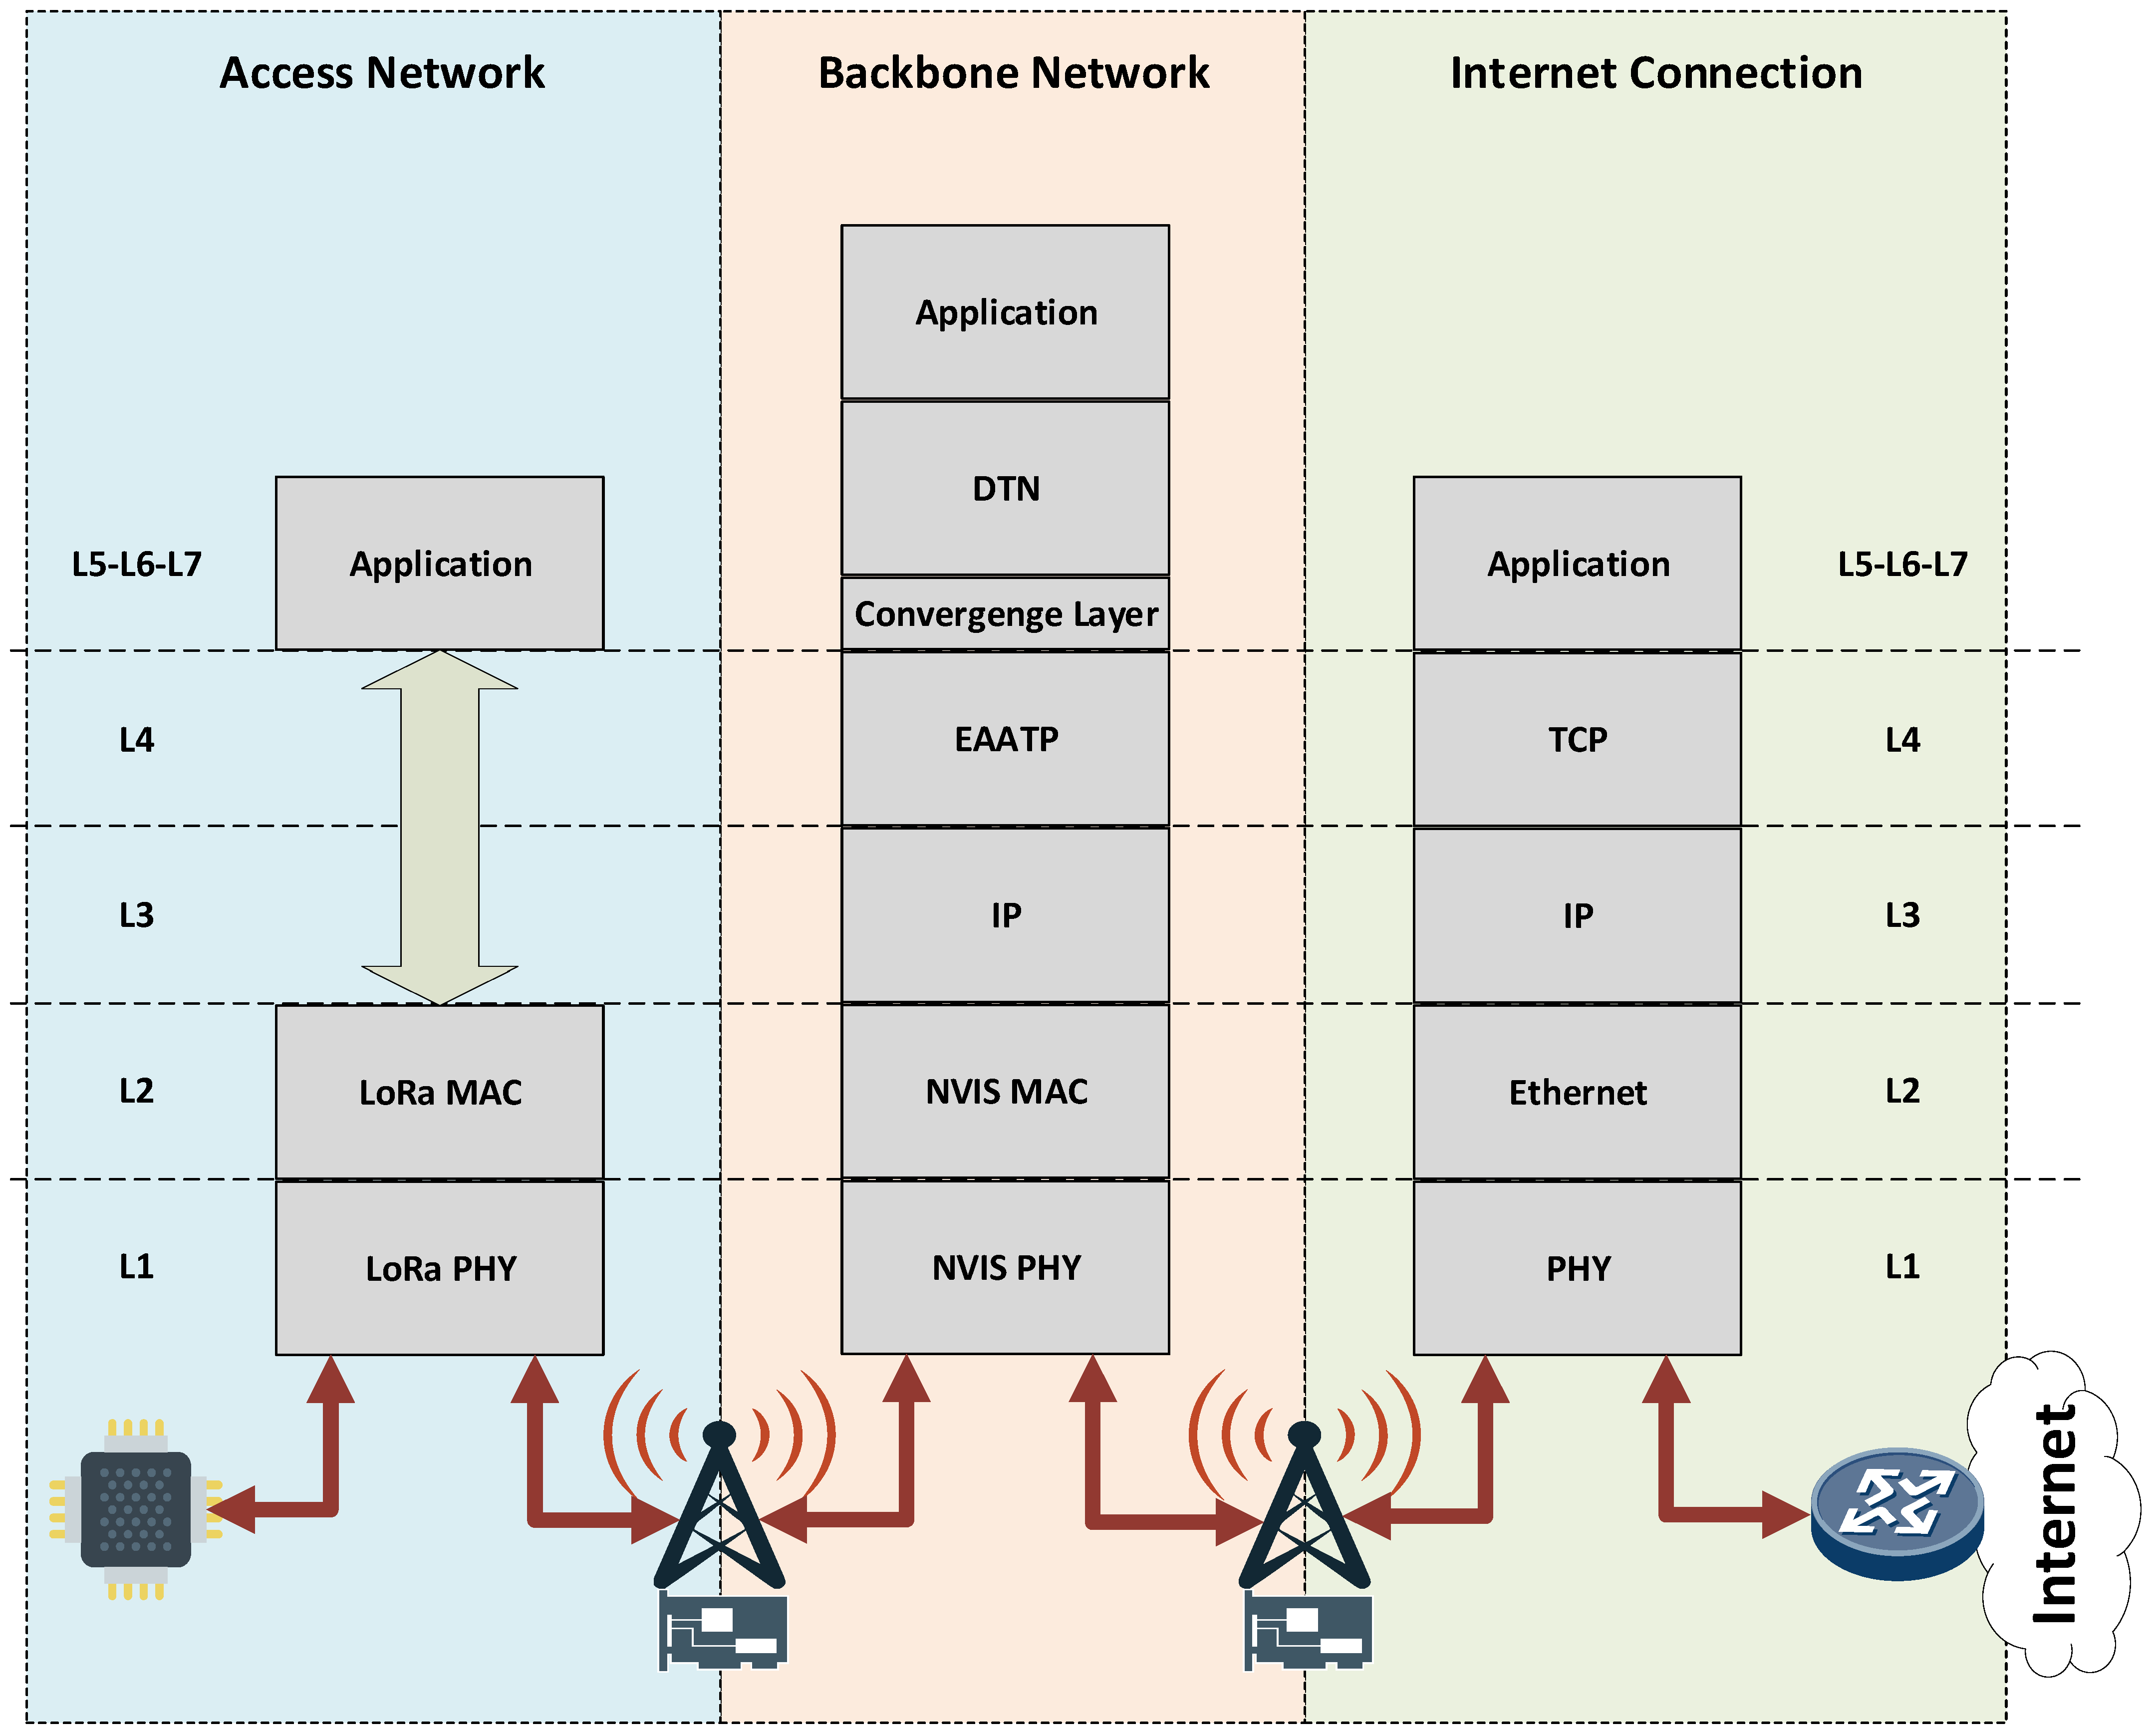
The DTN is usually implemented as an overlay network below the application layer of the Open Systems Interconnection model (OSI model) and needs a convergence layer as an interface to connect to the lower layers of the protocol stack. Figure 5 shows the protocol stack from our use case.
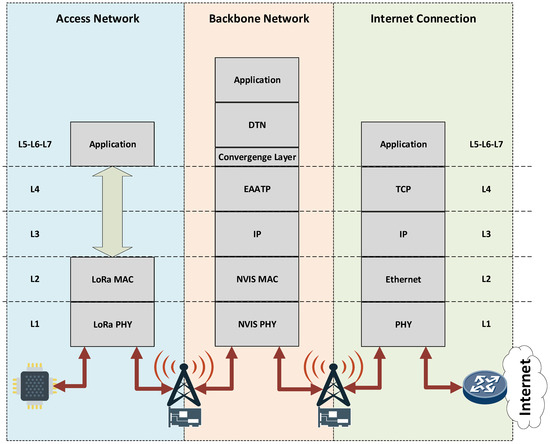
Figure 5.
Antarctic IoT network protocol stack.
In the access network, LoRa uses a reduced protocol stack, thus avoiding layers 3 to 6 of the OSI model. The application data is directly encapsulated into the LoRa data link layer. Once data arrives at the NVIS node, the protocol stack introduces all the OSI model layers and adds the DTN layer below the application layer. The DTN layer needs a convergence layer to adapt to the transport protocol below. Figure 4 shows the EAATP as the transport protocol in the backbone network, although we test diverse transport protocols in our simulations, as discussed in Section 5. Finally, when the data arrives at the last NVIS node and must be forwarded through the Internet, the DTN and convergence layers are removed. The common, well-known TCP/IP model is used, given that end-to-end connectivity at this zone is assumed.
4. Trustworthiness Model Specification
In this section, we summarize our trustworthiness model. Further details of the model can be found in [7]. To the best of our knowledge, none of the prior analyzed trustworthiness approaches have tried to include all of the four trustworthiness areas but have instead focused on one or some of them without considering the interdependencies between all the four categories. This could lead to assuming incorrect reasons for a lower trustworthiness level and implementing the wrong countermeasures to improve it. For this reason, we believed it necessary to design our model to measure a system’s trustworthiness level, which includes the four categories mentioned above and helps us to anticipate and identify the possible weaknesses of our IoT telemetry system.
We propose a layer-based model to measure the trustworthiness and evaluate a system’s performance (in our case, a group of interconnected remote Antarctic wireless sensor networks providing an IoT telemetry service). This model is characterized by (1) two baseline layers (data trustworthiness layer and network trustworthiness layer), (2) two extension layers (social trustworthiness layer and consensus layer) that include optional functionalities, and (3) the interaction between all of them. The data trustworthiness, network trustworthiness, social trustworthiness, and consensus layers can collectively define a system’s trustworthiness.
We postulate that each layer is characterized by its definition (scope), how the trustworthiness of that layer is measured (metric), and how the value of this metric can be improved (countermeasures).
4.1. Data Trustworthiness Layer
This layer aims to ascertain the correctness of the source’s collected data. We propose the measurement of this layer’s trustworthiness with the metric faulty sensing ratio (FSR), defined in Equation (2) as the proportion of false sensed values (FSV) by all nodes and total sensed values (TSV) in a defined period. The lower the FSR, the better the data trustworthiness.
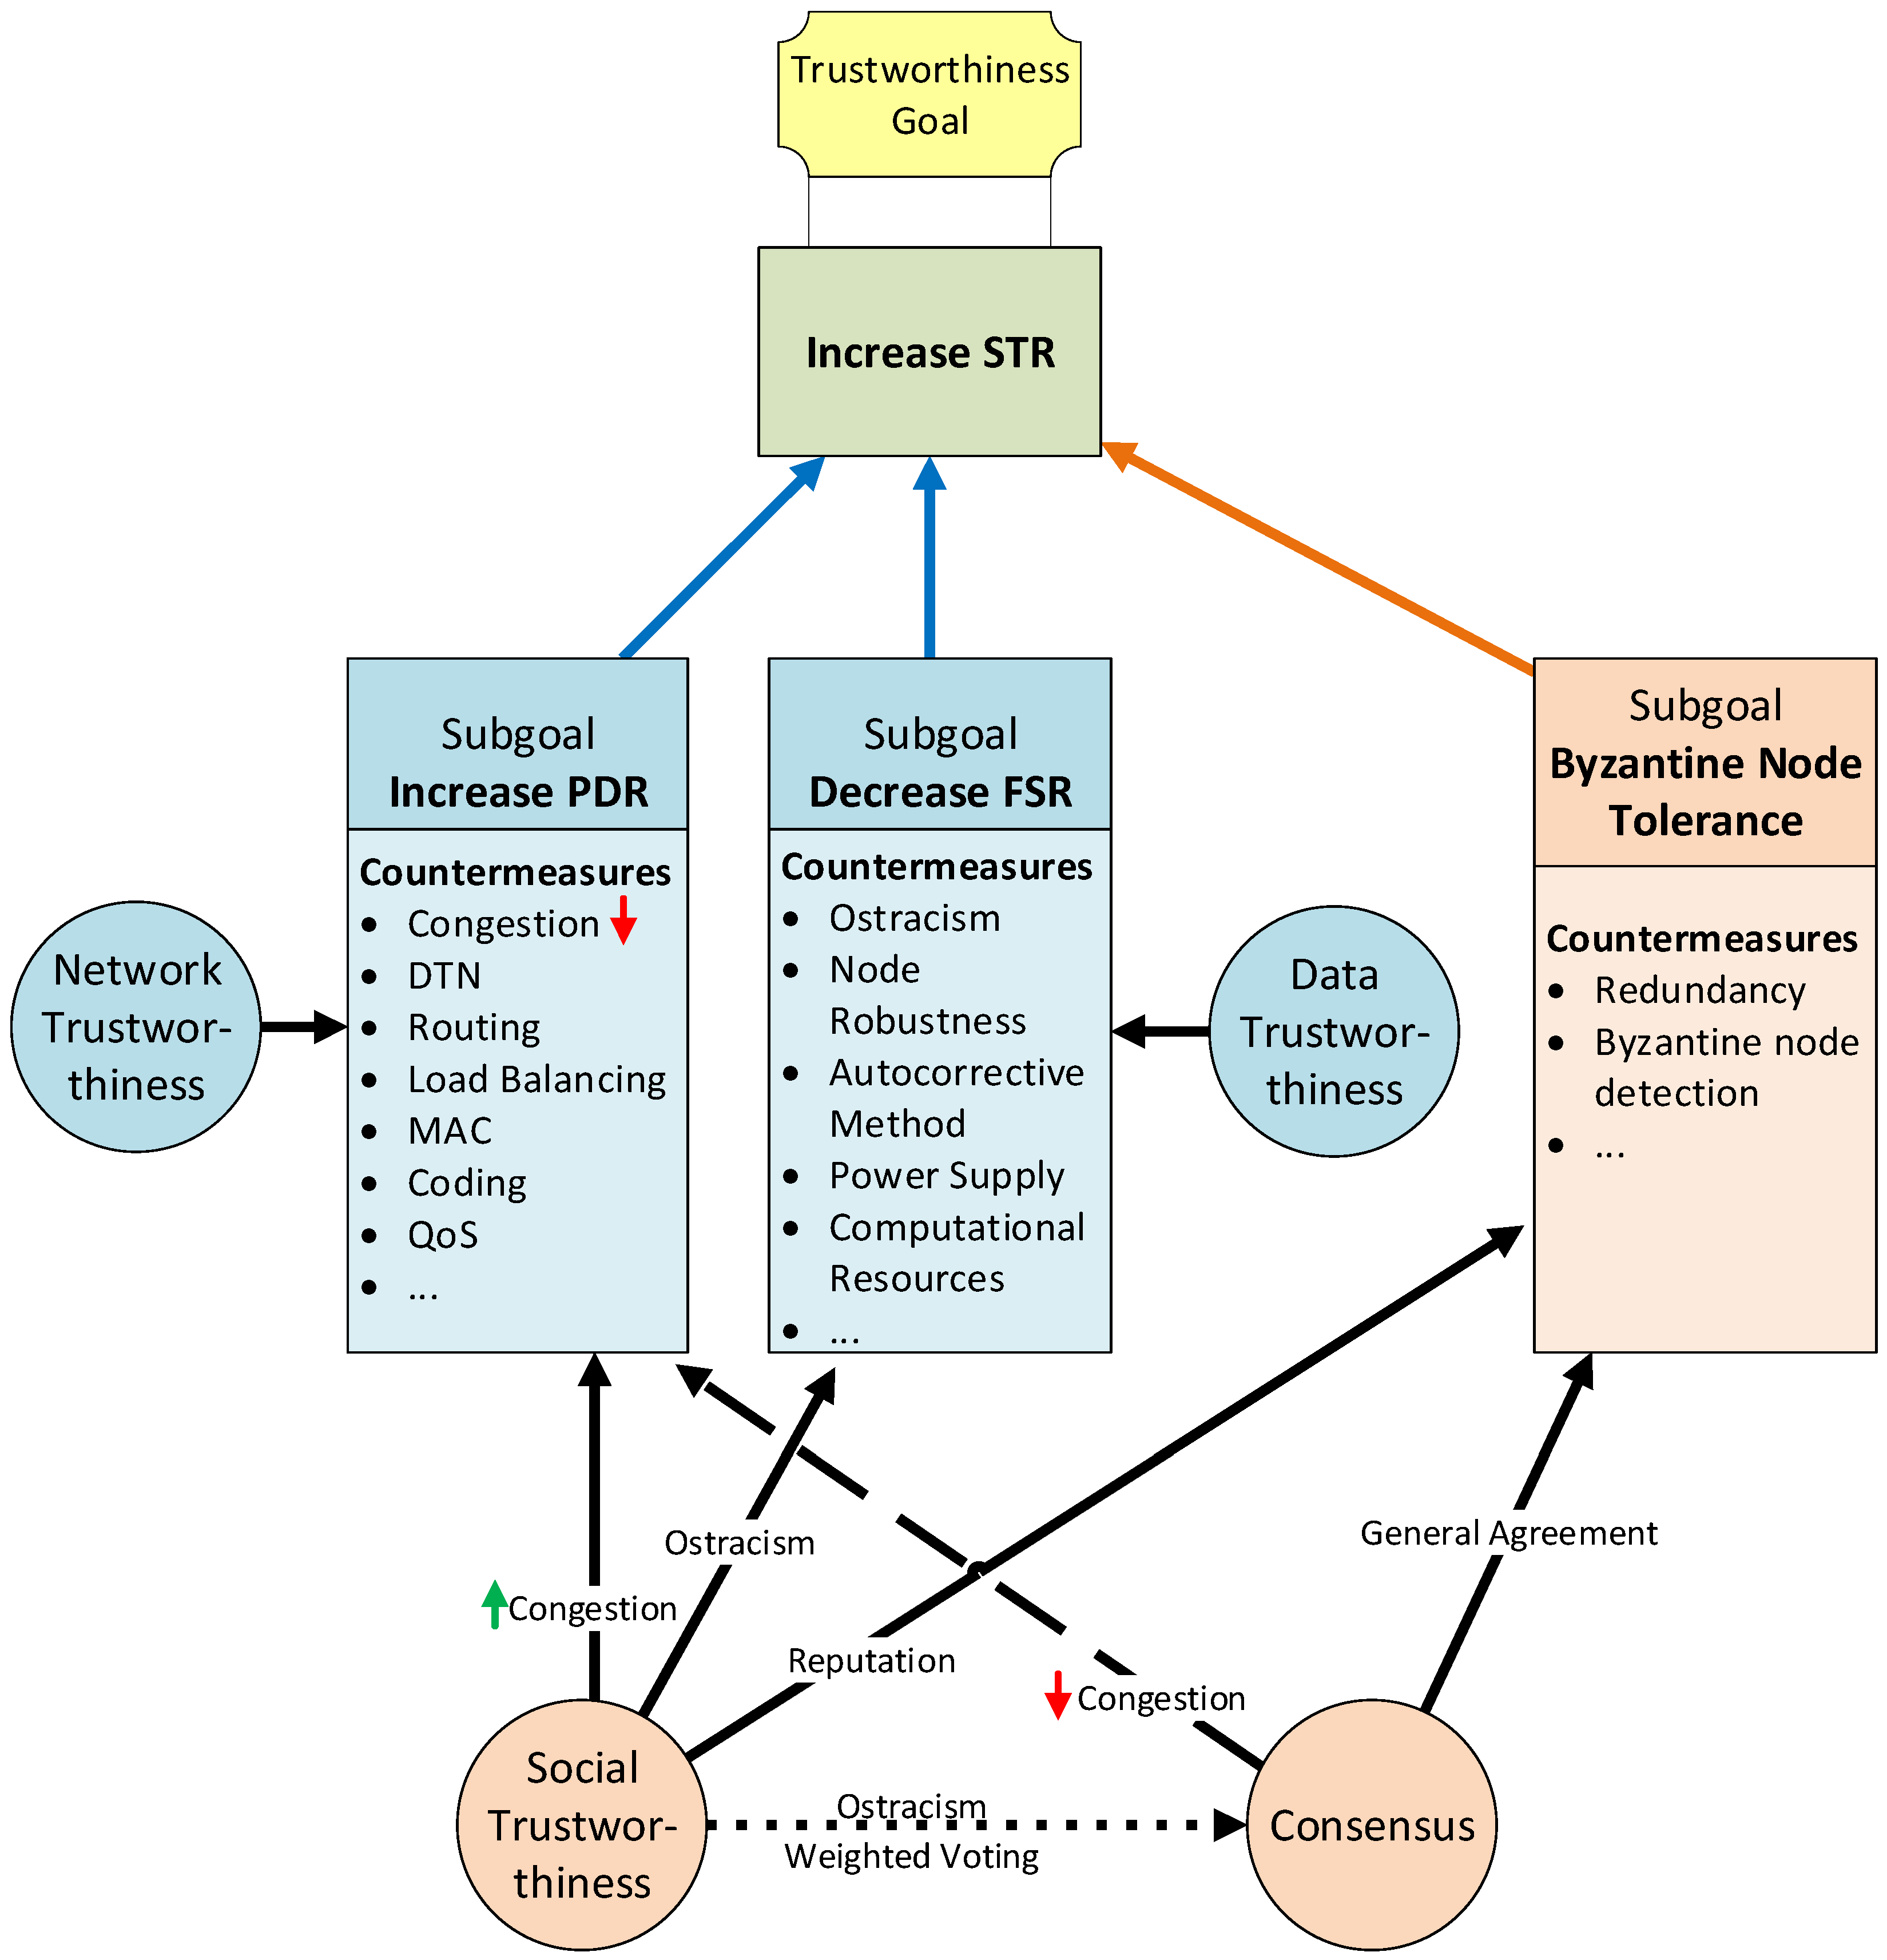
Corrective methods (e.g., [51,52]) which try to detect abnormal data (FSV) stored in the source node due to a sensor malfunctioning, a misreading of the sensed data, or erratic writing in the node’s memory, can be applied. Additional examples of corrective methods are hashes, checksums, and parity bits, among others (see Figure 6).
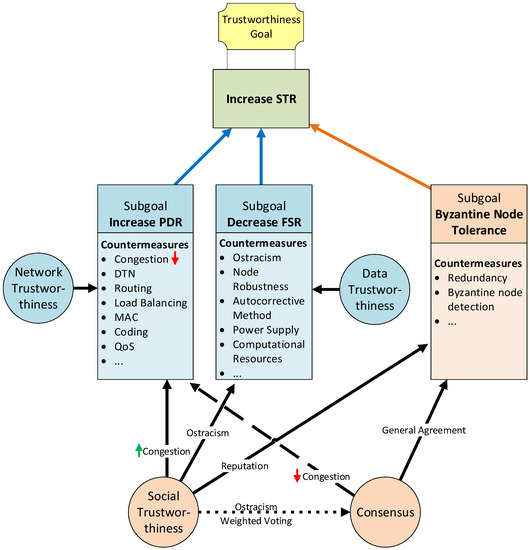
Figure 6.
Trustworthiness model goals and countermeasures relationship [7].
4.2. Network Trustworthiness Layer
This layer is responsible for assuring that a packet reaches its destination on time and unaltered despite the adversities (e.g., link failure, network congestion). We measure this layer’s trustworthiness with the packet delivery ratio (PDR), defined in Equation (3) as the quotient between the total number of packets correctly received (Pr) by all nodes and the total number of packets sent (Ps) by all nodes in the same time slot. The higher the PDR is, the better the network’s trustworthiness.
At the network trustworthiness layer, transmission coding techniques [66] are used to increase the robustness of the transmitted signal. Routing protocols and quality of service (QoS) mechanisms are used to find the best path from a source to a destination by quantifying the quality or performance of each link in the network [55,56]. Congestion control algorithms and other mechanisms of transport protocols [11] can also improve network trustworthiness. In the case of challenge networks, DTN overlay architectures and protocols, such as the Bundle Protocol [8], can also improve network trustworthiness (see Figure 6).
4.3. Social Trustworthiness Layer
This layer is responsible for leveraging the capability to autonomously establish social inter-object relationships to improve the trust between them and the correctness of the collected data. We measure this layer’s trustworthiness with the successful transaction rate (STR), calculated as the proportion between the number of successful transactions (ST) and the total number of transactions (TT) in a defined time slot, as stated in Equation (4). A transaction l is considered successful when a node j expects to obtain some information or data (v) from node i before a defined maximum reception time (Trxmax) and receives it as expected, thus providing good feedback (fijl = 1) for that transaction to node i. The higher the STR is, the better the social trustworthiness.
Most solutions tend to use reputational mechanisms to determine which nodes to trust when exchanging information. This reputation is commonly based on the feedback of previous transactions to build an opinion of the node’s trustworthiness [59,60,62].
4.4. Consensus Layer
This layer is responsible for reaching a state where all group participants agree on the same response or result. We measure this layer’s trustworthiness with the Byzantine node tolerance (BNT), defined as the proportion of supported Byzantine nodes (Nb) that can participate in the consensus system without affecting the correctness of the general agreement and the total number of nodes (Nt) that participate in the consensus system, as defined in Equation (5). A node is considered Byzantine if it experiences a crash or soft fault that incapacitates it to behave as expected or if it does not behave as expected on purpose (malicious node). The higher the BNT is, the higher the probability of reaching a correct general agreement (GA).
Several mechanisms can be used to reach a decentralized GA that all group nodes consider to be true. Theoretically, if the number of Byzantine nodes is higher than 50% of the total number of participating nodes, none of the consensus mechanism will reach a benevolent agreement [63]. A drawback of these mechanisms is that participating nodes need to exchange a large quantity of messages between them to reach a consensus, which can degrade the performance of low-bandwidth networks.
4.5. Trustworthiness Layers Relationships
Figure 6 synthesizes our trustworthiness model actors. Blue-colored elements form part of our model baseline layers, and orange-colored elements form part of the extension layers. The primary goal is to increase the STR to provide better trustworthiness. Three main factors directly help increase the STR: (1) Mitigate/tolerate Byzantine errors; (2) decrease the FSR; and (3) increase the PDR. These factors can be seen as secondary goals that leverage the success of the final goal to provide trustworthiness. Each of these secondary goals can be accomplished by implementing a set of actions or countermeasures. Each of these countermeasures commonly affects only one of the goals. Moreover, two transversal actions impact more than one secondary goal. These transversal actions implement the extension layers of our model: the social trustworthiness layer and the consensus layer.
In Figure 6, continuous-line arrows indicate a positive outcome, discontinuous-line arrows indicate a negative outcome, and dotted-line arrows indicate an uncertain outcome. On the one hand, the use of social trustworthiness can reduce network congestion thanks to the ostracism of nodes with the worst reputation by only sending the values from nodes with the highest reputation to the control center. In addition, social trustworthiness also helps to reduce the FSR thanks to the ostracism of bad reputation nodes. It also leverages the mitigation of Byzantine errors because only values from high reputation nodes (leaders) are trusted. On the other hand, implementing a consensus mechanism mitigates Byzantine errors thanks to the general agreements reached by all nodes from a consensus group. Contrarily, the consensus layer can negatively affect the PDR, given that it introduces a considerable amount of extra traffic to the network, which could lead to link congestion.
5. Simulation Tests
As mentioned before, the first tests we performed to assess the system’s trustworthiness in this use case [7] showed that it was possible to have an STR greater than 0.7 in some circumstances. However, we noticed that the DTN approach of using opportunistic bulk data transfers when the NVIS link becomes available produced network congestion in these periods. On the other hand, we also compared, evaluated, and designed modern transport protocols for heterogeneous LFNs to improve the performance of data transfers over this type of network. Our tests showed that our protocol, the EAATP, maximized throughput and minimized packet losses in LFNs. However, we did not evaluate how the use of these protocols could affect the trustworthiness of a system. Given that the NVIS links in the remote Antarctic WSN use case can be considered an LFN (with a BDP greater than 12,500 bytes, from Equation (1)), we thought that using a particular transport protocol might affect the system’s trustworthiness. For this reason, we decided to run a second round of tests and check if the hypothesis was correct.
In order to (1) foresee which problems may occur during the Antarctic campaign, (2) decide which transport protocol to use, and (3) build more accurate expectations of the system’s performance and outcomes, we applied our trustworthiness model to measure and evaluate them in this use case. For this purpose, the use case scenario was represented and evaluated in the Riverbed Modeler simulator. The first step is the modeling of the different elements that characterize our use case. More details about the modeling of this scenario and its technologies and protocols can be found in [7,11].
Firstly, the backbone network (NVIS) and the access network (LoRa) were modeled separately, characterized as stated in Table 1 following the aforementioned description of the network architecture (please revisit Section 3) and the link availability results from [4] and [65]. On the one hand, LoRa does not experience any availability variation between daytime and nighttime, being fully available if there is LoS between the sensor and the gateway, and with partial availability in the case of no LoS. On the other hand, NVIS is not affected by not having LoS. However, its availability varies hour by hour, depending on the ionosphere state, which is highly correlated to solar activity. During nighttime (5 p.m. to 6 a.m.), the NVIS links are not available, while during daytime (6 a.m. to 5 p.m.), their availability varies between 70% and 100%.

Table 1.
Network parameters used to model the scenario.
Secondly, we modeled the following transport protocols as in our previous work [11]: BBR, Copa, CUBIC, EAATP, Indigo, and Verus. We focused on modern transport protocols that have been proven to perform well [45] and TCP CUBIC, which is the standard transport protocol in most operating systems nowadays. These protocols were modeled according to the results from our previous work in physical testbeds and simulations [5,11] and the Pantheon tests [45].
Thirdly, we needed to model the Byzantine behavior of nodes. As stated in [67], the probability Pb of a node having a Byzantine fault is unlikely to be constant over time. The node reliability can be related to the battery charge level by associating the battery discharge with the WSN node aging process. Following the model in [67], we can assume the impact of aging as following a linear form, as defined in Equation (6):
where Pb0 is the probability of a node having a Byzantine fault at time t = 0, and k is the aging factor. This probability Pb increases hour by hour until its battery has practically run out at t = td, when it experiences a crash fault and Pb(td) = 1. In the simulations, we tested nine different values of Pb0 to emulate the use of different corrective methods (see Table 2).

Table 2.
Simulation parameters.
As we are in a simulation environment and we can keep track of all collected, sent, and received values by all nodes, we can compute FSV and ST by comparing the values that the sensor should have collected with the values that the sensor actually sends and the values that the control center receives, respectively. In a testbed environment with real devices, this would only be possible if previously known ground truth values were sent, in order to compare them with the values received by other nodes.
To model the implementation of the social trustworthiness layer, we used a simplified version of the objective reputational model from [59]. Our use case simplification assumes that all transactions will have the same weight, all nodes have the same computational capability, and the relationship factors between them are equal. Finally, a consensus protocol can be modeled by knowing the background traffic (bps) introduced to the network and the number of Byzantine nodes supported (Nb). In our use case, each group of redundant GTN-P stations will run the PBFT algorithm [68]. The background traffic grows exponentially as the number of nodes participating in the consensus (Nt) group increases. Moreover, the number of tolerated Byzantine nodes Nb is calculated as in Equation (7):
Our scenario has five NVIS gateways, each providing an independent LoRa coverage area (access network) with its own sensors. For each gateway, there are clusters of sensors measuring the same data. In our test on the field during the campaign, we will deploy eight clusters per gateway. However, in the simulations, we also tested larger numbers of clusters (as seen in Table 2) to assess the goodness of our model and the system’s scalability. Each cluster will have a specific number of redundant sensors measuring the same data. From our previous tests, we defined that we would set seven redundant sensors (GTN-P stations) in each cluster in the field deployment, so two Byzantine nodes could be tolerated. Despite this, in the simulation tests, we varied this number from 1 to 10 in order to compare the results with different Byzantine node tolerances (from 0 to 4, following Equation (7)) and assess the system’s scalability.
The simulations consider three different operational modes: the standard mode (no redundancy), the redundancy mode with social trustworthiness, and the redundancy mode with consensus. In the standard mode, all the values gathered by every sensor are pushed through the backbone network to the remote control center. On the contrary, in redundancy modes, only one value is forwarded to the control center by each cluster. This value is agreed by cluster members with the social or the consensus mechanism. This fact reduces the amount of traffic that has to pass through the NVIS backbone LFN, although, contrarily, it introduces more overload to the LoRa access network due to the messages that need to be exchanged between cluster members.
All these possibilities add up a total amount of 16,200 different scenarios. Each scenario was simulated for 120 h (5 days) to experience diverse nighttime and daytime cycles, and each test was repeated 30 times to assure results confidence. A summary of the simulation parameters to run our tests is shown in Table 2.
6. Results
After performing all the simulations, the average value of the STR was calculated for every set of 30 runs per test. The results obtained have a maximum error deviation of 0.68% with a confidence interval of 99%. Three different operational modes for the telemetry service can be identified: the standard mode, the redundancy mode with social trustworthiness layer, and the redundancy mode with consensus layer. For every mode, an N × M-dimension grid with all the possible combinations of stimulation parameters is formed, where M is the number of different Pb0 values, and N is the number of different GTN-P node combinations per gateway. For every point in this grid and for every transport protocol, the average value of the trustworthiness STR metric is computed. If we link all the STR values for every neighboring point in the grid, a mesh with all the STR values for each transport protocol is formed. We call this mesh the trustworthiness mesh.
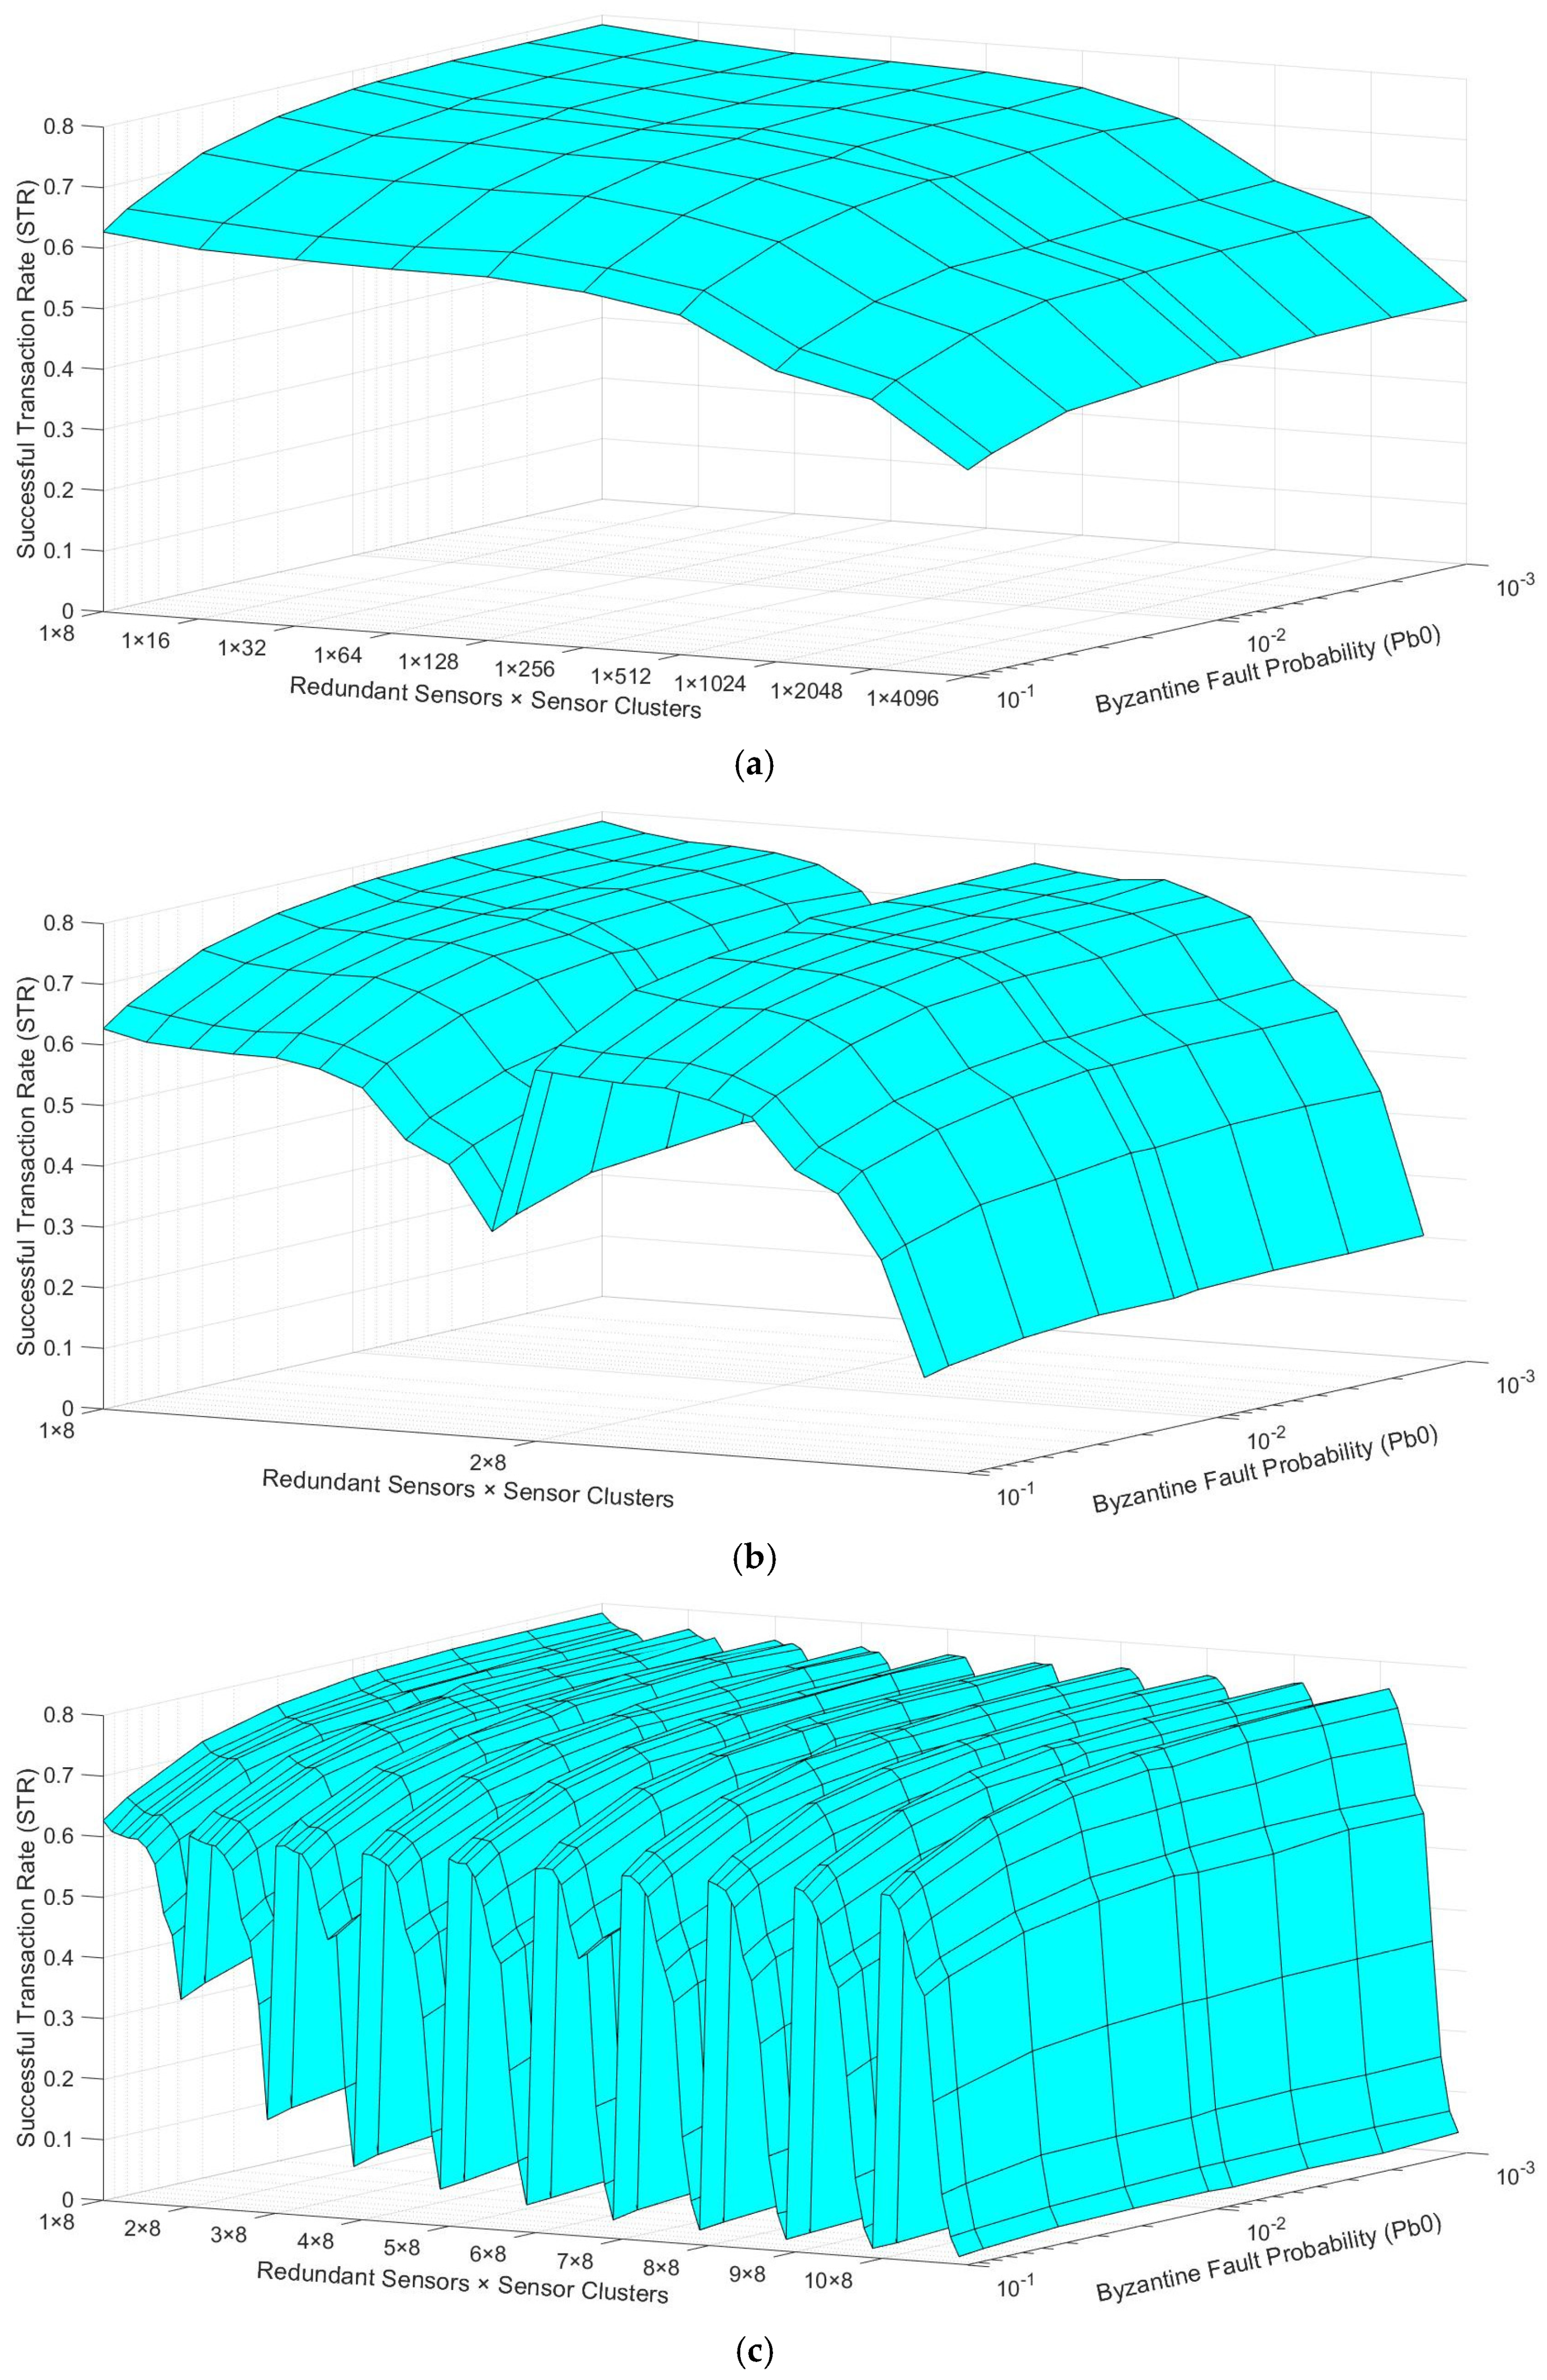
Given that it is complex to understand the trustworthiness mesh results, we first use an example to describe how the results are visualized. If we wanted to represent the results for only one transport protocol, when the number of redundant sensors per cluster is 1, and the number of clusters varies from 8 to 4096 (Table 2, row 9) we could obtain a mesh similar to Figure 7a. The “Byzantine Fault Probability” axis has nine discrete points, corresponding to the nine different Pb0 values shown in Table 2, row 4. The “Redundant Sensors × Sensor Clusters” axis has 10 discrete points, which are 1 × 2N, where N = [3, 4, …, 12], according to the values shown in Table 2, row 9. Figure 7a shows the general behavior that STR values will follow in the actual results. On the one hand, across the “Byzantine Fault Probability” axis, the STR decreases as the Pb0 increases, given that more values are faulty sensed when the Pb0 is higher. On the other hand, across the “Redundant Sensors × Sensor Clusters” axis, the STR decreases as the number of clusters increases, given that more devices are introduced to the network, provoking more packet losses caused by network congestion.
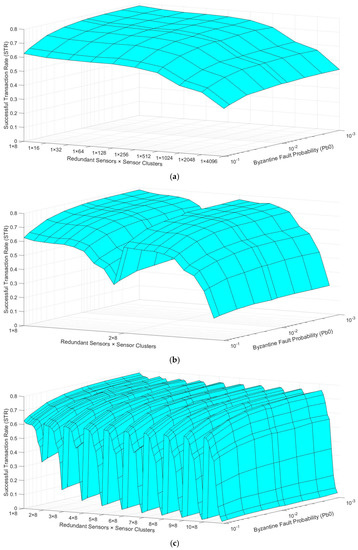
Figure 7.
Trustworthiness mesh examples: (a) only one redundant sensor per cluster; (b) one or two redundant sensors per cluster; (c) one to ten redundant sensors per cluster.
Similarly, suppose we wanted to show, in a single mesh, the results from the same scenario, but the number of redundant sensors per cluster varied between 1 and 2. In that case, we could obtain a mesh similar to Figure 7b. In this case, the “Byzantine Fault Probability” axis remains the same. In contrast, now the “Redundant Sensors × Sensor Clusters” axis has 20 discrete points, which are [1 × 2N, 2 × 2N] where N = [3, 4, …, 12]. If all the discrete points of this axis were labeled, it could be too congested. For this reason, we only label the beginning of each “redundant sensors” series, i.e., the “1 × 8” and the “2 × 8” discrete points. The same behavior as before is observed, but now the STR values recover when we jump from the “1 × 4096” to the “2 × 8” discrete point, given that much fewer nodes are introduced to the network, i.e., fewer packets are dropped due to network congestion.
Analogously, Figure 7c shows the trustworthiness mesh if we wanted to visualize all the results simultaneously, varying the number of redundant sensors from 1 to 10 (Table 2, row 10). In this case, the “Redundant Sensors × Sensor Clusters” axis has 100 discrete points, which are [1 × 2N, 2 × 2N, …, 10 × 2N] where N = [3, 4, …, 12]. In this case, we observe the same general behavior again. However, now we can also detect that, if we compare the discrete points with the same number of clusters, the STR also decreases as the number of redundant sensors per each cluster increases, i.e., more packet losses are caused by network congestion as more nodes are introduced to the network.
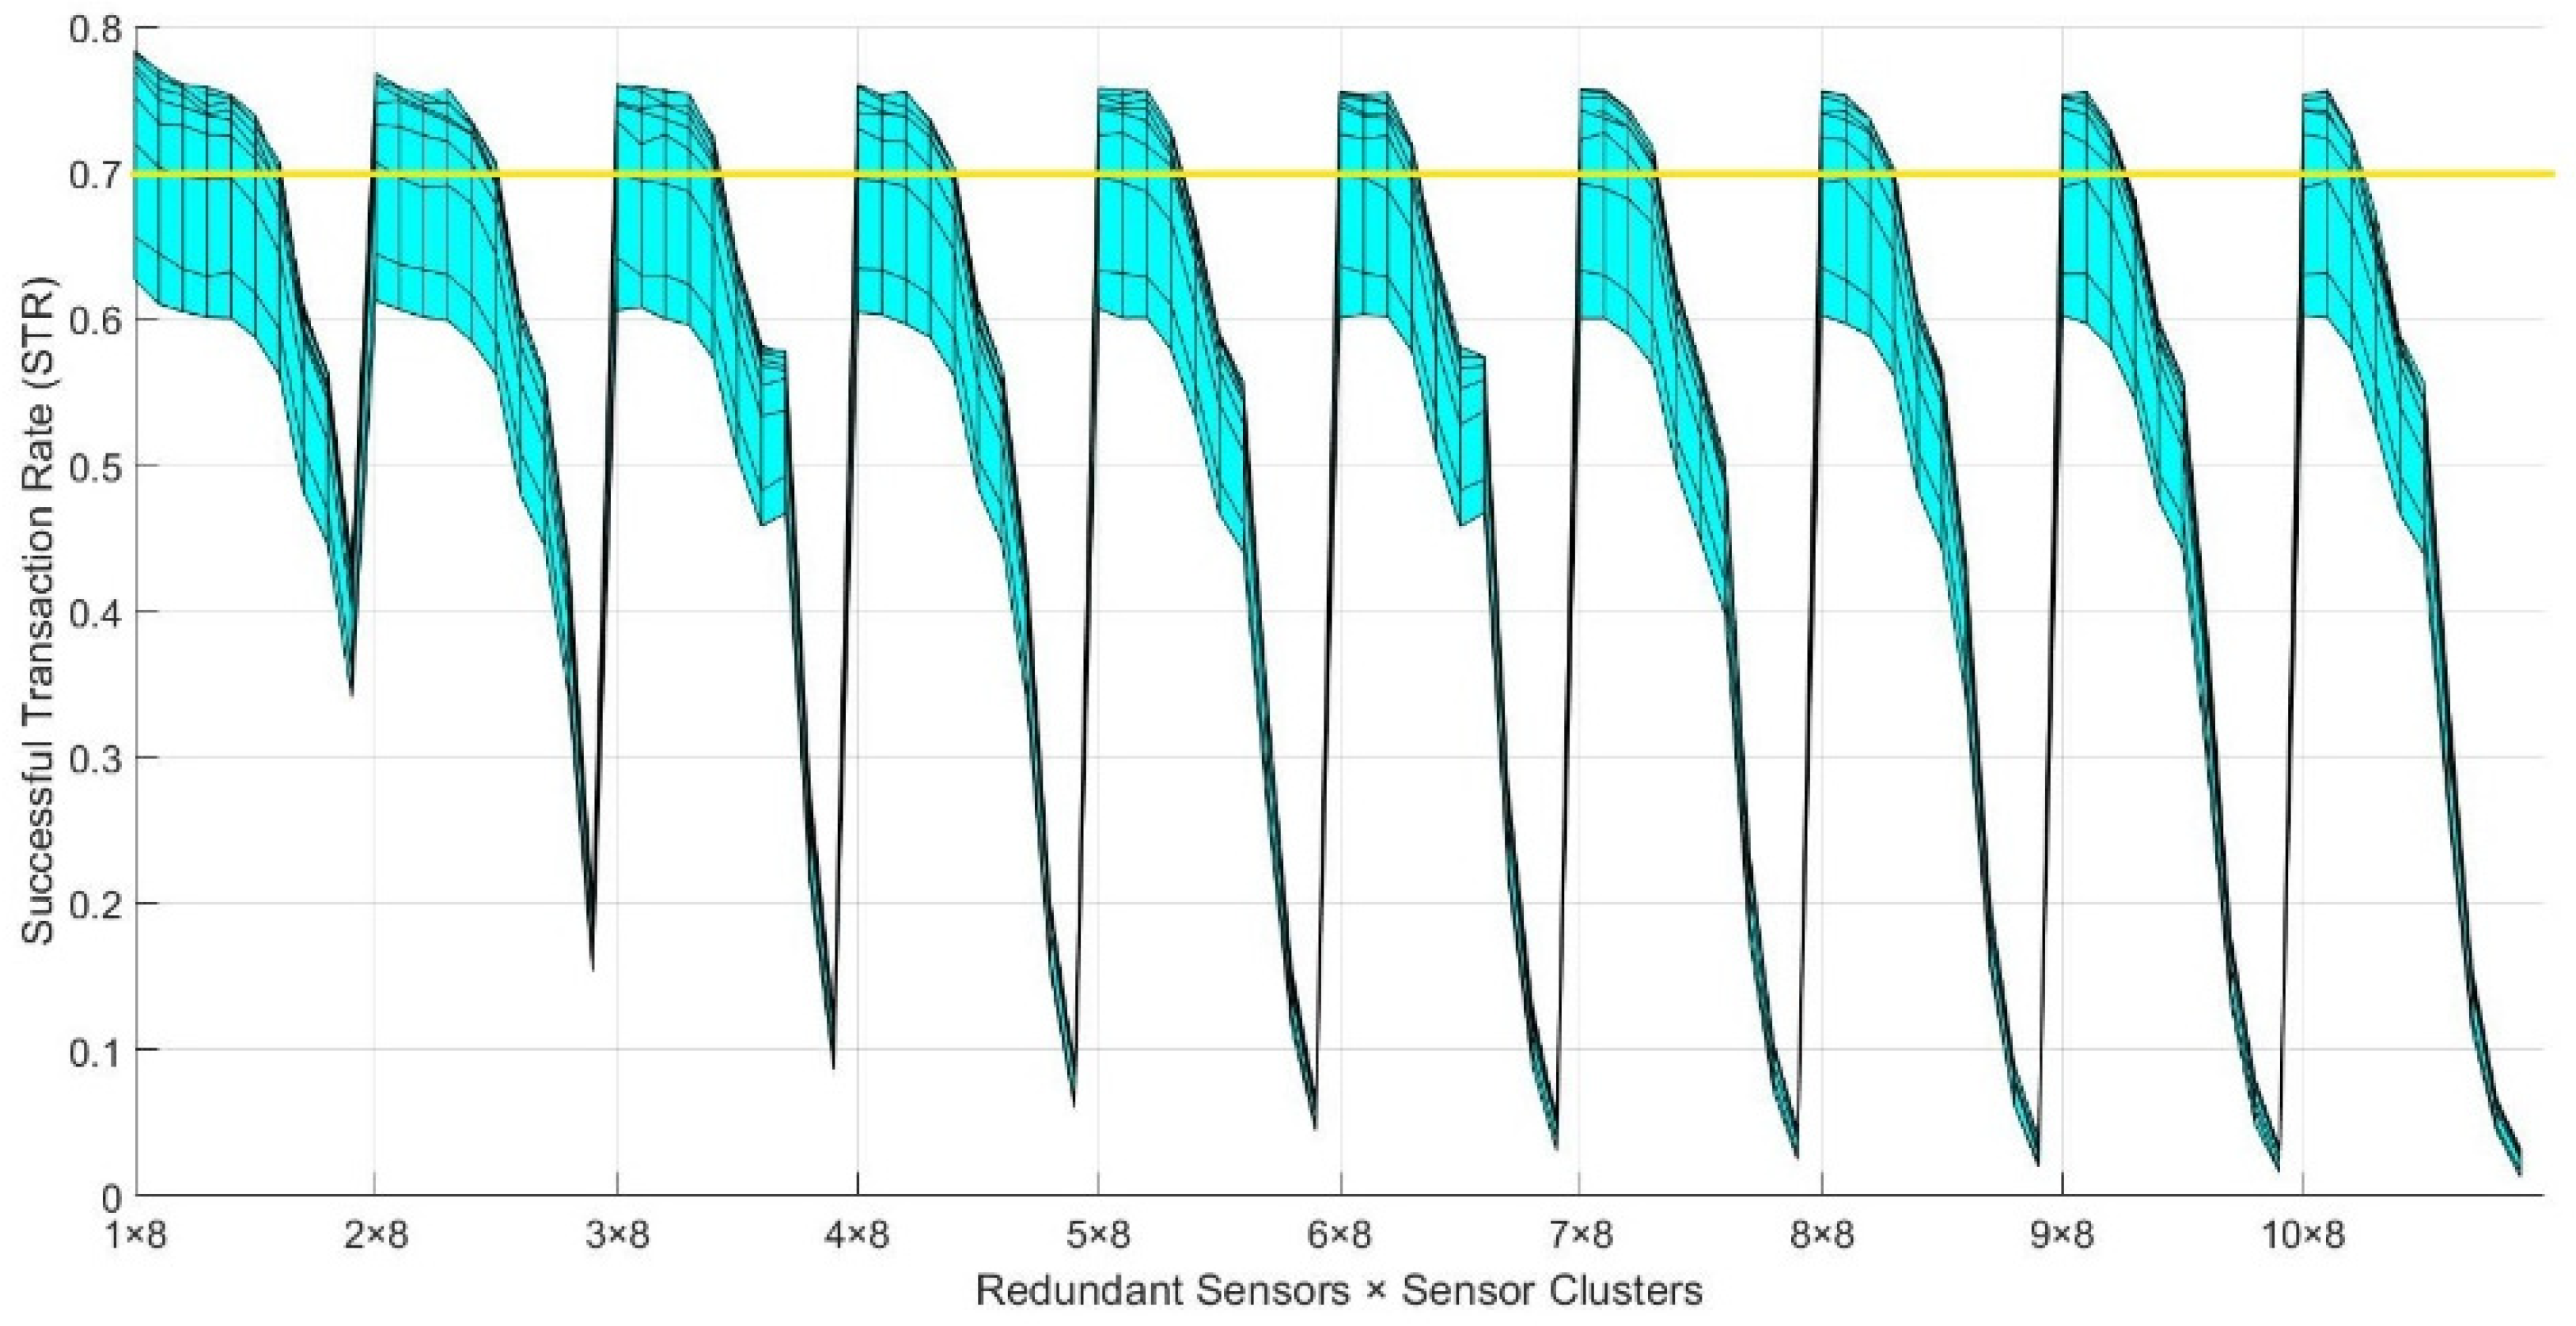
Figure 8 shows the frontal view of the trustworthiness mesh from Figure 7c. From this view, we can observe how the STR varies across the “Redundant Sensors × Sensor Clusters” axis without showing the variance, depending on the Pb0 of the nodes.
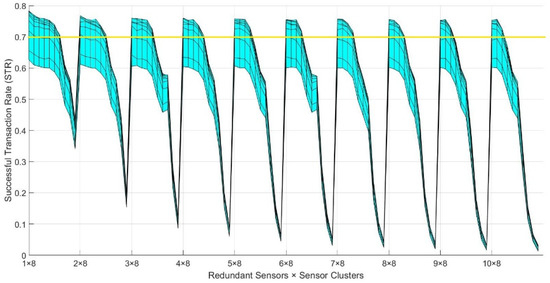
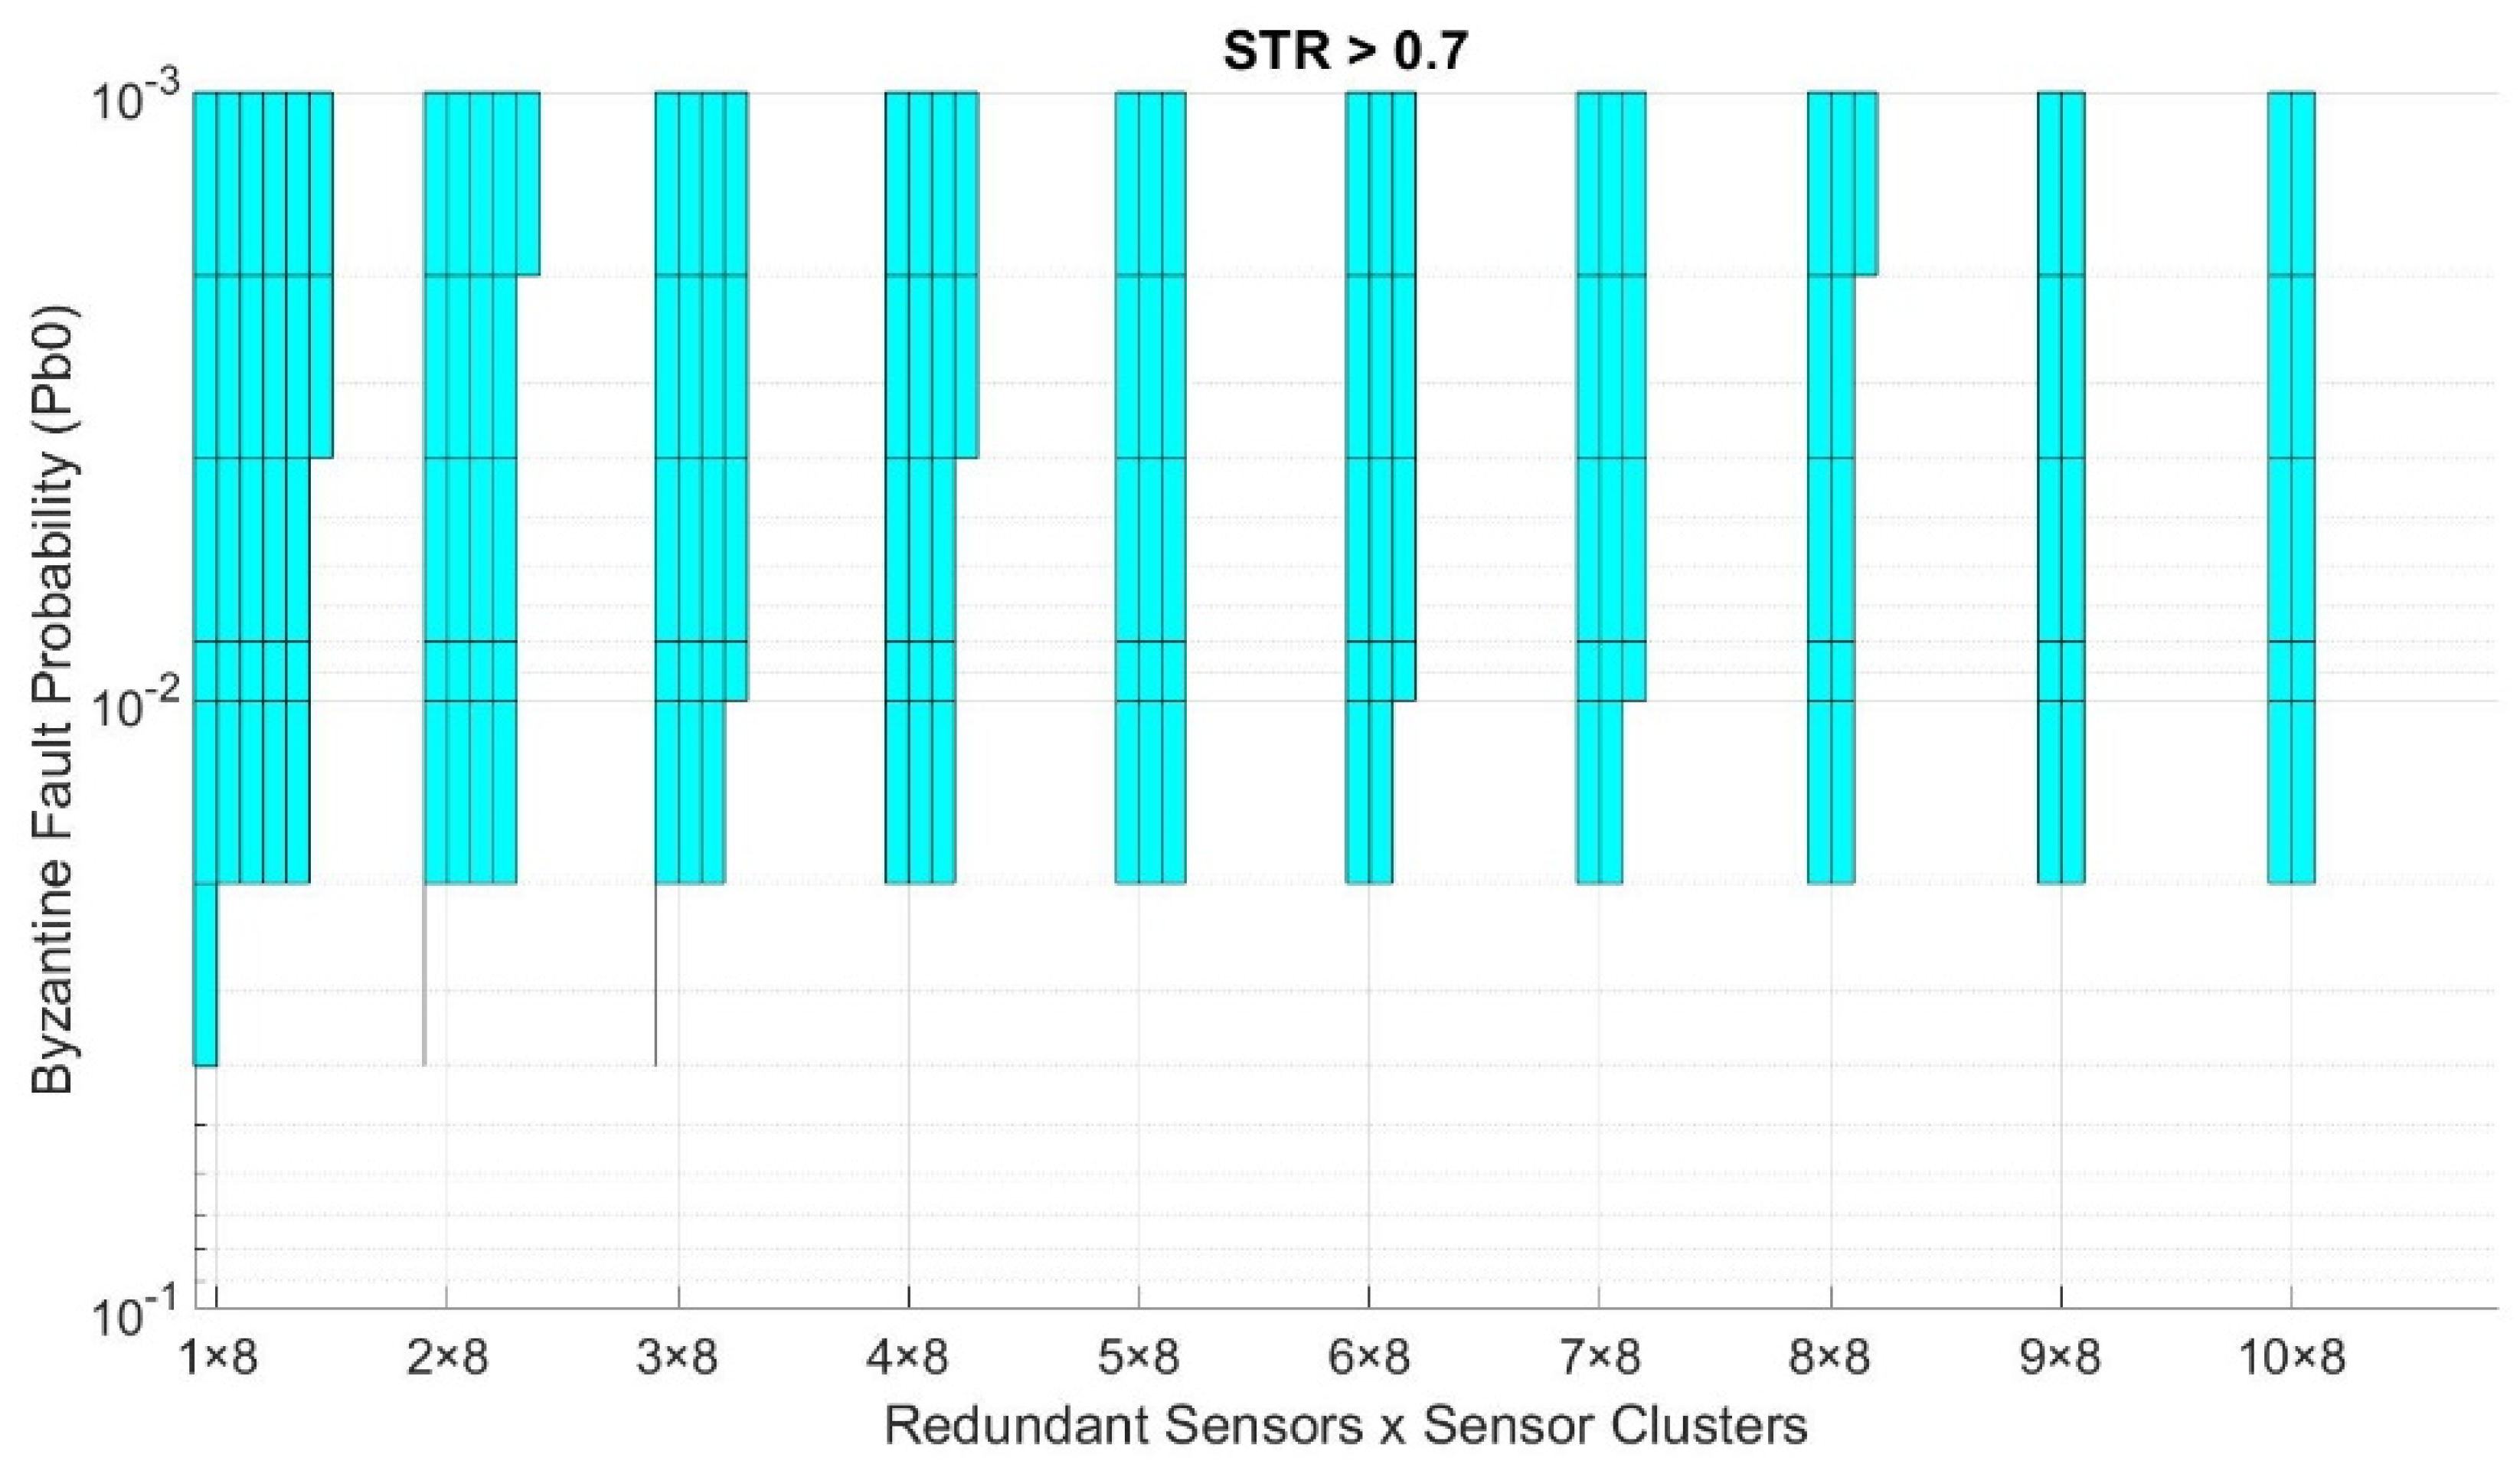
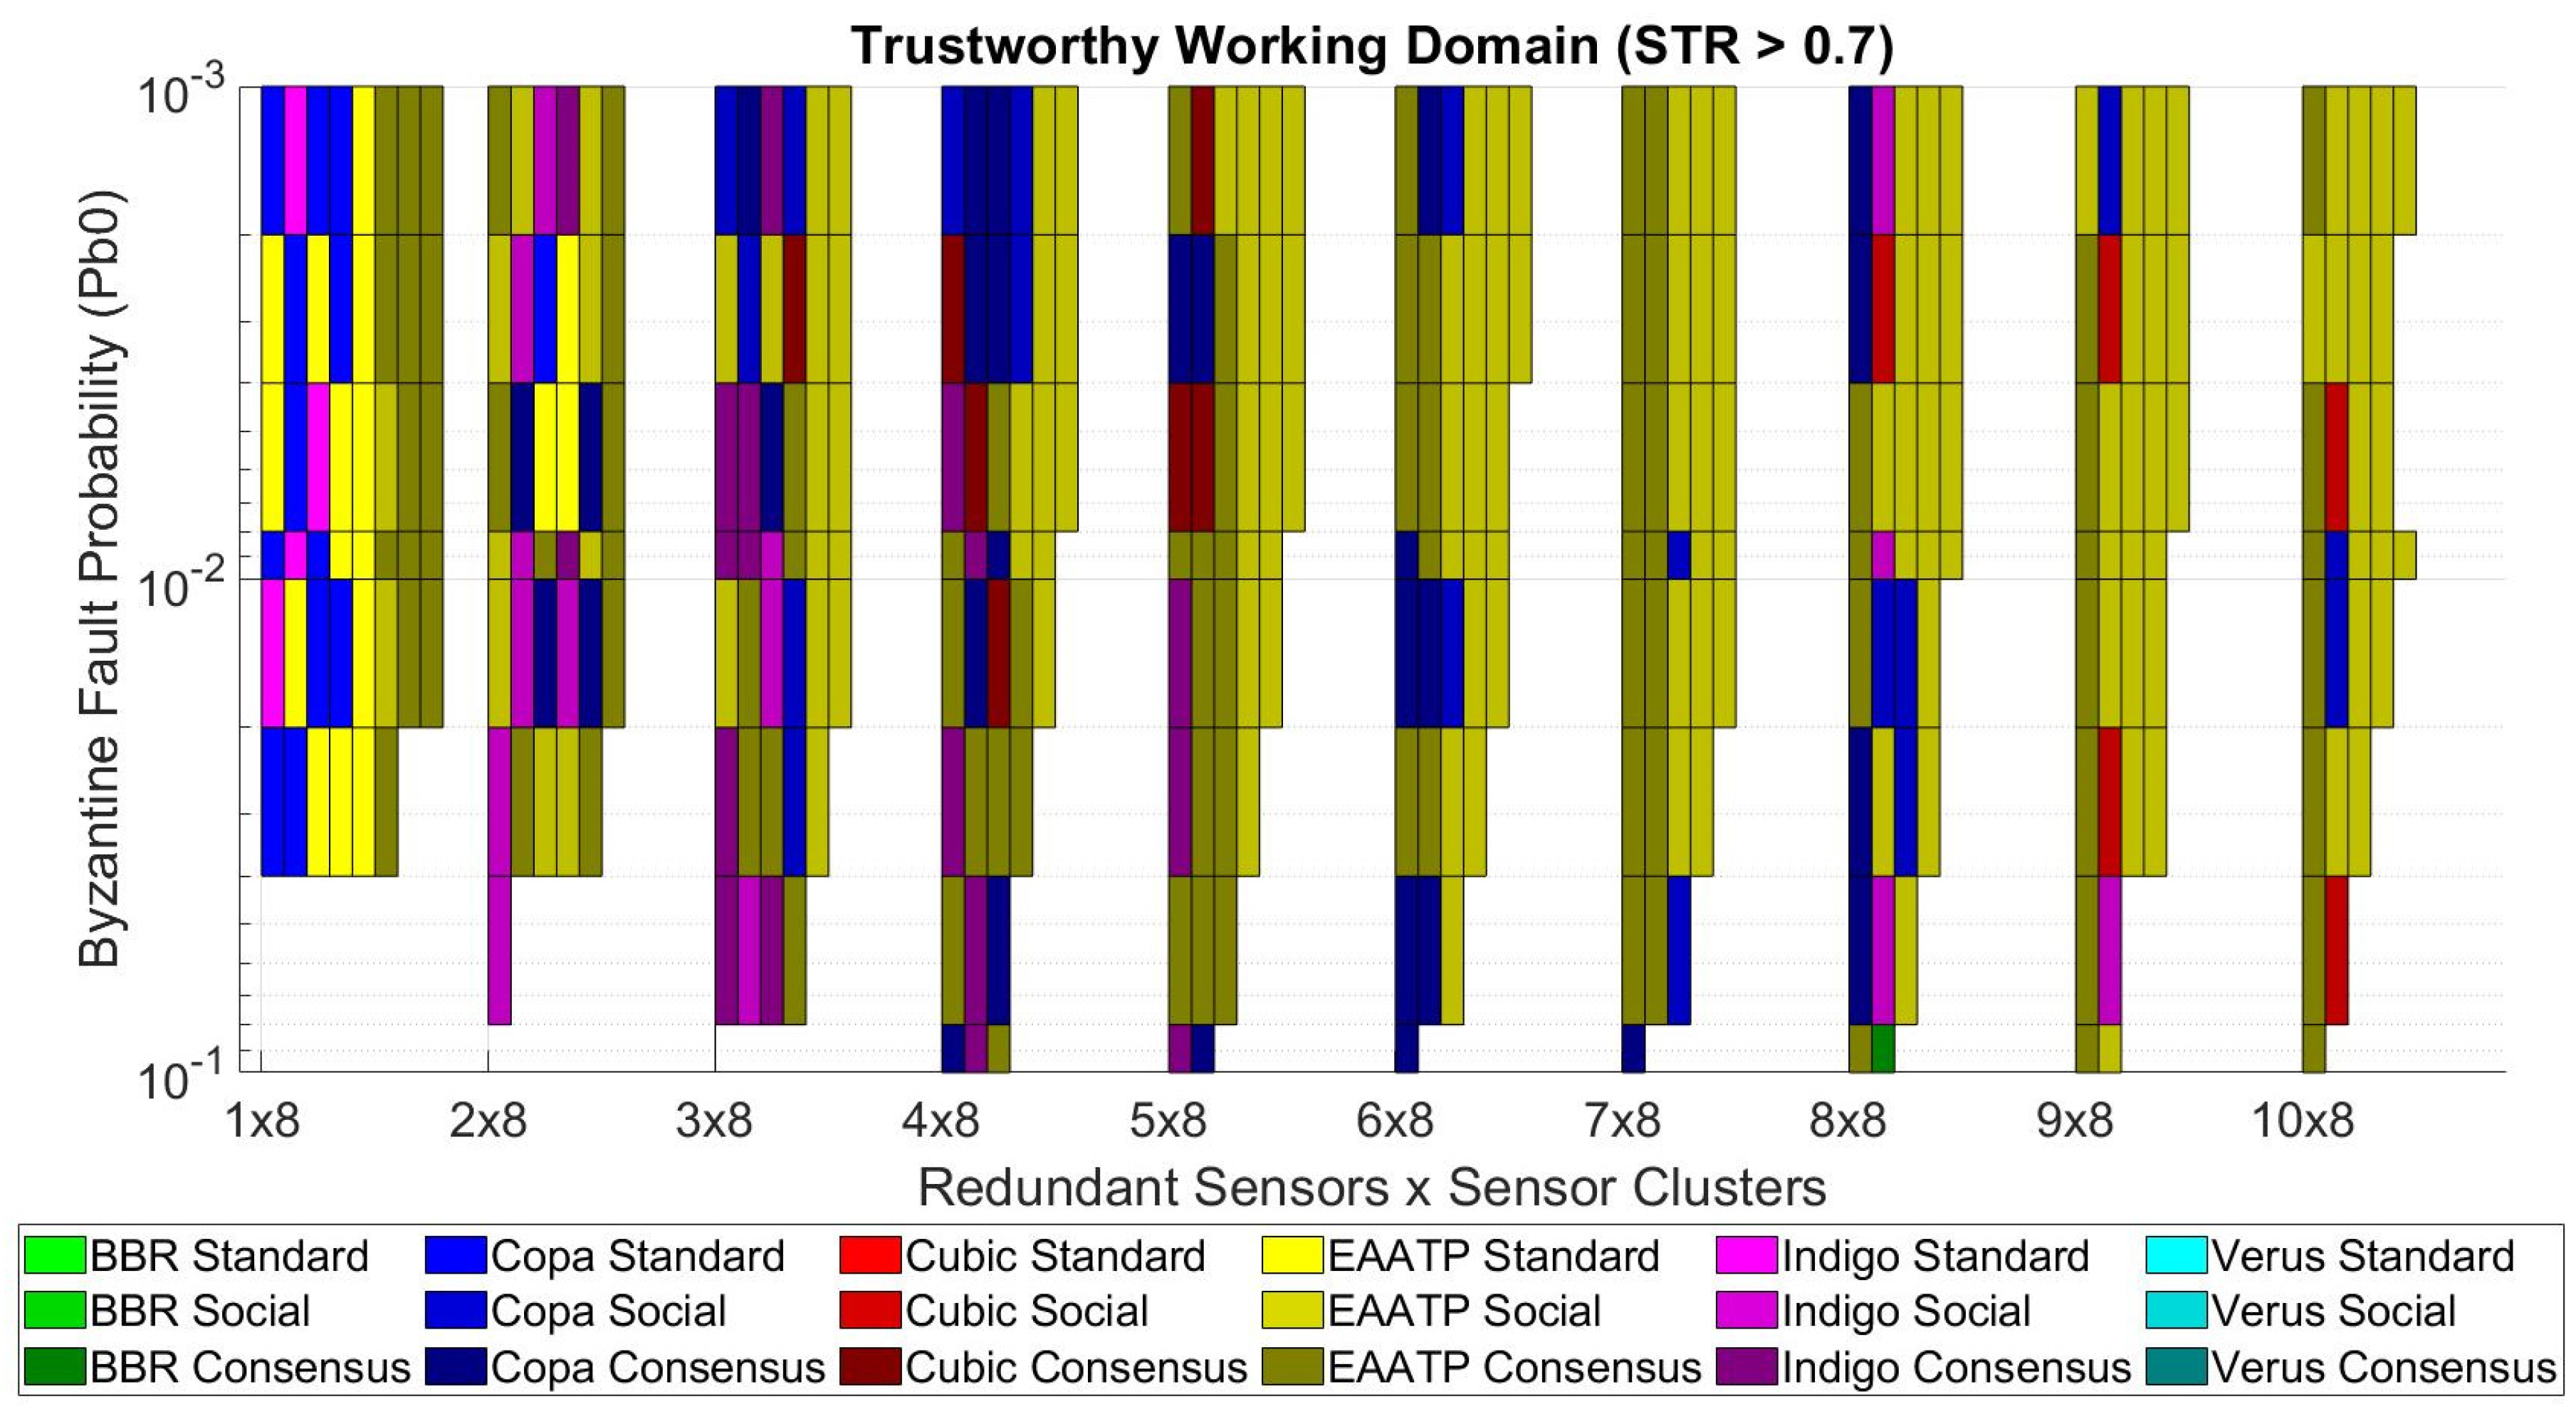
Our model can also be used to visualize the working domain in which to implement our service, given a desired minimum trustworthiness level. As stated before, our use case requires a minimum STR of 0.7, so an average of 9 out of 13 sensed values per night reach the control center correctly to meet the objective of [9]. Figure 9 shows the working domain of the example trustworthiness mesh presented in Figure 7c and Figure 8, requiring an STR higher than 0.7. For every point in the grid, if no solution provides an STR higher than the desired minimum value, the surface for that area is white-colored, meaning we cannot deploy the service with those conditions. On the contrary, if one or more solutions achieve an STR higher than the desired minimum value, the surface is painted with the color of the solution with the highest STR. This representation is achieved by “cutting” Figure 8 along the yellow line, which represents the minimum STR level that must be achieved. The part of the trustworthiness mesh above the yellow line meets the criteria and is part of the working domain, while the part below does not.
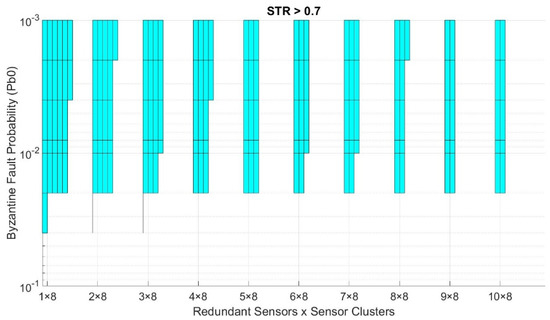
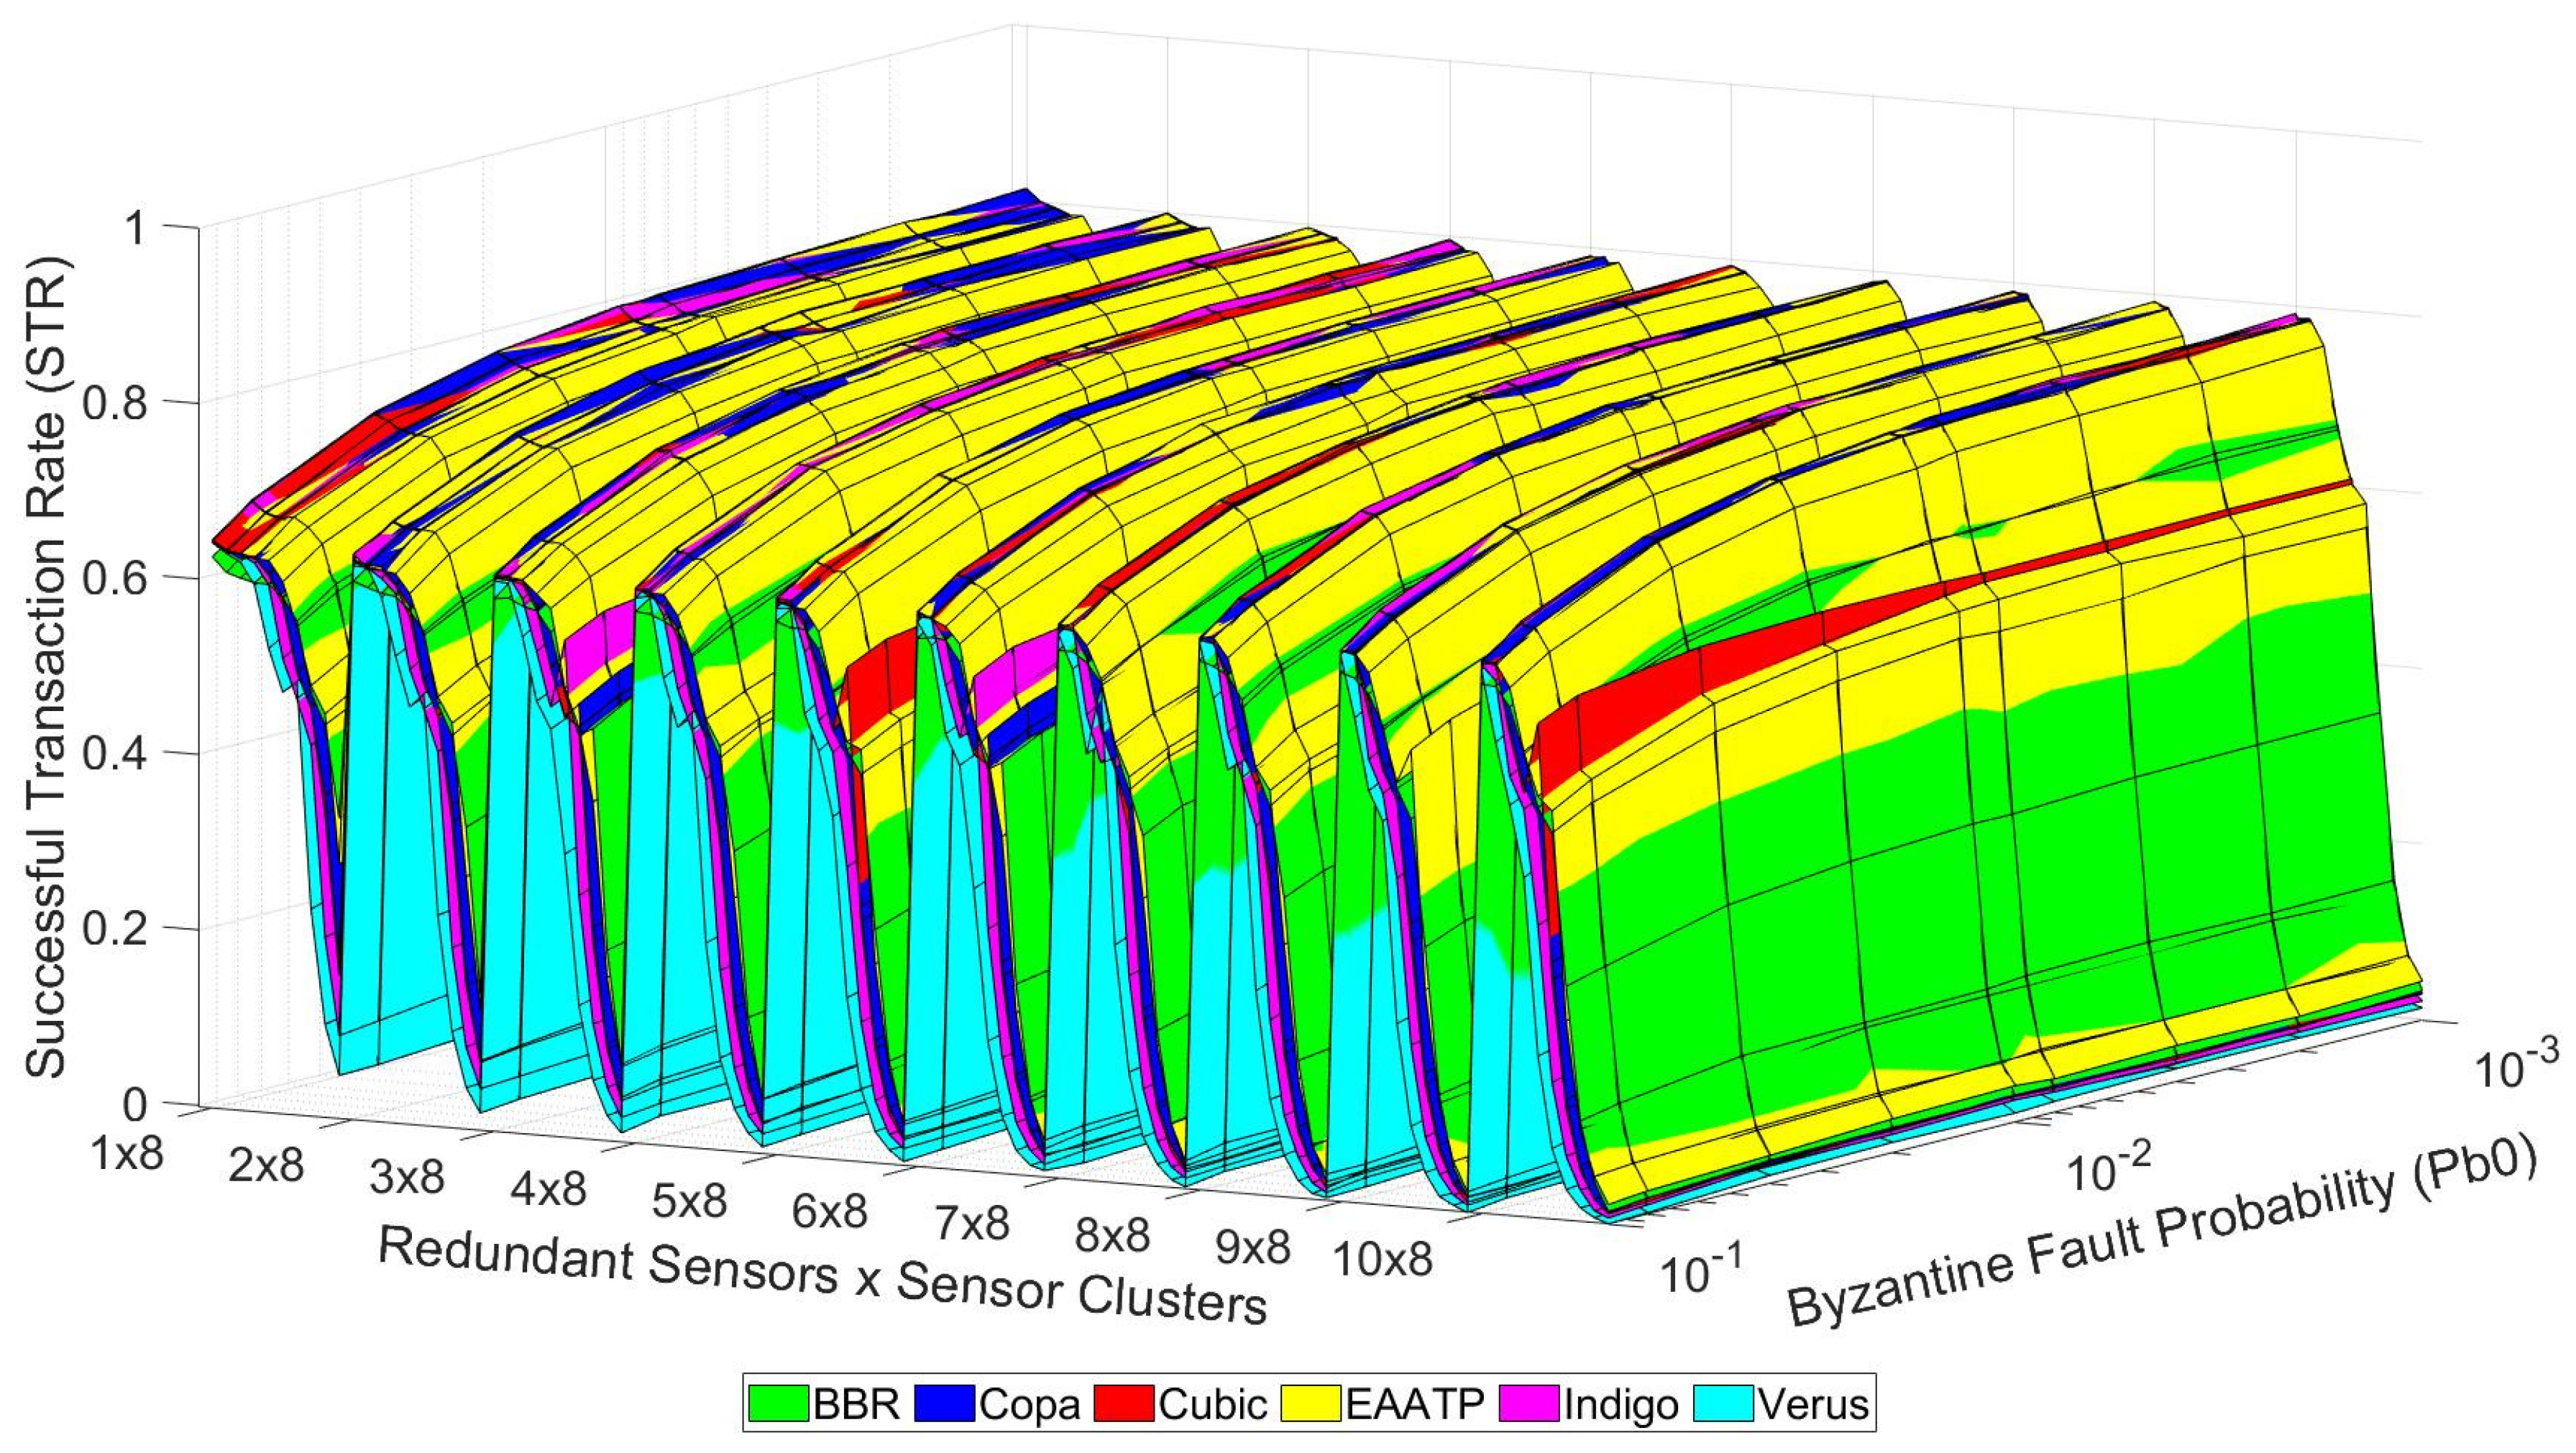
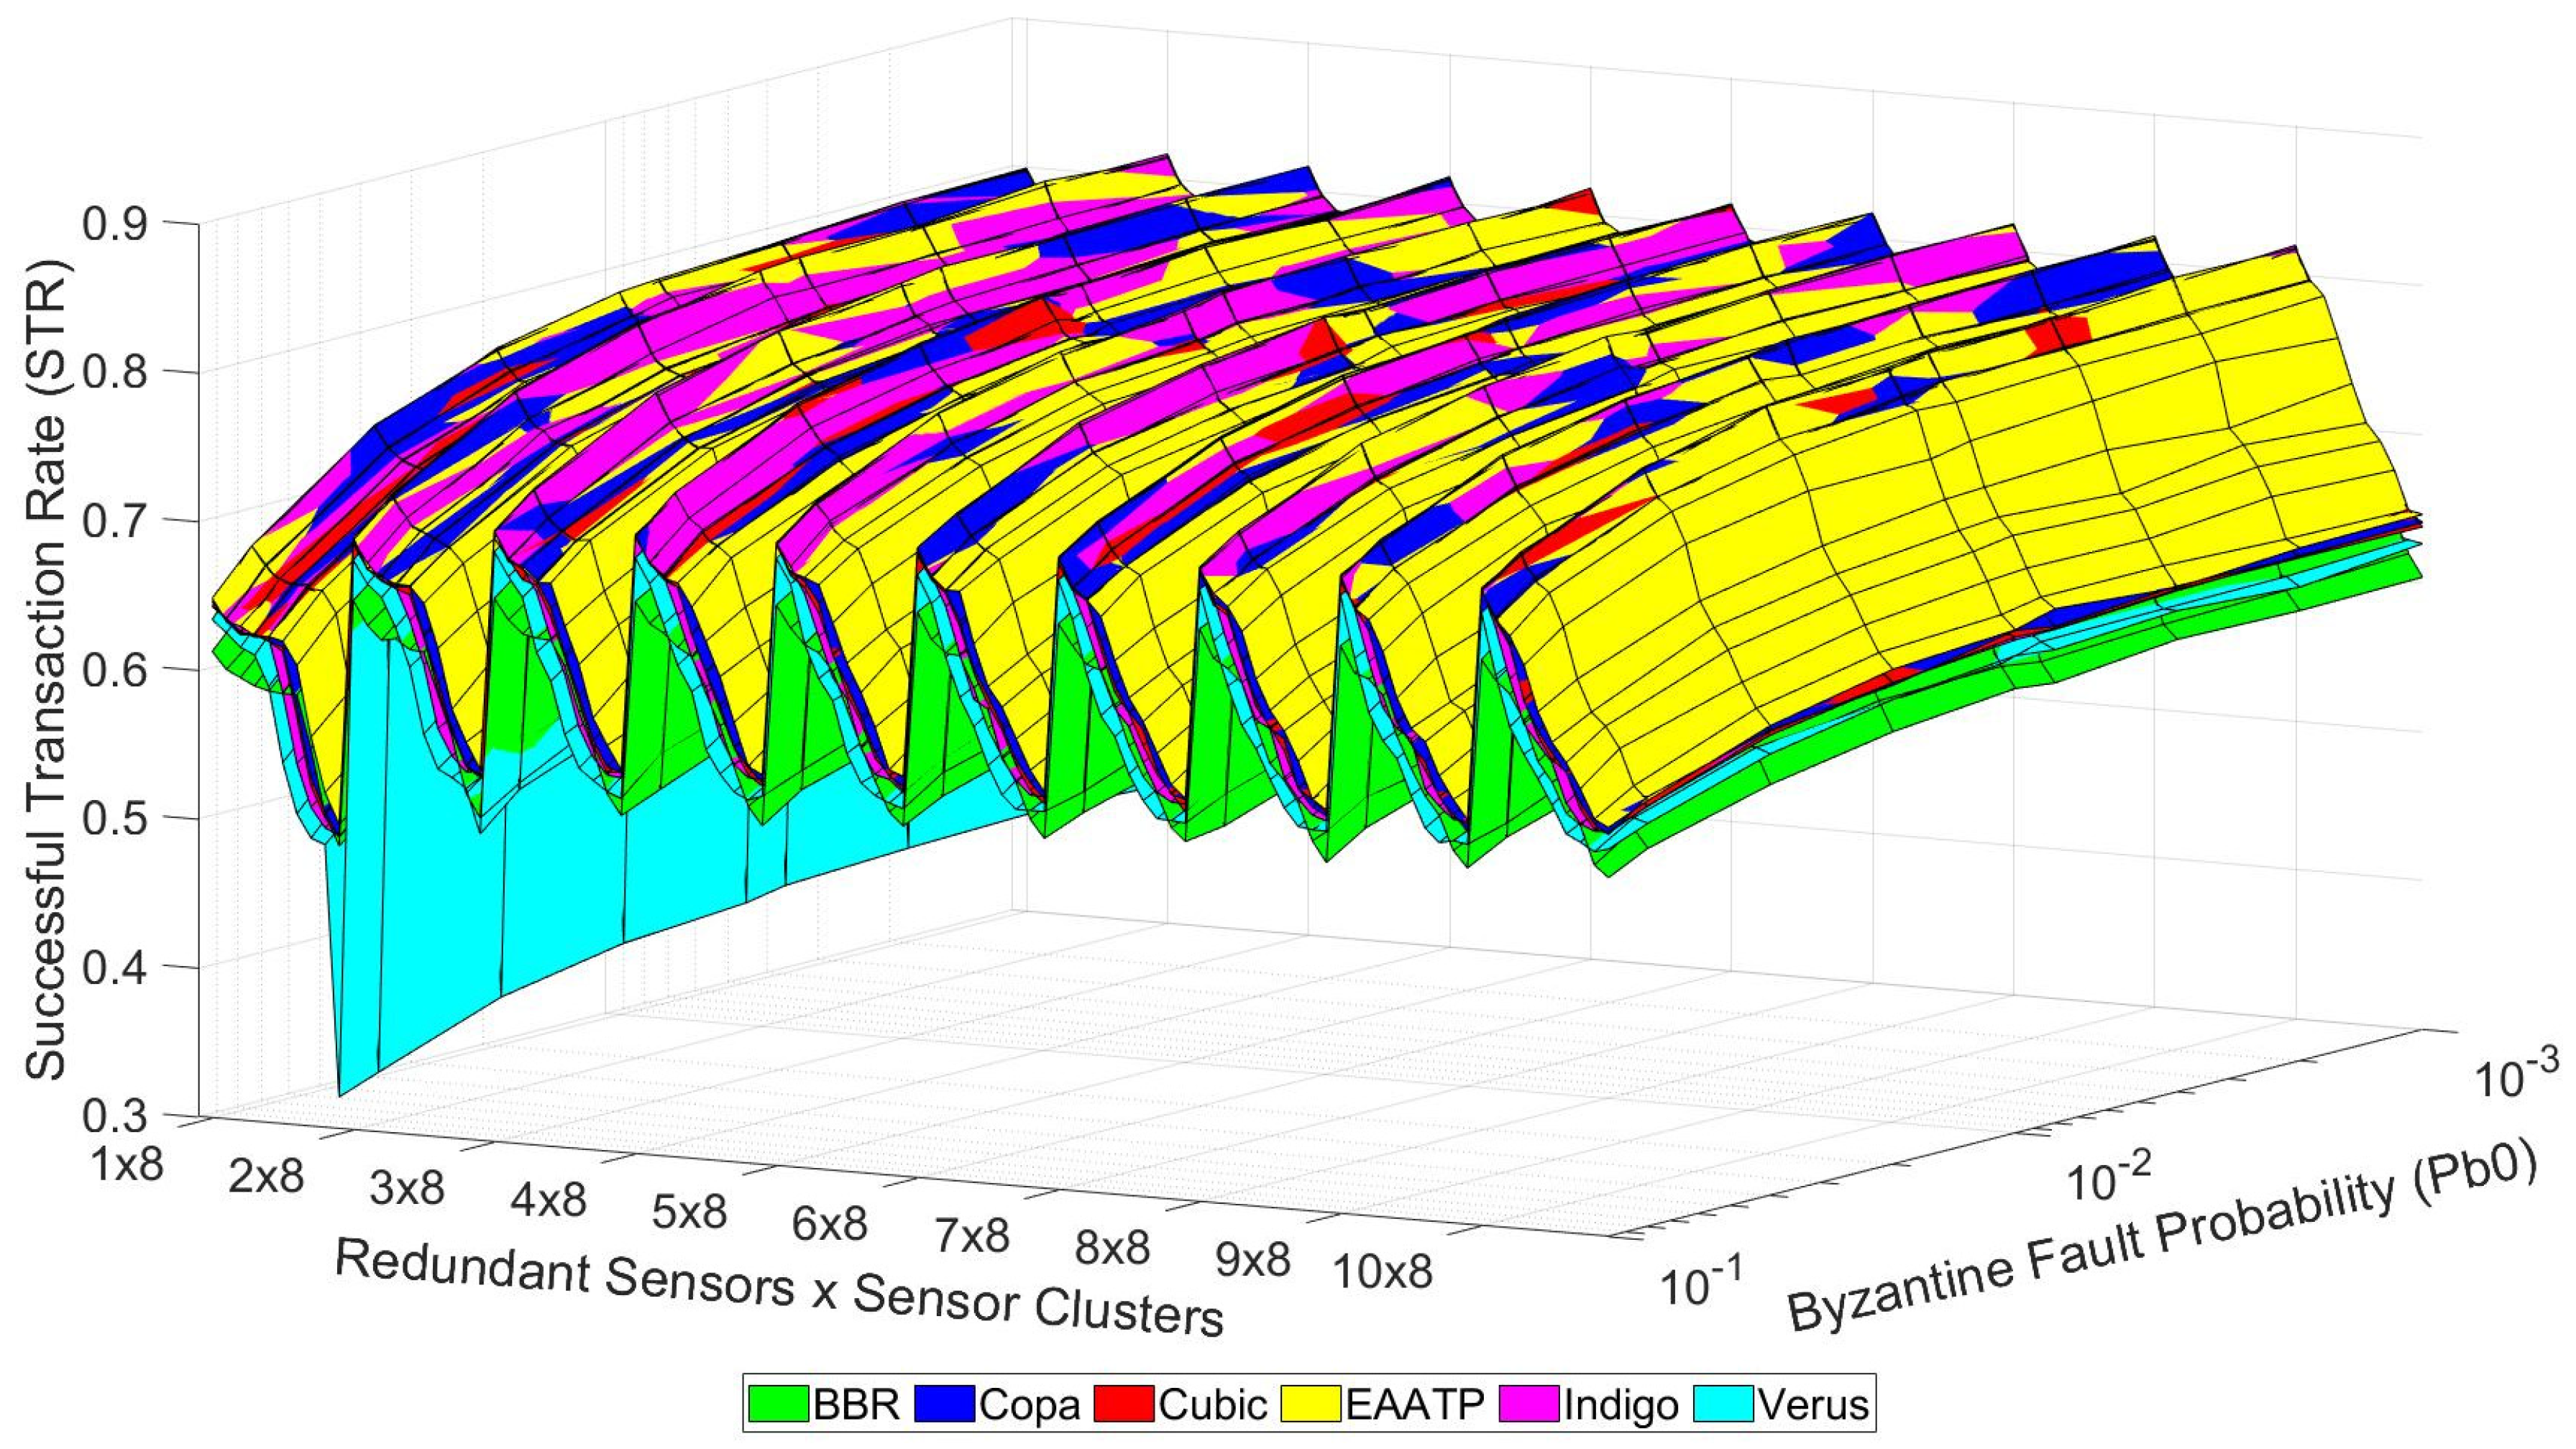
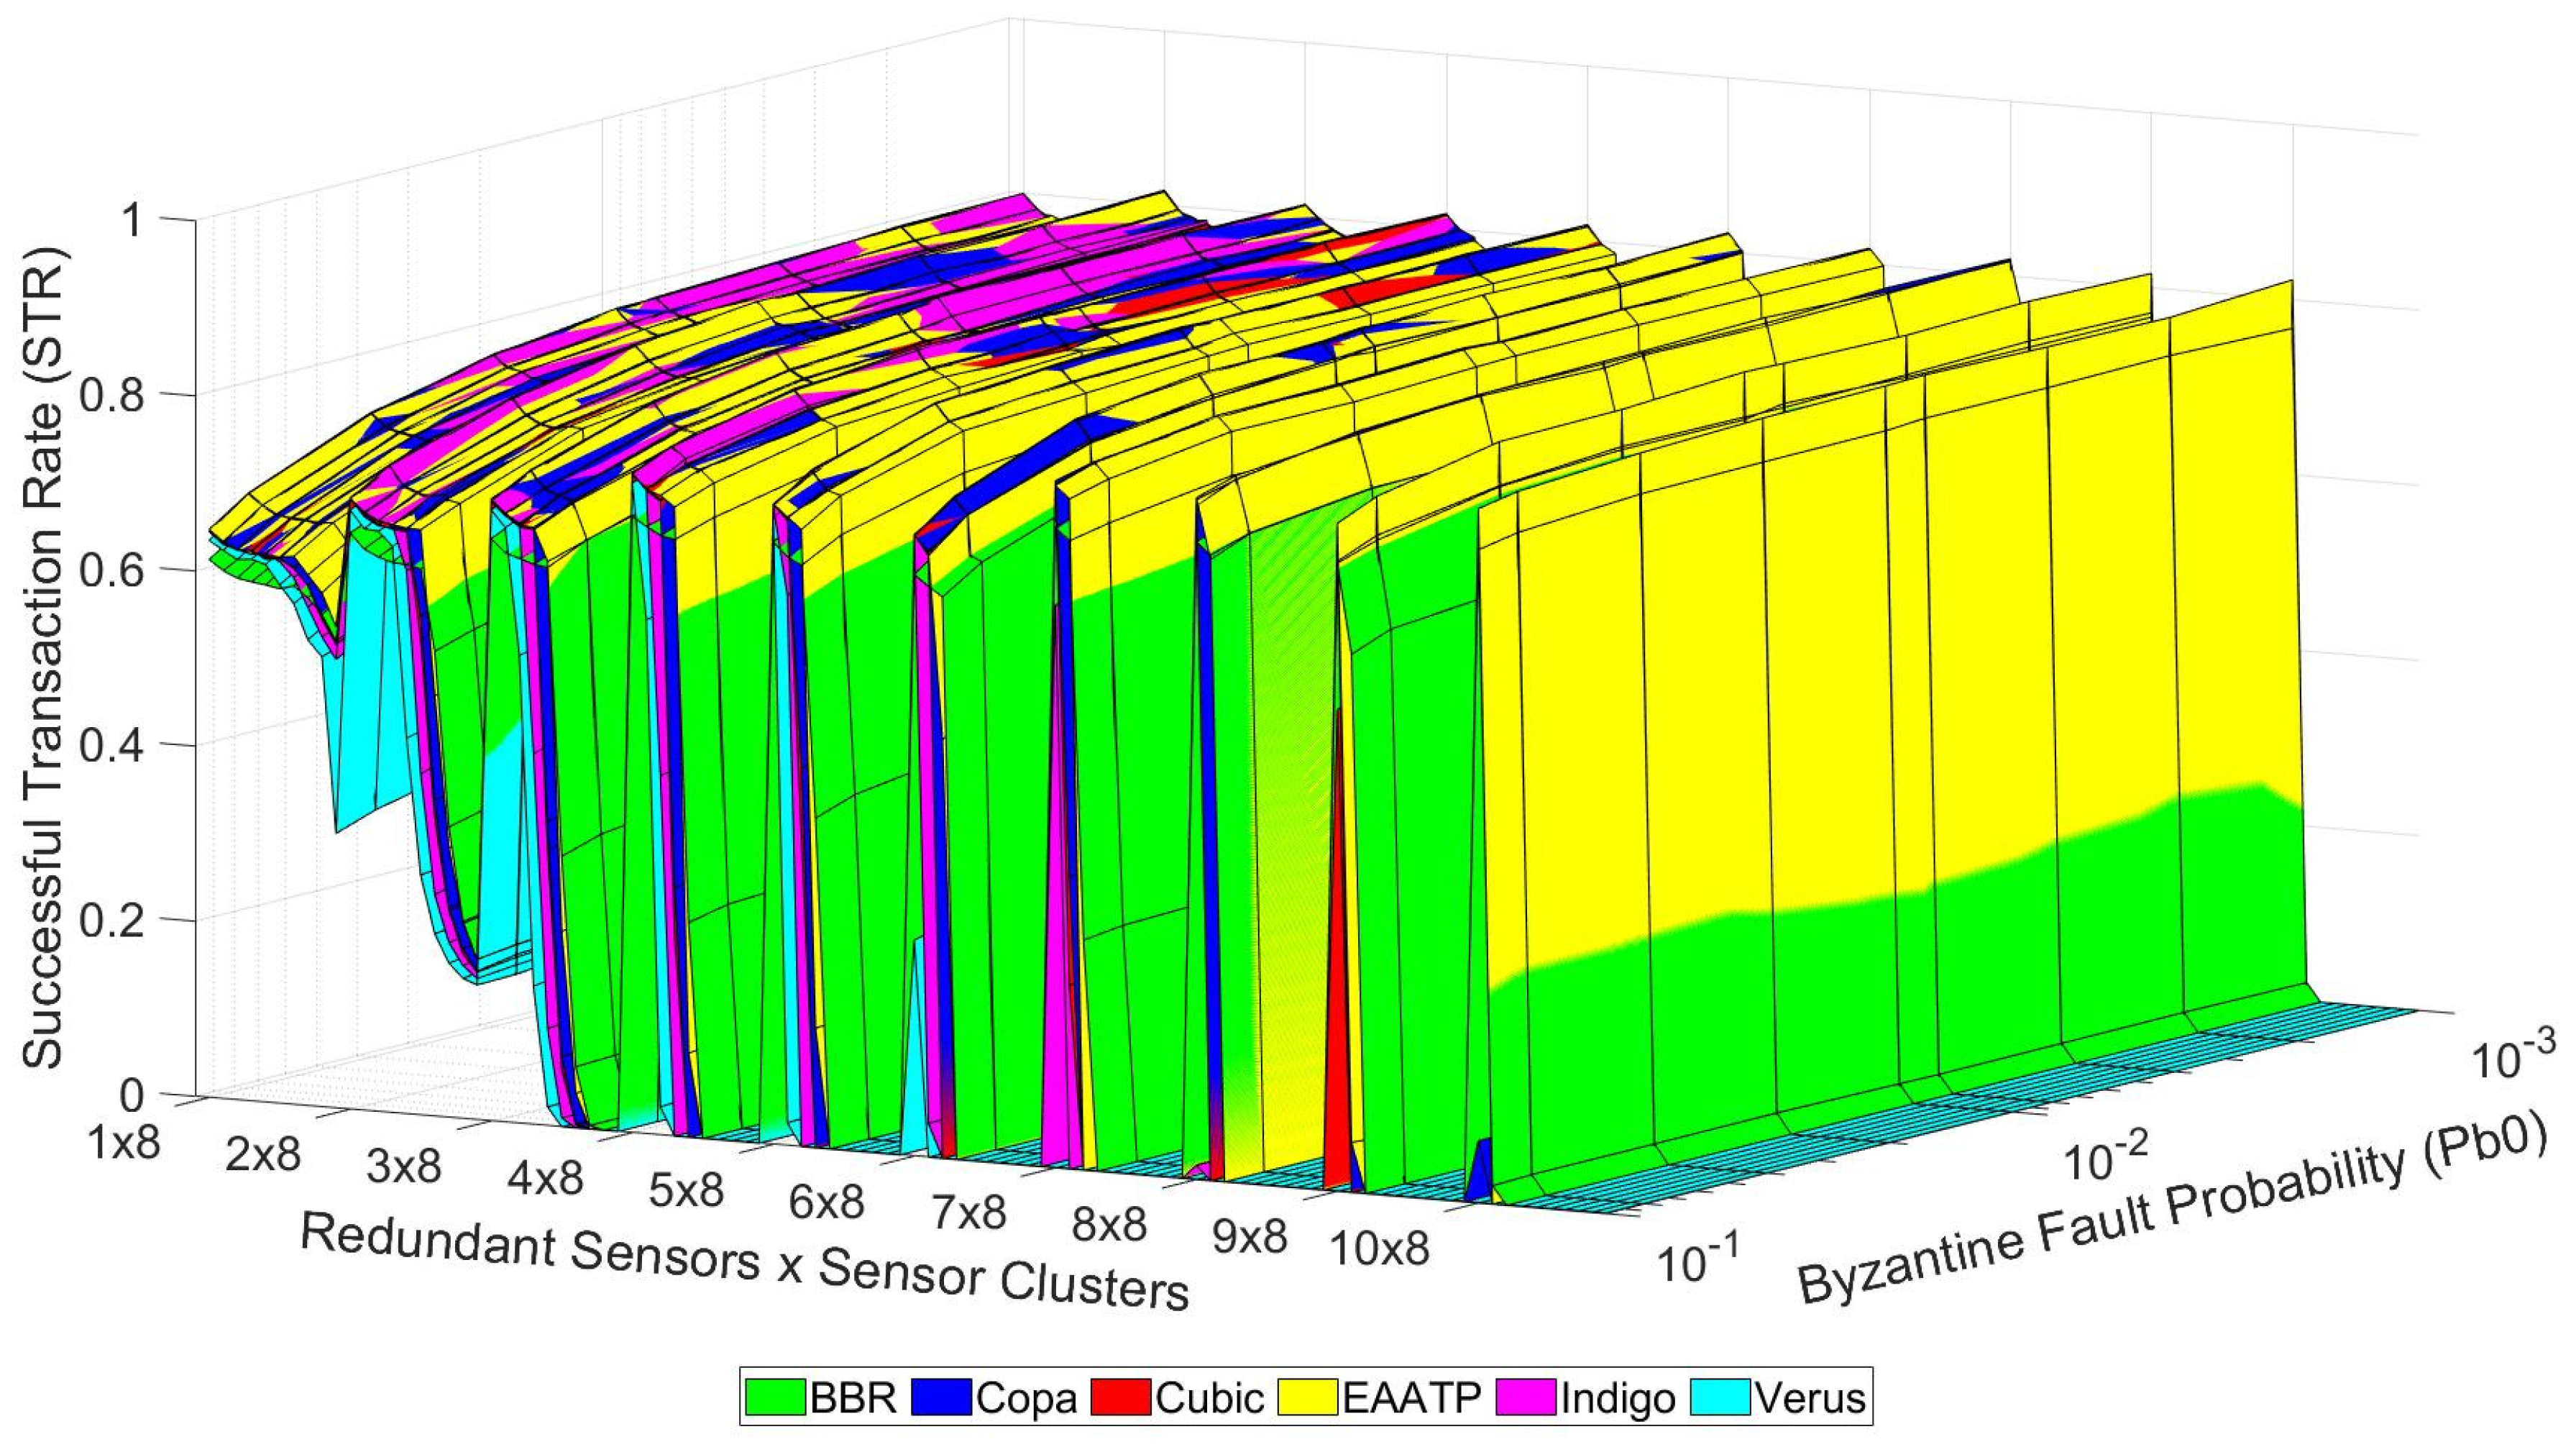
After clarifying how to visualize the data shown in these graphs, we present the tests’ results in the following graphs. Figure 10, Figure 11 and Figure 12 show the trustworthiness mesh for the standard mode, the redundancy mode with social trustworthiness, and the redundancy mode with consensus, respectively. In each graph, the trustworthiness mesh of each transport protocol is superposed with the others in order to visualize which one achieves the highest STR. Moreover, Figure 13 shows the trustworthiness working domain of our telemetry service for an STR higher than 0.7
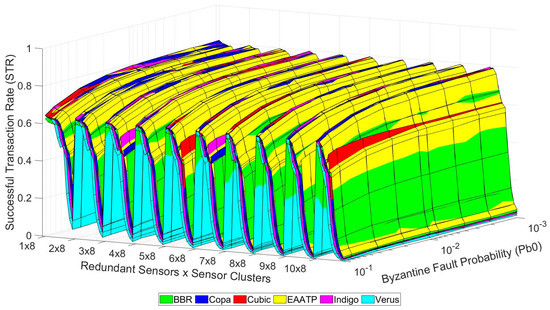
Figure 10.
Trustworthiness mesh (standard mode).
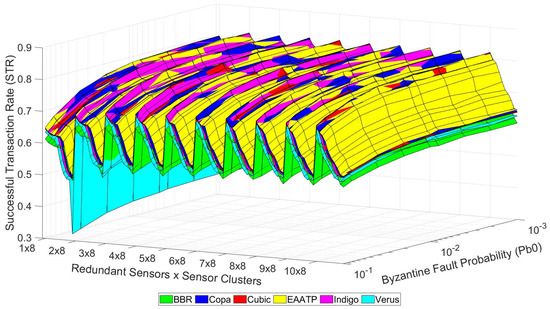
Figure 11.
Trustworthiness mesh (social trustworthiness).
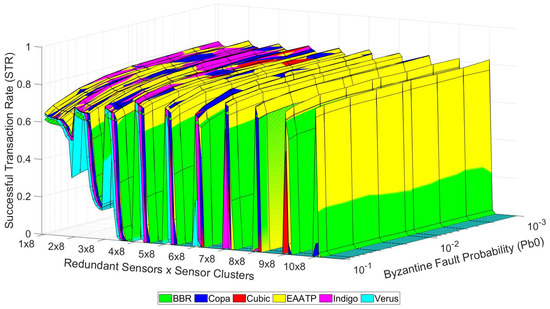
Figure 12.
Trustworthiness mesh (consensus).
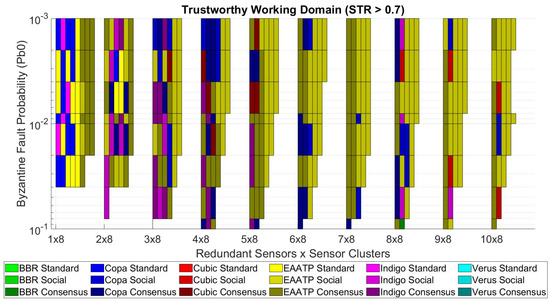
Figure 13.
Trustworthiness working domain requiring STR > 0.7.
7. Discussion
On the one hand, Figure 10, Figure 11 and Figure 12 show that the levels of trustworthiness achieved are similar for all the studied transport protocols with low network load (left side of the mesh and cases with fewer sensor clusters). This fact seems reasonable because we already selected the most suitable and top-performance transport protocols to perform our tests, discarding those that do not adapt well in LFNs. We believe that if other transport protocols less suitable for this kind of network had been tested, the difference in the results would be more evident. However, (1) the levels of BBR and Verus are slightly lower than their competitors, and (2) Copa, Indigo, and EAATP share the highest STR values in the case of low network load, although the predominance of EAATP grows as the network load increases (the yellow mesh is more visible than the others).
On the other hand, we can also see that the redundancy mode with social trustworthiness (Figure 11) is the most robust scenario, given that its STR decrease in high-load situations is less accentuated compared to the other cases (Figure 10 and Figure 12), always maintaining STR values greater than 0.5. Furthermore, it is confirmed that, in general, as the probability of a node experiencing a Byzantine error decreases, the achieved STR values accordingly increase.
From the trustworthiness working domain (Figure 13), we can see the aforementioned predominance of the EAATP. As mentioned in Section 5, the scenario intended to deploy in the next Antarctic campaign was the “7 redundant sensors × 8 sensor clusters”. Concretely, we can check that this case reaches the STR requirement of 0.7 for any Pb0 value.
If we focus on this case, in Figure 13, we can see that the EAATP is the most trustworthy protocol except for the Pb0 = 1 × 10⁻¹ and Pb0 = 8 × 10⁻² cases, in which Copa performs better. Table 3 shows, in detail, the results for the “7 redundant sensors × 8 clusters” case. For each protocol and each Pb0, we show the best STR achieved from the three possible operational modes (standard, social, and consensus). Although Copa, CUBIC, and EAATP have similar results, the latter can outperform Copa and CUBIC between 0.1% and 0.5% better in terms of STR in most cases, and also outperforms up to 7% more than its other competitors. These results confirm our hypothesis, i.e., using a particular transport protocol can directly affect the system’s trustworthiness in our use case.

Table 3.
Best STR achieved by each transport protocol in the “7 redundant sensors × 8 clusters” case. The best STR for each Pb0 is highlighted in bold.
We believe that the EAATP’s superior trustworthiness is caused by the fact that it incorporates a fairness mechanism to share the network bandwidth, which reduces congestion and packet losses. Moreover, EAATP’s congestion control tries to occupy the entire network bandwidth rapidly, and its mechanism to differentiate between random channel losses and congestion losses optimizes its achieved throughput in heavy congestion situations. These features give the EAATP a competitive advantage in terms of performance in our use case, where the DTN opportunistic scheme we use to send accumulated data during the night as a bulk data transfer congests the network.
For these reasons, we decided to use the EAATP as the backbone network transport protocol for our IoT telemetry service that will be deployed in the field during the next Antarctic campaign. Moreover, we can identify which of the three modes best suits the different scenarios which may arise. In general, the standard mode obtains the highest STR values when there is no redundancy (1 × N zone). If redundancy is applied, the consensus solution shows the highest levels of trustworthiness in most cases with a low network load. However, as mentioned before, when the network load increases, the social trustworthiness solution is more robust, achieving the highest STR values for those cases.
Finally, we also propose that the scenario to be deployed is reconsidered. In the “7 redundant sensors × 8 clusters” scenario, each gateway has 56 sensors connected, while only eight different values are sensed, which might be an excessive low efficiency. We propose to switch to the “5 redundant sensors × 16 clusters”. In this case, increasing the number of sensors by 43% (80 sensors per gateway) results in increasing the number of different sensed values by 100% (16 values). Table 4 shows the detailed results for this use case. If we compare the results from Table 3 and Table 4, the latter case achieves slightly worse STR values (which seems evident because we decrease the redundancy and increase the total number of sensors). However, Copa, CUBIC, EAATP, and Indigo still meet the required STR level of 0.7, providing trustworthiness to the service. In this case, we can also confirm the predominance of the EAATP, being the protocol with the highest STR in five of the nine Pb0 cases, while Copa and CUBIC achieve the highest STR in two cases each. Moreover, EAATP outperforms its competitors by up to 5.1%, while in the cases where another protocol outperforms the EAATP, it is only by 0.3% at most. Thus, we believe that the EAATP would also be the most suitable transport protocol to be used in this case.

Table 4.
Best STR achieved by each transport protocol in the “5 redundant sensors × 16 clusters” case. The best STR for each Pb0 is highlighted in bold.
8. Conclusions
This paper analyzes the applicability of the deployment of a remote WSN for the Antarctic region using NVIS technology and the provision of an IoT telemetry service for permafrost studies. This service will be deployed during the 2021–2022 Antarctic campaign of the SHETLAND-NET project. This work focuses on analyzing and comparing transport protocols’ trustworthiness in our remote WSN with DTN use case, which uses LoRa at the access network and NVIS links at the backbone network. Due to certain ionospheric characteristics, NVIS links do not work correctly at night. For this reason, values sensed at night are sent opportunistically to the control center as bulk data when the NVIS channel becomes available, which might cause network congestion. In this situation, the choice to use a particular transport protocol might affect the overall system’s trustworthiness. In order to study the viability of the service to be implemented before its deployment in the field during the Antarctic campaign and in an attempt to compare the performance of various transport protocols, we use our model to measure and evaluate the trustworthiness of the proposed system. This trustworthiness model consists of four layers that can affect the STR trustworthiness metric.
Three operational modes and six transport protocols were analyzed under different conditions using the Riverbed Modeler simulator. The results show a predominance of the EAATP as the most trustworthy transport protocol, while BBR and Verus have the worst trustworthiness. Adding redundancy to the measured values with multiple sensors and applying a social reputational mechanism improves the robustness of the system’s trustworthiness, reaching higher STR values and never dropping below 0.5, even in high-load scenarios. On the contrary, a consensus mechanism improves the system’s trustworthiness if the number of sensors is kept at a low value.
The research group decided to deploy eight clusters for each NVIS gateway and seven GTN-P redundant stations per cluster in the Antarctic campaign. The collected results confirm that this scenario achieves the minimum STR required of 0.7, resulting in a feasible deployment. In this case, the results show that the EAATP can outperform up to 7% of the other analyzed transport protocols in terms of trustworthiness (STR). However, we recommend sacrificing some redundancy (i.e., trustworthiness) and increasing the number of different sensed values, implementing the scenario with 16 clusters and five GTN-P redundant stations. In this case, although slightly worse STR values are achieved, the requirement of achieving at least an STR of 0.7 is met, while more data can be remotely monitored from the control center. The EAATP is also the most trustworthy transport protocol in this case, outperforming its competitors by up to 5.1%. Thus, the research group has decided to use the EAATP as the transport protocol for the offered telemetry service.
Future work aims to (1) study the viability of using the same network architecture to deploy an integrated sensing and communication system (ISAC) capable of using ionosondes as data transmission signals through NVIS; and (2) analyze the implementation of other DTN architectures and protocols to improve the trustworthiness of the entire system in situations when the availability of the NVIS link is not previously known (daytime).
Author Contributions
Conceptualization, A.B., A.M. and A.Z.; methodology, A.M. and A.Z.; software, A.M.; validation, A.B., A.M. and A.Z.; formal analysis, A.M.; investigation, A.M.; resources, A.B., A.M. and A.Z.; data curation, A.M.; writing—original draft preparation, A.M.; writing—review and editing, A.B., A.M. and A.Z.; visualization, A.M.; supervision, A.Z.; project administration, A.Z.; funding acquisition, A.B., A.M. and A.Z. All authors have read and agreed to the published version of the manuscript.
Funding
This research was funded by the “Secretaria d’Universitats i Recerca del Departament d’Empresa i Coneixement de la Generalitat de Catalunya”, the European Union (EU) and the European Social Fund (ESF) [2021 FI_B1 00175]. The research was also funded by the “Agència de Gestió d’Ajuts Universitaris i de Recerca (AGAUR)” of “Generalitat de Catalunya” (grant identification “2017 SGR 977”). This work also received funding from the Spanish Ministry on Science, Innovation and University, the Investigation State Agency and the European Regional Development Fund (ERDF) under the grant number RTI2018-097066-B-I00 (MCIU/AEI/FEDER, UE) for the project ʺNVIS Sensor Network For The South Shetland Islands Archipelagoʺ (SHETLAND-NET).
Institutional Review Board Statement
Not applicable.
Informed Consent Statement
Not applicable.
Data Availability Statement
Data is contained within the article.
Acknowledgments
The authors would like to thank “La Salle-URL” (Universitat Ramon Llull) for their encouragement and assistance.
Conflicts of Interest
The authors declare no conflict of interest.
Abbreviations
The following abbreviations are used in this manuscript:
| AATP | Adaptive and Aggressive Transport Protocol |
| BDP | Bandwidth Delay Product |
| BIC-TCP | Binary Increase Control TCP |
| BNT | Byzantine Node Tolerance |
| BP | Bundle Protocol |
| bps | Bits per second |
| BW | Bandwidth |
| CPS | Cyber Physical System |
| DTN | Delay Tolerant Network |
| DUACK | Duplicated Acknowledgment |
| EAATP | Enhanced AATP |
| FSR | Faulty Sensing Ratio |
| FSV | False Sensed Values |
| GA | General Agreement |
| GTN-P | Ground Terrestrial Network-Permafrost |
| HF | High Frequency |
| H-TCP | High-Speed TCP |
| ICN | Information-Centric Networking |
| IoT | Internet of Things |
| ISAC | Integrated Sensing and Communication System |
| JSCTP | Jitter Stream Control Transmission Protocol |
| LFN | Long Fat Network |
| M2M | Machine to Machine |
| NVIS | Near Vertical Incidence Skywave |
| OSI | Open Systems Interconnection |
| PBFT | Practical Byzantine Fault Tolerance |
| PCC | Performance-oriented Congestion Control |
| PDR | Packet Delivery Ratio |
| QoS | Quality of Service |
| RFC | Request For Comments |
| RTT | Round-Trip Time |
| SACK | Selective Acknowledgment |
| SIoT | Social Internet of Things |
| S-TCP | Scalable TCP |
| ST | Successful Transactions |
| STR | Successful Transaction Rate |
| TCP | Transmission Control Protocol |
| TSV | Total Sensed Values |
| TT | Total Transactions |
| WSN | Wireless Sensor Network |
References
- Kennicutt, M.C.; Kim, Y.D.; Rogan-Finnemore, M.; Anandakrishnan, S.; Chown, S.L.; Colwell, S.; Cowan, D.; Escutia, C.; Frenot, Y.; Hall, J.; et al. Delivering 21st century Antarctic and Southern Ocean science. Antarct. Sci. 2016, 28, 407–423. [Google Scholar] [CrossRef] [Green Version]
- Alsina-Pagès, R.M.; Hervás, M.; Orga, F.; Pijoan, J.L.; Badia, D.; Altadill, D. Physical layer definition for a long-haul HF antarctica to Spain radio link. Remote Sens. 2016, 8, 380. [Google Scholar] [CrossRef] [Green Version]
- Porte, J.; Maso, J.M.; Pijoan, J.L.; Badia, D. Sensing System for Remote Areas in Antarctica. Radio Sci. 2020, 55, 1–12. [Google Scholar] [CrossRef]
- Male, J.; Porte, J.; Gonzalez, T.; Maso, J.M.; Pijoan, J.L.; Badia, D. Analysis of the Ordinary and Extraordinary Ionospheric Modes for NVIS Digital Communications Channels. Sensors 2021, 21, 2210. [Google Scholar] [CrossRef] [PubMed]
- Briones, A.; Mallorquí, A.; Zaballos, A.; de Pozuelo, R.M. Adaptive and aggressive transport protocol to provide QoS in cloud data exchange over Long Fat Networks. Futur. Gener. Comput. Syst. 2021, 115, 34–44. [Google Scholar] [CrossRef]
- Gonzalez, T.; Porte, J.; Pijoan, J.L.; Badia, D.; Male, J.; Navarro, J.; Maso, J.M. SC-FDE Layer for Sensor Networks in Remote Areas Using NVIS Communications. Electronics 2021, 10, 1636. [Google Scholar] [CrossRef]
- Mallorquí, A.; Zaballos, A. A heterogeneous layer-based trustworthiness model for long backhaul nvis challenging networks and an iot telemetry service for antarctica. Sensors 2021, 21, 3446. [Google Scholar] [CrossRef]
- Bounsiar, S.; Benhamida, F.Z.; Henni, A.; de Ipiña, D.L.; Mansilla, D.C. How to Enable Delay Tolerant Network Solutions for Internet of Things: From Taxonomy to Open Challenges. Proceedings 2019, 31, 24. [Google Scholar] [CrossRef] [Green Version]
- de Pablo Hernández, M.Á.; Jiménez, J.J.; Ramos, M.; Prieto, M.; Molina, A.; Vieira, G.; Hidalgo, M.A.; Fernández, S.; Recondo, C.; Calleja, J.F.; et al. Frozen ground and snow cover monitoring in livingston and deception islands, antarctica: Preliminary results of the 2015–2019 PERMASNOW project. Geogr. Res. Lett. 2020, 46, 187–222. [Google Scholar] [CrossRef] [Green Version]
- Location Map of Low Island in the South Shetland Islands. Available online: https://en.wikipedia.org/wiki/Low_Island_(South_Shetland_Islands)#/media/File:Low-Island-location-map.png (accessed on 2 September 2021).
- Briones, A.; Mallorquí, A.; Zaballos, A.; de Pozuelo, R.M. Wireless loss detection over fairly shared heterogeneous long fat networks. Electronics 2021, 10, 987. [Google Scholar] [CrossRef]
- Rodrigues, J.J.P.C. (Ed.) Advances in Delay-Tolerant Networks (DTNs): Architecture and Enhanced Performance, 2nd ed.; Woodhead Publishing: Sawston, UK, 2020. [Google Scholar]
- Burleigh, S.; Hooke, A.; Torgerson, L.; Fall, K.; Cerf, V.; Durst, B.; Scott, K.; Weiss, H. Delay-tolerant networking: An approach to interplanetary internet. IEEE Commun. Mag. 2003, 41, 128–136. [Google Scholar] [CrossRef] [Green Version]
- Partan, J.; Kurose, J.; Levine, B.N. A Survey of Practical Issues in Underwater Networks. ACM SIGMOBILE Mob. Comput. Commun. Rev. 2007, 11, 23–33. [Google Scholar] [CrossRef] [Green Version]
- Tovar, A.; Friesen, T.; Ferens, K.; McLeod, B. A DTN wireless sensor network for wildlife habitat monitoring. In Proceedings of the Canadian Conference on Electrical and Computer Engineering, Calgary, AB, Canada, 2–5 May 2010; pp. 1–5. [Google Scholar] [CrossRef]
- Matsuzaki, R.; Ebara, H.; Muranaka, N. Rescue support system with DTN for earthquake disasters. IEICE Trans. Commun. 2015, E98B, 1832–1847. [Google Scholar] [CrossRef] [Green Version]
- Soares, V.N.G.J.; Farahmand, F.; Rodrigues, J.J.P.C. A layered architecture for Vehicular Delay-Tolerant Networks. In Proceedings of the 2009 IEEE Symposium on Computers and Communications, Sousse, Tunísia, 5–8 July 2009; pp. 122–127. [Google Scholar] [CrossRef] [Green Version]
- Scott, K.L.; Burleigh, S. Bundle Protocol Specification. Available online: https://tools.ietf.org/html/rfc5050 (accessed on 20 September 2021).
- Penning, A.; Baumgärtner, L.; Höchst, J.; Sterz, A.; Mezini, M.; Freisleben, B. DTN7: An Open-Source Disruption-Tolerant Networking Implementation of Bundle Protocol 7. In Proceedings of the International Conference on Ad-Hoc Networks and Wireless, LNCS, Luxembourg, 1–3 October 2019; Springer: Basel, Switzerland; Volume 11803, pp. 196–209. [Google Scholar]
- Schildt, S.; Morgenroth, J.; Pöttner, W.B.; Wolf, L. IBR-DTN: A lightweight, modular and highly portable Bundle Protocol implementation. Electron. Commun. EASST 2011, 37. [Google Scholar] [CrossRef]
- Von Zengen, G.; Büsching, F.; Pöttner, W.-B.; Wolf, L. An Overview of µDTN: Unifying DTNs and WSNs. In Proceedings of the 11th GI/ITG KuVS Fachgespräch Drahtlose Sensornetze (FGSN), Darmstadt, Germany, 13 September 2012; pp. 1–4. [Google Scholar]
- Al-Turjman, F.M.; Al-Fagih, A.E.; Alsalih, W.M.; Hassanein, H.S. A delay-tolerant framework for integrated RSNs in IoT. Comput. Commun. 2013, 36, 998–1010. [Google Scholar] [CrossRef]
- Guo, Z.; Wang, B.; Cui, J.H. Generic prediction assisted single-copy routing in underwater delay tolerant sensor networks. Ad Hoc Netw. 2013, 11, 1136–1149. [Google Scholar] [CrossRef]
- Wong, K.S.; Wan, T.C. Reliable Multicast Disruption Tolerant Networking: Conceptual Implementation Using Message Ferry. In Proceedings of the IEEE Region 10 Annual International Conference, Proceedings/TENCON, Penang, Malaysia, 5–8 November 2017; pp. 1817–1822. [Google Scholar]
- Mao, Y.; Zhou, C.; Ling, Y.; Lloret, J. An optimized probabilistic delay tolerant network (DTN) routing protocol based on scheduling mechanism for internet of things (IoT). Sensors 2019, 19, 243. [Google Scholar] [CrossRef] [Green Version]
- Guo, B.; Zhang, D.; Wang, Z.; Yu, Z.; Zhou, X. Opportunistic IoT: Exploring the harmonious interaction between human and the internet of things. J. Netw. Comput. Appl. 2013, 36, 1531–1539. [Google Scholar] [CrossRef]
- Xu, Y.; Mahendran, V.; Radhakrishnan, S. Internet of Hybrid Opportunistic Things: A Novel Framework for Interconnecting IoTs and DTNs. In Proceedings of the 2016 IEEE Conference on Computer Communications Workshops (INFOCOM WKSHPS), San Francisco, CA, USA, 10–14 April 2016; pp. 1067–1068. [Google Scholar] [CrossRef]
- Elmangoush, A.; Corici, A.; Catalan, M.; Steinke, R.; Magedanz, T.; Oller, J. Interconnecting Standard M2M Platforms to Delay Tolerant Networks. In Proceedings of the Proceedings-2014 International Conference on Future Internet of Things and Cloud, FiCloud 2014, Barcelona, Spain, 27–29 August 2014; pp. 258–263. [Google Scholar]
- Sathiaseelan, A.; Trossen, D.; Komnios, I.; Ott, J.; Crowcroft, J. Information Centric Delay Tolerant Networking: An Internet Architecture for the Challenged; University of Cambridge: Cambridge, UK, 2013. [Google Scholar]
- Manzoni, P.; Hernández-Orallo, E.; Calafate, C.T.; Cano, J.C. A Proposal for a Publish/Subscribe, Disruption Tolerant Content Island for Fog Computing. In Proceedings of the SMARTOBJECTS 2017-Proceedings of the 3rd Workshop on Experiences with the Design and Implementation of Smart Objects, Co-Located with MobiCom 2017, Snowbird, UT, USA, 16 October 2017; pp. 47–52. [Google Scholar]
- Kazmi, M.; Shamim, A.; Wahab, N.; Anwar, F. Comparison of TCP Tahoe, Reno, New Reno, Sack and Vegas in IP and MPLS Networks under Constant Bit Rate Traffic. In Proceedings of the International Conference on Advanced Computational Technology and Creative Media (ICACTCM), Pattaya, Thailand, 14–15 August 2014; pp. 33–38. [Google Scholar]
- Kelly, T. Scalable TCP: Improving performance in highspeed wide area networks. ACM SIGCOMM Comput. Commun. Rev. 2003, 33, 83–91. [Google Scholar] [CrossRef]
- Jin, C.; Wei, D.X.; Low, S.H. FAST TCP: Motivation, Architecture, Algorithms, Performance. IEEE/ACM Trans. Netw. 2006, 14, 1246–1259. [Google Scholar] [CrossRef] [Green Version]
- Leith, D.; Shorten, R. H-TCP Protocol for High-Speed Long-Distance Networks. In Proceedings of the PFLDnet, Argonne, IL, USA, 16–17 February 2004. [Google Scholar]
- Xu, L.; Harfoush, K.; Rhee, I. Binary Increase Congestion Control (BIC) for Fast Long-Distance Networks. In Proceedings of the IEEE INFOCOM 2004, Hong Kong, China, 7–11 March 2004; Volume 4, pp. 2514–2524. [Google Scholar]
- Ha, S.; Rhee, I.; Xu, L. Cubic: A new TCP-friendly high-speed TCP variant. ACM SIGOPS Oper. Syst. Rev. 2008, 42, 64–74. [Google Scholar] [CrossRef]
- Dong, M.; Li, Q.; Zarchy, D.; Godfrey, P.B.; Schapira, M. PCC: Re-Architecting Congestion Control for Consistent High Performance. In Proceedings of the 12th USENIX Symposium on Networked Systems Design and Implementation (NSDI’15), Oakland, CA, USA, 4–6 May 2015; pp. 395–408. [Google Scholar]
- Fu, C.P.; Liew, S.C. TCP Veno: TCP Enhancement for Transmission Over Wireless Access Networks. IEEE J. Sel. Areas Commun. 2003, 21, 216–228. [Google Scholar]
- Grieco, L.A.; Mascolo, S. Performance evaluation and comparison of Westwood+, New Reno, and Vegas TCP congestion control. ACM SIGCOMM Comput. Commun. Rev. 2004, 34, 25–38. [Google Scholar] [CrossRef]
- Kanagarathinam, M.R.; Singh, S.; Sandeep, I.; Roy, A.; Saxena, N. D-TCP: Dynamic TCP Congestion Control Algorithm for next Generation Mobile Networks. In Proceedings of the 15th IEEE Annual Consumer Communications & Networking Conference (CCNC), Las Vegas, NV, USA, 12–15 January 2018; pp. 1–6. [Google Scholar] [CrossRef]
- Wu, E.H.K.; Huang, Y.U.C.; Chang, G.K. EJTCP: Enhanced Jitter-based TCP for Wireless Broadband Networks. J. Inf. Sci. Eng. 2007, 23, 1663–1679. [Google Scholar]
- Chen, J.M.; Chu, C.H.; Wu, E.H.K.; Tsai, M.F.; Wang, J.R. Improving SCTP performance by jitter-based congestion control over wired-wireless networks. Eurasip J. Wirel. Commun. Netw. 2011, 2011, 103027. [Google Scholar] [CrossRef] [Green Version]
- Cardwell, N.; Cheng, Y.; Gunn, C.S.; Yeganeh, S.H.; Jacobson, V. BBR: Congestion-Based Congestion Control. Queue 2016, 14, 20–53. [Google Scholar] [CrossRef]
- Arun, V.; Balakrishnan, H.; Csail, M.I.T.; Design, S.; Nsdi, I. Copa: Practical Delay-Based Congestion Control for the Internet. In Proceedings of the 15th USENIX Symposium on Networked Systems Design and Implementation (NSDI’18), Renton, WA, USA, 9–11 April 2018; pp. 329–342. [Google Scholar]
- Yan, F.Y.; Ma, J.; Hill, G.D.; Raghavan, D.; Wahby, R.S.; Levis, P.; Winstein, K. Pantheon: The Training Ground for Internet Congestion-Control Research. In Proceedings of the 2018 USENIX Annual Technical Conference, USENIX ATC 2018, Boston, MA, USA, 11–13 July 2020; pp. 731–743. [Google Scholar]
- Zaki, Y.; Pötsch, T.; Chen, J.; Subramanian, L.; Görg, C. Adaptive Congestion Control for Unpredictable Cellular Networks. Comput. Commun. Rev. 2015, 45, 509–522. [Google Scholar] [CrossRef]
- Crawford, M.; Liongosary, E. The Industrial Internet of Things Consortium. IIC J. Innov. 2018, 9, 1–141. [Google Scholar]
- Junior, F.M.R.; Kamienski, C.A. A Survey on Trustworthiness for the Internet of Things. IEEE Access 2021, 9, 42493–42514. [Google Scholar] [CrossRef]
- Labib, N.S.; Brust, M.R.; Danoy, G.; Bouvry, P. Trustworthiness in IoT-A Standards Gap Analysis on Security, Data Protection and Privacy. In Proceedings of the 2019 IEEE Conference on Standards for Communications and Networking (CSCN), Granada, Spain, 28–30 October 2019; pp. 1–7. [Google Scholar] [CrossRef]
- Haron, N.; Jaafar, J.; Aziz, I.A.; Hassan, M.H.; Shapiai, M.I. Data Trustworthiness in Internet of Things: A Taxonomy and Future Directions. In Proceedings of the 2017 IEEE Conference on Big Data and Analytics (ICBDA), Kuching, Malaysia, 16–17 November 2017; pp. 25–30. [Google Scholar]
- Zhang, G.; Li, R. Fog computing architecture-based data acquisition for WSN applications. China Commun. 2017, 14, 69–81. [Google Scholar] [CrossRef]
- Fantacci, R.; Nizzi, F.; Pecorella, T.; Pierucci, L.; Roveri, M. False Data Detection for Fog and Internet of Things Networks. Sensors 2019, 19, 4235. [Google Scholar] [CrossRef] [Green Version]
- Hassan, M.M.; Gumaei, A.; Huda, S.; Almogren, A. Increasing the Trustworthiness in the Industrial IoT Networks through a Reliable Cyberattack Detection Model. IEEE Trans. Ind. Inform. 2020, 16, 6154–6162. [Google Scholar] [CrossRef]
- Bioglio, V.; Condo, C.; Land, I. Design of Polar Codes in 5G New Radio. IEEE Commun. Surv. Tutor. 2021, 23, 29–40. [Google Scholar] [CrossRef] [Green Version]
- Alahari, H.P.; Yalavarthi, S.B. A Survey on Network Routing Protocols in Internet of Things (IOT). Int. J. Comput. Appl. 2017, 160, 18–22. [Google Scholar] [CrossRef]
- Li, J.; Li, X.; Cheng, X.; Yuan, J.; Zhang, R. A trustworthiness-enhanced reliable forwarding scheme in mobile Internet of Things. J. Netw. Comput. Appl. 2019, 140, 40–53. [Google Scholar] [CrossRef]
- Atzori, L.; Iera, A.; Morabito, G. SIoT: Giving a Social Structure to the Internet of Things. IEEE Commun. Lett. 2011, 15, 1193–1195. [Google Scholar] [CrossRef]
- Caballero, V.; Vernet, D.; Zaballos, A. Social Internet of Energy-A New Paradigm for Demand Side Management. IEEE Internet Things J. 2019, 6, 9853–9867. [Google Scholar] [CrossRef]
- Nitti, M.; Girau, R.; Atzori, L. Trustworthiness Management in the Social Internet of Things. IEEE Trans. Knowl. Data Eng. 2013, 26, 1253–1266. [Google Scholar] [CrossRef]
- Marche, C.; Nitti, M. Trust-Related Attacks and Their Detection: A Trust Management Model for the Social IoT. IEEE Trans. Netw. Serv. Manag. 2021, 18, 3297–3308. [Google Scholar] [CrossRef]
- Lin, Z.; Dong, L. Clarifying Trust in Social Internet of Things. IEEE Trans. Knowl. Data Eng. 2018, 30, 234–248. [Google Scholar] [CrossRef] [Green Version]
- Azad, M.A.; Bag, S.; Hao, F.; Shalaginov, A. Decentralized Self-Enforcing Trust Management System for Social Internet of Things. IEEE Internet Things J. 2020, 7, 2690–2703. [Google Scholar] [CrossRef]
- Bodkhe, U.; Mehta, D.; Tanwar, S.; Bhattacharya, P.; Singh, P.K.; Hong, W.C. A survey on decentralized consensus mechanisms for cyber physical systems. IEEE Access 2020, 8, 54371–54401. [Google Scholar] [CrossRef]
- All about Moteino | LowPowerLab. Available online: https://lowpowerlab.com/guide/moteino/ (accessed on 21 September 2021).
- Gaelens, J.; Van Torre, P.; Verhaevert, J.; Rogier, H. Lora mobile-to-base-station channel characterization in the Antarctic. Sensors 2017, 17, 1903. [Google Scholar] [CrossRef] [Green Version]
- Fang, Y.; Chen, P.; Cai, G.; Lau, F.C.M.; Liew, S.C.; Han, G. Outage-limit-approaching channel coding for future wireless communications: Root-protograph low-density parity-check codes. IEEE Veh. Technol. Mag. 2019, 14, 85–93. [Google Scholar] [CrossRef]
- Pan, X.; Di Maio, F.; Zio, E. A Benchmark of Dynamic Reliability Methods for Probabilistic Safety Assessment. In Proceedings of the 2017 2nd International Conference on System Reliability and Safety (ICSRS), Milan, Italy, 20–22 December 2017; pp. 82–90. [Google Scholar]
- Castro, M.; Liskov, B. Practical Byzantine Fault Tolerance and Proactive Recovery. ACM Trans. Comput. Syst. 2002, 20, 398–461. [Google Scholar] [CrossRef]
Publisher’s Note: MDPI stays neutral with regard to jurisdictional claims in published maps and institutional affiliations. |
© 2021 by the authors. Licensee MDPI, Basel, Switzerland. This article is an open access article distributed under the terms and conditions of the Creative Commons Attribution (CC BY) license (https://creativecommons.org/licenses/by/4.0/).

