Article

Accuracy of Copernicus Altimeter Water Level Data in Italian Rivers Accounting for Narrow River Sections

1
Department of Civil and Environmental Engineering, Politecnico di Milano, 20133 Milano, Italy
2
Finnish Meteorological Institute, 00560 Helsinki, Finland
3
Autorità di Bacino del Fiume Po, 43121 Parma, Italy
4
Collect Localisation Satellites, 31520 Ramonville Saint-Agne, France
*
Author to whom correspondence should be addressed.
Remote Sens. 2021, 13(21), 4456; https://doi.org/10.3390/rs13214456
Submission received: 25 August 2021 / Revised: 23 October 2021 / Accepted: 28 October 2021 / Published: 5 November 2021

Abstract

:
Information about water level is essential for hydrological monitoring and flood/drought risk assessment. In a large part of Italian river network, in situ instruments for measuring water level are rare or lacking. Here we consider the satellite measurements of water level retrieved by Copernicus altimetric missions (Sentinel 3A, Sentinel 3B, Jason 2/3), and compare these with in situ data, from 19 gauging stations in Italy with a river section in the range of [50, 555] m. The results highlight the potentiality of altimetric satellite measurements for water level retrieval in a case study of Italian rivers. By comparing synchronous satellite and in situ water level difference (i.e., difference between two successive measurements in time of satellite data compared to the difference of two successive measurements in time of in situ data), we found a median value of Pearson correlation of 0.79 and 0.37 m of RMSE. Then, from water level differences, we extracted the satellite water level values with two different procedures: (1) assuming as the initial water level of the satellite measurements the first joint measurement (satellite–in situ data) and (2) calibrating the initial water level, minimizing the mean absolute error metric. The results show the feasibility of using satellite data for water level retrieval in an operative and automatic perspective.

Graphical Abstract

1. Introduction

Floods and droughts are widespread natural hazards that cause a huge amount of damage every year worldwide [1]. The increasing economic and life losses due to these hazards evidence that its risk is a crucial theme [2]. Italy is one of the European countries for which this topic is more urgent. The ISPRA (2018) report states that 71.1% of the municipalities are interested by a medium or high flood hazard; in terms of areas interested, 4.1% (12,405 km 2 ) of Italian territory is classified as a highest-hazard zone; 8.4% (25,398 km 2 ) as a medium-hazard zone; and 10.9% (32,961 km 2 ) as low hazard zone, with 6M people potentially impacted by flood risk [3].
Among the best practices for risk reduction and mitigation there are the early warnings and forecast systems that underline the need of a robust meteo-hydro monitoring system [4]. An extended system of flood/drought monitoring based both on meteorological (pluviometric) and hydrometric measurements is necessary for setting forecast and warning systems. Monitoring the flow discharge at specific sections of a river is essential to quantify the outputs of a catchment [5]. This is crucial for assessing effective water management procedures, from flood risk estimation to water resource management [5]. Although the importance of river monitoring is clear, a large part of Italian rivers is not monitored. In Italy, there are a total of 1276 hydrometric sensors. Among them, 747 also provide measurements of discharge [6]. Forty-six percent (588) of the total is located in the northern part [7]. There is a great portion of territory where the traditional hydrometric sensors are decommissioned, or absent, such as remote and mountain areas. Increasing the hydrometric measurements by also using non-traditional sensors can be useful for the alert system, to monitor the territory.
Satellites provide non traditional widespread and common measurements exploited in different fields: agriculture [8,9], landslide mapping [10], rainfall [11], soil humidity [12], snow [13,14], water level [15], water quality [16], and other hydrological and natural hazard applications. Water surface height can be obtained through measurement of satellite radar echo return time, with the radar altimeter instrumentation [17,18]. Water level derived from satellite altimetry can be useful for different types of hydrological purposes. Radar altimetry can be used for monitoring the water level and the volume variation of lakes and reservoirs [19,20,21,22,23], which are key components of the water cycle. Another possible application is the estimation of river discharge exploiting the altimeter data in Rating Curve models [24,25,26,27].
The first satellite missions using radar altimeters started in the 1970s, with the primary objective of measuring sea level and ocean surface topography. Satellite altimetric data from Poseidon and successive missions such as Jason 1 (2001) and Envisat (2002) provided excellent water level evaluations for large water bodies such as lakes and inland sea [28,29,30]. The results achieved for water lakes and inland sea showed the potential use of satellite altimetric data for both easily accessibility and large spatial coverage [28,29]. The satellite altimetric data can be a good complementary source of information for ground-based networks and can supply where gauges are missing [28,31]. For lakes and inland water, the quality assessment and in situ validation of satellite altimeter data have been quite widely explored [32,33], as good performance has also been found for the largest river [34,35,36,37]. The assessment of radar altimeter on rivers has been more problematic for the smallest river and is dependent on river width. Birkett et al. (2002) assessed the ability of the radar altimeter derived from the TOPEX/POSEIDON dataset to monitor the surface water height for a selection of rivers in the Amazon basin. In their work, they set a minimum theoretical river width at 1.16 km [38]. Joecila Santos et al. (2010) performed in situ comparison considering ERS2 and ENVISAT radar altimetry missions, also including narrow riverbeds (till to 0.05 km), finding that the river reach did not appear as a factor strongly affecting the quality of results. Therefore, high-quality series can also be collected on very narrow reaches (<1 km) [39].
In 2016, a new mission, Sentinel 3A, was launched operating with a nadir Satellite Radar ALtimeter (SRAL) [40]. The sentinel 3 mission provides higher spatial resolution and lower noise with respect to the previous one [41]. The validation of Sentinel 3 altimeter data in open sea [41] and lakes [34,42] also shows good performance in comparison to previous missions [43]. The applicability of Sentinel 3 altimeter data over river basin has recently been addressed [44,45,46]. Whereas recent works highlight that there is not a clear dependence of measurement performance with the river width [36,47,48], surrounding terrain can be an influencing factor. Altimeters can have difficulties tracking rivers at very high altitudes and in steep topographic reliefs [47].
The quality assessment report of Copernicus Global Land Operations (2018) provides the validation and quality assessment for Sentinel 3A and Jason missions. Still, in this official document, the river case study refers to a minimum of 300 m river width [17]. This highlights the need to assess the case of rivers with a width less than 300 m.
Here, we want to assess the feasibility of using satellite altimeter data from Jason, Sentinel 3A and Sentinel 3B missions for water level retrieval considering very narrow river sections (less than 300 m). The case study is the whole Italian territory, considering all the available Copernicus altimetric stations. We used the dataset of Jason and Sentinel 3 missions, and we compare it with in situ water level data. The objective is to investigate the accuracy of Copernicus altimetric measurements for water level retrieval and small river section monitoring.

2. Materials and Methods

2.1. Data

Ocean and surface topography measurements began with the Topex/Poseidon satellite in 1992 and continued through Jason 1 (2001), Jason 2 (2008), and Jason 3, which have been operating since 2016. Jason 3 is an Ocean Altimetry Satellite in a U.S.–European program to measure the height of the ocean surface.
Sentinel 3 mission is part of the Copernicus project, the European Union’s Earth observation program for the establishment of European capacity for Earth observation [49]. The primary objective is marine observation: sea-surface topography, sea and land surface temperature, ocean, and land color [49]. The Sentinel 3 satellite carries the following instruments: a dual-frequency SAR altimeter called SAR radar altimeter (SRAL) instrument, a microwave radiometer (MWR), Precise Orbit Determination (POD), Ocean and Land Colour Instrument (OLCI), and the Sea and Land Surface Temperature Radiometer (SLSTR) instrument (for further details see [50]). Therefore, it provides altimetric measurements and visible and infrared measurements simultaneously.
Here we used Sentinel 3A, Sentinel 3B, Jason 2 and Jason 3 satellite mission data, provided at the free and open access Copernicus Global Land service portal: https://land.copernicus.eu/global/products/wl (accessed date: 29 September 2020). The revisit time, corresponding to the duration of the orbital cycle of the considered satellite, is of 10 days for Jason 3 and 27 days for Sentinel 3A [51]. Jason 3 was launched in 2016 (and complements the Jason 2 water level timeseries as it is on the same orbit). The Jason water level timeseries are 5 years long, with one measurement every 10 days. Sentinel 3A was launched in 2016, so the Sentinel 3A water level timeseries therefore have a maximum length of at least 5 years, with one measurement every 27 days. Sentinel 3B was launched in 2018 and reached its final orbit in November 2018. The comparison between in situ and satellite measurements started in 2016 for the Sentinel 3 mission and in 2006 for the Jason mission. The intersection of the satellite ground track (i.e., the path on the surface directly below the satellite’s trajectory) with the river is called the “virtual station” [18,23]. Virtual stations are defined to provide river-water-level time series [52]. The coordinate of the virtual station is defined as the intersection of the satellite’s theoretical ground track and river’s centerline. The virtual stations are fixed, and their timeseries contain one data point per satellite cycle [52]. More precisely, the virtual station is the intersection between the rivers and satellite “theoretical ground track”, the path on the surface we would obtain if the satellite passes exactly over the same positions every cycle. Due to small effects on the satellite orbit (e.g., the fact that Earth’s mass distribution is not perfectly homogeneous), it does not pass exactly over the same position each cycle. Adjustments are regularly performed with small burns to ensure that the real ground track does not deviate more than 1 km from the theoretical ground track.
The altimeters’ footprint of Jason 3 is in the order of 16 km. For Sentinel 3A and Sentinel 3B, which use SAR mode, it is 300 m along the satellite’s flight direction and about 10 km across the track. The altimetry data used to generate the satellite water level estimate consist in 20 Hz data (i.e., one measurement every 300 m). Copernicus products account for all points within about +/− 2 km around the virtual station position. Several measurements are used: the ones at the nadir of the rivers and also a few just before or after the river crossing, for which the water is still in the footprint. Editing is performed over these 20 Hz measurements, and the median of the valid measurements is taken to get the water level estimate for that satellite crossing of the river. These medians are directly provided in the Copernicus Global Land Water level products. This is repeated for each satellite crossing, which occurs every 10 days for Jason 3 and 27 days for the Sentinel 3A and Sentinel 3B (the satellite cycle duration), hence constituting a water level time-series over the station with 10- or 27-day intervals. The accuracy of water level measurements depends on multiple parameters: the altimetry mission used, the shape and size of the river bed and its surroundings, as well as the period within the hydrological cycle. The mean accuracy over all virtual stations is in the order of 13 cm. This is the dispersion of the 20 Hz measurements over each river crossing. It varies from 10 to 35 cm depending on the basins and whether the measurement occurs during high or low water.
In Figure 1, we can see the orbit ground tracks for Sentinel 3A, Sentinel 3B, and Jason 2/3. Whereas there are potentially more virtual stations than what is displayed on the map, the current available sample provided from the Copernicus Global Land Service platform (red crosses in Figure 1) is limited in processed and good-quality retrievals. The data available in the platform and used in the analysis, are Level 3 products resulting from advanced processing of the Level 2 altimeter data made available by the space agencies. Level 2 data (1 measurement about every 300 m) are edited, based on their standard deviation value and the water surface height estimates across the transect. The Level 3 product is the median of these valid values and hence contains a quality control that has already removed most of the outliers. The requirements for the validation processing are the following: (1) time series that present no more than 3 consecutive cycles without valid measurements, (2) the median difference between in situ and satellite measurements does not exceed 0.5 m and the maximum difference is 1 m; and (3) at least 60 records with the theoretical time resolution must be reached [17]. An initial quality control includes an outlier rejection method where values outside the mean +/−3* standard deviation of the water level estimates from all the 20 Hz data measurements of the transect are identified as outliers. In addition, a criterion based on the backscatter coefficient is implemented in order to consider only data points associated with water. Therefore, the satellite time series used in the study have already been processed at different levels (including outlier rejection, mean calculation, and ellipsoid correction).
Radar altimetry provides vertical measurements between satellite and water level. Altimetry sends a radar signal to the Earth’s surface and the elevation is obtained by measuring the time in between emission and the backscattered wave [51]. The difference between the satellite altitude with respect to a reference surface (Geoid or Ellipsoid) and the satellite-water surface distance provides measurements of water level above the reference of the satellite data. Therefore, the water-level data extracted from satellite measurements are the water level measurements with respect to a reference. The validation with in situ data (which are water level with respect to a zero level) requires the knowledge of the river section at the exact position of virtual station. This value has to be then referred to the same reference as the satellite data [54].
This procedure implies: (1) the knowledge of the topographic section of river bed in the exact position of virtual station; (2) technical skills to manage the Digital Elevation Model and doing topographic conversion of the reference surface (if needed); (3) the knowledge of the zero level of all the river gauges and the respective references.
Looking to an automatized and operative perspective of the use of satellite water level data, this procedure can be discouraging if the topographic or instrumental information are not available or easy to access. To overcome this problem, we propose three different methods of data comparison directly using the satellite water level and in situ measurements without considering the surface of reference (see Methodology).
Each virtual station is provided by a “.json” file format with general information (such as latitude, longitude, satellite type, time coverage, and river basin), water surface reference, and an instantaneous water level value in UTC time.
Out of 11,336 virtual stations (744, 6049 and 4543 for Jason 2/3, Sentinel 3A, and Sentinel 3B, respectively) representing the global dataset, in Italy, there are a total of 43 (5, 28, and 10 for Jason 2/3, Sentinel 3A, and Sentinel 3B, respectively) virtual stations, reported in Figure 1, covering 9 italian regions: Lombardia, Emilia Romagna, Piemonte, Trentino-South Tyrol, Toscana, Veneto, Umbria, Lazio, and Sardegna, and interesting some of the main rivers like Po, Tevere, Adige, Arno, Adda, Oglio, but also minor rivers like Livenza, Ombrone, Tirso, Tanaro, Reno, and Dora Baltea e Mincio. Most of the virtual stations are placed on the Po river, this is for the very favorable orientation of that river running West–East in regards to the satellite tracks.
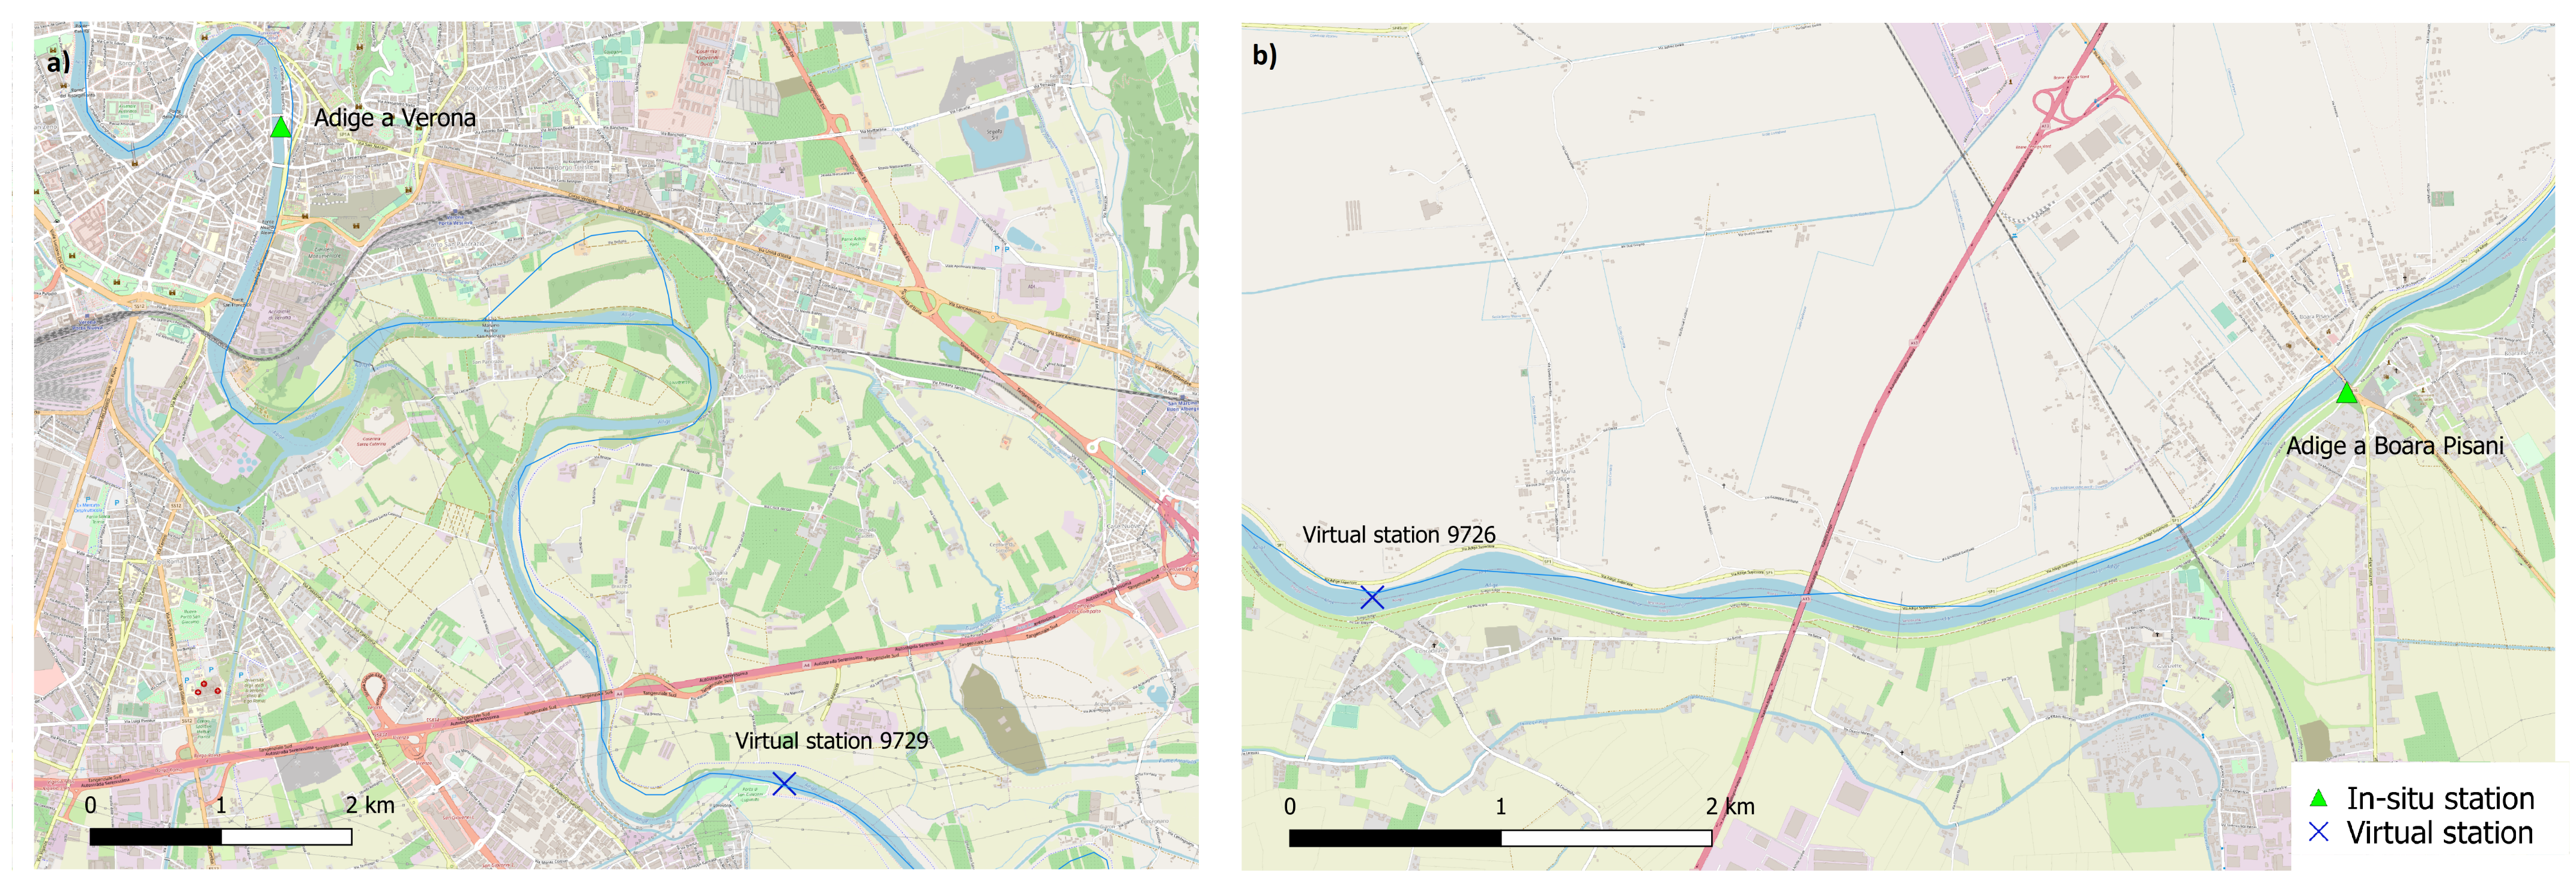
We selected 19 gauging stations close to the virtual stations, following criteria defined in the Methodology section (see an example of couple selection in Figure 2).
Table 1 provides information about each of the gauging stations selected, including the river, the region it belongs to, the geographical coordinates, the width of the river section, the satellite sensor providing data, and the distance with the correspondent virtual station. In particular, we have 4 stations on the Po river, 5 stations on the Tevere river, 3 stations on the Adige river, and 1 on the Adda river. These are the four longest rivers in Italy, each more than 300 km in length. Tevere river has a North–South orientation and passes through four different regions: there is a section at Ponte Nuovo in Umbria (in the North–South direction of the river channel) and four stations on the outlet of the river in the Lazio region (in the West–East orientation of the river channel). Arno river horizontally crosses the Tuscany and has a total length of 241 km. The four selected stations in the Arno river are located on the last part of the river path. Ombrone has a total length of 161 km and Livenza of 112 km. The two stations along these rivers are both on the outlet part. The altitude of the in situ stations is in the range of [0, 186] m a.s.l., so we do not have mountain stations. The data of the gauging stations were acquired with the minimum time scale available (up to 10 min) provided by the regions they belong to.

2.2. Methodology

It is quite unlikely that a virtual station may coincide with an in situ station; thus it needs a criterion to identify the pair’s virtual station—i.e., in situ gauging station—to be used in the comparison between satellite data and in situ measurements. This criterion is based on (1) the pair’s distance, assumed to be < 100 km according to [17], and (2) comparable hydraulic and geometric/morphological conditions in the two stations. The presence of some (natural or anthropogenic) interference between two stations may influence their water levels. The interference includes (a) lakes and dams, (b) incoming tributaries, (c) river bifurcations, (d) diversions, (e) obstacles that can cause the water flow to regurgitate (like a piles of a bridge, or barrages), (f) changes in the geometry of the river section, and (g) changes in the slope of the river channel.
In particular, we selected the pairs of satellite–in situ stations according to the following criteria:
  • Stations (virtual and in situ) that are geographically close to each other (according to the distance criterion) but that are not on the same river branch are not selected;
  • Stations (virtual and in situ) that are on the same river branch but present in the middle an interference (among the ones mentioned above), are not selected.
  • If there are two in situ stations close to one satellite station, we compare the satellite station with both of them, the same for the opposite situation.
According to the criterion for the identification of the virtual station–in situ gauging station pair, we have selected 22 pairs, with a distance in the range of [0.05, 11.39] km, given in Table 1. In particular, 5 stations have a river width more than 300 m, 1 station with a section between 200 and 300 m, 4 stations in the interval 100–200 m and 9 less than 100 m in width. Some in situ stations can be combined with the passages of two different types of satellite. The Pontelagoscuro, Badia Polesine, and Ficarolo stations are considered twice, comparing the same in situ data with the two different types of satellite data. For each pair, we associated a river section width measured at each virtual station position retrieved by Google Earth and used it to categorize the different sections, distinguishing the large rivers such as the Po river from the small ones such as the Livenza and Ombrone rivers. The river section width varies within the [50, 555] m range.
Once the pairs were defined, we focused on the comparison in time. For each virtual station, there is a time series of satellite water level at a specific date and time. On the basis of the satellite data and time passage, we extracted the in situ data at the same date and the nearest time. Since the altimeter time is UTC (Coordinated Universal Time), the satellite time series have been referenced to CET (Central Europe Time) to match the time of in situ gauging stations. The time format of in situ gauging stations depends by the station and the authority that collects data. Thus, we compared data the between virtual station and the in situ gauging station and found a maximum 30 min difference. The period analyzed is 2016–2020 for Sentinel 3A data, 2018–2020 for Sentinel 3B, and 2008–2020 for Jason data.
Since the satellite water level measurements are referred to a reference (GEOID/Ellipsoid) and each in situ data is referred to a zero hydrometric, for each pair there exists a constant bias between the two data series (satellite-in situ). The measurements comparison has been done in terms of water level difference and absolute water level. As first case, we calculated the difference between two successive satellite data measurements in time and compared it with the difference between two successive in situ data measurements in time. The comparison of the variation in time of satellite measurements with the variation in time of in situ measurements is a procedure that permits to overcome the problem of different reference.
Comparisons in terms of absolute water level have been done in two different ways: (1) the systematic bias between satellite water level and in situ water level is calculated imposing the equality of in situ–satellite measurements, for the first available measurement in common. In this way, the first in situ measurement is taken as reference of all the series of data. (2) We calibrated the initial water level from the differences between satellite—in situ water level, choosing as systematic bias for the whole series that one that minimizes the MAE (mean absolute error metric). To do the optimization we used the “optimize” function in R, varying the delta between satellite and in situ measures for each time steps and imposing the minimization of the MAE. The delta that minimized the MAE has been chosen as systematic bias for the whole series.
In order to check the agreement between satellite and in situ measurements, we have considered the following metrics (as also computed in [17]): the Pearson correlation coefficient (R), the Root Mean Square Error (RMSE), the Mean Bias Error (MBE), and the Mean Absolute Error (MAE). In the next, we briefly recalled their sample versions. Let { y 1 , y 2 , , y n } be a sample of size n of (in situ water level) observations, and similarly { y ^ 1 , y ^ 2 , y ^ n } a sample of (satellite water level) measurements.
The Pearson correlation coefficient is calculated as
R = s y y ^ s y s y ^
where s y = i = 1 n ( y i y ¯ ) 2 n 1 and s y ^ = i = 1 n ( y ^ i y ^ ¯ ) 2 n 1 are the sample standard deviations, respectively, of in situ and satellite measurements and s y y ^ = i = 1 n ( y i y ¯ ) ( y ^ i y ^ ¯ ) n 1 is the sample covariance, where y ¯ and y ^ ¯ are the sample means, respectively, of in situ and satellite measurements. R [ 1 , 1 ] . If R = 1 ( 1 ) , it indicates that the data lying exactly on a line with positive (negative) angular coefficient. R = 0 would indicate no correlation between the data.
The Root Mean Square Error is calculated as
RMSE = RSS n
where RSS is the Residual Sum of Squares, RSS = i = 1 n ( y i y ^ i ) 2 . RMSE is non-negative, and a value of 0 indicates a perfect agreement. Thus, lower is RMSE better is the agreement. The Mean Bias Error is calculated as
MBE = 1 n i = 1 n ( y ^ i y i )
MBE denotes the average bias in the prediction. A positive bias represents an overestimation, while a negative bias an underestimation. The Mean Absolute Error is calculated as
MAE = 1 n i = 1 n | y ^ i y i |
MAE indicates the average of the absolute differences.

3. Results and Discussion

Considering the 22 satellite–in situ station pais, we calculated the values of the four metrics: R, RMSE, MBE, and MAE (Table 2). We calculated these for water level differences and water levels obtained assuming the first value of satellite water level measurement equal to the in situ one. We found a good agreement between virtual and in situ measurements, finding that, for the 68 % of pairs, the coefficient of correlation is higher than 0.7, with a median value of 0.79 (value referred to water level differences while the value for the water level is 0.87), the first quartile of 0.65 (0.66) and the third quartile of 0.93 (0.94) (Table 2). In terms of RMSE, 41 % of pairs have a value smaller than 0.3 m, with a median value of 0.37 m (0.38 m), the first quartile of 0.23 m (0.25 m) and the third quartile of 0.61 m (0.76 m). In terms of MBE, 68 % of pairs have a value between −0.01 m and 0.01 m, with a median value of −0.003 m (−0.07 m), the first quartile of −0.01 m (−0.32 m) and the third quartile of 0.001 m (0.08 m). In terms of MAE, 63 % of pairs have a value smaller than 0.3 m, with a median value of 0.24 m (0.28 m), the first quartile of 0.19 m (0.2 m) and the third quartile of 0.42 m (0.48 m). The values of RMSE are quite similar to those found by [54] over French rivers using Jason 3, with a river width in the range [35, 300] m. They found a median value of RMSE equal to 0.275 m, the first quartile of 0.20 m and the third quartile of 0.44 m. They found that if the attention is restricted to width >100 m, the values of the statistics improve as follows: median value of RMSE equal to 0.24 m, the first quartile of 0.18 m and the third quartile of 0.28 m. In our case, the highest values of RMSE (>1 m) are found for the case of Adda at Pizzighettone (Sentinel 3A), Adige at Badia Polesine (Sentinel 3B) where there are some outliers. Adda is a tributary of Po river, while Adige shares with Po the area of delta. Both the stations (Pizzighettone, Badia Polesine) are located in the Po valley, the large plain area surrounding the Po river characterized by minimal slope. Pizzighettone station is placed in the last part of the river path, which is oriented along the North-West direction and converges almost perpendicularly into Po river. This emphasizes the possible interaction between the orientation of the river and the satellite ground track. Badia Polesine is located in the last part of Adige river, which flows parallel to the Po river in the area of delta. For this station, as can be seen in Figure A1c,d, there is a good agreement between in situ—satellite data except for an outlier that influences the RMSE. The presence of outliers can be due to errors of in situ instruments, or problems in the satellite measurements due to the presence of interference due to water reflections, vegetation and topography can influences the radar echoes over land surface preventing a precise determination of altimetric height [51].
The performance obtained comparing the water levels can be improved finding the optimal value of the initial water level. Imposing the equality of the first value of the water level could be good for some stations but can lead to a shift of measurements if the first value is an outlier. Pontelagoscuro station (see Results section) can be an example of this case. For this station the procedure of fixing the first value can be inaccurate since there is clearly a bias between satellite and in situ measurements. Or, in others words, the choice of assuming equal the first water level value was not the optimal one. To overcome this situation, we calibrated the initial value, minimizing the differences between satellite and in situ water levels, specifically minimizing the MAE.
Calibrating the systematic bias, the results we obtained are better in terms of RMSE, MBE, and MAE (Table 3). We obtained a median value of RMSE of 0.27 m, the first quantile equal to 0.19 m and the third quantile of 0.59 m. In terms of MAE, we found a median value of 0.19 m, the first quantile of 0.13 m and the third quantile of 0.35 m. In terms of MBE, the median value is −0.02 m, the first quantile is −0.05 m, and the third quantile is 0.03 m. The performance in terms of Pearson correlation coefficient did not change, because the change in the initial water level corresponds to a change in the intercept of the regression line, but not altering the relation between the variables. As can be seen also from Figure 3, the agreement between satellite and in situ measurements, after calibration, increases.
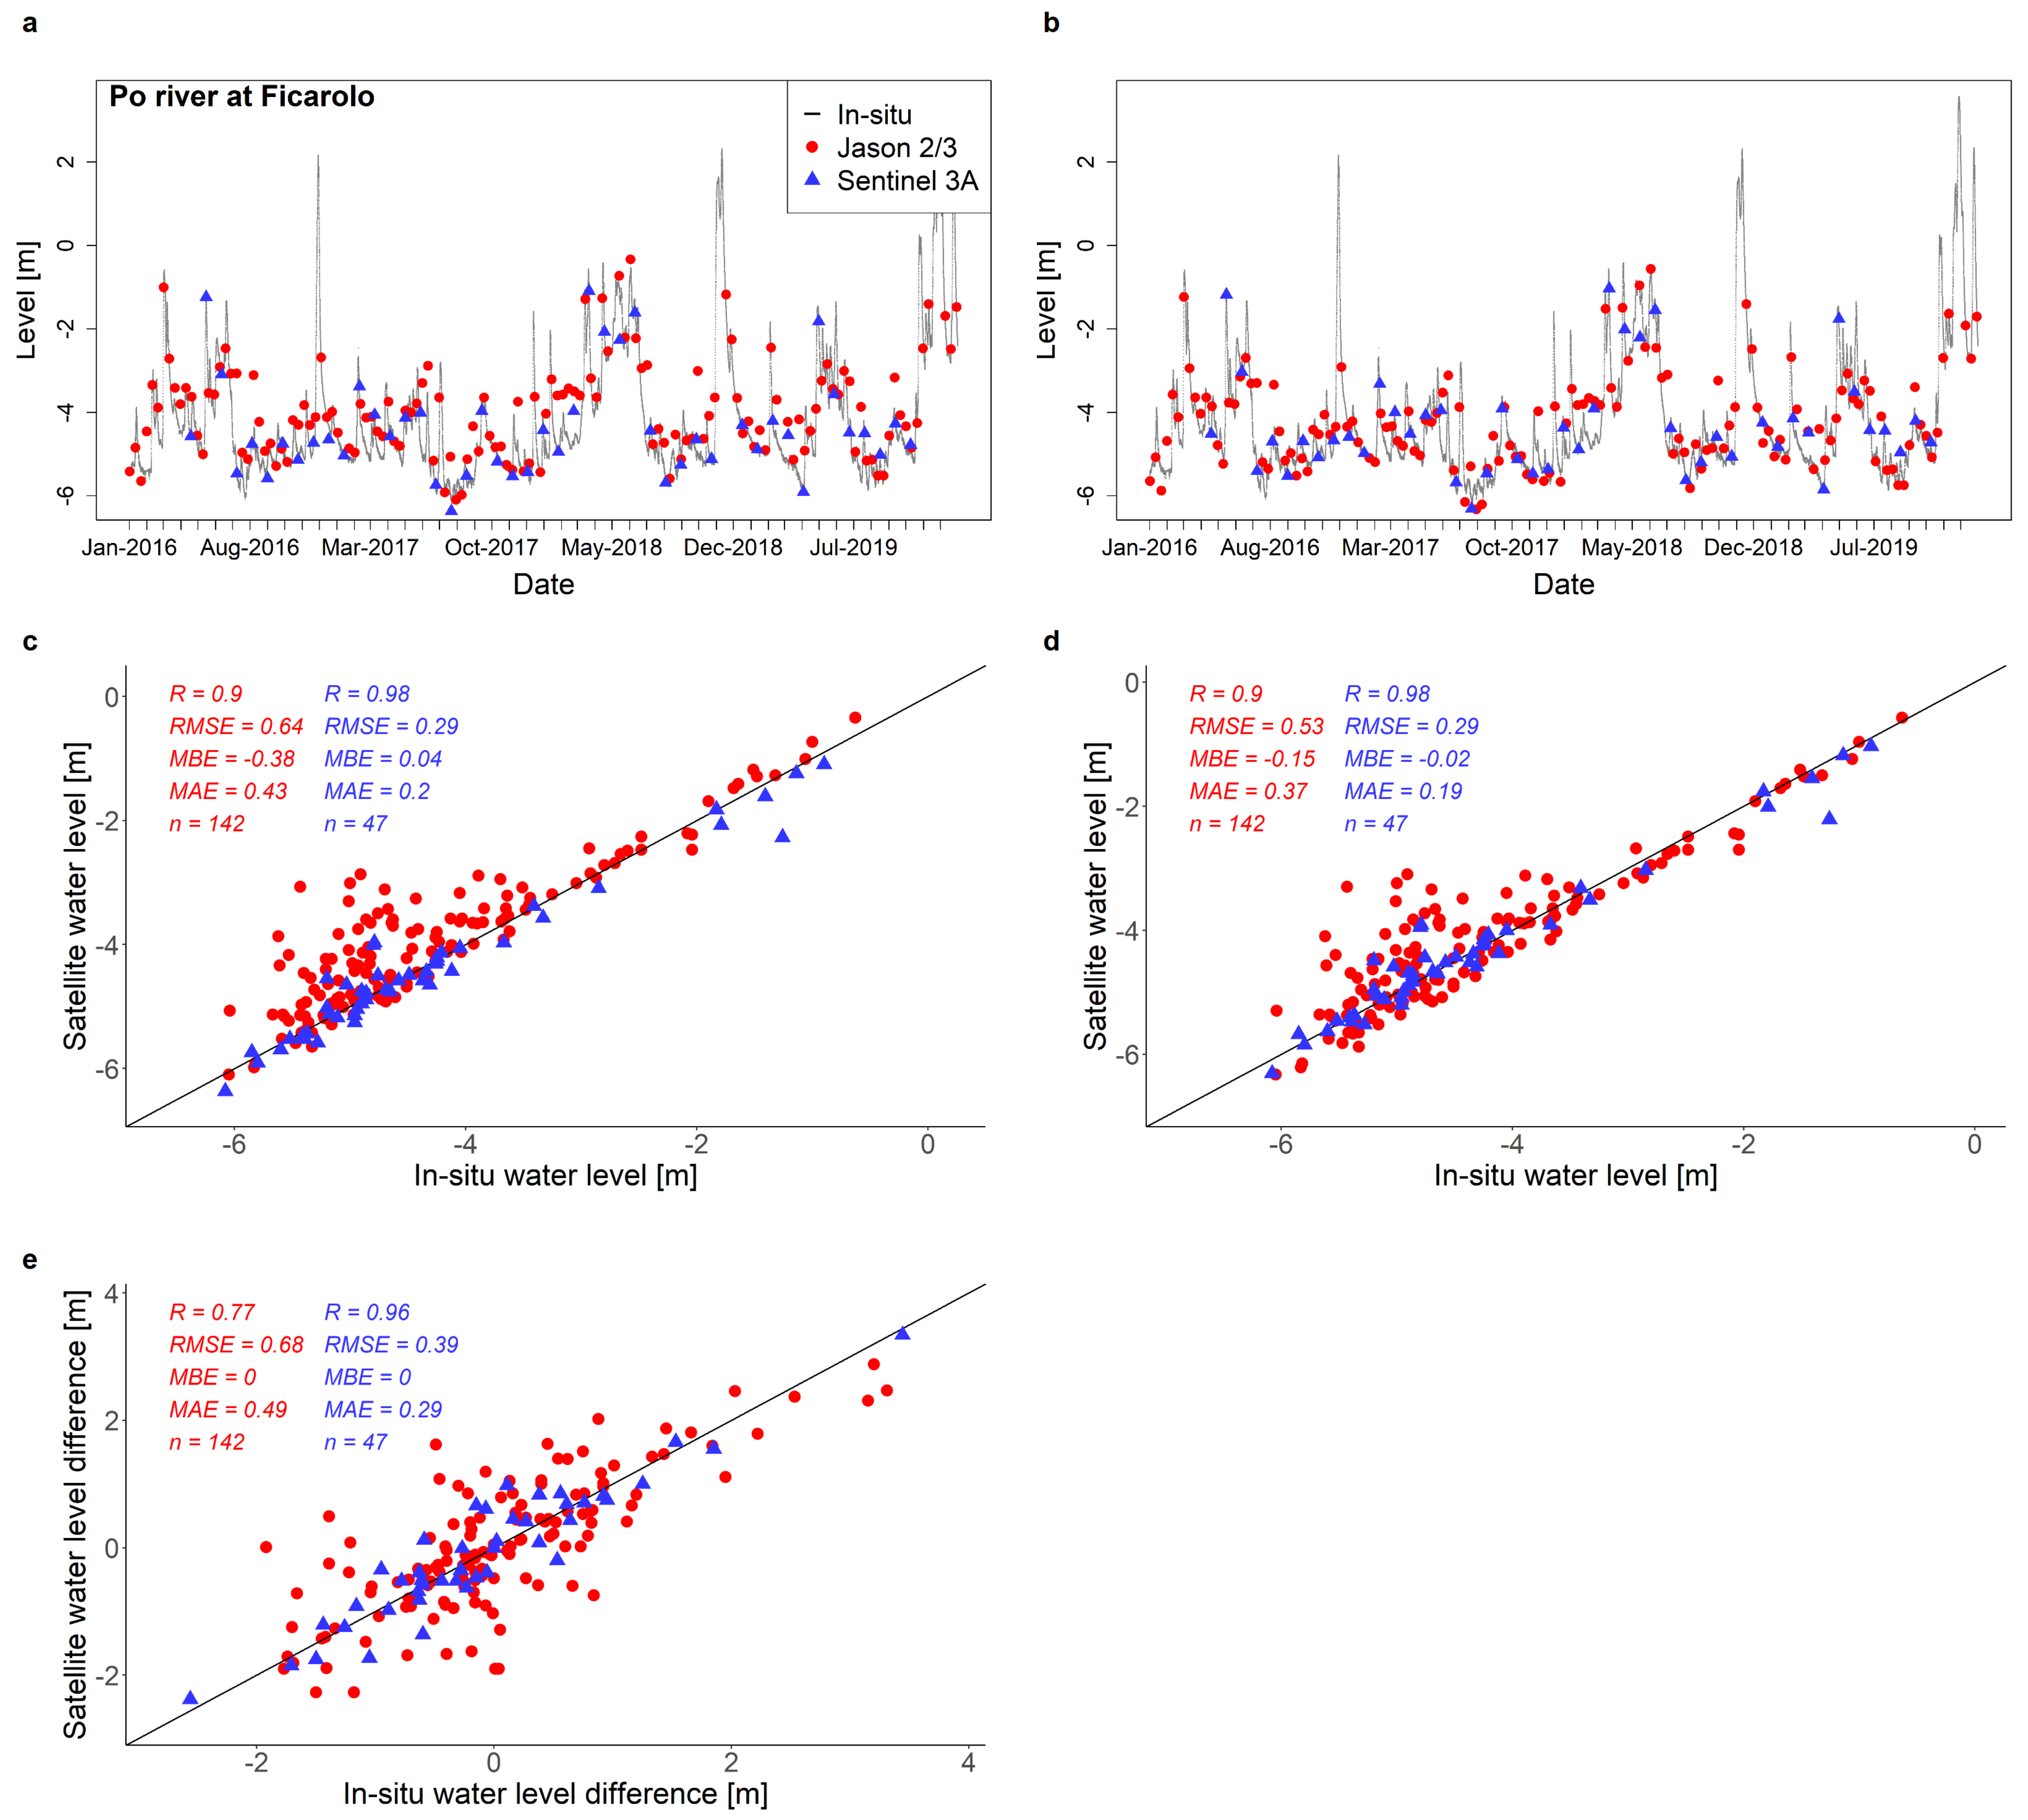
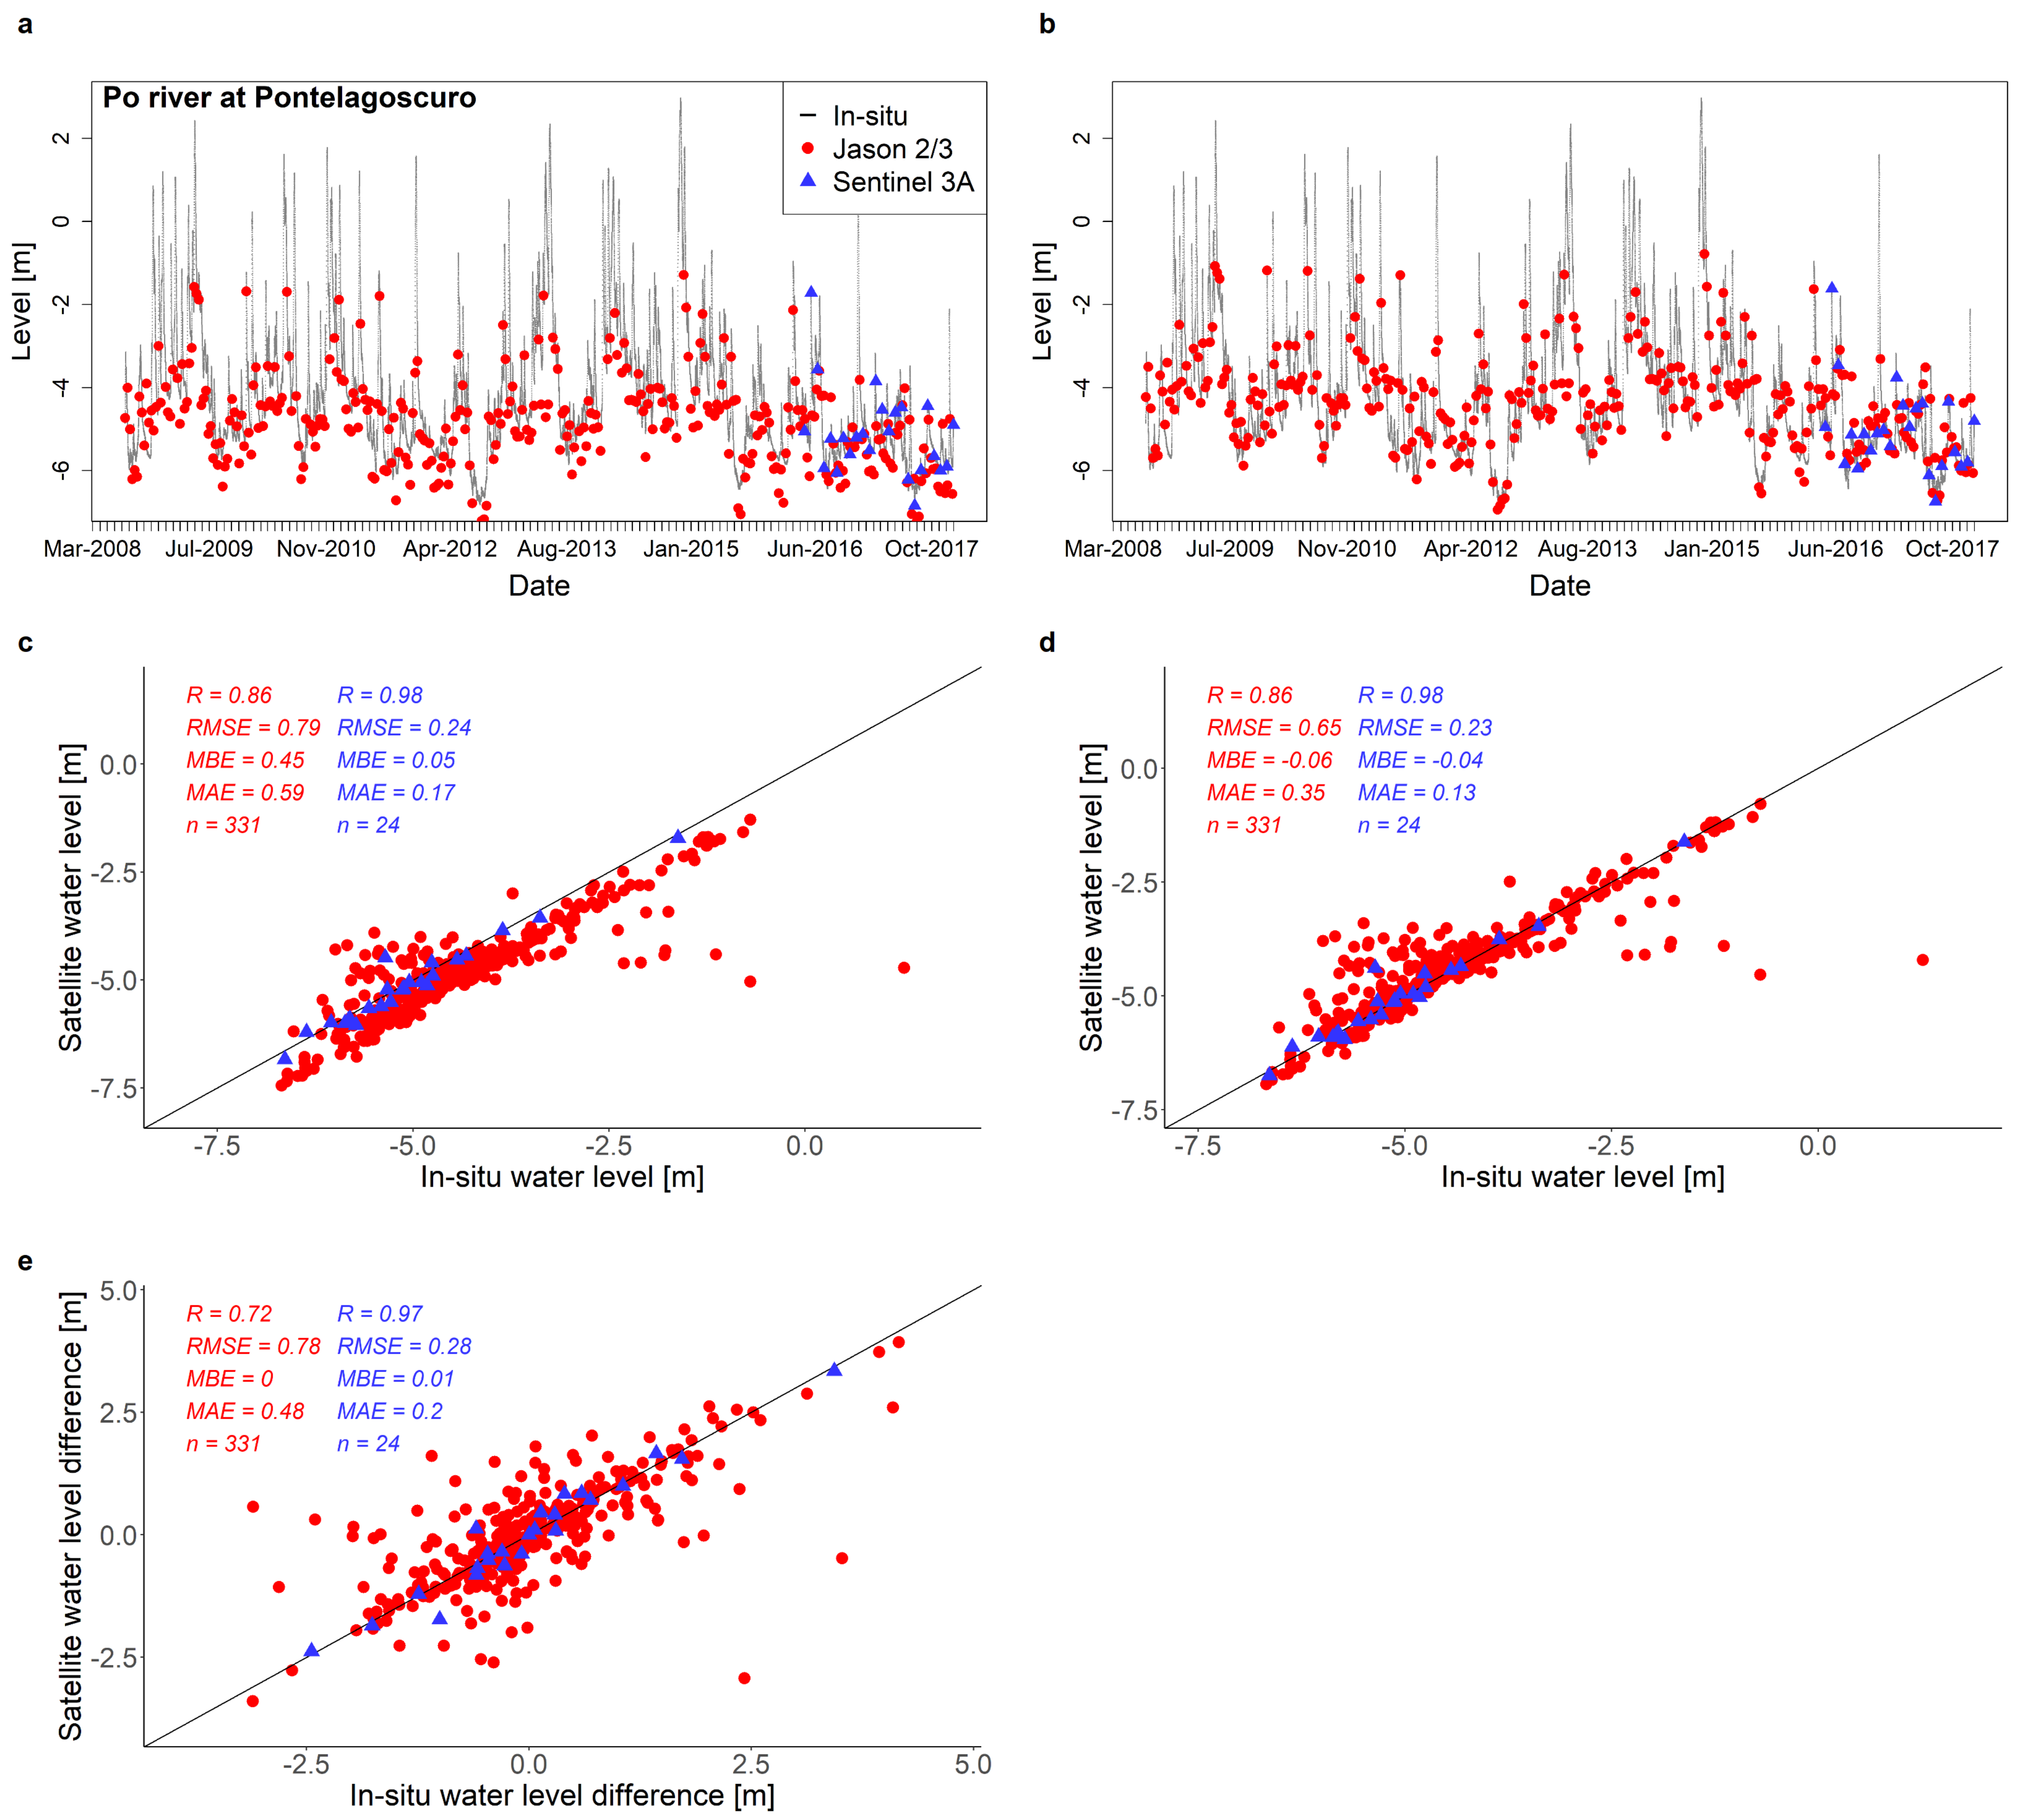
The in situ stations with the largest river sections (Boretto, Pontelagoscuro, Piacenza, and Ficarolo) belong to the Po river and have a medium width of 440.5 m. For these stations, we found the highest values of the Pearson correlation (the median value equal to 0.96) and the median value of RMSE equal to 0.26 m, −0.03 m for MBE, and 0.16 m for MAE (comparison done with absolute values and the calibrated systematic bias). These results are concordant with the validation done by Tourian et al., (2016) [55] in the same river, where they found an average correlation of 0.7, Root-Mean-Square Error of 0.8 m using ENVISAT, CryoSat-2, Jason 1/2, and SARAL/AltiKa. For all of these sections using Sentinel 3A data, we obtained higher Pearson correlation values with respect to that ones obtained with Jason, also referring to the results found by Tourian et al., (2016) [55]: the correlation value for Pontelagoscuro is 0.98 (0.86 with Jason 2/3), for Ficarolo is 0.98 (0.90 with Jason 2/3), for Piacenza is 0.93, and for Boretto station is 0.98.
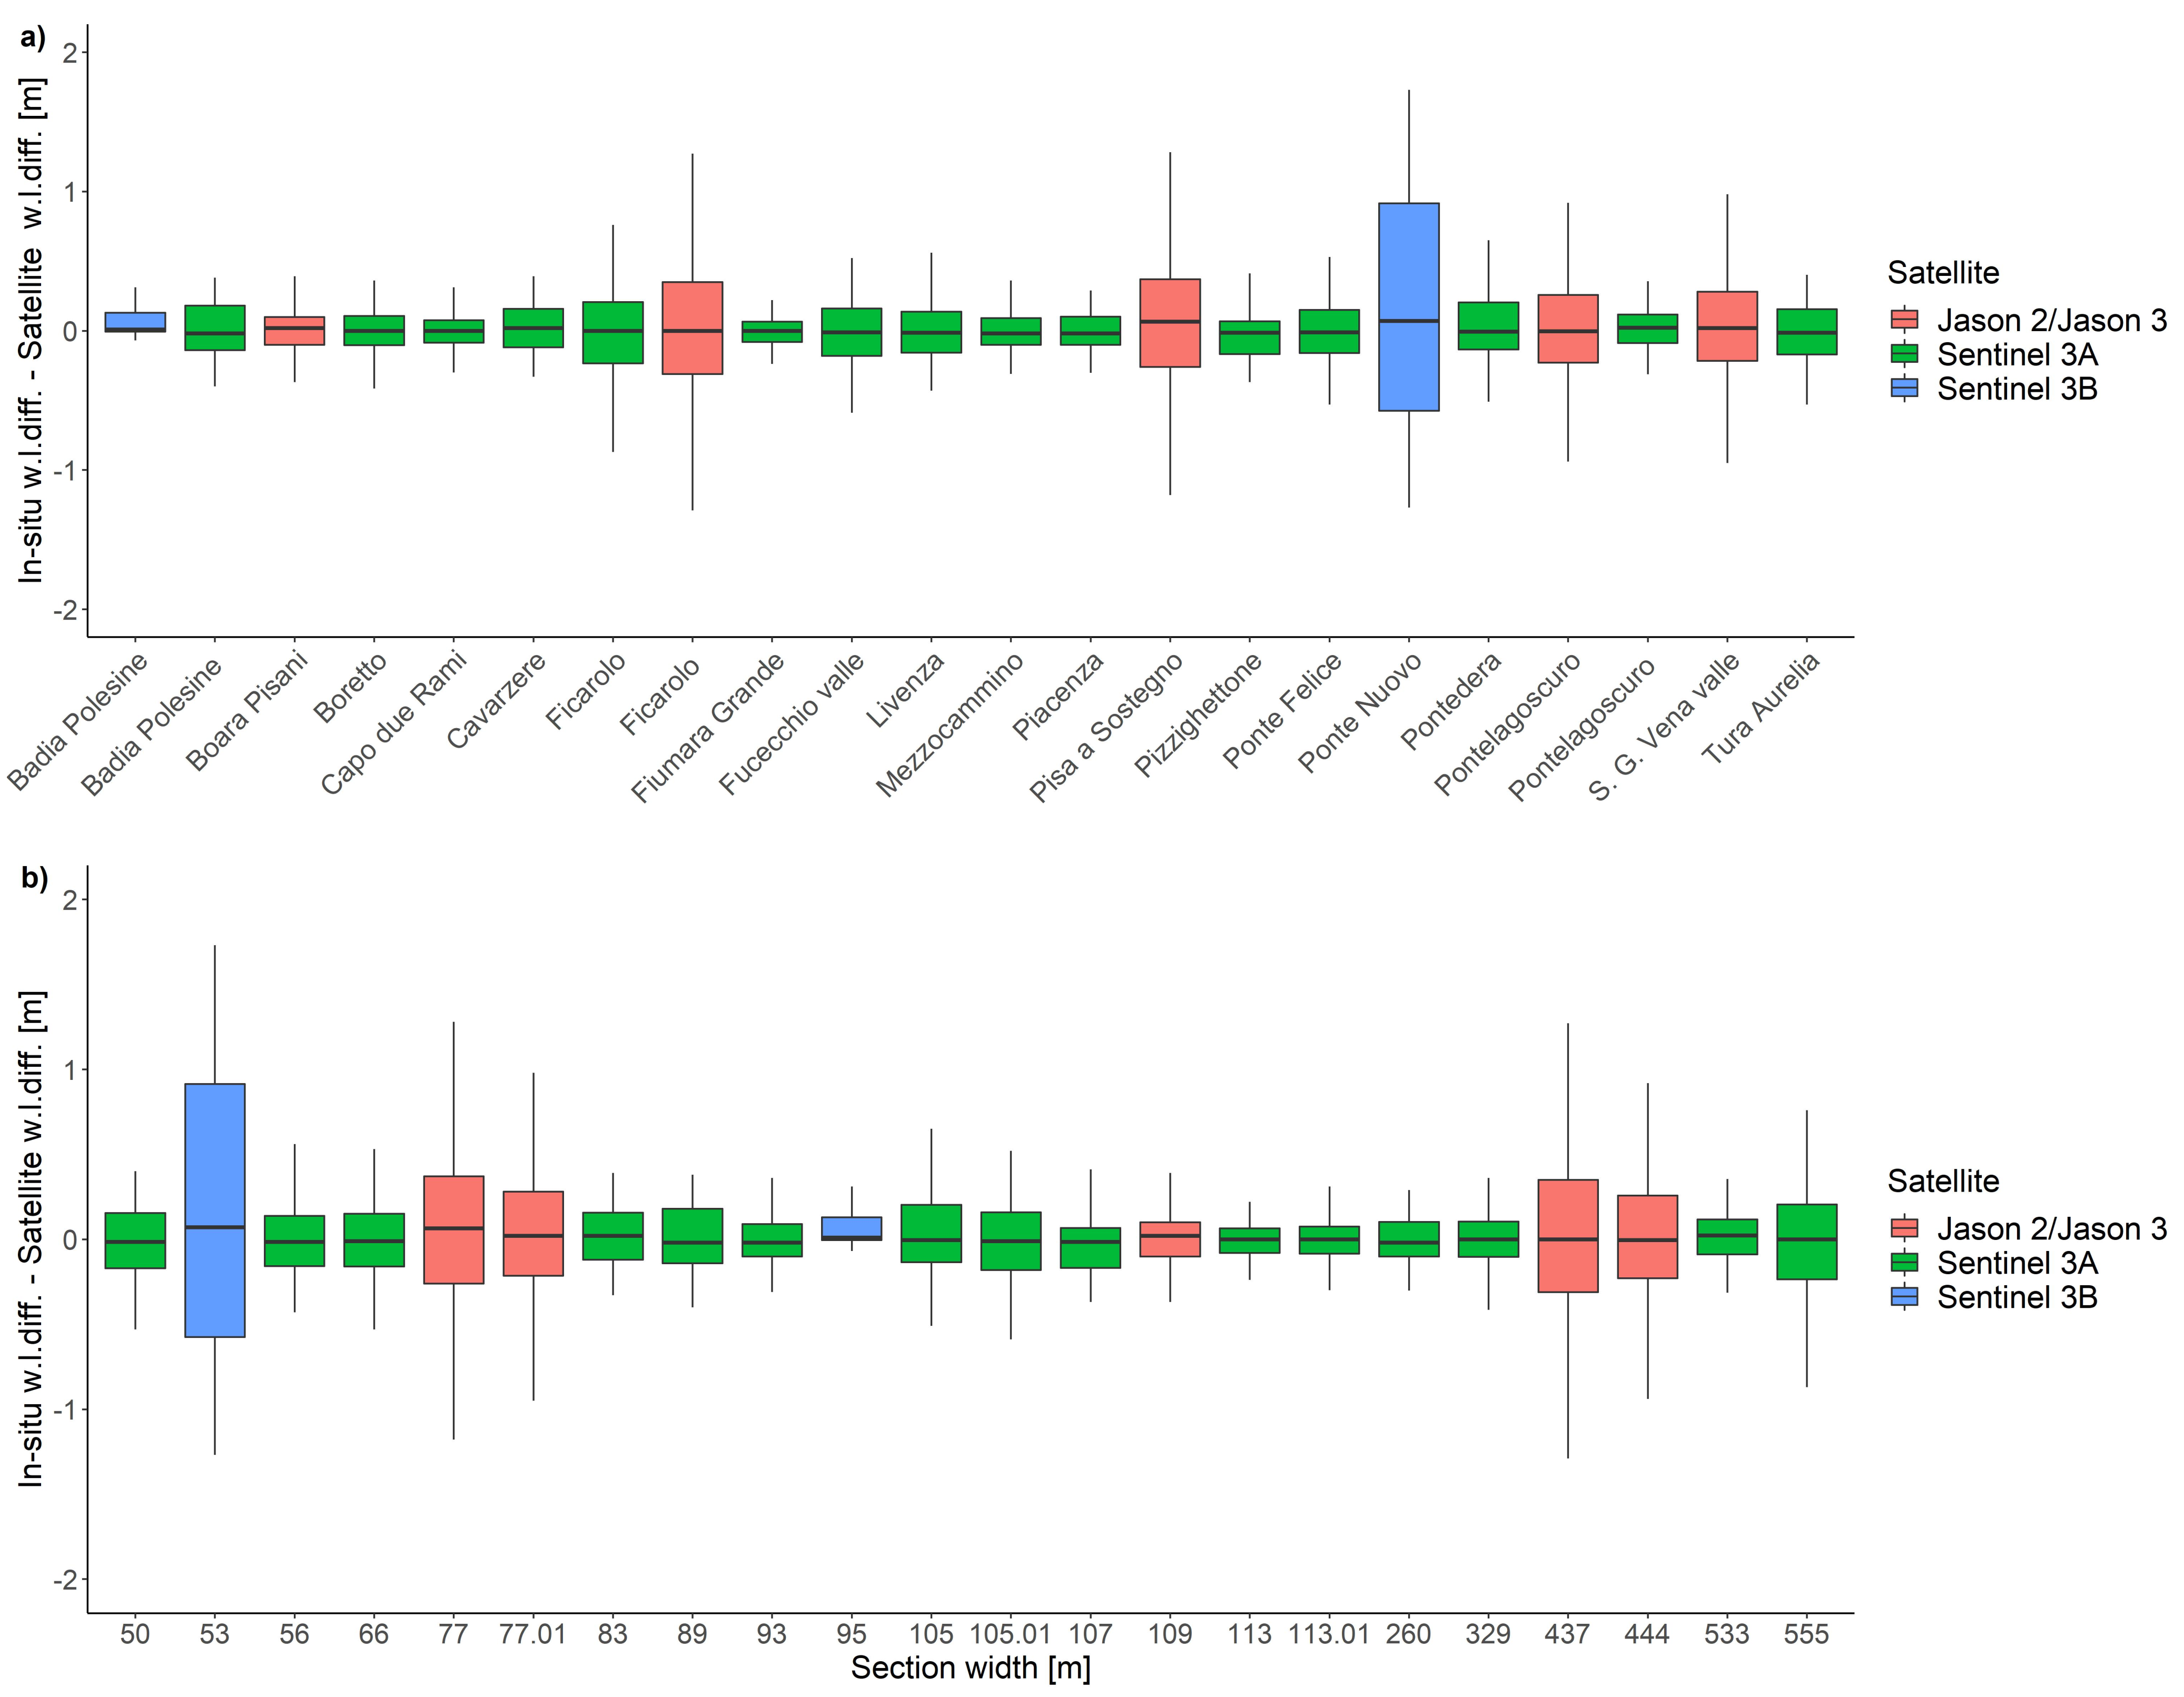
The boxplots of water level differences between in situ and satellite measurements for each of the 22 pairs considered, and distinguished by the different satellites, are reported in Figure 4a). Looking at differences between in situ and satellite measurements varying with the section width, we can see low variance of the boxplots obtained with Sentinel 3A also for narrow rivers (less than 100 m) (Figure 4b). Focusing on the accuracy of Copernicus data for the pairs with little river width (10 pairs have a width less than 100 m), we obtain a median correlation of 0.77, median RMSE of 0.38 m, median MBE of 0.025 m, and median value of MAE of 0.22 m. Among these pairs, three of them consider the in situ station with a river width less than 56 m. In particular, the values of river sections are: 50 m for Ombrone river (Tuscany), 53 m for the Tevere river in Umbria, and 56 m for Livenza river in Veneto. Still considering these three lowest rivers, the median value of the Pearson correlation is 0.75, RMSE 0.32 m, and MAE 0.23 m. Therefore, specifically for Sentinel satellites, the results show no clear dependence of measurements performance with respect to river width (as can be seen in Figure 4b). The same conclusions have been recently found by Jiang et al. in Chinese rivers [47]. Besides the section width, other factors can influence and have an impact on the altimeter water level retrieval. One of these factors can be the distance between the virtual station and in situ sensor. In our work, we apply a very strict criterion for the selection of pairs; the maximum distance between the pairs is 11 km, and we do not consider pairs with the presence of hydrological interference. Another important factor is the presence of meanders near the Sentinel virtual section, as well the presence of other small water bodies around the river. This can be the case of the Ponte Nuovo station (correlation 0.65, RMSE= 0.65 m), one of the station with the worst performance. The river exhibits small ‘cascades’ that might imply some non-linearity between the water levels at the virtual station and the in situ locations. The altimeter time-series could be of lower quality for this particular virtual station, as we are not sure the re-tracked peak in the altimeter waveform corresponds to the river. The environment (meanders, other surrounding water bodies) can play a more important role in the altimeter water level retrieval than the river width itself.
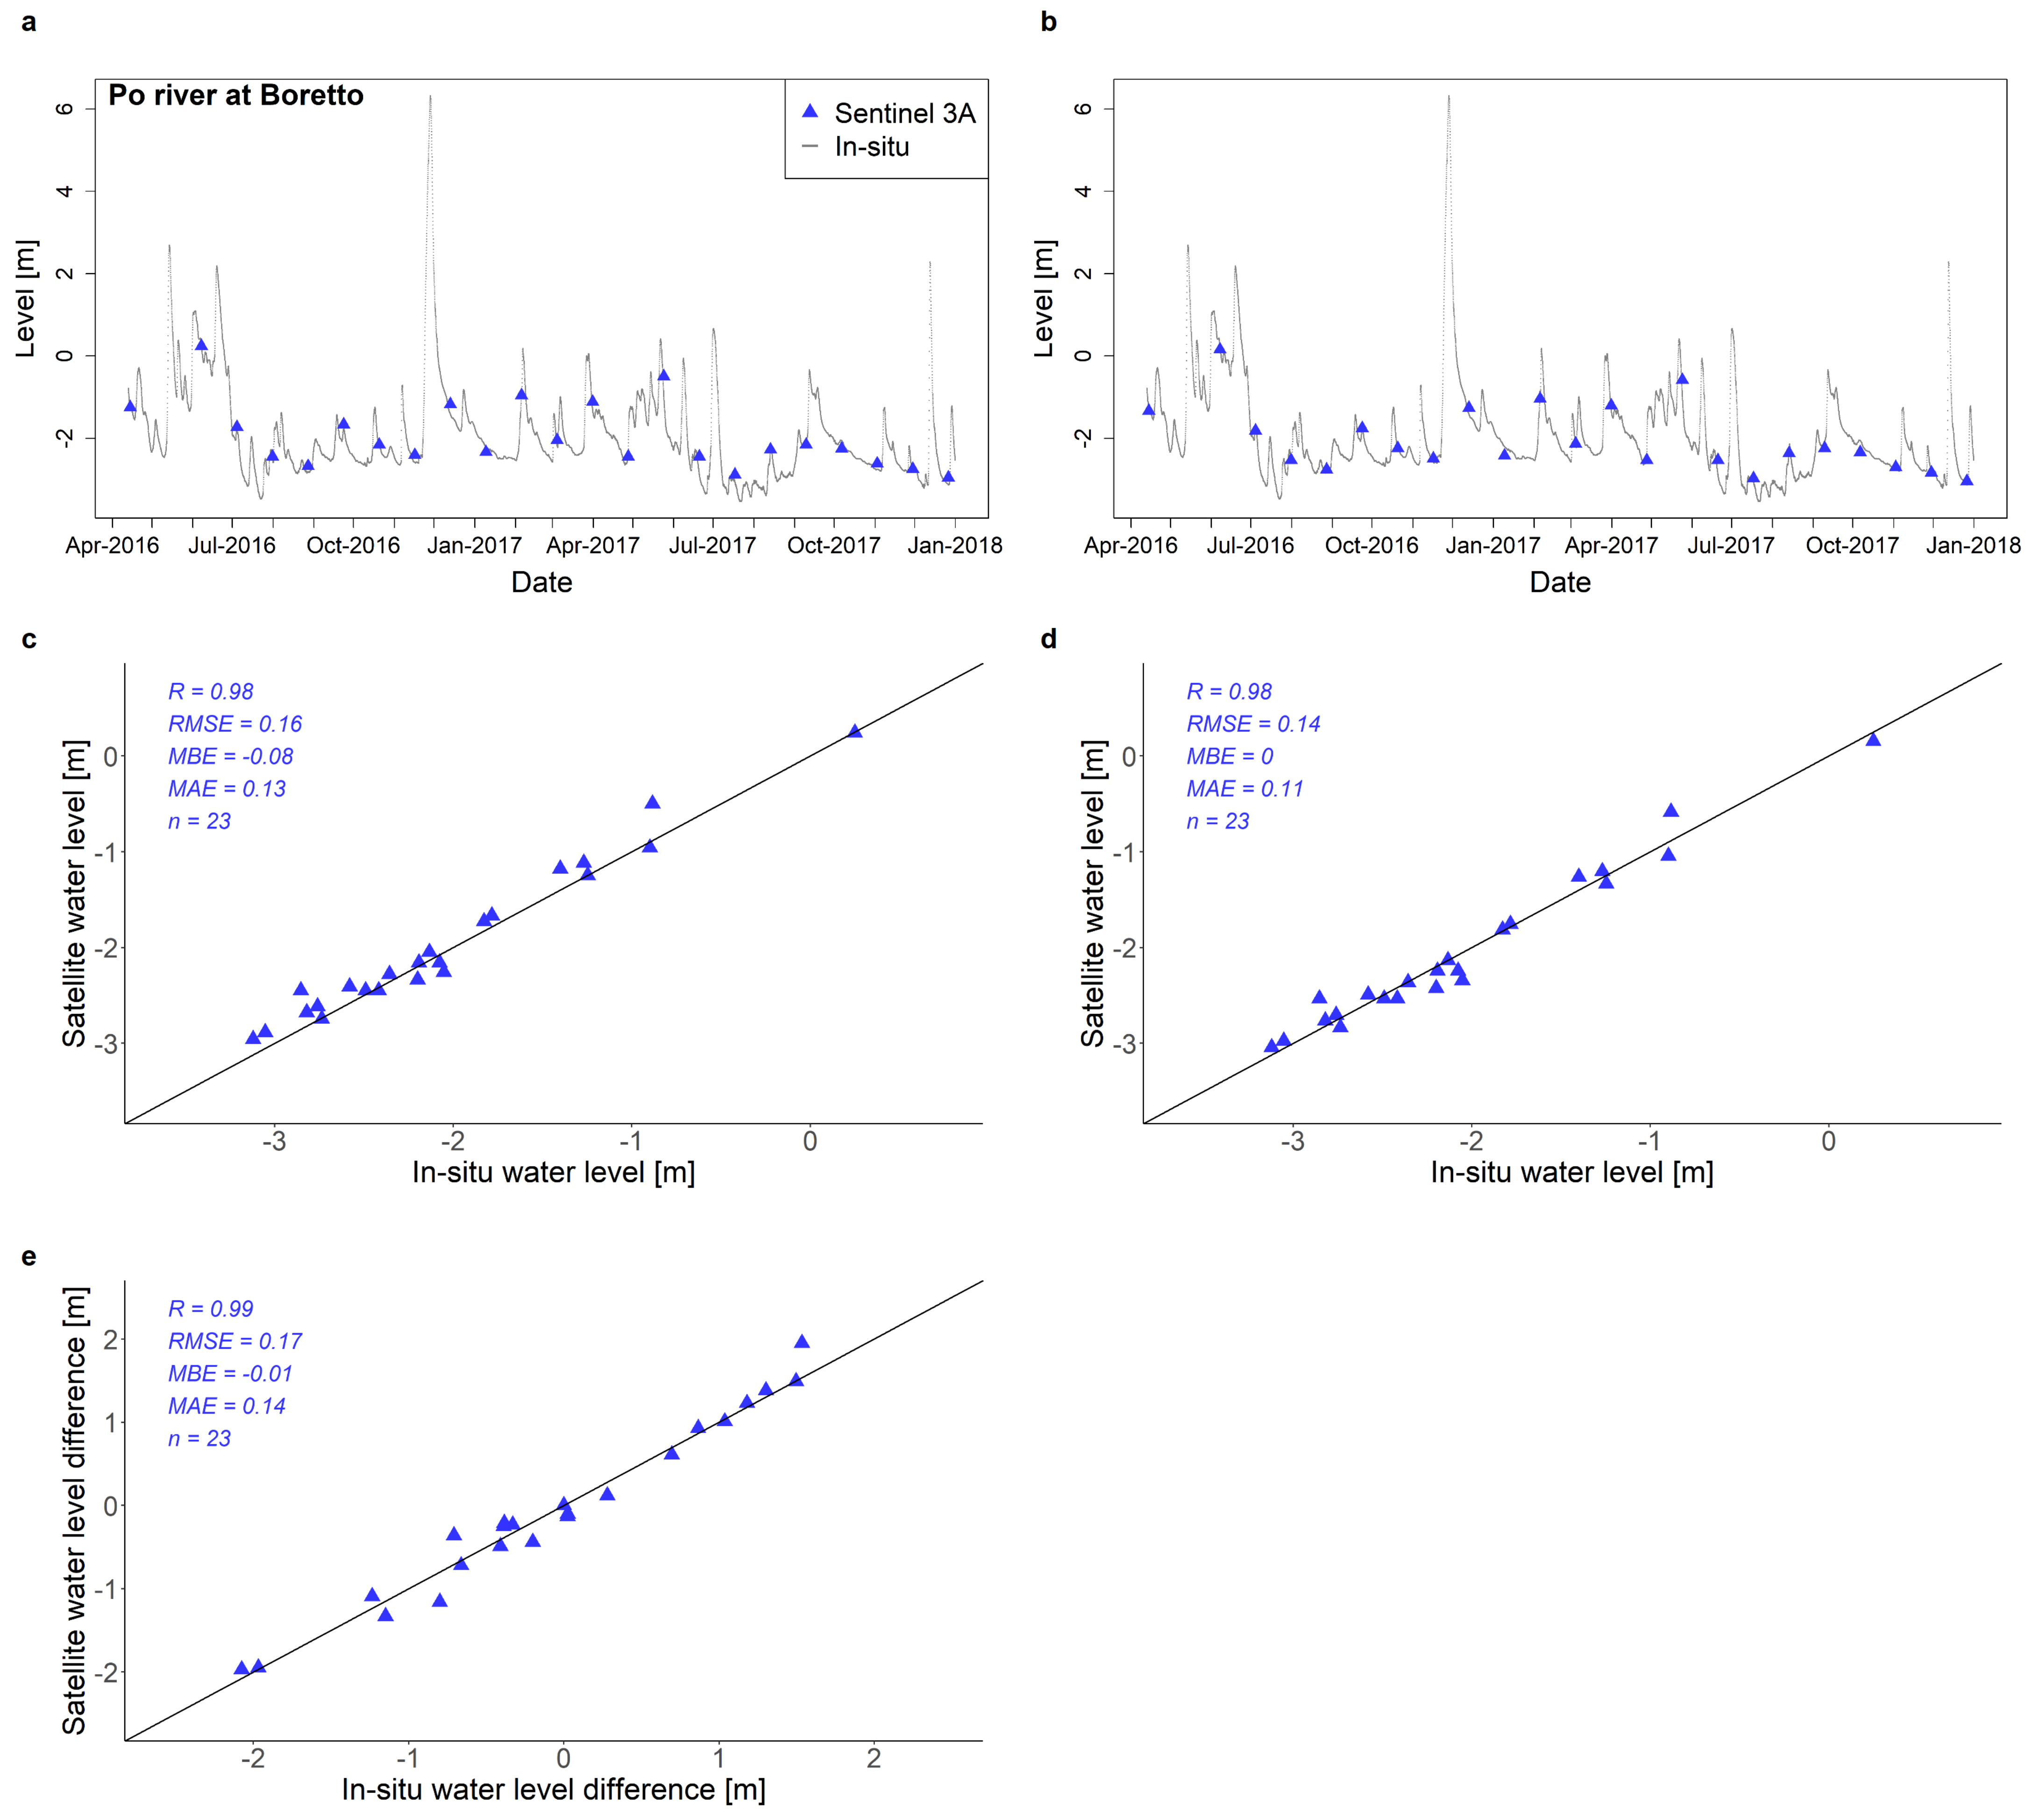
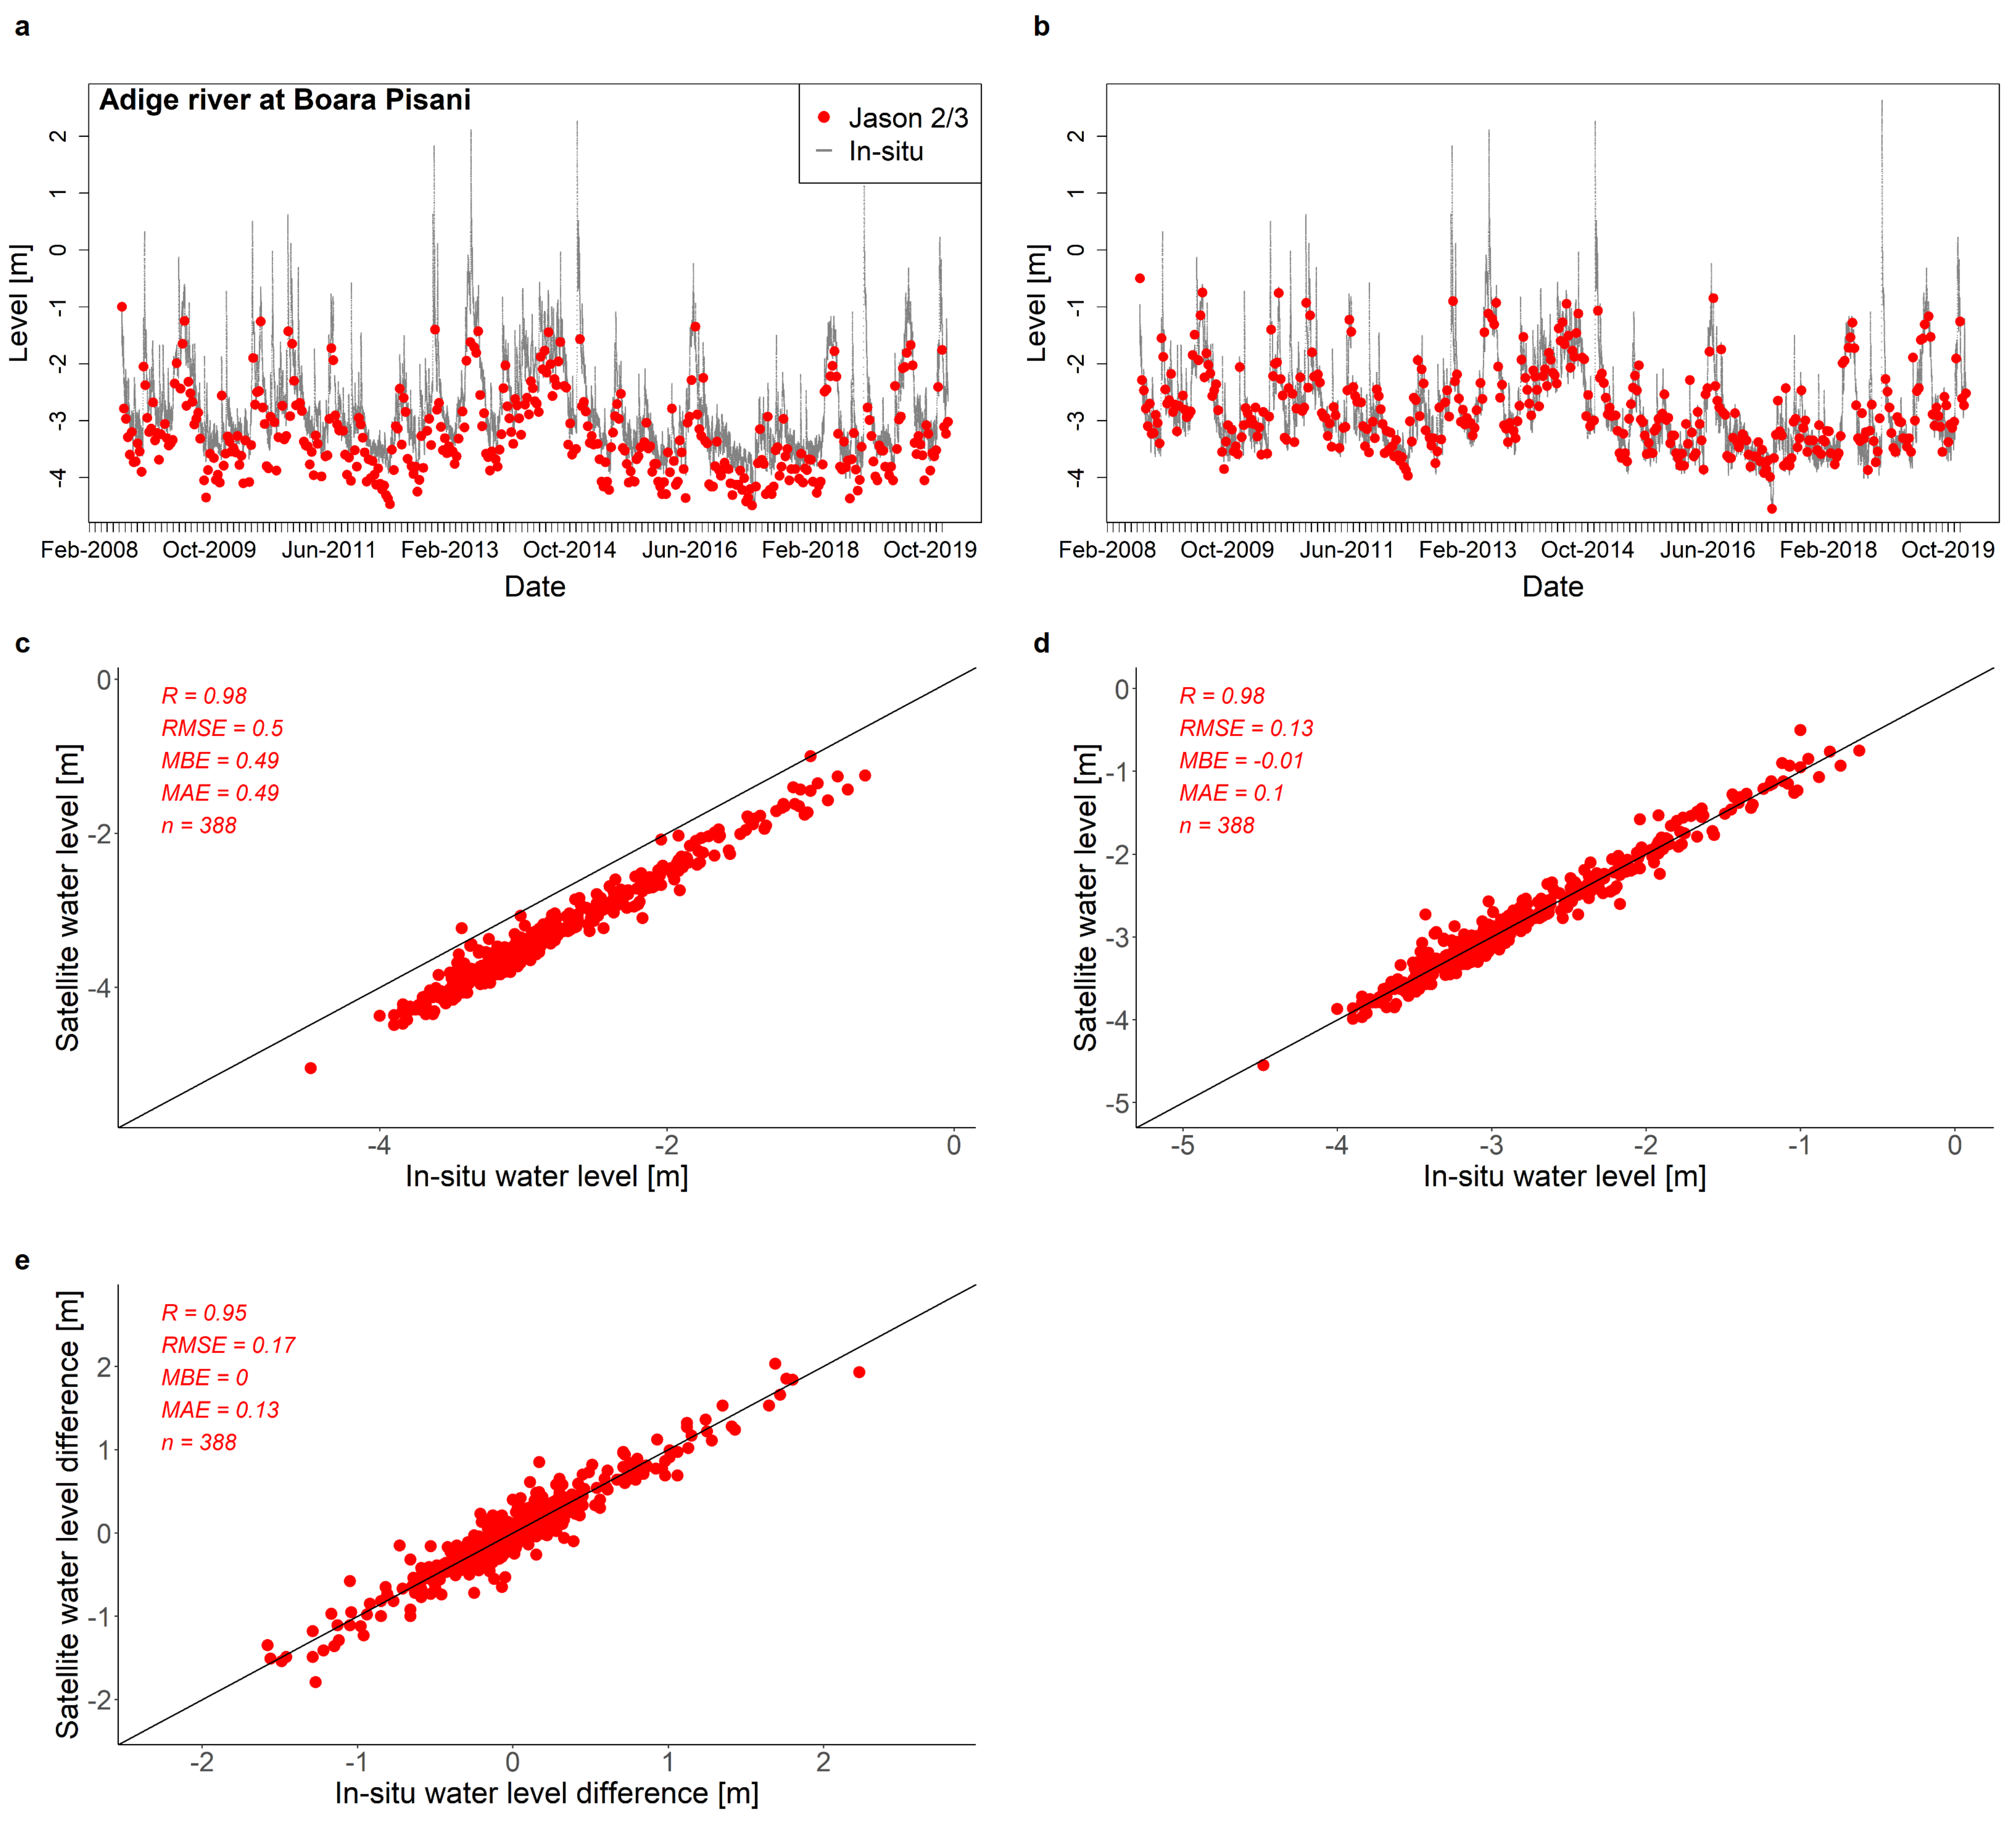
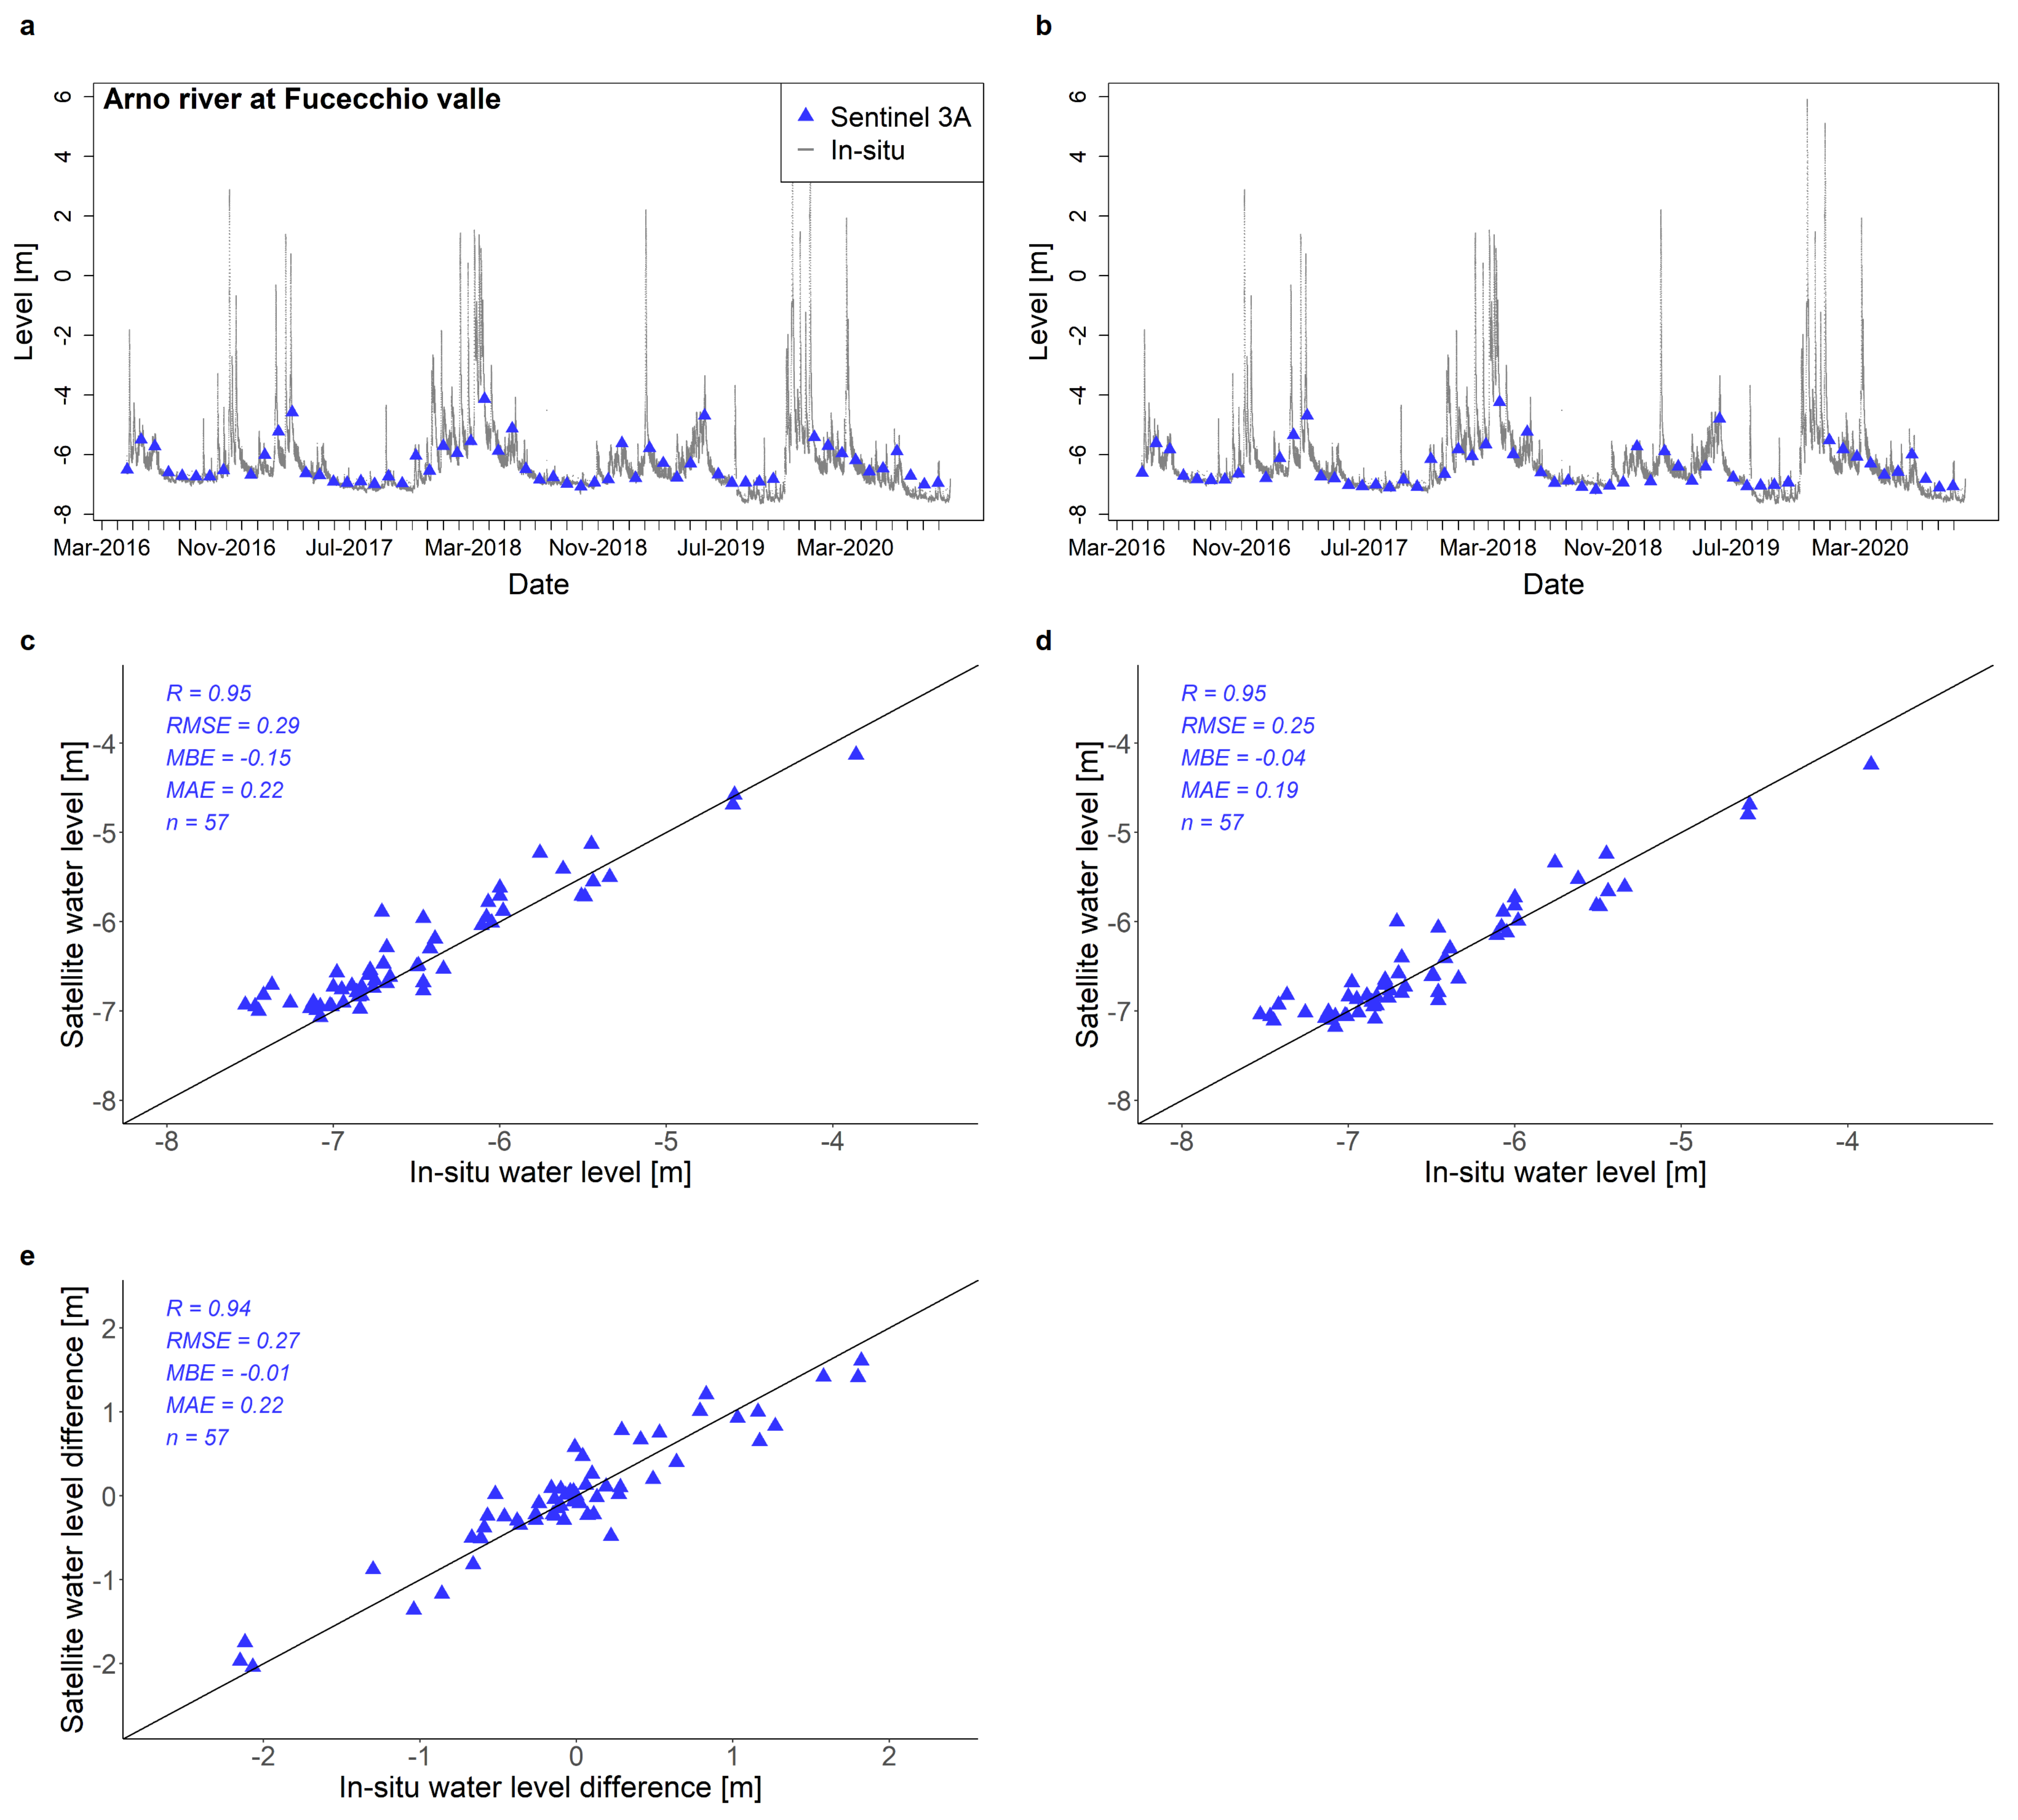
Regarding the relationship between altitude and performance found by Jiang et al. [47], we cannot lead to similar conclusions since all the stations considered are at a low altitude (less than 200 m a.s.l.). For the stations Ficarolo and Pontelagoscuro, there is a multiple satellite passage. We calculate the temporal variability of water level from in situ and satellite measurements, reported in Figure 5 and Figure 6, assuming for the initial water level value for the satellites (a); calibrating the initial water level value (b); the scatter plot of satellite and in situ measurements of the water level, assuming for the satellite measurements the initial water level value (c); calibrating the initial water level value; (d) and the scatter plot of satellite and in situ water level differences (e). It has been done similarly for the Adige river at Badia Polesine, the Po river at Boretto, the Adige river at Boara Pisani, and the Arno river at Fucecchio Valle (Figure A1, Figure A2, Figure A3 and Figure A4 of the Appendix A). Comparing different satellites, it is possible to note that Sentinel 3A measurements show a better agreement with in situ measurements with respect to Jason 2/3, over all the range of river widths, including the smaller widths, as can be seen from Figure 4. The widest boxplots with the longest whiskers were found for Tevere at Ponte Nuovo (Sentinel 3B), and Po at Ficarolo and Arno at Pisa a Sostegno (both Jason 2/3). The high variability of Sentinel 3B performance for the station of Ponte Nuovo can be explained by the terrain topographic conformation (presence of meanders or small cascades) or by the possible interaction between orientation of the rivers and the satellite ground track. In general, it is possible to see (1) an overall good agreement between satellite and in situ measurements indicating a feasibility of satellite to retrieve the water level also for narrow river section widths (Figure 4, Figure 5 and Figure 6). For the Ficarolo and Pontelagoscuro stations, we can compare the performances of Sentinel 3A and Jason 2/3. For both of these stations, we can see that the Sentinel 3 data are well distributed along the line, whereas there exists much greater dispersion for Jason 2/3 data (Figure 5 and Figure 6). The worst performances of satellite measurements are for low values of water level, as can be seen from Figure 5 and Figure 6. This issue was also pointed out by [17].

4. Conclusions and Perspectives

Every year, floods and droughts cause huge and widespread damage worldwide in terms of economic and human losses. A proper system of water level monitoring in a territory is essential to realize effective mitigation procedures and a resilient society. Traditional ground sensors are often disused, or not present, especially in mountain areas and less developed or remote areas where there are not logistic/financial supports for creating a proper system of measurements. In this respect, remote sensing techniques may provide a valid support. Satellite data can be obtained for free, and easy download and near-real time measurements can be retrieved for monitoring the river section. The drawback is the time coverage of these measurements, which, at present, is up to 30 days. Past studies have pointed out the difficulties of altimeter missions to achieve good performances for the smaller river sections due to contamined waveforms [47]. Indeed, in low waters, there can be more sand benches or wet river boundaries, which represent echogenic surfaces and degrade the altimeter accuracy. Considering a small extension along the river, there can be errors, or data cannot represent the seasonal space variation of river [17]. Despite this, some good results have also been obtained for smaller rivers [56].
In our analysis, we considered 22 pairs with a range of river section width between 50 and 555 m. Comparing satellite and in situ stations in terms of absolute values with the calibrated systematic bias, we found a median correlation of 0.87, 0.27 m of RMSE, −0.02 m of MBE, and 0.19 m of MAE. For the largest river sections, in the [260–555] m interval, the median of Pearson correlation is of 0.95, 0.26 m of RMSE, −0.03 m of MBE, and 0.16 m of MAE. These in situ stations belong to the Po river, one of the largest rivers in Italy. The results also showed that, for rivers with lower width, the match between satellite and in situ measurements can be good; considering just the river sections with a width less than 100 m (10 pairs), we found a median of Pearson correlation of 0.77, RMSE of 0.38 m, MAE of 0.22 m, and MBE of 0.025 m. The results for these stations even improve if we just consider the Sentinel 3A measures (median values: 0.87 of correlation, 0.23 m RMSE, −0.02 m MBE and 0.14 m MAE). Therefore, we found an high accuracy of Copernicus measures also considering smaller river stations.
Overall, the results lead us to conclude that Jason 2/3 and Sentinel 3A missions provided altimeter data that can be implemented and used for river monitoring, also in the case of Italian rivers. Whereas we did not find a correlation between performance and river width, the environment (presence of meanders and smalls cascades) and the orientation between satellite ground track and river seem to be possible influencing factors. The stations considered in this study represent ’validation sites’ for altimetric products. In addition, this analysis may provide confidence in the altimetry dataset over other areas of the world where in situ data are not available.
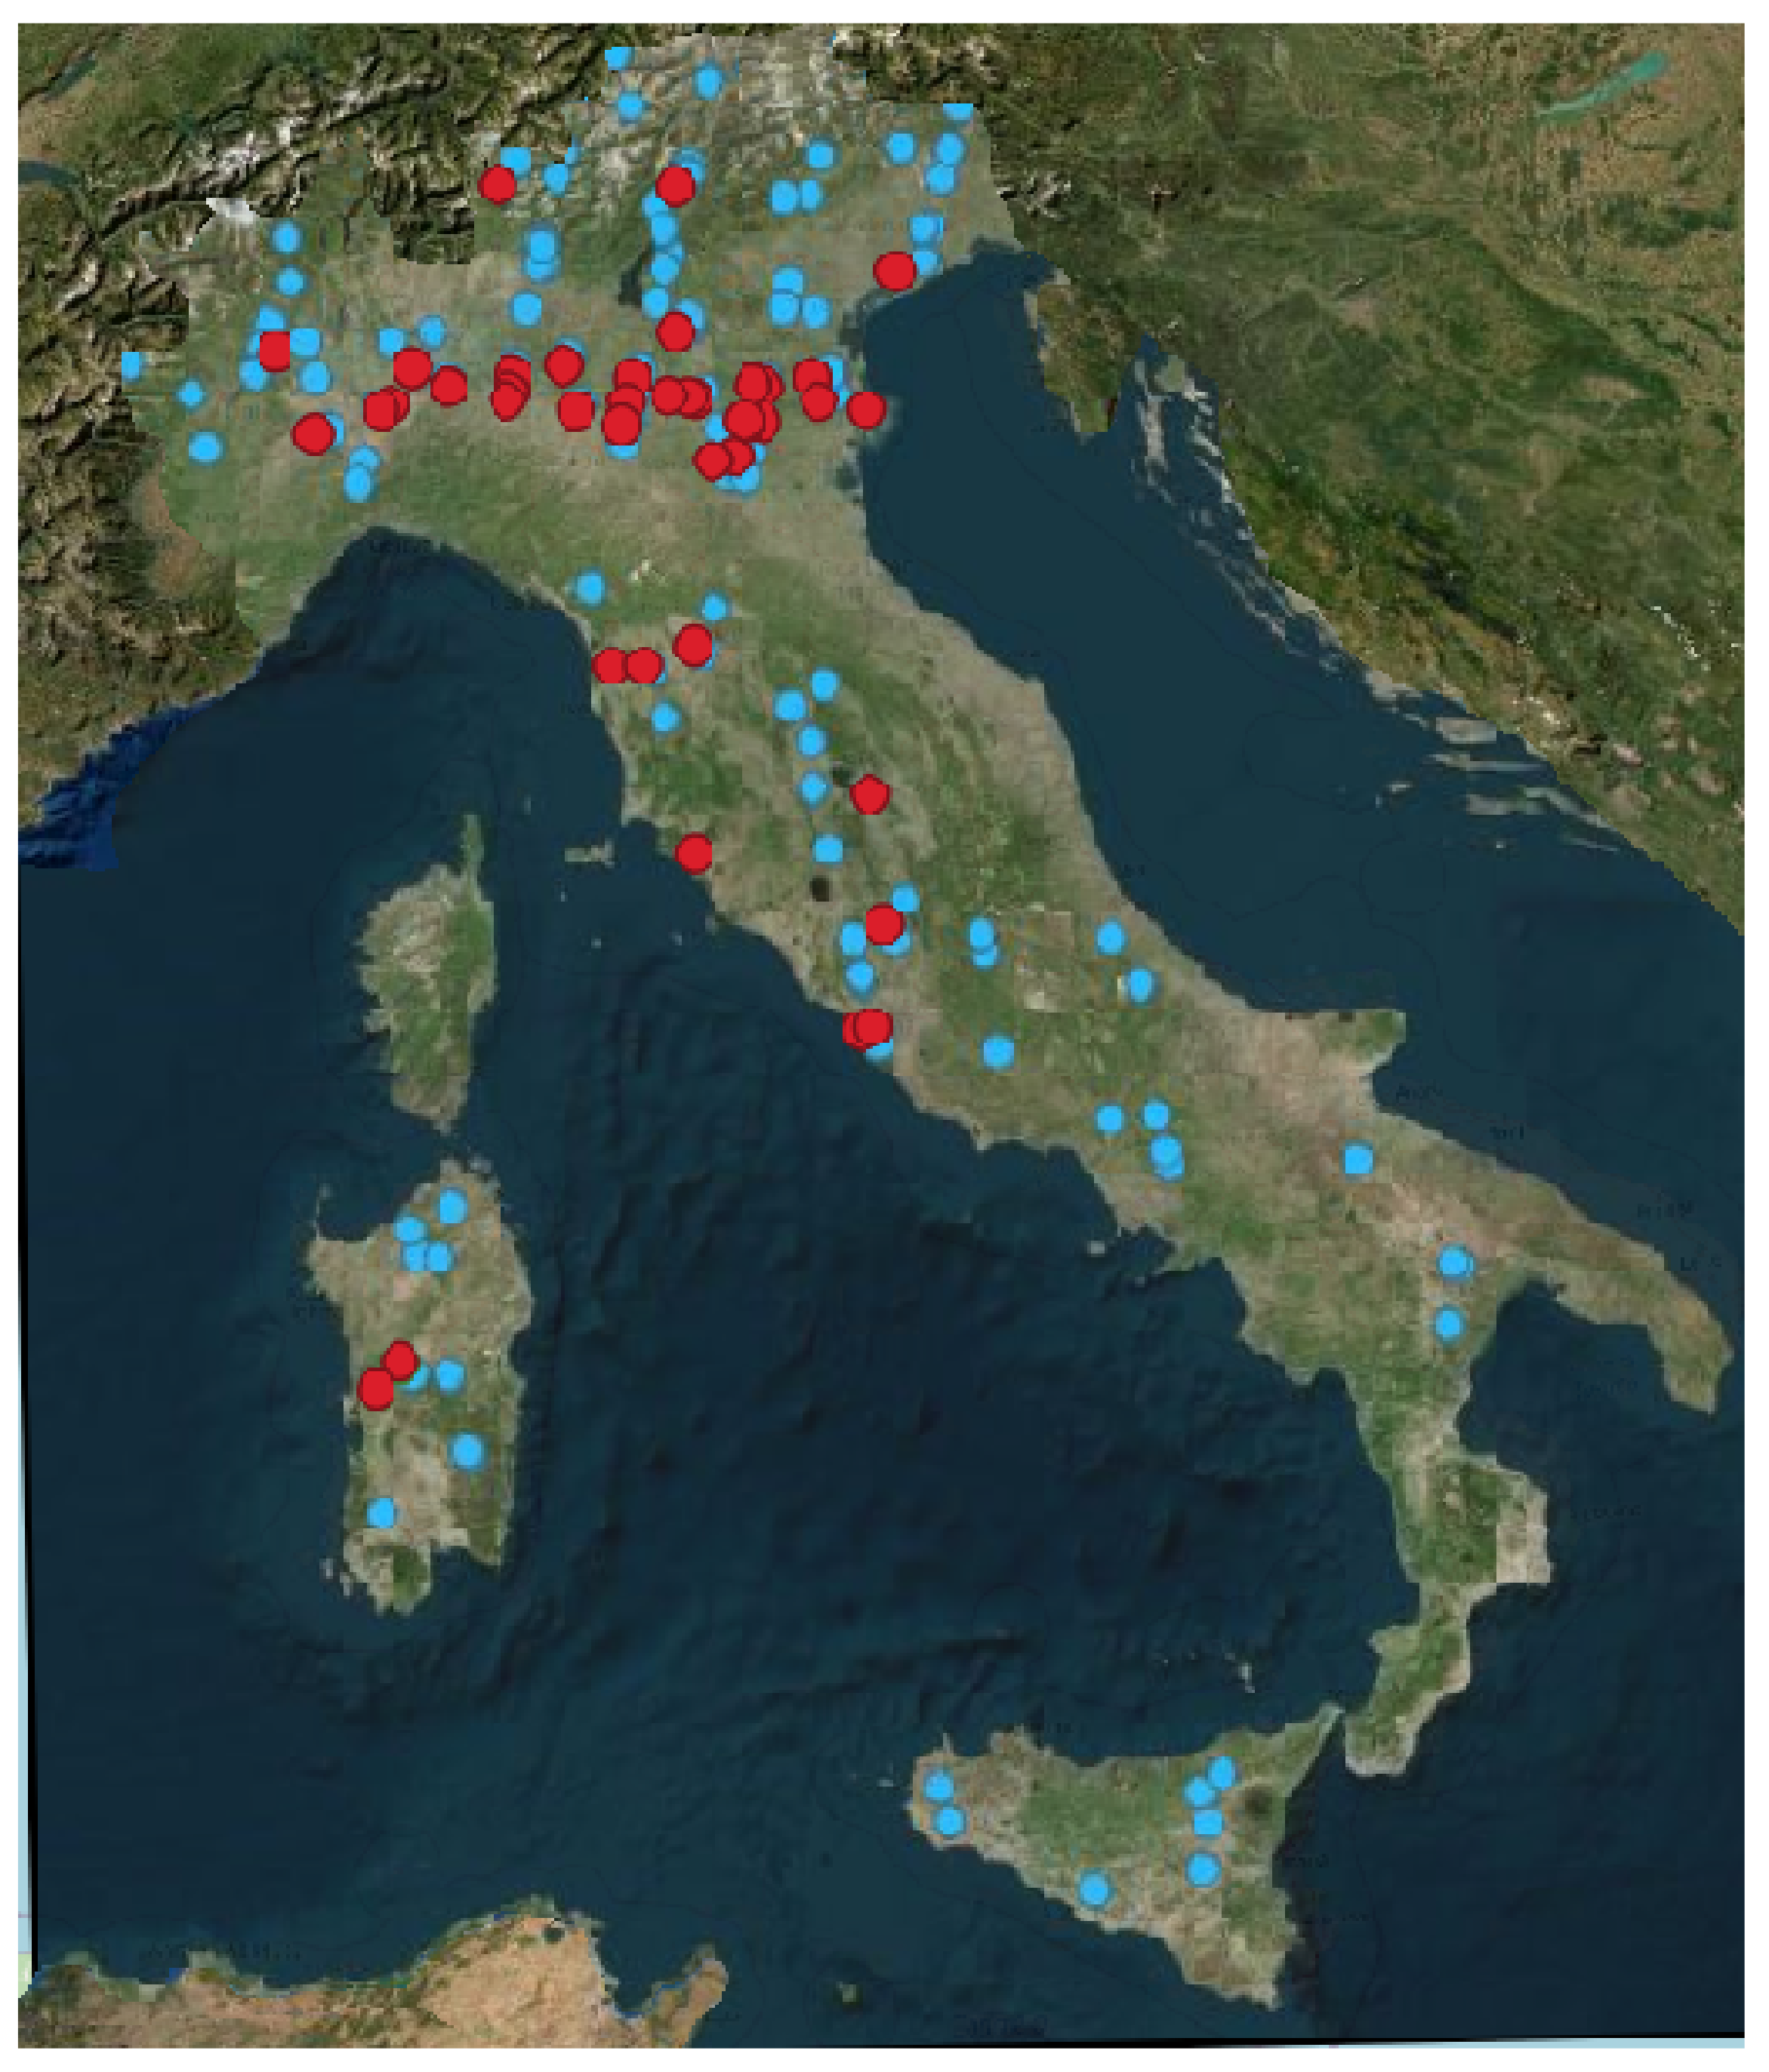
Satellite data will be more exploited in the future. Indeed, the improvements brought by the Open Loop tracking mode (on-board in Jason 3, Sentinel 3A, and Sentinel 3B) and the regular updates of its associated open-loop tracking commands (OLTC), which allow positioning the altimeters’ receiving window, have proved to be of interest to monitor small water targets [57]. Moreover, the Open Loop mode use on Sentinel 3A and Sentinel 3B was extended to latitudes higher than 60°N in November 2020, which yield new virtual stations candidates at high latitudes. Associated with the yearly updates of the OLTC onboard, these altimeters (the last version of Sentinel 3A (v3.1), and Sentinel 3B (v6.1) OLTC were uploaded in August 2021), it will continue to allow defining new targets; see Figure 7. Moreover, the technology used for altimeter measures is currently being improved. Advanced instruments are being tested to improve the quality of data. For example, with Fully Focus SAR processing (already tested on some R&D processing chains of the Sentinel 3 data), there is the possibility of having altimeter data every 50 cm (data are currently provided every 300 m). Fully Focused SAR is a technique that allows coherent integration of the echos from the radar burst that illuminate a target [58]. This would improve the quality for small river sections in the future.
New missions are scheduled; for example, the constellation of small altimetry satellites dedicated to continental surface waters (SMASH) [60] or the SWOT mission is scheduled to be launched in 2022 for accurate future monitoring of local sea level changes at the land-sea interface [61]. The results of comparison with in situ data show that altimetry measurements can provide a valid way of retrieving water level by also considering narrow river sections. The scheduled future implementations of this technology and the new available targets will lead to the settling of a new type of level measurements that can be integrated in the currently water management procedure for risk assessment and territory control.

Author Contributions

Conceptualization, C.D.M. and A.N.A.; methodology, C.D.M. and. A.N.A.; formal analysis, C.D.; Resources, S.P.; writing—original draft preparation, C.D.; writing—review and editing, C.D.M., C.D., A.N.A., S.P. and N.T.; visualization, C.D.; supervision, C.D.M, N.T. and A.N.A. All authors have read and agreed to the published version of the manuscript.

Funding

This research received no external funding.

Institutional Review Board Statement

Not applicable.

Informed Consent Statement

Not applicable.

Data Availability Statement

Publicly available datasets were analyzed in this study. This data can be found here: https://land.copernicus.eu/global/products/wl (accessed on 20 August 2020).

Acknowledgments

We wish to acknowledge Autorità di Bacino del Po, Arpa Lombardia, Arpa Veneto, Servizio Idrologico Regione Toscana, Regione Lazio, and Regione Umbria for providing in situ data. We thank the Associate Editor and the anonymous Reviewers for their positive and constructive comments, which helped to improve the presentation of our results.

Conflicts of Interest

The authors declare no conflict of interest.

Appendix A

Appendix A.1

Figure A1. Adige river at Badia Polesine (Veneto): (a) temporal variability of satellite and in situ water level, where the satellite water levels are obtained imposing the initial water level; (b) same as panel (a), but the initial water level was calibrated; (c) scatterplot satellite-in situ water levels given in panel (a); (d) scatterplot satellite-in situ water levels given in panel (b); (e) scatterplot satellite-in situ water level differences.
Remotesensing 13 04456 g0a1

Appendix A.2

Figure A2. Po river at Boretto (Emilia Romagna): (a) temporal variability of satellite and in situ water level, where the satellite water levels are obtained imposing the initial water level; (b) same as panel (a) but the initial water level was calibrated; (c) scatterplot satellite-in situ water levels given in panel (a); (d) scatterplot satellite-in situ water levels given in panel (b); (e) scatterplot satellite-in situ water level differences.
Remotesensing 13 04456 g0a2

Appendix A.3

Figure A3. Adige river at Boara Pisani (Veneto): (a) temporal variability of satellite and in situ water level, where the satellite water levels are obtained by imposing the initial water level; (b) same as in panel (a) but the initial water level was calibrated; (c) scatterplot satellite-in situ water levels given in panel (a); (d) scatterplot satellite-in situ water levels given in panel (b); (e) scatterplot satellite-in situ water level differences.
Remotesensing 13 04456 g0a3

Appendix A.4

Figure A4. Arno river at Fucecchio valle (Tuscany): (a) temporal variability of satellite and in situ water level, where the satellite water levels are obtained imposing the initial water level; (b) same as panel (a) but the initial water level was calibrated; (c) scatterplot satellite-in situ water levels given in panel (a); (d) scatterplot satellite-in situ water levels given in panel (b); (e) scatterplot satellite-in situ water level differences.
Remotesensing 13 04456 g0a4

References

  1. Ponziani, F.; Pandolfo, C.; Stelluti, M.; Berni, N.; Brocca, L.; Moramarco, T. Assessment of rainfall thresholds and soil moisture modeling for operational hydrogeological risk prevention in the Umbria region (central Italy). Landslides 2012, 9, 229–237. [Google Scholar] [CrossRef]
  2. Mondino, E.; Scolobig, A.; Borga, M.; Albrecht, F.; Mård, J.; Weyrich, P.; Di Baldassarre, G. Exploring changes in hydrogeological risk awareness and preparedness over time: A case study in northeastern Italy. Hydrol. Sci. J. 2020, 65, 1049–1059. [Google Scholar] [CrossRef] [Green Version]
  3. Trigila, A.; Iadanza, C.; Bussettini, M.; Lastoria, B. Dissesto idrogeologico in Italia: Pericolosità e indicatori di rischio—ISPRA Edizione 2018; Report 287/2018; ISPRA: Rome, Italy, 2018.
  4. EU Water Directors. Best Practices on Flood Prevention, Protection and Mitigation. Meetings in Budapest on 30 November and 1 December 2002, and in Bonn on 5/6 February 2003. 2003. Available online: https://ec.europa.eu/environment/water/flood_risk (accessed on 19 July 2021).
  5. Dixon, H.; Hannaford, J.; Fry, M.J. The effective management of national hydrometric data: Experiences from the United Kingdom. Hydrol. Sci. J. 2013, 58, 1383–1399. [Google Scholar] [CrossRef] [Green Version]
  6. ISPRA—Idro: V Riunione: Il Monitoraggio delle Portate: Stato e Criticità. Available online: http://www.isprambiente.gov.it (accessed on 27 September 2021).
  7. WMO Hydrological Observing System (WHOS). Available online: https://community.wmo.int/activity-areas/wmo-hydrological-observing-system-whos (accessed on 27 September 2021).
  8. Engman, E.T. Applications of microwave remote sensing of soil moisture for water resources and agriculture. Remote Sens. Environ. 1991, 35, 213–226. [Google Scholar] [CrossRef]
  9. Gould, W. Remote sensing of vegetation, plant species, and regional biodiversity hotspots. Ecol. Appl. 2000, 10, 1861–1870. [Google Scholar] [CrossRef]
  10. Shahabi, H.; Hashim, M. Landslide susceptibility mapping using GIS-based statistical models and Remote sensing data in tropical environment. Sci. Rep. 2015, 5, 9899. [Google Scholar] [CrossRef] [PubMed] [Green Version]
  11. Stisen, S.; Sandholt, I. Evaluation of remote-sensing-based rainfall products through predictive capability in hydrological runoff modelling. Hydrol. Process. 2010, 24, 879–891. [Google Scholar] [CrossRef]
  12. Paciolla, N.; Corbari, C.; Al Bitar, A.; Kerr, Y.; Mancini, M. Irrigation and Precipitation Hydrological Consistency with SMOS, SMAP, ESA-CCI, Copernicus SSM1km, and AMSR-2 Remotely Sensed Soil Moisture Products. Remote Sens. 2020, 12, 3737. [Google Scholar] [CrossRef]
  13. Arslan, A.; Akyürek, Z. Remote Sensing of Snow and Its Applications; MDPI: Basel, Switzerland, 2021. [Google Scholar] [CrossRef]
  14. Bongio, M.; Arslan, A.N.; Tanis, C.M.; De Michele, C. Snow depth time series retrieval by time-lapse photography: Finnish and Italian case studies. Cryosphere 2021, 15, 369–387. [Google Scholar] [CrossRef]
  15. Munyaneza, O.; Wali, U.G.; Uhlenbrook, S.; Maskey, S.; Mlotha, M.J. Water level monitoring using radar remote sensing data: Application to Lake Kivu, central Africa. Phys. Chem. Earth 2009, 34, 722–728. [Google Scholar] [CrossRef]
  16. Brando, V.E.; Dekker, A.G. Satellite hyperspectral remote sensing for estimating estuarine and coastal water quality. IEEE Trans. Geosci. Remote Sens. 2003, 41, 1378–1387. [Google Scholar] [CrossRef]
  17. Taburet, N.; Vayre, M.; Calmettes, B.; Zawadzki, L.; Paris, A.; Calmant, S.; Crétaux, J.F. Copernicus Global Land Operations “Cryosphere and Water”: Quality Assessment Report—Lake and River Water Level, pp. 1–60. 2020. Available online: https://land.copernicus.eu/global (accessed on 20 August 2021).
  18. Calmant, S.; Seyler, F. Continental surface waters from satellite altimetry. C. R. Geosci. 2006, 338, 1113–1122. [Google Scholar] [CrossRef]
  19. Jiang, L.; Nielsen, K.; Andersen, O.B.; Bauer-Gottwein, P. CryoSat-2 radar altimetry for monitoring freshwater resources of China. Remote Sens. Environ. 2017, 200, 125–139. [Google Scholar] [CrossRef] [Green Version]
  20. Song, C.; Huang, B.; Ke, L. Modeling and analysis of lake water storage changes on the Tibetan Plateau using multi-mission satellite data. Remote Sens. Environ. 2013, 135, 25–35. [Google Scholar] [CrossRef]
  21. Duan, Z.; Bastiaanssen, W. Estimating water volume variations in lakes and reservoirs from four operational satellite altimetry databases and satellite imagery data. Remote Sens. Environ. 2013, 134, 403–416. [Google Scholar] [CrossRef]
  22. Kropáček, J.; Braun, A.; Kang, S.; Feng, C.; Ye, Q.; Hochschild, V. Analysis of lake level changes in Nam Co in central Tibet utilizing synergistic satellite altimetry and optical imagery. Int. J. Appl. Earth Observ. Geoinf. 2012, 17, 3–11. [Google Scholar] [CrossRef]
  23. Frappart, F.; Papa, F.; Famiglietti, J.S.; Prigent, C.; Rossow, W.B.; Seyler, F. Interannual variations of river water storage from a multiple satellite approach: A case study for the Rio Negro River basin. J. Geophys. Res. Atmos. 2008, 113. [Google Scholar] [CrossRef] [Green Version]
  24. Sichangi, A.W.; Wang, L.; Yang, K.; Chen, D.; Wang, Z.; Li, X.; Zhou, J.; Liu, W.; Kuria, D. Estimating continental river basin discharges using multiple remote sensing data sets. Remote Sens. Environ. 2016, 179, 36–53. [Google Scholar] [CrossRef] [Green Version]
  25. Michailovsky, C.I.; McEnnis, S.; Berry, P.A.M.; Smith, R.; Bauer-Gottwein, P. River monitoring from satellite radar altimetry in the Zambezi River basin. Hydrol. Earth Syst. Sci. 2012, 16, 2181–2192. [Google Scholar] [CrossRef] [Green Version]
  26. Leon, J.; Calmant, S.; Seyler, F.; Bonnet, M.P.; Cauhopé, M.; Frappart, F.; Filizola, N.; Fraizy, P. Rating curves and estimation of average water depth at the upper Negro River based on satellite altimeter data and modeled discharges. J. Hydrol. 2006, 328, 481–496. [Google Scholar] [CrossRef] [Green Version]
  27. Tarpanelli, A.; Barbetta, S.; Brocca, L.; Moramarco, T. River Discharge Estimation by Using Altimetry Data and Simplified Flood Routing Modeling. Remote Sens. 2013, 5, 4145–4162. [Google Scholar] [CrossRef] [Green Version]
  28. Crétaux, J.F.; Birkett, C. Lake studies from satellite radar altimetry. C. R. Geosci. 2006, 338, 1098–1112. [Google Scholar] [CrossRef]
  29. Alsdorf, D.E.; Lettenmaier, D. Tracking freshwater from space. Science 2003, 301, 1098–1112. [Google Scholar] [CrossRef] [PubMed] [Green Version]
  30. Coe, M.T.; Birkett, C.M. Calculation of river discharge and prediction of lake height from satellite radar altimetry: Example for the Lake Chad basin. Water Resour. Res. 2004, 40. [Google Scholar] [CrossRef]
  31. Alsdorf, D.E.; Rodríguez, E.; Lettenmaier, D.P. Measuring surface water from space. Rev. Geophys. 2007, 45, 1–24. [Google Scholar] [CrossRef]
  32. Schwatke, C.; Dettmering, D.; Bosch, W.; Seitz, F. DAHITI—An innovative approach for estimating water level time series over inland waters using multi-mission satellite altimetry. Hydrol. Earth Syst. Sci. 2015, 19, 4345–4364. [Google Scholar] [CrossRef] [Green Version]
  33. Frappart, F.; Calmant, S.; Cauhopé, M.; Seyler, F.; Cazenave, A. Preliminary results of ENVISAT RA-2-derived water levels validation over the Amazon basin. Remote Sens. Environ. 2006, 100, 252–264. [Google Scholar] [CrossRef] [Green Version]
  34. Cretaux, J.; Bergé-Nguyen, M.; Calmant, S.; Jamangulova, N.; Satylkanov, R.; Lyard, F.; Perosanz, F.; Verron, J.; Samine Montazem, A.; Guilcher, G.; et al. Absolute Calibration or Validation of the Altimeters on the Sentinel-3A and the Jason-3 over Lake Issykkul (Kyrgyzstan). Remote Sens. 2018, 10, 1679. [Google Scholar] [CrossRef] [Green Version]
  35. Birkinshaw, S.J.; O’Donnell, G.M.; Moore, P.; Kilsby, C.G.; Fowler, H.J.; Berry, P.A.M. Using satellite altimetry data to augment flow estimation techniques on the Mekong River. Hydrol. Process. 2010, 24, 3811–3825. [Google Scholar] [CrossRef]
  36. Bogning, S.; Frappart, F.; Blarel, F.; Niño, F.; Mahé, G.; Bricquet, J.P.; Seyler, F.; Onguéné, R.; Etamé, J.; Paiz, M.C.; et al. Monitoring Water Levels and Discharges Using Radar Altimetry in an Ungauged River Basin: The Case of the Ogooué. Remote Sens. 2018, 10, 350. [Google Scholar] [CrossRef] [Green Version]
  37. De Oliveira Campos, I.; Mercier, F.; Maheu, C.; Cochonneau, G.; Kosuth, P.; Blitzkow, D.; Cazenave, A. Temporal variations of river basin waters from Topex/Poseidon satellite altimetry. Application to the Amazon basin. C. R. Acad. Sci.–Ser. IIA–Earth Planet. Sci. 2001, 333, 633–643. [Google Scholar] [CrossRef]
  38. Birkett, C.M.; Mertes, L.A.; Dunne, T.; Costa, M.H.; Jasinski, M.J. Surface water dynamics in the Amazon Basin: Application of satellite radar altimetry. J. Geophys. Res. Atmos. 2002, 107, LBA-26. [Google Scholar] [CrossRef]
  39. Santos da Silva, J.; Calmant, S.; Seyler, F.; Rotunno Filho, O.C.; Cochonneau, G.; Mansur, W.J. Water levels in the Amazon basin derived from the ERS 2 and ENVISAT radar altimetry missions. Remote Sens. Environ. 2010, 114, 2160–2181. [Google Scholar] [CrossRef]
  40. Le Roy, Y.; Deschaux-Beaume, M.; Mavrocordatos, C.; Aguirre, M.; Hélière, F. SRAL SAR radar altimeter for Sentinel-3 mission. In Proceedings of the International Geoscience and Remote Sensing Symposium (IGARSS), Barcelona, Spain, 23–28 July 2007; pp. 219–222. [Google Scholar] [CrossRef]
  41. Liibusk, A.; Kall, T.; Rikka, S.; Uiboupin, R.; Suursaar, Ü.; Tseng, K.H. Validation of Copernicus Sea Level Altimetry Products in the Baltic Sea and Estonian Lakes. Remote Sens. 2020, 12, 4062. [Google Scholar] [CrossRef]
  42. Gao, Q.; Makhoul, E.; Escorihuela, M.J.; Zribi, M.; Quintana Seguí, P.; García, P.; Roca, M. Analysis of Retrackers’ Performances and Water Level Retrieval over the Ebro River Basin Using Sentinel-3. Remote Sens. 2019, 11, 718. [Google Scholar] [CrossRef] [Green Version]
  43. Frappart, F.; Blarel, F.; Fayad, I.; Bergé-Nguyen, M.; Cretaux, J.; Shu, S.; Schregenberger, J.; Baghdadi, N. Evaluation of the Performances of Radar and Lidar Altimetry Missions for Water Level Retrievals in Mountainous Environment: The Case of the Swiss Lakes. Remote Sens. 2021, 13, 2196. [Google Scholar] [CrossRef]
  44. Huang, Q.; Li, X.; Han, P.; Long, D.; Zhao, F.; Hou, A. Validation and application of water levels derived from Sentinel-3A for the Brahmaputra River. Sci. China Technol. Sci 2019, 62, 1760–1772. [Google Scholar] [CrossRef]
  45. Kittel, C.; Jiang, L.; Tøttrup, C.; Bauer-Gottwein, P. Sentinel-3 radar altimetry for river monitoring—A catchment-scale evaluation of satellite water surface elevation from Sentinel-3A and Sentinel-3B. Hydrol. Earth Syst. Sci. 2021, 25, 333–357. [Google Scholar] [CrossRef]
  46. Tarpanelli, A.; Camici, S.; Nielsen, K.; Brocca, L.; Moramarco, T.; Benveniste, J. Potentials and limitations of Sentinel-3 for river discharge assessment. Adv. Space Res. 2021, 68, 593–606. [Google Scholar] [CrossRef]
  47. Jiang, L.; Nielsen, K.; Dinardo, S.; Andersen, O.B.; Bauer-Gottwein, P. Evaluation of Sentinel-3 SRAL SAR altimetry over Chinese rivers. Remote Sens. Environ. 2020, 237, 111546. [Google Scholar] [CrossRef]
  48. Zakharova, E.; Nielsen, K.; Kamenev, G.; Kouraev, A. River discharge estimation from radar altimetry: Assessment of satellite performance, river scales and methods. J. Hydrol. 2020, 583, 124561. [Google Scholar] [CrossRef]
  49. Fernández, J.; Fernández, C.; Féménias, P.; Peter, H. The Copernicus Sentinel-3 Mission. In Proceedings of the ILRS Workshop 2016, Potsdam, Germany, 9–14 October 2016; pp. 1–6. [Google Scholar]
  50. Donlon, C.; Berruti, B.; Buongiorno, A.; Ferreira, M.H.; Féménias, P.; Frerick, J.; Goryl, P.; Klein, U.; Laur, H.; Mavrocordatos, C.; et al. The Global Monitoring for Environment and Security (GMES) Sentinel-3 mission. Remote Sens. Environ. 2012, 120, 37–57. [Google Scholar] [CrossRef]
  51. Taburet, N.; Zawadzki, L.; Calmant, S.; Crétaux, J.F.; Mercier, F.; Vayre, M. Copernicus Global Land Operations “Cryosphere and Water”: Product User Manual—Lake and River Water Level; pp. 1–41. 2020. Available online: https://land.copernicus.eu/global (accessed on 20 August 2021).
  52. Bauer-Marschallinger, B. Copernicus Global Land Operations “Vegetation and Energy”; p. 51. 2018. Available online: https://land.copernicus.eu/global (accessed on 20 August 2021).
  53. Aviso Pass Locator. Available online: https://www.aviso.altimetry.fr/es/data/tools/pass-locator.html (accessed on 19 July 2021).
  54. Biancamaria, S.; Schaedele, T.; Blumstein, D.; Frappart, F.; Boy, F.; Desjonquères, J.D.; Pottier, C.; Blarel, F.; Niño, F. Validation of Jason-3 tracking modes over French rivers. Remote Sens. Environ. 2018, 209, 77–89. [Google Scholar] [CrossRef] [Green Version]
  55. Tourian, M.J.; Tarpanelli, A.; Elmi, O.; Qin, T.; Brocca, L.; Moramarco, T.; Sneeuw, N. Spatiotemporal densification of river water level time series by multimission satellite altimetry. Water Resour. Res. 2016, 52, 1140–1159. [Google Scholar] [CrossRef] [Green Version]
  56. Biancamaria, S.; Frappart, F.; Leleu, A.S.; Marieu, V.; Blumstein, D.; Desjonquères, J.D.; Boy, F.; Sottolichio, A.; Valle-Levinson, A. Satellite radar altimetry water elevations performance over a 200 m wide river: Evaluation over the Garonne River. Adv. Space Res. 2017, 59, 128–146. [Google Scholar] [CrossRef] [Green Version]
  57. Taburet, N.; Zawadzki, L.; Vayre, M.; Blumstein, D.; Le Gac, S.; Boy, F.; Raynal, M.; Labroue, S.; Crétaux, J.F.; Femenias, P. S3MPC: Improvement on Inland Water Tracking and Water Level Monitoring from the OLTC Onboard Sentinel-3 Altimeters. Remote Sens. 2020, 12, 3055. [Google Scholar] [CrossRef]
  58. Egido, A.; Smith, W. Fully Focused SAR Altimetry: Theory and Applications. IEEE Trans. Geosci. Remote Sens. 2017, 55, 392–406. [Google Scholar] [CrossRef]
  59. Altimeter Open Loop Tracking Command for Hydrology. Available online: https://www.altimetry-hydro.eu/ (accessed on 19 July 2021).
  60. Blumstein, D.; Biancamaria, S.; Guérin, A.; Maisongrande, P. A potential constellation of small altimetry satellites dedicated to continental surface waters (SMASH mission). AGU Fall Meeting Abstracts; H43N-2257. 2019. Available online: https://ui.adsabs.harvard.edu/abs/2019AGUFM.H43N2257B/abstract (accessed on 20 August 2021).
  61. Morrow, R.; Blurmstein, D.; Dibarboure, G. Fine-scale Altimetry and the Future SWOT Mission. In New Frontiers in Operational Oceanography; CreateSpace Independent Publishing Platform: Scotts Valley, CA, USA, 2018. [Google Scholar] [CrossRef] [Green Version]
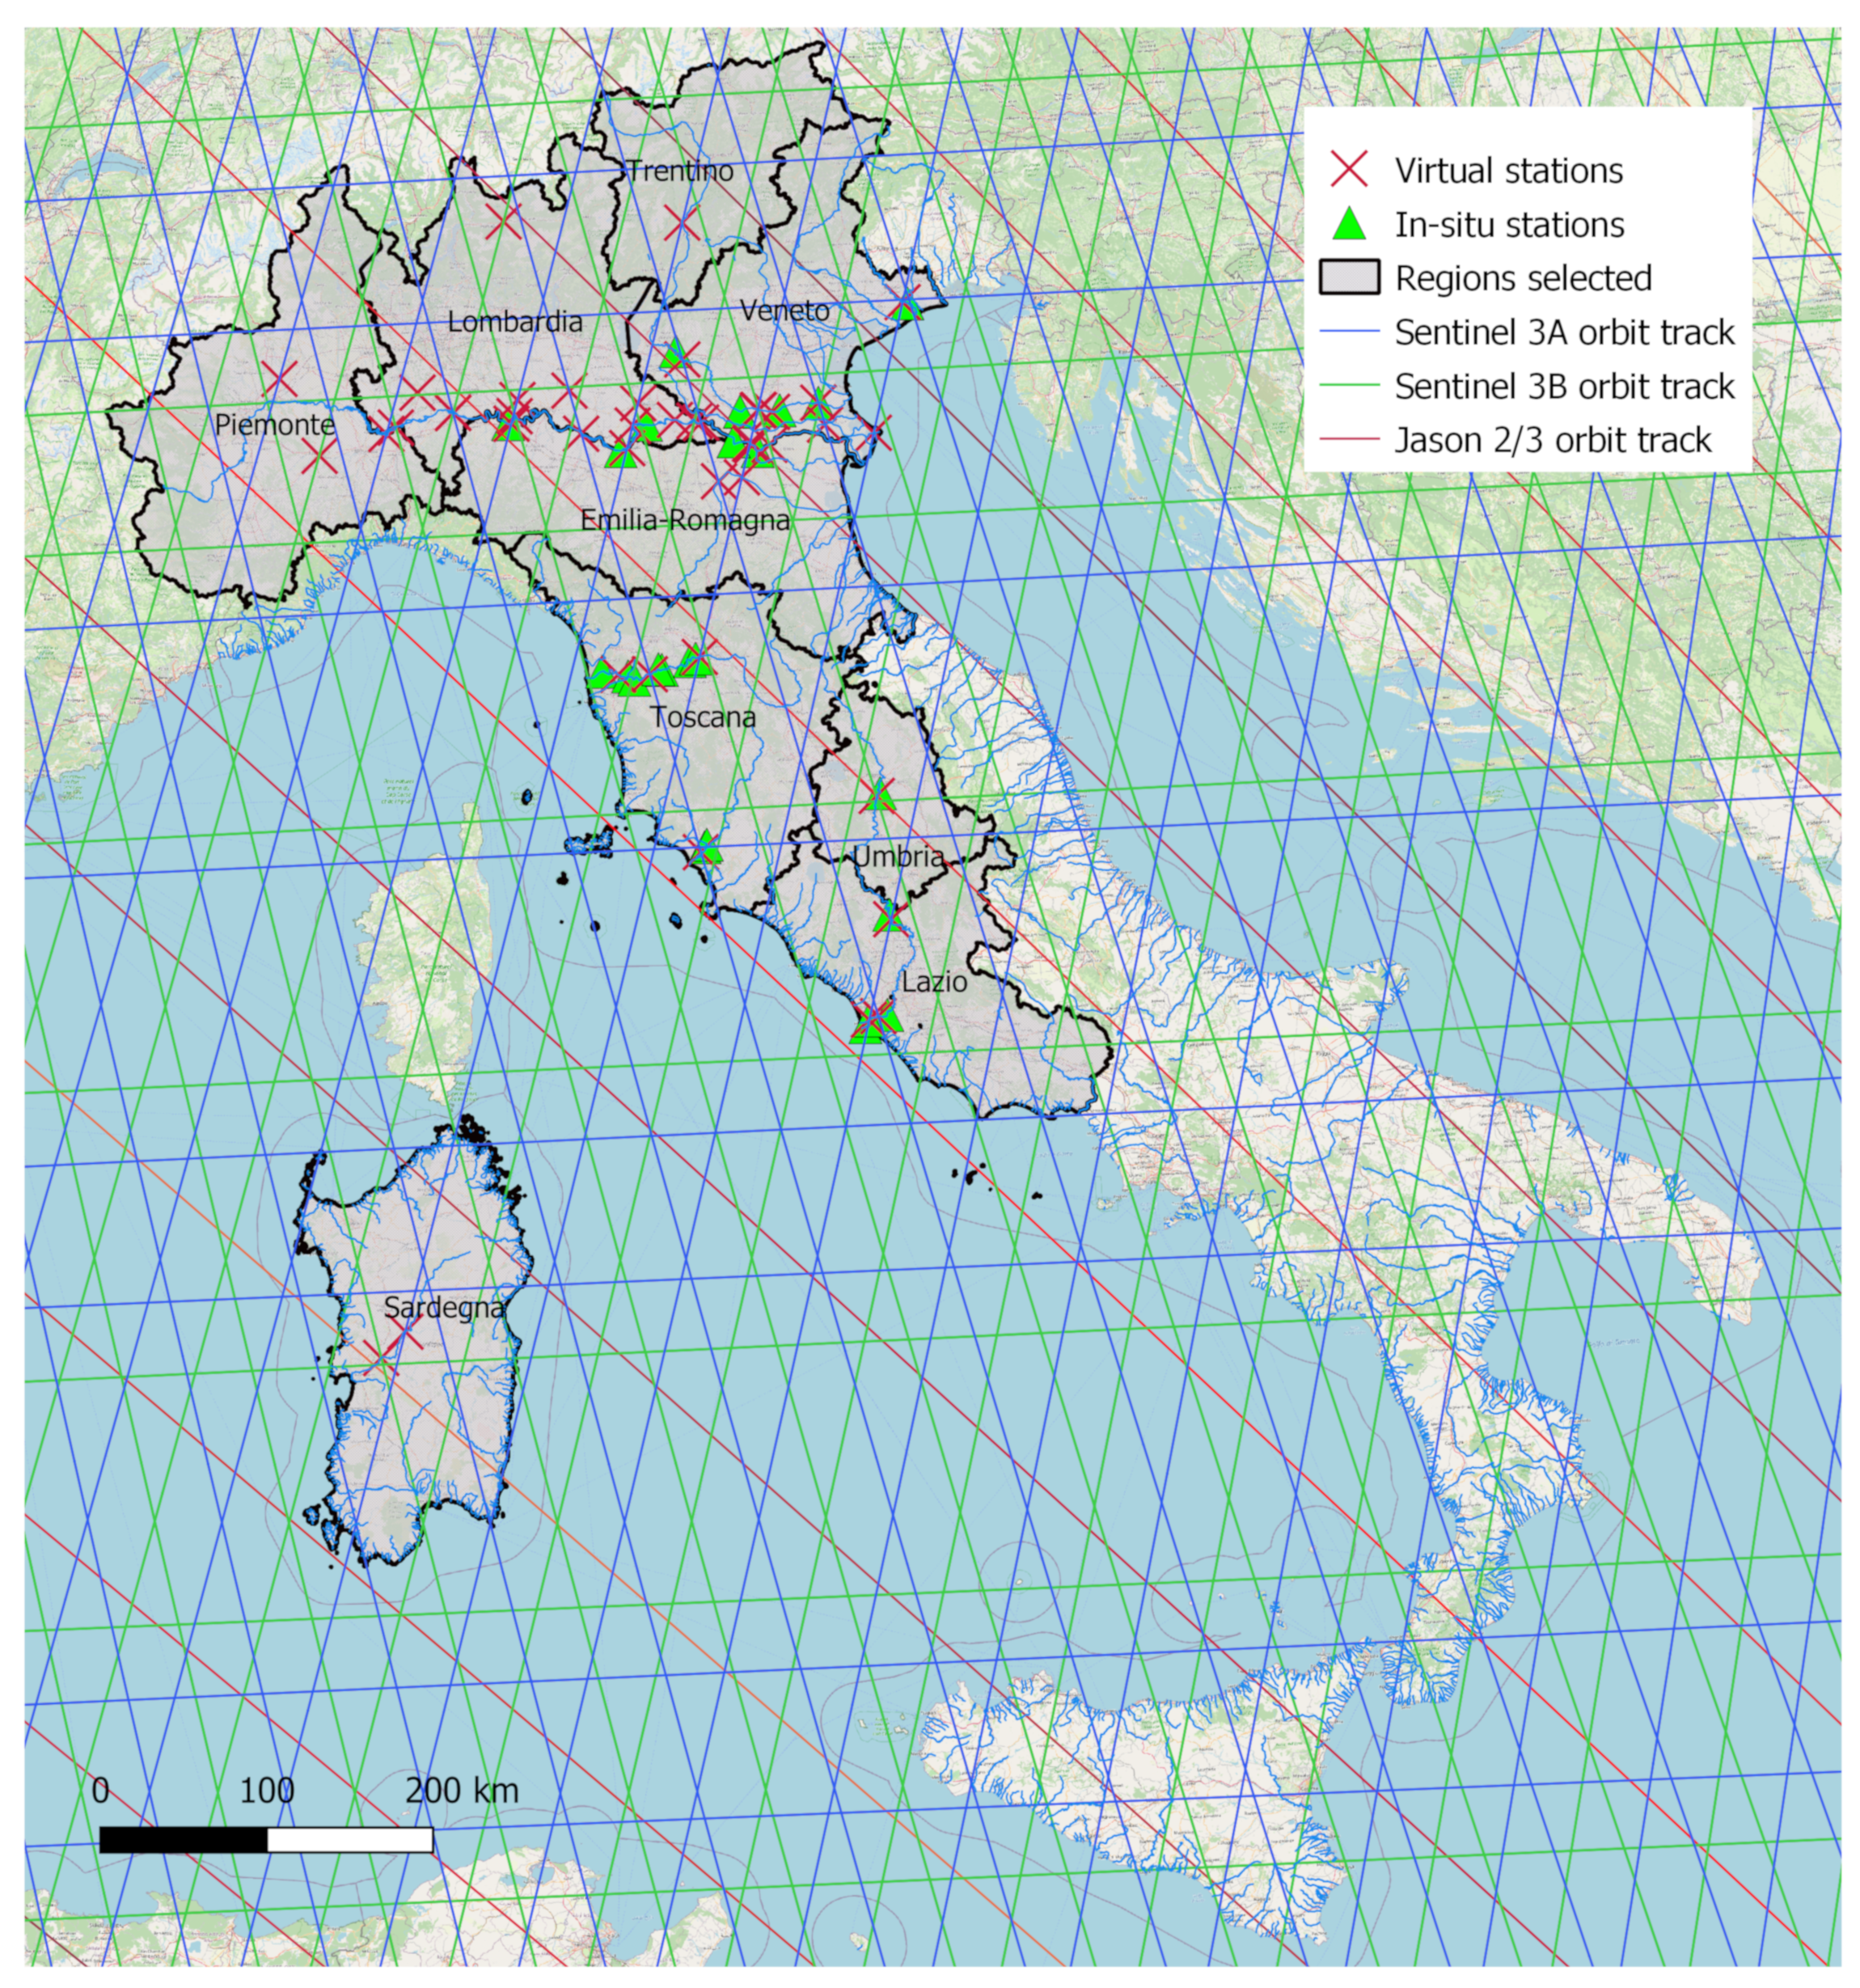
Figure 1. Location of virtual stations (×) and in situ stations (△) in Italy. Orbit ground tracks of Jason 2/3, Satellite 3A, and Satellite 3B obtained from AVISO (Pass locator) [53] and ESA website. In the map are indicated only the regions for which satellite altimetric data are actually available.
Remotesensing 13 04456 g001
Figure 2. Examples of virtual–in situ-coupled selection methodology: (a) discarded pair for the presence of interference, (b) selected pair. Base maps are taken from OpenStreetMap.
Remotesensing 13 04456 g002
Figure 3. Boxplots of the performances in terms of R, RMSE, MAE and MBE comparing in situ and satellite water level differences (in pink), water levels where the satellite water levels are obtained by imposing the initial water level (green), and water levels where the satellite water levels are obtained by calibrating the initial water level (in blue).
Remotesensing 13 04456 g003
Figure 4. (a) Boxplots of the differences (in situ water differences minus satellite water differences) for each of the 22 pairs, with different colors distinguishing the different satellites. (b) Boxplots sorted by river section width.
Remotesensing 13 04456 g004
Figure 5. Po river at Ficarolo (Veneto): (a) temporal variability of satellite and in situ water level, where the satellite water levels are obtained by imposing the initial water level; (b) as in panel (a) but the initial water level was calibrated; (c) scatterplot satellite-in situ water levels given in panel (a); (d) scatterplot satellite-in situ water levels given in panel (b); (e) scatterplot satellite-in situ water level differences.
Remotesensing 13 04456 g005
Figure 6. Po river at Pontelagoscuro (Emilia Romagna): (a) temporal variability of satellite and in situ water levels, where the satellite water levels are obtained by imposing the initial water level; (b) as in panel (a) but the initial water level was calibrated; (c) scatterplot satellite-in situ water levels given in panel (a); (d) scatterplot satellite-in situ water levels given in panel (b); (e) scatterplot satellite-in situ water level differences.
Remotesensing 13 04456 g006
Figure 7. Map of the virtual stations (existing ones indicated with red circles and potential new ones indicated with blue circles) in Italy, for which the altimeter on board DEM (OLTC) is tuned to track the water [59] (V6 DEM was uploaded onboard Sentinel 3A at the end of August 2020 [57]). The quality check of time series of new targets is currently in process. If the new targets satisfy the quality requirements, they could be added to the existing virtual stations, permitting a coverage also of southern Italy and islands, in the next future.
Remotesensing 13 04456 g007
Table 1. Main information related to the in situ station–virtual station pairs selected.
In-Situ Stat.RiverRegionLat. [N]Long. [E]Sect. Width [m]SatelliteVirtual Stat. IDPair Dist. [km]Num. Data
BorettoPoEmilia Romagna44.9110.56329Sentinel 3A86344.3323
PiacenzaPoEmilia Romagna45.069.70260Sentinel 3A86332.0623
PontelagoscuroPoEmilia Romagna44.8911.61444Jason 2/386314.67331
PontelagoscuroPoEmilia Romagna44.8911.61533Sentinel 3A86366.3224
Ponte FeliceTevereLazio42.3512.4666Sentinel 3A99062.9945
Fiumara GrandeTevereLazio41.7512.26113Sentinel 3A99074.9643
MezzocamminoTevereLazio41.8112.4293Sentinel 3A99055.4945
Capo due ramiTevereLazio41.7812.28113.01 *Sentinel 3A99070.5643
La SaluteLivenzaVeneto45.6612.8056Sentinel 3A12,8102.9836
Boara PisaniAdigeVeneto45.1011.78109Jason 2/397264.70388
CavarzereAdigeVeneto45.1412.0883Sentinel 3A97300.0544
Badia PolesineAdigeVeneto45.1011.4895Sentinel 3B973111.3715
Badia PolesineAdigeVeneto45.1011.4889Sentinel 3A972810.6942
FicaroloPoVeneto44.9411.43555Sentinel 3A86369.9247
FicaroloPoVeneto44.9411.43437Jason 2/3863111.39142
Pisa a SostegnoArnoToscana43.7110.3977Jason 2/312,7389.86388
S.G. alla Vena valleArnoToscana43.6810.5977.01 *Jason 2/312,7386.06389
PontederaArnoToscana43.6710.63105Sentinel 3A12,7409.8957
Fucecchio valleArnoToscana43.7210.81105.01*Sentinel 3A12,7405.9357
Ponte Tura AureliaOmbroneToscana42.7611.1450Sentinel 3A98825.8054
Ponte NuovoTevereUmbria43.0112.4353Sentinel 3B99082.5419
PizzighettoneAddaLombardia45.199.78107Sentinel 3A86270.6224
* A fictitious decimal unit is added when the same virtual station corresponds to different in situ stations. This is done to distinguish these pairs in the next boxplots. The river width is measured in correspondence with the virtual station position.
Table 2. Values of R, RMSE, MBE, MAE for the in situ station—virtual station pairs, calculated considering as variable as water level difference as water level. The satellite water levels are determined from satellite water level differences assuming as initial water level the corresponding one observed in the in situ station.
Water Level DifferenceWater Level
In-Situ Stat.SatelliteR [-]RMSE [m]MBE [m]MAE [m]R [-]RMSE [m]MBE [m]MAE [m]
BorettoSentinel 3A0.990.17−0.010.140.980.16−0.080.13
PiacenzaSentinel 3A0.930.35−0.010.200.930.240.010.14
PontelagoscuroJason 2/30.720.7800.480.860.790.450.59
PontelagoscuroSentinel 3A0.970.280.010.200.980.240.050.17
Ponte FeliceSentinel 3A0.800.31−0.010.230.880.40−0.330.35
Fiumara GrandeSentinel 3A0.590.17−0.020.110.610.25−0.190.20
MezzocamminoSentinel 3A0.840.16−0.010.130.790.35−0.320.33
Capo due ramiSentinel 3A0.630.16−0.020.110.680.26−0.220.22
La SaluteSentinel 3A0.700.2500.190.760.210.030.14
Boara PisaniJason 2/30.950.1700.130.980.500.490.49
CavarzereSentinel 3A0.390.6100.340.650.450.090.22
Badia PolesineSentinel 3B0.281.25−0.010.730.490.920.410.45
Badia PolesineSentinel 3A0.960.2200.190.980.230.140.18
FicaroloSentinel 3A0.960.3900.290.980.290.040.20
FicaroloJason 2/30.770.6800.490.900.64−0.380.43
Pisa a SostegnoJason 2/30.600.6000.450.630.93−0.440.73
S.G. alla Vena valleJason 2/30.790.4700.350.900.68−0.330.52
PontederaSentinel 3A0.840.42−0.030.250.851.91−1.881.88
Fucecchio valleSentinel 3A0.940.27−0.010.220.950.29−0.150.22
Ponte Tura AureliaSentinel 3A0.890.4300.270.900.32−0.070.23
Ponte NuovoSentinel 3B0.770.970.150.820.650.900.620.70
PizzighettoneSentinel 3A0.491.4500.630.561.03−0.320.36
Table 3. Values of R, RMSE, MBE, and MAE for the in situ station–virtual station pairs, calculated over the water level values obtained after the calibration of MAE.
Water Level
In-Situ Stat.SatelliteR [-]RMSE [m]MBE [m]MAE [m]
BorettoSentinel 3A0.980.1400.11
PiacenzaSentinel 3A0.930.240.030.14
PontelagoscuroJason 2/30.860.65−0.060.35
PontelagoscuroSentinel 3A0.980.23−0.040.13
Ponte FeliceSentinel 3A0.880.23−0.030.18
Fiumara GrandeSentinel 3A0.610.15−0.010.10
MezzocamminoSentinel 3A0.790.140.010.10
Capo due ramiSentinel 3A0.680.14−0.020.09
La SaluteSentinel 3A0.760.210.040.14
Boara PisaniJason 2/30.980.13−0.010.10
CavarzereSentinel 3A0.650.450.070.22
Badia PolesineSentinel 3B0.490.880.290.44
Badia PolesineSentinel 3A0.980.180.040.14
FicaroloSentinel 3A0.980.29−0.020.18
FicaroloJason 2/30.900.53−0.150.37
Pisa a SostegnoJason 2/30.630.84−0.160.70
S.G. alla Vena valleJason 2/30.900.61−0.100.49
PontederaSentinel 3A0.850.37−0.050.23
Fucecchio valleSentinel 3A0.950.25−0.040.19
Ponte Tura AureliaSentinel 3A0.900.32−0.030.23
Ponte NuovoSentinel 3B0.650.650.060.57
PizzighettoneSentinel 3A0.561.02−0.290.36
Publisher’s Note: MDPI stays neutral with regard to jurisdictional claims in published maps and institutional affiliations.