Abstract
For urban waterlogging alleviation, green infrastructures have been widely concerned. How to carry out scientific green infrastructure planning becomes an important issue in flood control and disaster relief. Based on historical media records of urban waterlogging from 2017 to 2020 and combined with variables about topography, land cover and socioeconomics, we used the Radial Basis Function Neural Network (RBFNN) to conduct urban waterlogging susceptibility assessment and simulate the risk of waterlogging in different scenarios of green land configuration in Shenzhen. The results showed that: (1) high proportions of impervious surface and population could increase the risks in Luohu and Futian districts, followed by Nanshan and Baoan districts, while high proportions of green space could effectively reduce the risks in southeastern Shenzhen; (2) urban waterlogging in Luohu and Futian districts can be alleviated by strengthening green infrastructure construction while Longgang and Longhua districts should make comprehensive use of other flood prevention methods; (3) turning existing urban green space into impervious surfaces would increase the risks of waterlogging, which is more evident in places with high proportions of green space such as Dapeng and Yantian districts. The effectiveness of green infrastructures varies in different spatial locations. Therefore, more attention should be paid to protecting existing green spaces than cultivating more green infrastructures in urban waterlogging alleviation.
1. Introduction
In recent years, urban waterlogging has caused huge damage and economic losses, which threatens the safety of citizens’ lives and property [1]. In low-lying and highly urbanized areas, the sewerage system is not able to drain heavy rainfall away in time, thus causing urban waterlogging, which affects roads, buildings and other facilities [2]. Therefore, reducing the risk of urban waterlogging has aroused widespread concern [3,4].
Current researches mainly focus on (1) early warning simulation, risk assessment [5,6] and emergency management [7]; (2) the relationship between spatio-temporal characteristics of urban waterlogging and urbanization [8,9]; (3) and the effects of landscape pattern and land use on urban waterlogging [10,11,12]. Meanwhile, governments around the world have responded by, for example, low-impact development (LID) in the United States [13,14] and Water-Sensitive Urban Design (WSUD) in Australia [15]. In 2014, China established the concept of Sponge City [16]. In 2015, the Chinese government issued the Guidance of the General Office of the State Council on Promoting the Construction of Sponge Cities, which aimed to reduce the risk of urban waterlogging, repair urban water ecology and contain water resources. Cities all over China began to vigorously promote the construction of sponge cities [17,18], in which the role of green infrastructures is emphasized.
Green infrastructures, represented by vegetation [19], can effectively alleviate the contradiction between urban economic development and water environment protection [20]. Compared with gray infrastructures, which are mainly based on engineering and technical means such as drainage pipes, they are more ecological and economical, with the advantages of adjusting hydrometric characteristics such as strengthening the accumulation and penetration of rainfall, improving the quality of urban space, enhancing urban resilience and many other multi-integrated benefits [21]. For example, green roofs have the advantages of reducing stormwater flows and improving water quality during larger rainfall events [22]. Apart from reducing heat and flooding, green infrastructures are also beneficial for climate adaption [23] and maintaining biodiversity long-term through offering functional networks of habitats and ecosystems [24].
Although it is well acknowledged that cultivating more green infrastructures helps reduce the risk of urban waterlogging, the consistency of its impact is still a question [19]. Moreover, land use management such as converting residential areas to green space may mitigate the flood [25], while it is wondered whether this conversion is always applicable anywhere. Previous research shows that actual influences of green infrastructure vary from place to place because of different ways of design and maintenance [26]. There is still a need to investigate the impact of green infrastructure on waterlogging more thoroughly.
The current green infrastructure planning in response to urban waterlogging usually uses the hierarchical analysis method [27] and the multi-criterion evaluation method [28], in which the weight setting is more subjective. With the development of computer sciences, in addition to traditional theoretical models such as hydrologic models and hydrodynamic models [29,30], data-driven machine learning methods such as Neural Network [31], Supporting Vector Machine (SVM) [32,33] and other methods [34,35] are applied to researches on urban waterlogging such as the assessment of disaster damage [36] and the sensitivity of flood [29,37]. The radial basis function neural network (RBFNN) has good generalization performance and high precision and also possesses fast training speed and high practicality [38]. It trains existing targets by setting evaluation indexes and determines the final criteria level index by combining multiple sub-criteria nonlinearly [39], which could deal with the problems of subjective weighting and collinear indexes efficiently. RBFNN was employed to analyze disaster susceptibility [40] thanks to its extraordinary adaptive learning ability while it is seldom used to evaluate the risk of waterlogging, especially in different land use scenarios.
With Shenzhen, a megacity usually trapped by the problem with waterlogging, as the study area, we address the abovementioned questions in three steps: firstly, an evaluation index system consisting of historical waterlogging records, factors about topography, land use and socio-economic conditions was established. Secondly, an urban waterlogging susceptibility assessment was conducted by RBFNN to identify priority areas for green infrastructures. Thirdly, the scenario analysis was operated to analyze the effectiveness of green infrastructures in different spatial locations and different land use conditions. This research provided a view of the application of machine learning methods in the field of green urban infrastructure planning in response to urban waterlogging, as well as references for urban waterlogging control and mitigation.
2. Materials and Methods
2.1. Study Area
Shenzhen is a coastal city located on the eastern bank of the Pearl River Delta and in southern Guangdong Province, from 113 to 114 to 37′E and 22 to 22 to 52′N. It belongs to a subtropical monsoon climate with plenty of rainfall concentrated in summer. The terrain of Shenzhen is high in the southeast and low in the northwest, most of which are low mountains and hills mixed with flat platforms (Figure 1). Even during the rainy season, the groundwater level of the city is well far below the surface [41]. Shenzhen governs Futian, Nanshan and Luohu districts as central urban areas; Yantian, Baoan, Longhua and Longgang districts as suburbs; and Guangming, Pingshan and Dapeng districts as outer suburbs. Shenzhen is prone to local urban waterlogging because of large areas of roads and buildings.
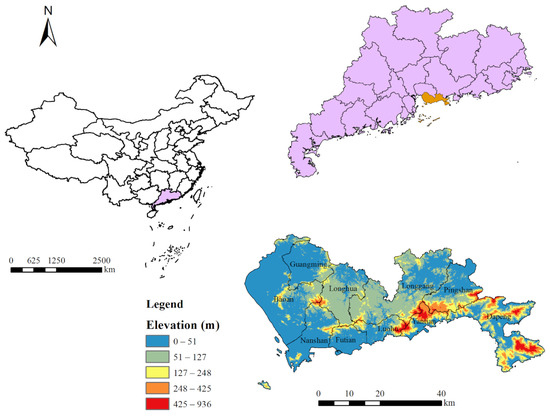
Figure 1.
The location of the study area.
As a city with high risks of urban waterlogging, Shenzhen has suffered many events of urban waterlogging, which have caused serious losses [42]. On 11 May 2014, Shenzhen was hit by the strongest rainstorm (226 mm) since 2008, with serious waterlogging in widespread areas. From August 28 to 29 in 2018, heavy rainfall occurred in Shenzhen, which also had a serious impact on the city. Taking these into consideration, Shenzhen was making great efforts to control urban waterlogging. Since it was officially selected as one of China’s second batch of sponge city construction pilots in 2016, the government made some progress in urban green infrastructure construction. In 2021, Shenzhen ranked first in the evaluation of the performance of the national sponge city construction pilots, implemented jointly by the Ministry of Finance, the Ministry of Housing and Construction and the Ministry of Water Resources.
2.2. Data Sources
Urban waterlogging events were recorded as point data, which were vectorized in ArcGIS with records of waterlogging road sections and points from 2017 to 2020 released by the Shenzhen traffic police authority [9]. Besides, administration data were derived from Shenzhen Municipal Planning and Land and Resources Commission. Some researcher takes 0.5 km as the risk radius considering the distance to the risk source, the waterlogging spot, boundary and the daily life radius of residents [43], while others choose a one-kilometer grid and believe that the analysis scales should take the mean nearest distance of urban waterlogging points in the specific study area [44]. Taking the situation in Shenzhen and the limitation of our datasets, all data were resampled to one kilometer.
Topographical factors such as elevation (DEM), slope (SLOPE), relative terrain (RE) [44], topographic wetness index (TWI) and surface roughness (SR); land use characteristics such as the proportion of impervious surface (PIS) and the proportion of green space (PGS); and social factors such as urban population (POP) were calculated in this paper. Data about DEM were derived from ASTER GDEM 30 m resolution elevation data, and other relative topographical factors were calculated in ArcGIS 10.8. Land use data were land cover classification data with the resolution of 30 m were released by Tsinghua University in 2020. The population data in 2019 with a resolution of one kilometer was downloaded from LANDSCAN (https://landscan.ornl.gov/landscan-datasets, accessed on 20 February 2021) [45].
2.3. Indicators to Identify Priority Areas for Green Infrastructure Planning
Urban waterlogging susceptibility analysis helps for effective flood reduction management [46]. Disaster risk is usually defined as a function of hazard, exposure and vulnerability [47,48]. Hazard refers to the probability of occurrence of a potentially urban waterlogging. Exposure refers to people, property and other factors potentially affected by waterlogging. The vulnerability relates to social, economic, physical and environmental factors or processes which add to the susceptibility [49].
The kernel density of waterlogging points was used to represent the hazard intensity of urban waterlogging (UWI). The kernel density analysis uses a smoothing function to fit point data, thus simulating the true probability distribution of continuous phenomena [50]. The method of kernel density analysis was used to reflect the spatial distribution of UWI. Equation (1) is as follows,
where is the estimated kernel density of the location as well as UWI, is the input point, is the search radius distance from the point location and is the distance from the position to the th observed position.
Social-economic factors such as urban population (POP) [51] were calculated to represent exposure. Topographical factors such as elevation (DEM), slope (SLOPE), relative terrain (RE), topographic wetness index (TWI) [52] and surface roughness (SR) [44] and factors about land use such as the proportion of impervious surface (PIS) [32] and the proportion of green space (PGS) [53] were used to indicate vulnerability.
2.4. Methods
After employing the Pearson correlation analysis to choose indicators connected with urban waterlogging, we established an evaluation index system consisting of historical waterlogging records, factors about topography, land use and socio-economic conditions. We conducted an urban waterlogging susceptibility assessment by RBFNN, and we also used the RBFNN algorithm to simulate the corresponding risks of urban waterlogging in the scenario analysis. The flowchart of methodology is illustrated in Figure 2.
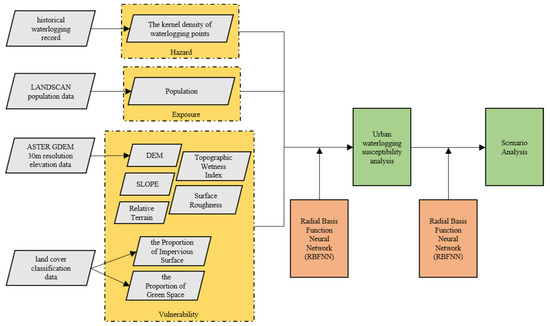
Figure 2.
The flowchart of methodology.
2.4.1. Pearson Correlation Analysis
The Pearson correlation coefficient is often used to measure whether there is a linear correlation between two variables, with values ranging from −1 to 1. Pearson correlation analysis was used to judge the rationality of factors chosen in the urban waterlogging susceptibility analysis. At the same time, the positive and negative effects of each factor on urban waterlogging were highlighted.
2.4.2. The RBFNN Model
Radial basis function neural network (RBFNN) is composed of a neural network with three layers, including the input layer, hidden layer and output layer [54]. RBFNN usually includes two processes, nonlinear transformation of hidden layer and linear transformation from hidden layer to output layer [40]. It obtains a network with minimum error approximation by learning and training process of input samples, which can be used for subsequent prediction analysis [55].
The RBFNN model was employed to integrate all the above-mentioned susceptibility factors to assess the risk of urban waterlogging in Shenzhen. First of all, the normalization of indicators was carried out by making a judgment of its positive and negative correlation with the risk of urban waterlogging. Then quantile classification method was used to divide each factor from low to high into five levels, with the highest value being level 5, representing areas with the highest risk of waterlogging. Finally, the evaluation criteria matrix of five levels of factors was input into the training model as samples, and the vector of indicators of evaluation objects was used as the prediction data. RBFNN was used to evaluate the level of risk of waterlogging in each grid cell. The mean square error ε was set as 0.0001, and the distribution coefficient was set as 1. The prediction of the grid cells at a one-kilometer scale in Shenzhen was operated by sim function in MATLAB R2020b.
2.4.3. Scenario Analysis
With primary consumption of forest, water and farmland [56], Shenzhen experienced urban land expansion at a rate of 19.0% in 1990–1999, 7.4% in 1999–2005 and 3.8% in 2005–2008 [57]. On the other hand, from 1987–2017, 11% of the construction land was converted to vegetated areas [58]. Taking the land use change in Shenzhen into consideration, the status quo was set as basic scenario 0, and two types of land use change were considered when discussing the impacts of green space on the risk of urban waterlogging. In Scenario 1, the existing impervious surface was converted into green space, which was set as scenario 1_1, 1_2 and 1_3 according to different proportions (5%, 10% and 20%). In Scenario 2, the existing green space was converted into the impervious surface, which was set as scenario 2_1, 2_2, 2_3 according to different proportions (5%, 10%, 20%). The new values of PIS and PGS in each grid cell in each scenario were re-normalized, and other indicators remained unchanged. By taking the new vectors as the prediction data, the evaluation values of risk of urban waterlogging under the current standard after land use change were obtained. The scenario settings are shown in Figure 3.
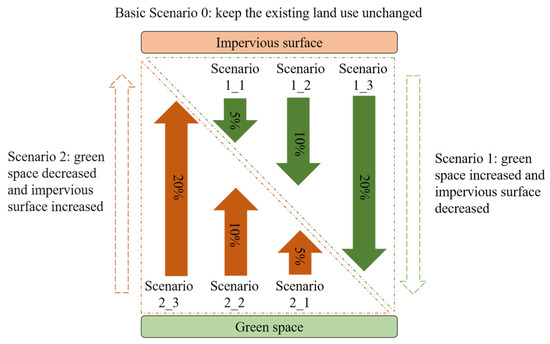
Figure 3.
Basic scenario and designing of six scenarios under different green space configurations.
3. Results
3.1. Indicators of Urban Waterlogging
The urban waterlogging intensity of Shenzhen was high in the west and low in the east, as shown in Figure 4. High-value areas were concentrated in Luohu and Futian Districts, followed by the north of Baoan District, the south of Nanshan District and Longhua District. The waterlogging intensity was relatively high in the middle of Shenzhen, with plains staggered with low hills. The waterlogging intensity was relatively low in the southeast, which was dominated by low mountains. Low-value areas were mainly in Dapeng District, the south of Pingshan District and the east of Yantian District.
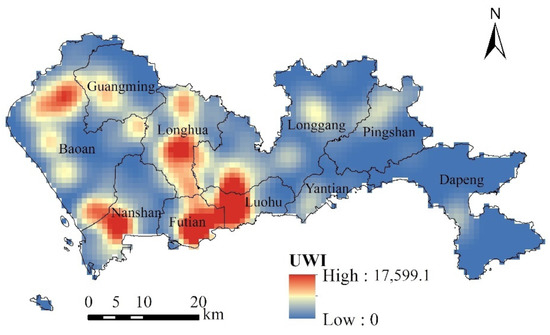
Figure 4.
Spatial distribution of urban waterlogging intensity (UWI) in Shenzhen.
Pearson correlation analysis of DEM, SLOPE, RE, TWI, SR, PIS, PGS, POP with UWI was carried out, and the results are shown in Table 1. The spatial distribution of the indicators is shown in Figure 5. Except for TWI, PIS and POP, other factors showed a negative correlation with UWI. The correlation between PGS and UWI reached −0.443, which was the most negative and indicated that green space could effectively reduce the intensity of urban waterlogging. In contrast, the correlation between POP and UWI reached 0.539, which was the most positive, which meant urban waterlogging tended to be distributed in areas with high population and thus posed a threat to people’s property and life safety. All the sensitivity factors were significantly related to UWI, indicating the selected factors were reasonable and showed the risk of urban waterlogging effectively.

Table 1.
Pearson correlation analysis of waterlogging sensitive factors in Shenzhen. (Waterlogging sensitive factors such as elevation (DEM), slope (SLOPE), relative terrain (RE), topographic wetness index (TWI), surface roughness (SR) the proportion of impervious surface (PIS), the proportion of green space (PGS) and population (POP)).
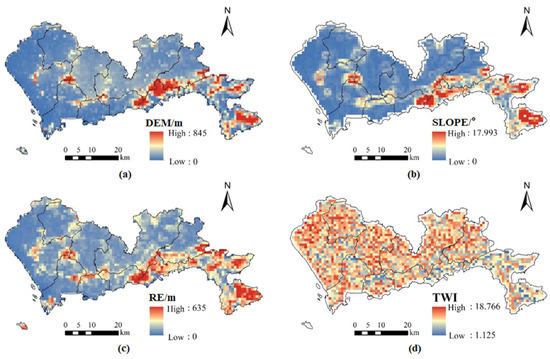
Figure 5.
Spatial distribution of urban waterlogging sensitive factors in Shenzhen: (a) DEM; (b) SLPOE; (c) RE; (d) TWI; (e) SR; (f) PIS; (g) PGS; (h) POP. (Waterlogging sensitive factors such as elevation (DEM), slope (SLOPE), relative terrain (RE), topographic wetness index (TWI), surface roughness (SR) the proportion of impervious surface (PIS), the proportion of green space (PGS) and population (POP)).
As for topographic features, the Pearson correlation coefficient between DEM and UWI was −0.302, indicating that most urban waterlogging occurred in low-lying areas. In the southwest of Shenzhen, such as Futian and Luohu Districts, the altitude was low and UWI was high. In the southeast coastal areas, such as Dapeng and Yantian Districts, the altitude was high while UWI was low. In the central areas such as Longhua and Longgang Districts, where hills and lowlands were staggered and the altitude fluctuated, high-value and low-value areas of UWI were also scattered and staggered. SLOPE, the change of which was spatially consistent with the elevation, was also negative with UWI. High values of SLOPE were in southeast coastal areas, and low values were in western areas, hilly areas with large SLOPE occasionally in central Shenzhen. RE reflected changes in elevation in small areas within the grid cells, the distribution of high values of which was similar to that of DEM but was more diffuse and continuous. TWI was positively related to UWI, and in most areas of Shenzhen, it was high, with relatively low-value areas mainly in northern Nanshan district, northern Futian district and Yantian district. UWI in these areas was also relatively low compared to other areas. SR in most areas in Shenzhen was relatively low, which meant prone to accumulation of rain. On the other hand, the rain was not easy to accumulate in the areas with high SR, such as eastern Luohu district and western Yantian district, which contributed to low UWI.
In terms of land use, Shenzhen, as a highly urbanized area, had a high proportion of impervious surface in north and southwest areas, with a large range and high-value areas formed. Pearson correlation coefficient between PIS and UWI was 0.517, showing a significant positive correlation and ranking second in all indicators. In contrast, the Pearson correlation coefficient between PGS and UWI was −0.443, showing a significant negative correlation. PGS in the southeast coastal areas, eastern Baoan district and northern Futian district was relatively high, and thus the risk of urban waterlogging in those areas was relatively small.
As for socio-economic exposure, POP was significantly positively related to UWI, which meant that in densely populated areas, the frequency of waterlogging events was also higher. The areas with high POP in Shenzhen were located in the southwest coastal Futian and Luohu districts, which were also central urban areas, followed by northern suburbs such as northern Guangming, northern Longhua and northern Longgang. The POP and UWI in the Dapeng district in the southeastern coastal part of Shenzhen were both the least, which meant that urban waterlogging was mostly in urban residential and commercial clusters with high populations.
Overall, the distribution of topographical features was similar. The impacts of the impervious surface and green space on urban waterlogging were significantly different, same to the spatial distribution of the two indicators. Most of the population was concentrated in the southwest of Shenzhen, where the elevation was low and SR was small. Furthermore, there were more impervious surfaces and less green space in the southwest of Shenzhen, and also large urban waterlogging intensity. Urban waterlogging seldom occurred in the southeastern coastal areas, where most areas were high-altitude, with the less impervious surface, while woodland and grassland as the representative of land use types.
3.2. RBFNN Results and Urban Waterlogging Risk
The evaluation criteria in the RBFNN model for risk assessment of urban waterlogging in Shenzhen were shown in Table 2, as ZUWI represented the normalized UWI, etc. The evaluation criteria matrix of five levels of factors in Table 2 was input into the RBFNN model as training samples. The evaluated level of risk of waterlogging in each grid cell under the 1 km scale of Shenzhen was computed by the RBFNN model, and the results of the evaluation are shown in Figure 6.
Table 2.
Evaluation standard of RBFNN model for risk assessment of urban waterlogging in Shenzhen. (ZUWI represents the normalized UWI, ZDEM represents the normalized DEM, etc.).
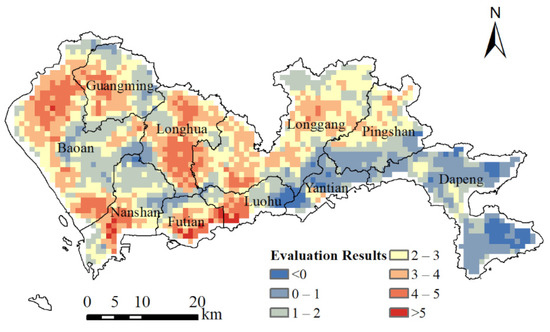
Figure 6.
Results of risk assessment of urban waterlogging in Shenzhen.
The risk of urban waterlogging in Shenzhen was higher in the west and lower in the east. The highest evaluation value was 5.586, and the lowest value was −1.022. The area of level 5 accounted for 10.53% (of which 0.89% was greater than 5 and 9.64% was 4–5). The area of level 4 accounted for 22.01%, that of level 3 accounted for 24.22%, that of level 2 accounted for 23.94% and that of level 1 accounted for 19.28% (of which 15.80% were 0–1 and 3.48% were less than 0). The area of level 3 was the largest, and the area of level 2 or level 4 was 20–25%, representing that the overall risk of waterlogging was balanced. The low-risk areas of level 1 were mainly distributed in the southeast and west of Shenzhen, where green space accounted for a relatively large area. In contrast, the areas of level 5 were mainly concentrated in central urban areas such as Luohu, Futian and Nanshan districts, where there was a large population. Therefore, Shenzhen should give priority to mitigating urban waterlogging in the southwest coastal areas, especially in Futian and Luohu districts. Secondly, consideration should be given to areas such as southern Nanshan and northern Baoan districts. In addition, it should also be paid attention to protect against the risk of urban waterlogging in Longhua and Longgang districts.
Compared with the fact that the intensity of urban waterlogging was mainly distributed similar to scatters, the spatial variations in the risk of waterlogging were mostly contiguous, and the distribution was highly similar to that of areas with high PIS. At the same time, the high-value areas (level 4 or 5) with high waterlogging risk can well cover areas with a high population. However, the changes between spatial variations in waterlogging risk were smaller, more stable and continuous than those of PIS and POP.
3.3. Scenario Analysis
The results of the evaluation of risk assessment of urban waterlogging in Shenzhen under different scenarios are shown in Figure 7. In the seven scenarios, areas of level 2 or 3 accounted for the largest proportion, which was relatively close, followed by areas of level 4, and areas of level 5 accounted for the smallest proportion, which indicated that the degree of risk of urban waterlogging in Shenzhen was relatively balanced. Although the area of Level 5 with serious risk of waterlogging and urgent need of planning in Shenzhen was small, ranging from 10% to 11%, the area of Level 1 with low risk and good green infrastructure planning accounted only for 15–20%, indicating that the green infrastructure planning in Shenzhen still needed to be further strengthened.
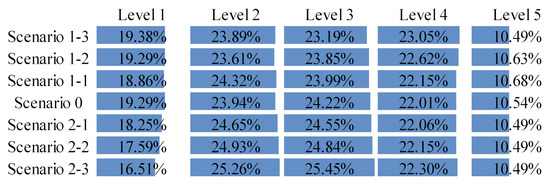
Figure 7.
The results of risk assessment of urban waterlogging in Shenzhen under different scenarios. (The blue bar represents the percent of the area of different risk levels.).
In Scenario 1 (green space increased and impervious surface decreased), the impacts of land-use change in different proportions were different. The proportion of the area of each level fluctuated greatly and had no obvious law. With the increase in the proportion of impervious surface converted to green space, the area of level 1 and level 4 gradually increased, and the area of level 3 and level 5 gradually decreased. The average evaluation result of the basic scenario was 2.28, and the average evaluation results of scenario 1-1, scenario 1-2 and scenario 1-3 were 2.29, 2.29 and 2.28, respectively, which did not have an obvious trend.
In Scenario 2 (green space decreased and impervious surface increased), the laws of land use change in different proportions were consistent. With the increase in the proportion of green space turning into the impervious surface, the proportion of level 1 decreased significantly, the proportion of level 2, level 3 and level 4 increased, and the proportion of level 5 remained unchanged, which indicated that areas with low risk of waterlogging would be transformed into areas with medium risk of waterlogging, the ability to cope with waterlogging weakened sharply due to the reduction in green space. However, the impact of the reduction in green space was rather weak on the areas with a high risk of waterlogging.
The impacts of land use change in the ability to resist waterlogging in different regions were not completely consistent. As can be seen from Figure 8, in Scenario 1, the areas with a well-increased risk of waterlogging were mainly located in Baoan, Guangming and Longgang districts, and the areas with well-decreased risk of waterlogging located mainly in Futian and Luohu districts. With the increase in the proportion of impervious surface turned to green space, both the range of changed value and the changed areas of promotion or decline became larger. This showed that the existing strategy of turning the impervious surface into green space could not significantly improve the ability to deal with urban waterlogging in most areas of Baoan, Longgang and Guangming districts. It was still necessary to further strengthen the construction of other supporting facilities to deal with urban waterlogging. In contrast, it can effectively reduce the risk of urban waterlogging and thus encourage green infrastructure planning at the junction of Futian district and Luohu district and some scattered places with large slope changes in other districts.
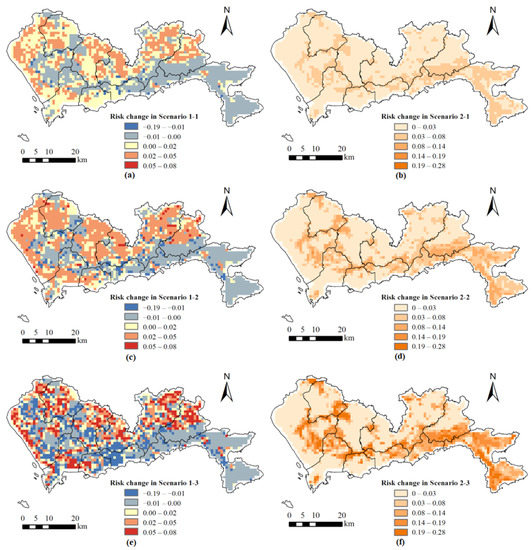
Figure 8.
Changes in results of risk assessment in different scenarios: (a) Scenario 1-1; (b) Scenario 2-1; (c) Scenario 1-2; (d) Scenario 2-2; (e) Scenario 1-3; (f) Scenario 2-3.
In Scenario 2, the risk of urban waterlogging in all areas of Shenzhen increased, which indicated that developing existing green space into impervious surface led to the enhancing of waterlogging, and with the increase of the proportion of impervious surface development (from 5%, 10% to 20%), the added value of risk gradually increased. In other ways, conversion of green land to construction land harmed urban waterlogging prevention and reduction. Besides, the greater the proportion of conversions, the greater the potential risk of urban waterlogging would be. As can be seen from Figure 8b,d,f, if the green space was transformed into the impervious surface, the most affected areas were the south of Guangming district, the east of Baoan district, Yantian and Dapeng district. If the existing green space in these areas was transformed into an impervious surface, the risk of urban waterlogging would significantly increase.
4. Discussion
Based on indicators such as historical urban waterlogging intensity, factors about topography, land use and population, RBFNN was used to estimate waterlogging risk in Shenzhen and simulate the changes in risk of waterlogging in different scenarios of land use, and then some suggestions for green infrastructures planning under the background of urban waterlogging were put forward.
4.1. Spatial Variations in Risk of Urban Waterlogging
The RBFNN model was used to evaluate the risk of urban waterlogging by combining multiple sensitive factors, which effectively avoided detailed questions such as index selection, weight setting and result determination in flood sensitivity assessment and green infrastructures planning. The positive and negative correlation and significance of each indicator were derived effectively and directly from Pearson correlation analysis.
The overall risk of urban waterlogging in Shenzhen is relatively balanced, with high risk in the west and low risk in the east. The areas with the highest risk and thus requiring improved green infrastructure planning most urgently are concentrated in Futian and Luohu districts, followed by the south of Nanshan district, the north of Baoan district, Longhua district and the west of Guangming district. Longgang district and the north of Pingshan district also need more green infrastructures, and the southeast coastal area has the lowest risk.
The spatial variation in risk of waterlogging has a lot in common with historical urban waterlogging intensity since UWI in Futian and Luohu districts is the highest, followed by that in Nanshan and Baoan district, and UWI in Dapeng district is the lowest. Similar to findings of previous researches that low areas are susceptible to severe floods [59], in addition to TWI, topographical factors show a negative correlation with UWI, and the correlation between RE and UWI is most negative. In general, higher elevation meant less risk of being submerged. TWI quantitatively simulates the dry and wet states of soil moisture. Places with high TWI, which refer to areas that possess the potential to generate overland flow, are prone to waterlogging due to high soil moisture [38]. In terms of land use, PIS is positively correlated with UWI, while PGS is negatively correlated with UWI, which is similar to findings of previous studies [49]. Land cover features are critical explanatory factors for urban waterlogging. Impervious surfaces reduce the seepage of rainwater and increase surface runoff, increasing the risk of urban waterlogging.
4.2. Different Impacts of Green Space
Land use change has an obvious impact on the risk of urban waterlogging, and the impact is not consistent under different location conditions. As is proved in other papers, different spatial areas respond to land use change and rainfall change scenarios differently [60].
When the impervious surface is transformed into green space, the areas with a higher risk of waterlogging are mainly located in Baoan, Guangming and Longgang districts, and the areas with a lower risk of waterlogging are mainly located in Futian and Luohu districts. The existing strategy of turning the impervious surface into green space can effectively reduce the risk of urban waterlogging at the junction of Futian district and Luohu district and scattered places with large changes in slope in other districts.
However, the actual effectiveness of green infrastructures also varies spatially. Turning the existing impervious surface into green space cannot significantly improve the ability to deal with the risk of urban waterlogging in most areas of Baoan, Longgang and Guangming districts, which indicates that combination with other supporting waterlogging reduction measures is needed [61]. As is shown in Figure 9a, the larger the area of conversion is (Scenario 1_3 compared with Scenario 1_1), the larger the uncertainty is. Besides, when the existing percent of green space is lower than 20%, the impact of turning the impervious surface into green space on the risk of waterlogging is obvious, although it is still uncertain that the impact is positive or negative consistently. When the existing percent of green space is relatively higher, there is a trend that the reduction in risk of waterlogging becomes smaller. Similarly, some researchers find that if the proportion of green infrastructures in the watershed in Shenzhen exceeds 60%, urban waterlogging may not be mitigated even if more green infrastructures are constructed [19].
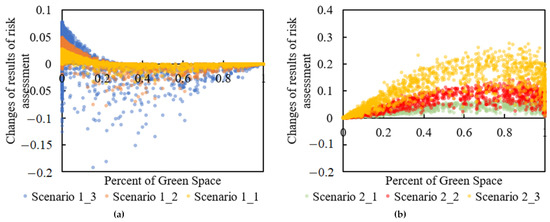
Figure 9.
The relationship between the percent of green space and changes in results of risk assessment: (a) Scenario 1; (b) Scenario 2.
Although cultivating more green space may not necessarily mitigate urban waterlogging, the benefit of mitigation effect of existing green space is without a doubt. When green space is converted to the impervious surface, the law of land use change in different proportions is constant. It can be seen from Figure 9b that with the increase in the proportion of green space turned into the impervious surface, the increased risk of urban waterlogging becomes larger. Furthermore, when the proportion of green space turned into the impervious surface is constant, the increased risks in different places present semi arch. The increase in the risk of urban waterlogging is relatively smaller in places with less green space while losing green space will do great harm to places where the percent of green space is large now. For example, thanks to flat terrain, high proportion of green space and good ecological environment, the current risks of urban waterlogging in southern Guangming district, eastern Baoan district, Yantian district and Dapeng district are rather low. The increase in risks of waterlogging in the abovementioned areas when green space is turned into the impervious surface is largest.
4.3. Recommendation
The results of the evaluation of risk assessment of urban waterlogging the green infrastructure planning in Shenzhen can be further improved. The population and proportion of the impervious surface in Futian District and Luohu District, the central urban area, are relatively high, which are conducive to the high urban waterlogging risk and fragile environment. The lack of green space makes it difficult to build large-scale green infrastructures in these areas. Therefore, it is necessary to control the construction of the urban impervious surface and consider strengthening the combination of artificial facilities and natural ecological facilities and increasing plants and greening around the impervious surface such as roads and buildings.
The fluctuations in topography in most areas of Baoan, Longgang and Guangming districts are relatively large, and the area of hills and mountains is also somewhat greater. It is necessary to promote the combination of gray and green infrastructures in urban planning, and it is still suggested to further strengthen the construction of other supporting facilities to deal with urban waterlogging.
Southern Guangming district, eastern Baoan district, Yantian district and Dapeng district tend to be easily at risk of waterlogging if green space is turned into an impervious surface. Therefore, in future development, we should make Green Development the first priority and pay attention to ecological value and environmental protection at the same time as economic development. Attention should also be paid to water and soil conservation, the ecological value of the existing green space [62] and it is suggested to strictly abide by the ecological redline and control the development intensity [60].
4.4. Limitations
Data from media records of historical waterlogging events from 2017 to 2020 were used in the assessment of Shenzhen’s waterlogging intensity. With the rise of big data technology, it became more and more popular to combine social media data with other information such as land use to study the capabilities of urban waterlogging prevention [43,49]. The kernel density method can effectively reflect the continuous distribution of urban waterlogging at a small scale, which expands in a dense and circular layer [9]. It is still encouraged that conduct deeper field research in future studies and works with relevant technical departments to solve the problems of access to and sharing of flood-prone data and dynamic rainfall data [42].
In general, urban waterlogging not only occurs within a single street or an administrative district but also often across streets and administrative districts. Although one kilometer is a practical and appropriate scale for risk assessment and green infrastructures planning, taking the scale effect characteristics of landscape ecology into consideration [44], multi-scale comprehensive analysis can be carried out in subsequent studies.
Although it is convenient and objective to use the RBFNN model to evaluate and analyze the results under different land use changes, this method is based on a fully idealized scenario design. In practical application, the ecological redline, existing planning and other restrictive factors ought to be considered. Furthermore, more factors about green infrastructures such as biophysical parameters and the spatial configuration could be considered when discussing its waterlogging mitigation effect.
Different green infrastructure planning measures are proposed for different areas, which could further guide urban development and planning on a macro scale. The solution of urban waterlogging depends on multidisciplinary scholars working together [63], so specific measures such as Roof Greening and Rain Garden are needed in the research on green infrastructure planning in the future. All departments in the same basin areas ought to work together to maintain the ecological environment and put forward effective disaster prevention and mitigation measures from multiple angles.
5. Conclusions
Based on media records of historical events of urban waterlogging, combined with topographic factors such as elevation, slope, relative elevation, terrain humidity index and surface roughness; land use factors such as the proportion of impervious surface and proportion of green space; and socio-economic factors such as population, comprehensive use of kernel density analysis, Pearson correlation analysis, RBFNN, scenario analysis and other methods, susceptibility assessment of urban waterlogging in Shenzhen was conducted. Moreover, according to different land use change scenarios, the roles of green infrastructures in different areas and conditions were discussed. Finally, corresponding green infrastructure planning measures in the context of urban waterlogging were put forward. The main conclusions were drawn as follows:
- The risk of urban waterlogging at the junction of Luohu district and Futian district is relatively large due to the high population and density of the impervious surface. The risk of urban waterlogging is also relatively high in Nanshan and Longgang districts and is lowest in southeastern areas;
- Priority should be given to the construction of green infrastructure in central urban areas such as the Luohu and Futian districts. Green infrastructure planning priority in Nanshan and Baoan districts is also very high. The southeast of Shenzhen, represented by the Dapeng district, currently has a high proportion of green space and low risk of urban waterlogging and thus a low priority of planning;
- The mitigation effects of green infrastructure are different depending on the region. Dapeng and Yantian districts need to pay attention to the protection of existing green space and reduce regional development intensity. Urban waterlogging in Luohu and Futian districts can be alleviated by strengthening green infrastructure construction. However, due to relatively little effect of green infrastructures, Longgang and Longhua districts should make comprehensive use of other flood prevention measures.
- It is certain that destroying existing green space would increase the risk of waterlogging, whatever the proportion of the decreased green space is. Cultivating more green infrastructures does not necessarily reduce the risk of waterlogging due to different proportions of land use and different locations. More attention should be paid to the protection of green space, and we should adhere to green development and ecological protection and avoid converting existing green space into the impervious surface to the best of our ability.
Author Contributions
Conceptualization, methodology, writing—original draft preparation, visualization: Y.Q.; validation, writing—review and editing: H.W.; supervision, funding acquisition: J.W. All authors have read and agreed to the published version of the manuscript.
Funding
This research was funded by Shenzhen Fundamental Research Program, grant number GXWD20201231165807007-20200816003026001.
Institutional Review Board Statement
Not applicable.
Informed Consent Statement
Not applicable.
Data Availability Statement
The data used in this study are openly available on the website.
Conflicts of Interest
The authors declare no conflict of interest.
References
- Han, S.; Xie, Y.; Li, D.; Li, P.; Sun, M. Risk analysis and management of urban rainstorm water logging in Tianjin. J. Hydrodyn. Ser. B 2006, 18, 552–558. [Google Scholar] [CrossRef]
- Wu, J.; Yang, R.; Song, J. Effectiveness of low-impact development for urban inundation risk mitigation under different scenarios: A case study in Shenzhen, China. Nat. Hazards Earth Syst. Sci. 2018, 18, 2525–2536. [Google Scholar] [CrossRef]
- Yin, J.; Ye, M.; Yin, Z.; Xu, S. A review of advances in urban flood risk analysis over China. Stoch. Environ. Res. Risk Assess. 2014, 29, 1063–1070. [Google Scholar] [CrossRef]
- Sang, Y.-F.; Yang, M. Urban waterlogs control in China: More effective strategies and actions are needed. Nat. Hazards 2017, 85, 1291–1294. [Google Scholar] [CrossRef]
- Fedeski, M.; Gwilliam, J. Urban sustainability in the presence of flood and geological hazards: The development of a GIS-based vulnerability and risk assessment methodology. Landsc. Urban Plan. 2007, 83, 50–61. [Google Scholar] [CrossRef]
- Tehrany, M.S.; Pradhan, B.; Jebur, M.N. Flood susceptibility mapping using a novel ensemble weights-of-evidence and support vector machine models in GIS. J. Hydrol. 2014, 512, 332–343. [Google Scholar] [CrossRef]
- Huang, Q.; Cervone, G.; Zhang, G. A cloud-enabled automatic disaster analysis system of multi-sourced data streams: An example synthesizing social media, remote sensing and Wikipedia data. Comput. Environ. Urban Syst. 2017, 66, 23–37. [Google Scholar] [CrossRef]
- Huang, H.; Chen, X.; Zhu, Z.; Xie, Y.; Liu, L.; Wang, X.; Wang, X.; Liu, K. The changing pattern of urban flooding in Guangzhou, China. Sci. Total. Environ. 2018, 622–623, 394–401. [Google Scholar] [CrossRef] [PubMed]
- Yu, H.; Zhao, Y.; Fu, Y.; Li, L. Spatiotemporal Variance Assessment of Urban Rainstorm Waterlogging Affected by Impervious Surface Expansion: A Case Study of Guangzhou, China. Sustainability 2018, 10, 3761. [Google Scholar] [CrossRef]
- Zhang, B.; Xie, G.; Li, N.; Wang, S. Effect of urban green space changes on the role of rainwater runoff reduction in Beijing, China. Landsc. Urban Plan. 2015, 140, 8–16. [Google Scholar] [CrossRef]
- Bin, L.; Xu, K.; Xu, X.; Lian, J.; Ma, C. Development of a landscape indicator to evaluate the effect of landscape pattern on surface runoff in the Haihe River Basin. J. Hydrol. 2018, 566, 546–557. [Google Scholar] [CrossRef]
- Liu, J.; Liu, X.; Wang, Y.; Li, Y.; Jiang, Y.; Fu, Y.; Wu, J. Landscape composition or configuration: Which contributes more to catchment hydrological flows and variations? Landsc. Ecol. 2020, 35, 1531–1551. [Google Scholar] [CrossRef]
- Ahiablame, L.M.; Engel, B.A.; Chaubey, I. Effectiveness of low impact development practices in two urbanized watersheds: Retrofitting with rain barrel/cistern and porous pavement. J. Environ. Manag. 2013, 119, 151–161. [Google Scholar] [CrossRef] [PubMed]
- Dietz, M.E. Low Impact Development Practices: A Review of Current Research and Recommendations for Future Directions. Water Air Soil Pollut. 2007, 186, 351–363. [Google Scholar] [CrossRef]
- Morison, P.; Brown, R. Understanding the nature of publics and local policy commitment to Water Sensitive Urban Design. Landsc. Urban Plan. 2011, 99, 83–92. [Google Scholar] [CrossRef]
- Chan, F.K.S.; Griffiths, J.A.; Higgitt, D.; Xu, S.; Zhu, F.; Tang, Y.-T.; Xu, Y.; Thorne, C.R. “Sponge City” in China—A breakthrough of planning and flood risk management in the urban context. Land Use Policy 2018, 76, 772–778. [Google Scholar] [CrossRef]
- Liu, J.; Gong, X.; Li, L.; Chen, F.; Zhang, J. Innovative design and construction of the sponge city facilities in the Chaotou Park, Talent Island, Jiangmen, China. Sustain. Cities Soc. 2021, 70, 102906. [Google Scholar] [CrossRef]
- She, L.; Wei, M.; You, X.-Y. Multi-objective layout optimization for sponge city by annealing algorithm and its environmental benefits analysis. Sustain. Cities Soc. 2021, 66, 102706. [Google Scholar] [CrossRef]
- Zhang, Q.; Wu, Z.; Tarolli, P. Investigating the Role of Green Infrastructure on Urban WaterLogging: Evidence from Metropolitan Coastal Cities. Remote Sens. 2021, 13, 2341. [Google Scholar] [CrossRef]
- Zhou, H.; Li, H.; Zhao, X.; Ding, Y. Emergy ecological model for sponge cities: A case study of China. J. Clean. Prod. 2021, 296, 126530. [Google Scholar] [CrossRef]
- Liu, L.; Jensen, M.B. Green infrastructure for sustainable urban water management: Practices of five forerunner cities. Cities 2018, 74, 126–133. [Google Scholar] [CrossRef]
- Williams, N.S.; Rayner, J.P.; Raynor, K.J. Green roofs for a wide brown land: Opportunities and barriers for rooftop greening in Australia. Urban For. Urban Green. 2010, 9, 245–251. [Google Scholar] [CrossRef]
- Derkzen, M.L.; van Teeffelen, A.J.; Verburg, P. Green infrastructure for urban climate adaptation: How do residents’ views on climate impacts and green infrastructure shape adaptation preferences? Landsc. Urban Plan. 2017, 157, 106–130. [Google Scholar] [CrossRef]
- Bolliger, J.; Silbernagel, J. Contribution of Connectivity Assessments to Green Infrastructure (GI). ISPRS Int. J. Geo-Inf. 2020, 9, 212. [Google Scholar] [CrossRef]
- Huang, W.; Hashimoto, S.; Yoshida, T.; Saito, O.; Taki, K. A nature-based approach to mitigate flood risk and improve ecosystem services in Shiga, Japan. Ecosyst. Serv. 2021, 50, 101309. [Google Scholar] [CrossRef]
- Wang, C.; Du, S.; Wen, J.; Zhang, M.; Gu, H.; Shi, Y.; Xu, H. Analyzing explanatory factors of urban pluvial floods in Shanghai using geographically weighted regression. Stoch. Environ. Res. Risk Assess. 2017, 31, 1777–1790. [Google Scholar] [CrossRef]
- Li, L.; Uyttenhove, P.; Van Eetvelde, V. Planning green infrastructure to mitigate urban surface water flooding risk—A methodology to identify priority areas applied in the city of Ghent. Landsc. Urban Plan. 2020, 194, 103703. [Google Scholar] [CrossRef]
- Meerow, S.; Newell, J. Spatial planning for multifunctional green infrastructure: Growing resilience in Detroit. Landsc. Urban Plan. 2017, 159, 62–75. [Google Scholar] [CrossRef]
- Hong, H.; Tsangaratos, P.; Ilia, I.; Liu, J.; Zhu, A.-X.; Chen, W. Application of fuzzy weight of evidence and data mining techniques in construction of flood susceptibility map of Poyang County, China. Sci. Total Environ. 2018, 625, 575–588. [Google Scholar] [CrossRef] [PubMed]
- Xue, F.; Huang, M.; Wang, W.; Zou, L. Numerical Simulation of Urban Waterlogging Based on FloodArea Model. Adv. Meteorol. 2016, 2016, 1–9. [Google Scholar] [CrossRef]
- Kia, M.B.; Pirasteh, S.; Pradhan, B.; Mahmud, A.R.; Sulaiman, W.N.A.; Moradi, A. An artificial neural network model for flood simulation using GIS: Johor River Basin, Malaysia. Environ. Earth Sci. 2012, 67, 251–264. [Google Scholar] [CrossRef]
- Tang, X.; Hong, H.; Shu, Y.; Tang, H.; Li, J.; Liu, W. Urban waterlogging susceptibility assessment based on a PSO-SVM method using a novel repeatedly random sampling idea to select negative samples. J. Hydrol. 2019, 576, 583–595. [Google Scholar] [CrossRef]
- Sahana, M.; Rehman, S.; Sajjad, H.; Hong, H. Exploring effectiveness of frequency ratio and support vector machine models in storm surge flood susceptibility assessment: A study of Sundarban Biosphere Reserve, India. Catena 2020, 189, 104450. [Google Scholar] [CrossRef]
- Chen, W.; Li, Y.; Xue, W.; Shahabi, H.; Li, S.; Hong, H.; Wang, X.; Bian, H.; Zhang, S.; Pradhan, B.; et al. Modeling flood susceptibility using data-driven approaches of naïve Bayes tree, alternating decision tree, and random forest methods. Sci. Total Environ. 2020, 701, 134979. [Google Scholar] [CrossRef]
- Kang, L.; Guo, X. Research on application of cross structure flood risk assessment decision support system using Bayesian Network. In Proceedings of the 2010 2nd IEEE International Conference on Information Management and Engineering, Chengdu, China, 16–18 April 2010; pp. 328–332. [Google Scholar] [CrossRef]
- Lou, W.; Chen, H.; Shen, X.; Sun, K.; Deng, S. Fine assessment of tropical cyclone disasters based on GIS and SVM in Zhejiang Province, China. Nat. Hazards 2012, 64, 511–529. [Google Scholar] [CrossRef]
- Tang, X.; Shu, Y.; Lian, Y.; Zhao, Y.; Fu, Y. A spatial assessment of urban waterlogging risk based on a Weighted Naïve Bayes classifier. Sci. Total Environ. 2018, 630, 264–274. [Google Scholar] [CrossRef] [PubMed]
- Avand, M.; Moradi, H.; Lasboyee, M.R. Spatial modeling of flood probability using geo-environmental variables and machine learning models, case study: Tajan watershed, Iran. Adv. Space Res. 2021, 67, 3169–3186. [Google Scholar] [CrossRef]
- Luo, K.; Wang, Z.; Sha, W.; Wu, J.; Wang, H.; Zhu, Q. Integrating Sponge City Concept and Neural Network into Land Suitability Assessment: Evidence from a Satellite Town of Shenzhen Metropolitan Area. Land 2021, 10, 872. [Google Scholar] [CrossRef]
- Pham, B.T.; Shirzadi, A.; Bui, D.T.; Prakash, I.; Dholakia, M. A hybrid machine learning ensemble approach based on a Radial Basis Function neural network and Rotation Forest for landslide susceptibility modeling: A case study in the Himalayan area, India. Int. J. Sediment Res. 2018, 33, 157–170. [Google Scholar] [CrossRef]
- Lancia, M.; Zheng, C.; He, X.; Lerner, D.N.; Andrews, C.; Tian, Y. Hydrogeological constraints and opportunities for “Sponge City” development: Shenzhen, southern China. J. Hydrol. Reg. Stud. 2020, 28, 100679. [Google Scholar] [CrossRef]
- Sun, S.; Zhai, J.; Li, Y.; Huang, D.; Wang, G. Urban waterlogging risk assessment in well-developed region of Eastern China. Phys. Chem. Earth Parts A/B/C 2020, 115, 102824. [Google Scholar] [CrossRef]
- Lin, T.; Liu, X.; Song, J.; Zhang, G.; Jia, Y.; Tu, Z.; Zheng, Z.; Liu, C. Urban waterlogging risk assessment based on internet open data: A case study in China. Habitat Int. 2018, 71, 88–96. [Google Scholar] [CrossRef]
- Zhang, Q.; Wu, Z.; Zhang, H.; Fontana, G.D.; Tarolli, P. Identifying dominant factors of waterlogging events in metropolitan coastal cities: The case study of Guangzhou, China. J. Environ. Manag. 2020, 271, 110951. [Google Scholar] [CrossRef] [PubMed]
- Rose, A.N.; McKee, J.J.; Sims, K.M.; Bright, E.A.; Reith, A.E.; Urban, M.L. LandScan 2019; Oak Ridge National Laboratory: Oak Ridge, TN, USA, 2020. Available online: https://landscan.ornl.gov (accessed on 16 September 2021).
- Kazmierczak, A.; Cavan, G. Surface water flooding risk to urban communities: Analysis of vulnerability, hazard and exposure. Landsc. Urban Plan. 2011, 103, 185–197. [Google Scholar] [CrossRef]
- Afriyanie, D.; Julian, M.M.; Riqqi, A.; Akbar, R.; Suroso, D.S.; Kustiwan, I. Re-framing urban green spaces planning for flood protection through socio-ecological resilience in Bandung City, Indonesia. Cities 2020, 101, 102710. [Google Scholar] [CrossRef]
- Besio, M.; Ramella, A.; Bobbe, A.; Colombo, A.; Olivieri, C.; Persano, M. Risk maps: Theoretical concepts and techniques. J. Hazard. Mater. 1998, 61, 299–304. [Google Scholar] [CrossRef]
- Zeng, Z.; Lan, J.; Hamidi, A.R.; Zou, S. Integrating Internet media into urban flooding susceptibility assessment: A case study in China. Cities 2020, 101, 102697. [Google Scholar] [CrossRef]
- Botev, Z.I.; Grotowski, J.F.; Kroese, D. Kernel density estimation via diffusion. Ann. Stat. 2010, 38, 2916–2957. [Google Scholar] [CrossRef]
- Zhu, Z.; Ren, J.; Liu, X. Green infrastructure provision for environmental justice: Application of the equity index in Guangzhou, China. Urban For. Urban Green. 2019, 46, 126443. [Google Scholar] [CrossRef]
- Tang, X.; Li, J.; Liu, M.; Liu, W.; Hong, H. Flood susceptibility assessment based on a novel random Naïve Bayes method: A comparison between different factor discretization methods. Catena 2020, 190, 104536. [Google Scholar] [CrossRef]
- Wang, G.; Chen, J.; Zhao, C.; Zhou, X.; Deng, X. Exploration of the causality between area changes of green spaces and waterlogging frequency in Beijing. Phys. Chem. Earth Parts A/B/C 2017, 101, 172–177. [Google Scholar] [CrossRef]
- Warwick, K.; Craddock, R. An introduction to radial basis functions for system identification. A comparison with other neural network methods. In Proceedings of the 35th IEEE Conference on Decision and Control, Kobe, Japan, 13 December 2002; pp. 464–469. [Google Scholar] [CrossRef]
- He, S.; Zhai, J. The rescue and relief plan based on the risk assessment of debris flow in Yunnan Province, China. Nat. Hazards Res. 2021. [Google Scholar] [CrossRef]
- Yu, W.; Zhang, Y.; Zhou, W.; Wang, W.; Tang, R. Urban expansion in Shenzhen since 1970s: A retrospect of change from a village to a megacity from the space. Phys. Chem. Earth Parts A/B/C 2019, 110, 21–30. [Google Scholar] [CrossRef]
- Chen, J.; Chang, K.-T.; Karacsonyi, D.; Zhang, X. Comparing urban land expansion and its driving factors in Shenzhen and Dongguan, China. Habitat Int. 2014, 43, 61–71. [Google Scholar] [CrossRef]
- Chen, T.; Kaufmann, H.J. Analysis of Urban Change in Shenzhen City Based on Landsat Archived Data. J. Comput. Commun. 2018, 6, 146–154. [Google Scholar] [CrossRef][Green Version]
- Malik, S.; Pal, S.C.; Chowdhuri, I.; Chakrabortty, R.; Roy, P.; Das, B. Prediction of highly flood prone areas by GIS based heuristic and statistical model in a monsoon dominated region of Bengal Basin. Remote Sens. Appl. Soc. Environ. 2020, 19, 100343. [Google Scholar] [CrossRef]
- Zhang, Q.; Wu, Z.; Guo, G.; Zhang, H.; Tarolli, P. Explicit the urban waterlogging spatial variation and its driving factors: The stepwise cluster analysis model and hierarchical partitioning analysis approach. Sci. Total Environ. 2021, 763, 143041. [Google Scholar] [CrossRef]
- Du, S.; Wang, C.; Shen, J.; Wen, J.; Gao, J.; Wu, J.; Lin, W.; Xu, H. Mapping the capacity of concave green land in mitigating urban pluvial floods and its beneficiaries. Sustain. Cities Soc. 2019, 44, 774–782. [Google Scholar] [CrossRef]
- Du, S.; Van Rompaey, A.; Shi, P.; Wang, J. A dual effect of urban expansion on flood risk in the Pearl River Delta (China) revealed by land-use scenarios and direct runoff simulation. Nat. Hazards 2015, 77, 111–128. [Google Scholar] [CrossRef]
- Ayele, B.Y.; Megento, T.L.; Habetemariam, K.Y. Governance of green infrastructure planning in Addis Ababa, Ethiopia. Land Use Policy 2021, 105777. [Google Scholar] [CrossRef]


Publisher’s Note: MDPI stays neutral with regard to jurisdictional claims in published maps and institutional affiliations. |
© 2021 by the authors. Licensee MDPI, Basel, Switzerland. This article is an open access article distributed under the terms and conditions of the Creative Commons Attribution (CC BY) license (https://creativecommons.org/licenses/by/4.0/).