Abstract
The presence and extent of permafrost in the Himalaya, which is a vital component of the cryosphere, remains severely under-researched with its future climatic-driven trajectory only partly understood and the future consequences on high-altitude ecosystem tentatively sketched out. Previous studies and available permafrost maps for the Himalaya relied primarily upon the modelled meteorological inputs to further model the likelihood of permafrost. Here, as a maiden attempt, we have quantified the distribution of permafrost at 30 m grid-resolution in the Western Himalaya using observations from multisource satellite datasets for estimating input parameters, namely temperature, potential incoming solar radiation (PISR), slope, aspect and land use, and cover. The results have been compared to previous studies and have been validated through field investigations and geomorphological proxies associated with permafrost presence. A large part of the study area is barren land (~69%) due to its extremely resistive climate condition with ~62% of the total area having a mean annual air temperature of (MAAT) <1 °C. There is a high inter-annual variability indicated by varying standard deviation (1–3 °C) associated with MAAT with low standard deviation in southern part of the study area indicating low variations in areas with high temperatures and vice-versa. The majority of the study area is northerly (~36%) and southerly (~38%) oriented, receiving PISR between 1 and 2.5 MW/m2. The analysis of permafrost distribution using biennial mean air temperature (BMAT) for 2002-04 to 2018-20 suggests that the ~25% of the total study area has continuous permafrost, ~35% has discontinuous permafrost, ~1.5% has sporadic permafrost, and ~39% has no permafrost presence. The temporal analysis of permafrost distribution indicates a significant decrease in the permafrost cover in general and discontinuous permafrost in particular, from 2002-04 to 2018-20, with a loss of around 3% for the total area (~8340.48 km2). The present study will serve as an analogue for future permafrost studies to help understand the permafrost dynamics associated with the effects of the recent abrupt rise in temperature and change in precipitation pattern in the region.
1. Introduction
Permafrost, or perennially frozen ground (soil or rock) with temperature less or equal to 0 °C for at least two years [1], is an integral component of the cryosphere and covers ~24% of the land surface of the northern hemisphere [2]. This integral cryospheric component has been distinguished as one of the important indicators of global climate change within the international framework of the Global Climate Observing System in World Meteorological Organization [3]. Permafrost regulates soil moisture and consequently the landscapes as well as an ecosystem over large regions as the seasonally freezing and thawing of the active layer controls the hydrological, biological, and geomorphic processes and affects the anthroposphere [4,5]. However, in response to the increase in annual average temperature, the permafrost is depleting in many regions globally, including the Himalaya. The thawing of permafrost can have diverse and widespread impacts on society, such as an increase in landslides and land degradation due to destabilization of slopes [6,7,8,9], ground subsidence [10,11,12], changes in subsurface hydrology [13,14,15], damage to infrastructure [16,17], and change in sediment load of rivers [18]. More importantly, as the permafrost thaws, it releases greenhouse gases from the stored soil organic carbon, which creates positive feedback and further amplifies the rate of rise in annual average temperature [19,20,21]. Keeping the above facts in view, the Intergovernmental Panel on Climate Change (IPCC) (2014) suggested that climate change will bring about unexpected permafrost phenomena and societal impacts in the future [22,23].
While a wealth of studies are available on the status of Himalayan glaciers (e.g., [24,25,26,27,28,29,30,31,32]), glacier dynamics (e.g., [33,34]), glacier mapping (e.g., [33,34,35,36,37]), crevasse mapping (e.g., [38]), glacial lake mapping (e.g., [39,40,41]), melt-water geochemistry (e.g., [42,43]), and discharge reconstruction (e.g., [44,45]), the permafrost distribution and the potential impact of its thaw is largely unknown for the most part of the Himalaya [46]. In recent years, several studies have investigated permafrost in the Tibetan plateau [47,48], Hindu Kush-Himalaya (HKH) [49], and Nepalese Himalaya [50]. However, in the case of North-western Himalaya, only fragmented information exists [6,7,51,52,53,54]. A global Permafrost Zonation Index (PZI) at ~1 km resolution was provided by Gruber (2012) using an empirical relationship between permafrost and mean annual air temperature (MAAT), which can be considered as a first order estimate of permafrost. However, PZI was broadly based on the boundaries of continuous and isolated permafrost on the International Permafrost Association (IPA) map provided by Brown et al. [55], including the reanalysis of digital elevation model (DEM), and did not consider field validation [56]. PZI uses modelled MAAT, which has its own limitations in high mountain regions, and by using the modelled MAAT further to model permafrost has the potential to introduce further magnified biases in the results. Although PZI is more useful in outlining the overall spatial pattern of permafrost occurrence, it may fail in capturing the small-scale variations and heterogeneity of permafrost existence since it uses temperature as a single predictive variable. Another global study by Obu et al. [57] provides the permafrost map of the northern hemisphere at ~1 km resolution but does not account for permafrost variability in steep mountains, primarily due to inability of their model to include the slope and aspect.
One of the major difficulties in studying permafrost using remote sensing is that unlike other cryospheric components such as snow and ice, permafrost cannot be directly observed through remote sensors [58]. The existence of permafrost depends on certain environmental conditions that can be expressed through surface information which can further be assessed using remotely sensed observations. Mean annual air temperature (MAAT), potential incoming solar radiation (PISR), and slope aspect are the principal factors that administer and regulate the presence and absence of permafrost in the mountainous environments [22]. In the present study, as a maiden attempt, we comprehensively used remote sensing data and techniques for permafrost mapping along with ground validation in the parts of Western Himalaya. The major objectives of our work are: (1) to systematically analyze the key climatic and topographic parameters controlling occurrence of permafrost such as temperature, precipitation, incoming solar radiation, slope and aspect derived from multi-source multi-temporal remote sensing data; (2) to collectively integrate these variables in analytical hierarchy process (AHP)-based framework to get a robust spatial distribution of permafrost; (3) to compare and validate the results with ground/field observations and available published results in the study area and; (4) to create a permafrost distribution map for the parts of the Western Himalaya. In the end of the discussion section, we also argue the limitations associated with our methodology and results. The present study will serve as an analogue for future permafrost studies that will help in understanding the dynamics of permafrost in a changing environment and has implications for discerning the impacts of permafrost thawing on the evolution of potential natural hazards that may affect the high mountain communities. This becomes critical considering the higher rates of warming than the global averages [59,60,61,62] and increasing frequency of disasters in permafrost areas [9,63] observed in the Himalaya.
2. Study Area
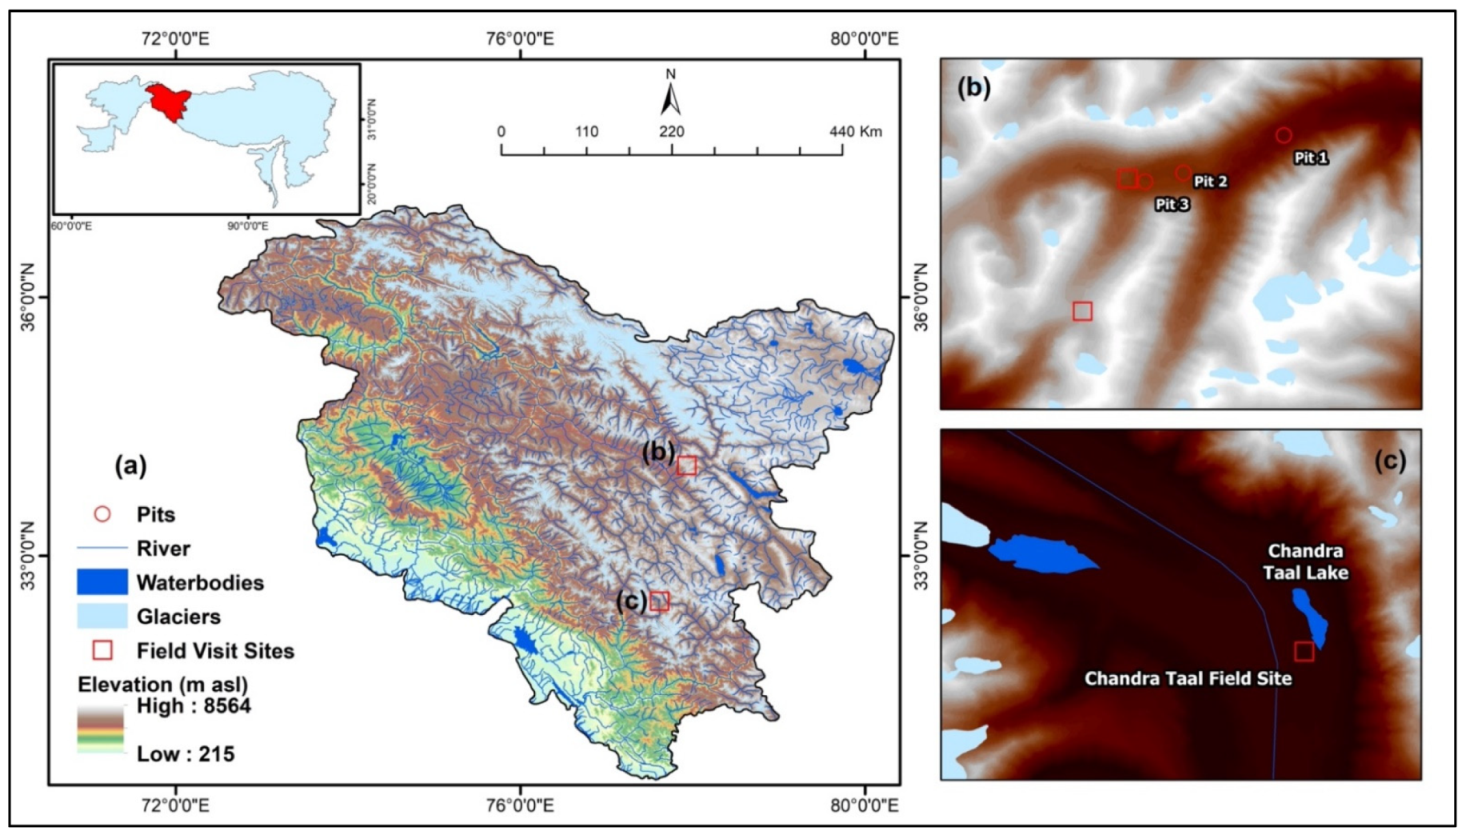
The permafrost probability mapping was carried out for an area of ~278,016 km2, in the parts of Western Himalaya, spanning from Baltistan in the northwest to Himachal Pradesh in the southeast (Figure 1). The area constituted of five mountains ranges of Karakoram-Himalaya viz. the Karakoram Range, Ladakh range, Zanskar range, Pir-Panjal range, and Greater Himalayan range. The background for the selection of the study area was to include the most possible climatological diversity and geographical or geomorphological vividness of the Himalaya. The area under investigation forms a transitional climatic zone, where the moist and lush lowlands and foothills of southern parts ascend and meet the cold and dry highlands of Western Himalaya. Climatologically, two major weather systems operate in this part of the Himalayan region, viz. the Indian Summer Monsoon (ISM) and the midlatitude Westerlies or the Western Disturbances (WD) [30,64,65,66]. The Western Himalayan region (Karakoram Range) lies in the trajectory of the midlatitude westerlies that brings moisture and cold winds and produces heavy snowfall during the winter; however, the influence of mid-latitude westerlies decreases towards further south and east [65,66]. Contrarily, the southern and south-eastern parts of the study area are dominantly influenced by the ISM and receive heavy summer (June–September) rainfall and hence experience a humid to sub-humid climate [65,67]. As this wind system approaches the north-western and north-eastern region, they experience a progressive decline in the precipitation at an expanse of topography and winter snowfall [68,69,70]. Therefore, the tropical character of the south and southeast region and the semi-arid ‘cold desert’ character of the north-west and north-east region is largely a consequence of topography-climate interactions. The unique climatological, as well as geomorphological setting of the study area, has resulted in microclimatic conditions along a climatic gradient ranging from sub-tropical humid towards the south-eastern parts at altitudes <2000 m asl to alpine valleys above ~3500 m asl to progressively tundra-type at altitudes above ~4000 m asl (Figure 1). Keeping the influence of the two weather systems under consideration, four different climatic zones (ISM dominated, WD dominated, transition zone, and precipitation shadow zone) are proposed for the study area, which basically reflect the dominance of these weather systems [71].
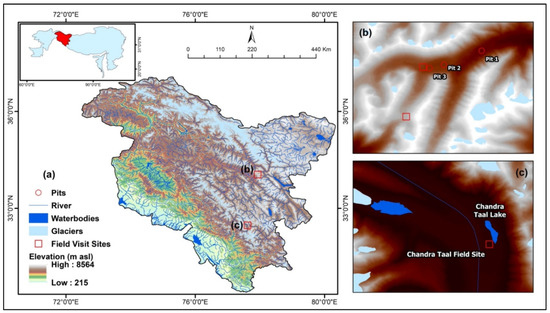
Figure 1.
The map showing the (a) location of the study area (highlighted in red) in the HKH region (inset boundary by ICIMOD [72]) with elevation after Shuttle Radar Topographic Mission (SRTM), glaciers [73], water bodies [74] and ground validation sites in (b) Ladakh and (c) Himachal Pradesh.
3. Materials and Methods
3.1. Temperature
The 8-day night and daytime temperature observations from the Moderate Resolution Imagining Spectroradiometer (MODIS) onboard Terra (MOD11A2 available from February 2000) and Aqua (MYD11A2 available from July 2002), were used to derive annual land surface temperature (LST). The Terra and Aqua products provide an average of an 8-day period LST in a 1200 × 1200 km grid. It is not ideal to employ remotely sensed LST directly for permafrost mapping because of the insulating effect provided by the winter snow cover [75]. Furthermore, the thermal offset on annual scale, caused by differing thermal conductivities of the permafrost active layer when frozen and thawed, can introduce irregularities in the spatiotemporal relationship between annual average ground temperatures and annual average LST [57]. Therefore, the average of 8-day LST (arithmetic average daytime and night-time values of MOD11A2 and MYD11A2) were first used to calculate the monthly average and subsequently to calculate the annual average LST for each hydrological year (September to October of the consecutive year) to reduce the biasness associated with missing values in a particular month.
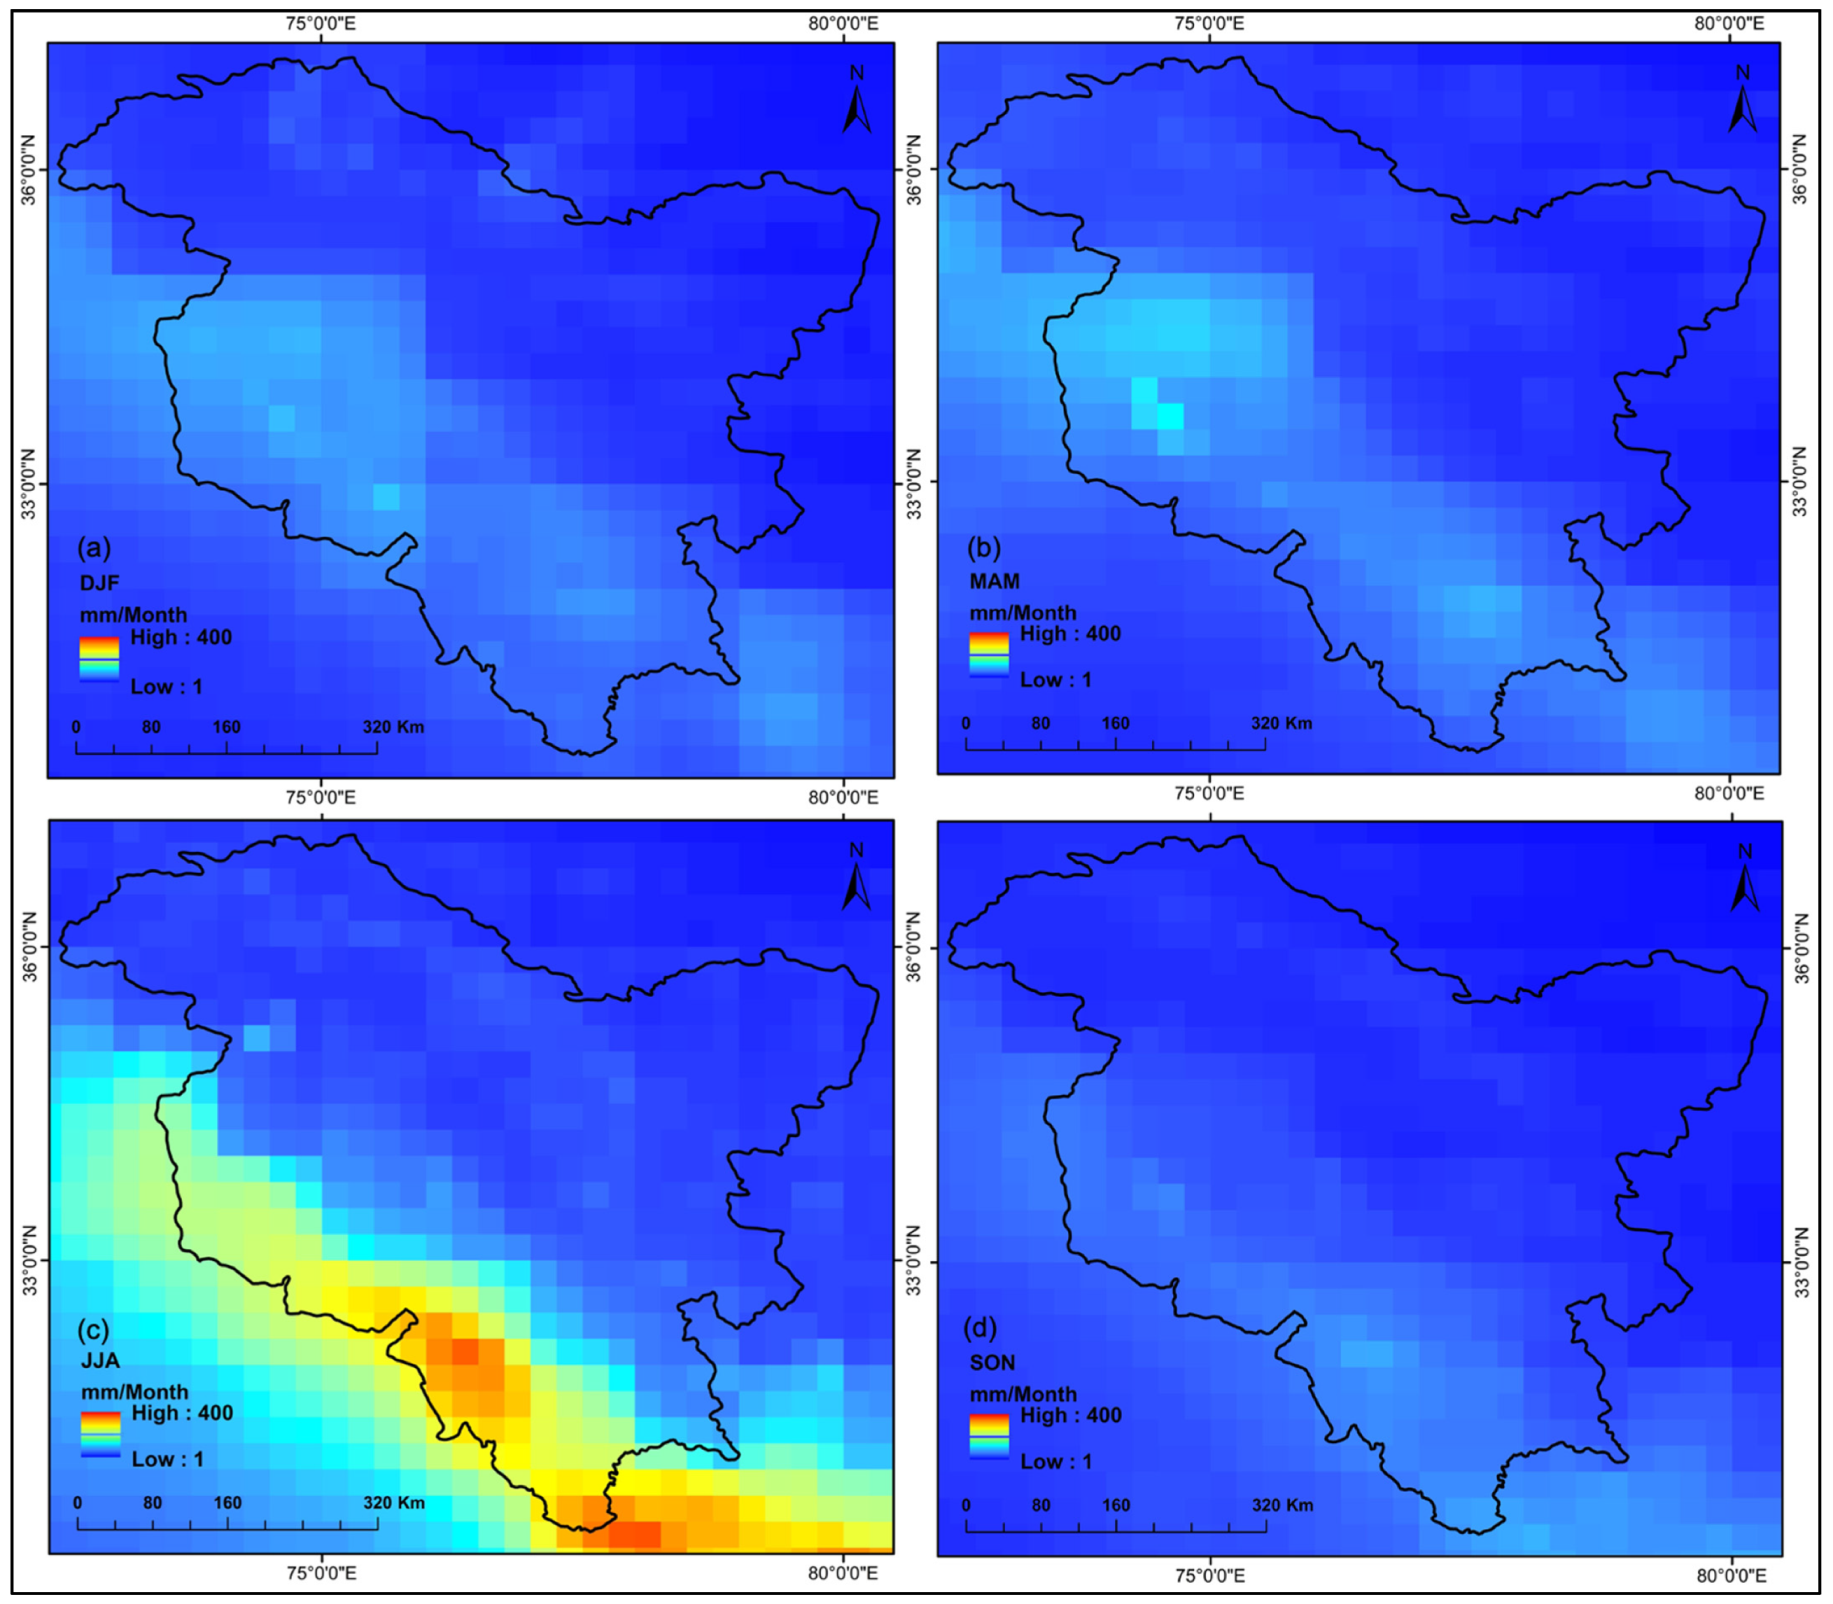
The average annual LST were then converted to the mean annual air temperature (MAAT) following the statistically significant equations developed by Singh et al. [71] for the different elevation and precipitation zones of the Western Himalaya. Singh et al. [71] used 8-day LST from the arithmetic mean of MOD11A2 and MYD11A2 and compared them with the 8-day air temperature from eleven high-altitude stations to derive statistically robust (R2 = 0.80, root mean square difference = 5.7 °C, n = 3552, p-value < 0.01 at 99% confidence level) relationships between air and surface temperatures across various climatic regimes of the Western Himalaya, as shown in Table 1. The relationship between LST and air temperature is largely dictated by availability of moisture in near surface atmosphere, which is controlled by precipitation. Therefore, the Tropical Rainfall Measuring Mission (TRMM) of precipitation product [76] was obtained for the period of 1 January 1998 to 31 December 2020, and plotted for December to February, March to May, June to August, and September to November (Figure 2) for the categorization of the four precipitation zones [77] (Table 1), which are ISM dominated (Equation (4), WD dominated (Equation (3), transition zone (Equation (2) and the precipitation shadow zone (Equation (1). The monthly rate of precipitation in millimeters per month (mm/Month) was used to estimate seasonal average (Figure 2). The precipitation is higher in the southern part of the study area during the ISM dominant months (Figure 2c) and the peak shifts to the north-western part of the study area, although at lower magnitude, during the WD dominants months (Figure 2a).

Table 1.
Details of relationship used to convert mean annual land surface temperature (LST) to mean annual air temperature (MAAT) for different precipitation zones (R2 = coefficient of regression between LST and MAAT; n = number of observations) (modified after Singh et al. [71]).
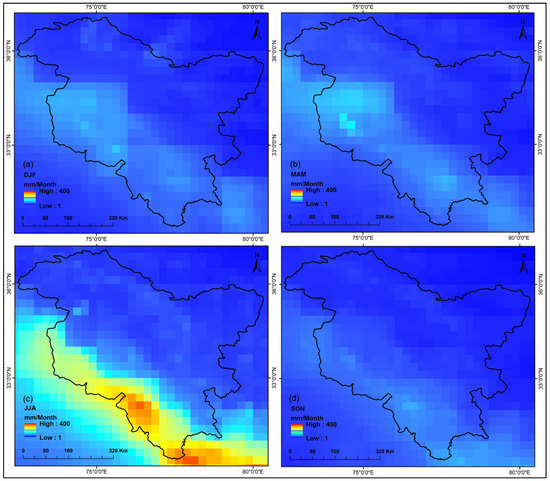
Figure 2.
Tropical Rainfall Measuring Mission (TRMM) derived precipitation maps [76] of the study area showing dominance of precipitation during (a) December–January–February; (b) March–April–May; (c) June–July–August and; (d) September–October–November.
Following the methodology explained above and equations listed in Table 1, the annual mean LST for all the eighteen hydrological years between September 2002 and October 2020 were converted to MAAT. After the conversion, the arithmetic mean of MAAT for two consecutive hydrological years were used to calculate the biennial mean air temperature (BMAT) to be used as an input for AHP for the determination of occurrence of continuous (below −5 °C) and discontinuous (−5 °C to 0 °C) permafrost [78,79,80]. Although the transition between continuous and discontinuous permafrost occurs between −6 °C and −8 °C [80], the snow cover can significantly increase the temperature of permafrost surface [81]. For sporadic permafrost, which is defined as the area where the temperature fluctuates above and below 0 °C isotherm, we used maximum and minimum value of each pixel in MAAT between two consecutive years (which varied between −1.3 °C and 1.64 °C) and used in AHP to classify the sporadic permafrost area. The pixels with value >0 °C which do not qualify for sporadic were classified as no permafrost area. Finally, we used the maximum value of BMAT for each pixel between 2002-04 and 2018-20 and used it in AHP to create a robust permafrost map for the study area.
3.2. Land Cover and Use
Permafrost occurrence is a complex ground characteristic with intricate correlation with surface temperature, surface topography, geology, vegetation, and soil moisture [4,22]. The complexities involved in the conditions of occurrence of permafrost makes it difficult to directly observe remotely and can only be inferred from proxy geophysical variables and surface features derived from remotely sensed data [58]. These geophysical and geomorphic parameters can be extracted from freely available multi source remote sensing datasets. The land cover was obtained from cloud free Landsat 8 [82] datasets available between 2017 and 2019. The presence of prominent features, such as rock glaciers, gelifluctions, perennial snow patches, modification, the degradation of slopes, and thermokarst lakes manifest the presence of permafrost [40,83,84,85]. However, the areas covered by the glaciers, lakes, and water bodies are generally considered to be an indicator of permafrost absence. These surface indicators were identified using freely available 30 m spatial resolution Landsat images for the years 2017/18/19 (ablation season) from the U.S. Geological Survey (USGS) and the National Aeronautics and Space Administration (NASA) [82]. The glaciers were extracted for the study area using glacier outlines obtained from the Randolph Glacier Inventory, Version 6 [73]. The optical images were further used to classify the surface features into barren land, vegetation, settlement, glacier cover and water bodies. Since the probability of permafrost occurrence based on where BMAT is highest in the areas located above the transient tree line [86], the vegetation cover has not been further divided into different forest types. We have used unsupervised classification technique to classify the surface features because of the large study area [87]. A confusion or error matrix and Kappa coefficient (K) has been used to perform the accuracy assessment [88]. A set of 261 random points were created for accuracy assessment, which were then overlaid on the Google Earth image for cross checking the unsupervised classification result with the actual ground feature. The overall accuracy and Kappa coefficient of our unsupervised classification is 91.57% and 85.00% respectively (Table 2).

Table 2.
The table showing the surface feature accuracy assessment.
3.3. Ground Terrain Variables
After temperature, the solar radiation, slope, and aspect are the principal variables influencing the formation and existence of permafrost in the mountainous regions [22,89,90,91]. The potential incoming solar radiation (PISR) affects the ground temperature through subsurface energy flux [92]. The distribution of PISR is predominantly influenced by surface topography, elevation, slope, and relief, and plays a crucial role in the formation of permafrost by influencing the microclimate and hence ground temperature [84,93,94]. Hoelzle [84] suggested that, on a local scale, direct solar radiation is probably the most important factor for the distribution of mountain permafrost, because MAAT determines large scale distribution patterns of permafrost. According to Hoelzle [84], permafrost could exist at low altitudes, i.e., far below the 0 °C isotherm in case of strongly reduced radiation. In the present study, we derived the ground terrain variables such as PISR, slope, and aspect from Shuttle Radar Topographic Mission (SRTM) DEM, as used in several other similar studies [22,49,95]. We used SRTM DEM (~30 m) and the ‘Area Solar Radiation’ tool in ArcMap 10.4 to create a PISR grid of about 30 m resolution for the late summer months (1 June to 30 September) with relatively low snow cover [96,97]. A sky size value of 200 was given as an input, which is sufficient for large day interval setting (>14 days) along with the default value for other parameters in the ArcMap tool [98]. The PISR has further been reclassified into four classes varying from 0 to 2.5 MW/m2. We did not consider PISR above 2.5 MW/m2 as the areas receiving more solar radiation does not indicate permafrost [83]. The upper limit was estimated for the period (June–September) when the solar radiation is maximum in the region and was considered to ensure the robustness of the permafrost mapping. Aspect and slope play dominant roles in the likelihood of permafrost by influencing radiative forcing. Both the terrain parameters were derived in the GIS environment from 30 m SRTM DEM. The aspect was further classified into four classes which are north (303.75°–0° and 0°–33.75°), east (33.75°–123.75°), south (123.75°–213.75°) and west (213.75°–303.75°), and slopes were categorized into four classes 11.1°–19°, 19.1°–27°, 27.1°–35° and <11°–>35° [7,83,99,100] (Table 3).

Table 3.
Weights and ratings of permafrost variables in the Analytical Hierarchy Process (AHP).
3.4. Resampling and Analytical Hierarchy Process (AHP)
In total, we have five different types of datasets, four (PISR, Slope, Aspect, and Surface Feature) having 30 m and one (BMAT) with 1 km resolution. Since resampling of one dataset to the resolution of other four was a better option, instead of the vice-versa (to reduce the uncertainties generated during the resampling), we used an ArcGIS bilinear resampling technique to resample BMAT to 30 m resolution [101]. The purpose of the resampling was not to increase the resolution of the output rather to bring all the different datasets to the same resolution so that they can be used as an input to the AHP. The AHP is a semi-quantitative, multi-criterion, subjective and objective decision-making method in which decisions are taken using weights through pair-wise relative comparisons [102]. The concept of AHP is based on three factors which are disintegration, comparative judgment, and the integration of priorities [103,104,105,106]. It breaks down a complex decision problem into factors, arranges them hierarchically, and assigns weights according to their subjective relevance and relative importance by setting up a comparison matrix. The AHP method for permafrost mapping was adopted owing to the advantages of using AHP as an expert-based method in which a variety of information influencing the permafrost development can be incorporated subjectively as well as objectively. In AHP, when a consensus is reached, the weights for each component are obtained automatically by an eigenvector calculation of the comparison matrix and inconsistencies can be corrected if needed using consistency index values [102,103,107]. The only shortcoming of the method is that the subjective preference in the ranking of factors may differ from one expert to another [103]. In this study, the relative value of each pair of factors was determined based on extensive literature review and after rigorous sensitivity analysis for the factors for which little or no information was available. In AHP, the comparison of factors is made by using a scale ranging from one to nine if the factors have direct relationship, and the values varies between 1/2 to 1/9 if they have inverse relationship [108]. The calculation of the comparison matrix gives factor weight in terms of eigenvector.
Based on the LST derived BMAT, the study region was divided into four temperature classes, which are <−5 °C; −5 °C to −1.3 °C; −1.3 °C to 1.64 °C and >1.64 °C (Table 3) [55,77,78] which has been discussed in detail in Section 3.1. These classes were assigned the ratings of 9, 7, 3, and 2, respectively, for the AHP modelling. It has been emphasized that in the mountainous regions, such as Alps and Himalaya, permafrost can exist even below 0 °C isotherm line at most topographically suitable locations such as shaded reliefs receiving reduced solar radiation [7,84,109]. Considering this argument, we have performed a sensitivity analysis with BMAT and considered a temperature range (−1.3 °C to 1.64 °C) with a lower rating in the model, so that the sporadic area of permafrost is not underestimated. The PISR has been reclassified into four classes varying from 0 to 2.5 MW/m2 and the lower value of PISR was assigned higher ratings on a 1–9 scale (Table 3). The Aspect was given weights lesser than PISR but greater than the slope angle. From the existence of rock glaciers in this region [110], it was evident that the permafrost favoured the northern slopes than the western slopes, and lesser solar radiation on the northern slopes of the northern hemisphere may be implicated [46,49,111]. Therefore, the northern slopes were allocated a maximum rating of 9 and the southern slopes were allocated a minimum rating of 2. Following the suggestions of Allen et al. [7] and Arenson and Jakob [83], slopes flatter than 10° and steeper than 35° were considered insignificant for the occurrence of permafrost. Before assigning ratings (weight) to the slopes, a sensitivity analysis was carried out to find the slope range influencing the permafrost occurrence most significantly. Based on the sensitivity analysis, the slope between 19° to 35° was given the highest ratings.
3.5. The Model for Permafrost Mapping
For permafrost occurrence probability mapping, all the four variables which are BMAT, PISR, aspect, and slope were reclassified into four classes, and each class was assigned a rating on a scale of 1 to 9 (Table 4) conditional to their importance for permafrost occurrence. Four different variables were weighted and added to create the final permafrost occurrence map. All the variables were given a weight value ‘w’ with which the variable ratings were multiplied.
where, X = model output, Wm, Wp, Wa, Ws are the weights of MAAT, PISR, Aspect, and slope respectively and Rm, Rp, Ra, Rs are the BMAT, PISR, Aspect and Slope with their ratings. The ratings of the BMAT and Aspect were assigned based on previous studies [55,78,79,83,99,100]. The ratings of PISR and Slope were assigned on the professional judgment after carrying out several sensitive analyses.
X = Wm * Rm + Wp * Rp + Wa * Ra + Ws * Rs
The final permafrost distribution then was obtained by multiplying the model results with the ground surface covering information.
where, PE = Permafrost existence, GSC is ground surface covering. GSC also contained four layers, each layer having ratings from 1 to 9.
PE = X * GSC
We estimated biennial change in permafrost occurrence from 2002-04 to 2018-20 based on the Equations (5) and (6) for the spatiotemporal variation in permafrost distribution in the region. The PE was subjected to sensitivity analysis based on the field validation to estimate the continuous, discontinuous, and no permafrost cover. The maximum and minimum of MAAT were used to identify the pixels with values fluctuating around 0 °C isotherm and were classified as the sporadic permafrost cover. To ensure the robustness of the final permafrost map over the period September 2002 to October 2020, we used the maximum of BMAT (from 2002-04 to 2018-20) for mapping the distribution of continuous, discontinuous, and no permafrost zones and maximum and minimum of BMAT (from 2002-04 to 2018-20) for mapping the sporadic permafrost zone.

Table 4.
The table summarizing the permafrost area in different categories with the number of rock glaciers found in each category which has been considered for accuracy assessment.
Table 4.
The table summarizing the permafrost area in different categories with the number of rock glaciers found in each category which has been considered for accuracy assessment.
| Permafrost Zones | Area (km2) | Area (%) | Number of Rock Glaciers Mapped in the Area | ||
|---|---|---|---|---|---|
| Schmid et al. [49] | Pandey [110] | Hassan et al. [112] | |||
| Continuous permafrost | 69,563.01 | 25.02 | 165 | 240 | 325 |
| Discontinuous permafrost | 96,097.86 | 34.57 | 102 | 252 | 257 |
| Sporadic permafrost | 4251.92 | 1.53 | 0 | 0 | 0 |
| No permafrost | 108,103.60 | 38.88 | 10 | 24 | 15 |
| Total | 278,016.40 | 100 | 279 | 516 | 597 |
4. Results
4.1. Temperature
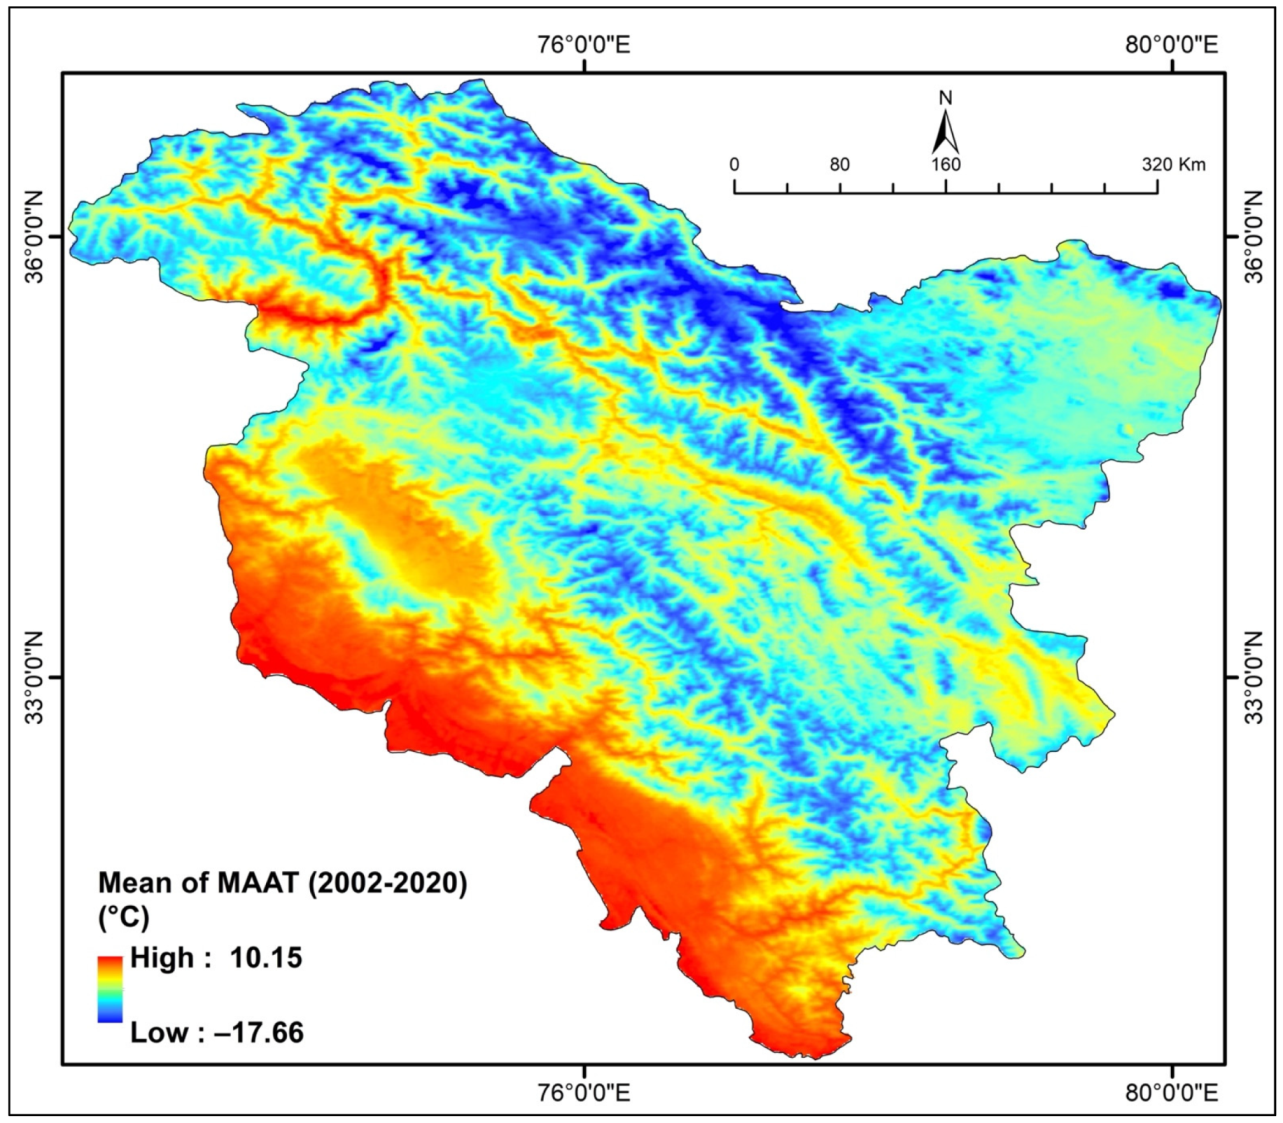
The mean of near-surface air temperature varies between −17.65 °C to 10.15 °C (Figure 3) with minimum of maximum and minimum temperature below −16 °C and −18 °C (Supplementary Figures S1 and S2), respectively. There is a high interannual variability associated with mean annual air temperature with a standard deviation varying between 0.1 °C and 3 °C (Supplementary Figure S3). Interestingly, the variability is lower on the southern side of the study area and higher on areas with high elevation. The result from the present study shows that out of the total study area, ~33.12% of the total study area has MAAT lesser than −5 °C, indicating a large part of the study area with cold climate. About 28.94% of the overall study area has MAAT ranging between −5 °C to −1.3 °C, ~13.02% area has −1.3 °C to 1.64 °C and ~24.92% has MAAT more than 1.64 °C (Figure 3). The results show that apart from the southern side of the study area, other parts with higher temperature range and high interannual variability have potential of permafrost occurrence (Figure 3).
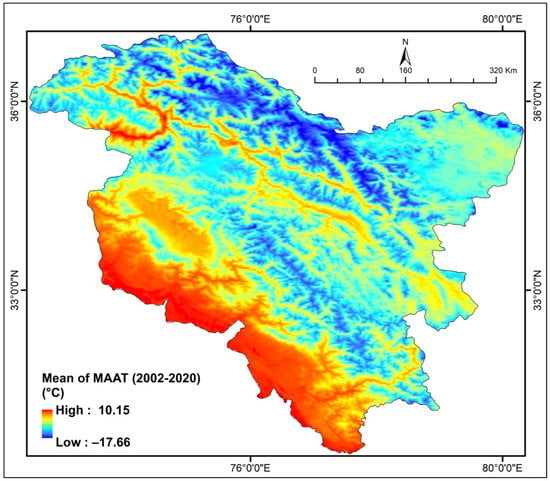
Figure 3.
Map of the study area showing the mean annual air temperature (MAAT) averaged for the period 2002-04 to 2018-20 in °C.
4.2. Land Cover and Ground Variables
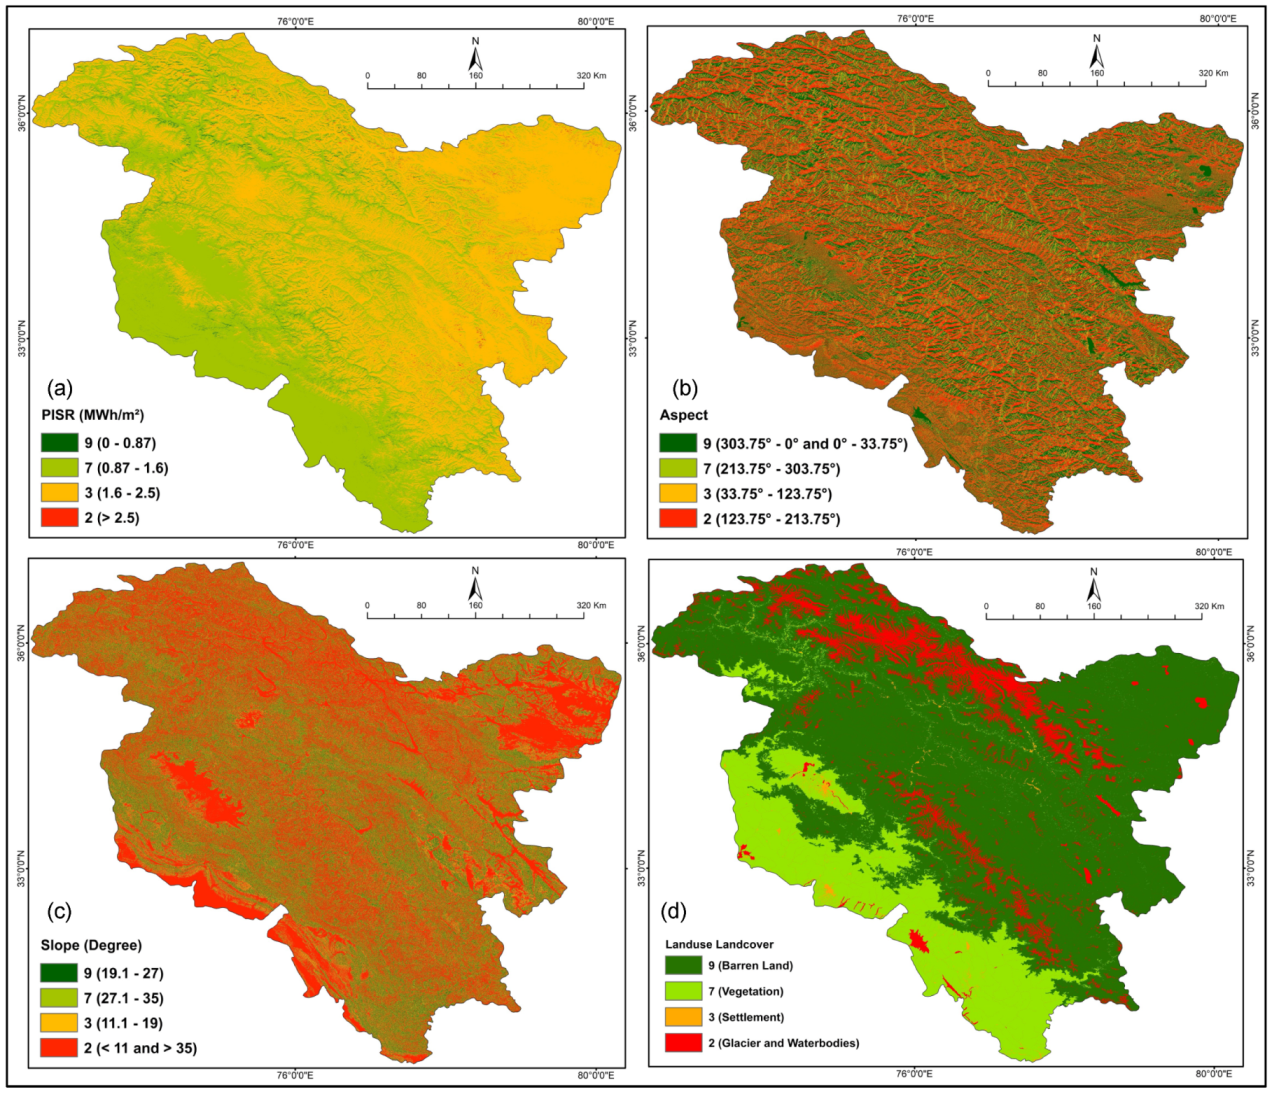
The primary remote sensing inputs for identification and mapping of spatial distribution of permafrost are BMAT, PISR, aspect, slope, and surface features (Figure 4). The final grid resolution of the generated permafrost map is 30 m after resampling. The PISR distribution is relatively uniform with ~50% of the study area receiving solar radiation between 1.76 and 2.5 MWh/m2 and 48% of the area receiving between 0.88 and 1.76 MWh/m2. Of the total study area, ~36% are northerly and ~38% southerly oriented. The PISR of a specific area is directly associated with the topographic shading, which is comprised of two components which are shaded relief which occurs when the solar radiation is blocked due to its own relief and cast shadows, which occurs when solar radiations casts shadows from another topographic feature mostly steep valley walls [113]. The higher reaches of valleys in Himalaya with north and south aspect are mostly influenced by cast shadows [113], and since ~78% of the study area is either northerly or southerly oriented (Figure 4d), the cast shadow is the most influential topographic shading in the present study area.
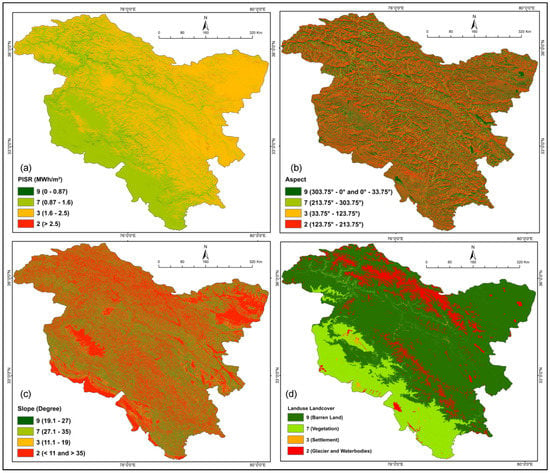
Figure 4.
Maps of the study area showing the ground variables (a) Potential incoming solar radiation (PISR) from Shuttle Radar Topographic Mission (SRTM), (b) Aspect from SRTM, (c) Slope from SRTM, and (d) Land use and land cover mapped on Landsat 8, used in analytical hierarchy process (AHP).
4.3. Validation and Accuracy Assessment
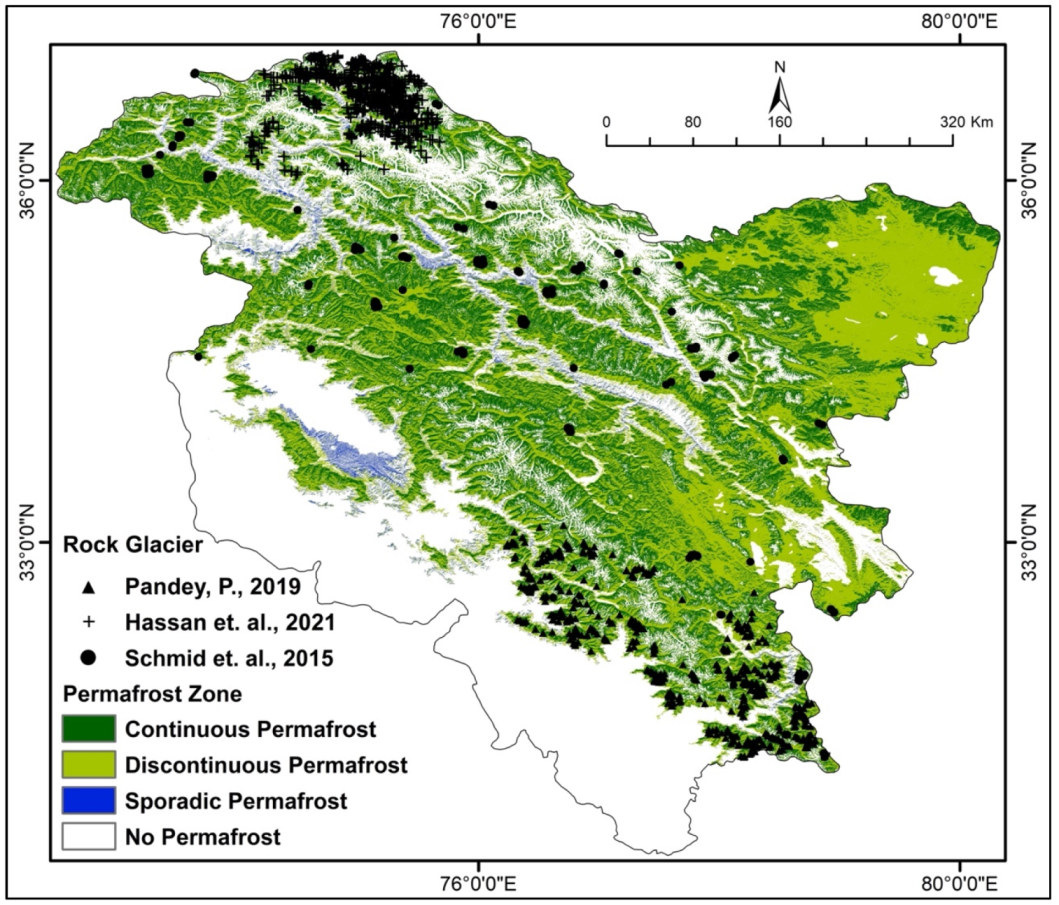
The primary driver of the permafrost occurrence is BMAT, which again is controlled by topographic and surface characteristics. By logically amalgamating geophysical and geomorphic parameters in ArcGIS, the spatial distribution and mapping of permafrost zones were carried out for the Western Himalaya. To ensure the robustness of the model, we firstly used the maximum of BMAT from 2002-04 to 2018-20 to map the occurrence of permafrost (Figure 5). Due to the use of maximum value recorded by each pixel in the study area as an input, the permafrost area occurrence mapped shows the minimum area in each category with statistically high confidence. The results showed ~25.02% of the study area has continuous permafrost, about ~34.57% has discontinuous permafrost, ~1.53% has sporadic permafrost, and ~38.88% has no permafrost.
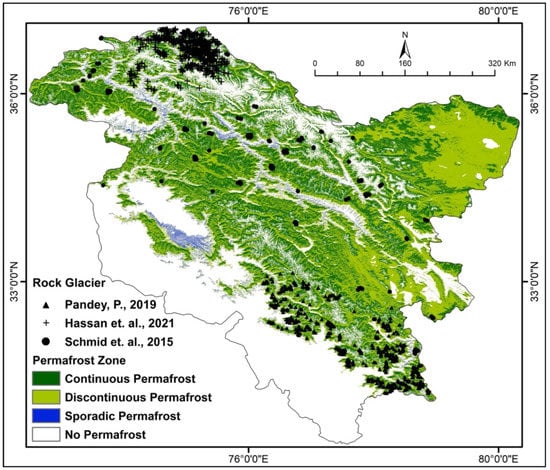
Figure 5.
Map of the study area showing the distribution of different permafrost zones with location of rock glaciers mapped by Hassan et al. [112], Pandey [110], and Schmid et al. [49] using the maximum of BMAT from 2002-04 to 2018-20.
Except for ice-cored rock glaciers, rock glaciers are a periglacial process [114] which implies that they are a non-glacial landform linked to cold climates especially with different types of frozen ground. Therefore, the presence of rock glaciers can be used as a proxy for the presence of permafrost because they are accepted as visible indicators of permafrost [49]. We compared the assessment of permafrost presence mapped using BMAT from 2002-04 to 2018-20 with rock glaciers mapped in the study area (Table 4). The accuracy assessment with rock glacier data showed a good consistency. There are total of 279, 516, and 597 rock glaciers mapped by Schmid et al. [49], Pandey [110], Hassan et al. [112] respectively, that fall inside the present study area. Out of these 1392 glaciers, only 49 happen to be located outside the continuous or discontinuous permafrost zones (Table 4).
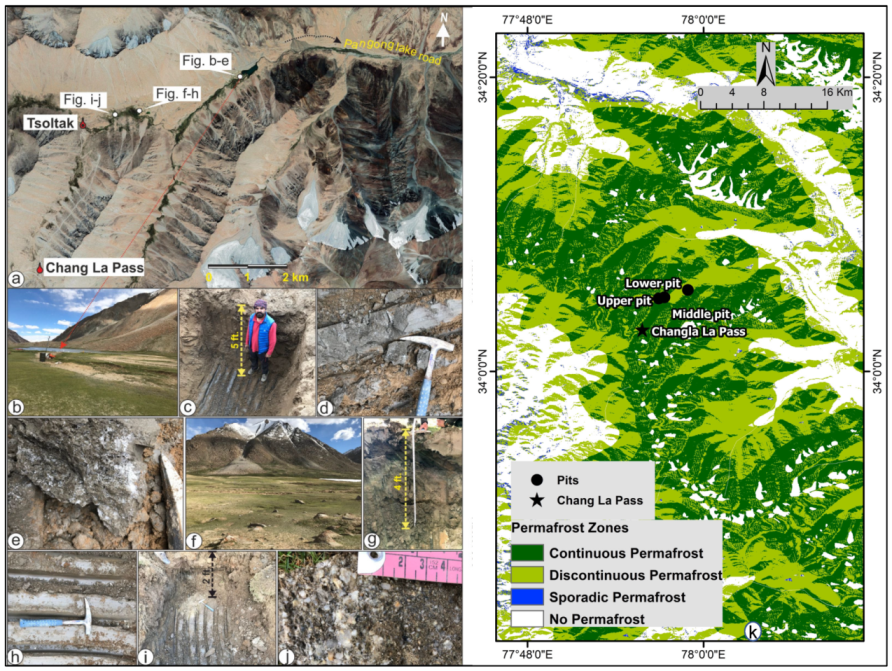
The modelled permafrost distribution was validated with independent ground truth by field observations at two different locations present within completely different climatic and topographic setting (location shown in Figure 1). The first location used for the validation of our result was Chang La Pass near Leh, Ladakh. The permafrost occurrences have been suggested to occur at a shallow depth throughout Taglang La and Chang La Passes [40]. To validate our results, we have chosen the northern slopes of Chang La, as our results indicated presence of continuous permafrost at this location (Figure 6). The field validation work was carried out in July 2019. We excavated pits at three different locations with gradually increasing elevation (~4838, 4970 and 4990 m asl) using an excavation machine (Figure 6) and, interestingly, the evidence of depth wise permafrost existence was found. A completely frozen ground (permafrost) at a depth of ~1.5 m was observed in the pit made at an elevation of ~4838 m asl, while the same was observed at less than 1 m and 0.5 m depth for the other two pits at elevations of ~4970 and 4990 m asl respectively (Figure 6). It is evident from the field observations that the permafrost occurrence becomes shallower with an increase in the elevation. Besides this, permafrost mounds that are suggested to be the geomorphological expression of changes due to permafrost activity are also observed in these areas.
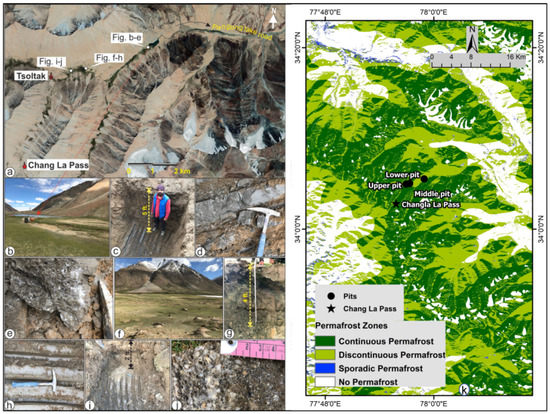
Figure 6.
(a) Google Earth Pro image showing the location of pits excavated on the north slope of Chan La pass, (b–e) field photographs showing the pit site (~4838 m asl), permafrost depth, permafrost surface, and ice crystals respectively, (f–h) field photographs of the second pit (~4970 m asl) showing the synoptic view of pit site, permafrost depth and permafrost surface, and (i,j) field photographs of the third pit (~4990 m asl) showing permafrost depth and ice crystals, and (k) permafrost zone classification in the area.
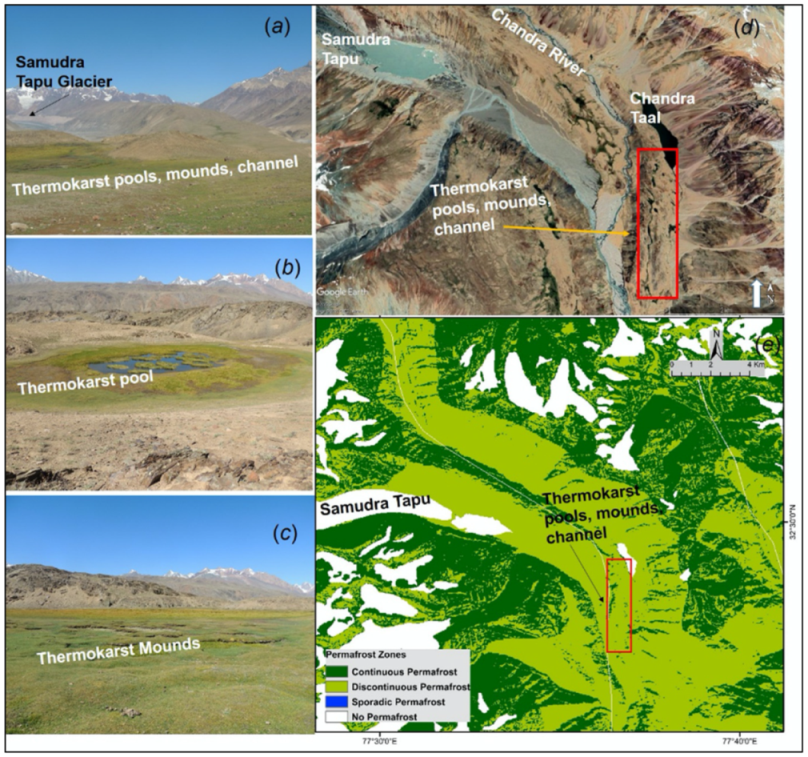
The second location for the ground validation was near Chandra Taal Lake in Spiti valley, Himachal Pradesh at an elevation of ~4300 m asl (location shown in Figure 1), where pit/trenching could not be done due to logistic difficulties. Between Chandra River and Chandra Taal Lake, the formation of periglacial geomorphological features, which includes thermokarst lakes, mounds, and channels, are visible indicators of the presence of permafrost in the region (Figure 7). Several thawed depressions filled with water (thermokarst lakes) and small frost mounds have formed in the locations, which are a good indicator of ice-rich permafrost in the region [40]. It has been observed that in some continuous permafrost zones, beaded drainage develops when small, thawed pools join [115,116,117] (Figure 7). This feature can be seen in the synoptic view of the location obtained from Google Earth. The presence of thermokarst lakes, mounds, and beaded streams indicated and validated the results obtained from our model for permafrost mapping in the Chandra valley also.
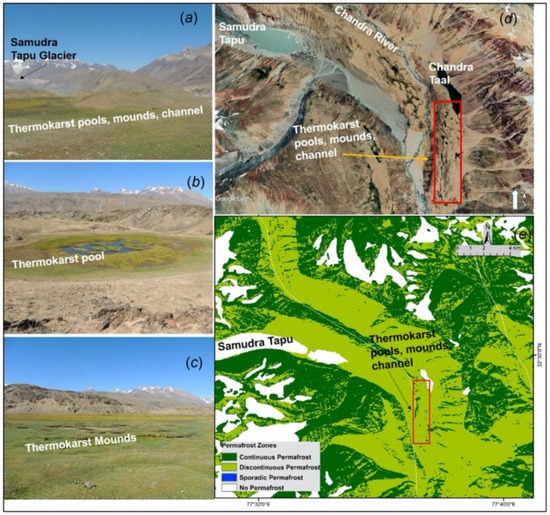
Figure 7.
The field-photographs of geomorphological proxies associated with presence of permafrost (a) Thermokarts features close to Samudra Tapu glacier, (b) Thermokarts pool, (c) Thermokarts mounds, (d) GoogleEarth image of the area, and (e) permafrost zone classification in the area.
4.4. Distribution of Permafrost
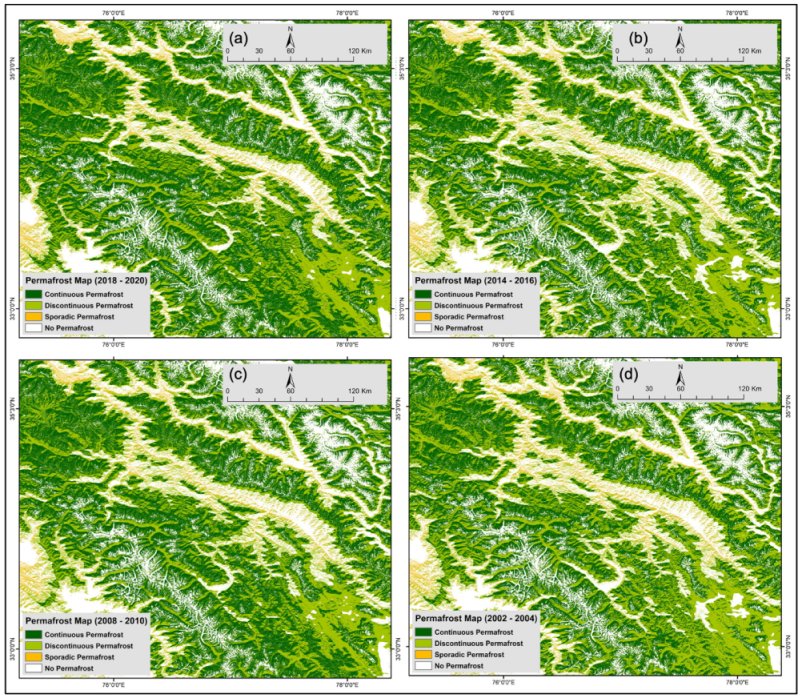
After the development of the permafrost distribution map, with a minimum extent of permafrost occurrence using the maximum of BMAT for 2002-04 to 2018-20, we also looked at the temporal change in the permafrost area during the last two decades. As the permafrost distribution has been mapped primarily based on BMAT, the pixels with fluctuation in BMAT will result in the change of the category of permafrost distribution the pixels are identified as, giving information about the spatial change in permafrost distribution over time. This is particularly important because the change in biennial temperature over two decades will directly affect the active layer thickness, and therefore the transition between different permafrost zones, rather than the existence of permafrost. For the temporal analysis, nine different permafrost maps were created using the nine BMAT’s between 2002-04 and 2018-20, out of which four (for 2002-04, 2008-10, 2014-16 and 2018-20) are presented in Figure 8 for selected areas of Ladakh and Himachal Pradesh where the changes were found to be more prominent. The results suggest that there is a significant and rather systematic decrease in permafrost area (combining both continuous and discontinuous) from 56% of the overall study area in 2002-04 to 55% in 2018-20. Interestingly, there is no significant change in the sporadic permafrost cover, which requires seasonal change in temperature rather than biennial average of near-surface temperature for detection of any spatiotemporal change. The maps of the overall study area showing the permafrost extent for different years are given in Supplementary Figures S8–S16. The comparison of the permafrost cover mapped using BMAT of 2002-04 (Supplementary Figure S8) and maximum of BMAT from 2002-04 and 2018-20 (Figure 5), shows that there is significant difference (3%) in discontinuous permafrost mapped.
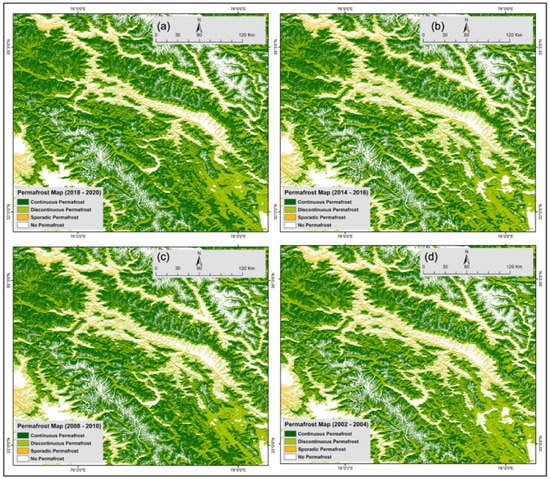
Figure 8.
Maps of the selected parts of Ladakh and Himachal Pradesh showing the permafrost extent for (a) 2002-04, (b) 2008-10, (c) 2014-16, and (d) 2018-20.
5. Discussion
Temperature is the most important climatic parameter due to its ability to represent the near-surface energy exchange and has longest record of instrumentation observation due to logistical simplicity [30]. It primarily controls the variation in occurrence and dynamics of all the components of cryosphere [118]. However, the in-situ temperature observations available in the Himalayan region are scarce and uneven due to extreme weather conditions and difficult terrain, which compels significant logistic and financial obligations for the installation and maintenance of weather stations [30]. The results of the land cover mapping suggest that a major portion of the study area (69%) is barren land without any surface cover, mostly due to the orographic shadow which restricts the precipitation influence in large part of the study area (Figure 2). The vegetation cover is ~20.47% of the total study area, mostly distributed on the southern slopes with higher precipitation. The data from RGI V6 suggest that ~10% of the total study area is covered by glaciers and water bodies that regulate the flow of water in the rivers. Due to the hostile climatic conditions, large part of the study area has fragmented human settlement and cover only ~0.55% of the total area. The variation in near surface temperature derived from remotely observed land surface temperature primarily controls the land use, especially the distribution of cryosphere, vegetation and human settlements, which is evident from the results given in Figure 3 and Figure 4. Therefore, near-surface air temperature derived from spatially continuous land surface temperature provides with an unparalleled option for modelling the different components of cryosphere in relation to different climatic and elevation zones [71].
We validated our results with field observations at two different sites located in different climatic and elevation zones and with different geomorphological proxies of permafrost presence mapped in the study area. The validation of the modelled results shows strong consistence with observed presence of permafrost and its geomorphological proxies. Around 96.5% of the total of 1392 rock glaciers mapped by three different studies carried out by independent research groups are mapped within the continuous or discontinuous permafrost zone modelled in the present study. Our results show that a large part of the study area (~61%) has permafrost presence with ~25% of the total study area with continuous permafrost presence and other ~31% with discontinuous and sporadic permafrost. The recent studies about change in temperature in Western Himalaya suggest a significant rise in temperature particularly in recent decades [30], which is manifested by the area covered by permafrost in the region. The results suggest that the area with the least probability of occurrence of any kind of permafrost increased from ~40% of the total study area in 2002-04 to ~43% in 2018-20. It is also interesting to note that the area covered by continuous permafrost shows more decline in comparison to the discontinuous permafrost. The Ladakh regions, Aksai Chin region, Kargil area, Gilgit-Baltistan and Pir-Panjal range showed presence of continuous permafrost areas. In general, the dominance of permafrost was strongly affected by temperature, as the areas with low temperatures (excluding glaciated areas) exhibited a prevalence of permafrost. Temperature is strongly influenced by other atmospheric (for example humidity) and surface topographical conditions, which further affect PISR, and therefore form another important factor controlling permafrost dominance. The higher reaches of the study area with a very cold and arid environment were found to be favourable locations for existence of permafrost. However, the humid ISM dominated region showed restricted permafrost cover (Figure 3 and Figure 5). The sporadic permafrost, which is classified as the areas with fluctuation of temperature above and below 0 °C, are dominant in the higher reaches of valleys in the study area.
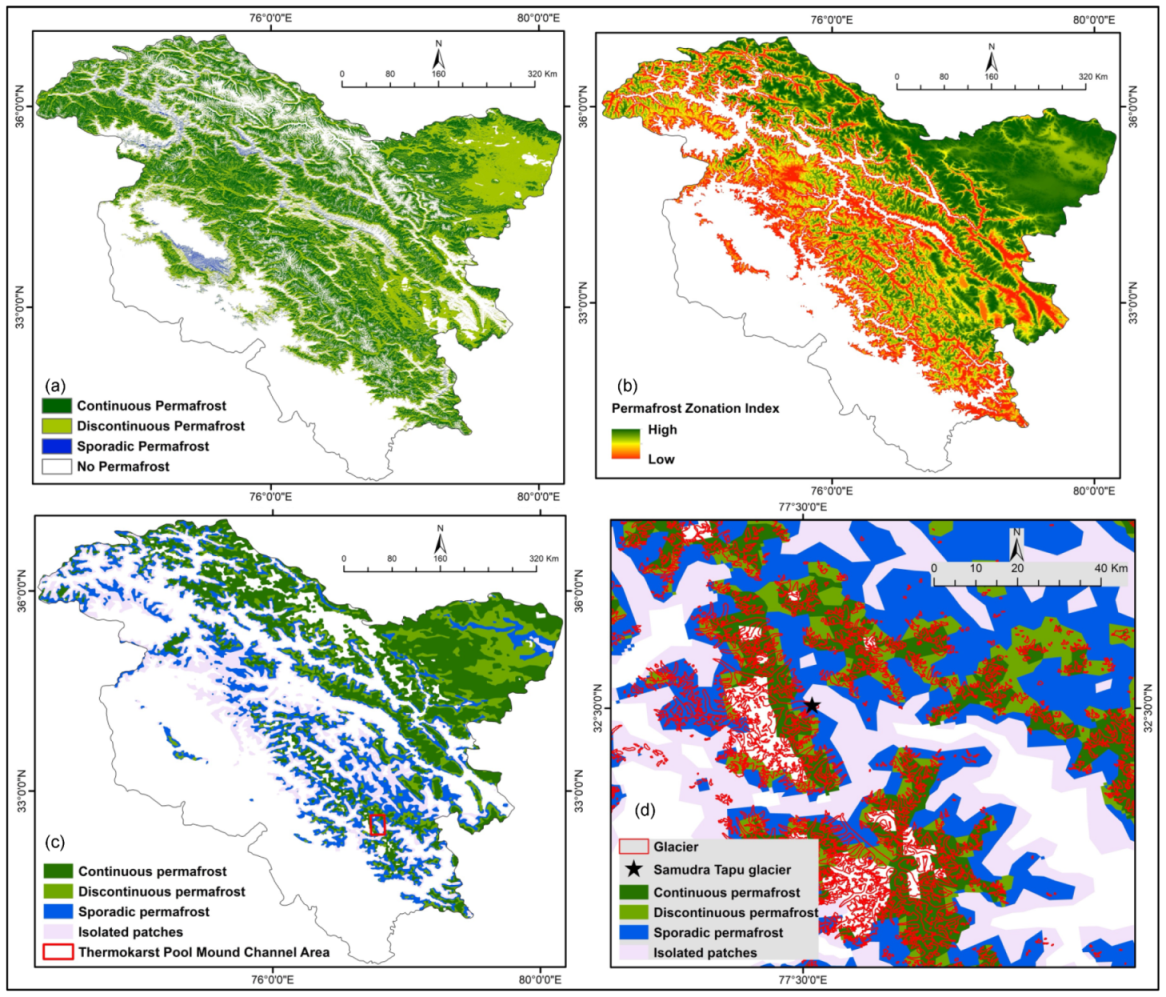
Apart from the point validation, we also compared our results to global and local scale studies of permafrost presence in the study area. The PZI map provided by Gruber [22] is a significant contribution towards permafrost mapping on a global scale (Figure 9). For comparing our result with PZI, we created an unclassified permafrost map of the study area and defined the values from high to low. The PZI is based on a model that was applied globally with a spatial resolution of ~1 km using high-resolution elevation data and air temperature obtained from NCAR-NCEP reanalysis and CRU TS 2.0. The value of PZI ranges from 0.01 to 1 and is an index representing a comprehensive spatial pattern of permafrost occurrence. However, PZI does not necessarily provide the actual permafrost extent or probability of permafrost [49]. The comparison of our results with that of the PZI map [22] shows that that both the maps are in strong agreement with each other. It also reveals the importance of topography in controlling the existence of permafrost along with temperatures. Also, our result shows the absence of permafrost in glaciated terrain and near water bodies, while in PZI, even glaciated regions and water bodies show a high value of the index. The present results can be taken as the topographically corrected, high-resolution version of map provided by Gruber [22]. As in the present study, remotely observed surface temperature has been used as an input instead of reanalysis datasets, which have been proven to have large uncertainties in high mountainous regions [71]. Another global permafrost map created by Obu et al. [57] provides extensive information about permafrost variability in the Northern Hemisphere using MODIS LST and ERA-Interim reanalysis temperature data as input (Figure 9c). One of the main limitations of the model used in this global study is the inability to account for permafrost variability in steep mountain slopes due to preclusion of crucial parameters like slope, aspect, and PISR, which is clearly visible in Figure 9d where we have represented the results of Obu et al. [57] in one of the areas where field work was done (as shown in Figure 8). Another interesting inference from the comparison with the present study is that, similar to Gruber [22] (Figure 9b), the permafrost presence is identified as continuous in glaciated regions (Figure 9d), which is acceptable if the glacial ice is considered as permafrost [119]. To have a quantitative perspective, we compared the results of Obu et al. [57] with the present study for the watershed catchment (2320 sq. km) of the Samudra Tapu glacier (show in Figure 9d) and thermoskarts pools and mounds (shown in Figure 8 and Figure 9c). The comparison shows that around 538 sq. km (23%) and 256 sq. km (11%) of the total catchment area is classified as continuous permafrost and discontinuous permafrost, respectively, by Obu et al. [57] while our results show that around 805 sq. km (35%) and 800 sq. km (35.5%) of the total catchment area is continuous and discontinuous permafrost, respectively. Out of the total area classified as continuous and discontinuous permafrost by Obu et al. [56], around 40% is covered by glaciers. In the present study, we have not considered glacier area as permafrost [119], as the response of permafrost and glaciers to the variation in temperature are different and must be considered separately for glacio-hydrological investigations (Figure 9). In addition, as stated explicitly in Obu et al. [57], their model does not account for permafrost variability in steep mountains, which is the predominant topography in this region, primarily due to inability of their model to include the slope and aspect. In addition, they also did not consider the potential incoming solar radiation in their model (PISR) which is another crucial factor responsible for permafrost variability in the region. In another local comparison (Kullu region of Himachal Pradesh) with the study carried out by Allen et al. [7], we find a significant consistency. Allen et al. [7] has discussed the importance of topography in influencing the permafrost occurrence in the monsoon dominated regions, which is also evident from the present study. Our results further show a good agreement with that of Wani et al. [54] for Ganglass catchment in Ladakh, Himalaya. The result of our model showed that most of the Ganglass catchment area falls under continuous permafrost zone, which has also been reported by Wani et al. [54] through field investigation.
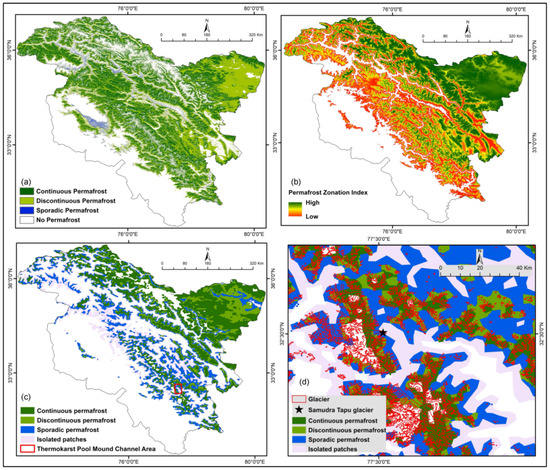
Figure 9.
Maps of the study area showing the (a) different types of permafrost area mapped in the present study, (b) PZI by Gruber [22], (c) permafrost area mapped by Obu et al. [57], and (d) the results of Obu et al. [57] for the area shown in Figure 8d.
There are two main limitations of the present study. The first is the use of soil water content or soil moisture data, which is due to the unavailability of an appropriate spatially continuous dataset. However, we have used the land use data mapped on 30 m resolution Landsat 8 images, which can harbor information about the soil constitution of the area [56]. In addition, the areas with a high probability of permafrost occurrence in the region are mostly located above 3000 m ASL, which is beyond the tree line elevation in most parts of the northwestern Himalaya [86]. The second limitation is the uncertainties associated with the resampling of the BMAT to 30 m resolution. The main objective of the resampling process was to bring all the datasets to the same resolution so that they could be utilized as an input in the AHP, and resampling one dataset to the resolution of all other datasets was an obvious choice. There are primarily three approaches used for resampling, which are closest neighbour, bilinear interpolation, and cubic convolution. The comparison of these three standard resampling methods revealed that the MAAT performs well with smooth resampling methods (e.g., Bilinear and Cubic), but the Nearest Neighbor method produces less acceptable results [101], and therefore the bilinear technique was used in the present study. The resampling in heterogenous conditions can be improved by the incorporation of further ground based meteorological observations, which are either missing or fragmented at large spatiotemporal scale in the region.
6. Conclusions
The present study is an attempt to map the permafrost occurrence in the seldom-studied Western Himalayan region using BMAT derived from spatially continuous LST using statistically robust relationship established for different precipitation zones of the region and integrating it with temperature controlling topographic variables such as solar radiation, slope, aspect, and ground cover. The results have been validated using the field validation and geomorphological proxies associated with the occurrence of permafrost. Also, other studies from the sub-catchments of the study area show consistency with our results. We have not considered glaciated regions, such as permafrost areas, as they need to be treated separately for glacio-hydrological investigations and they respond differently to the changing climate. Regardless of the uncertainties associated with use of different datasets of varying spatial resolution, the model shows good performance in terms of capturing the properties defining the permafrost presence when compared to field-observations and previously published local studies. The results show the anticipated extensive cover of permafrost (~59%) in the overall study area combining both continuous and discontinuous permafrost. The occurrence of permafrost is predominantly controlled by temperature variability directly and other ground variables like land cover, surface properties, and the potential incoming solar radiation indirectly. The temporal analysis of change in permafrost area suggests a systematic and significant decrease in the permafrost area in all categories as a reflection of the systematic increase in temperature, particularly in recent decades. The decrease in continuous permafrost cover is more in comparison to the discontinuous permafrost cover suggesting a systematic rise in the minimum temperature with time.
The unprecedented rise in the near surface temperature in the region with rate higher than global or regional average [30] has associated impacts on socioeconomic individualities of the region due to impacts on different components of the cryosphere, including an obvious impact on the distribution of permafrost [120]. Thus, a spatially continuous distribution of permafrost is required as an input for the glacio-hydrological models to estimate and understand the contribution of permafrost thawing in the hydrological regime of the region. The contribution of permafrost to the discharge in downstream areas has been completely missing in the region leading to uncertainties associated with application glacio-hydrological models in large catchments [121]. The present study will also help the local stakeholders in precipitation shadow areas with an understanding of the different components of cryosphere for site suitability studies for construction of artificial glaciers [122].
Supplementary Materials
The following are available online at https://www.mdpi.com/article/10.3390/rs13214403/s1, Figure S1: Maps of the study area showing the maximum of mean annual air temperature (MAAT) from 2002-04 to 2018-20 in °C, Figure S2: Maps of the study area showing the minimum of mean annual air temperature (MAAT) from 2002-04 to 2018-20 in °C, Figure S3: Maps of the study area showing the standard deviation in mean annual air temperature (MAAT) from 2002-04 to 2018-20 in °C, Figure S4: Map of the study area showing the distribution of continuous permafrost zone based on the maximum of BMAT from 2002-04 to 2018-20, Figure S5: Map of the study area showing the distribution of discontinuous permafrost zone based on the maximum of BMAT from 2002-04 to 2018-20, Figure S6: Map of the study area showing the distribution of sporadic permafrost zone based on the maximum of BMAT from 2002-04 to 2018-20, Figure S7: Bar chart showing the temporal extent of permafrost zones in the study area, Figure S8: Map of the study area showing the permafrost extent for 2002-04, Figure S9: Map of the study area showing the permafrost extent for 2004-06, Figure S10: Map of the study area showing the permafrost extent for 2006-08, Figure S11: Map of the study area showing the permafrost extent for 2008-10, Figure S12: Map of the study area showing the permafrost extent for 2010-12, Figure S13: Map of the study area showing the permafrost extent for 20012-14, Figure S14: Map of the study area showing the permafrost extent for 2014-16, Figure S15: Map of the study area showing the permafrost extent for 2016-18, Figure S16: Map of the study area showing the permafrost extent for 2018-20, Figure S17: Pie charts showing the temporal (2002-04 to 2018-20) variation in the distribution of permafrost extent in the study area.
Author Contributions
M.A.R.K., P.P., S.S., A.B. and S.N.A. conceived the study and developed the overall methodology. M.A.R.K., S.S. and P.P. conducted the analysis with support from V.C. in mapping. P.P. and S.N.A. carried out the fieldwork for ground validation. P.K.C.R. provided overall guidance during the processing and analysis. All authors have read and agreed to the published version of the manuscript.
Funding
This study did not receive any external funding.
Institutional Review Board Statement
Not applicable.
Informed Consent Statement
Not applicable.
Data Availability Statement
The data presented in this study are available in article and supplementary material.
Acknowledgments
M.A.R.K. and P.P. are thankful to the director Indian Institute of Remote Sensing, ISRO, Dehradun for help and support. S.S. and A.B. would like to acknowledge the University of Aberdeen Pump Prime grant to support their research in Ladakh, India. S.N.A. acknowledges the Director, Birbal Sahni Institute of Palaeosciences, Lucknow for encouragement and support.
Conflicts of Interest
The authors do not declare any conflict of interest.
References
- Permafrost Subcommittee. Glossary of Permafrost and Related Ground-Ice Terms; Associate Committee on Geotechnical Research, National Research Council of Canada: Ottawa, ON, Canada, 1988; p. 156. [Google Scholar]
- Zhang, T.; Heginbottom, J.A.; Barry, R.G.; Brown, J. Further statistics on the distribution of permafrost and ground ice in the Northern Hemisphere1. Polar Geogr. 2000, 24, 126–131. [Google Scholar] [CrossRef]
- Li, Y.; Conway, D.; Xiong, W.; Gao, Q.; Wu, Y.; Wan, Y.; Zhang, S. Effects of climate variability and change on Chinese agriculture: A review. Clim. Res. 2011, 50, 83–102. [Google Scholar] [CrossRef]
- Boike, J.; Juszak, I.; Lange, S.; Chadburn, S.; Burke, E.; Overduin, P.P.; Roth, K.; Ippisch, O.; Bornemann, N.; Stern, L.; et al. A 20-year record (1998–2017) of permafrost, active layer and meteorological conditions at a high Arctic permafrost research site (Bayelva, Spitsbergen). Earth Syst. Sci. Data 2018, 10, 355–390. [Google Scholar] [CrossRef]
- Cao, B.; Zhang, T.; Wu, Q.; Sheng, Y.; Zhao, L.; Zou, D. Permafrost zonation index map and statistics over the Qinghai-Tibet Plateau based on field evidence. Permafr. Periglac. Process. 2019, 30, 178–194. [Google Scholar] [CrossRef]
- Ali, S.N.; Quamar, M.F.; Phartiyal, B.; Sharma, A. Need for permafrost researches in Indian Himalaya. J. Clim. Chang. 2018, 4, 33–36. [Google Scholar] [CrossRef]
- Allen, S.K.; Fiddes, J.; Linsbauer, A.; Randhawa, S.S.; Saklani, B.; Salzmann, N. Permafrost Studies in Kullu District, Himachal Pradesh. Curr. Sci. 2016, 111, 550. [Google Scholar] [CrossRef]
- Bhardwaj, A.; Kumar, R.; Sam, L. Analysing geospatial techniques for land degradation studies in Hindu Kush-Himalaya. In Environmental Change in the Himalayan Region: Twelve Case Studies; Springer: Cham, Switzerland, 2019; pp. 117–135. [Google Scholar] [CrossRef]
- Pandey, P.; Chauhan, P.; Bhatt, C.M.; Thakur, P.K.; Kannaujia, S.; Dhote, P.R.; Roy, A.; Kumar, S.; Chopra, S.; Bhardwaj, A.; et al. Cause and process mechanism of rockslide triggered flood event in Rishiganga and Dhauliganga River Valleys, Chamoli, Uttarakhand, India using satellite remote sensing and in situ observations. J. Indian Soc. Remote. Sens. 2021, 49, 1011–1024. [Google Scholar] [CrossRef]
- Ekici, A.; Lee, H.; Lawrence, D.M.; Swenson, S.C.; Prigent, C. Ground subsidence effects on simulating dynamic high-latitude surface inundation under permafrost thaw using CLM5. Geosci. Model Dev. 2019, 12, 5291–5300. [Google Scholar] [CrossRef]
- Gruber, S. Ground subsidence and heave over permafrost: Hourly time series reveal interannual, seasonal and shorter-term movement caused by freezing, thawing and water movement. Cryosphere 2020, 14, 1437–1447. [Google Scholar] [CrossRef]
- Wu, X.; Zhao, L.; Liu, G.; Xu, H.; Zhang, X.; Ding, Y. Effects of permafrost thaw-subsidence on soil bacterial communities in the southern Qinghai-Tibetan Plateau. Appl. Soil Ecol. 2018, 128, 81–88. [Google Scholar] [CrossRef]
- Frampton, A.; Painter, S.; Destouni, G. Permafrost degradation and subsurface-flow changes caused by surface warming trends. Hydrogeol. J. 2012, 21, 271–280. [Google Scholar] [CrossRef]
- Karlsson, J.M.; Lyon, S.W.; Destouni, G. Thermokarst lake, hydrological flow and water balance indicators of permafrost change in Western Siberia. J. Hydrol. 2012, 464–465, 459–466. [Google Scholar] [CrossRef]
- Walvoord, M.A.; Kurylyk, B. Hydrologic Impacts of Thawing Permafrost-A Review. Vadose Zone J. 2016, 15, 1–20. [Google Scholar] [CrossRef]
- Liu, W.; Yu, W.; Hu, D.; Lu, Y.; Chen, L.; Yi, X.; Han, F. Crack damage investigation of paved highway embankment in the Tibetan Plateau permafrost environments. Cold Reg. Sci. Technol. 2019, 163, 78–86. [Google Scholar] [CrossRef]
- Nelson, F.E.; Anisimov, O.; Shiklomanov, N.I. Subsidence risk from thawing permafrost. Nature 2001, 410, 889–890. [Google Scholar] [CrossRef]
- Rowland, J.; Jones, C.; Altmann, G.; Bryan, R.; Crosby, B.T.; Hinzman, L.D.; Kane, D.L.; Lawrence, D.; Mancino, A.; Marsh, P.; et al. Arctic Landscapes in Transition: Responses to Thawing Permafrost. EOS 2010, 91, 229–230. [Google Scholar] [CrossRef]
- Biskaborn, B.K.; Smith, S.L.; Noetzli, J.; Matthes, H.; Vieira, G.; Streletskiy, D.A.; Schoeneich, P.; Romanovsky, V.E.; Lewkowicz, A.G.; Abramov, A.; et al. Permafrost is warming at a global scale. Nat. Commun. 2019, 10, 1–11. [Google Scholar] [CrossRef] [PubMed]
- Koven, C.D.; Ringeval, B.; Friedlingstein, P.; Ciais, P.; Cadule, P.; Khvorostyanov, D.; Krinner, G.; Tarnocai, C. Permafrost carbon-climate feedbacks accelerate global warming. Proc. Natl. Acad. Sci. USA 2011, 108, 14769–14774. [Google Scholar] [CrossRef] [PubMed]
- Schuur, E.A.G.; McGuire, A.D.; Schadel, C.; Grosse, G.; Harden, J.W.; Hayes, D.; Hugelius, G.; Koven, C.; Kuhry, P.; Lawrence, D.; et al. Climate change and the permafrost carbon feedback. Nature 2015, 520, 171–179. [Google Scholar] [CrossRef]
- Gruber, S. Derivation and analysis of a high-resolution estimate of global permafrost zonation. Cryosphere 2012, 6, 221–233. [Google Scholar] [CrossRef]
- IPCC. IPCC Fifth Assessment Synthesis Report-Climate Change 2014 Synthesis Report; IPCC: Geneva, Switzerland, 2014. [Google Scholar]
- Bolch, T.; Kulkarni, A.; Kääb, A.; Huggel, C.; Paul, F.; Cogley, J.G.; Frey, H.; Kargel, J.S.; Fujita, K.; Scheel, M.; et al. The State and Fate of Himalayan Glaciers. Science 2012, 336, 310–314. [Google Scholar] [CrossRef]
- Gardelle, J.; Berthier, E.; Arnaud, Y. Slight mass gain of Karakoram glaciers in the early twenty-first century. Nat. Geosci. 2012, 5, 322–325. [Google Scholar] [CrossRef]
- Gardner, A.S.; Moholdt, G.; Cogley, J.G.; Wouters, B.; Arendt, A.A.; Wahr, J.; Berthier, E.; Hock, R.; Pfeffer, W.T.; Kaser, G.; et al. A Reconciled Estimate of Glacier Contributions to Sea Level Rise: 2003 to 2009. Science 2013, 340, 852–857. [Google Scholar] [CrossRef]
- Kääb, A.; Berthier, E.; Nuth, C.; Gardelle, J.; Arnaud, Y. Contrasting patterns of early twenty-first-century glacier mass change in the Himalayas. Nature 2012, 488, 495–498. [Google Scholar] [CrossRef]
- Kapnick, S.; Delworth, T.; Ashfaq, M.; Malyshev, S.; Milly, P.C.D. Snowfall less sensitive to warming in Karakoram than in Himalayas due to a unique seasonal cycle. Nat. Geosci. 2014, 7, 834–840. [Google Scholar] [CrossRef]
- Scherler, D.; Bookhagen, B.; Strecker, M.R. Spatially variable response of Himalayan glaciers to climate change affected by debris cover. Nat. Geosci. 2011, 4, 156–159. [Google Scholar] [CrossRef]
- Singh, S.; Kumar, R.; Bhardwaj, A.; Sam, L.; Shekhar, M.; Singh, A.; Gupta, A. Changing climate and glacio-hydrology in Indian Himalayan Region: A review. Wiley Interdiscip. Rev. Clim. Chang. 2016, 7, 393–410. [Google Scholar] [CrossRef]
- Shekhar, M.; Bhardwaj, A.; Singh, S.; Ranhotra, P.S.; Bhattacharyya, A.; Pal, A.K.; Roy, I.; Martin-Torres, J.; Zorzano, M.-P. Himalayan glaciers experienced significant mass loss during later phases of little ice age. Sci. Rep. 2017, 7, 10305. [Google Scholar] [CrossRef] [PubMed]
- Yao, T.; Thompson, L.G.; Yang, W.; Yu, W.; Gao, Y.; Guo, X.; Yang, X.; Duan, K.; Zhao, H.; Xu, B.; et al. Different glacier status with atmospheric circulations in Tibetan Plateau and surroundings. Nat. Clim. Chang. 2012, 2, 663–667. [Google Scholar] [CrossRef]
- Sam, L.; Bhardwaj, A.; Singh, S.; Kumar, R. Remote sensing flow velocity of debris-covered glaciers using Landsat 8 data. Prog. Phys. Geogr. Earth Environ. 2015, 40, 305–321. [Google Scholar] [CrossRef]
- Sam, L.; Bhardwaj, A.; Kumar, R.; Buchroithner, M.F.; Martin-Torres, J. Heterogeneity in topographic control on velocities of Western Himalayan glaciers. Sci. Rep. 2018, 8, 1–16. [Google Scholar] [CrossRef]
- Bhambri, R.; Bolch, T.; Chaujar, R.K. Frontal recession of Gangotri Glacier, Garhwal Himalayas, from 1965 to 2006, measured through high-resolution remote sensing data. Curr. Sci. 2012, 102, 489–494. [Google Scholar] [CrossRef]
- Bhardwaj, A.; Joshi, P.K.; Snehmani; Singh, M.; Sam, L.; Gupta, R. Mapping debris-covered glaciers and identifying factors affecting the accuracy. Cold Reg. Sci. Technol. 2014, 106–107, 161–174. [Google Scholar] [CrossRef]
- Bhardwaj, A.; Joshi, P.; Snehmani; Sam, L.; Singh, M.; Singh, S.; Kumar, R. Applicability of Landsat 8 data for characterizing glacier facies and supraglacial debris. Int. J. Appl. Earth Obs. Geoinf. 2015, 38, 51–64. [Google Scholar] [CrossRef]
- Bhardwaj, A.; Sam, L.; Singh, S.; Kumar, R. Automated detection and temporal monitoring of crevasses using remote sensing and their implications for glacier dynamics. Ann. Glaciol. 2016, 57, 81–91. [Google Scholar] [CrossRef]
- Bhardwaj, A.; Singh, M.; Joshi, P.; Snehmani; Singh, S.; Sam, L.; Gupta, R.; Kumar, R. A lake detection algorithm (LDA) using Landsat 8 data: A comparative approach in glacial environment. Int. J. Appl. Earth Obs. Geoinf. 2015, 38, 150–163. [Google Scholar] [CrossRef]
- Pandey, P.; Ali, S.N.; Sharma, V.; Ray, P.K.C. Focus on Thermokarst Lakes in Indian Himalaya: Inception and Implication under Warming Climate. J. Clim. Chang. 2020, 6, 59–69. [Google Scholar] [CrossRef]
- Shukla, A.K.; Ojha, C.S.P.; Singh, R.P.; Pal, L.; Fu, D. Evaluation of TRMM Precipitation Dataset over Himalayan Catchment: The Upper Ganga Basin, India. Water 2019, 11, 613. [Google Scholar] [CrossRef]
- Kumar, R.; Kumar, R.; Singh, S.; Singh, A.; Bhardwaj, A.; Kumari, A.; Randhawa, S.S.; Saha, A. Dynamics of suspended sediment load with respect to summer discharge and temperatures in Shaune Garang glacierized catchment, Western Himalaya. Acta Geophys. 2018, 66, 1109–1120. [Google Scholar] [CrossRef]
- Ali, S.N.; Sharma, A.; Agrawal, S.; Yadava, M.G.; Jani, R.A.; Dubey, J.; Morthekai, P. Oxygen and deuterium isotope characteristics of Teesta river catchment from Sikkim Himalaya, India: Implications of different moisture sources. Geochem. J. 2020, 54, 327–336. [Google Scholar] [CrossRef]
- Kumar, R.; Singh, S.; Singh, A.; Bhardwaj, A.; Sam, L.; Randhawa, S.S.; Gupta, A. Development of a Glacio-hydrological Model for Discharge and Mass Balance Reconstruction. Water Resour. Manag. 2016, 30, 3475–3492. [Google Scholar] [CrossRef]
- Singh, S.; Kumar, R.; Bhardwaj, A.; Singh, A. Changing climate and glacio-hydrology: A case study of Shaune Garang basin, Himachal Pradesh. Int. J. Hydrol. Sci. Technol. 2018, 8, 258. [Google Scholar] [CrossRef]
- Gruber, S.; Fleiner, R.; Guegan, E.; Panday, P.; Schmid, M.-O.; Stumm, D.; Wester, P.; Zhang, Y.; Zhao, L. Review article: Inferring permafrost and permafrost thaw in the mountains of the Hindu Kush Himalaya region. Cryosphere 2017, 11, 81–99. [Google Scholar] [CrossRef]
- Cheng, G.; Wu, T. Responses of permafrost to climate change and their environmental significance, Qinghai-Tibet Plateau. J. Geophys. Res. Space Phys. 2007, 112, F02S03. [Google Scholar] [CrossRef]
- Zhang, M.; Lai, Y.; Liu, Z.; Gao, Z. Nonlinear analysis for the cooling effect of Qinghai-Tibetan railway embankment with different structures in permafrost regions. Cold Reg. Sci. Technol. 2005, 42, 237–249. [Google Scholar] [CrossRef]
- Schmid, M.-O.; Baral, P.; Gruber, S.; Shahi, S.; Shrestha, T.; Stumm, D.; Wester, P. Assessment of permafrost distribution maps in the Hindu Kush Himalayan region using rock glaciers mapped in Google Earth. Cryosphere 2015, 9, 2089–2099. [Google Scholar] [CrossRef]
- Jones, D.; Harrison, S.; Anderson, K.; Selley, H.; Wood, J.; Betts, R. The distribution and hydrological significance of rock glaciers in the Nepalese Himalaya. Glob. Planet. Chang. 2017, 160, 123–142. [Google Scholar] [CrossRef]
- Mayewski, P.A.; Jeschke, P.A.; Ahmad, N. An active rock glacier, Wavbal Pass, Jammu and Kashmir Himalaya, India. J. Glaciol. 1981, 27, 201–202. [Google Scholar] [CrossRef][Green Version]
- Owen, L.; England, J. Observations on rock glaciers in the Himalayas and Karakoram Mountains of northern Pakistan and India. Geomorphology 1998, 26, 199–213. [Google Scholar] [CrossRef]
- Thayyen, R.; Dimri, A. Modeling Slope Environmental Lapse Rate (SELR) of temperature in the monsoon glacio-hydrological regime of the Himalaya. Cryosph. Discuss. 2016, 1–35. [Google Scholar] [CrossRef]
- Wani, J.M.; Thayyen, R.J.; Gruber, S.; Ojha, C.S.P.; Stumm, D. Single-year thermal regime and inferred permafrost occurrence in the upper Ganglass catchment of the cold-arid Himalaya, Ladakh, India. Sci. Total. Environ. 2019, 703, 134631. [Google Scholar] [CrossRef] [PubMed]
- Brown, J.; Ferrians, O.J., Jr.; Heginbottom, J.A.; Melnikov, E.S. Circum-Arctic Map of Permafrost and Ground-Ice Conditions; US Geological Survey: Reston, VA, USA, 1997; p. 45.
- Cao, B.; Zhang, T.; Peng, X.; Mu, C.; Wang, Q.; Zheng, L.; Wang, K.; Zhong, X. Thermal Characteristics and Recent Changes of Permafrost in the Upper Reaches of the Heihe River Basin, Western China. J. Geophys. Res. Atmos. 2018, 123, 7935–7949. [Google Scholar] [CrossRef]
- Obu, J.; Westermann, S.; Bartsch, A.; Berdnikov, N.; Christiansen, H.H.; Dashtseren, A.; Delaloye, R.; Elberling, B.; Etzelmüller, B.; Kholodov, A.; et al. Northern Hemisphere permafrost map based on TTOP modelling for 2000–2016 at 1 km2 scale. Earth-Sci. Rev. 2019, 193, 299–316. [Google Scholar] [CrossRef]
- Shi, Y.; Niu, F.; Yang, C.; Che, T.; Lin, Z.; Luo, J. Permafrost Presence/Absence Mapping of the Qinghai-Tibet Plateau Based on Multi-Source Remote Sensing Data. Remote. Sens. 2018, 10, 309. [Google Scholar] [CrossRef]
- Bhutiyani, M.R.; Kale, V.S.; Pawar, N.J. Long-term trends in maximum, minimum and mean annual air temperatures across the Northwestern Himalaya during the twentieth century. Clim. Chang. 2007, 85, 159–177. [Google Scholar] [CrossRef]
- Negi, H.S.; Kanda, N.; Shekhar, M.S.; Ganju, A. Recent Wintertime Climatic Variability over the North West Himalayan Cryosphere. Curr. Sci. 2018, 114, 760–770. [Google Scholar] [CrossRef]
- Sabin, T.P.; Krishnan, R.; Vellore, R.; Priya, P.; Borgaonkar, H.P.; Singh, B.B.; Sagar, A. Climate Change Over the Himalayas; Springer: Singapore, 2020; pp. 207–222. [Google Scholar] [CrossRef]
- Shrestha, A.B.; Wake, C.P.; Mayewski, P.A.; Dibb, J.E. Maximum temperature trends in the Himalaya and its vicinity: An analysis based on temperature records from Nepal for the period 1971–1994. J. Clim. 1999, 12, 2775–2786. [Google Scholar] [CrossRef]
- Shugar, D.H.; Jacquemart, M.; Shean, D.; Bhushan, S.; Upadhyay, K.; Sattar, A.; Schwanghart, W.; McBride, S.; Vries, M.V.W.d.; Mergili, M.; et al. A massive rock and ice avalanche caused the 2021 disaster at Chamoli, Indian Himalaya. Science 2021, 373, 300–306. [Google Scholar] [CrossRef]
- Ali, S.N.; Juyal, N. Chronology of late quaternary glaciations in Indian Himalaya: A critical review. J. Geol. Soc. India 2013, 82, 628–638. [Google Scholar] [CrossRef]
- Benn, D.I.; Owen, L.A. The role of the Indian summer monsoon and the mid-latitude westerlies in Himalayan glaciation: Review and speculative discussion. J. Geol. Soc. 1998, 155, 353–363. [Google Scholar] [CrossRef]
- Dimri, A.P.; Niyogi, D.S.; Barros, A.; Ridley, J.K.; Mohanty, U.C.; Yasunari, T.J.; Sikka, D.R. Western Disturbances: A review. Rev. Geophys. 2015, 53, 225–246. [Google Scholar] [CrossRef]
- Ali, S.N.; Agrawal, S.; Sharma, A.; Phartiyal, B.; Morthekai, P.; Govil, P.; Bhushan, R.; Farooqui, S.; Jena, P.S.; Shivam, A. Holocene hydroclimatic variability in the Zanskar Valley, Northwestern Himalaya, India. Quat. Res. 2020, 97, 140–156. [Google Scholar] [CrossRef]
- Dahri, Z.H.; Moors, E.; Ludwig, F.; Ahmad, S.; Khan, A.; Ali, I.; Kabat, P. Adjustment of measurement errors to reconcile precipitation distribution in the high-altitude Indus basin. Int. J. Clim. 2018, 38, 3842–3860. [Google Scholar] [CrossRef]
- Dimri, A. Interannual variability of Indian winter monsoon over the Western Himalayas. Glob. Planet. Chang. 2013, 106, 39–50. [Google Scholar] [CrossRef]
- Midhuna, T.M.; Kumar, P.; Dimri, A.P. A new Western Disturbance Index for the Indian winter monsoon. J. Earth Syst. Sci. 2020, 129, 1–14. [Google Scholar] [CrossRef]
- Singh, S.; Bhardwaj, A.; Singh, A.; Sam, L.; Shekhar, M.; Martín-Torres, F.J.; Zorzano, M.-P. Quantifying the Congruence between Air and Land Surface Temperatures for Various Climatic and Elevation Zones of Western Himalaya. Remote. Sens. 2019, 11, 2889. [Google Scholar] [CrossRef]
- ICIMOD. Outline Boundary of Hindu Kush Himalayan (HKH) Region. 2008. Available online: https://rds.icimod.org/home/datadetail?metadataid=3924 (accessed on 25 October 2021).
- RGI Consortium. Randolph Glacier Inventory—A Dataset of Global Glacier Outlines: Version 6.0; Technical Report; Global Land Ice Measurements from Space: Boulder, CO, USA; Available online: https://doi.org/10.7265/N5-RGI-60 (accessed on 1 March 2020).
- DIVA-GIS. Download Data by Country DIVA-GIS. 2013. Available online: http://www.diva-gis.org (accessed on 6 March 2020).
- Hachem, S.; Allard, M.; Duguay, C. Using the MODIS land surface temperature product for mapping permafrost: An application to northern Québec and Labrador, Canada. Permafr. Periglac. Process. 2009, 20, 407–416. [Google Scholar] [CrossRef]
- GES DISC. TRMM (TMPA-RT) Near Real-Time Precipitation L3 1 day 0.25 degree × 0.25 degree V7, Edited by Andrey Savtchenko, Greenbelt, M.D. Goddard Earth Sciences Data and Information Services Center (GES DISC). Available online: https://doi.org/10.5067/TRMM/TMPA/DAY-E/7 (accessed on 5 November 2020).
- Bookhagen, B.; Burbank, D.W. Toward a complete Himalayan hydrological budget: Spatiotemporal distribution of snowmelt and rainfall and their impact on river discharge. J. Geophys. Res. Space Phys. 2010, 115, F03019. [Google Scholar] [CrossRef]
- King, L. Zonation and Ecology of High Mountain Permafrost in Scandinavia. Geogr. Ann. Ser. A Phys. Geogr. 1986, 68, 131. [Google Scholar] [CrossRef]
- Péwé, T.L.; Brown, R.J.E. Distribution of permafrost in North America and its relationship to the environment: A review, 1963–1973. In Proceedings of the Permafrost: Second International Conference, Yakutska, Russia, 13–28 July 1973. [Google Scholar]
- Smith, M.W.; Riseborough, D.W. Climate and the limits of permafrost: A zonal analysis. Permafr. Periglac. Process. 2002, 13, 1–15. [Google Scholar] [CrossRef]
- Zhang, T. Influence of the seasonal snow cover on the ground thermal regime: An overview. Rev. Geophys. 2005, 43. [Google Scholar] [CrossRef]
- USGS. Missions de Landsat, 2013. Landsat 8. 2020. Available online: https://doi.org//10.5066/F71835S6 (accessed on 1 February 2020).
- Arenson, L.U.; Jakob, M. A New GIS based Mountain Permafrost Distribution Model. In Proceedings of the GEO2010: 63rd Canadian Geotechnical Conference & 6th Canadian Permafrost Conference, Calgary, AB, Canada, 12–15 September 2010. [Google Scholar]
- Hoelzle, M. Permafrost occurrence from BTS measurements and climatic parameters in the eastern Swiss Alps. Permafr. Periglac. Process. 1992, 3, 143–147. [Google Scholar] [CrossRef]
- Kreslavsky, M.; Head, J.W.; Marchant, D.R. Periods of active permafrost layer formation during the geological history of Mars: Implications for circum-polar and mid-latitude surface processes. Planet. Space Sci. 2008, 56, 289–302. [Google Scholar] [CrossRef]
- Singh, S.P.; Sharma, S.; Dhyani, P.P. Himalayan arc and treeline: Distribution, climate change responses and ecosystem properties. Biodivers. Conserv. 2019, 28, 1997–2016. [Google Scholar] [CrossRef]
- Jensen, J.R. Remote Sensing of the Environment an Earth Resource Perspective, 2nd ed.; Prentice Hall: Upper Saddle River, NJ, USA, 2006. [Google Scholar]
- Muhuri, A.; Gascoin, S.; Menzel, L.; Kostadinov, T.S.; Harpold, A.A.; Sanmiguel-Vallelado, A.; Moreno, J.I.L. Performance Assessment of Optical Satellite-Based Operational Snow Cover Monitoring Algorithms in Forested Landscapes. IEEE J. Sel. Top. Appl. Earth Obs. Remote. Sens. 2021, 14, 7159–7178. [Google Scholar] [CrossRef]
- Cheng, G. Influences of local factors on permafrost occurrence and their implications for Qinghai-Xizang Railway design. Sci. China Ser. D Earth Sci. 2004, 47, 704–709. [Google Scholar] [CrossRef]
- Etzelmüller, B.; Frauenfelder, R. Factors Controlling the Distribution of Mountain Permafrost in The Northern Hemisphere and Their Influence on Sediment Transfer. Arct. Antarct. Alp. Res. 2009, 41, 48–58. [Google Scholar] [CrossRef]
- Gorbunov, A.P. Permafrost Investigations in High-Mountain Regions. Arct. Alp. Res. 1978, 10, 283. [Google Scholar] [CrossRef]
- Azócar, G.F.; Brenning, A.; Bodin, X. Permafrost distribution modelling in the semi-arid Chilean Andes. Cryosphere 2017, 11, 877–890. [Google Scholar] [CrossRef]
- Brenning, A.; Azócar, G.F. Statistical analysis of topographic and climatic controls and multispectral signatures of rock glaciers in the dry Andes, Chile (27°–33°S). Permafr. Periglac. Process. 2009, 21, 54–66. [Google Scholar] [CrossRef]
- Wang, X.; Wang, Z.; Deng, X.; Sun, B.; Zhao, Y.; Fu, W. Coupled thermal model of wellbore and permafrost in Arctic regions. Appl. Therm. Eng. 2017, 123, 1291–1299. [Google Scholar] [CrossRef]
- Weiming, C.; Shangmin, Z.; Chenghu, Z.; Xi, C. Simulation of the Decadal Permafrost Distribution on the Qinghai-Tibet Plateau (China) over the Past 50 Years. Permafr. Periglac. Process. 2012, 23, 292–300. [Google Scholar] [CrossRef]
- Baral, P.; Haq, M.A.; Yaragal, S. Assessment of rock glaciers and permafrost distribution in Uttarakhand, India. Permafr. Periglac. Process. 2019, 31, 31–56. [Google Scholar] [CrossRef]
- Sattler, K.; Anderson, B.; Mackintosh, A.; Norton, K.; De Róiste, M. Estimating Permafrost Distribution in the Maritime Southern Alps, New Zealand, Based on Climatic Conditions at Rock Glacier Sites. Front. Earth Sci. 2016, 4. [Google Scholar] [CrossRef]
- ArcMap. Area Solar Radiation. The User Document of ArcGIS Tools Available on ESRI Website. 2021. Available online: https://desktop.arcgis.com/en/arcmap/10.3/tools/spatial-analyst-toolbox/area-solar-radiation.htm (accessed on 8 July 2021).
- Panda, S.K.; Prakash, A.; Solie, D.N.; Romanovsky, V.E.; Jorgenson, M.T. Remote sensing and field-based mapping of permafrost distribution along the Alaska Highway corridor, interior Alaska. Permafr. Periglac. Process. 2010, 21, 271–281. [Google Scholar] [CrossRef]
- Sattler, K.; Keiler, M.; Zischg, A.; Schrott, L. On the Connection between Debris Flow Activity and Permafrost Degradation: A Case Study from the Schnalstal, South Tyrolean Alps, Italy. Permafr. Periglac. Process. 2011, 22, 254–265. [Google Scholar] [CrossRef]
- Liu, H.; Weng, Q. Scaling Effect of Fused ASTER-MODIS Land Surface Temperature in an Urban Environment. Sensors 2018, 18, 4058. [Google Scholar] [CrossRef]
- Saaty, T.L. The Analytic Hierarchy Process: Planning, Priority Setting, Resource Allocation; MacGraw-Hill: New York, NY, USA, 1980. [Google Scholar]
- Kayastha, P.; Dhital, M.; De Smedt, F. Application of the analytical hierarchy process (AHP) for landslide susceptibility mapping: A case study from the Tinau watershed, west Nepal. Comput. Geosci. 2013, 52, 398–408. [Google Scholar] [CrossRef]
- Kumar, R.; Anbalagan, R. Landslide susceptibility mapping using analytical hierarchy process (AHP) in Tehri reservoir rim region, Uttarakhand. J. Geol. Soc. India 2016, 87, 271–286. [Google Scholar] [CrossRef]
- Malczewski, J. Visualization in multicriteria spatial decision support systems. Geomatica 1999, 53, 139–147. [Google Scholar] [CrossRef]
- Yalcin, A. GIS-based landslide susceptibility mapping using analytical hierarchy process and bivariate statistics in Ardesen (Turkey): Comparisons of results and confirmations. CATENA 2008, 72, 1–12. [Google Scholar] [CrossRef]
- Saaty, T.L. Decision making with the analytic hierarchy process. Int. J. Serv. Sci. 2008, 1, 83. [Google Scholar] [CrossRef]
- Saaty, T.L. A scaling method for priorities in hierarchical structures. J. Math. Psychol. 1977, 15, 234–281. [Google Scholar] [CrossRef]
- Imhof, M. Modelling and verification of the permafrost distribution in the Bernese Alps (western Switzerland). Permafr. Periglac. Process. 1996, 7, 267–280. [Google Scholar] [CrossRef]
- Pandey, P. Inventory of rock glaciers in Himachal Himalaya, India using high-resolution Google Earth imagery. Geomorphology 2019, 340, 103–115. [Google Scholar] [CrossRef]
- Fort, M. Permafrost in the Himalayas: Specific characteristics, evolution vs. climate change and impacts on potential natural hazards. In EGU General Assembly Conference Abstracts; EGU: Munich, Germany, 2015; p. 4733. [Google Scholar]
- Hassan, J.; Chen, X.; Muhammad, S.; Bazai, N.A. Rock glacier inventory, permafrost probability distribution modeling and associated hazards in the Hunza River Basin, Western Karakoram, Pakistan. Sci. Total Environ. 2021, 782, 146833. [Google Scholar] [CrossRef] [PubMed]
- Olson, M.; Rupper, S. Impacts of topographic shading on direct solar radiation for valley glaciers in complex topography. Cryosphere 2019, 13, 29–40. [Google Scholar] [CrossRef]
- Rowley, T.; Giardino, J.R.; Granados-Aguilar, R.; Vitek, J.D. Periglacial Processes and Landforms in the Critical Zone; Elsevier: Amsterdam, The Netherlands, 2015; pp. 397–447. [Google Scholar] [CrossRef]
- Arp, C.D.; Whitman, M.S.; Jones, B.M.; Grosse, G.; Gaglioti, B.V.; Heim, K.C. Distribution and biophysical processes of beaded streams in Arctic permafrost landscapes. Biogeosciences 2015, 12, 29–47. [Google Scholar] [CrossRef]
- Davis, N. Permafrost: A Guide to Frozen Ground in Transition; University of Alaska Press: Fairbanks, AK, USA, 2001. [Google Scholar] [CrossRef]
- Oswood, M.W.; Everett, K.R.; Schell, D.M. Some physical and chemical characteristics of an arctic beaded stream. Ecography 1989, 12, 290–295. [Google Scholar] [CrossRef]
- Ohmura, A. Physical Basis for the Temperature-Based Melt-Index Method. J. Appl. Meteorol. 2001, 40, 753–761. [Google Scholar] [CrossRef]
- Dąbski, M. Should Glaciers Be Considered Permafrost? Geosciences 2019, 9, 517. [Google Scholar] [CrossRef]
- Nüsser, M.; Dame, J.; Kraus, B.; Baghel, R.; Schmidt, S. Socio-hydrology of “artificial glaciers” in Ladakh, India: Assessing adaptive strategies in a changing cryosphere. Reg. Environ. Chang. 2018, 19, 1327–1337. [Google Scholar] [CrossRef]
- Singh, S.; Bhardwaj, A.; Kumar, R. Implications of ignoring permafrost in glacio-hydrological models in high mountains. In Proceedings of the XI International Conference on Permafrost, Potsdam, Germany, 20–24 June 2016. [Google Scholar] [CrossRef]
- Norphel, C.; Tashi, P. Mountain Hazards and Disaster Risk Reduction, Snow Water Harvesting in the Cold Desert in Ladakh: An Introduction to Artificial Glacier. In Mountain Hazards and Disaster Risk Reduction. Disaster Risk Reduction (Methods, Approaches and Practices); Nibanupudi, H., Shaw, R., Eds.; Springer: Tokyo, Japan, 2015. [Google Scholar] [CrossRef]
Publisher’s Note: MDPI stays neutral with regard to jurisdictional claims in published maps and institutional affiliations. |
© 2021 by the authors. Licensee MDPI, Basel, Switzerland. This article is an open access article distributed under the terms and conditions of the Creative Commons Attribution (CC BY) license (https://creativecommons.org/licenses/by/4.0/).

