
Remote Sensing of the Polar Ice Zones with HF Radar


Abstract

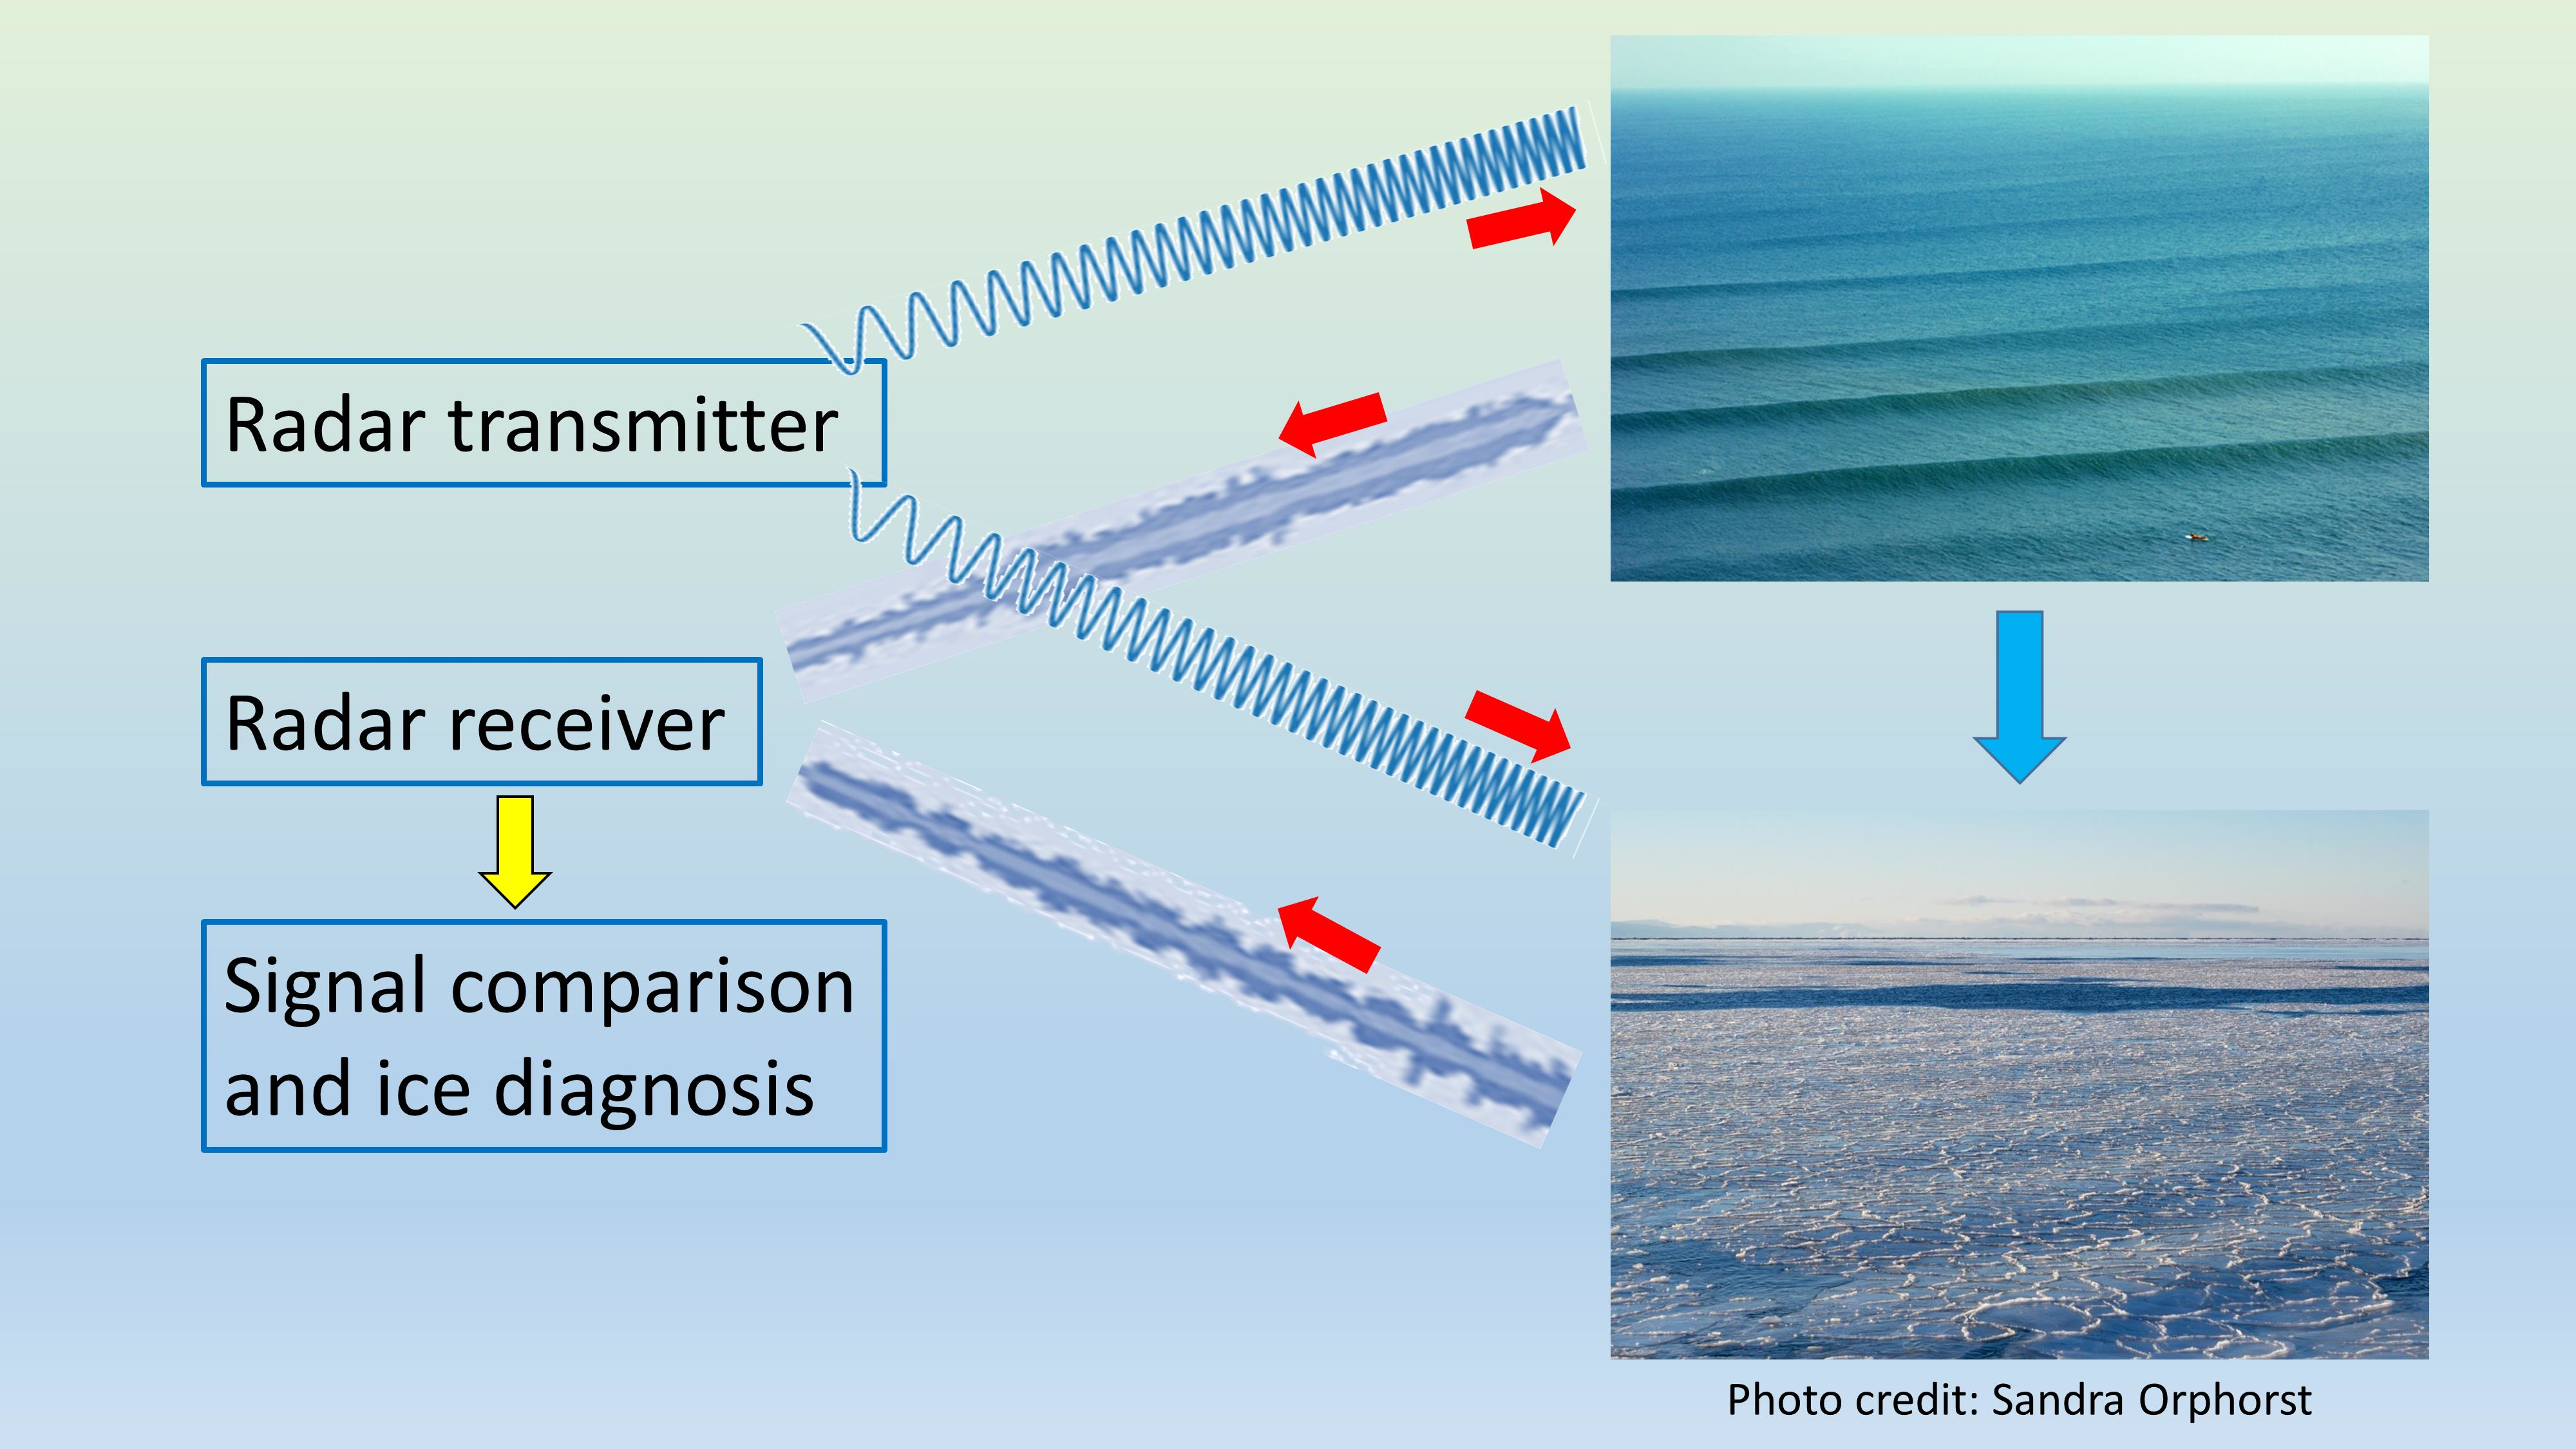
1. Introduction
2. Space-Borne Ice Sensors and Their Observables
3. HF Radar and Its Observables
3.1. Propagation Modes and System Characteristics
- Skywave–reflection from the Earth’s ionosphere, at heights between 60 and 400 km;
- Surface wave–diffraction around the curved Earth’s surface. At long ranges this takes the form of a localized electromagnetic wave seemingly attached to the surface, accompanied by electrical currents driven in the conducting seawater.
3.2. Radio Wave Scattering from the Ocean Surface
3.2.1. First-Order Theory
3.2.2. Second-Order Theory
3.3. Remote Sensing of the Ocean Surface with HF Radar
3.3.1. Free Ocean Surface
3.3.2. Extension to Ice-Covered Surfaces
3.4. Previous Studies and Deployments of HF Radars in the Ice Zone
4. Sea Ice: Forms and Properties
4.1. Formation and Evolution of Sea Ice
4.2. Properties of Sea Ice
4.2.1. Electrical Properties
4.2.2. Mechanical and Structural Properties
- The mass loading model;
- The thin elastic plate model;
- The viscous layer models;
- The viscoelastic layer models;
- The discrete floe models.
4.3. Dispersion Relations for Ice-Coupled Waves
4.3.1. Mass Loading Model
4.3.2. Thin Elastic Plate Model
4.3.3. Viscous Layer Model
4.3.4. Mass Loading Model with Viscosity
4.3.5. Viscoelastic Models
4.3.6. Discrete Floe Models
4.4. Model Validation and Calibration
5. HF Radar Signatures of Ice-Coupled Waves
5.1. Computation of Radar Signatures
5.2. Discrimination between Ice Species
5.3. Sensitivity to Parameter Values
6. Synoptic-Scale Structure of Ice-Coupled Wave Fields
6.1. The Action Balance Equation
- (i)
- (ii)
- (iii)
6.2. HF Radar Estimation of the Source Terms
6.3. Ice Field Boundaries
6.4. HF Radar Signatures of Ice Boundary Reflectance
7. Radar Performance and Operational Limitations
7.1. Limitations Arising from the Ionosphere
7.2. Limitations Related to the Resolving Power of HF Radar
7.3. Limitations Imposed by the Poor Spatial Resolution of HF Radar
7.4. Attenuation of HF Surface Waves Propagating over Ice
7.5. Limitations Imposed by Multiple Scattering of HFSWR Signals
7.6. Limitations Associated with the Radar Operating Frequency Band
8. Opportunities with Present-Day Radars
8.1. SuperDARN
8.2. Military Skywave Radars
8.3. Civilian HFSWR
8.4. Military HFSWR
9. Conclusions
- The persistent mapping of the ice edge on a synoptic scale with a resolution of order 10 km and a resampling interval of order tens of minutes is eminently achievable with HF skywave radar;
- HFSWR can achieve even finer spatial resolution but at reduced ranges, out to hundreds of kilometers instead of thousands;
- Unlike space-borne SAR, which relies on a snapshot of ice waves to estimate the dispersion, HF radar measures both spatial dimension AND phase speed of the waves, yielding far higher discrimination. Moreover, HF radar can achieve its analysis even in a confused sea when many waves are superimposed, where SAR might fail to identify a candidate wave for measurement;
- The dispersion relations of different types of ice support a crude classification capability using the first-order radar echoes from a radar cell under test, though not necessarily for all ice species. This result opens the door to many low-cost radars interested in participating in the ice monitoring mission, noting that radar design impacts on the retrieval;
- For a given ice species, a similar approach can yield estimates of dominant parameters, though not necessarily for all ice species;
- When the second-order Doppler spectra are included in the echo analysis, much greater discrimination between ice species and between parameter values ensues, but the form of the directional wave spectrum deep within the ice field has a strong bearing on this;
- The evolution of the ice-coupled wave spectrum as it penetrates deeper into the ice field enables the radar to take advantage of the frequency dependence of the attenuation due to viscosity, thereby enhancing ice classification, and also contributing to our understanding of the source terms in the action balance equation;
- Additional radar signatures of the ice characteristics may be found in front of the ice field, as a result of waves reflecting from the ice edge;
- Nature has decreed that the waves of greatest relevance deep within the ice field respond preferentially to low radar frequencies. This may limit the ability of some HF radars to make meaningful measurements;
- For HFSWR systems, the attenuation of the radar signal as it propagates across the ice field will be rapid once a threshold distance is passed; this distance may be just a few tens of kilometers at upper HF frequencies but can be many hundreds of kilometers at the low end of the band;
- HF skywave radars avoid this and some other problems but must deal with the high latitude ionosphere with its many irregularities and turbulent motions that can degrade signal purity and hence obscure the features needed for ice echo analysis. The efficacy of advanced signal processing techniques that work exceptionally well at lower latitudes has yet to be established;
- The morphology of multi-year ice is complex and its dynamics unlikely to follow the predictions of a simple model, but a radar signature will nevertheless appear. However, practical concern focuses on rapidly evolving first-year ice fields.
Funding
Data Availability Statement
Acknowledgments
Conflicts of Interest
References
- Peng, G.; Matthews, J.L.; Wang, M.; Vose, R.; Sun, L. What Do Global Climate Models Tell Us about Future Arctic Sea Ice Coverage Changes? Climate 2020, 8, 15. [Google Scholar] [CrossRef]
- Pidcock, R. Why Aren’t Climate Models Better Art Predicting Arctic Sea Ice Loss? Carbon Brief—Sea Ice. 2014. Available online: https://www.carbonbrief.org/why-arent-climate-models-better-at-predicting-arctic-sea-ice-loss (accessed on 17 December 2014).
- National Snow & Ice and Snow Data Center. Available online: http://nsidc.org/arcticseaicenews/ (accessed on 19 March 2021).
- Scarlat, R.C.; Spreen, G.; Heygster, G.; Huntemann, M.; Patilea, C.; Pedersen, L.T.; Salso, R. Sea Ice and Atmospheric Parameter Retrieval From Satellite Microwave Radiometers: Synergy of AMSR2 and SMOS Compared with the CIMR Candidate Mission. J. Geophys. Res. Ocean. 2019, 125, e2019JC015749. [Google Scholar] [CrossRef]
- Mäkynen, M.; Haapala, J.; Aulicino, G.; Balan-Sarojini, B.; Balmaseda, M.; Gegiuc, A.; Girard-Ardhuin, F.; Hendricks, S.; Heygster, G.; Istomina, L.; et al. Satellite Observations for Detecting and Forecasting Sea-Ice Conditions: A Summary of Advances Made in the SPICES Project by the EU’s Horizon 2020 Programme. Remote Sens. 2020, 12, 1214. [Google Scholar] [CrossRef]
- Sentinel-3. Available online: https://www.esa.int/Applications/Observing_the_Earth/Copernicus/Sentinel-3 (accessed on 20 March 2021).
- Ricker, R.; Hendricks, S.; Beckers, J.F. The Impact of Geophysical Corrections on Sea-Ice Freeboard Retrieved from Satellite Altimetry. Remote Sens. 2016, 8, 317. [Google Scholar] [CrossRef]
- Tilling, R.L.; Ridout, A.; Shepherd, A. Estimating Arctic sea ice thickness and volume using CryoSat-2 radar altimeter data. Adv. Space Res. 2018, 62, 1203–1225. [Google Scholar] [CrossRef]
- Horvat, C.; Blanchard-Wrigglesworth, E.; Petty, A. Observing Waves in Sea Ice with ICESat-2. Geophys. Res. Lett. 2020, 47, e2020GL087629. [Google Scholar] [CrossRef]
- Long, D.G. Polar Applications of Spaceborne Scatterometers. IEEE J. Sel. Top. Appl. Earth Obs. Remote Sens. 2017, 10, 2307–2320. [Google Scholar] [CrossRef]
- Zakhvatkina, N.; Smirnov, V.; Bychkova, I. Satellite SAR Data-based Sea Ice Classification: An Overview. Geosciences 2019, 9, 152. [Google Scholar] [CrossRef]
- Johansson, A.M.; Brekke, C.; Spreen, G.; King, J.A. X-, C-, and L-band SAR signatures of newly formed sea ice in Arctic leads during winter and spring. Remote Sens. Environ. 2018, 204, 162–180. [Google Scholar] [CrossRef]
- Wadhams, P.; Holt, B. Waves in frazil and pancake ice and their detection in Seasat synthetic aperture radar imagery. J. Geophys. Res. Space Phys. 1991, 96, 8835–8852. [Google Scholar] [CrossRef]
- Gebhardt, C.; Bidlot, J.-R.; Gemmrich, J.; Lehner, S.; Pleskachevsky, A.; Rosenthal, W. Wave observations in the marginal ice zone with the TerraSAR-X satellite. Ocean Dyn. 2016, 66, 839–852. [Google Scholar] [CrossRef]
- Ardhuin, F.; Stopa, J.; Chapron, B.; Collard, F.; Smith, M.; Thomson, J.; Doble, M.J.; Blomquist, B.; Persson, O.; Collins, C.O.; et al. Measuring ocean waves in sea ice using SAR imagery: A quasi-deterministic approach evaluated with Sentinel-1 and in situ data. Remote Sens. Environ. 2017, 189, 211–222. [Google Scholar] [CrossRef]
- Ardhuin, F.; Collard, F.; Chapron, B.; Girard-Ardhuin, F.; Guitton, G.; Mouche, A.; Stopa, J.E. Estimates of ocean wave heights and attenuation in sea ice using the SAR wave mode on Sentinel-1A. Geophys. Res. Lett. 2015, 42, 2317–2325. [Google Scholar] [CrossRef]
- Ardhuin, F.; Boutin, G.; Stopa, J.; Girad-Adhuin, F.; Melsheimer, C.; Thomson, J.; Kohout, A.; Doble, M.; Wadhams, P. Wave attenuation through an Arctic Marginal Ice Zone on October 12, 2015. Part 2: Numerical modelling of waves and associated ice breakup. J. Geophys. Res. Ocean. 2018, 123, 5652–5668. [Google Scholar] [CrossRef]
- De Santi, F.; De Carolis, G.; Olla, P.; Doble, M.; Cheng, S.; Shen, H.H.; Wadhams, P.; Thomson, J. On the Ocean Wave Attenuation Rate in Grease-Pancake Ice, a Comparison of Viscous Layer Propagation Models With Field Data. J. Geophys. Res. Ocean. 2018, 123, 5933–5948. [Google Scholar] [CrossRef]
- Monteban, D.; Johnsen, H.; Lubbad, R. Spatiotemporal Observations of Wave Dispersion within Sea Ice Using Sentinel-1 SAR TOPS Mode. J. Geophys. Res. Ocean. 2019, 124, 8522–8537. [Google Scholar] [CrossRef]
- Aulicino, G.; Wadhams, P.; Parmiggiani, F. SAR Pancake Ice Thickness Retrieval in the Terra Nova Bay (Antarctica) during the PIPERS Expedition in Winter 2017. Remote Sens. 2019, 11, 2510. [Google Scholar] [CrossRef]
- Cheng, S.; Stopa, J.; Ardhuin, F.; Shen, H.H. Spectral attenuation of ocean waves in pack ice and its application in calibrating viscoelastic wave-in-ice models. Cryosphere 2020, 14, 2053–2069. [Google Scholar] [CrossRef]
- De Carolis, G.; Olla, P.; De Santi, F. SAR image wave spectra to retrieve the thickness of grease-pancake sea ice using viscous wave propagation models. Sci. Rep. 2021, 11, 2733. [Google Scholar] [CrossRef] [PubMed]
- Wilson, M. Satellite altimetry quantifies the alarming thinning of Arctic sea ice. Phys. Today 2009, 62, 19–21. [Google Scholar] [CrossRef]
- Headrick, J.M.; Anderson, S.J. HF Over-the-Horizon Radar. In Radar Handbook, 3rd ed.; Skolnik, M., Ed.; McGraw-Hill: New York, NY, USA, 2008; Chapter 20. [Google Scholar]
- CODAR Ocean Sensors. Available online: http://www.codar.com/SeaSonde.shtml (accessed on 25 October 2021).
- WERA Ocean Radar. Available online: https://helzel.com/product-detail-wera/ (accessed on 25 October 2021).
- Rice, S.O. Reflection of EM waves from slightly rough surfaces. Commun. Pure Appl. Math. 1951, 4, 351–378. [Google Scholar] [CrossRef]
- Barrick, D.E.; Peake, W.H. A Review of Scattering from Surfaces with Different Roughness Scales. Radio Sci. 1968, 3, 865–868. [Google Scholar] [CrossRef]
- Weber, B.L.; Barrick, D.E. On the nonlinear theory for gravity waves on the ocean’s surface. Part I: Derivations. Journal of Physical. Oceanography 1977, 7, 3–10. [Google Scholar]
- Barrick, D.E.; Weber, B.L. On the nonlinear theory for gravity waves on the ocean’s surface. Part II: Interpretation and applications. J. Phys. Oceanogr. 1977, 7, 11–21. [Google Scholar] [CrossRef]
- Barrick, D.E. Remote sensing of sea state by radar. In Remote Sensing of the Troposphere; Derr, V.E., Ed.; NOAA/Environmental Research Laboratories: Boulder, CO, USA, 1972; pp. 12.1–12.6. [Google Scholar]
- Anderson, S.J.; Anderson, W.C. Bistatic scattering from the ocean surface and its application to remote sensing of seastate. In Proceedings of the IEEE APS International Symposium, University of Virginia, Blacksburg, VA, USA, 15–19 June 1987. [Google Scholar]
- Gill, E.W.; Huang, W.; Walsh, J. On the Development of a Second-Order Bistatic Radar Cross Section of the Ocean Surface: A High-Frequency Result for a Finite Scattering Patch. IEEE J. Ocean. Eng. 2006, 31, 740–750. [Google Scholar] [CrossRef]
- Barrick, D.E.; Lipa, B.J. The second-order shallow-water hydrodynamic coupling coefficient in interpretation of HF radar sea echo. IEEE J. Ocean. Eng. 1986, 11, 310–315. [Google Scholar] [CrossRef]
- Anderson, S.J. The Extraction of Wind and Sea State Parameters from HF Skywave Radar Echoes; IREECON-83; IREECON International Digest: Sydney, Australia, 1983; pp. 654–656. [Google Scholar]
- Vaughan, G.L.; Squire, V.A. The scattering and damping of ice-coupled waves. Int. J. Offshore Polar Eng. 2008, 18, 263–270. [Google Scholar]
- Zhang, S.; Xuan, Y.; Li, J.; Geng, T.; Li, X.; Xiao, F. Arctic Sea Ice Freeboard Retrieval from Envisat Altimetry Data. Remote Sens. 2021, 13, 1414. [Google Scholar] [CrossRef]
- Kwok, R.; Markus, T.; Kurtz, N.T.; Petty, A.A.; Neumann, T.A.; Farrell, S.L.; Cunningham, G.F.; Hancock, D.W.; Ivanoff, A.; Wimert, J.T. Surface Height and Sea Ice Freeboard of the Arctic Ocean From ICESat-2: Characteristics and Early Results. J. Geophys. Res. Ocean. 2019, 124, 6942–6959. [Google Scholar] [CrossRef]
- Kohout, A.L.; Williams, M.J.M.; Dean, S.M.; Meylan, M.H. Storm-induced sea-ice breakup and the implications for ice extent. Nature 2014, 509, 604–607. [Google Scholar] [CrossRef]
- Campbell, L.W.; Katz, A.H.; Patton, D.E. Polar Fox II—Experimental Phase; Technical Report RADC-TR-72-21; Rome Air Development Center: Rome, NY, USA, 1971. [Google Scholar]
- Ring, W.F.; Sales, G.S. Measurement of Sea and Ice Backscatter Reflectivity Using an OTH Radar System; Technical Report RADC-TR-82-63; Rome Air Development Center: Rome, NY, USA, 1982. [Google Scholar]
- Srivastava, S.K.; Walsh, J. Over-the-Horizon Radar; Haykin, S., Lewis, E.O., Raney, R.K., Rossiter, J.R., Eds.; John Wiley: Hoboken, NJ, USA, 1994. [Google Scholar]
- Walsh, J.; Dawe, B.; Srivastava, S. Remote sensing of icebergs by ground-wave Doppler radar. IEEE J. Ocean. Eng. 1986, 11, 276–284. [Google Scholar] [CrossRef]
- Lipa, B.; Crissman, R.; Barrick, D. HF radar observations of Arctic pack-ice breakup. IEEE J. Ocean. Eng. 1986, 11, 270–275. [Google Scholar] [CrossRef]
- Statscewich, H.; Roarty, H.; Smith, M.; Page, E.; Glenn, S.; Weingartner, T. Enhancing Arctic Maritime Domain Awareness through an Off-Grid Multi-sensor Instrument Platform. Mar. Technol. Soc. J. 2014, 48, 97–109. [Google Scholar] [CrossRef]
- Roarty, H.J.; Smith, M.; Glenn, S.M.; Whelan, C.; Barrick, D.E.; Statscewich, H.; Weingartner, T. Multi-use HF radar for arctic maritime domain awareness. In Proceedings of the 2013 MTS/IEEE Oceans, Bergen, Norway, 10–14 June 2013. [Google Scholar] [CrossRef]
- Panteleev, G.; Yaremchuk, M.; Francis, O.; Kikuchi, T. Configuring high frequency radar observations in the Southen Chukchi Sea. Polar Sci. 2013, 7, 72–81. [Google Scholar] [CrossRef]
- Panteleev, G.; Yaremchuk, M.; Stroh, J.; Posey, P.; Hebert, D.; Nechaev, D.A. Optimization of the High-Frequency Radar Sites in the Bering Strait Region. J. Atmos. Ocean. Technol. 2015, 32, 297–309. [Google Scholar] [CrossRef]
- Weingartner, T.J.; Pickart, R.; Winsor, P. Characterization of the Circulation on the Continental Shelf Areas of the Northeastern Chukchi and Western Beaufort Seas; Report BOEM-2017-065; Bureau of Ocean Energy Management, US Department of Interior: Washington, DC, USA, 2017; Print Book, Also available as e-Book.
- Flocco, D.; Falco, P.; Wadhams, P.; Spezie, G. Surface current measurements in Terra Nova Bay by HF radar. Antarct. Sci. 2003, 15, 61. [Google Scholar] [CrossRef]
- Shirasawa, K.; Ebuchi, N.; Leppäranta, M.; Takatsuka, T. Ice-edge detection from Japanese C-band radar and high-frequency radar coastal stations. Ann. Glaciol. 2013, 54, 59–64. [Google Scholar] [CrossRef]
- Kamli, E.; Chavanne, C.; Dumont, D. Experimental Assessment of the Performance of High-Frequency CODAR and WERA Radars to Measure Ocean Currents in Partially Ice-Covered Waters. J. Atmos. Ocean. Technol. 2016, 33, 539–550. [Google Scholar] [CrossRef]
- Halverson, M.; Pawlowicz, R.; Chavanne, C. Dependence of 25 MHz HF radar working range on near-surface conductivity, sea state and tides. J. Atmos. Ocean. Technol. 2017, 34, 447–462. [Google Scholar] [CrossRef]
- Zhang, W.; Ebuchi, N.; Fukamachi, Y.; Cheng, F.; Ohshima, K.I.; Emery, B.M.; Toyota, T.; Abe, H.; Shirasawa, K. Sea ice observation with oceanographic HF radar. IEEE Trans. Geosci. Remote Sens. 2019, 58, 378–390. [Google Scholar] [CrossRef]
- Wentworth, F.L.; Cohn, M. Electrical properties of sea ice at 0.1 to 30 Mc/s. J. Res. Natl. Bur. Stand. Sect. D Radio Sci. 1964, 68D, 681–691. [Google Scholar] [CrossRef]
- Fujita, S.; Matsuoka, T.; Ishida, T.; Matsuoka, K.; Mae, S. A summary of the complex dielectric permittivity of ice in the megahertz range and its application for radar sounding of polar ice sheets. Physics of Ice Core Records 2000, 1, 185–212. [Google Scholar]
- Buchanan, S.; Ingham, M.; Gouws, G. The low frequency electrical properties of sea ice. J. Appl. Phys. 2011, 110, 074908. [Google Scholar] [CrossRef]
- Mellor, M. Mechanical behaviour of sea ice. In The Geophysics of Sea Ice; Untersteiner, N., Ed.; NATO ASI Series; Springer: Boston, MA, USA, 1986; Chapter 20. [Google Scholar]
- Shokr, M.; Sinha, N.K. Sea Ice: Physics and Remote Sensing; AGU-Wiley Geophysical Monograph 209; Wiley: Hoboken, NJ, USA, 2015. [Google Scholar]
- Timco, G.W.; Weeks, W.F. A review of the engineering properties of sea ice. Cold Reg. Sci. Technol. 2010, 60, 107–129. [Google Scholar] [CrossRef]
- Marchenko, A.; Morozov, E.; Muzylev, S. Measurements of sea-ice flexural stiffness by pressure characteristics of flexural-gravity waves. Ann. Glaciol. 2013, 54, 51–60. [Google Scholar] [CrossRef]
- Murat, J.R.; Lainey, L.M. Some experimental observations on the Poisson’s ratio of sea-ice. Cold Reg. Sci. Technol. 1982, 6, 105–113. [Google Scholar] [CrossRef]
- Rabault, J.; Sutherland, G.; Gundersen, O.; Jensen, A. Measurements of wave damping by a grease ice slick in Svalbard using off-the-shelf sensors and open-source electronics. J. Glaciol. 2017, 63, 372–381. [Google Scholar] [CrossRef]
- De Carolis, G.; Olla, P.; Pignagnoli, L. Effective viscosity of grease ice in linearied gravity waves. J. Fluid Mech. 2005, 535, 369–381. [Google Scholar] [CrossRef]
- Peters, A.S. The effect of a floating mat on water waves. Commun. Pure Appl. Math. 1950, 3, 319–354. [Google Scholar] [CrossRef]
- Weitz, M.; Keller, J.B. Reflection of water waves from floating ice in water of finite depth. Commun. Pure Appl. Math. 1950, 3, 305–318. [Google Scholar] [CrossRef]
- Keller, J.B.; Weitz, M. Reflection and transmission coefficients for waves entering or leaving an ice field. Commun. Pure Appl. Math. 1953, 6, 415–417. [Google Scholar] [CrossRef]
- Fox, C.; Squire, V.A. Reflection and transmission characteristics at the edge of shore fast sea ice. J. Geophys. Res. Space Phys. 1990, 95, 11629–11639. [Google Scholar] [CrossRef]
- Fox, C.; Squire, V.A. Strain in shore fast ice due to incoming ocean waves and swell. J. Geophys. Res. Space Phys. 1991, 96, 4531–4547. [Google Scholar] [CrossRef]
- Liu, A.K.; Mollo-Christensen, E. Wave Propagation in a Solid Ice Pack. J. Phys. Oceanogr. 1988, 18, 1702–1712. [Google Scholar] [CrossRef]
- Lamb, H. Hydrodynamics, 6th ed.; Dover Reprint Edition; Dover: Mineola, TX, USA, 1932; pp. 624–625. [Google Scholar]
- Weber, J.E. Wave attenuation and wave drift in the marginal ice zone. J. Phys. Oceanogr. 1986, 17, 2351–2361. [Google Scholar] [CrossRef]
- Keller, J.B. Gravity waves on ice-covered water. J. Geophys. Res. Space Phys. 1998, 103, 7663–7669. [Google Scholar] [CrossRef]
- Wadhams, P. The seasonal ice zone. In The Geophysics of Sea Ice; Plenum: New York, NY, USA, 1986; pp. 825–991. [Google Scholar]
- Wadhams, P.; Parmiggiani, F.; De Carolis, G. The use of SAR to measure ocean wave dispersion in frazil-pancake ice. J. Phys. Oceanogr. 2002, 32, 1721–1746. [Google Scholar] [CrossRef]
- Wang, R.; Shen, H.H. Gravity waves propagating into an ice-covered ocean: A viscoelastic model. J. Geophys. Res. Space Phys. 2010, 115, C06024. [Google Scholar] [CrossRef]
- Zhao, X.; Shen, H.H.; Cheng, S. Modeling ocean wave propagation under sea ice covers. Acta Mech. Sin. 2015, 31, 1–15. [Google Scholar] [CrossRef]
- Zhao, X.; Cheng, S.; Shen, H.H. Nature of Wave Modes in a Coupled Viscoelastic Layer over Water. J. Eng. Mech. 2017, 143, 04017114. [Google Scholar] [CrossRef]
- Chen, H.; Gilbert, R.P.; Guyenne, P. Dispersion and attenuation in a porous viscoelastic model for gravity waves on an ice-covered ocean. Eur. J. Mech. B/Fluids 2019, 78, 88–105. [Google Scholar] [CrossRef]
- Fox, C.; Squire, V.A. On the oblique reflexion and transmission of ocean waves at shore fast sea ice. Philos. Trans. R. Soc. Lond. Ser. A Phys. Eng. Sci. 1994, 347, 185–218. [Google Scholar] [CrossRef]
- Flugge, W. Viscoelasticity; Springer: Berlin/Heidelberg, Germany, 1975. [Google Scholar]
- Robinson, N.J.; Palmer, S.C. A modal analysis of a rectangular plate floating on an incompressible liquid. J. Sound Vib. 1990, 142, 453–460. [Google Scholar] [CrossRef]
- Mosig, J.E.M.; Montiel, F.; Squire, V.A. Comparison of visco-elastic-type models for ocean wave attenuation in ice-covered seas. J. Geophys. Res. Ocean. 2015, 120, 6072–6090. [Google Scholar] [CrossRef]
- Mosig, J.E.M. Contemporary wave-ice interaction models. Ph.D. Thesis, University of Otago, Dunedin, New Zealand, 2018. [Google Scholar]
- Meylan, M.H.; Squire, V.A. The response of ice floes to ocean waves. J. Geophys. Res. Space Phys. 1994, 99, 891–900. [Google Scholar] [CrossRef]
- Skene, D.; Bennetts, L.; Michael Meylan, M.; Toffoli, A. Modelling water wave overwash of a thin floating plate. J. Fluid Mech. 2015, 777, R3. [Google Scholar] [CrossRef]
- Meylan, M.H.; Bennetts, L.; Cavaliere, C.; Alberello, A.; Toffoli, A. Experimental and theoretical models of wave-induced flexure of a sea ice floe. Phys. Fluids 2015, 27, 041704. [Google Scholar] [CrossRef]
- Squire, V.A.; Kovalev, P.D.; Kovalev, D.P. Resonance and interactions of infragravity waves with sea ice. Cold Reg. Sci. Technol. 2021, 182, 103217. [Google Scholar] [CrossRef]
- Herman, A. Wave-induced surge motion and collisions of sea ice floes: Finite-floe-size effects. J. Geophys. Res. 2018, 123, 7472–7494. [Google Scholar] [CrossRef]
- Squire, V.A. A fresh look at how ocean waves and sea ice interact. Philos. Trans. R. Soc. A Math. Phys. Eng. Sci. 2018, 376, 20170342. [Google Scholar] [CrossRef] [PubMed]
- Nelli, F.; Bennetts, L.G.; Skene, D.M.; Toffoli, A. Water wave transmission and energy dissipation by a floating plate in the presence of overwash. J. Fluid Mech. 2020, 889. [Google Scholar] [CrossRef]
- Squire, V.A. Toward realism in modeling ocean wave behaviour in marginal ice zones. J. Geophys. Res. 1997, 102, 22981–22991. [Google Scholar]
- Williams, T.D.; Bennetts, L.G.; Dumont, D.; Squire, V.A.; Bertino, L. Wave-ice interactions in the marginal ice zone. Part 1: Theoretical foundations. Ocean Model. 2013, 71, 81–91. [Google Scholar] [CrossRef]
- Williams, T.D.; Bennetts, L.G.; Squire, V.A.; Dumont, D.; Bertino, L. Wave–ice interactions in the marginal ice zone. Part 2: Numerical implementation and sensitivity studies along 1D transects of the ocean surface. Ocean Model. 2013, 71, 92–101. [Google Scholar] [CrossRef]
- Meylan, M.; Squire, V.A. Response of a circular ice floe to ocean waves. J. Geophys. Res. Ocean. 1996, 101, 8869–8884. [Google Scholar] [CrossRef]
- Meylan, M.H.; Horvat, C.; Bitz, C.M.; Bennetts, L.G. A floe size dependent scattering model in two- and three-dimensions for wave attenuation by ice floes. Ocean Model. 2021, 161, 101779. [Google Scholar] [CrossRef]
- Williams, T.D.; Bennetts, L.G.; Dumont, D.; Squire, V.A.; Bertino, L. Towards the inclusion of wave-ice interactions in large-scale models for the Marginal Ice Zone. arXiv 2012, arXiv:1203.2981. [Google Scholar]
- Bennetts, L.G.; Peter, M.A.; Squire, V.A.; Meylan, M.H. A three-dimensional model of wave attenuation in the marginal ice zone. J. Geophys. Res. Space Phys. 2010, 115. [Google Scholar] [CrossRef]
- Ardhuin, F.; Sutherland, P.; Doble, M.J.; Wadhams, P. Ocean waves across the Arctic: Attenuation due to dissipation dominates over scattering for periods longer than 19 s. Geophys. Res. Lett. 2016, 43, 5775–5783. [Google Scholar] [CrossRef]
- Li, J.; Kohout, A.L.; Shen, H.H. Comparison of wave propagation through ice covers in calm and storm conditions. Geophys. Res. Lett. 2015, 42, 5935–5941. [Google Scholar] [CrossRef]
- Meylan, M.; Masson, D. A linear Boltzmann equation to model wave scattering in the marginal ice zone. Ocean Model. 2006, 11, 417–427. [Google Scholar] [CrossRef]
- Meylan, M.H.; Bennetts, L.G. Three-dimensional time-domain scattering of waves in the marginal ice zone. Philos. Trans. R. Soc. A Math. Phys. Eng. Sci. 2018, 376, 20170334. [Google Scholar] [CrossRef] [PubMed]
- Collins, C.O., III; Rogers, W.E.; Lund, B. An investigation into the dispersion of ocean surface waves in sea ice. Ocean Dyn. 2016, 67, 263–280. [Google Scholar] [CrossRef]
- Squire, V.A. A comparison of the mass-loading and elastic plate models of an ice field. Cold Reg. Sci. Technol. 1993, 21, 219–229. [Google Scholar] [CrossRef]
- Newyear, K.; Martin, S. Comparison of laboratory data with a viscous two-layer model of wave propagation in grease ice. J. Geophys. Res. Space Phys. 1999, 104, 7837–7840. [Google Scholar] [CrossRef]
- Zhao, X.; Shen, H.H. Wave propagation in frazil/pancake, pancake and fragmented ice covers. Cold Reg. Sci. Technol. 2015, 113, 71–80. [Google Scholar] [CrossRef]
- Meylan, M.H.; Bennetts, L.G.; Kohout, A.L. In situ measurements and analysis of ocean waves in the Antarctic marginal ice zone. Geophys. Res. Lett. 2014, 41, 5046–5051. [Google Scholar] [CrossRef]
- Cheng, S.; Rogers, W.E.; Thomson, J.; Smith, M.; Doble, M.J.; Wadhams, P.; Kohout, A.; Lund, B.; Persson, O.P.G.; Collins, C.O., III; et al. Calibrating a viscoelastic sea ice model for wave propagation in the Arctic Fall marginal ice zone. J. Geophys. Res. Ocean. 2017, 122, 8770–8793. [Google Scholar] [CrossRef]
- Kodaira, T.; Waseda, T.; Nose, T.; Sato, K.; Inoue, J.; Voermans, J.; Babanin, A. Observation of on-ice wind waves under grease ice in the western Arctic Ocean. Polar Sci. 2021, 27. [Google Scholar] [CrossRef]
- Rogers, W.E.; Meylan, M.H.; Kohout, A.L. Estimates of spectral wave attenuation in Antarctic sea ice, using model/data inversion. Cold Reg. Sci. Technol. 2020, 182, 103198. [Google Scholar] [CrossRef]
- Wadhams, P.; Squire, V.A.; Ewing, J.A.; Pascal, R.W. The effect of the marginal ice zone on the directional wave spectrum of the ocean. J. Phys. Oceanogr. 1986, 16, 358–376. [Google Scholar] [CrossRef]
- Montiel, F.; Squire, V.A.; Bennetts, L.G. Attenuation and directional spreading of ocean wave spectra by large random arrays of ice floes. J. Fluid Mech. 2016, 790, 492–522. [Google Scholar] [CrossRef]
- Squire, V.A.; Montiel, F. Evolution of Directional Wave Spectra in the Marginal Ice Zone: A New Model Tested with Legacy Data. J. Phys. Oceanogr. 2016, 46, 3121–3137. [Google Scholar] [CrossRef]
- Lipa, B.; Nyden, B.; Barrick, D.; Kohut, J. HF Radar Sea-echo from Shallow Water. Sensors 2008, 8, 4611–4635. [Google Scholar] [CrossRef] [PubMed]
- Liu, Q.; Rogers, W.E.; Babanin, A.; Li, J.; Guan, C. Spectral Modeling of Ice-Induced Wave Decay. J. Phys. Oceanogr. 2020, 50, 1583–1604. [Google Scholar] [CrossRef]
- Meylan, M.; Bennetts, L.; Mosig, J.; Rogers, E.; Doble, M.; Peter, M. Dispersion relations, power laws and energy loss for waves in the marginal ice zone. J. Geophys. Res. 2018, 123, 3322–3335. [Google Scholar] [CrossRef]
- Iwasaki, S.; Otsuka, J. Evaluation of Wave-Ice Parameterization Models in Wavewatch III R Along the Coastal Area of the Sea of Okhotsk During Winter. Front. Mar. Sci. 2021, 8, 713784. [Google Scholar] [CrossRef]
- Bennetts, L.G.; Squire, V.A. Model sensitivity analysis of scattering-induced attenuation of ice-coupled waves. Ocean Model. 2012, 45–46, 1–13. [Google Scholar] [CrossRef]
- Fox, F.; Squire, V.A. Coupling between the ocean and an ice shelf. Ann. Glaciol. 1991, 15, 101–108. [Google Scholar] [CrossRef]
- Squire, V.A. Marginal ice zone rigidity parameterization from ocean wave refraction. Cold Reg. Sci. Technol. 1994, 22, 235–241. [Google Scholar] [CrossRef]
- Anderson, S.J.; Abramovich, Y.I. A unified approach to detection, classification and correction of ionospheric distortion n HF skywave radar systems. Radio Sci. 1998, 33, 1055–1067. [Google Scholar] [CrossRef]
- Abramovich, Y.I.; Anderson, S.J.; Gorokhov, A.Y.; Spencer, N.K. Stochastic constraints method in nonstationary hot clutter cancellation, Part I: Fundamentals and supervised training applications. IEEE Trans. Aerosp. Electron. Syst. 1998, 34, 1271–1292. [Google Scholar] [CrossRef]
- Abramovich, Y.I.; Anderson, S.J.; Spencer, N.K. Stochastic-constraints method in nonstationary hot clutter cancellation, Part II: Unsupervised training applications. IEEE Trans. Aerosp. Electron. Syst. 2000, 36, 132–149. [Google Scholar] [CrossRef]
- Theurer, T. High-Latitude Over-the-Horizon Radar Applications. Ph.D. Thesis, Universityb of Alaska, Fairbanks, AK, USA, 2020. Available online: http://hdl.handle.net/11122/11294 (accessed on 25 October 2021).
- Anderson, S.J. Multiple scattering of HF surface waves: Implications for radar design and sea clutter interpretation. IET Radar Sonar Navig. 2010, 4, 195–208. [Google Scholar] [CrossRef]
- Anderson, S.J. Bistatic and Stereoscopic Configurations for HF Radar. Remote Sens. 2020, 12, 689. [Google Scholar] [CrossRef]
- Greenwald, R.A. History of the Super Dual Auroral Radar Network (SuperDARN)-I: Pre-SuperDARN developments in high frequency radar technology for ionospheric research and selected scientific results. Hist. Geo-Space Sci. 2021, 12, 77–93. [Google Scholar] [CrossRef]
- Baker, J.B.H. The Super Dual Auroral Radar Network (SuperDARN). Available online: http://vt.superdarn.org/tiki-index.php?page=sd_tutorial (accessed on 25 October 2021).
- Greenwood, R.; Schultz, E.; Parkinson, M.; Neudegg, D. Evaluation of the TIGER SuperDARN Over-The-Horizon Radar Systems for Providing Remotely Sensed Marine and Oceanographic Data over the Southern Ocean; Technical Report No. 045; Australian Government, Bureau of Meteorology, Centre for Australian Weather and Climate Research: Melbourne, VIC, Australia, 2011.
- Shepherd, S.G.; Sterne, K.T.; Thomas, E.G.; Ruohoniemi, J.M.; Baker, J.B.H.; Parris, R.T.; Pedersen, T.R.; Holmes, J.M. Bistatic Observations with SuperDARN HF Radars: First Results. Radio Sci. 2020, 55. [Google Scholar] [CrossRef]
- Riddolls, R.J. High-latitude application of three-dimensional over-the-horizon radar. IEEE Aerosp. Electron. Syst. Mag. 2017, 32, 36–43. [Google Scholar] [CrossRef]
- Episkopos, M. Russia’s New Radar Can Track 5000 Objects (Including Hypersonic Missiles); The National Interest, Journal of the Center for the National Interest: Washington DC, USA, 8 December 2018. [Google Scholar]
- Dawe, B. (Maerospace Corporation, Waterloo, ON, Canada). Private communication.


| Observable | Passive Sensors | Active Sensors | |||
|---|---|---|---|---|---|
| Visible and IR Imagers | Microwave Radiometers | Altimeters | Scatter- Ometers | LEO Synthetic Aperture Radar | |
| ice field edge | Y | Y | Y | Y | Y |
| ice type | Y | y | N | y | Y |
| ice thickness | N | Y | Y | N | y |
| floe size distribution | Y | N | y | N | Y |
| permittivity | y | Y | N | Y | y |
| ice drift | Y | Y | N | y | Y |
| ice dynamics | N | N | N | N | N |
| resolution (horiz.) | 10–30 m | 5–25 km | 10–70 m | 25 km | 1–15 m |
| revisit time | 1–2 days | 1 day | 27 days | 7–14 days | 3–15 days |
Publisher’s Note: MDPI stays neutral with regard to jurisdictional claims in published maps and institutional affiliations. |
© 2021 by the author. Licensee MDPI, Basel, Switzerland. This article is an open access article distributed under the terms and conditions of the Creative Commons Attribution (CC BY) license (https://creativecommons.org/licenses/by/4.0/).
Share and Cite
Anderson, S. Remote Sensing of the Polar Ice Zones with HF Radar. Remote Sens. 2021, 13, 4398. https://doi.org/10.3390/rs13214398
Anderson S. Remote Sensing of the Polar Ice Zones with HF Radar. Remote Sensing. 2021; 13(21):4398. https://doi.org/10.3390/rs13214398
Chicago/Turabian StyleAnderson, Stuart. 2021. "Remote Sensing of the Polar Ice Zones with HF Radar" Remote Sensing 13, no. 21: 4398. https://doi.org/10.3390/rs13214398
APA StyleAnderson, S. (2021). Remote Sensing of the Polar Ice Zones with HF Radar. Remote Sensing, 13(21), 4398. https://doi.org/10.3390/rs13214398