Abstract
Haiyang-2C (HY-2C) is a dynamic, marine-monitoring satellite that was launched by China and is equipped with an onboard dual-frequency GPS receiver named HY2_Receiver, which was independently developed in China. HY-2C was successfully launched on 21 September 2020. Its precise orbit is an important factor for scientific research applications, especially for marine altimetry missions. The performance of the HY2_Receiver is assessed based on indicators such as the multipath effect, ionospheric delay, cycle slip and data utilization, and assessments have suggested that the receiver can be used in precise orbit determination (POD) missions involving low-Earth-orbit (LEO) satellites. In this study, satellite-borne GPS data are used for POD with a reduced-dynamic (RD) method. Phase centre offset (PCO) and phase centre variation (PCV) models of the GPS antenna are established during POD, and their influence on the accuracy of orbit determination is analysed. After using the PCO and PCV models in POD, the root mean square (RMS) of the carrier-phase residuals is around 0.008 m and the orbit overlap validation accuracy in each direction reaches approximately 0.01 m. Compared with the precise science orbit (PSO) provided by the Centre National d’Etudes Spatiales (CNES), the RD orbit accuracy of HY-2C in the radial (R) direction reaches 0.01 m. The accuracy of satellite laser ranging (SLR) range validation is better than 0.03 m. Additionally, a new method is proposed to verify the accuracy of the RD orbit of HY-2C by using space-borne Doppler orbitography and radiopositioning integrated by satellite (DORIS) data directly. DORIS data are directly compared to the result calculated using the accurate coordinates of beacons and the RD orbit, and the results indicate that the external validation of HY-2C RD orbit has a range rate accuracy of within 0.0063 m/s.
Keywords:
HY-2C; Satellite-borne GPS; precise orbit determination; reduced-dynamic orbit; SLR; DORIS 1. Introduction
The Haiyang-2C (HY-2C) satellite was successfully launched on 21 September 2020; it was the third satellite launched by China to monitor the dynamic marine environment and the second satellite in the marine dynamic satellite series established as part of China’s national civil space infrastructure [1]. The main goal is to obtain high-precision and high-resolution real-time observations of the ocean, such as the sea surface height and significant wave height [2]. The mass of HY-2C is 1677 kg, the Semi major axis is 7328.583 km, the Eccentricity is 0.000012, the average height is 957 km at an inclination of 66°, and the expected lifetime is 3 years. The satellite is connected to HY-2B and HY-2D to form an all-weather, high-frequency, global, marine dynamic environment-monitoring system that covers large and medium scales.
Precise orbit determination (POD) is an important prerequisite for HY-2C to perform altimetry missions, so this satellite requires a high orbit accuracy. To ensure a high-precision orbit, the HY-2C satellite is equipped with three independent payloads, namely, China’s self-developed, satellite-borne, dual-frequency global positioning system (GPS) receiver, named HY2_Receiver [1], a Doppler orbitography and radiopositioning integrated by satellite (DORIS) receiver named DGXX and a laser reflector array (LRA) for precise orbit determination by Satellite Laser Ranging (SLR) [3].
The POD of low-Earth-orbit (LEO) satellites using SLR is affected by the number of stations and the meteorological conditions, and the amount of range data is small [4]. Therefore, SLR can only be used for orbit determination with dynamic methods [5]. DORIS POD relies solely on the dynamic method. In contrast GPS POD can be based on the dynamic approach as well as reduced-dynamic (RD) and kinematic methods [6,7].
Since Bertiger et al. successfully applied the satellite-borne GPS POD technique to TOPEX/Poseidon for the first time, GPS receivers have been employed in combination with many LEO satellites, and the satellite-borne GPS POD technique has become increasingly mature as one of the main ways to determine the precise orbit of LEO satellites [8]. The dynamic method of POD relies on an accurate dynamic model and must adjust the corresponding model parameters in the orbit determination process; however, this approach is cumbersome and involves complicated dynamics theory [9]. Consequently, this method is rarely used to determine LEO satellite orbits [10]. A kinematic method of orbit determination only requires geometric information constructed based on satellite-borne GPS observations, and this information is used to calculate the orbit [11]; this approach also has high requirements regarding the geometric configuration and data continuity of GPS satellites. The RD method achieves a balance between dynamic modelling and the use of geometric information [12]. The accuracy of orbit with the RD method is also higher than that based on the dynamic method and the kinematic method [13,14].
Satellite-borne GPS POD technology has been successfully applied in conjunction with the CHAMP, GRACE, Jason-1, GOCE, COSMIC and other LEO satellites performing geodetic and oceanographic surveys. These satellites have strict orbit accuracy requirements [15,16,17,18,19,20]. Jäggi et al. have researched the application of pseudorandom pulse parameters in orbit determination and successfully determined the RD orbit of CHAMP [21]. Guo et al. determined the precise orbit of HY-2A by using satellite-borne GPS observations [22]. Lin et al. calculate the precise orbit of HY-2A based on GPS data, and the accuracy of the orbit in the radial (R) direction was better than 3 cm [1]. Gong et al. propose a progressive method to determine the POD of LEO satellites, which leads to an improved orbit accuracy [23].
The capability of the GPS receiver directly affects the quality of observations and the accuracy of orbit determination. The quality of observations reflects the performance of the onboard GPS receiver. The quality of GPS data can be analysed in terms of the multipath effect, ionospheric delay (IOD), elevation angle and utilization of GPS observations. Montenbruck et al. use the GPS elevation angle and multipath effects to evaluate the performance of the BlackJack receiver carried by the CHAMP satellite [24]. Hwang et al. have found that the proportion of the kinematic orbits of FORMOSAT-3/COSMIC that can be used for gravity research is less than 30%, and the factors that limit orbit use mainly include multipath effects, cycle slips, IOD and an insufficient number of visible GPS satellites [25,26]. Hwang et al. analyse the performance of GPS receivers carried by FORMOSAT/COSMIC and GRACE in orbit determination through multipath, IOD and phase residual methods [27].
To analyse the performance of the HY2_Receiver and the accuracy of the RD orbit of HY-2C, the quality of GPS observations is analysed, and internal and external validations are performed. A new external method is proposed to validate the accuracy of the RD orbit using onboard DORIS data.
DORIS is a highly accurate tracking system developed by France, with approximately 60 beacons globally for one-way accurate measurements. DORIS contributes to the International Terrestrial Reference Frame (ITRF), and ITRF2014 benefits from improved analysis strategies of the seven contributing International DORIS Service (IDS) analysis centres [28]. The CNES/CLS analysis centre contributes to the geodetic and geophysical research activity through DORIS data analysis [29]. In 1990, the SPOT-2 satellite, first equipped with a DORIS receiver, received a centimetre orbit [30]. DORIS instruments are presently flying aboard SPOT-4 and SPOT-5, Jason-1 and Jason-2, and Envisat. DIODE, developed by Centre National d’Etudes Spatiales (CNES) is successfully applied to Jason-1 [31]. Mercier et al. utilize DORIS phase and pseudorange data to precisely determine the orbits of Jason-2 [32]. Zelensky et al. determine the precise orbit of Envisat by using satellite-borne DORIS observations [33].
Mercier et al. have proposed a POD strategy based on RINEX DORIS 3.0 format with an accuracy of 1~3 cm [32]. Due to higher frequency, shorter wavelength, and higher measurement accuracy, the accuracy of high-frequency phase data of DORIS data (at frequency 2036.25 MHz) is at the millimetre level. Converting the phase data into a format of average range rate, the nominal accuracy reaches 0.5 mm/s [34].
Considering that SLR can serve as an external validation method for orbit determination by the GPS POD method, the new method proposed in this paper also innovates the use of onboard DORIS as an external validation method.
The primary aim of this paper is to assess the performance of the HY2_Receiver and the accuracy of HY-2C RD orbits, and to estimate the impact of PCO and PCV models on the orbit of HY-2C simultaneously. The rest of this article is arranged as follows. Section 2 introduces the HY-2C satellite information, data required for orbit determination and orbit quality assessment, introduces the method and strategy of HY-2C orbit determination, proposes a new external method to assess LEO orbits with onboard DORIS data directly and discusses the reliability of the new external method to validate orbits with onboard DORIS data directly. Section 3 analyses the quality of GPS data, estimates PCO and PCV models and studies the influence of these models in POD; based on phase residuals, differences between overlapping orbits are determined, comparisons with precise scientific orbits (PSO) are made, independent SLR validation is performed to assess the accuracy of HY-2C RD orbits and an example of HY-2C RD orbits and PSO validations with onboard DORIS data are given. Finally, the conclusions are presented.
2. Materials and Methods
2.1. Materials
2.1.1. HY-2C Spacecraft
Based on the Ziyuan series satellite platform, the load compartment structure of the Haiyang-2 series of satellites was reconfigured to meet the requirements of additional payloads. HY-2C has the same size and structure as HY-2A and HY-2B, but onboard equipment has been updated [7].
HY-2C is mainly equipped with a radar altimeter, a microwave scatterometer, and a microwave radiometer. The equipment used for POD includes an onboard DORIS receiver DGXX, a space-borne dual-frequency GPS receiver named HY2_Receiver that was developed in China, and a laser reflector array (LRA) [7].
A satellite-navigation body reference coordinate system (SNCS) is used [35], and a view of the satellite in this coordinate system is shown in Figure 1. Notably, the scatterometer antenna, data transmission antenna, altimeter antenna, DORIS antenna, and LRA are parallel to the Z axis.
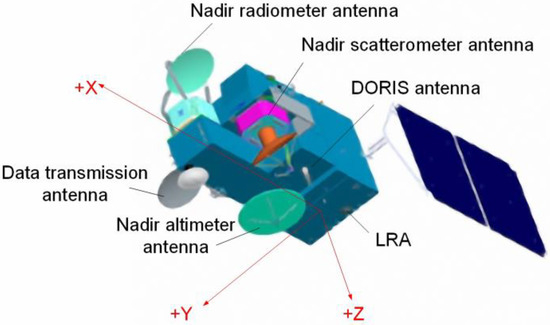
Figure 1.
Satellite View in the SNCS [https://osdds.nsoas.org.cn (accessed on 2 June 2021)].
The National Satellite Ocean Application Service (NSOAS) provide some parameters, such as the correction from the antenna phase centre to the satellite centre of mass (Sensor Offset). The Centre National d’Etudes Spatiales (CNES) provides the centre of mass (COM) of the satellite [36], as shown in Table 1. The DORIS antenna and LRA are set in the positive direction of the Z axis, and the GNSS antenna is set in the negative direction of the Z axis [36].

Table 1.
Antenna and COM parameters of HY-2C.
In order to facilitate analysis of specific perturbation, the force acting on the satellite is specified in a satellite orbit coordinate system (radial, along-track, cross-track; RTN). This RTN system is well suited for easy analyses of the POD quality.
The POD team from the CNES provides the correction parameters for the DORIS antenna phase centre relative to the COM of the satellite. Relevant documentation can be found at: ftp://ftp.ids-doris.org/pub/ids/satellites/DORISSatelliteModels.pdf (accessed on 24 June 2021). The DORIS system operates at two frequencies, 2 GHz and 400 MHz, and the positions of these antennas in the SNCS are listed in Table 2.
Table 2.
Positions of the DORIS antennas in the SNCS.
2.1.2. Data for GPS POD and Validation
Satellite-borne GPS observations are released by NSOAS.
Precise GPS satellite ephemeris data are provided by the Center for Orbit Determination in Europe (CODE) [37] with a sampling interval of 15 min. Precise GPS satellite clock offsets are provided by CODE at a sampling interval of 30 s. Earth rotation parameters are also provided by CODE. Since the precise ephemeris data are provided by CODE every 15 min and the sampling interval of observations is 30 s during orbit determination, it is necessary to interpolate the precise ephemeris data [38]. Bernese 5.2 uses the ninth-order Lagrange interpolation method to interpolate the precise GPS ephemeris data [39].
PSO data for orbit accuracy analysis are released by CNES, and these data are obtained with a dynamic method using onboard DORIS observations [40].
SLR tracking data are provided by the International Laser Ranging Service (ILRS) [41].
DORIS observations are provided by IDS in RINEX DORIS 3.0 format. RINEX has been developed by the Astronomical Institute of the University of Berne for the easy exchange of the GPS data to be collected during the large European GPS campaign, EUREF 89. The RINEX format can also be easily adapted to contain DORIS data as it makes little assumption about the actual content of the data file, but only constrains the formatting of the data. Thus, it can be easily adapted to contain data other than GNSS. DORIS data includes pseudorange and phase, which is the same as the format of GNSS data. For a detailed description of the RINEX DORIS 3.0 format, please refer to the documents provided by the IDS: https://ids-doris.org/about-doris-rinex-format.html (accessed on 25 June 2021). When using DORIS data to check an orbit [42], it is necessary to convert the phase in 3.0 format to the range rate, i.e., to convert the 3.0 data format to the 2.2 data format. A summary of the data sources is provided in Table 3.
Table 3.
Sources of data.
2.2. Method
2.2.1. Reduced-Dynamic Method
When Bernese 5.2 GNSS software [39] is applied, an a priori dynamic orbit is used for GPS clock synchronization and then for the preprocessing of phase data. The cycle slips in the phase observations are marked, and for each cycle slip, a new ambiguity parameter is set in the parameter’s estimation process [43]. The “cleaned” phase observations are used in the GPSEST module to determine the dynamic satellite parameters. These parameters include the initial state vector (6 Keplerian elements), 9 solar radiation coefficients [44] and 3 pseudostochastic pulse parameters in the R, T and N directions. Arc lengths of 24 h were selected, and the pulses are estimated every 6 min [45].
2.2.2. Orbit Determination Strategies for HY-2C
The models and parameters used together with satellite-borne GPS observations to achieve RD orbit determination are shown in Table 4.
Table 4.
RD orbit determination strategies of HY-2C.
2.2.3. Validation of Orbits with DORIS Data
Suppose that the DORIS phase observations corresponding to the two frequencies and at time are and , respectively. After ionospheric correction, the corresponding phase value at is:
If (where ), the average distance change rate within is:
The time system used by DORIS is International Atomic Time (TAI), while the RD orbit relates to GPS time (GPST). Therefore, the time offset between both scales has to be considered before validation is performed.
Onboard DORIS observations are used to check the satellite orbit, and they can be obtained based on the average distance change rate:
where represents the time difference between and ; represents the distance of satellite movement in the time interval; and . When , represents the position of the satellite at time ; when , represents the position of the satellite at time . represents the precise location of the DORIS beacon stations. The beacon station location information can be obtained from the IDS website: https://ids-doris.org/doris-system/tracking-network/site-logs.html (accessed on 24 June 2021). represents the effect of relativity in the time interval ; represents the correction of the Earth rotation parameters in the time interval ; represents the correction of the tides in the time interval ; represents the correction of the tropospheric delay in the time interval ; represents the correction of the DORIS antenna phase centre; and represents random error.
The difference between the average range rate obtained by Equation (2) and the average range rate obtained by Equation (3) is calculated to obtain the DORIS validation residuals:
When using DORIS data to validate the RD orbit of HY-2C, we need to take into account some errors, such as the DORIS phase-centre correction and the impact of tidal effects. CNES has released the correction data of DORIS phase centre, we only need to correct it to the signal propagation path between HY-2C and the beacon stations. When calculating tide corrections, it is necessary to consider solid-earth tide, ocean tide and polar tide (although there are few DORIS stations at high latitudes) corrections. For tropospheric delay correction, the Saastamoinen model is used to calculate the zenith delay [46], and then the mapping function Niell Mapping Function (NMF) is used to map it to the signal propagation path [47].
According to the law of error propagation, the median error of the range rate is calculated using the satellite positions corresponding to two epochs with an interval of 10 s. The range rate function is:
where represents the range rate in the time interval ; and represent the satellite positions in two adjacent epochs in the time interval , respectively; and represents the distance of satellite movement in the time interval .
The total differential of the position parameters in Equation (5) is calculated to obtain the medium error relation:
where , , and ; , , and respectively represent the errors of the satellite position in three directions in an Earth-Centred and Earth-Fixed coordinate system (ECEF).
If the satellite has a 2 cm error in three directions, according to Equation (6), the median error of the range rate is 0.0052 m/s. Considering other random errors when using DORIS data to check orbits, the error is doubled to v = 0.0104 m/s as the threshold.
The law of error propagation verifies that the method proposed to check satellite orbits using space-borne DORIS data is reasonable and can be used to establish a precise external data validation method
3. Result and Analysis
3.1. Quality Assessment of HY-2C GPS Observations
In this section, the GPS data are preprocessed with G-Nut/Anubis software [48] and the performance of the HY2_Receiver is assessed by using indicators such as multipath effects, the IOD, the cycle slip and the utilization of GPS observations. G-Nut/Anubis is the third GNSS software developed by the Research Institute of Geodesy, Topography and Cartography in the Czech Republic; it can perform quality inspection and analysis operations based on observations and supports the RINEX 3 file format.
3.1.1. Multipath Effect
Theoretically, the influence of multipath effects on the pseudorange can reach up to tens of metres, and the influence on the carrier phase is only one quarter of its wavelength. Therefore, when calculating multipath effects, the influence of the phase multipath error is usually ignored. Anubis uses a linear combination of pseudorange and carrier phase information to calculate the pseudorange multipath and [48]:
where is the multipath phase noise; is the pseudorange multipath effect on both frequencies; and represent the wavelength of and the integer ambiguity of , respectively; and , where represents the frequency of different bands.
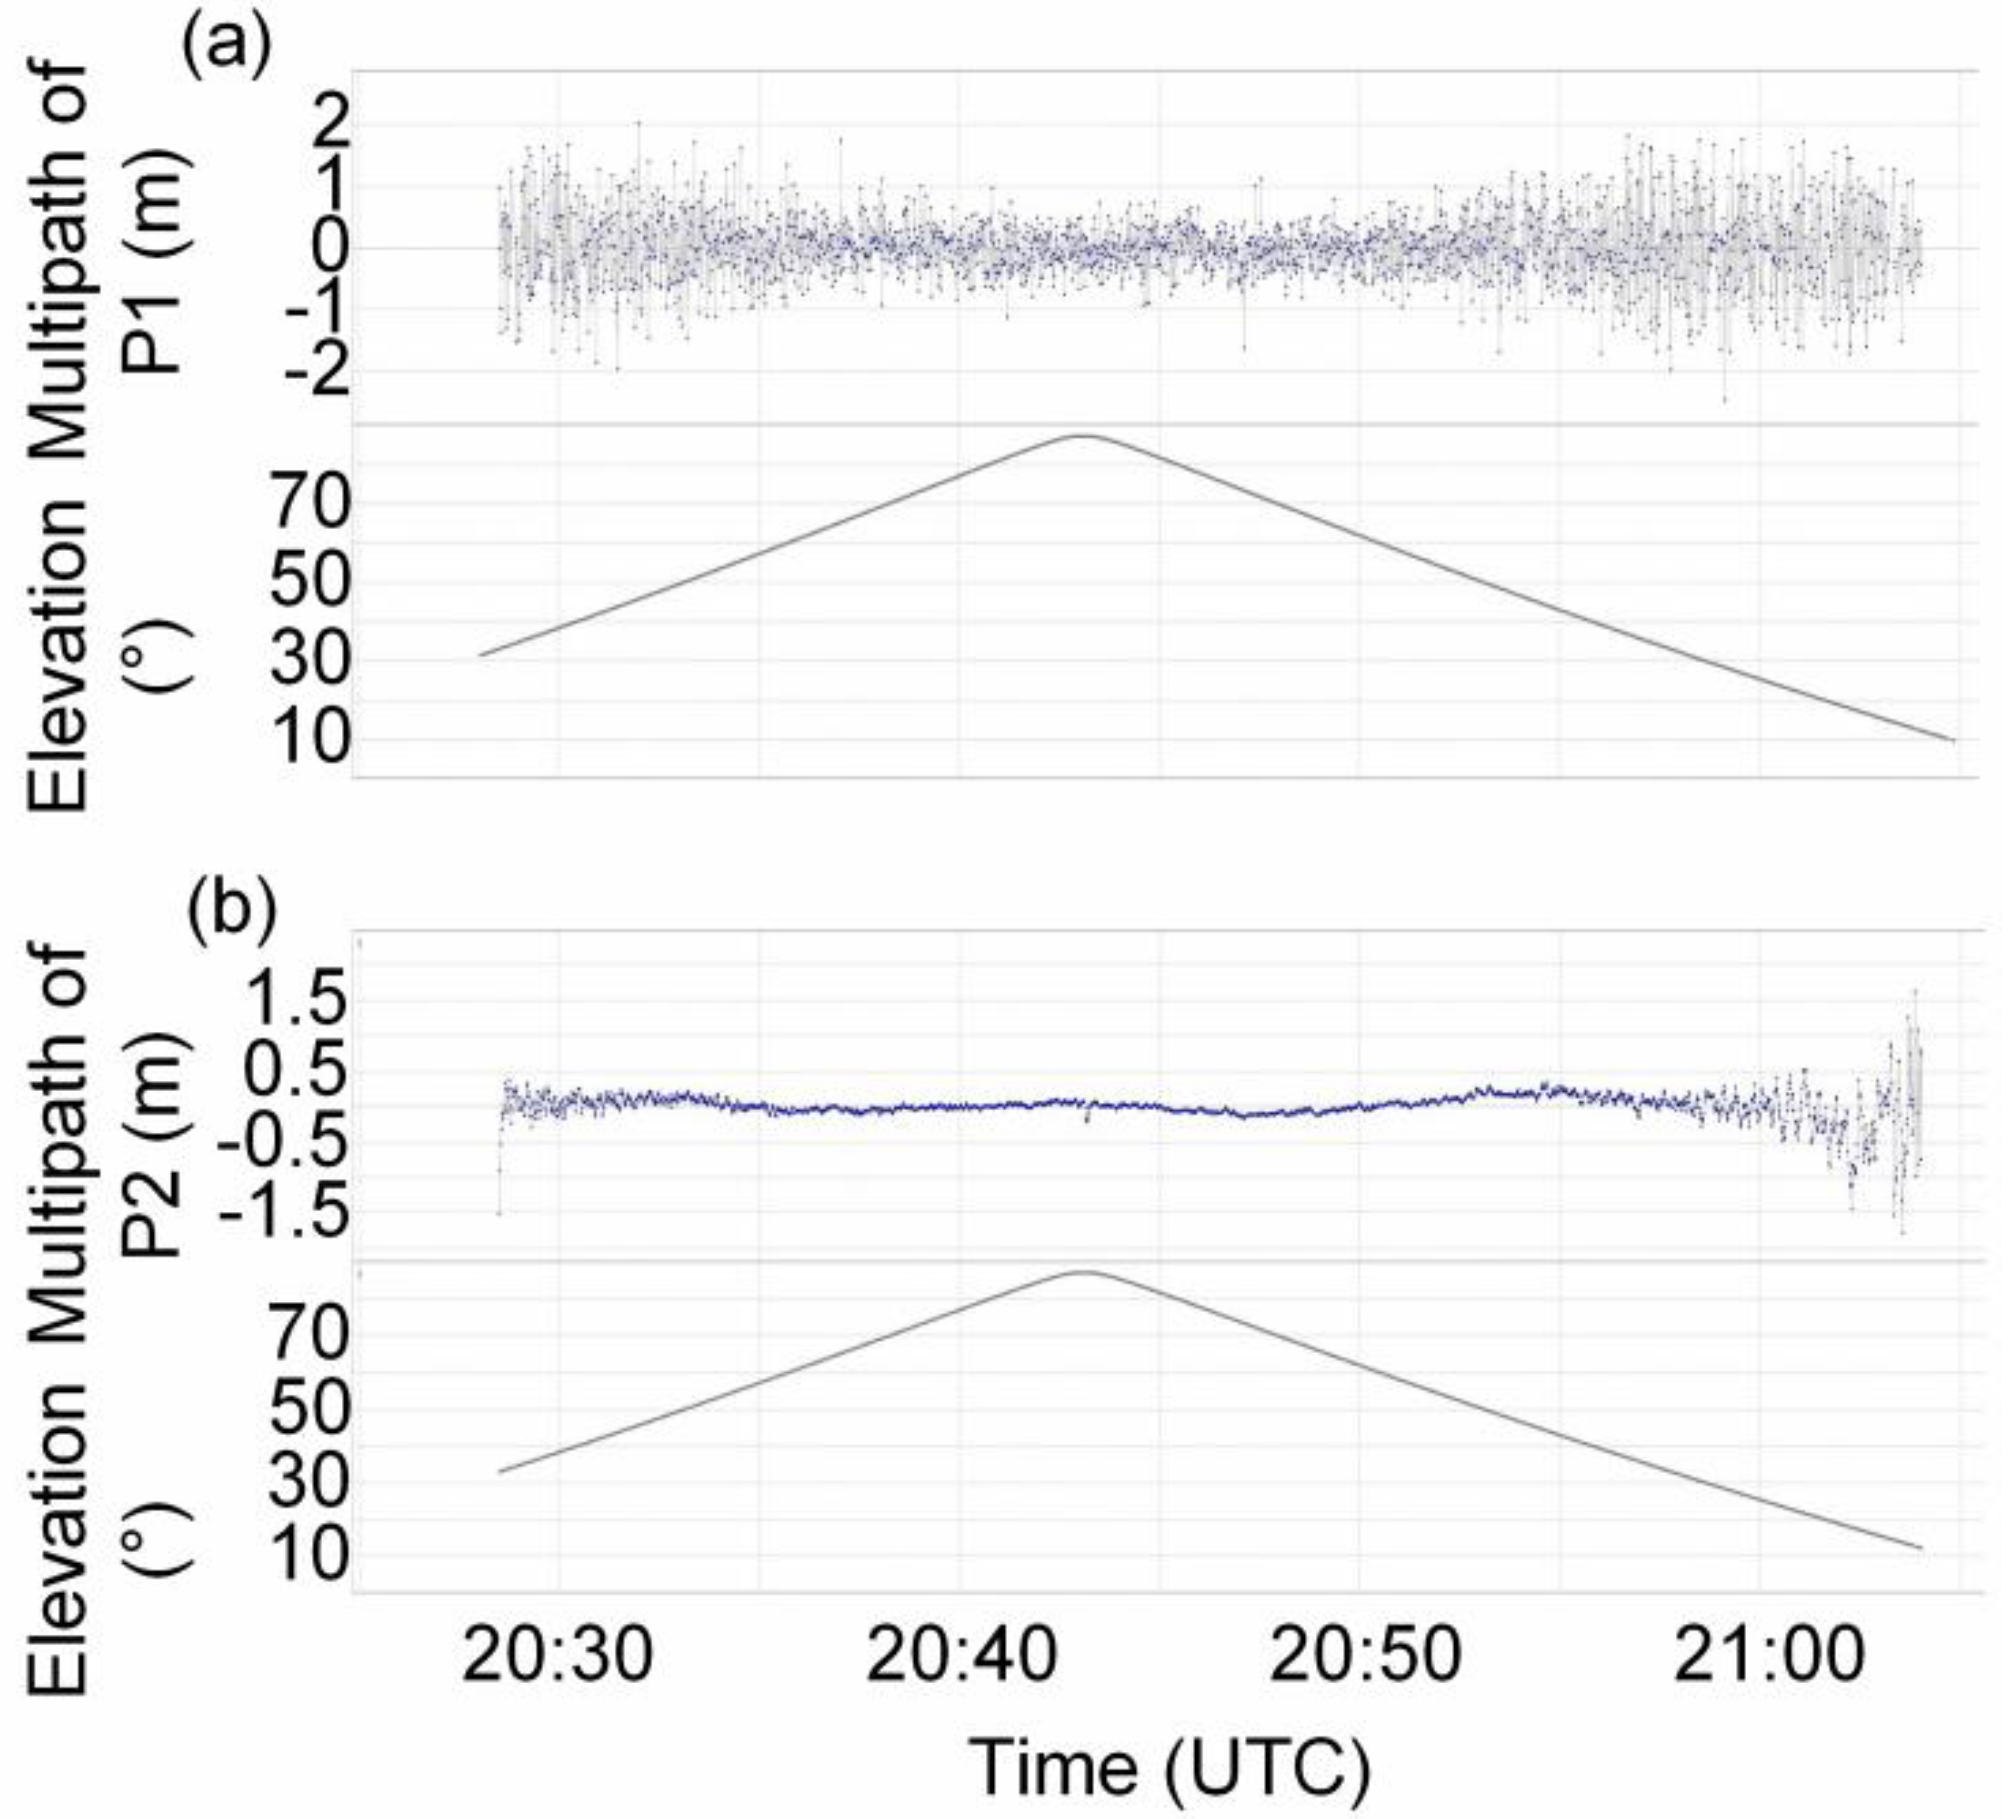
To specifically analyse the relationship between multipath effects and the elevation angle, the GPS satellite numbered G09 on DOY 348 in 2020 is taken as an example. The period from 20:25 to 21:05 (UTC) is selected. The pseudorange multipath as well as the elevation angle of G09 as observed from HY-2C are calculated and shown in Figure 2. Figure 2a illustrates a statistical assessment of MP1 and the elevation angle, and Figure 2b gives a statistical assessment of MP2 and the elevation angle.
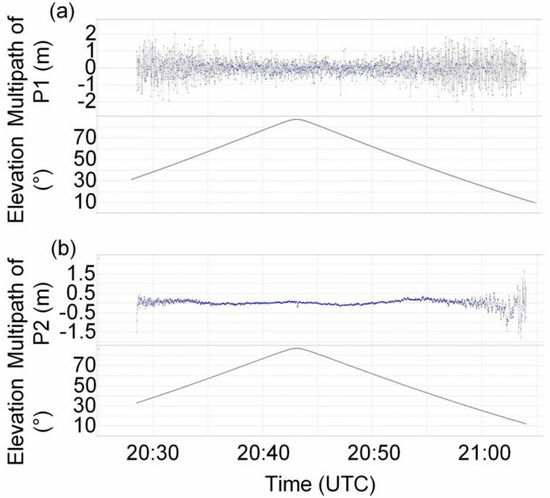
Figure 2.
Multipath effects of HY-2C and G09 satellite on DOY 348 in 2020 (a) MP1, (b) MP2.
Figure 2 shows that MP1 considerably fluctuates when the elevation angle is less than 30°, and the range of fluctuations is between −2 m and 2 m; when the elevation angle is larger than 30°, the fluctuations are between −1 m and 1 m. The fluctuation of MP2 is between −1.5 m and 1.5 m, but when the elevation angle is larger than 30°, the fluctuations range between −0.5 m and 0.5 m. By comparing Figure 2a with Figure 2b, it can be found that the MP1 value is more sensitive to low elevation angles than the MP2 value.
Table 5 summarizes the report of Anubis regarding the GPS data obtained between DOY 348 and DOY 354 in 2020. Cycle slip represents the ratio of the actual number of epochs observed in a certain period of time to the number of epochs in which a cycle slip occurs. The data utilization represents the ratio of the actual number of epochs to the theoretical number of epochs observed by the GPS receiver. In reality, due to the effects of cycle slips and elevation angle changes, observations will be interrupted, leading to missing data. The cycle slip and data utilization are mainly used to reflect the antijamming capability of satellite-borne GPS receivers. These two indicators can be used to evaluate the performance of the HY2_Receiver.
Table 5.
Data quality assessment of HY-2C.
In Table 5, the MP1 values are all smaller than 20.0 cm, and the MP2 values are all smaller than 17.0 cm. Additionally, the variations in MP2 are smaller than those in MP1, which indicates that the observations of the band are more susceptible to the influence of multipath effects. As shown in Table 5, the utilization of HY-2C satellite-borne GPS observations is higher than 98% on days except DOY 349 in 2020. The utilization of satellite-borne GPS observations is higher than 99.9% over these 5 days, starting from DOY 350 in 2020. The utilization indicates that the HY2_Receiver operates normally in orbit. When the completeness of observations is normal, the cycle slip is small, which generally indicates that the multipath error and IOD error of GPS observations are large [49].
3.1.2. Ionospheric Delay
A geometry-free combined LEO satellite carrier phase can be expressed as [50]:
where ; is IOD, ; represents the observed value of the carrier phase; and and represent the wavelength of and integer ambiguity of , respectively.
The differences between the combined observations of two consecutive epochs can be obtained by:
When there is no cycle slip, the difference in ambiguity between two consecutive epochs is 0, and Equation (10) is called the ionospheric residual combination. Under normal circumstances, the IOD residual curve is smooth, but when the ionospheric residual error changes significantly in a short period of time, cycle slip may occur [13]. The corresponding expression of the rate of IOD change is:
where .
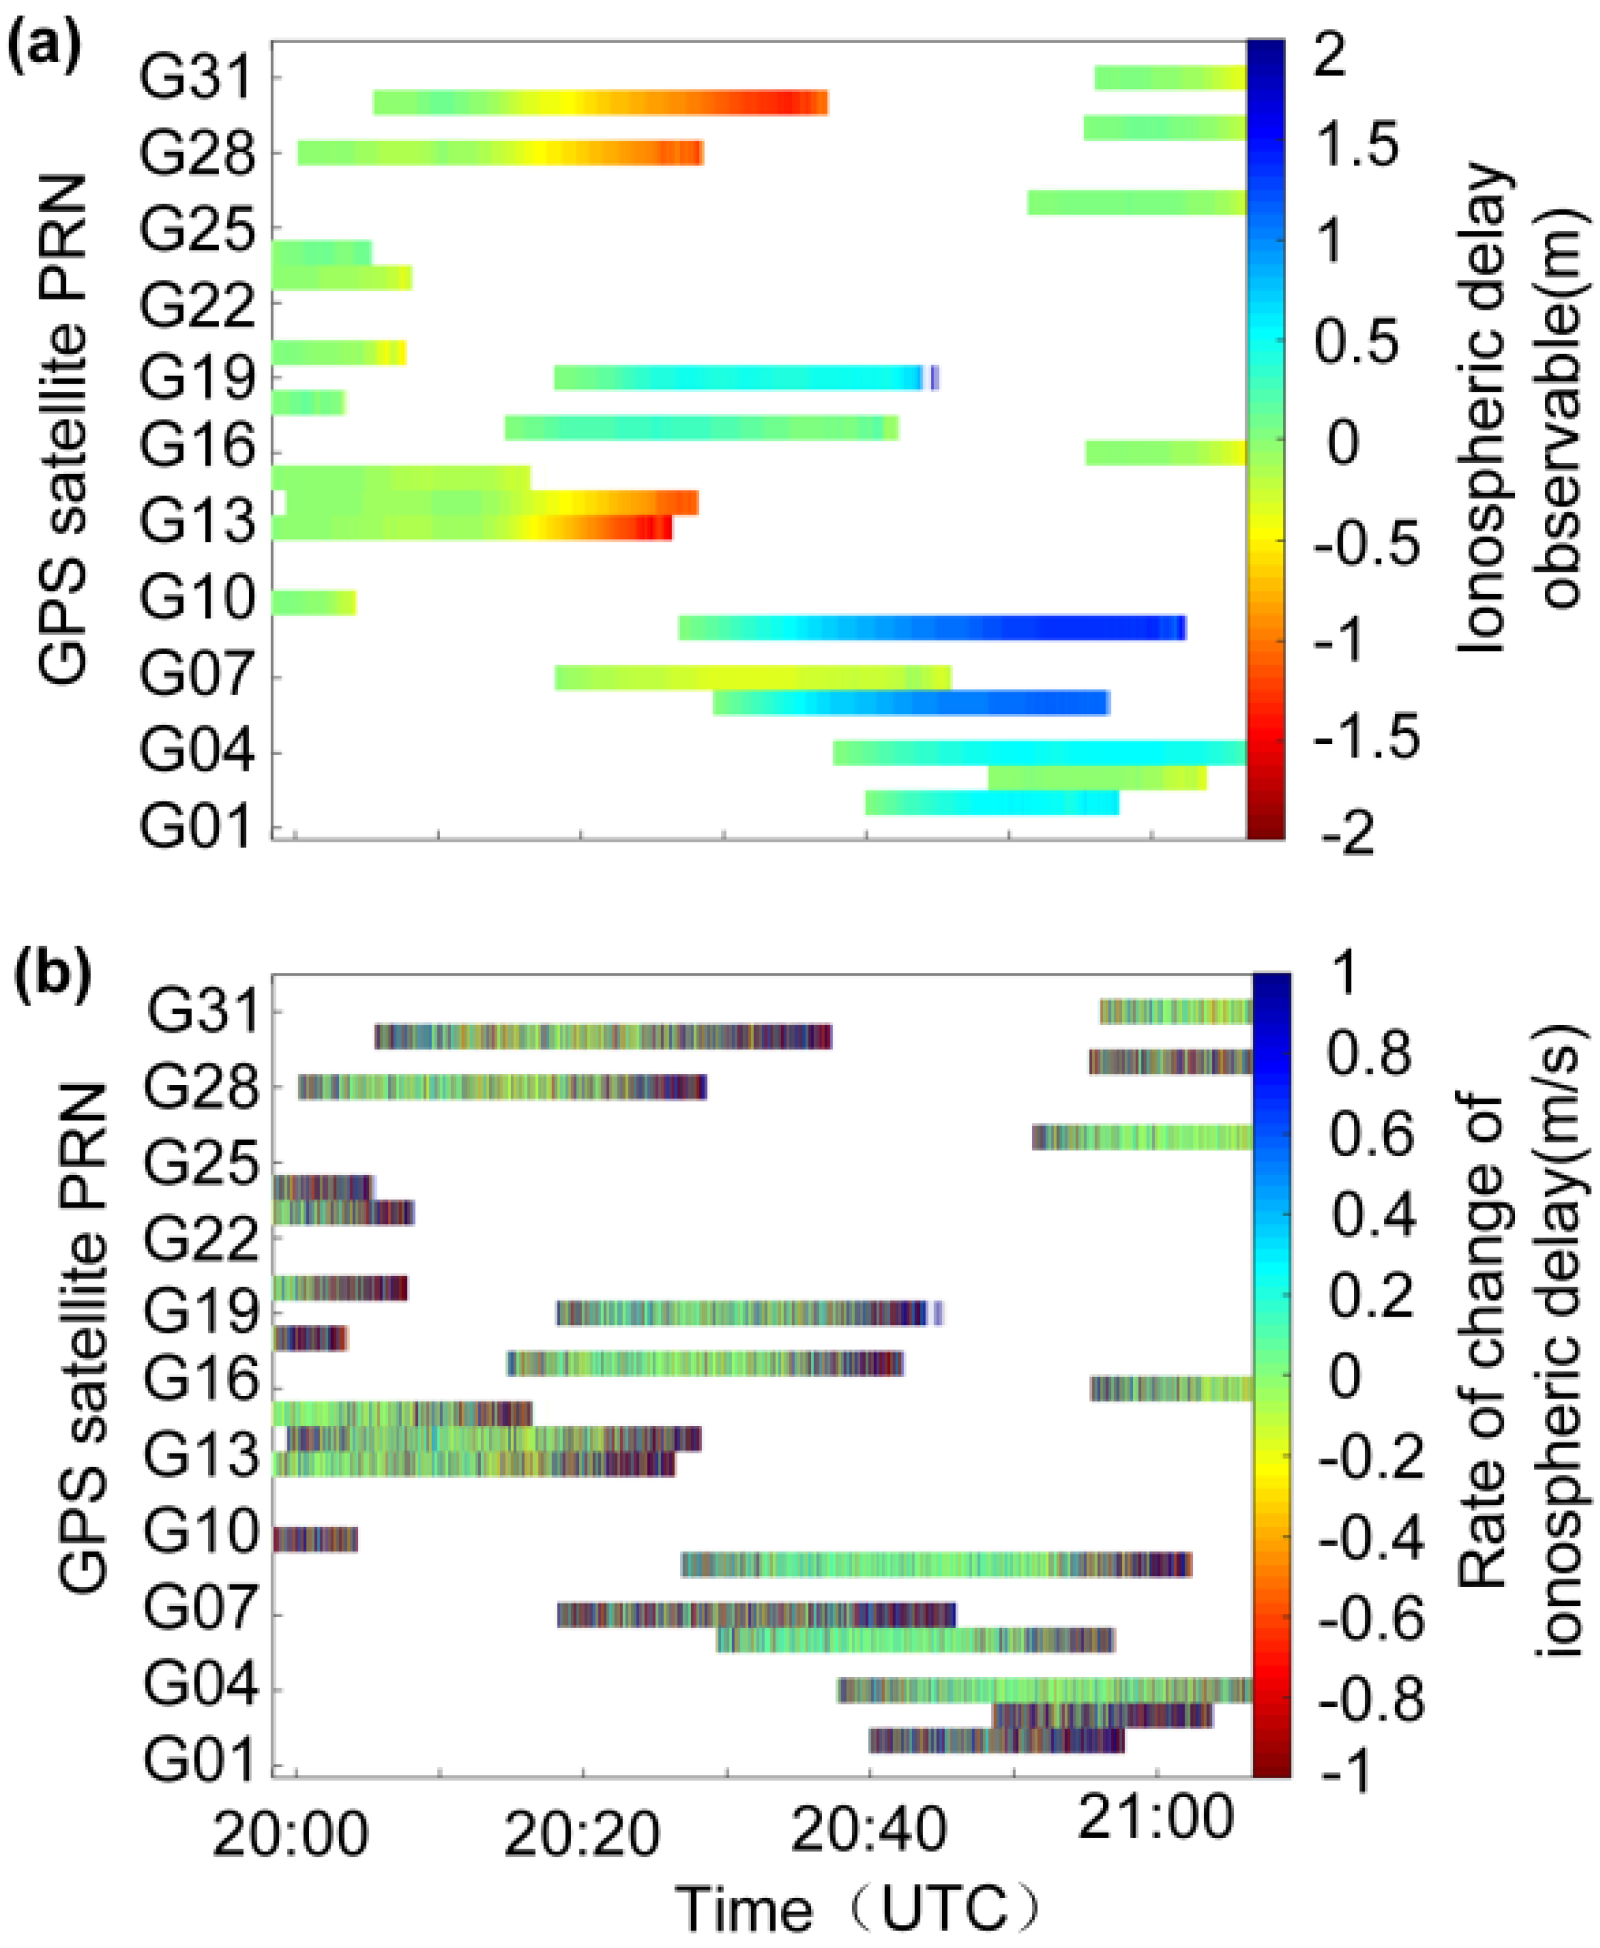
Equation (10) is used to calculate the IOD residuals, and Equation (11) is used to calculate the rate of IOD change. A 24-hour window will make the picture too dense to clearly show the variation, so the time period (20:00–21:20) is chosen on DOY 348 in 2020 to highlight the variations. Figure 3a shows the IOD residuals in the selected time span, and Figure 3b shows the rate of IOD change in the selected time span. Figure 3a shows that most of the IOD residuals remain at low levels. However, from 20:20 to 20:40, the residual values of the G13, G14, G28 and G30 satellites are large, and from 20:30~21:00, the residuals of the G06 and G09 satellites are large. The colour of the rate of IOD change significantly darkens at the end of a period of data collection. Studies have shown that the discontinuity of carrier-phase data and the occurrence of abnormal values will cause this phenomenon [27].

Figure 3.
IOD residuals and rate of IOD change on DOY 348 in 2020 (a) IOD residuals, (b) rate of IOD change.
3.2. Assessment of Orbit Accuracy
Before performing satellite orbit determination, it is necessary to consider issues related to the phase centre of LEO satellite antennas. Onboard GPS observations are based on the distance from the instantaneous phase centre of the GPS satellite antenna to the instantaneous antenna phase centre at the time the signal from the LEO satellite is received; additionally, the reference point of the precise orbit of the LEO satellite is the centre of mass. Generally, the mean antenna phase centre (MAPC) and the antenna reference point (ARP) do not coincide, and the deviation is the PCO. Due to antenna manufacturing deviations and because LEOs are affected by the environment during operation, the GPS signal centre will change. The deviation between the instantaneous phase centre and the average phase centre is PCV, which is a function of the elevation and azimuth angle between the LEO and GPS satellites [51].
Carrier-phase residual analysis, overlapping orbit comparison, PSO comparison, and SLR range validation are used to validate the accuracy of the RD orbit of HY-2C. The first two methods are used to establish internal validation, and the latter are used to establish external validation.
3.2.1. Effect of PCV and PCO on Orbits
In this study, satellite-borne GPS data are selected to estimate PCO and PCV in orbit over 7 days, starting from DOY 348 in 2020 [25]. Due to the high coupling of PCO and PCV, they cannot be estimated at the same time. PCO is substituted into the observation equation as an unknown parameter and the orbital parameters are estimated at the same time [52]. According to the principle of least squares, PCO is calculated for multiple days, and the average is taken as the final corrected value [53]. Similarly, the PCV values are estimated at each grid point. This method is not susceptible to the influence of factors such as receiver clock error and ambiguity among parameters [54,55].
To systematically validate the impacts of PCO and PCV on orbit determination, three schemes are designed: Scheme 1 does not use PCO and PCV information; Scheme 2 only uses PCO information; and Scheme 3 uses PCO and 10° × 10° PCV information. Figure 4 shows the 10° × 10° PCV model estimated in the satellite GPS antenna coordinate system.
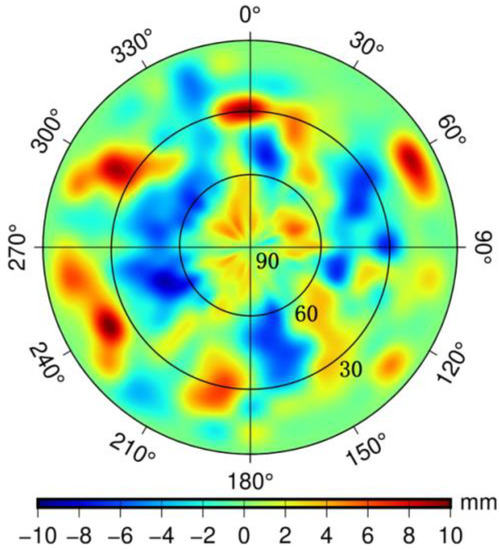
Figure 4.
Azimuth-elevation maps of the PCV model of the HY-2C (10° × 10°).
Satellite-borne GPS data are used to estimate the PCV model for the antenna of the HY2_Receiver, and the direct method of estimating PCV is characterized by a more refined model than that for PCV. Suppose each grid point is unknown, we calculate the value of the grid with the orbital parameters directly. The PCV map of HY-2C uses a scale of −10 to 10 mm, but with extreme values of −9.09 mm and 10.37 mm. In Figure 4, we can find that when the elevation angle is small (from 0° to 30°), most of the absolute values of the PCV are small, but there are also large, speckled values with some empty values; when the elevation angle is between 80° and 90°, there will also be a phenomenon of empty values, although they are not obvious. So, the resulting model is more refined, and the map illustrates a spot-like distribution.
The above three schemes are used to determine satellite orbits. Table 6 lists the results of the three types of orbits compared with PSO in the R, T and N directions within 7 days. 3DRMS is used to evaluate the different orbit results.
Table 6.
Residuals between RD orbit and PSO in different orbit determination schemes within 7 days.
The accuracy of PSO in the R direction of this orbit is better than 0.015 m [40]. The report from CNES indicates that the ambiguity fixation efficiency of GPS observations for the PSO of HY-2C is as high as 99%, which reflects the excellent performance of China’s domestic satellite-borne GPS receivers.
When comparing the RD orbit with PSO, it is necessary to consider unifying the RD orbit and PSO to the time system. Since the time system of PSO for HY-2C provided by CNES is International Atomic Time (TAI) while the RD orbit relates to GPS time (GPST), there is a 19 s deviation between TAI and GPST, i.e., . It is necessary to preprocess the PSO in advance and convert the time system of PSO to that of GPST to facilitate comparisons.
For Scheme 2, decreases of 0.002 m in the R direction, 0.007 m in the T direction, and 0.004 m in the N direction are observed compared with the residual results for Scheme 1. When taking into account PCO corrections, the error in orbit estimation is reduced, and the orbit accuracy is effectively improved. The accuracy of the orbit increase in the T direction is significantly higher than that in the other two directions. A comparison of Scheme 2 and Scheme 3 indicates that the RMS values for Scheme 3 are 0.001 m smaller in the R direction, 0.001 m in the T direction, and 0.001 m in the N direction than those for Scheme 2; additionally, the orbit accuracy is improved after the PCV model is introduced, but the model range is limited. This result is mainly because the PCO parameters estimated at the same time as the dynamic parameters effectively limit the systematic errors in the residuals of the observations, and PCV is relatively small for the corrections of observations.
Compared to Scheme 1, the accuracy of orbit obtained for Scheme 2 and Scheme 3 is improved, and 3DRMS decreases from 0.034 m to 0.027 m and then to 0.025 m, which is attributed to the improvement in the tangential orbit accuracy.
In summary, based on the RD orbit and PSO comparisons, the RMS of the orbital residual in the R direction is 1.0 cm, 2.0 cm in the T direction, and 1.1 cm in the N direction, and the 3DRMS result is 2.5 cm. The HY-2C RD orbit determination method yields the highest accuracy in the R direction and the worst accuracy in the T direction.
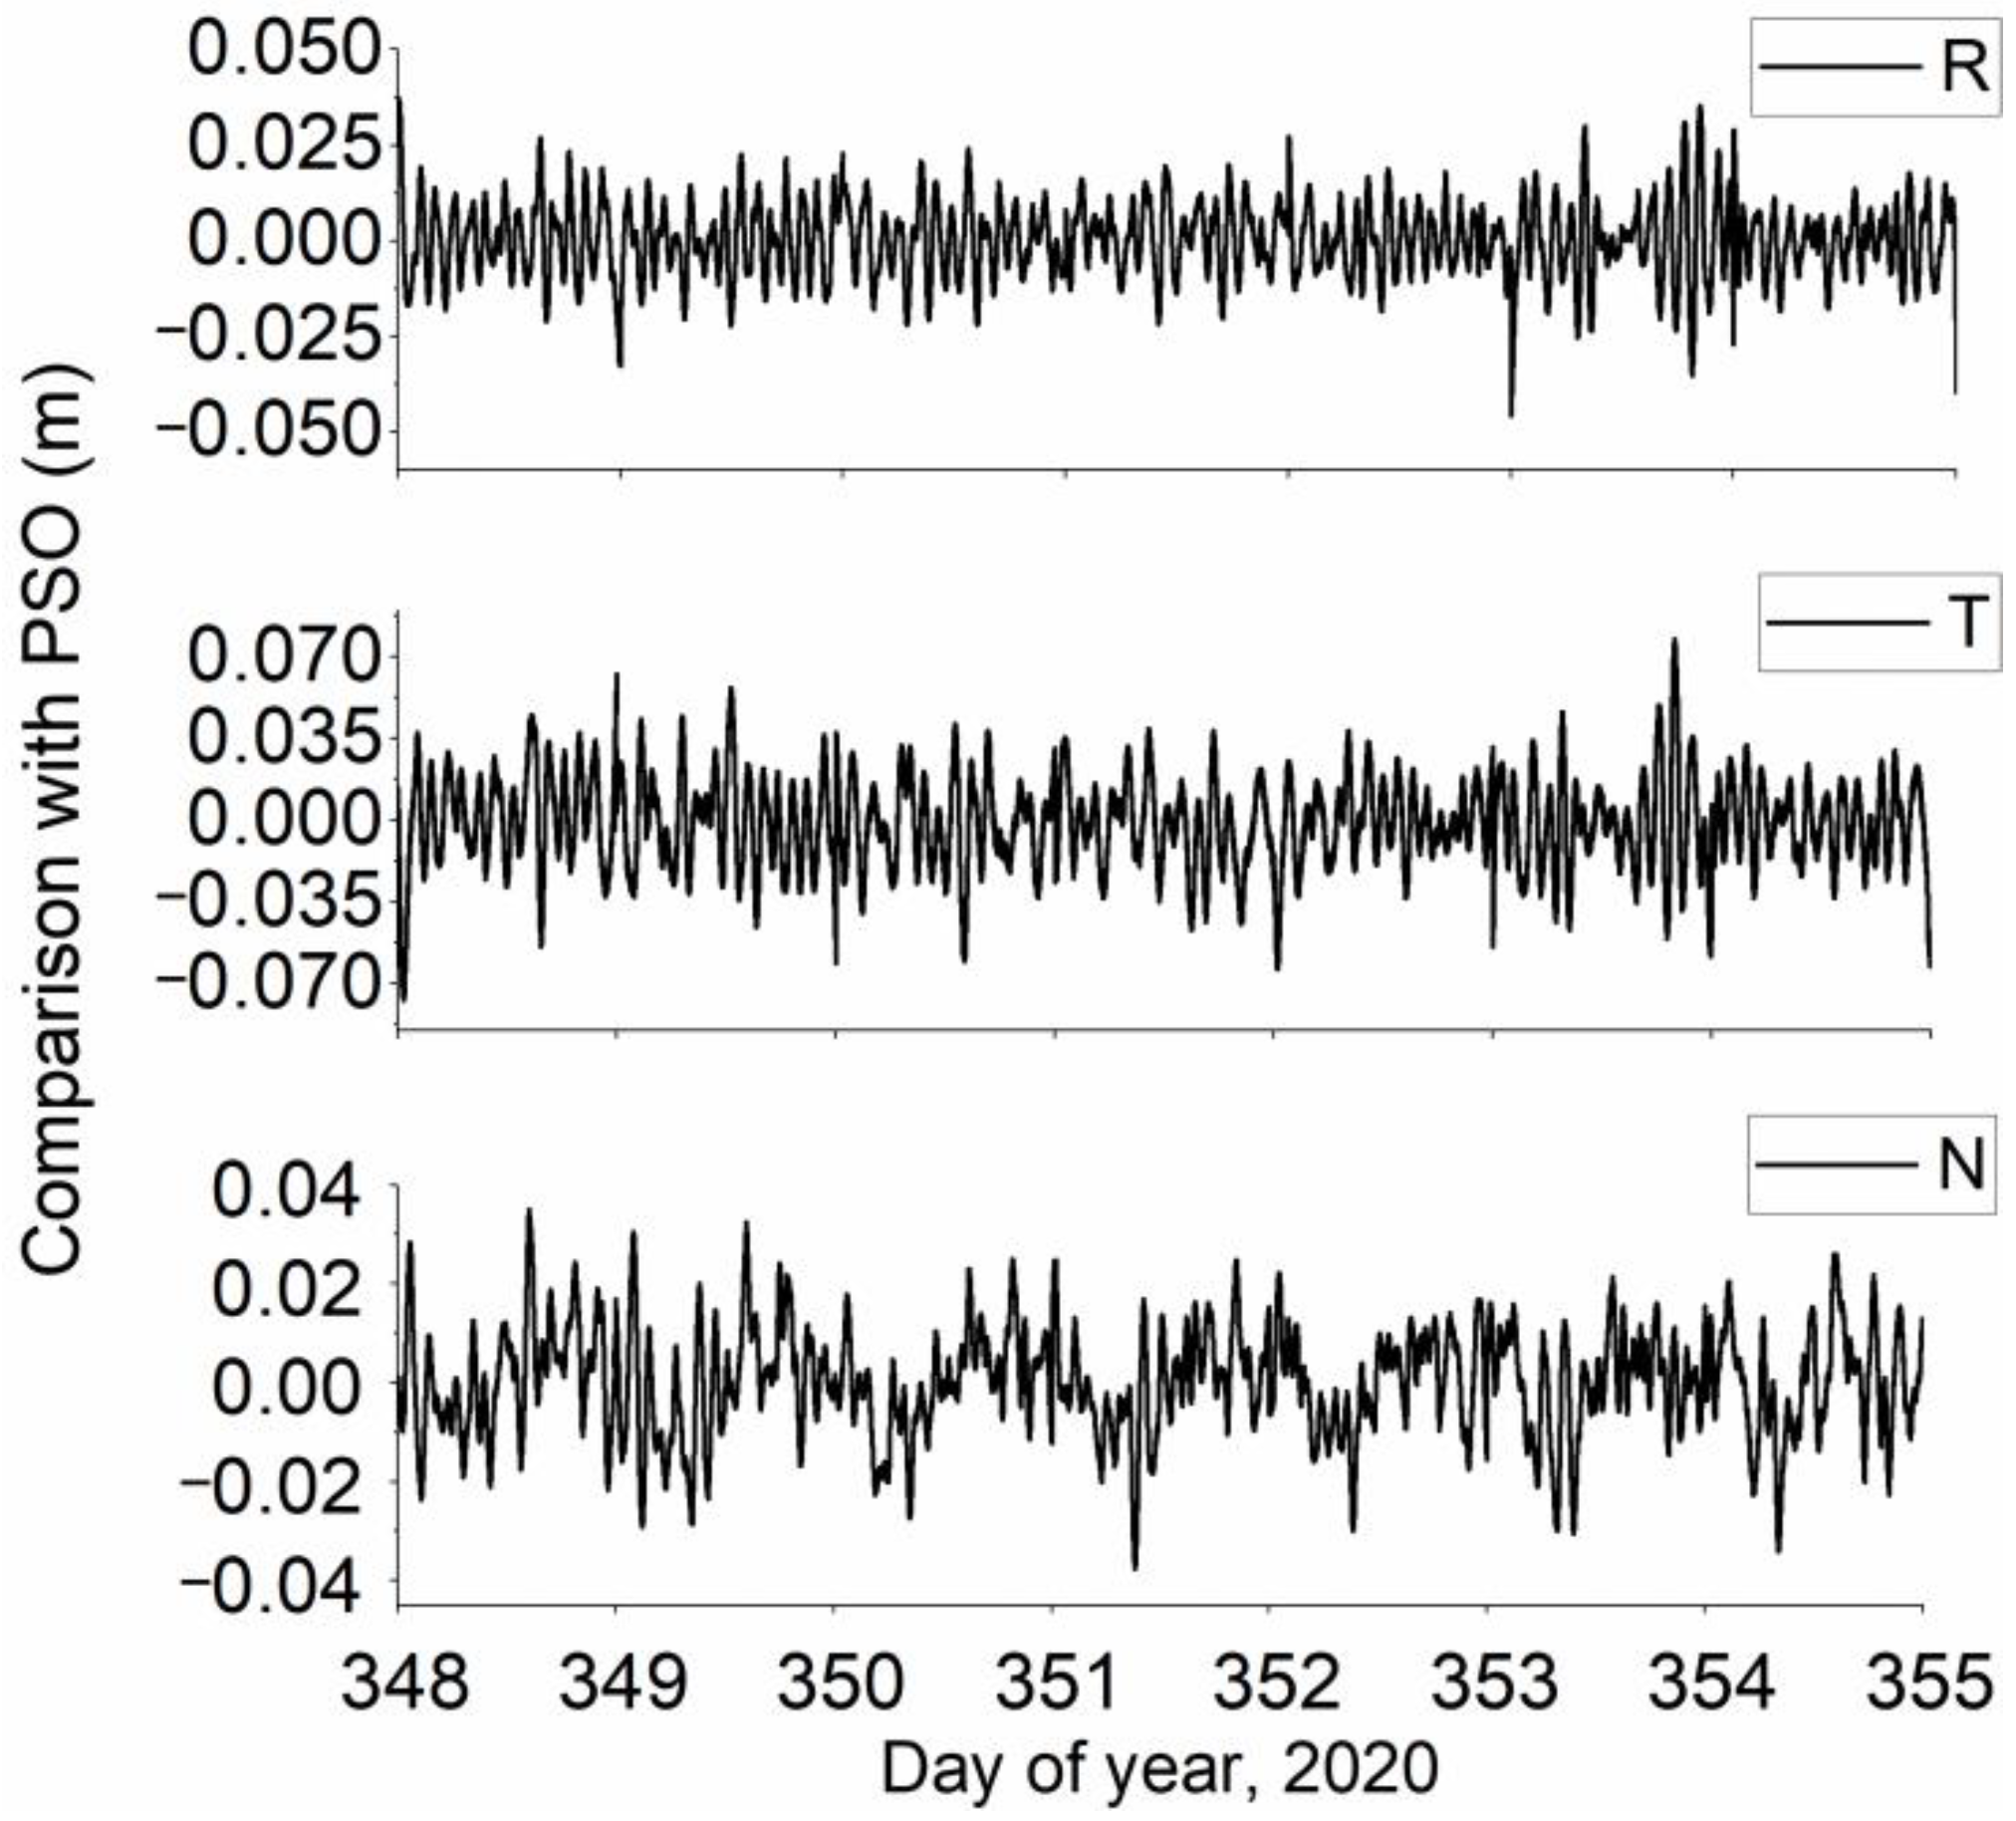
The result of comparing the RD orbit with PSO is plotted as a dashed line, as shown in Figure 5.
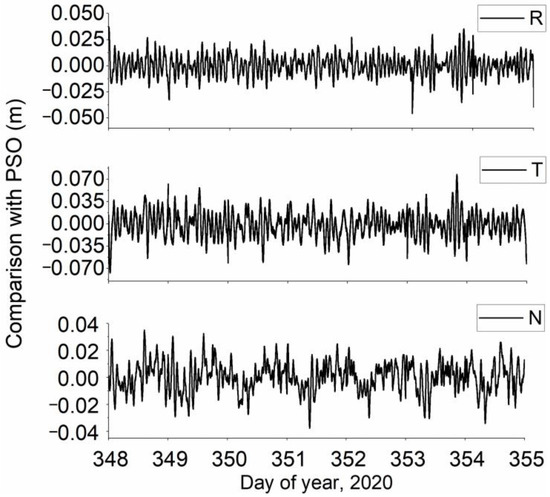
Figure 5.
Line chart of orbit residuals from the PSO comparison within 7 days.
Figure 5 shows that the residuals are in the ranges of ±0.04 m in the R direction, ±0.09 m in the T direction, and ±0.05 m in the N direction. The residuals display obvious fluctuations at 0 h and 24 h every day because when HY-2C uses the RD method for orbit determination, the constraints at both ends of the orbit determination arc are relatively weak, resulting in obvious boundary effects. The obviously extreme values show up because the pseudostochastic pulse parameters fail to capture the influence of errors, such as those associated with atmospheric drag and solar radiation pressure. Additionally, the RMS of the residuals for the RD orbit and PSO comparison is plotted as a histogram, as shown in Figure 6.
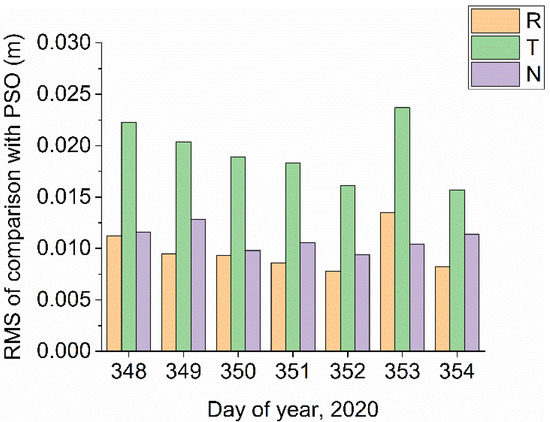
Figure 6.
Histogram of residuals from the PSO comparison.
From the results of the RD orbit comparison with PSO, as shown in Figure 6, the RMS value of the difference in the R direction is worse than that in the N direction on DOY 353 in 2020. The RMS values in the R direction on the other 6 days are less than those in the N direction, and the residuals exhibit the largest RMS value in the T direction.
3.2.2. Analysis of Carrier-Phase Residuals
For RD orbit determination, the carrier-phase residuals include modelled errors and nonmodelled errors. Actual PCV values are subtracted from modelled PCV values, and the difference between the two is directly reflected in the linearization after the phase residual is calculated. When the observation model and dynamical model used in LEO POD are extremely consistent with the actual conditions, the carrier-phase residuals are the observation’s noise level. The RMS value of the carrier-phase residuals using an ion-free combination can be used as one of the indicators in internal compliance accuracy evaluation [51,56].
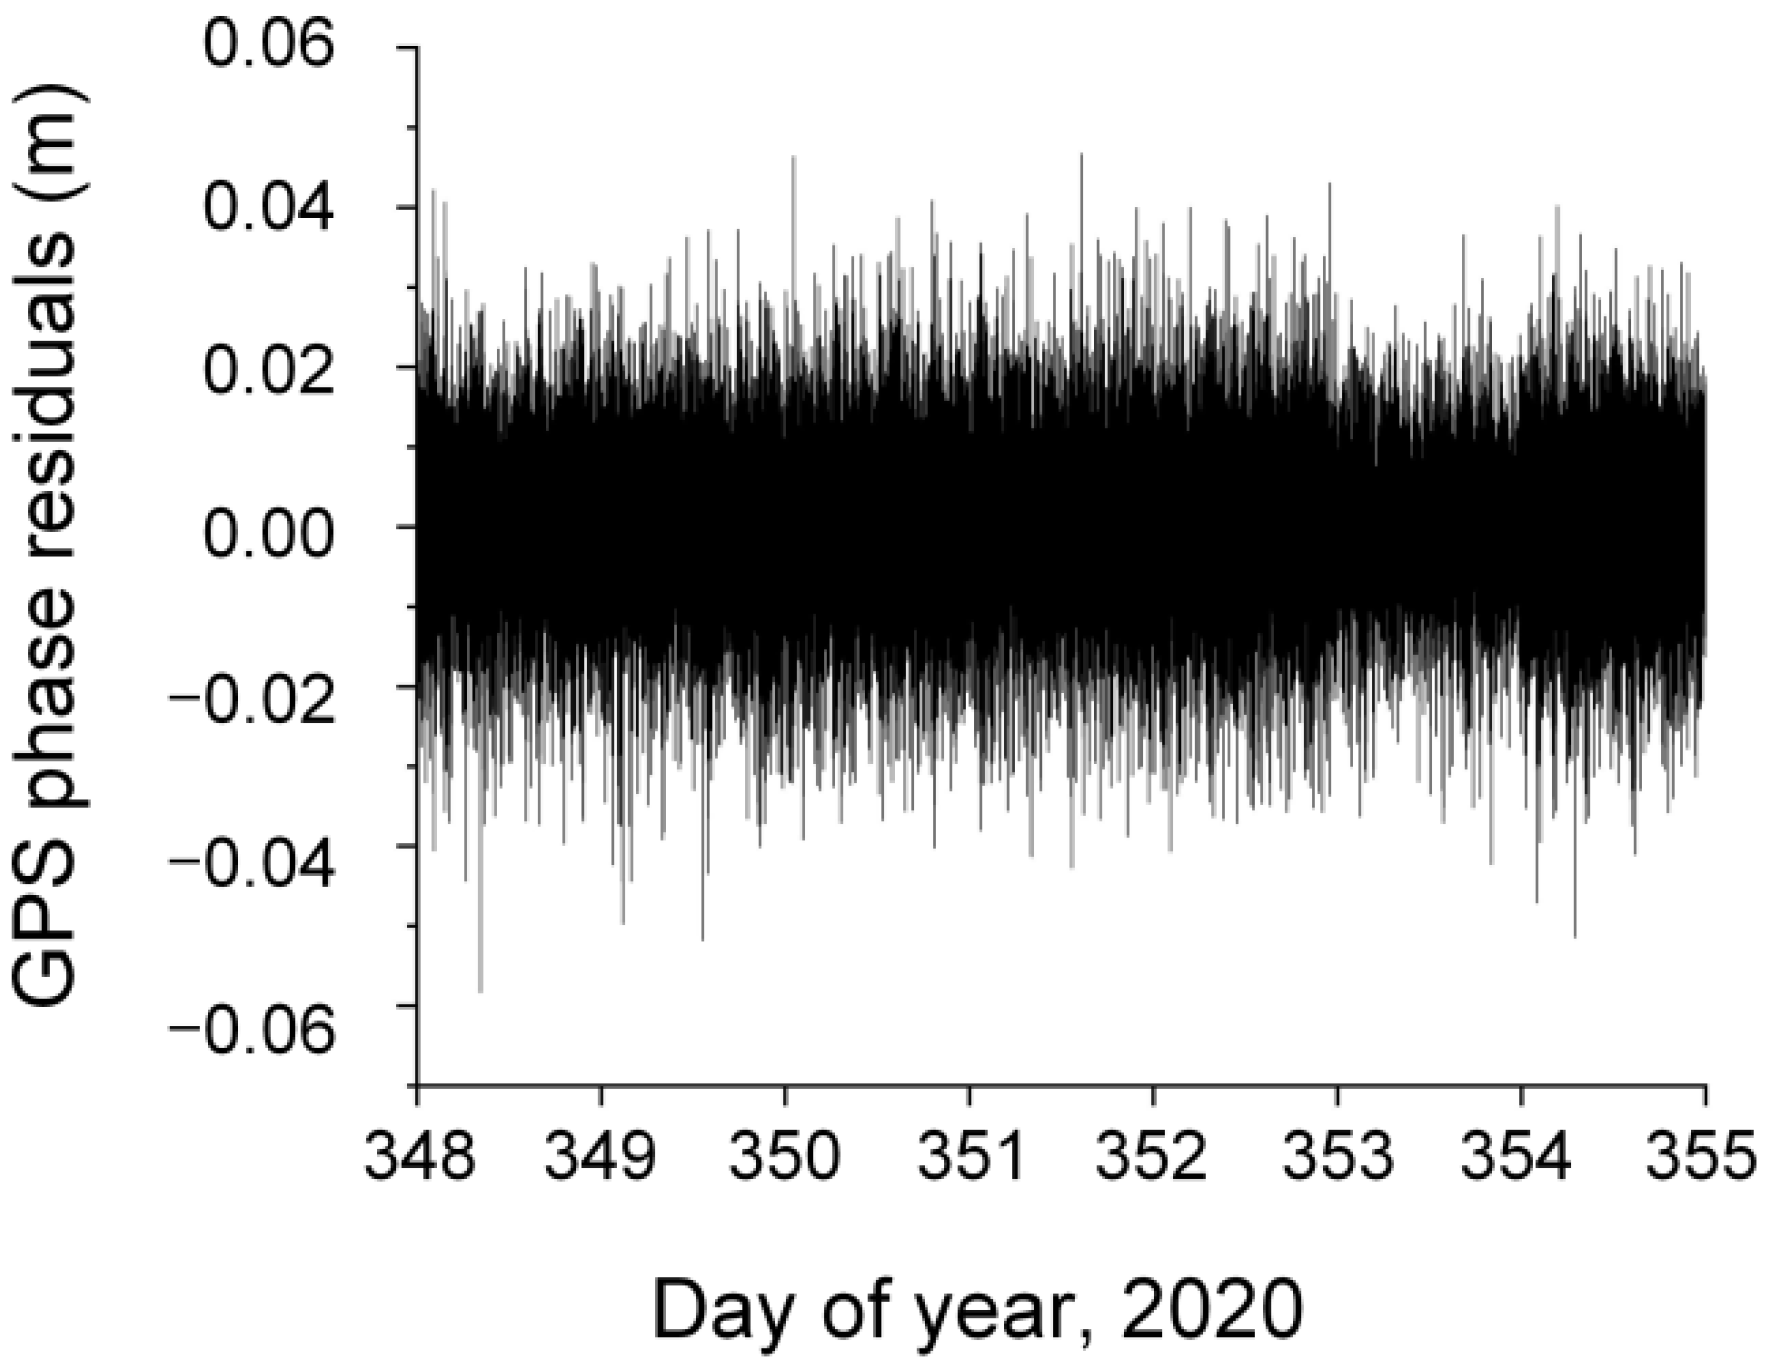
The carrier-phase residuals are calculated over 7 days, starting from DOY 348 in 2020. The carrier phase residuals of all GPS satellites are plotted in Figure 7, and summaries are given in Table 7.

Figure 7.
Phase residuals.
Table 7.
Phase residual summary statistics.
As shown in Figure 7, the residuals of the carrier phase within 7 days fluctuate between −0.06 and 0.05 m, and the residuals are mostly distributed within ±0.02 m, and the residuals fluctuate little, with stable changes. Table 7 suggests that the average RMS value of the 7-day carrier-phase residuals is about 0.008 m. The carrier-phase residual analysis indicates that the HY-2C RD orbit determination strategy is reliable; additionally, data preprocessing can effectively weaken the influence of the cycle slip of the phase data and the RD orbit accuracy obtained is high.
3.2.3. Overlap Validation Accuracy
If both the observation model and the dynamical model can correctly reflect satellite orbit characteristics, the satellite orbits of the two arcs of the orbit determination should exhibit high consistency. Due to the errors in the actual orbit determination based on observations and the model used, the results of comparisons can be used to validate the accuracy of orbits, although the systematic error of orbit determination cannot be detected through the comparison of overlapping orbits [57]. Two separate orbit determination processes are used to calculate the satellite orbits corresponding to two different time periods. The first part of the arc is 0~18 h, the second part of the arc is 12~24 h, and the overlapping time of the two arcs is 6 h. Taking DOY 348 in 2020 as an example, Figure 8 shows the residuals of the orbit comparison during the overlapping period.
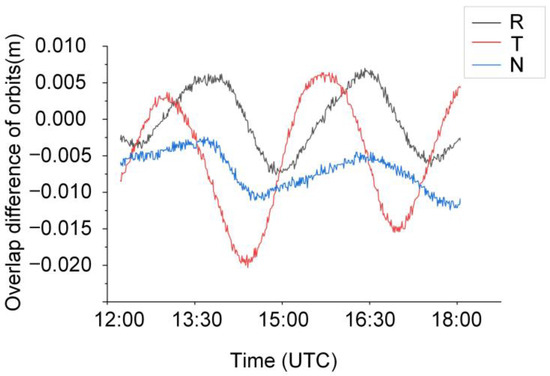
Figure 8.
Residuals of overlapping orbits on DOY 348 in 2020.
As shown in Figure 8, the residual fluctuates between −0.0075 m and 0.0075 m in the R direction, between −0.02 and 0.0075 m in the T direction, and between −0.0125 and 0.0025 in the N direction. The results of comparing the overlapping orbits on DOY 348 in 2020 indicate that the orbits display large fluctuations in the T direction and small fluctuations in the N direction. Figure 9 shows the RMS value of the comparison.

Figure 9.
RMS of residuals of overlapping orbits.
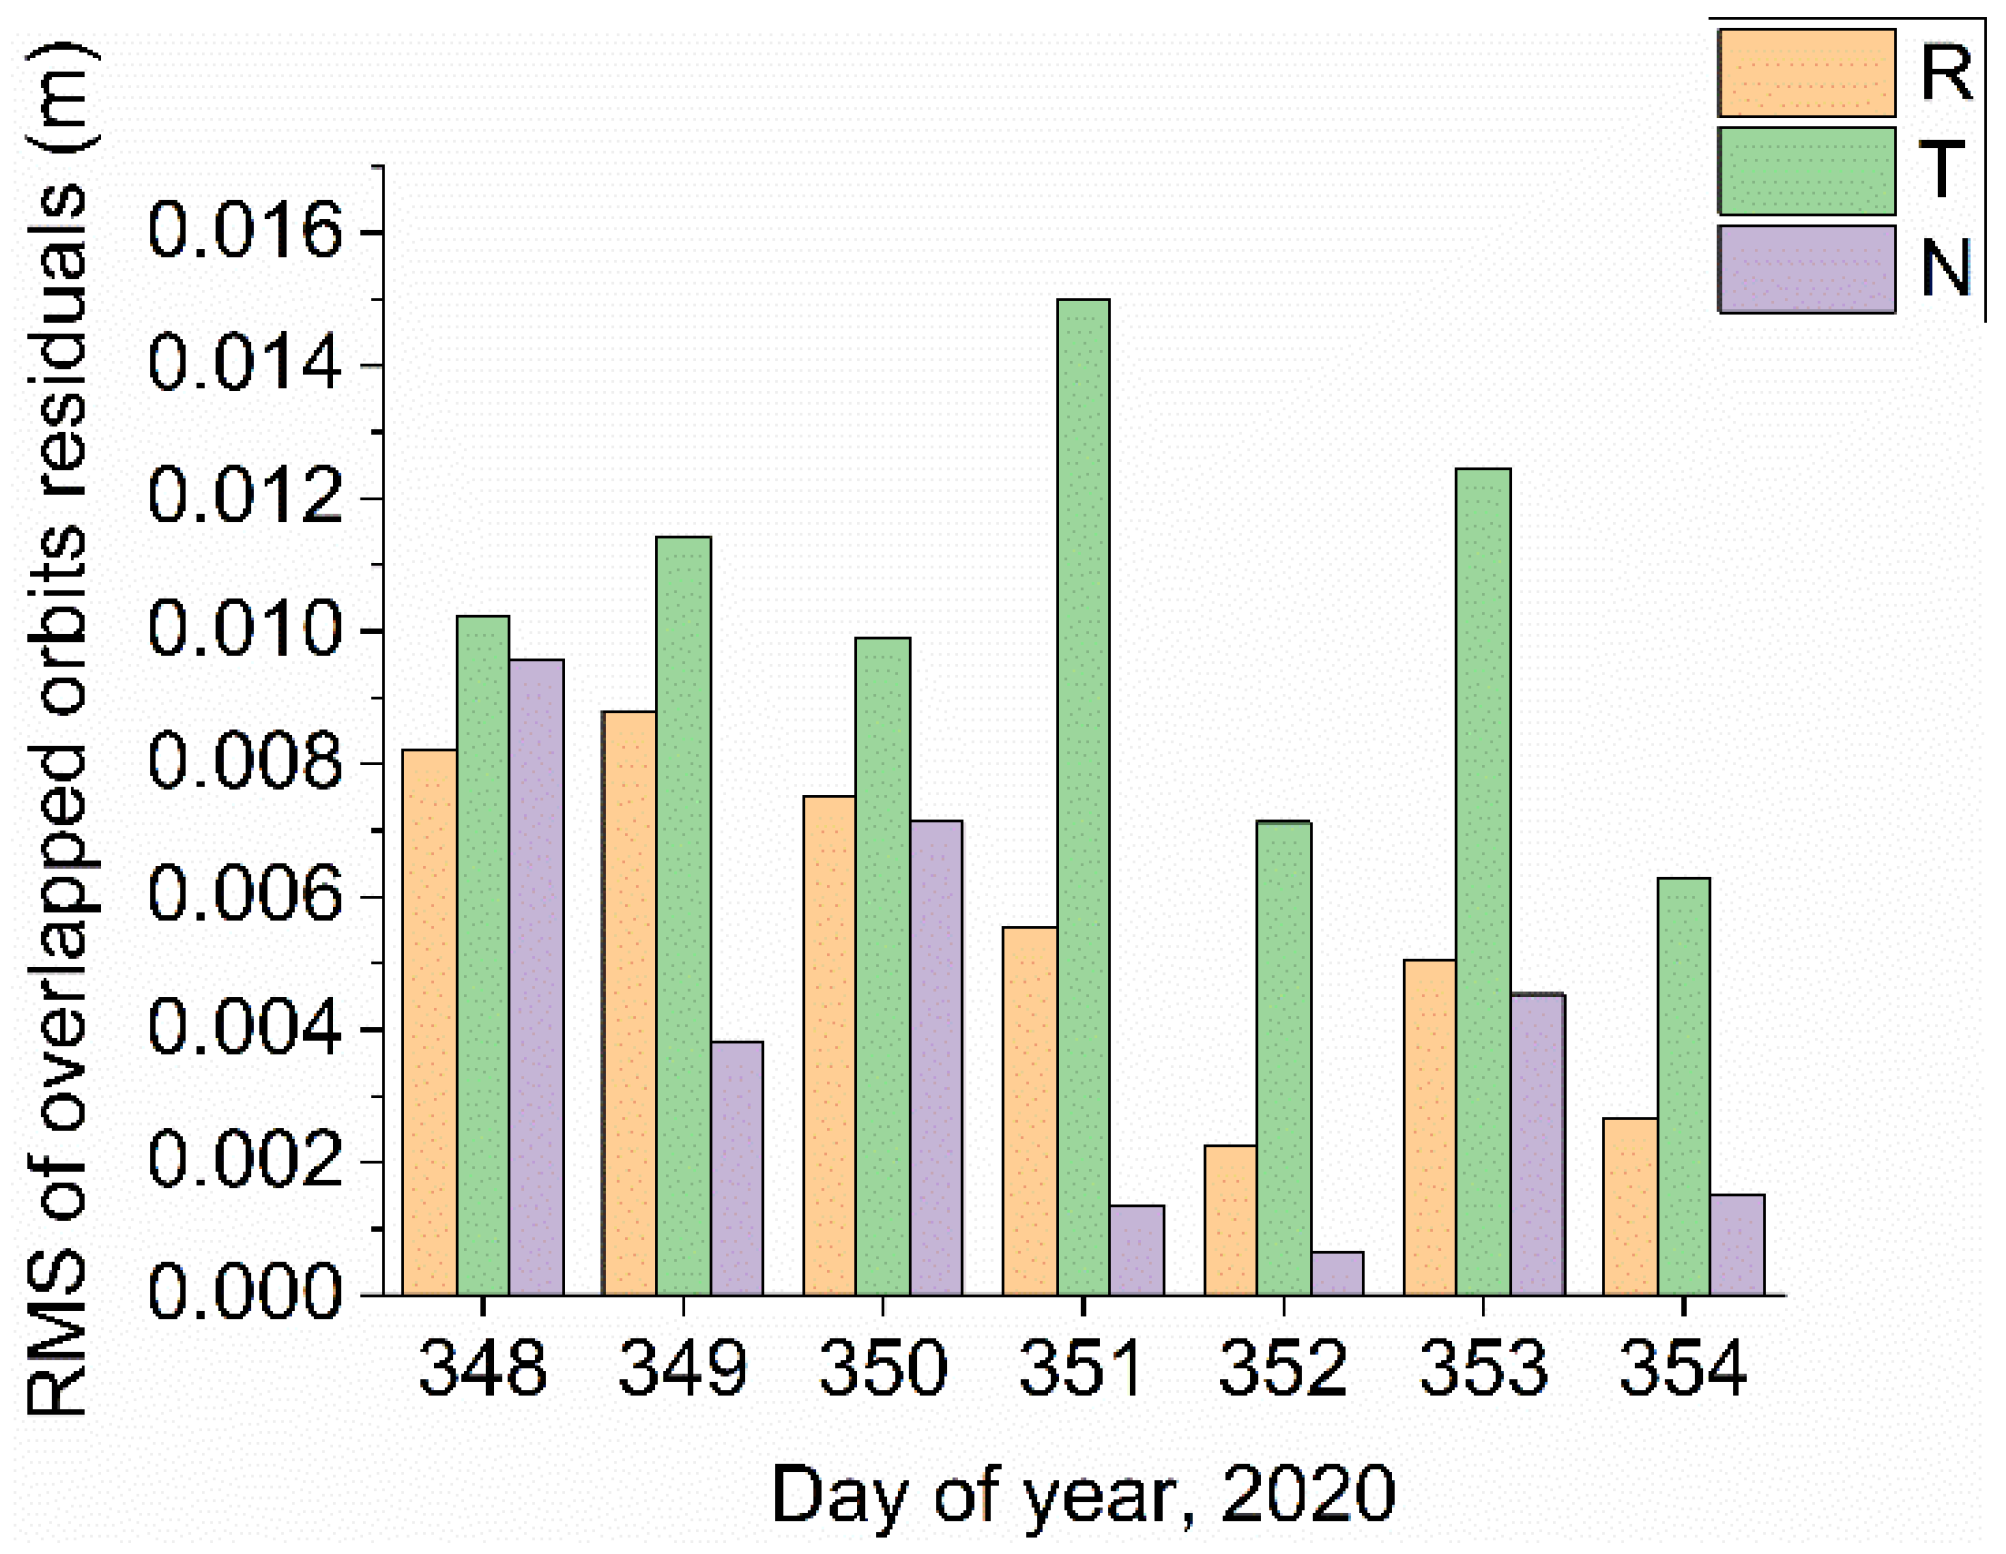
As shown in Figure 9, the RMS values of overlapping orbits in the T direction are larger than those in the other two directions, indicating that the overlapping orbit comparison results are the worst in the T direction. The RMS value of the overlapping orbits in the R direction is larger than that in the N direction, except on DOY 348 in 2020. The RMS values in the R direction on the other 6 days are all greater than the RMS values in the N direction. Detailed information on the comparison is given in Table 8.
Table 8.
Summary statistics for the residuals of overlapping orbits within 7 days.
As shown in Table 8, the maximum difference between the overlapping orbits is 0.042 m in the R direction, 0.031 m in the T direction, and 0.011 m in the N direction; additionally, the RMS value of the 7-day overlapping orbit difference is 0.006 m in the R direction, 0.011 m in the T direction, and 0.006 m in the N direction. The RMS value in the three directions is approximately 0.01 m.
3.2.4. SLR Range Validation
SLR range validation uses LEO satellite coordinates from RD orbits and SLR station coordinates to calculate the distance between stations and LEO satellites, and compares the result with the observations of SLR stations in the corresponding epoch to evaluate the accuracy of the RD method for orbit determination [58]. When conducting SLR range validation, it is necessary to consider the influence of tidal corrections (including ocean tides, solid-earth tides, and polar tides) and plate motions at stations [4]. The correction of observations mainly includes tropospheric delay correction, general relativity correction, centroid compensation correction and station eccentricity correction [59].
SLR observations are used to independently check the RD orbit accuracy of HY-2C. According to [60], the coordinates of SLR stations are based on the Station Location Reference Frame (SLRF) 2014, and relevant data can be obtained at https://ilrs.gsfc.nasa.gov/network/site_information/index.html (accessed on 2 June 2021). The elevation cutoff angle is set to 10° [61] and the tropospheric delay error can be modelled [59].
The report provided by the CNES states that during the period from October 2020 to April 2021, the core stations participating in the HY-2C SLR observation mission included those numbered 7090, 7105, 7810, 7839, 7840, 7941, 7119, and 7501. Among them, few high-elevation-angle observations are available [40]. From DOY 348-DOY 354 in 2020, two of the eight core stations had no data (Station 7501 and Station 7839). In addition to these six SLR core stations, nine SLR stations provided data for validation. Figure 10 shows the flight trajectory of HY-2C and the distribution of stations.
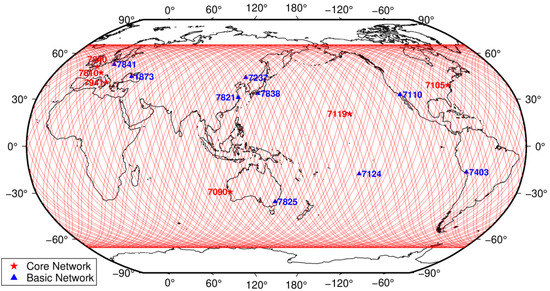
Figure 10.
Satellite trajectory and SLR station distribution map.
As shown in Figure 10, the red stars indicate SLR core stations that participated in the laser ranging of HY-2C, and the blue triangles indicate other stations used in the laser ranging of HY-2C.
The range residuals between the SLR NP data and the range differences between HY-2C RD orbit and the ground station coordinates were calculated. The SLR range validation results were plotted as a histogram, as shown in Figure 11. Table 9 lists the statistical results for SLR range validation for HY-2C.
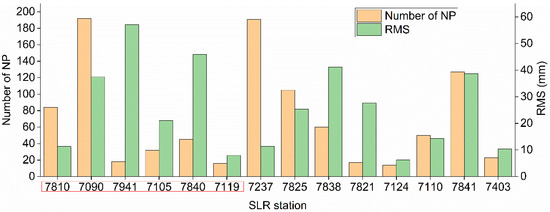
Figure 11.
RMS of SLR validation residuals.
Table 9.
Summary statistics for the residuals of SLR range validation.
As shown in Figure 11, the red boxes denote SLR core stations involved in the HY-2C laser-ranging observation mission. Among the six core stations, the RMS values of the stations except stations 7941 and 7840 are all less than 0.04 m. For the other eight basic stations, except stations 7838 and 7841, the RMS values are all less than 0.03 m, which indicates that the HY-2C orbit-determination results are stable.
From DOY 348 to DOY 354 in 2020, 15 SLR stations participated in the laser-ranging mission of HY-2C and observed 1009 normal points (NPs). The RMS value of residual validation for each SLR station was calculated, and the elevation cutoff angle threshold was set to 10°. The data for station 1873 were removed because of the small amount of station data (only four groups) available on DOY 348. Some observations were removed because of outliers. The number of excluded points was 35, and the total data removal rate was 3.5%.
As shown in Table 9, the RMS value of SLR range validation was 0.030 m. The experimental results showed that the performance of the HY-2C satellite-borne GPS receiver is stable, and the system produces high-quality data. Additionally, the accuracy of RD orbits is higher than 0.03 m.
3.2.5. Validation of Orbits with DORIS Data
In addition to using the above methods to verify the accuracy of RD orbit determination for HY-2C, the satellite orbit can also be validated by using onboard DORIS data.
During DORIS orbit validation, the 3.0 data format is converted to the 2.2 data format. Because of the large amount of phase data in the 3.0 format, only the phase observations at 10 s intervals are used [62].
A new validation method is proposed by using space-borne DORIS data. Because the DGXX receiver uses a specific channel to receive low-altitude data, the elevation angle is generally very low, resulting in inaccurate tropospheric delay calculations. Therefore, the elevation cutoff angle threshold must be set to 10°.
Through experimental tests, it is found that a discontinuity in the observations (that is, observation time intervals greater than 10 s) will cause abnormal values. In the designed DORIS validation algorithm, when the observations from a beacon station include a discontinuity in a certain epoch, the data from the four epochs before and after the discontinuity are eliminated. This approach leads to a reduction in the amount of data used, making the final validation result unreliable. When the results are calculated, it is necessary to exclude stations with insufficient data.
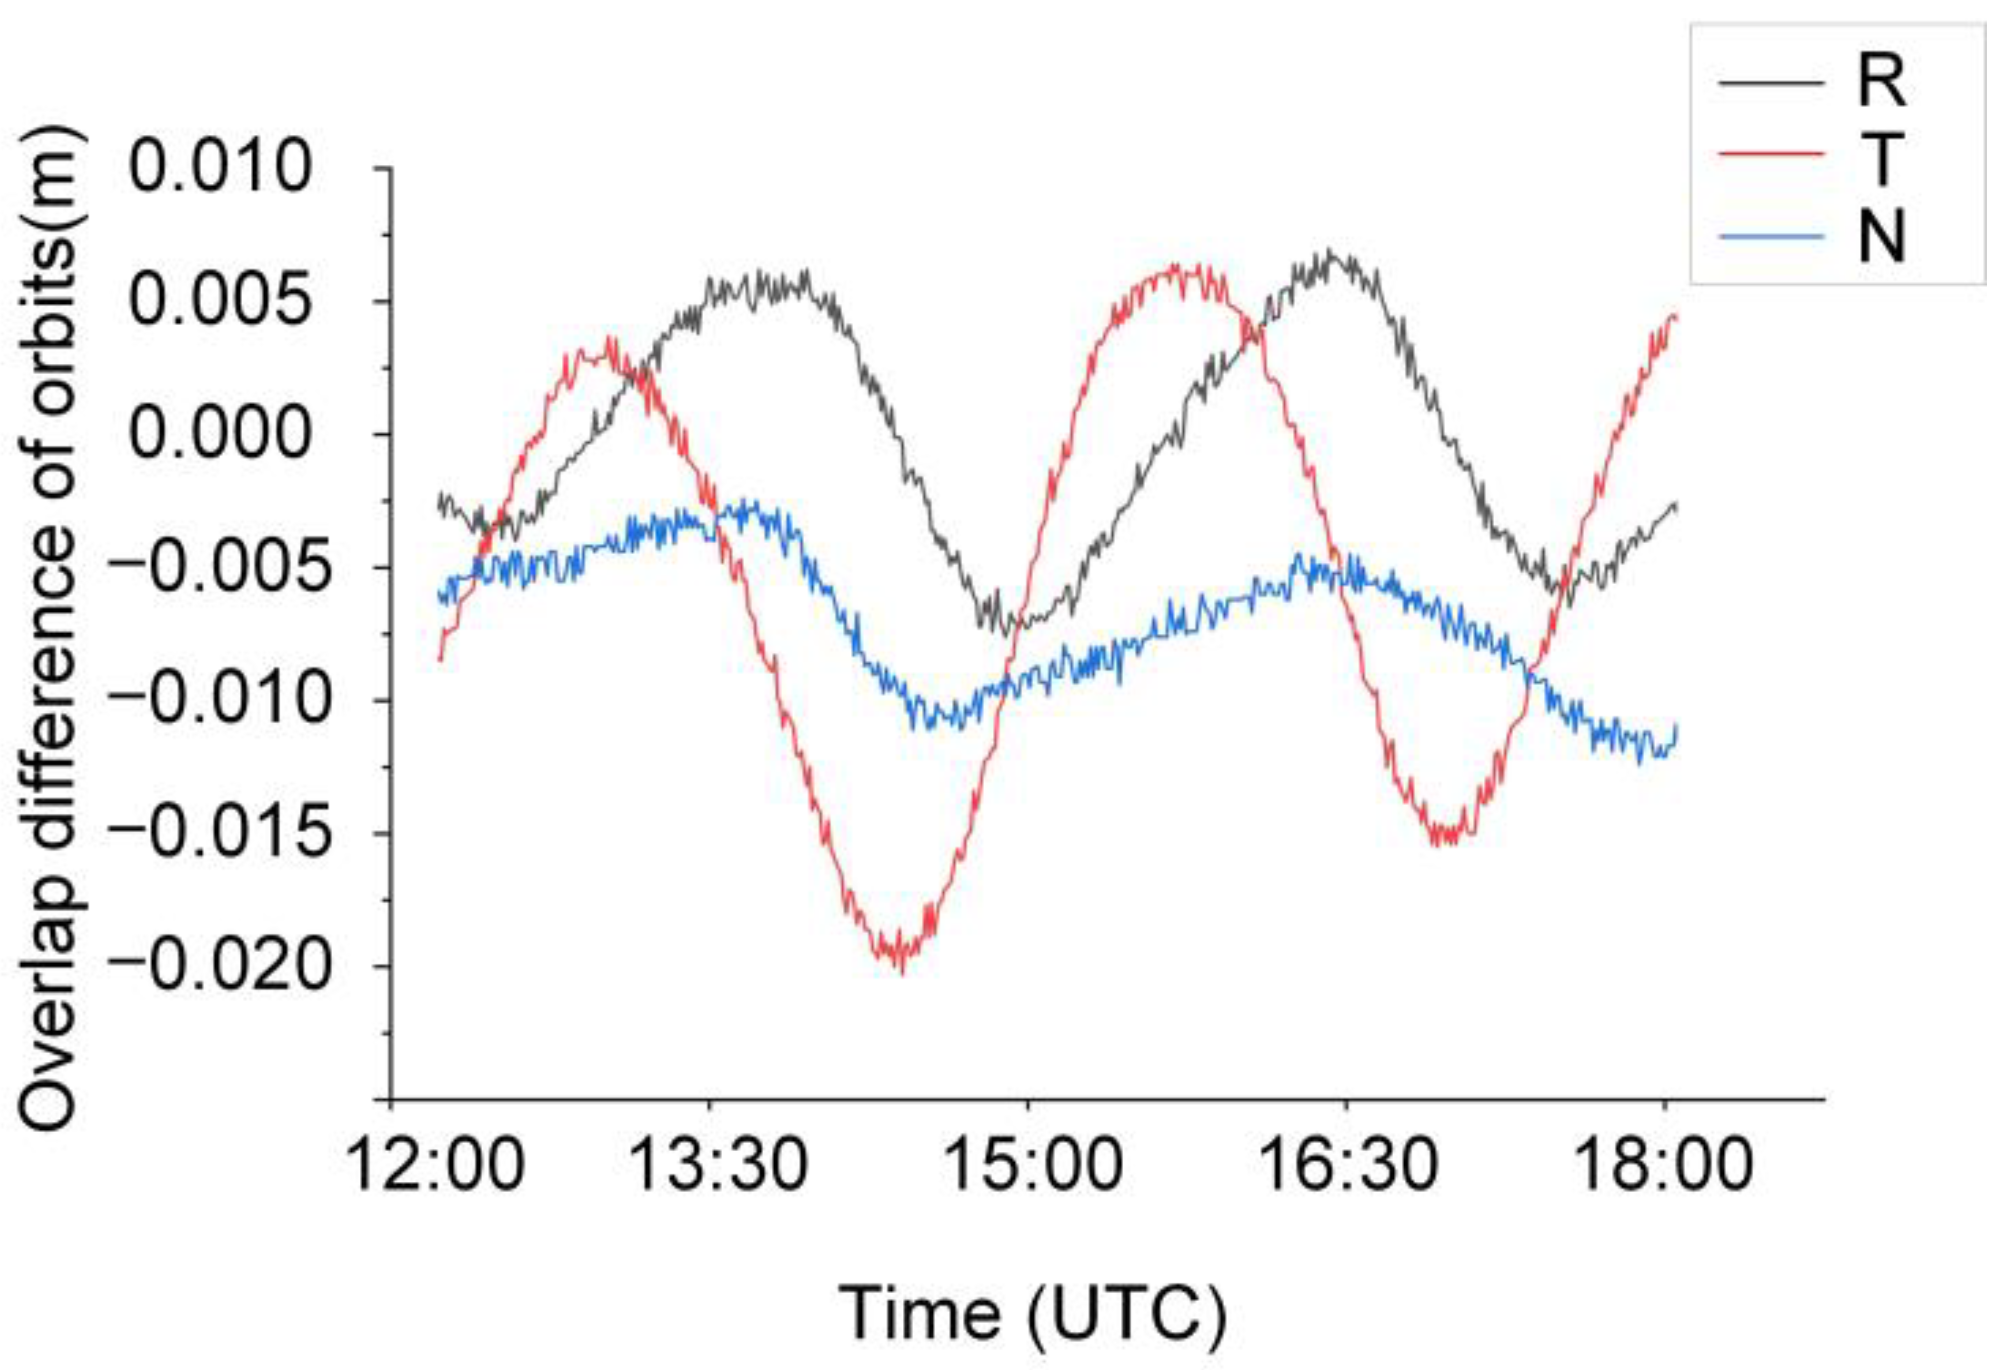
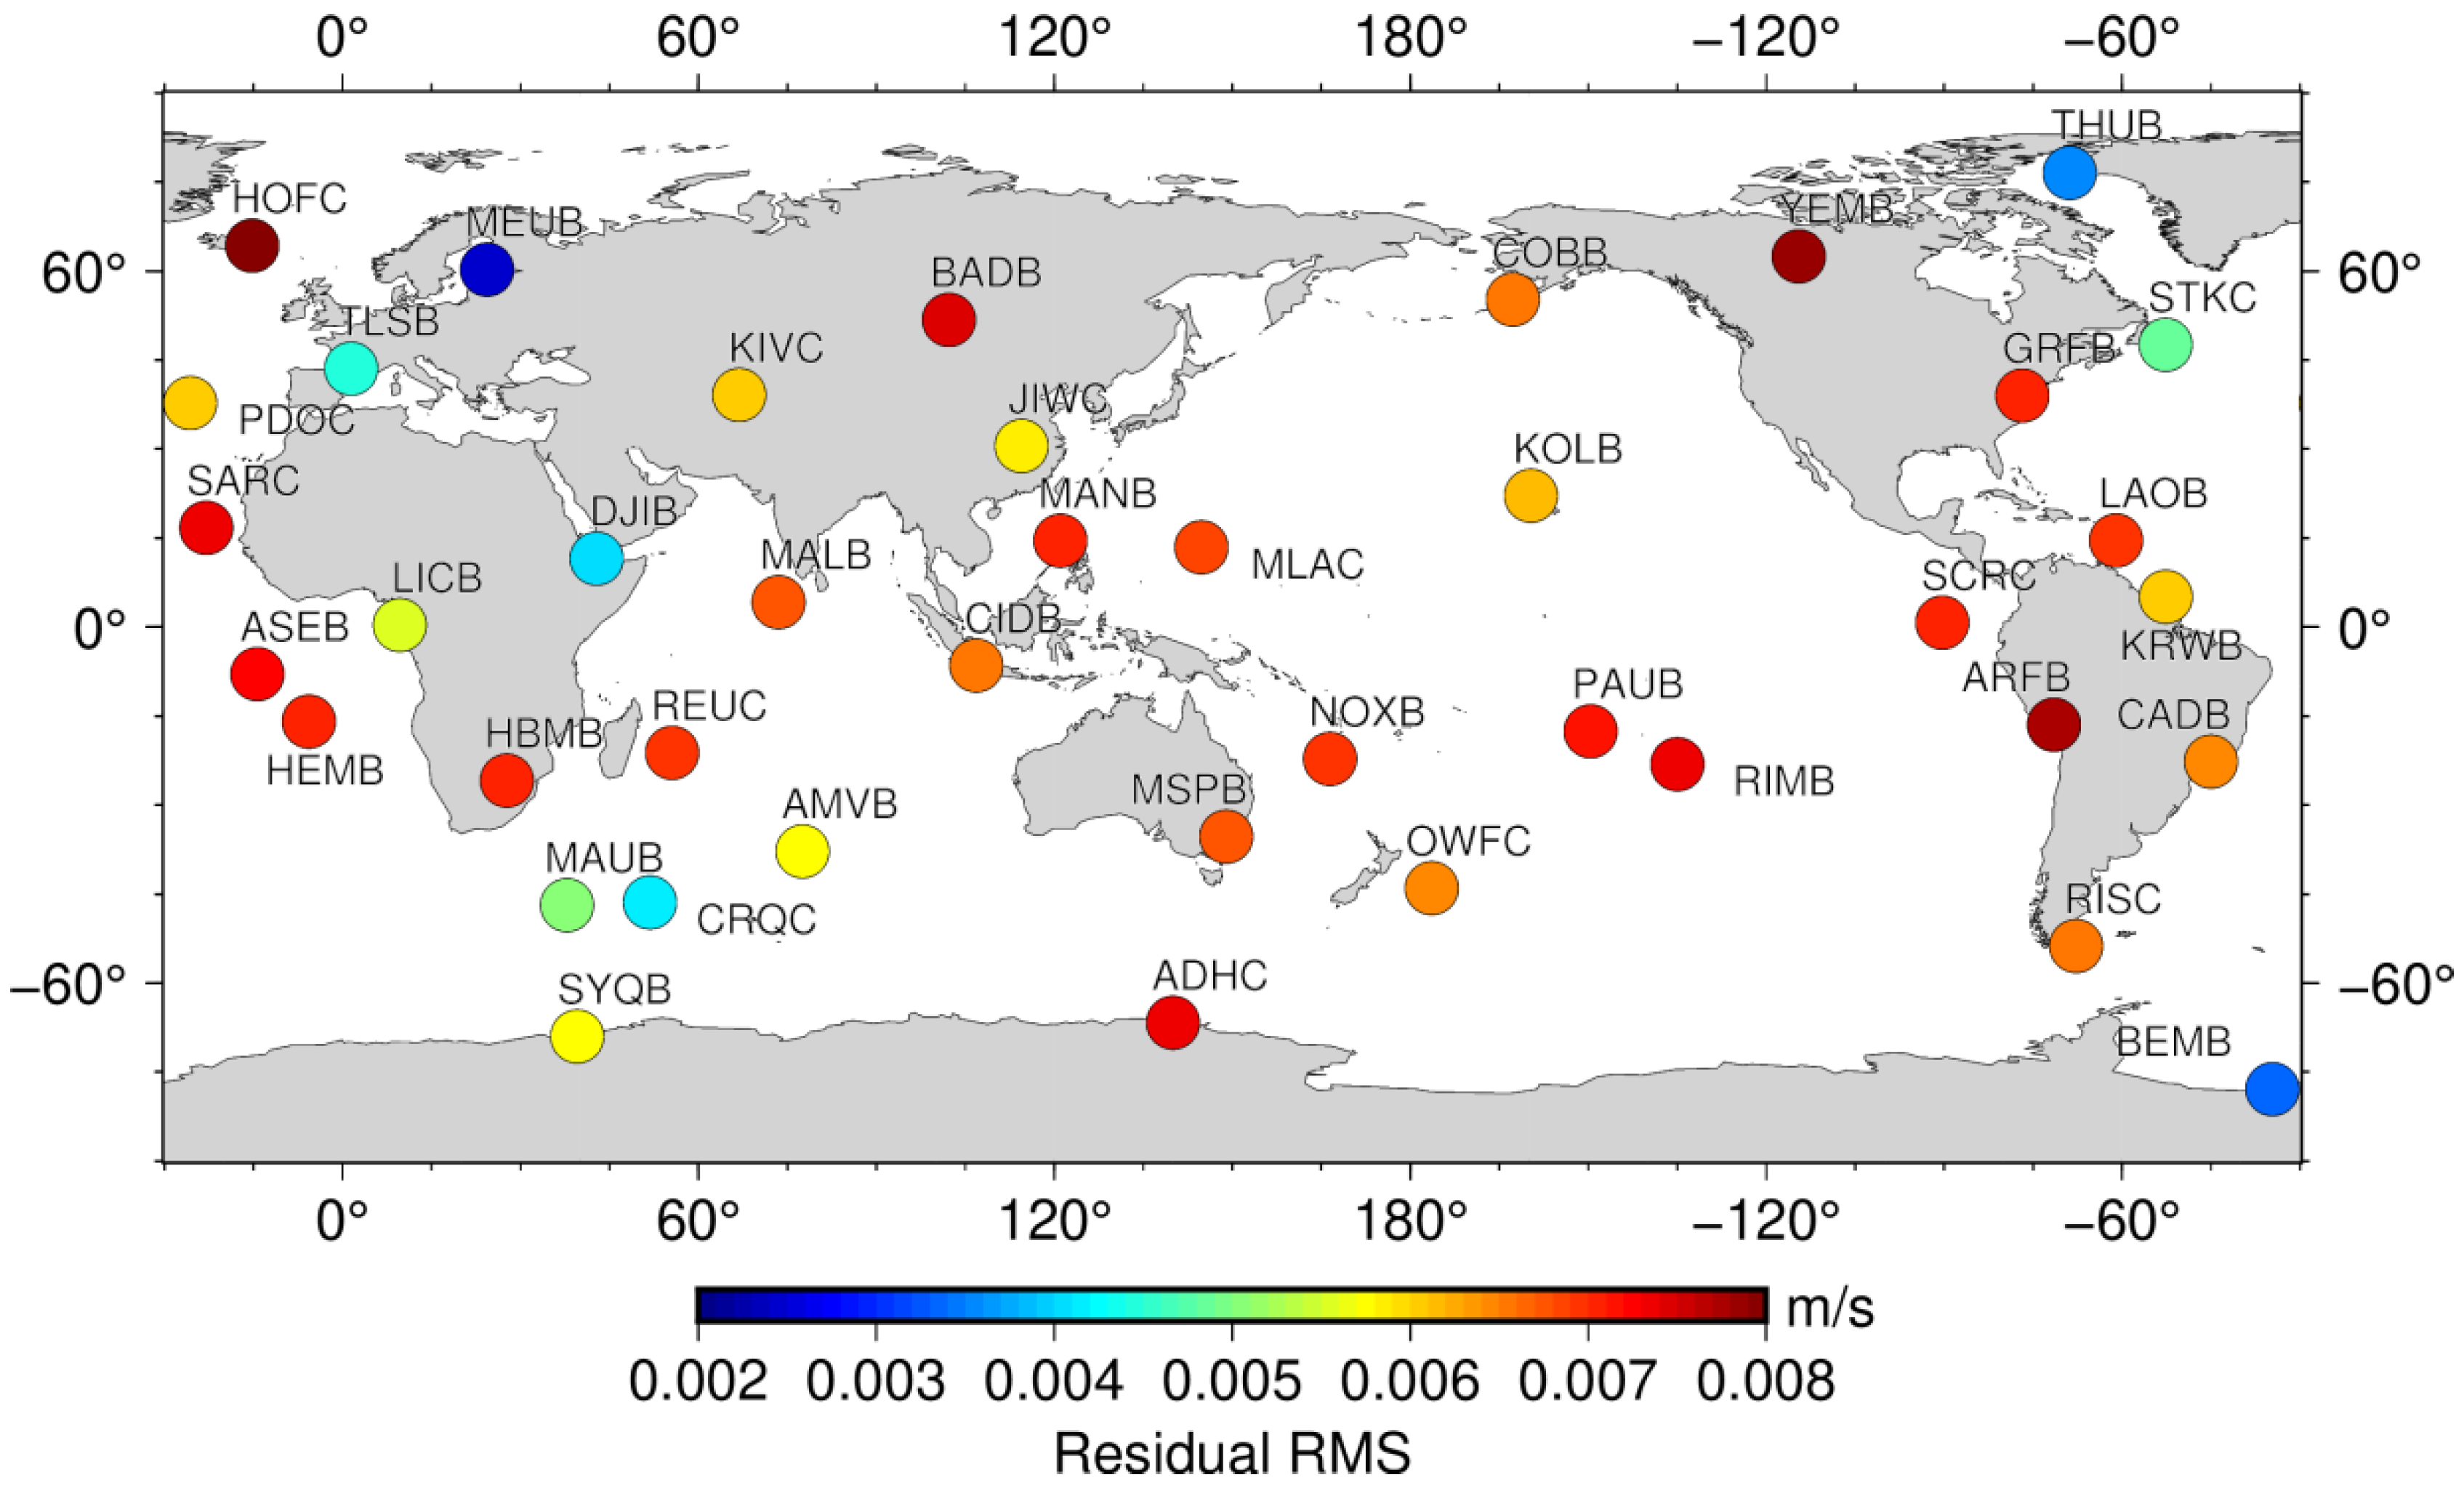
The 7-day satellite-borne DORIS observations used in the validation include data from at most 52 beacon stations and at least 49 stations. Based on the results for each station, the beacon stations with less than 300 observations are eliminated. For convenience, the data volume statistics are based on the total number of 7-day data points from each beacon station. The data from each beacon station are converted to an average range rate. Figure 12 plots the distribution of the DORIS beacon stations used in the validation and the residuals of the validation.
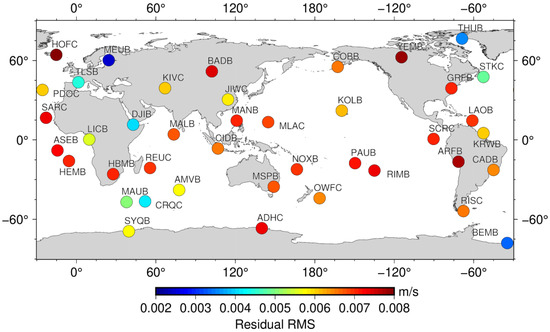
Figure 12.
DORIS beacon station distribution map and residuals of DORIS validation.
In Figure 12, the colour of the circles indicates the accuracy of the RD orbit of HY-2C gained from the DORIS validation. The RMS value of the verified residual of each beacon station is within 0.01 m/s, but the RMS value of some beacon stations, such as ARFB, HOFC, and YEMB, is greater than 0.008 m/s. The influence of the tropospheric delay is still large when the elevation angle is 15°; if the elevation cutoff angle is set to 15°, too much data will be rejected. However, to assess the reliability of the validation result, it is necessary to keep a sufficient quantity of data. The final elevation angle threshold is set to 10°. Table 10 lists the residual statistical results for the beacon stations in DORIS validation for HY-2C.
Table 10.
Summary statistics for the residuals of the beacon stations for DORIS validation.
In the checking process, based on the setting of the elevation cutoff angle threshold and the use of observations with many discontinuities, the data for beacon stations such as BETB, DIOB, MAIB, and MIAB are eliminated, with only two groups remaining. The data for SJUC are all eliminated, and the data for beacon stations such as SOFC, WEUC, YASB are also excluded due to the small numbers of observations (less than 300); therefore, the statistical data for the above beacon stations are not included in Figure 12. The 7-day residuals of validation with DORIS data are summarized in Table 11.
Table 11.
Summary statistics of the residuals of DORIS validation.
By combining Table 10 and the first line of Table 11, it is found that for more than 80% of the beacon stations included in DORIS validation, the RMS values are less than 0.007 m/s, and the RMS value for the overall DORIS validation residual is 0.0063 m/s. The RD orbits of HY-2C are checked with onboard DORIS data, and the HY-2C RD orbit has an accuracy of 0.0063 m/s.
In second line of Table 11, satellite-borne DORIS data are selected to calculate range rate to validate the PSO of HY-2C over 7 days, starting from DOY 348 in 2020. This experiment can prove the reliability of the external validation by using DORIS data on board. It can be seen that the residual RMS value of DORIS validation of PSO is 0.0070 m/s, the result is 0.0007m/s larger than DORIS validation of RD orbits. These results certify that the accuracy of PSO released by CNES is high [40]. This experiment shows that the proposed method of external validation of RD orbits using DORIS data is reliable and efficient.
4. Conclusions
Based on GPS observations of HY2_Receiver, the quality of the observations is analysed, and the data of the band are more susceptible to changes in elevation than are those of the band. The data utilization results suggest that the HY2_Receiver achieves good performance and can be used in POD missions involving LEO satellites. PCO and PCV models are established, and the satellite orbits obtained by using the PCO and PCV models display better accuracy than those obtained without considering the PCO and PCV models. Compared with PSO, the R-direction residual RMS value is 0.01 m, and the 3D RMS value is 0.025 m. The RMS of the carrier-phase residuals is around 0.008 m. The overlap method is applied to assess the accuracy of orbit determination, and the detailed overlap analysis suggests that the RMS value of the residual of overlapping orbits is 0.006 m in the R direction, 0.011 m in the T direction, and 0.006 m in the N direction. The internal-coincidence accuracy-verification results indicate that the HY-2C satellite orbit determination strategy is reliable; notably, the error term is eliminated during the POD process, and the orbit determination result is relatively stable. SLR range validation is analysed in detail, and the RMS value is better than 0.03 m. The results of SLR range validation suggest that the accuracy of the precise orbit of HY-2C reaches the centimetre level. A newly proposed method is used to check orbits based on space-borne DORIS data directly, and that the accuracy of the range rate of the HY-2C RD orbit reaches 0.0063 m/s.
According to the experimental results, the RD orbit of HY-2C reaches centimetre-level accuracy, and the space-borne GPS receiver HY2_Receiver independently developed in China can be used for LEO POD missions. With the improvement and optimization of the model, the RD method for orbit determination will be increasingly applied to LEO satellites, and the orbit accuracy of satellites will be increased in the future.
Author Contributions
Conceptualization, writing—original draft preparation, writing—review and editing and methodology, H.G. and J.G.; software, G.W.; validation, Z.Y., G.W. and L.Q.; data curation, M.L. and H.P.; formal analysis, B.J.; funding acquisition, J.G. All authors have read and agreed to the published version of the manuscript.
Funding
This research was funded by National Natural Science Foundation of China (Grant Nos. 41774001 and 41874091), Autonomous and Controllable Special Project for the Surveying and Mapping of China (Grant No. 816-517), and SDUST Research Fund (Grant No. 2014TDJH101).
Institutional Review Board Statement
Not applicable.
Informed Consent Statement
Not applicable.
Data Availability Statement
Our sincere thanks go to the National Satellite Ocean Application Center for providing space-borne GPS data for HY-2C; CODE for providing GPS satellite orbits, clocks and Earth rotation parameters; the CNES for providing precise orbits for HY-2C; the ILRS for providing SLR data; and the IDS for providing DORIS data.
Acknowledgments
We thank the Astronomical Institute of the University of Bern (AIUB) for providing Bernese GNSS Software. This research is supported by National Natural Science Foundation of China (grant numbers 41774001) and SDUST Research Fund (grant number 2014TDJH101).
Conflicts of Interest
The authors declare no conflict interest.
References
- Lin, M.S.; Wang, X.H.; Peng, H.L.; Zhao, Q.L.; Li, M. Precise orbit determination technology based on dual-frequency GPS solution for HY-2 satellite. Eng. Sci. 2014, 16, 97–101. [Google Scholar] [CrossRef]
- Jiang, X.W.; Lin, M.S.; Zhang, Y.G. Progress and prospect of Chinese ocean satellites. J. Remote Sens. 2016, 20, 1185–1198. [Google Scholar] [CrossRef]
- Bury, G.; Sośnica, K.; Zajdel, R. Multi-GNSS orbit determination using satellite laser ranging. J. Geod. 2019, 93, 2447–2463. [Google Scholar] [CrossRef] [Green Version]
- Wang, Y.C.; Guo, J.Y.; Zhou, M.S.; Jin, X.; Zhao, C.M.; Chang, X.T. Geometric solution method of SLR station coordinate based on multi-LEO satellites. Chin. J. Geophys. 2020, 63, 4333–4344. [Google Scholar] [CrossRef]
- Strugarek, D.; Sośnica, K.; Arnold, D.; Jäggi, A.; Zajdel, R.; Bury, G.; Drożdżewski, M. Determination of Global Geodetic Parameters Using Satellite Laser Ranging Measurements to Sentinel-3 Satellites. Remote Sens. 2019, 11, 2282. [Google Scholar] [CrossRef] [Green Version]
- Zhao, X.L.; Zhou, S.S.; Ci, Y.; Hu, X.G.; Cao, J.F.; Chang, Z.Q.; Tang, C.P.; Guo, D.N.; Guo, K.; Liao, M. High-precision orbit determination for a LEO nanosatellite using BDS-3. GPS Solut. 2020, 24, 102. [Google Scholar] [CrossRef]
- Zhang, Q.J.; Zhang, J.; Zhang, H.; Rui, W.; Hong, J. The study of HY-2A satellite engineering development and in-orbit movement. Eng. Sci. 2013, 15, 12–18. [Google Scholar] [CrossRef]
- Bertiger, W.I.; Bar-Sever, Y.E.; Christensen, E.J.; Davis, E.S.; Guinn, J.R.; Haines, B.J.; Ibanez-Meier, R.W.; Jee, J.R.; Lichten, S.M.; Melbourne, W.G.; et al. GPS precise tracking of TOPEX/POSEIDON: Results and implications. J. Geophys. Res. Ocenas 1994, 99, 24449–24464. [Google Scholar] [CrossRef]
- Mao, X.Y.; Arnold, D.; Girardin, V.; Villiger, A.; Jäggi, A. Dynamic GPS-based LEO orbit determination with 1 cm precision using the Bernese GNSS Software. Adv. Space Res. 2020, 67, 788–805. [Google Scholar] [CrossRef]
- Kang, Z.; Tapley, B.; Bettadpur, S.; Ries, J.; Nagel, P. Precise orbit determination for GRACE using accelerometer data. Adv. Space Res. 2006, 38, 2131–2136. [Google Scholar] [CrossRef]
- Švehla, D.; Rothacher, M. Kinematic positioning of LEO and GPS satellites and IGS stations on the ground. Adv. Space Res. 2005, 36, 376–381. [Google Scholar] [CrossRef]
- Wu, S.C.; Yunck, T.P.; Thornton, C.L. Reduced-dynamic technique for precise orbit determination of low earth satellites. J. Guid. Control. Dyn. 1991, 14, 24–30. [Google Scholar] [CrossRef]
- Xia, Y.W.; Liu, X.; Guo, J.Y.; Yang, Z.M.; Qi, L.H.; Ji, B.; Chang, X. On GPS data quality of GRACE-FO and GRACE satellites: Effects of phase center variation and satellite attitude on precise orbit determination. Acta Geod. Geophys. 2021, 56, 93–111. [Google Scholar] [CrossRef]
- Hwang, C.; Tseng, T.-P.; Lin, T.; Švehla, D.; Schreiner, B. Precise orbit determination for the FORMOSAT-3/COSMIC satellite mission using GPS. J. Geod. 2009, 83, 477–489. [Google Scholar] [CrossRef]
- Kang, Z.; Nagel, P.; Pastor, R. Precise orbit determination for GRACE. Adv. Space Res. 2003, 31, 1875–1881. [Google Scholar] [CrossRef]
- Haines, B.; Bar-Sever, Y.; Bertiger, W.; Desai, S.; Willis, P. One-Centimeter Orbit Determination for Jason-1: New GPS-Based Strategies. Mar. Geod. 2004, 27, 299–318. [Google Scholar] [CrossRef]
- Bock, H.; Jäggi, A.; Švehla, D.; Beutler, G.; Hugentobler, U.; Visser, P. Precise orbit determination for the GOCE satellite using GPS. Adv. Space Res. 2007, 39, 1638–1647. [Google Scholar] [CrossRef]
- Guo, J.Y.; Qin, J.; Kong, Q.L.; Li, G.W. On simulation of precise orbit determination of HY-2 with centimeter precision based on satellite-borne GPS technique. Appl. Geophys. 2012, 9, 95–107. [Google Scholar] [CrossRef]
- Yunck, T.P.; Bertiger, W.I.; Wu, S.C.; Bar-Sever, Y.E.; Christensen, E.J.; Haines, B.J.; Lichten, S.M.; Muellerschoen, R.J.; Vigue, Y.; Willis, P. First assessment of GPS-based reduced dynamic orbit determination on TOPEX/Poseidon. Geophys. Res. Lett. 2013, 21, 541–544. [Google Scholar] [CrossRef]
- Zhou, X.Y.; Chen, H.; Fan, W.; Zhou, X.; Chen, Q.; Jiang, W. Assessment of single-difference and track-to-track ambiguity resolution in LEO precise orbit determination. GPS Solut. 2021, 25, 62. [Google Scholar] [CrossRef]
- Jäggi, A.; Hugentobler, U.; Beutler, G. Pseudo-Stochastic Orbit Modeling Techniques for Low-Earth Orbiters. J. Geod. 2006, 80, 47–60. [Google Scholar] [CrossRef] [Green Version]
- Guo, J.; Zhao, Q.L.; Li, M.; Hu, Z.G. Centimeter Level Orbit Determination for HY2A Using GPS Data. Geomat. Form. Sci. Wuhan Univ. 2013, 38, 52–55. [Google Scholar] [CrossRef]
- Gong, X.W.; Sang, J.Z.; Wang, F.H.; Li, X.X. A More Reliable Orbit Initialization Method for LEO Precise Orbit Determination Using GNSS. Remote Sens. 2020, 12, 3646. [Google Scholar] [CrossRef]
- Montenbruck, O.; Kroes, R. In-flight performance analysis of the CHAMP BlackJack GPS Receiver. GPS Solut. 2003, 7, 74–86. [Google Scholar] [CrossRef]
- Hwang, C.; Lin, T.-J.; Tseng, T.-P.; Chao, B.F. Modeling Orbit Dynamics of FORMOSAT-3/COSMIC Satellites for Recovery of Temporal Gravity Variations. IEEE Trans. Geosci. Remote Sens. 2008, 46, 3412–3423. [Google Scholar] [CrossRef]
- Cai, Y.R.; Bai, W.H.; Wang, X.Y.; Sun, Y.; Du, Q.F.; Zhao, D.Y.; Meng, X.G.; Liu, C.L.; Xia, J.M.; Wang, D.W.; et al. In-orbit performance of GNOS on-board FY3-C and the enhancements for FY3-D satellite. Adv. Space Res. 2017, 60, 2812–2821. [Google Scholar] [CrossRef]
- Hwang, C.; Tseng, T.-P.; Lin, T.-J.; Švehla, D.; Hugentobler, U.; Chao, B.F. Quality assessment of FORMOSAT-3/COSMIC and GRACE GPS observables: Analysis of multipath, ionospheric delay and phase residual in orbit determination. GPS Solut. 2009, 14, 121–131. [Google Scholar] [CrossRef]
- Moreaux, G.; Lemoine, F.G.; Argus, D.; Santamaría-Gómez, A.; Willis, P.; Soudarin, L.; Gravelle, M.; Ferrage, P. Horizontal and vertical velocities derived from the IDS contribution to ITRF2014, and comparisons with geophysical models. Geophys. J. Int. 2016, 207, 209–227. [Google Scholar] [CrossRef] [Green Version]
- Lemoine, J.-M.; Capdeville, H.; Soudarin, L. Precise orbit determination and station position estimation using DORIS RINEX data. Adv. Space Res. 2016, 58, 2677–2690. [Google Scholar] [CrossRef]
- Dorrer, M.; Laborde, B.; Deschamps, P. DORIS (Doppler orbitography and radiopositioning integrated from space): System assessment results with DORIS on SPOT 2. Acta Astronaut. 1991, 25, 497–504. [Google Scholar] [CrossRef]
- Jayles, C.; Vincent, P.; Rozo, F.; Balandreaud, F. DORIS-DIODE: Jason-1 has a Navigator on Board. Mar. Geod. 2004, 27, 753–771. [Google Scholar] [CrossRef]
- Mercier, F.; Cerri, L.; Berthias, J.-P. Jason-2 DORIS phase measurement processing. Adv. Space Res. 2010, 45, 1441–1454. [Google Scholar] [CrossRef]
- Zelensky, N.P.; Berthias, J.-P.; Lemoine, F.G. DORIS time bias estimated using Jason-1, TOPEX/Poseidon and ENVISAT orbits. J. Geod. 2006, 80, 497–506. [Google Scholar] [CrossRef]
- Doornbos, E.; Willis, P. Analysis of DORIS range-rate residuals for TOPEX/Poseidon, Jason, Envisat and SPOT. Acta Astronaut. 2007, 60, 611–621. [Google Scholar] [CrossRef]
- Li, X.X.; Zhang, K.K.; Meng, X.G.; Zhang, W.; Zhang, Q.; Zhang, X.; Li, X. Precise Orbit Determination for the FY-3C Satellite Using Onboard BDS and GPS Observations from 2013, 2015, and 2017. Engineering 2019, 6, 904–912. [Google Scholar] [CrossRef]
- CNES. HY-2C input data for Precise Orbit Determination. 2021. Available online: https://ids-doris.org/analysis-documents.html (accessed on 24 June 2021).
- Dach, R.; Brockmann, E.; Schaer, S.; Beutler, G.; Meindl, M.; Prange, L.; Bock, H.; Jäggi, A.; Ostini, L. GNSS processing at CODE: Status report. J. Geod. 2009, 83, 353–365. [Google Scholar] [CrossRef] [Green Version]
- Allahvirdi-Zadeh, A.; Wang, K.; El-Mowafy, A. POD of small LEO satellites based on precise real-time MADOCA and SBAS-aided PPP corrections. GPS Solut. 2021, 25, 1–14. [Google Scholar] [CrossRef]
- Dach, R.; Andritsch, F.; Arnold, D.; Vertone, S.; Thaller, D. Bernese GNSS Software Version 5.2. User Manual; Astronomical Institute, University of Bern, Bern Open Publishing: Bern, Switzerland, 2015. [Google Scholar]
- Flavien, M.; John, M.; Sabine, H. First POD Results on HY-2C. 2021. Available online: https://ids-doris.org/images/documents/report/AWG202104/IDSAWG202104-Mercier-PODHY2C.pdf (accessed on 24 June 2021).
- Pearlman, M.; Degnan, J.; Bosworth, J. The International Laser Ranging Service. Adv. Space Res. 2002, 30, 135–143. [Google Scholar] [CrossRef]
- Auriol, A.; Tourain, C. DORIS system: The new age. Adv. Space Res. 2010, 46, 1484–1496. [Google Scholar] [CrossRef]
- Visser, P.; Ijssel, J.V.D. Aiming at a 1-cm Orbit for Low Earth Orbiters: Reduced-Dynamic and Kinematic Precise Orbit Determination. Space Sci. Rev. 2003, 108, 27–36. [Google Scholar] [CrossRef]
- Rodriguez-Solano, C.; Hugentobler, U.; Steigenberger, P. Adjustable box-wing model for solar radiation pressure impacting GPS satellites. Adv. Space Res. 2012, 49, 1113–1128. [Google Scholar] [CrossRef]
- Zhang, B.B.; Wang, Z.; Zhou, L.; Feng, J.; Qiu, Y.; Li, F. Precise Orbit Solution for Swarm Using Space-Borne GPS Data and Optimized Pseudo-Stochastic Pulses. Sensors 2017, 17, 635. [Google Scholar] [CrossRef] [Green Version]
- Saastamoinen, J. Contributions to the theory of atmospheric refraction. Bull. Géod. 1972, 105, 279–298. [Google Scholar] [CrossRef]
- Niell, A.E. Global mapping functions for the atmosphere delay at radio wavelengths. J. Geophys. Res. Atmos. 1996, 101, 3227–3246. [Google Scholar] [CrossRef]
- Vaclavovic, P.; Dousa, J. G-Nut/Anubis: Open-Source Tool for Multi-GNSS Data Monitoring with a Multipath Detection for New Signals, Frequencies and Constellations. In Gravity, Geoid and Earth Observation; Springer: Cham, Switzerland, 2015; Volume 143, pp. 775–782. [Google Scholar]
- Qi, L.H.; Guo, J.Y.; Xia, Y.W.; Yang, Z.M. Effect of Higher-Order Ionospheric Delay on Precise Orbit Determination of GRACE-FO Based on Satellite-Borne GPS Technique. IEEE Access 2019, 9, 29841–29849. [Google Scholar] [CrossRef]
- Reigber, C.; Schwintzer, P.; Neumayer, K.-H.; Barthelmes, F.; König, R.; Förste, C.; Balmino, G.; Biancale, R.; Lemoine, J.-M.; Loyer, S.; et al. The CHAMP-only earth gravity field model EIGEN-2. Adv. Space Res. 2003, 31, 1883–1888. [Google Scholar] [CrossRef]
- Liu, M.; Yuan, Y.; Ou, J.; Chai, Y. Research on Attitude Models and Antenna Phase Center Correction for Jason-3 Satellite Orbit Determination. Sensors 2019, 19, 2408. [Google Scholar] [CrossRef] [Green Version]
- Yuan, J.J.; Zhou, S.S.; Hu, X.G.; Yang, L.; Cao, J.F.; Li, K.; Liao, M. Impact of Attitude Model, Phase Wind-Up and Phase Center Variation on Precise Orbit and Clock Offset Determination of GRACE-FO and CentiSpace-1. Remote. Sens. 2021, 13, 2636. [Google Scholar] [CrossRef]
- Lu, C.X.; Zhang, Q.; Zhang, K.K.; Zhu, Y.T.; Zhang, W. Improving LEO precise orbit determination with BDS PCV calibration. GPS Solut. 2019, 23, 1–13. [Google Scholar] [CrossRef]
- Jäggi, A.; Dach, R.; Montenbruck, O.; Hugentobler, U.; Bock, H.; Beutler, G. Phase center modeling for LEO GPS receiver antennas and its impact on precise orbit determination. J. Geod. 2009, 83, 1145–1162. [Google Scholar] [CrossRef] [Green Version]
- Shao, K.; Gu, D.F.; Chang, X.; Yi, B.; Wang, Z.M. Impact of GPS receiver antenna GRAPHIC residual variations on single-frequency orbit determination of LEO satellites. Adv. Space Res. 2019, 64, 1166–1176. [Google Scholar] [CrossRef]
- Zhao, Q.L.; Liu, J.N.; Ge, M.R.; Shi, C. Precision Orbit Determination of CHAMP Satellite with cm-level Accuracy. Geomat. Inf. Sci. Wuhan Univ. 2006, 31, 879–882. [Google Scholar]
- Kang, Z.; Bettadpur, S.; Nagel, P.; Save, H.; Poole, S.; Pie, N. GRACE-FO precise orbit determination and gravity recovery. J. Geod. 2020, 94, 1–17. [Google Scholar] [CrossRef]
- Švehla, D.; Rothacher, M. Kinematic and reduced-dynamic precise orbit determination of low earth orbiters. Adv. Geosci. 2003, 1, 47–56. [Google Scholar] [CrossRef] [Green Version]
- Petit, G.; Luzum, B. IERS Conventions IERS Technical Note; Verlag des Bundesamtsfür Kartographie and Geodäsie: Frankfurt am Main, Germany, 2010. [Google Scholar]
- Guo, J.Y.; Wang, Y.C.; Shen, Y.; Liu, X.; Sun, Y.; Kong, Q.L. Estimation of SLR station coordinates by means of SLR measurements to kinematic orbit of LEO satellites. Earth Planets Space 2018, 70, 201. [Google Scholar] [CrossRef] [Green Version]
- Mendes, V.B. High-accuracy zenith delay prediction at optical wavelengths. Geophys. Res. Lett. 2004, 31, 189–207. [Google Scholar] [CrossRef] [Green Version]
- Kong, Q.L.; Guo, J.Y.; Gao, F.; Han, L.T. Performance Evaluation of Three Atmospheric Density Models on HY-2A Precise Orbit Determination Using DORIS Range-Rate Data. J. Test. Eval. 2018, 47, 2150–2166. [Google Scholar] [CrossRef]


Publisher’s Note: MDPI stays neutral with regard to jurisdictional claims in published maps and institutional affiliations. |
© 2021 by the authors. Licensee MDPI, Basel, Switzerland. This article is an open access article distributed under the terms and conditions of the Creative Commons Attribution (CC BY) license (https://creativecommons.org/licenses/by/4.0/).