Article

Analysis of Temporal and Spatial Characteristics of Urban Expansion in Xiaonan District from 1990 to 2020 Using Time Series Landsat Imagery

1
State Key Laboratory of Geological Processes and Mineral Resources, China University of Geosciences, Wuhan 430074, China
2
Hubei Subsurface Multi-Scale Imaging Key Laboratory, Institute of Geophysics and Geomatics, China University of Geosciences, Wuhan 430074, China
3
CAS Key Laboratory of Spectral Imaging Technology, Xi’an 710119, China
*
Author to whom correspondence should be addressed.
Remote Sens. 2021, 13(21), 4299; https://doi.org/10.3390/rs13214299
Submission received: 14 September 2021 / Revised: 20 October 2021 / Accepted: 24 October 2021 / Published: 26 October 2021
(This article belongs to the Special Issue Applications of Remote Sensing Imagery for Urban Areas)

Abstract

:
With the rapid development in the global economy and technology, urbanization has accelerated. It is important to characterize the urban expansion and determine its driving force. In this study, we used the Xiaonan District in Hubei Province, China, as an example to map and quantify the spatiotemporal dynamics of urban expansion from the two perspectives of built-up area and urban land in 1990–2020 by using remote sensing images. The location of rivers was found to be a primary limiting factor for spatial patterns and expansion of the built-up area. The transfer of the city center and the main direction of expansion generally corresponded well to the topography, policies, and development strategies. The built-up area expanded faster than the urban population in 1995–2020, which caused a waste in land resources. The results showed that the urban expansion first decreased and then increased during the research period. The increase in the proportion of the secondary industry was the main driving force of the urban expansion. Based on the characteristics of urban expansion in the past three decades, we conclude that the urban land of Xiaonan District will expand quickly in the future and will occupy vast agricultural land. The government must deploy control measures to balance the benefits and costs of urban expansion.

1. Introduction

Since the reform and opening up to the international market, China has encountered unprecedented economic growth, resulting in rapid urbanization. From 1949–2020, China’s urbanization rate has increased from 10.6% to more than 60% [1,2]. Urbanization, by definition, is the course of progressive change from a customary provincial society that is overwhelmed by agribusiness to an advanced metropolitan culture dominated by non-horticultural enterprises, which is characterized by metropolitan land development [3]. It poses both opportunities and challenges for the long-term development between human requirements and the global environment [4,5]. On the one hand, the innovation and wealth brought about by urbanization are surprising to the development of cities. Cities have a significant agglomeration effect and a scale benefit, the optimal allocation of economic factors, and the reasonable layout of regional internal industries can be realized in the process of expansion to promote the rapid development of the regional economy [6,7]. On the other hand, with the continuous shift from natural vegetation or cropland to urban land, a series of worrisome problems have gradually arisen, which have been reflected in many dimensions, including waste of land resources [8,9], loss of wildlife habitats and biodiversity [10,11,12], degradation of the ecological environment such as by air and water contamination, strong urban heat islands and heat waves, settlement of wetlands [13,14,15,16,17], and loss of arable land [18,19].
At present, 56.2% of the world’s population lives in urban areas, and by 2030, 60.4% of the total population is projected to be urban, with as much as 96% of this populace dwelling in Asia and Africa [20]. As the biggest developing country on our planet, China’s urbanization will keep on speeding up. Considering the limited availability of land resources in China, balancing the relationship between arable land, ecological protection, and economic development is an urgent problem to be solved. In this context, it is essential to characterize the urban expansion process and explore the drive mechanism to accomplish reasonable development objectives in this increasingly urbanized world.
As early as the 1820s, researchers began to study urban expansion. They focused mainly on urban morphology and spatial structure, proposing various theories, hypotheses, and urban expansion models such as the concentric zone model, sector theory, and multiple nuclei model [21]. The early achievements provide a good theoretical foundation for the later research of urban expansion. With the consistent development of remote sensing and geographic information science (GIS) technologies, the perspective of research on urban expansion has become more diverse. Research on urban expansion is not only limited to the theoretical stage; more researchers have begun to conduct continuous monitoring of the dynamic process of urban expansion quantitatively, analyze the spatial and temporal characteristics of urban expansion, and explore the driving mechanism of urban expansion.
Remote sensing is a non-contact long-distance detection technology [22]. It has the advantages of being functional at large-scale monitoring, yielding multi-temporal, high precision data, and being accessible. Studying the dynamic process of urban expansion can not only save on labor and financial costs but also improve the accuracy and efficiency of monitoring. Urban expansion has been widely discussed in many previous studies based on remote sensing images. Specifically, most existing researches focus on the study of megacities (e.g., Beijing, Shanghai, Guangzhou, Shenzhen), large cities (e.g., Wuhan, Chengdu, Nanjing, and Harbin), and urban agglomeration (e.g., Jing-Jin-Ji Area, Zhujiang Delta) in China. For example, Liu et al. (2005) mapped urban land expansion in China and analyzed its expansion modes as well as driving forces using high-resolution Landsat thermal mapper (TM) and enhanced thermal mapper (ETM) data [23]. Case studies of 13 major significant megacities in China revealed that urban expansion was generally driven by demographic changes, monetary growth, and changes in land use policies. Zhai et al. (2019) extracted urban land in seven cities (Beijing, Tianjin, Chongqing, Wuhan, Shanghai, Guangzhou, and Shenzhen) from 1990 to 2015 based on Landsat TM/operational land imager (OLI) data and analyzed the internal and external driving factors of landscape pattern change and urban expansion [24]. The results showed that urban land expanded to different degrees and modes in different cities during the past 25 years, which generally showed an expansion trend from urban centers to surrounding areas and from coastal areas to inland areas. Danilo et al. (2014) used object-oriented analysis of aerial photographs to obtain the land use mapping between 1954–2000 in the Langhe region (NW Italy) and analyzed the spatiotemporal patterns of land use change over time [25]. Demetris et al. (2015) achieved the extraction of urban spatial information in 28 EU countries using defense meteorological satellite program/operational linescan system (DMSP/OLS) night light data in 1992, 2001, and 2012 [26]. Li et al. (2020) extracted the urban land of the Changsha-Zhuzhou-Xiangtan city agglomeration based on the DMSP/OLS night lighting data from 1994–2013 [27].
The external shape and internal structure of the city are constantly changing during the process of urban expansion. This spatiotemporal dynamic transformation has attracted the interest of researchers. Nowadays, the research on the spatiotemporal characteristics of urban expansion in terms of area growth is mainly based on mathematical models (e.g., expansion speed, expansion intensity, and expansion dynamic index). Mature geographic information technology is mainly used to analyze the difference in the spatial direction of urban expansion, the change of the city center, and the mode of urban expansion when analyzing the spatial characteristics of expansion. Ning et al. (2020) utilized an assortment of spatial investigation strategies and indicators to analyze the intensity, direction, and pattern of urban expansion in Harbin using remote sensing image data from 2001, 2008, 2013, and 2017 [28]. Wang (2017) applied the average annual expansion index, spatial and temporal change land division model, urban land use spatial transfer model, and distance decay density model to analyze the spatial and temporal attributes and types of the urban spatial expansion of Changchun [29]. Wang (2014) used the expansion rate, expansion intensity, compaction index, urban center of gravity, and radiation index to characterize the spatial and temporal dynamics of the expansion of the main urban area of Xi’an and analyzed the difference in expansion in terms of spatial orientation [30]. Weng (2002) explored land use change dynamics of the Zhujiang Delta by the joint utilization of satellite remote sensing, GIS, and stochastic modeling technologies [31]. The results demonstrated that there was an outstanding and lopsided metropolitan growth and a gigantic loss in cropland between 1989–1997, and the land use change process has shown no indication of becoming steady. In addition, the relevant concept of landscape ecology has been gradually introduced into research on urban expansion in recent years [32,33]. Xi et al. (2019) selected a series of landscape metrics to analyze the extension interaction and land use changes in the main urban area of Xi’an [34]. Bian et al. (2021) took the Yangtze River Economic Belt as the research object; studied the landscape urbanization from the perspective of multi-scale spatial and temporal pattern, diversity, and sustainability influence; and used landscape index and binary regression method to discuss the connection between landscape urbanization, national development planning, and regional sustainability [35]. Sapena and Ruiz (2015) used a series of multi-temporal fragmentation metrics, including the landscape metrics, to make a dynamic quantification of urban spatial patterns and urban sprawl by using land-use/land-cover (LULC) data obtained from the European Urban Atlas dataset. The results showed that urban expansion monitoring with multi-temporal data using these techniques highlights urbanization trends, having a great potential to quantify and model the geographic development of metropolitan areas [36].
In addition, the research on the quantitative analysis of urban expansion drivers has gradually become a hot spot in recent years. For example, Verburg (2004) used the logistic model to analyze the urban expansion of the Netherlands and proposed that the driving factors for the increase of urban construction land for residential, industrial, commercial, and entertainment facilities are the urban traffic accessibility, relevant government land policies, and interaction of adjacent areas [37]. Ademola et al. (2006) quantified spatial indicators such as topographic variables, accessibility, neighborhood index, and distance from water; analyzed them with a binary logistic regression model of urban land change in Lagos; drew the same conclusion as Verburg; further observed the differences between significant variables of residential and commercial land change models; and proposed that the land use change model should distinguish residential land and commercial land to identify drivers [38]. Peng and Chen (2019) obtained 12 correlation drivers from the population, economy, social, and traffic four dimensions through relevant analysis; used principal component analysis; and proposed that the road area, fiscal expenditure, the proportion of secondary, and the proportion of tertiary industry are the core driver of urban construction land expansion in Hunan province in 2005–2017 [39]. Chen (2020) selected the relevant factors and used the grey relation analysis to conclude that the main driving force for the urban land expansion in the study area was the increase in the population [40]. Zhang (2019) chose geographically weighted regression (GWR) to explore the driving forces of urban land expansion in Shandong Province and used ArcGIS software to visualize the results, which directly reflected the spatial change of each driver [41].
However, research on the urban expansion of cities surrounding large cities is lacking. These cities are usually in a period of rapid development, which is partially driven by large cities [42,43]. If we can identify the existing problems in the process of their urban expansion process, it will be of extraordinary importance to change metropolitan advancement strategies timely for sustainable development. To characterize the urban expansion of the areas around large cities, we quantified the spatiotemporal transformation patterns of built-up area and urban land expansion in Xiaonan District utilizing multi-temporal Landsat TM and OLI images from 1990, 1995, 2000, 2005, 2010, 2015, and 2020 combined with the compaction index, fractional exponent, landscape metrics, sector analysis, and urban growth type. The main content of this paper is as follows: (1) mapping the spatial pattern of built-up area and urban land cover dynamically, (2) characterizing the spatiotemporal features of built-up area and urban land expansion, (3) dissecting the temporal coevolution of the urban population and area, and (4) investigating the driving force of urban expansion.

2. Study Area and Materials
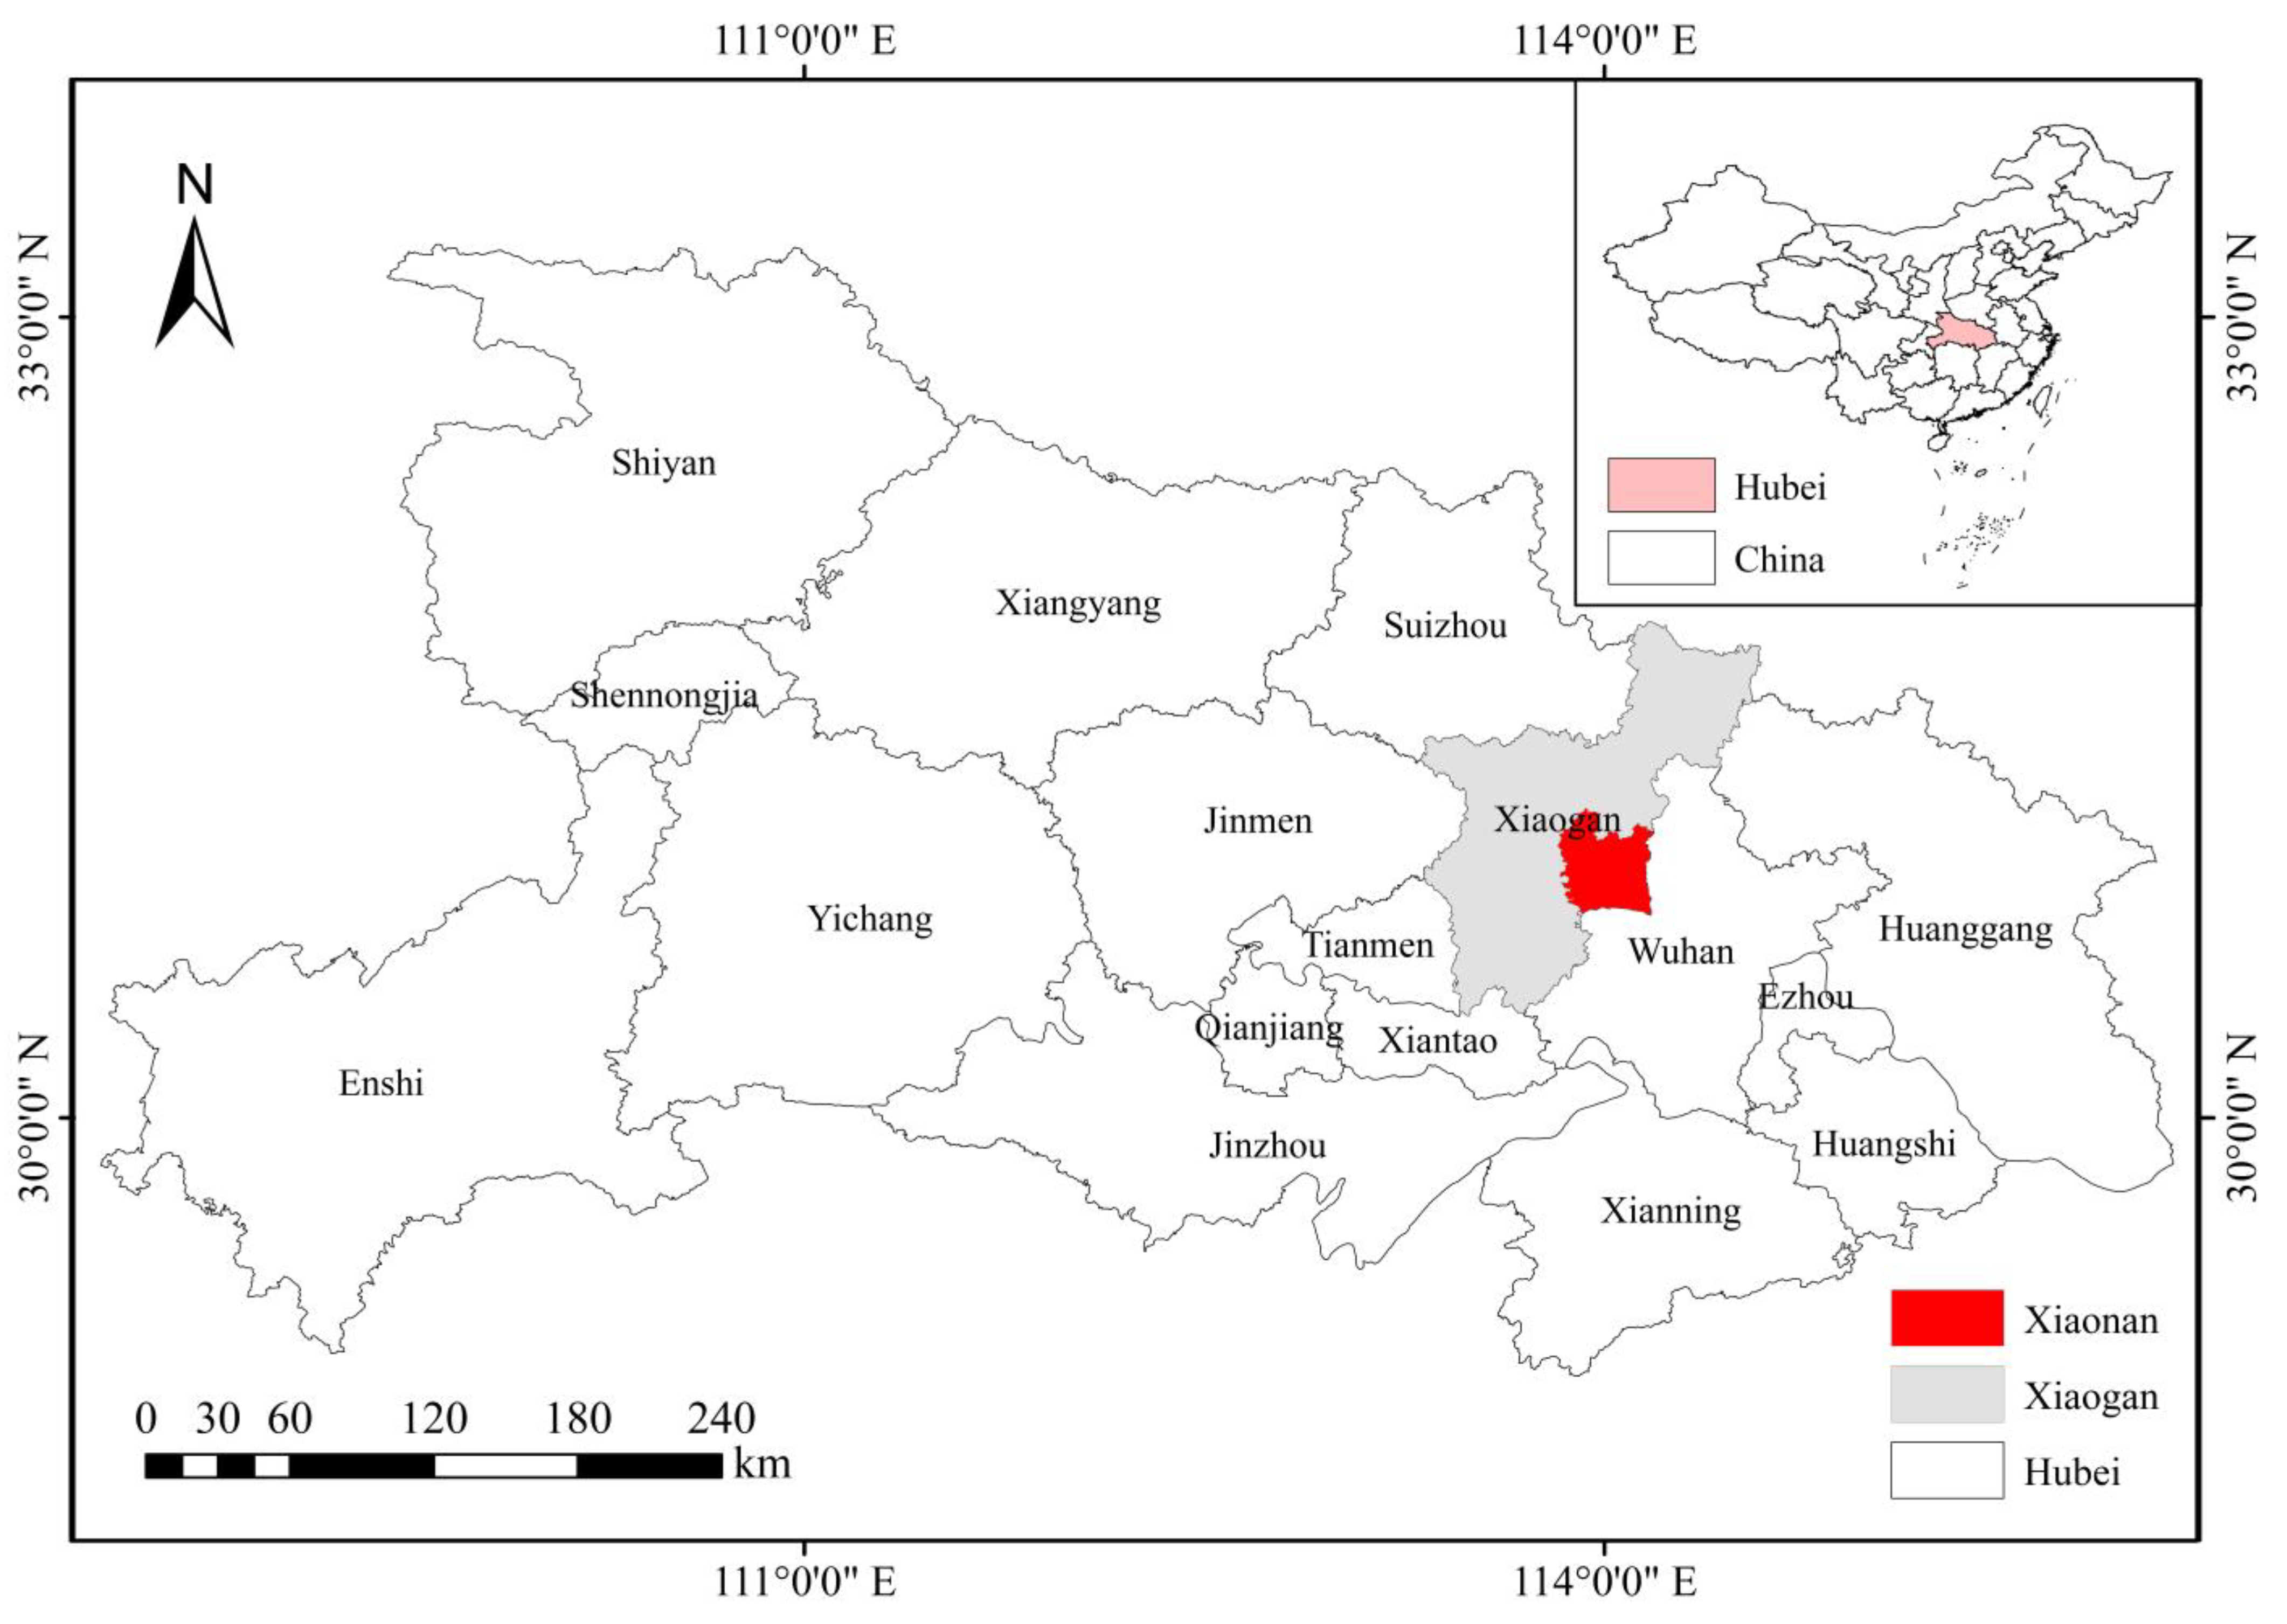
2.1. Study Area

The study area, Xiaogan City (30°23′–31°52′ N, 113°19′–114°35′ E), is located in the northeast of Hubei Province, China. It is an important part of the Yangtze River Economic Belt and the Wuhan City Circle [44]. Since Xiaogan City was established in 1993, this region has encountered fast urbanization in the past three decades because of its superior geographical conditions [45]. A wide range of development strategies have been taken on in the past three decades, and countless various extensions have happened during this period. Among the seven districts (Xiannan, Dawu, Xiaochang, Hanchuan, Yunmeng, Yingcheng, and Anlu), Xiannan District covers an area of 1018.32 km2 with a population of 0.98 million in 2020, is located in the east of Xiaogan City, and is regarded as the urban core of Xiaogan City, while the other six regions are characterized mostly by rural areas. To demonstrate the detailed urban expansion of Xiaogan City, our study focused on Xiaonan District (Figure 1), which we selected for the following reasons. First, Xiaonan District is the administrative and industrial center of Xiaogan City. Its urban expansion can represent the development of the entire Xiaogan City. Second, Xiaonan District borders Wuhan, only 60 km from the center of Wuhan, facilitating resource sharing between regions. Xiaonan District exhibits great development potential because of its excellent geographical conditions. It is important to characterize urban expansion and attempt to solve identified problems in the expansion process.

2.2. Remote Sensing Images and Other Materials
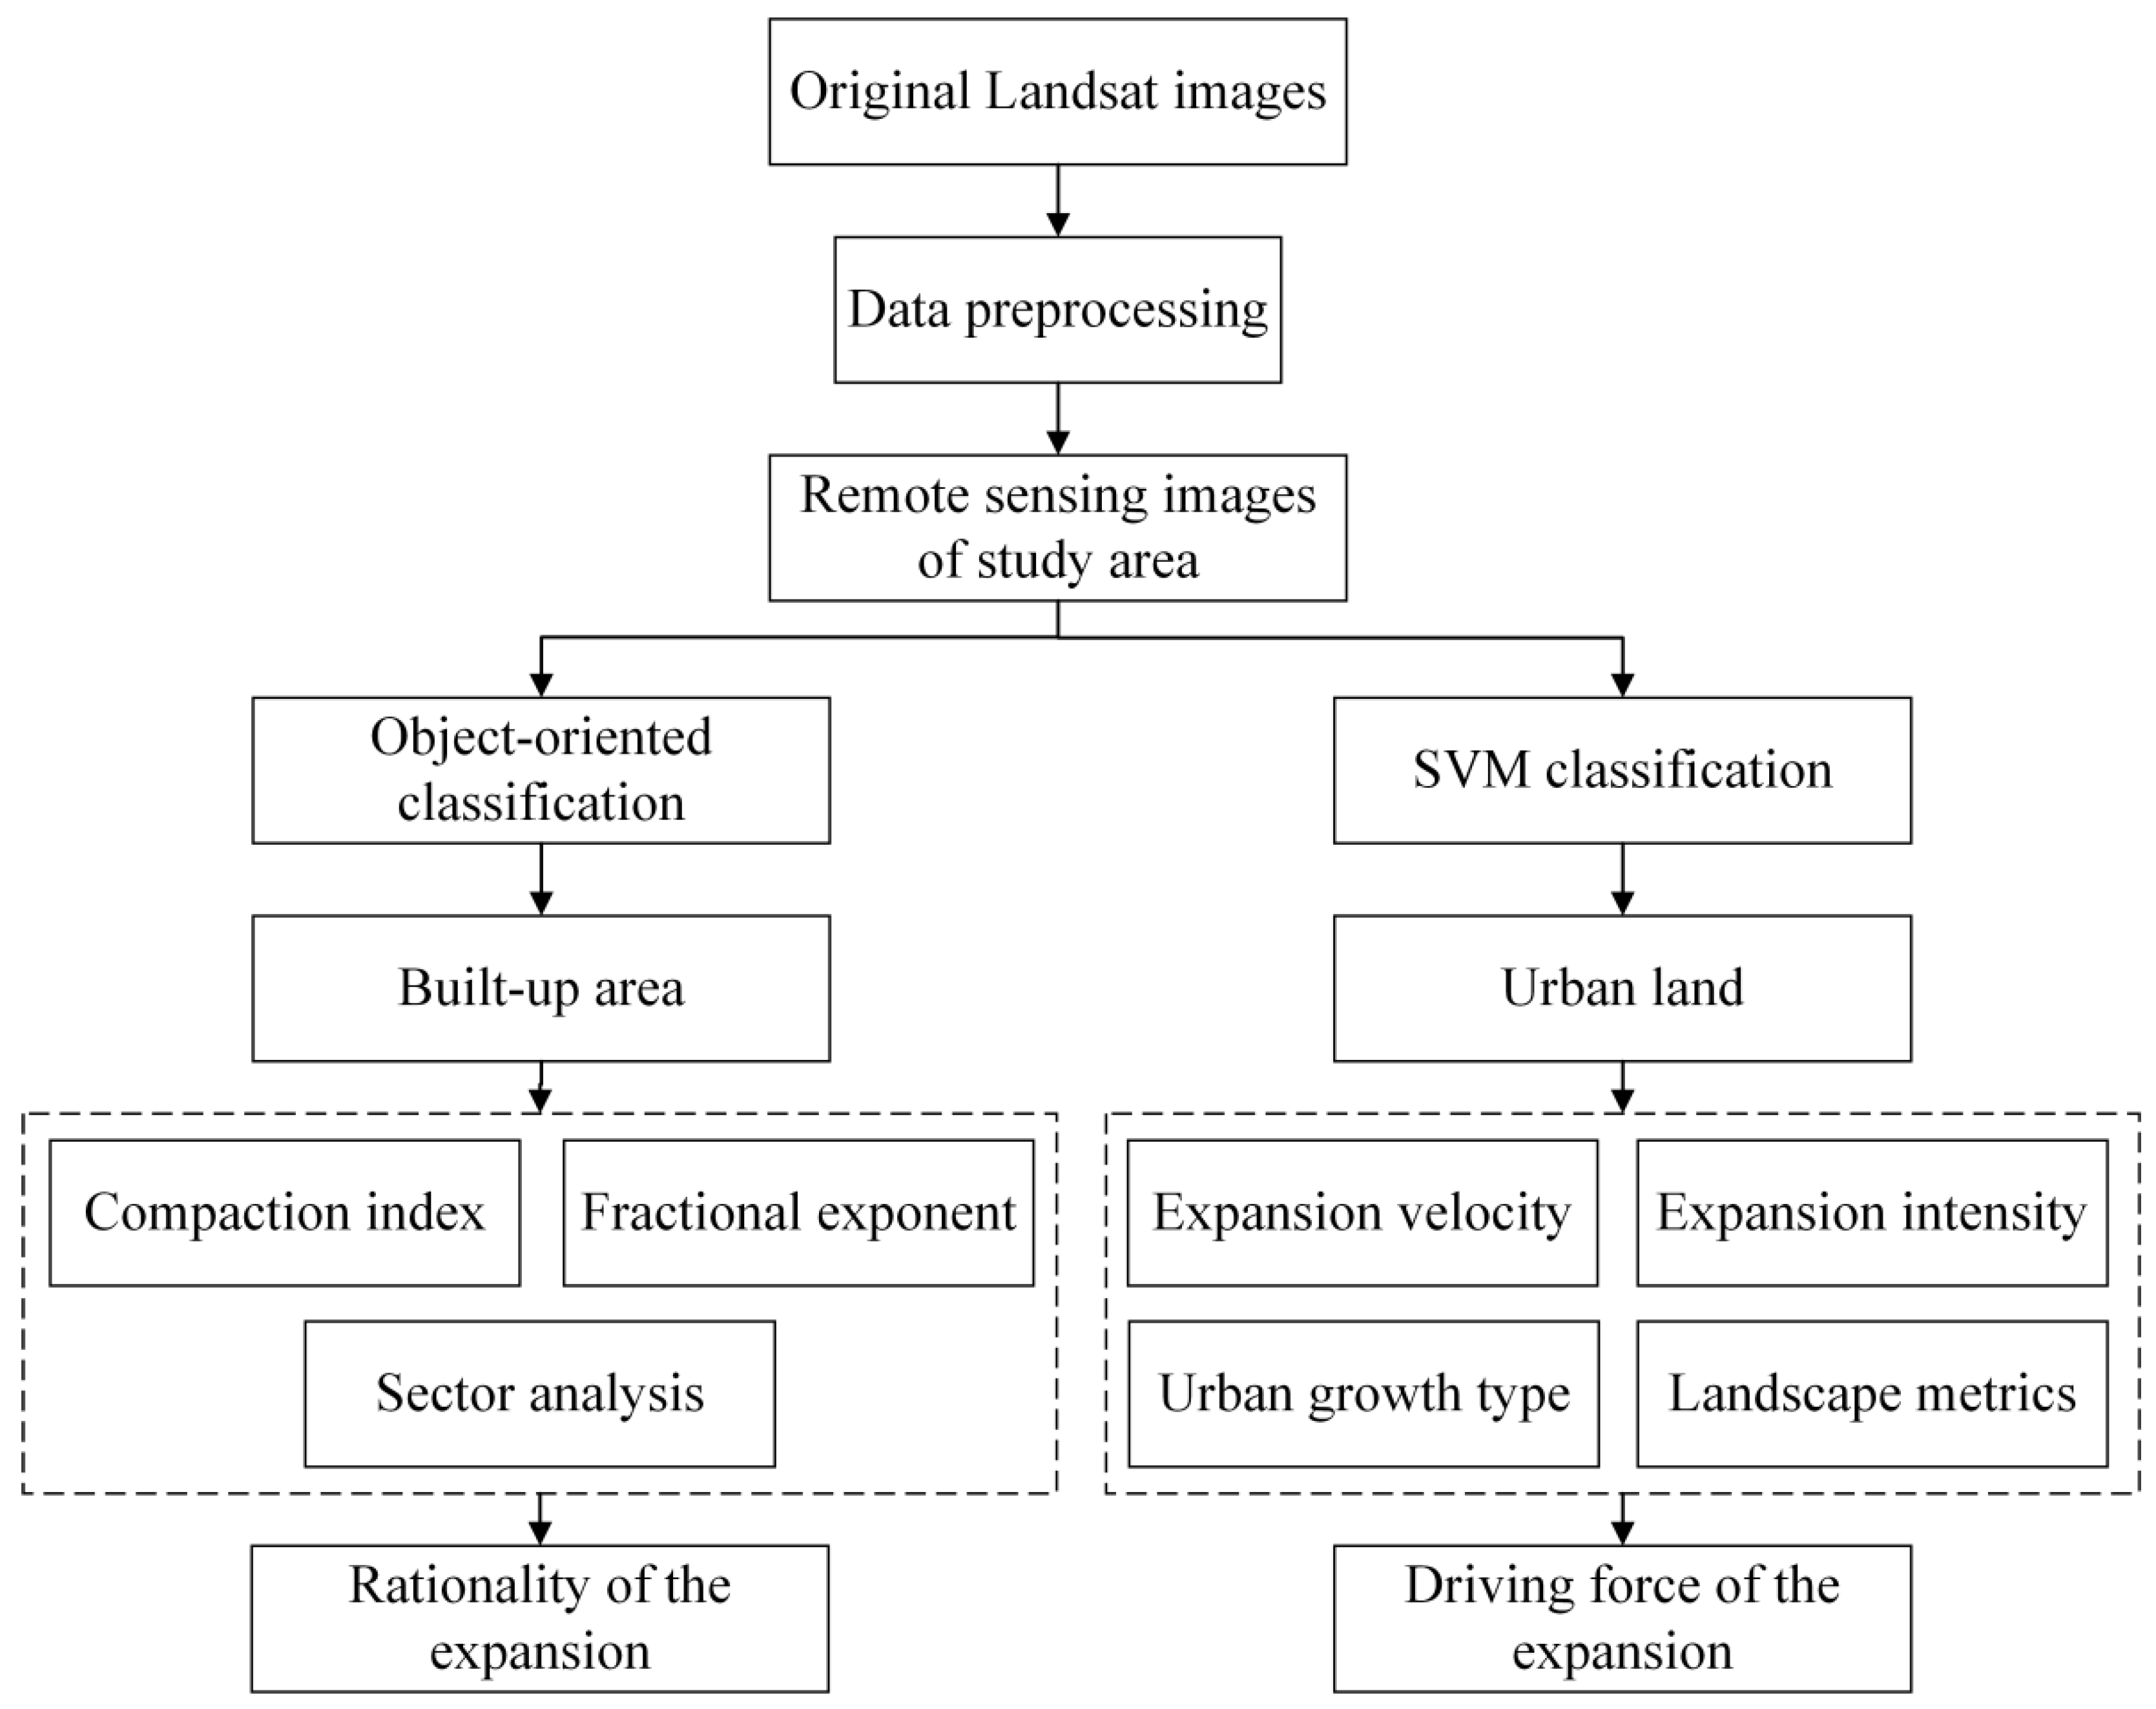
Since 1972, a series of Landsat satellites have been launched and have provided many high-quality remote sensing images for detecting the earth’s resources and environment. Seven sequential series of remote sensing images (1990, 1995, 2000, 2005, 2010, 2015, and 2020) were chosen to obtain land cover information of the past three decades in the study area. Cloud-free TM images before 2015 and OLI images obtained after 2015 were acquired from the United States Geological Survey (USGS) website (http://www.usgs.gov/, accessed on 18 October 2021). In addition, the remote sensing images from July–September were selected to ensure that the vegetation and crops in the study area are luxuriant as far as possible on the basis of cloud-free images, which can help to improve classification accuracy. The path-row numbers, procurement dates, and resolution of the images used in this study are recorded in Table 1, and we used ENVI version 5.3 and ArcGIS version 10.2 to accomplish the data processing, including radiometric calibration, image mosaic, reprojection, clip, atmospheric correction, classification, and classification accuracy assessment.
In addition to basic remote sensing images, the free land use data of Hubei Province (1 km resolution), which we used to evaluate the reliability of the urban land area we extracted, were downloaded from the website of the Resources and Environmental Sciences and Data Center (https://www.resdc.cn/, accessed on 18 October 2021). The province boundaries inside China, the city boundaries inside the Hubei Provinces, and the district boundaries inside the Xiaonan District in vector format were obtained from the National Catalogue Service For Geographic Information website (https://www.webmap.cn/, accessed on 18 October 2021). Additionally, the socioeconomic data, demographic data, and other statistical data were collected from Xiaonan District Chronicles, Xiaonan Yearbook, Hubei Provincial Statistical Yearbook, and Xiaonan District National Economic and Social Development Statistical Bulletin of 1990–2020 [46,47,48].

3. Methods

As shown in Figure 2, the framework of this research mainly comprised three steps: (1) extracting the built-up area and urban land, (2) characterizing the expansion process of built-up area and urban land, and (3) exploring the temporal coevolution of built-up area with urban populations and the main driving force of urban land expansion, respectively.

3.1. Object-Oriented and SVM Classification

In this study, we extracted the built-up area and urban land in Xiaonan District and analyzed the urban expansion in Xiaonan District from these two aspects. The “built-up area” is the area with intense human activity. This area includes the concentrated part of the urban area and the urban construction land scattered in the suburbs, which are closely correlated with the city and have municipal public facilities [49]. The built-up area is usually an integrated spatial range, and small patches of vegetation and water area should be included. While “urban land” is a concept developed from the perspective of land use. It refers to the non-agricultural areas dominated by artificial surfaces, including industrial and commercial land, scientific and educational land, residential land, roads, and other traffic land, excluding the vegetation and water area inside the city.
For urban built-up area, we applied object-oriented classification combined with visual interpretation to map. The visual interpretation process mainly included the following content: (1) incorporating small green spaces, water spaces, and unused land between construction land into the built-up area to ensure the spatial continuity of the built-up area; (2) removing two large water bodies, the Gunzi River and Xian River, passing through the city; and (3) excluding other land-use types with an obvious distinction between urban boundaries.
Many researchers have studied the influence of different supervised classification methods on the accuracy of classification, proving that the support vector machine (SVM) has a relatively high classification accuracy on the land use information [50,51,52]. For urban land, we first obtained the land cover information by applying SVM classification, including four categories: urban land, grassland and areable land, water, and naked land. Then, we integrated them into two categories: urban and non-urban land. The kappa coefficients and overall accuracy were used to assess the performance of the obtained products [53,54,55].
At the same time, to ensure the reliability of the results we extracted, we compared the area of built-up area with the corresponding data from the China Urban Construction Statistical Yearbook and the area of urban land with the free land use data of Hubei Province (1 km resolution), which we downloaded from the website of the Resources and Environmental Sciences and Data Center (https://www.resdc.cn/, accessed on 18 October 2021). The difference was determined by calculating the absolute and relative errors. The results demonstrate that the areas of built-up areas and urban land were slightly biased from the data in the statistical yearbook and website with small errors.

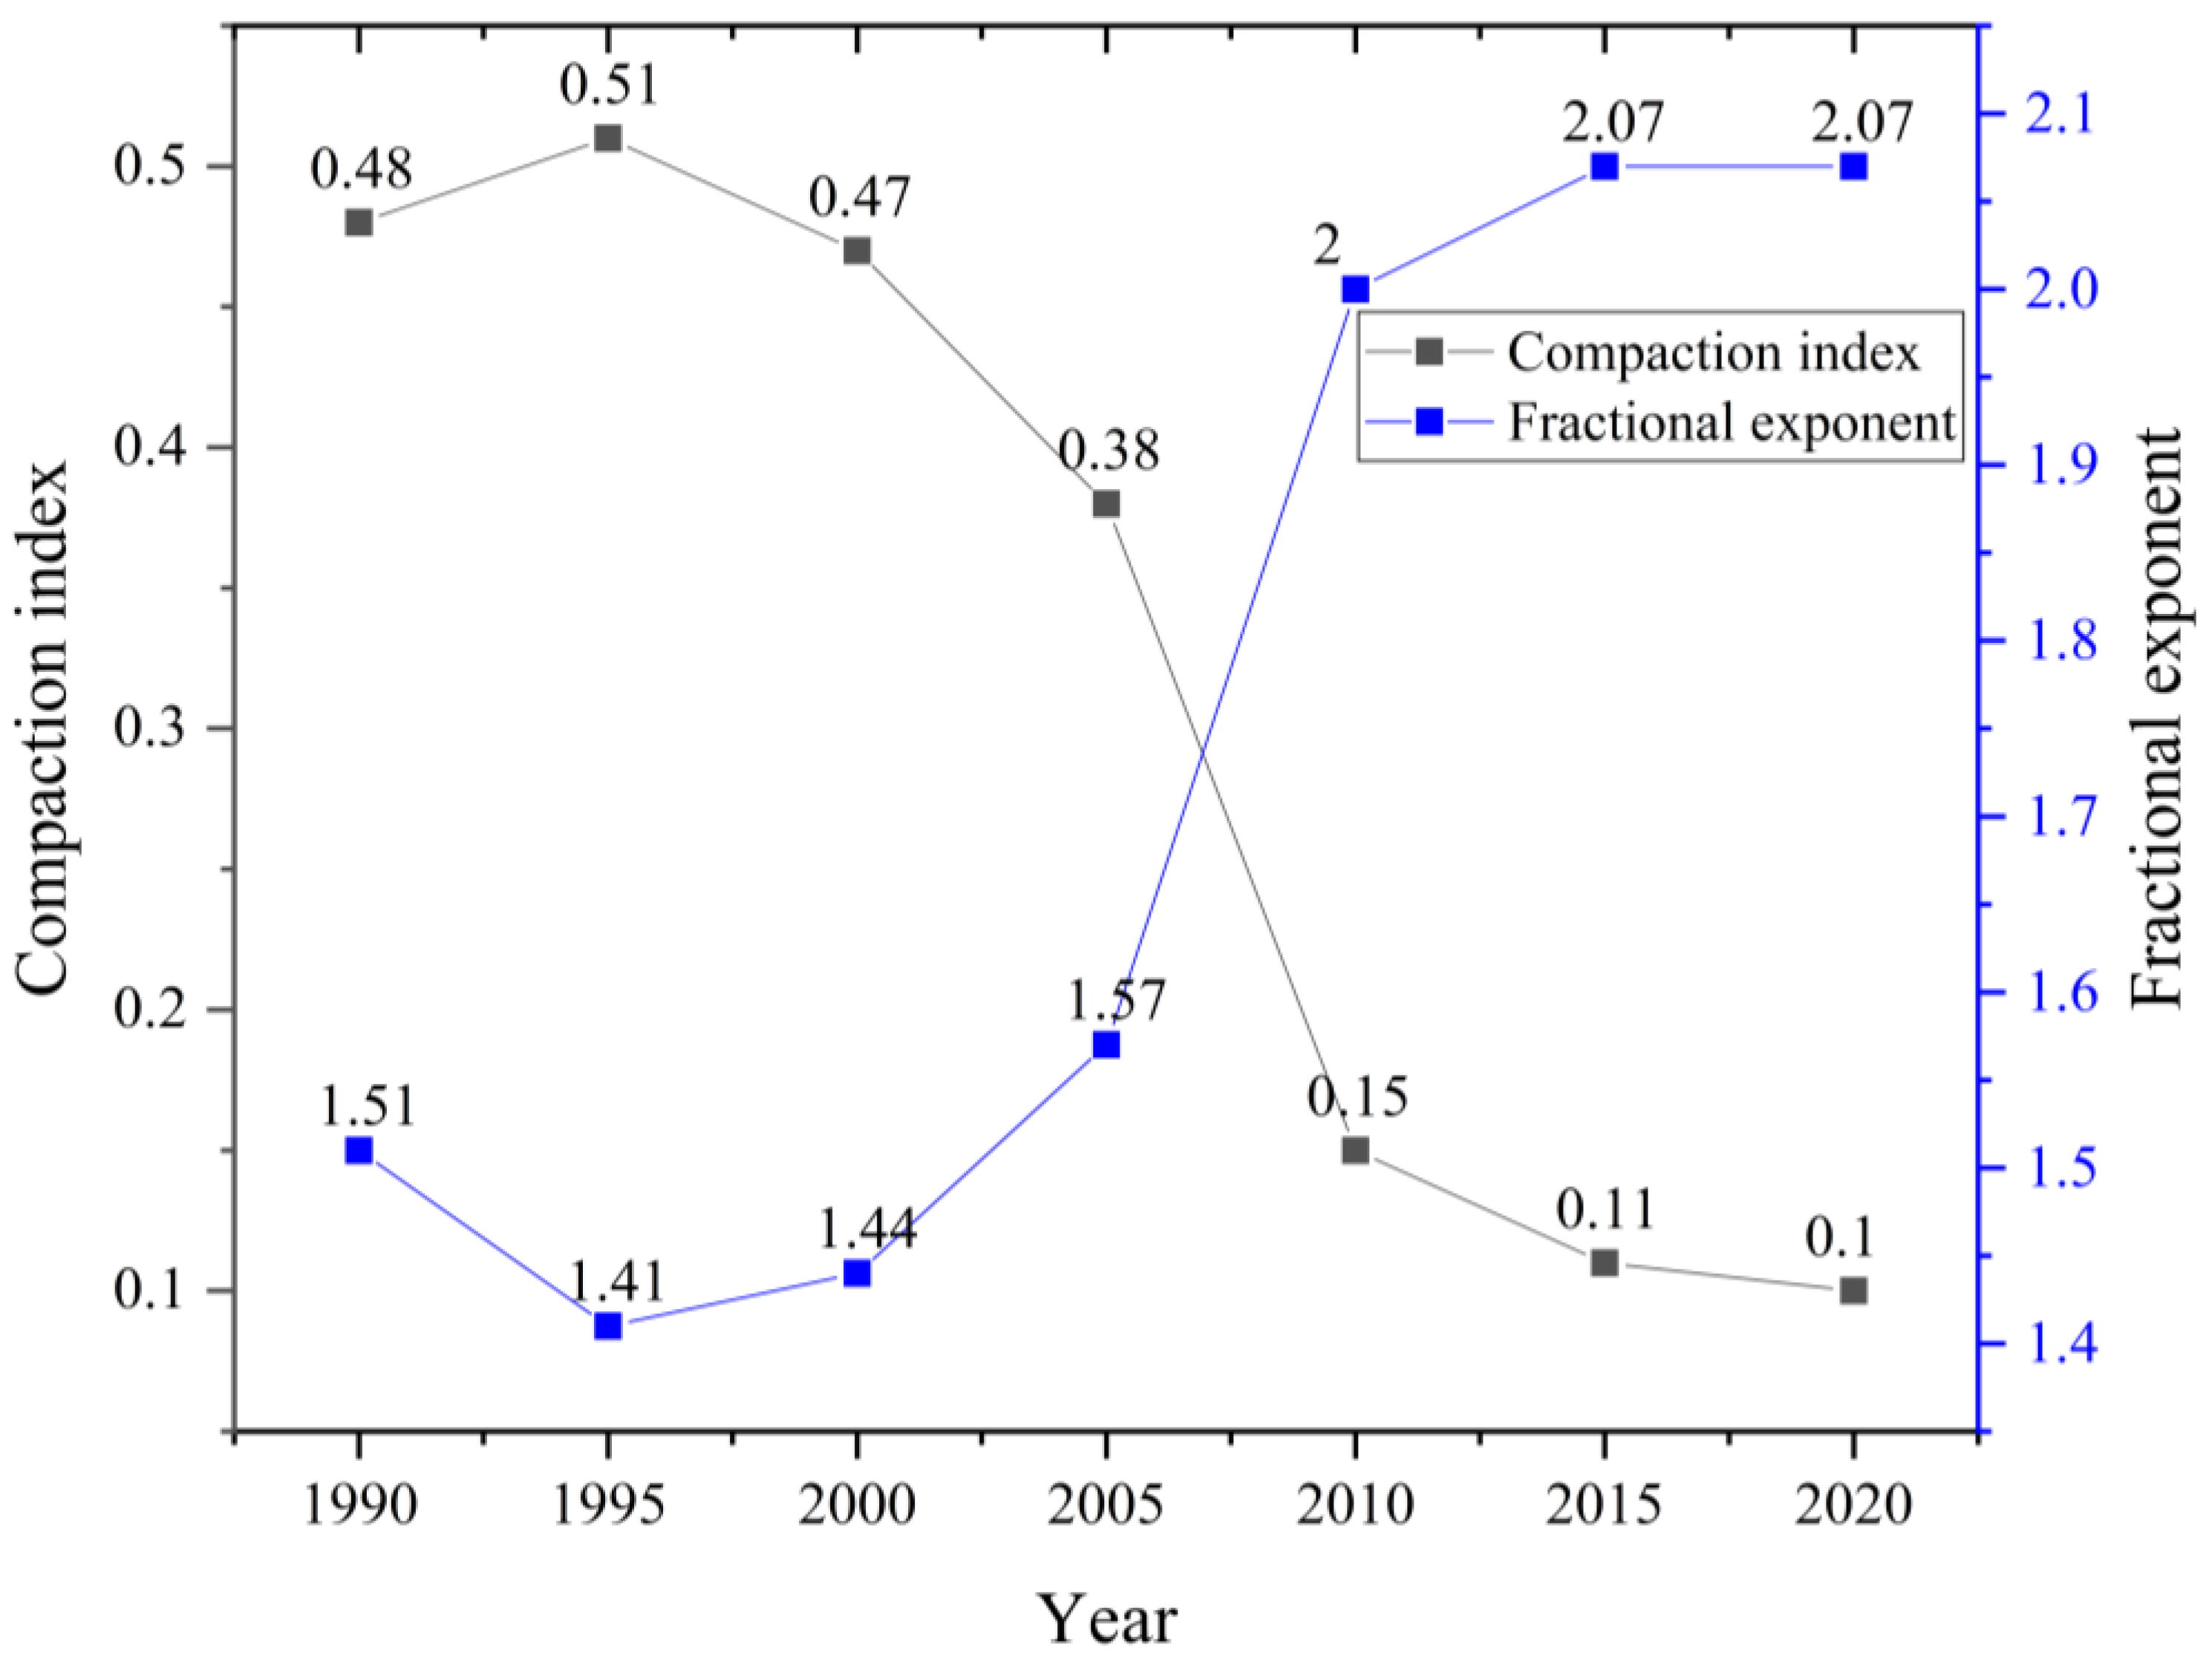
3.2. Compaction Index and Fractional Exponent

A city with a compact pattern is more convenient for centralizing various facilities and improving the utilization efficiency. It can also decrease the waste of resources and environmental pollution caused by urban expansion [56]. In 1961, Richardson proposed a compaction index to intuitively and fully reflect the outer spatial morphology of a city. The index was calculated as follows:
C = 2 π A L
where C represents the compaction index, the range of which is 0–1. A is the area of the urban land patch, and L is the perimeter of the external boundary of the urban land patch.
The fractional exponent was first proposed by Mandelbrot, B. B. [57]; the term “fractal” represents a pattern in which the smaller components reflect the whole in some form. Fractals are characterized by self-similarity and complexity. Some scholars have proposed that the spatial pattern of a city is usually complex and exhibits similarity over a given period, which can be regarded as exhibiting fractal development over time [58,59]. Therefore, they introduced the theory of fractals into the study of urban expansion. The fractional exponent is an important indicator for describing fractals that measures the regular degree and internal structure complexity of the external shape of urban land patches by its values. In this study, the index was calculated as follows:
D = 2 l n ( P 4 ) l n A
where D represents the fractional exponent, P is the perimeter of the external boundary of the urban land patch, and A is its area. The larger the fractional exponent, the more complex and irregular the shape of the urban patch.

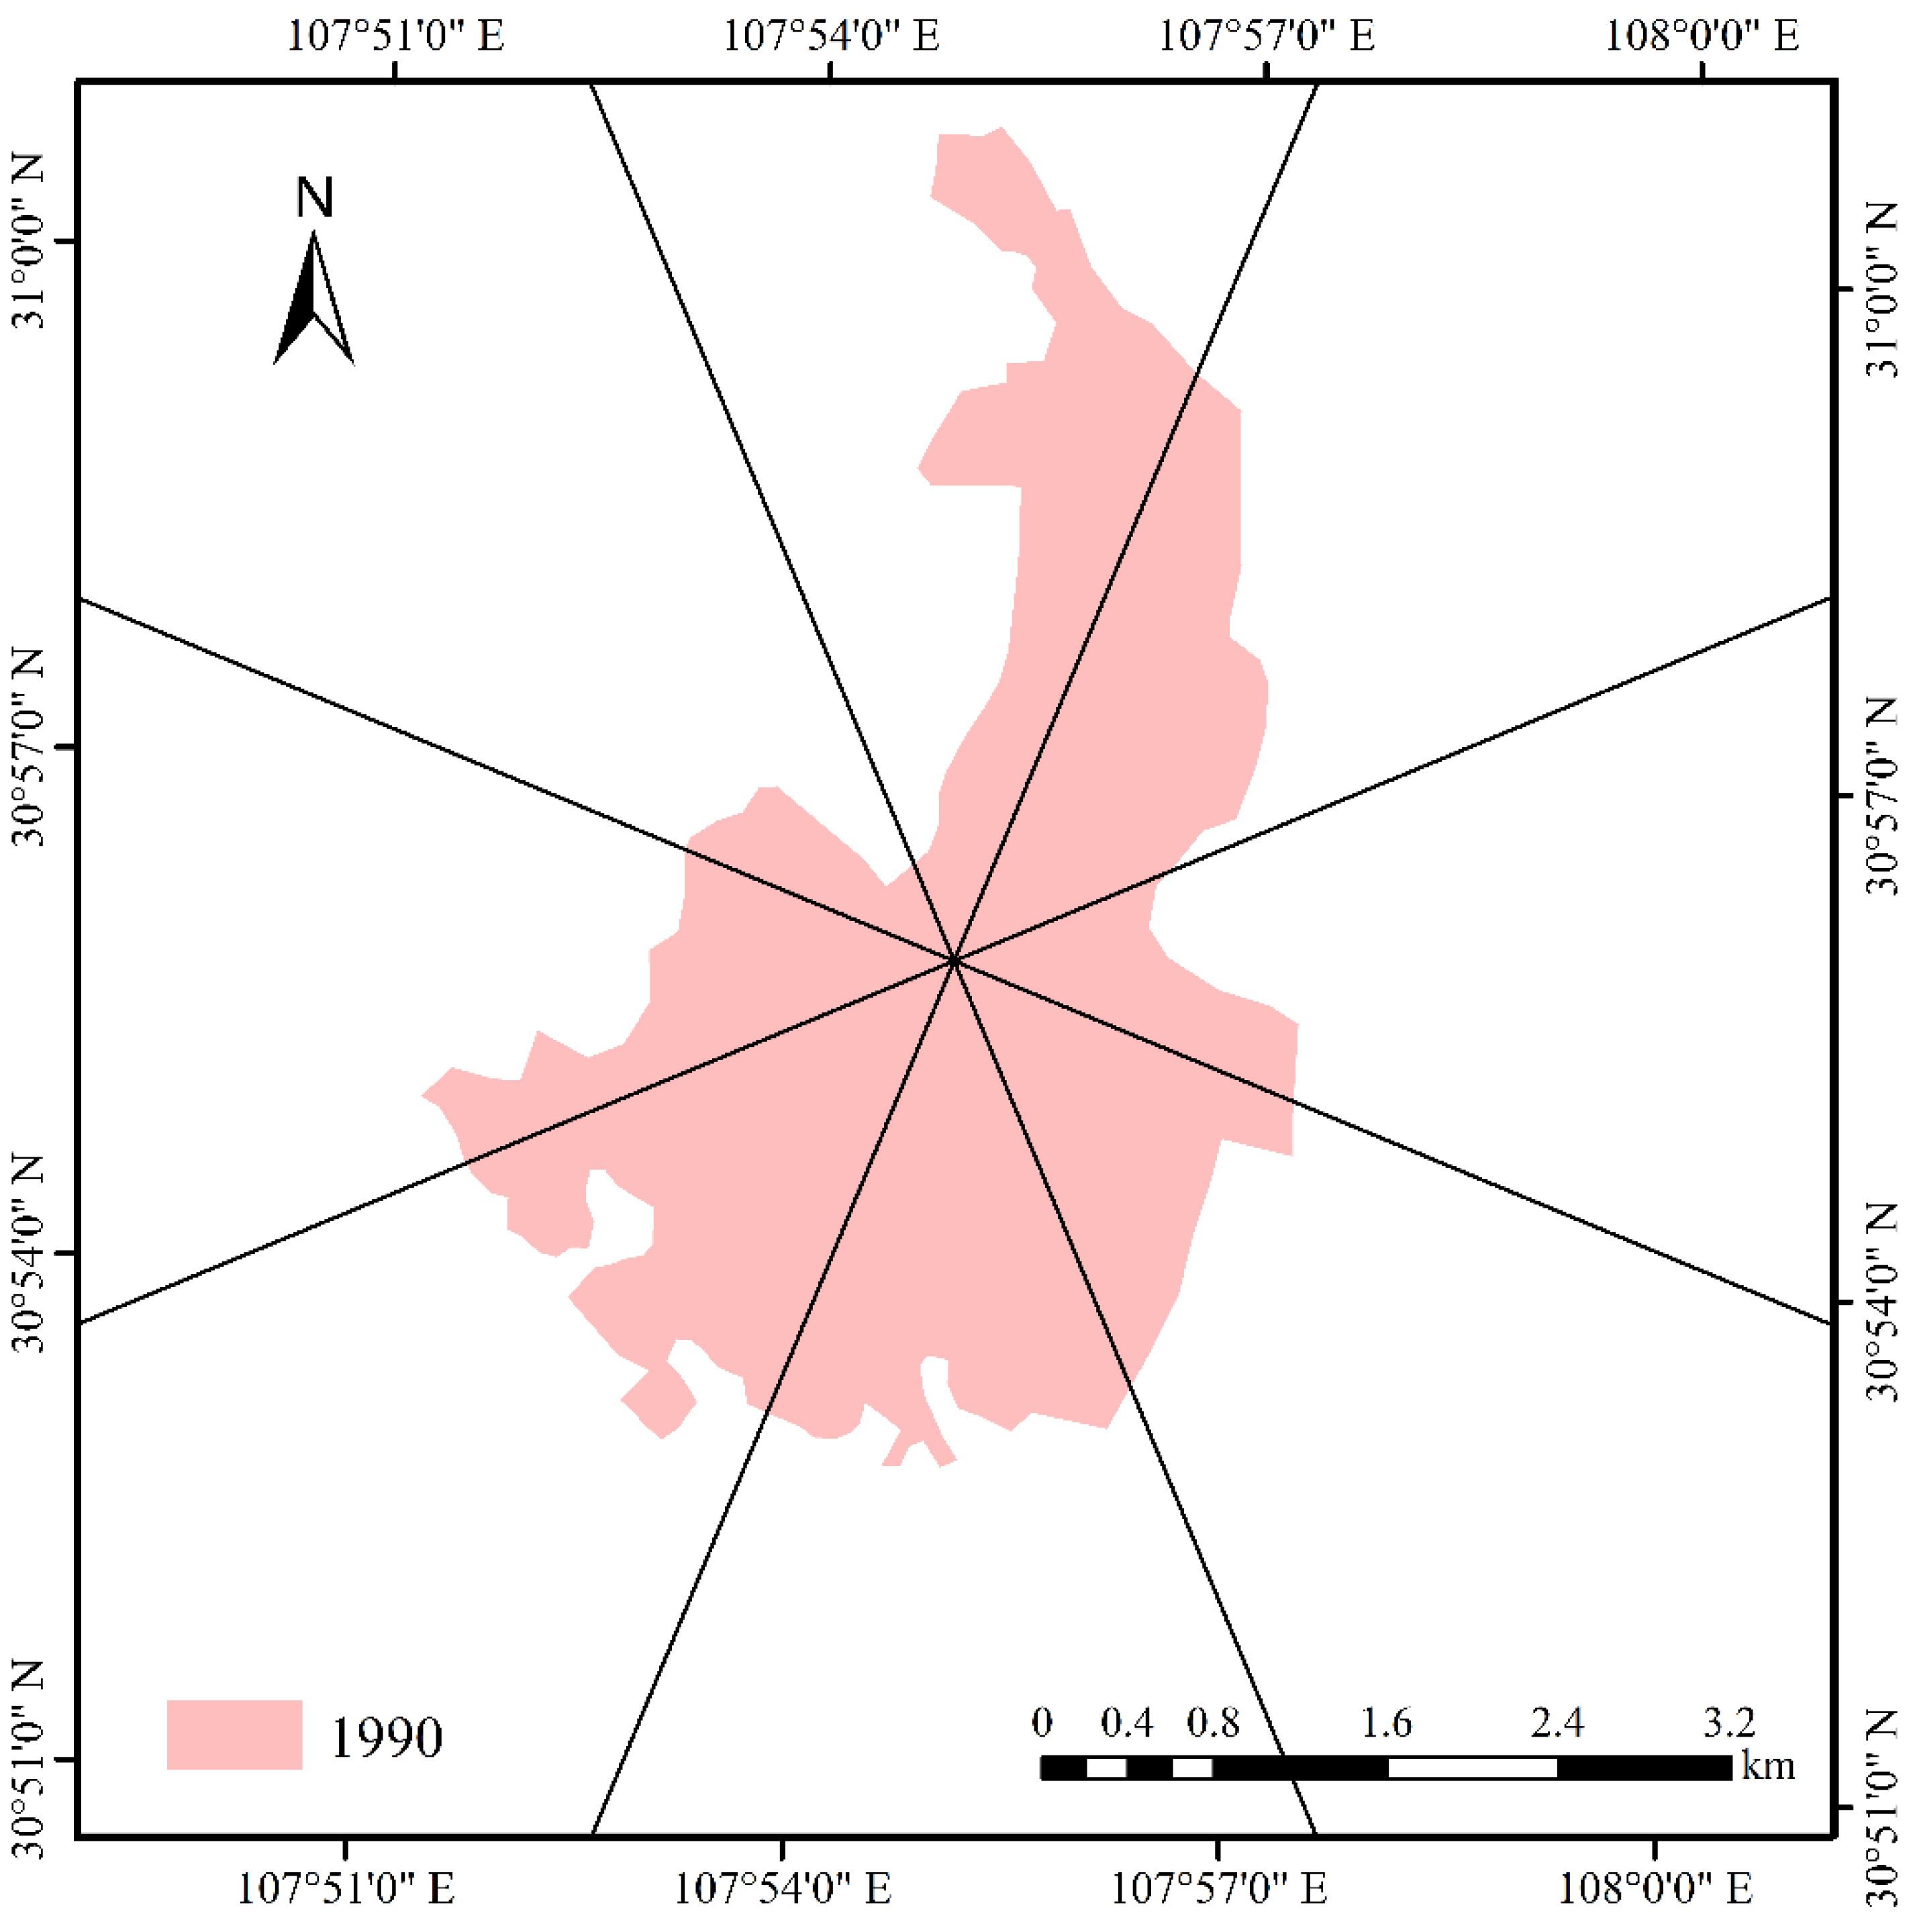
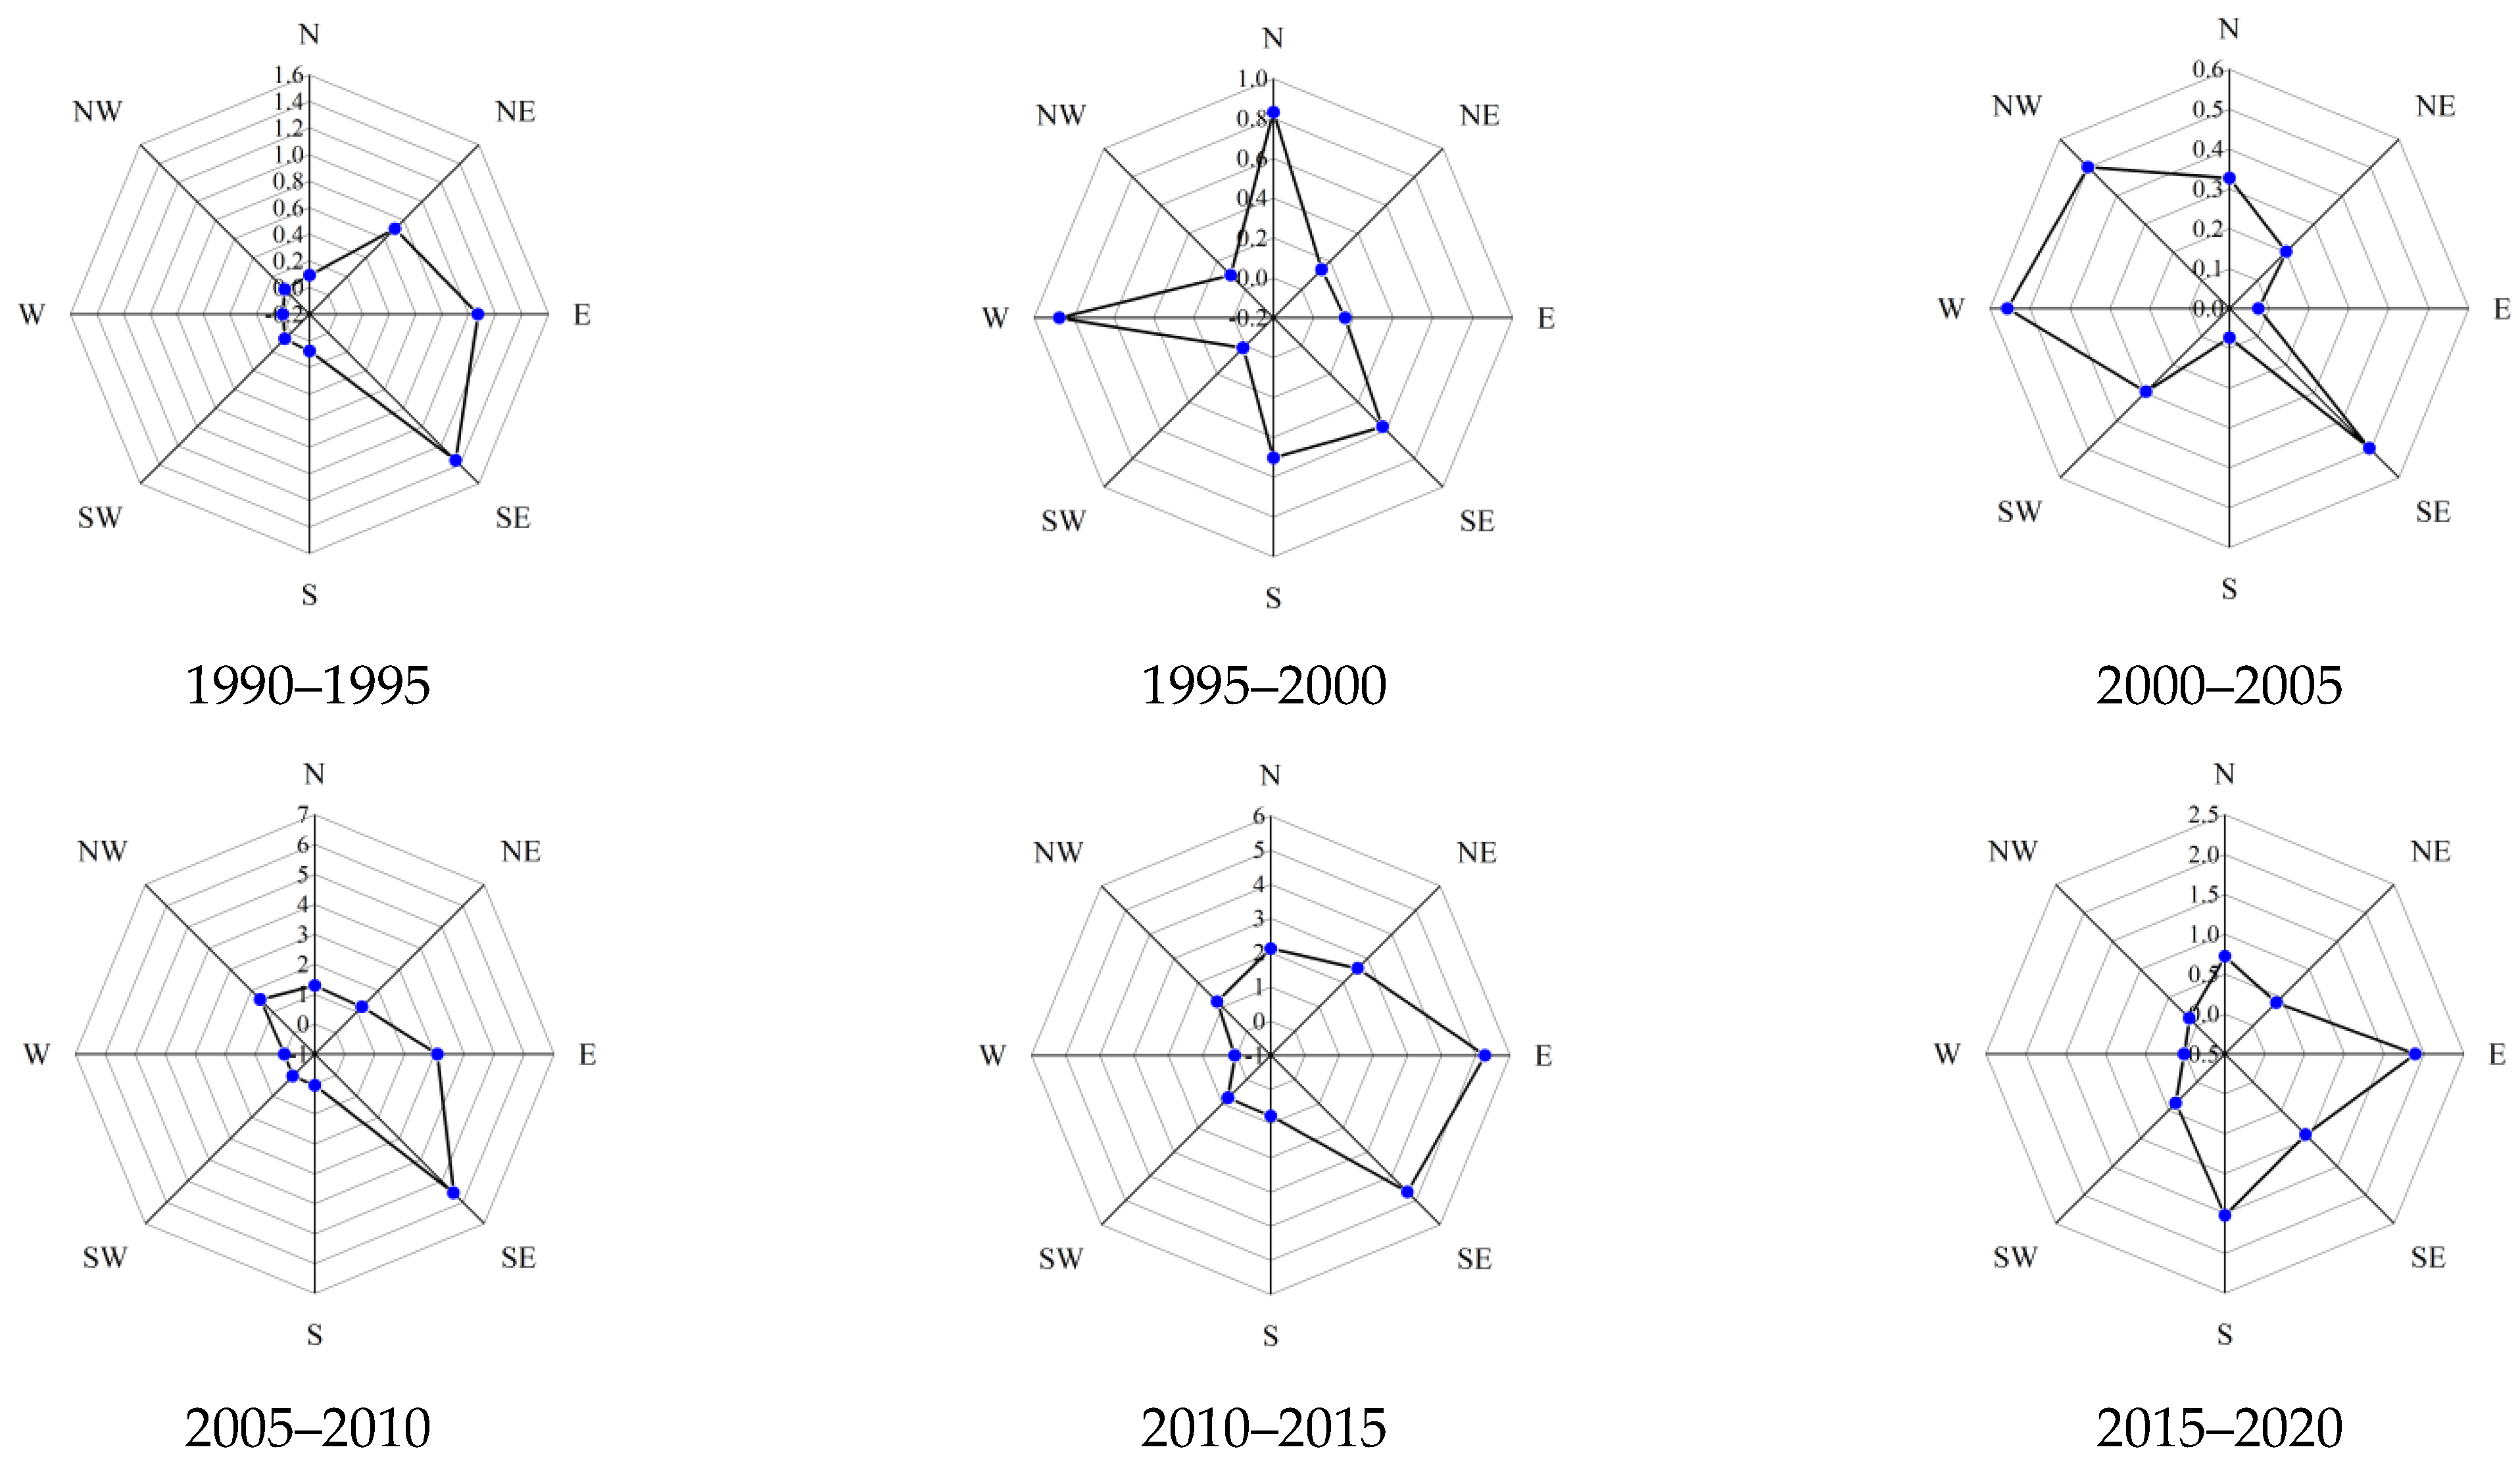
3.3. Sector Analysis

We further examined detailed changes in different directions. Sector analysis is a kind of descriptive GIS spatial analysis method based on stacking statistics and analysis of sector units. It has been widely used in the field of urban expansion research, but there is no standard on how to divide the object into several equal sectors in its application. Peng and Tang (2020) have searched and counted the relevant 171 articles, and found that for the number of sectors, eight sectors were relatively preferred (104/171), for sector orientation, the azimuth sector (there are always 4 sectors facing 4 basic geographical orientations: north, east, south, west) appears relatively more (110/171) [60]. Based on the general applicability of the “eight sectors” model and the feature of the expansion of the built-up area (the expansion of built-up area from 2005–2010 was mainly in the southeast direction), we chose the “eight sectors” model which generated by embedding four middle directions (northeast, northwest, southwest, southeast) in four basic directions (north, east, south, west) derived from a geographic perspective. The specific sector analysis steps are as follows: first, four transects across the city center of 1990 were generated to divide the built-up area into eight sectors (Figure 3), and the expanded area every five years of each sector was calculated. By analyzing the change of construction land in each sector, we identified the difference in expansion in different directions.

3.4. Expansion Velocity and Intensity

We calculated two indexes of urban land expansion: expansion velocity (V) and expansion intensity (R). The two indexes can compare the speed of urban expansion. The definitions of V and R are as follows:
V = A e n d A s t a r t d
R = A e n d A s t a r t A s t a r t × 1 d × 100 %
where A s t a r t   and A e n d   are the urban land area at the beginning and end, respectively. d is the time span of the study period.

3.5. Urban Growth Type

Scholars have proposed different standards for the definition of urban growth type, leading to a variety of model divisions of urban land. Leorey and Nariida (1999) divided the types of urban land expansion into compact, edge, corridor, and business-as-usual [61]. Emily et al. (2003) also summarized five types: infill, expansion, isolated, linear branch, and clustered branch [62]. The division system of the urban growth type is complex, and the results are highly subjective and dependent on the judgment of researchers. Therefore, to determine the urban land growth type conveniently, accurately, and quickly, Xu et al. (2007) proposed a method of quantitatively dividing urban growth types into infilling, edge-expansion, and leapfrogging categories [63]. Infilling is defined as new urban patches formed by filling gaps in the existing urban patches. Edge-expansion is the newly developed urban patches extending outward along the edge of the existing urban patches. Leapfrogging growth represents new urban patches developed independently and without overlapping with any existing urban patches. The metric S is used to distinguish the three urban growth types:
S = L C P
where LC is the length of the boundary between the new urban patch and the old one, and P is the boundary length of the new urban patch. If S = 0, it indicates that the new urban patch has no public border between the old urban patch, indicating that the type of growth is leapfrogging. The type is edge-expansion when 0 < S ≤ 0.5 and infilling when 0.5 < S ≤ 1.

3.6. Landscape Metrics

Landscape patterns refer to the spatial structure characteristics of land use [64]. FRAGSTAS is a landscape metric calculation software that can calculate 59 landscape metrics at three different levels. In this study, we selected four landscape metrics: patch density (PD), landscape shape index (LSI), aggregation index (AI), and cohesion index (COHESION) to analyze the landscape pattern characteristics of urban land in Xiaonan District from 1990–2020. The landscape metric values were calculated by using FRAGSTATS version 3.0 with the eight-neighbor rule. The specific information of the four landscape metrics is as follows:
(1) Patch density (PD):
P D = n i A ( 100 , 00 ) ( 100 )
where n i represents the total area of landscape class i , A represents the total area of all landscape classes, and the value of P D represents the number of patches per unit area.
(2) Landscape shape index (LSI):
The value of LSI indicates patch shape complexity by calculating the degree of deviation between a patch and a square or circle with an equal area of the patch. In FRAGSTATS, the calculation of this index is standard by the equal-area square, and the specific formula is as follows:
L S I = 0.25 E A
where 0.25 is the square shape parameter, E represents the total boundary length of all patches of a landscape type, and A is the total area of patches for this type.
L S I ≥ 1, when L S I = 1 means the patch has the most regular shape, the larger the value of L S I , the more deviated from the square and the more irregular the shape of the patch.
(3) Aggregation index (AI):
A I = [ g i i m a x g i i ] × 100
where g i i represents the number of adjoining patches of landscape class i.
If the value of AI get higher with the area of urban land increasing, it indicates the distance between the patches of urban land becomes smaller, and the degree of concentrated land utilization has increased.
(4) Patch cohesion index (COHESION):
C O H E S I O N = [ 1 j = 1 m p i j j = 1 m p i j a i j ] × [ 1 1 A ] 1 × 100
where p i j represents the boundary length between patches of landscape class i and patches of landscape class j; a i j is the proportion of patch j to class i; and A is the sum area of all patches.

3.7. Urban Area–Population Elastic Coefficient and Allometry Model

The urban area–population elastic coefficient is an important index applied for measuring the adaptability of urban population growth and built-up area growth. It describes the quantitative relationship between the growth rate of the built-up area and the urban population, which can reflect the rationality of urban expansion and be calculated as follows:
R i = S i P o p i
where S i and P o p i are the average growth rates of built-up area and urban population in period i, respectively.
The urban area–population elastic coefficient was first proposed by Gehl (2002). He also proposed that urban expansion is reasonable when the value of the urban area–population elastic coefficient is 1.12. When the value is lower or higher than 1.12, the urban expansion is less reasonable and will probably affect sustainable urban development in the future, as recognized by many scholars in China [65,66,67].
In general, there is not a simple linear relationship between built-up area expansion and urban population growth, and simply determining the rationality of urban expansion using only the urban area–population elasticity coefficient mentioned above is not sufficiently comprehensive. In the 1950s, some scholars introduced the allometry model in the field of biology into the study of urban expansion to explore the relationship between urban population and urban land [68]. The allometry model is as follows:
A = a N b
where A and N represent the areas of the built-up region and urban population, respectively, and a and b are coefficients. The values of a and b can be obtained by examining the built-up area sequence and the urban population sequence of the corresponding year.
According to the research of relevant scholars [69,70,71], for Chinese cities, when b = 0.85, the growth rate of built-up areas and growth rate of urban populations are similar, the process of urban expansion in the study period is appropriate. When b < 0.85, urban expansion is regarded as negative growth, and the urban population grows faster than the built-up area, which may cause environmental pollution and a decline in quality of life. When b > 0.85, it is regarded as positive growth, and the growth rate of the urban population is lower than that of the built-up area, which may result in the waste of construction land.

3.8. Grey Relation Analysis

The grey system theory was first proposed by Tan and Deng based on system control theory in the field of systems engineering [72]. It is a method for analyzing and determining the degree of influence or contribution to the main behavior between a series of relevant factors. Based on the grey system theory, we can obtain the correlation between the factors through data processing with incomplete information and then identify the main influencing factor by comparing the value of the coefficient. The steps for the grey relation analysis in our study are as follows:
(1) The sequences to analysis were determined. In this paper, the area of urban land was used as the reference sequence (x) and the relevant index sequence group ( y i ) as the comparison sequence.
Previous research shows the expansion of urban land is the result of internal factors (e.g., terrain and natural environment) and external factors (e.g., population, economy, transportation, and policy) [73,74,75]. Internal factors restrict the direction of urban expansion and the spatial shape of cities, while external factors promote the expansion of urban land. The population is the most dynamic driving factor of urban expansion [76]. The rapid development of the city makes many people transfer to the city, which will inevitably increase the demand for residential buildings, roads, hospitals, parks, shopping malls, and other related living facilities, resulting in an increase in urban land. Economic factors are the most direct and fundamental factor for urban expansion. The high-level economic development will attract many high-quality enterprises to settle in the region, bringing the expansion of industrial land and transportation land. The gross domestic product (GDP) can be used to reflect the economic level of a region directly. The government invests most public revenue into urban land development, so government revenue can also promote an increase in urban land. Investment in fixed assets can stimulate the rapid development of the local economy, increase the proportion of the secondary and tertiary industries, and consistently upgrade the industrial structure, which will also lead to an increase in industrial land, commercial land, road transportation land, public facilities, and other urban land. Based on the qualitative analysis above and the availability of the corresponding statistical data, the factors including total population, GDP, proportion of secondary industry, proportion of tertiary industry, government revenue, and investment in fixed assets of the whole society were selected to study the main driving force of the urban land expansion in Xiaonan District as the comparison sequence ( y i ).
(2) Dimensionless processing. The multiple indicators we selected have different dimensions and different units. In order to avoid errors caused by different dimensions, data need to be dimensionless. In this study, each value of sequence was divided by the first value of this sequence (initial value).
(3) The absolute value of the difference between comparison sequence group ( y i ) and reference sequence ( x ) was calculated to find the maximum z ( k ) m a x and minimum z ( k ) m i n .
z ( k ) = x i ( k ) y j ( k ) ,   k = 1 , 2 , , n
(4) Correlation coefficients were calculated as follows:
r i j ( k ) = z ( k ) m i n + ρ z ( k ) m a x z ( k ) + ρ z ( k ) m a x ,   k = 1 , 2 , , n
where ρ is the resolution coefficient that increases the difference significance between the correlation coefficients, and the value of the ρ is in the range of 0–1, usually taking a value of 0.5.
(5) Correlation indexes were calculated on the correlation coefficients.
r i j = 1 N i j 1 N r i j ( k ) ,   k = 1 , 2 , , n

4. Results

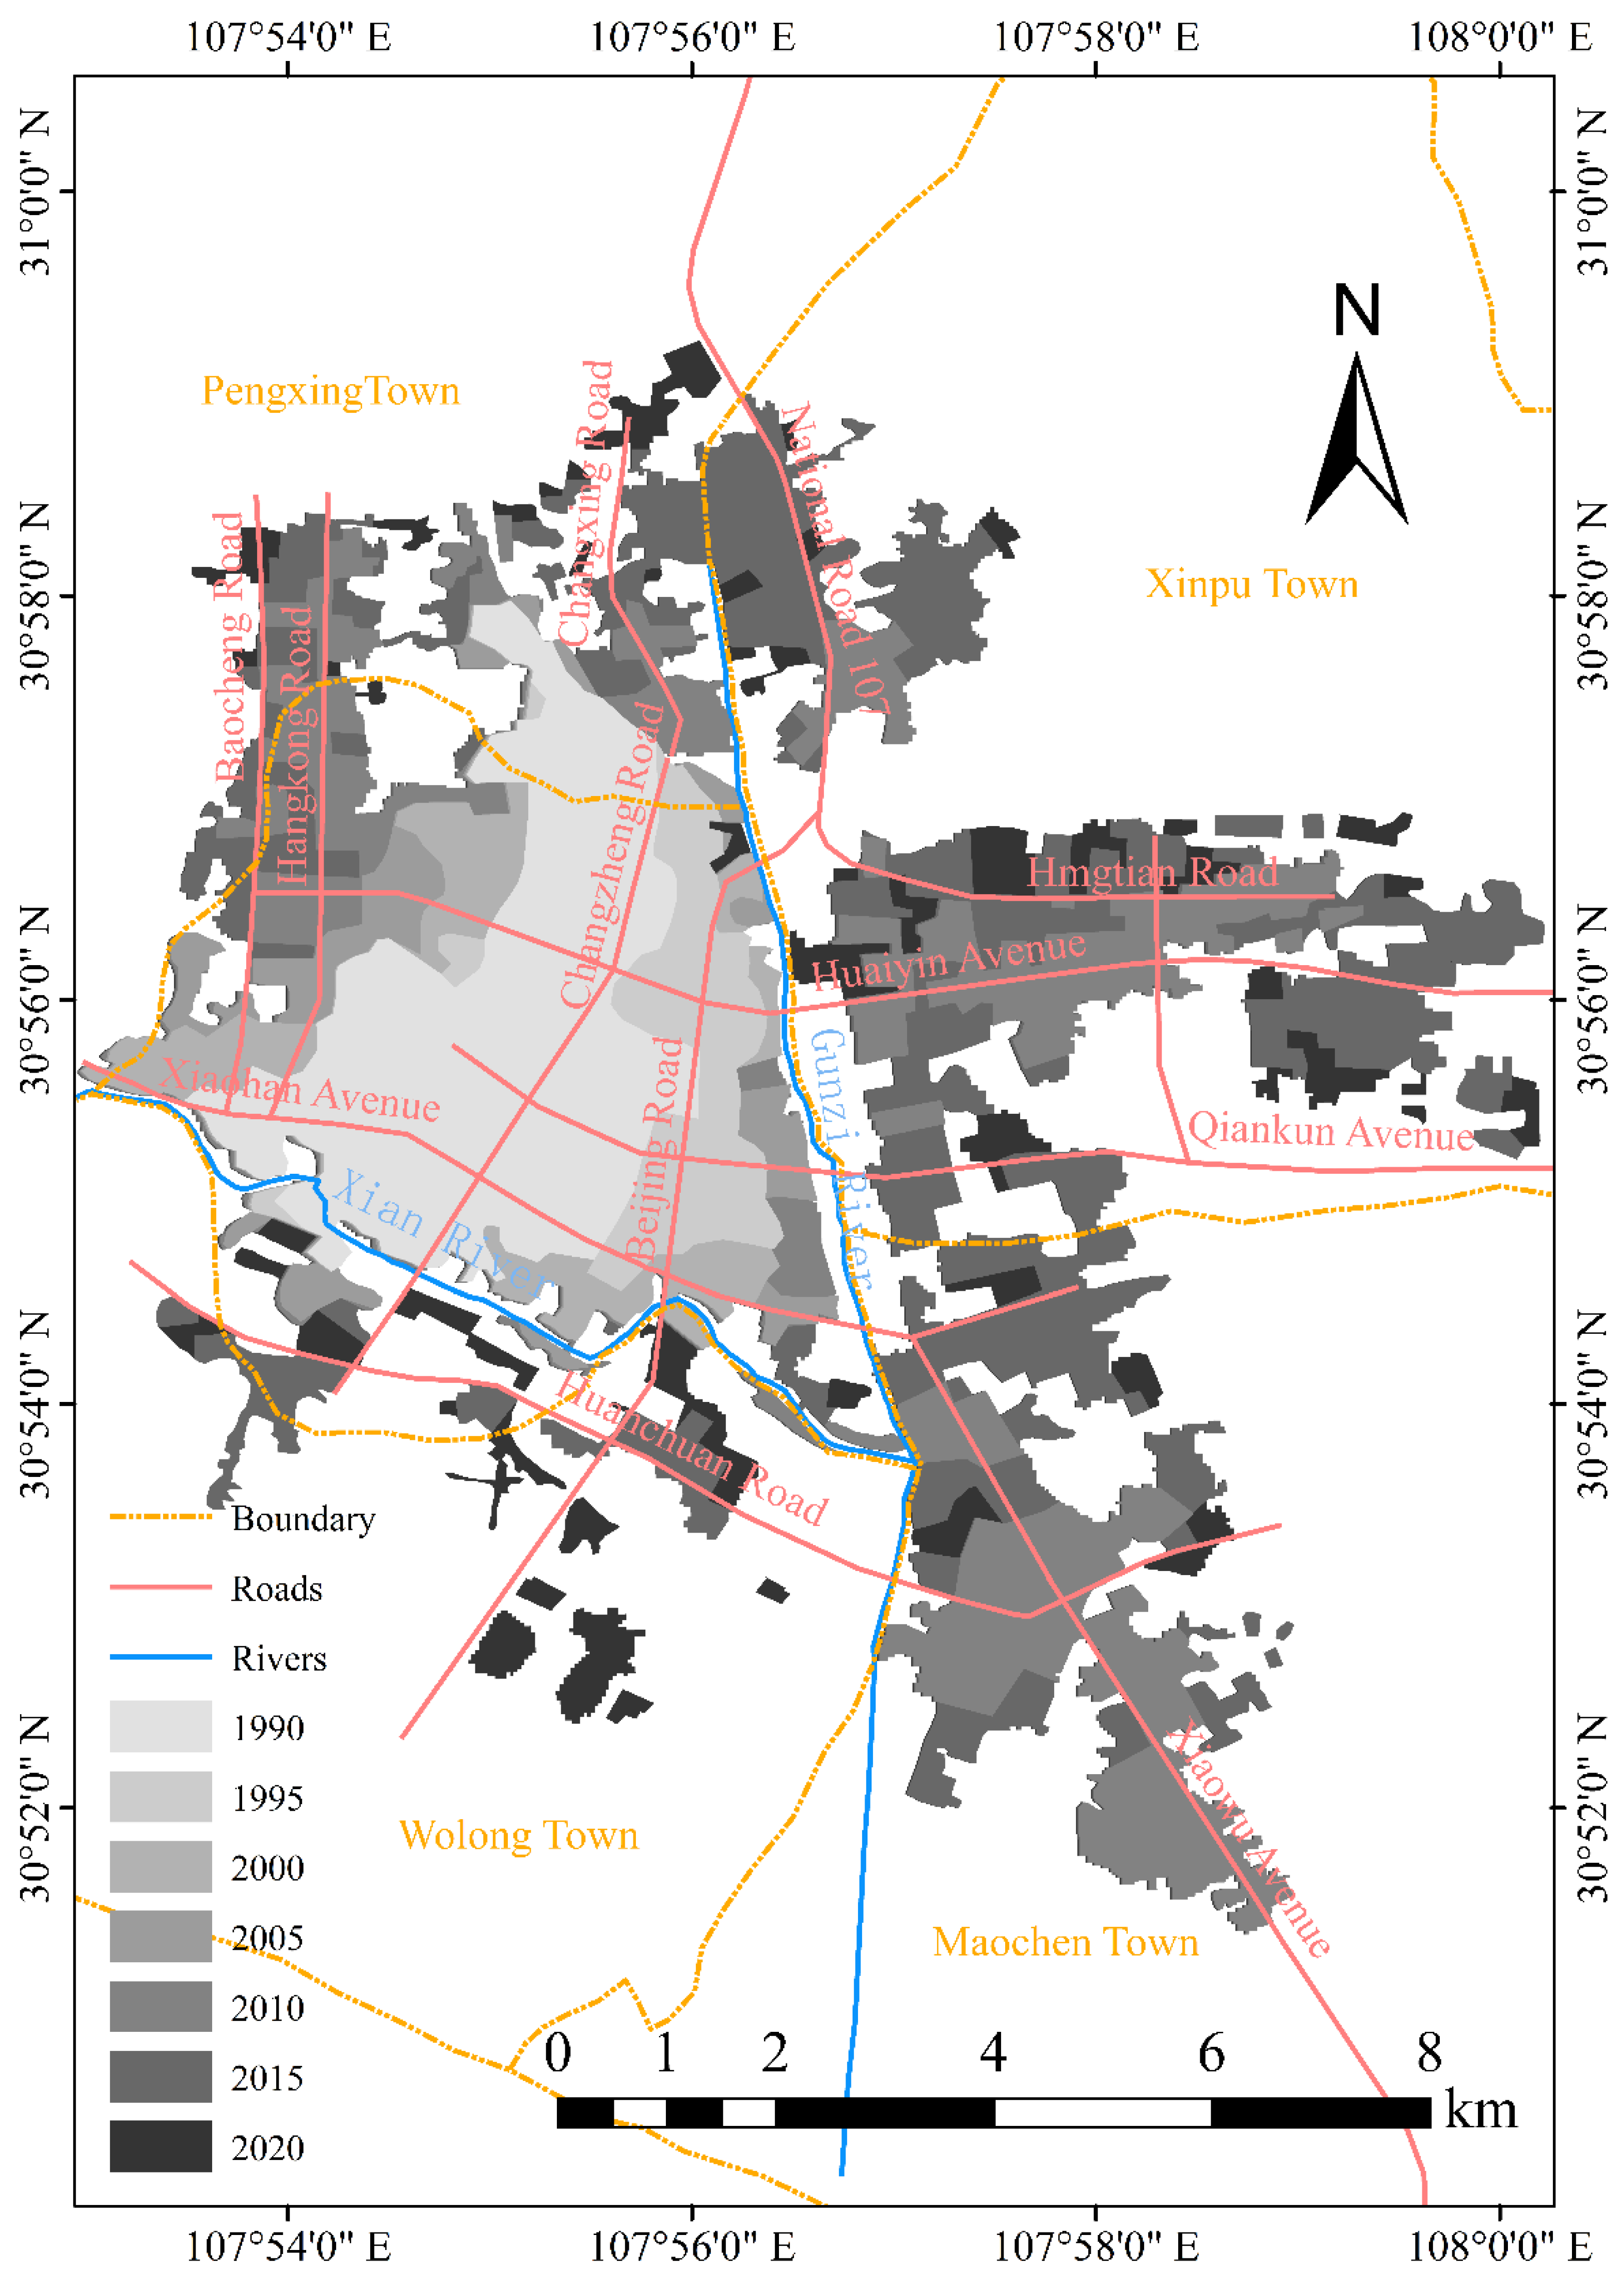
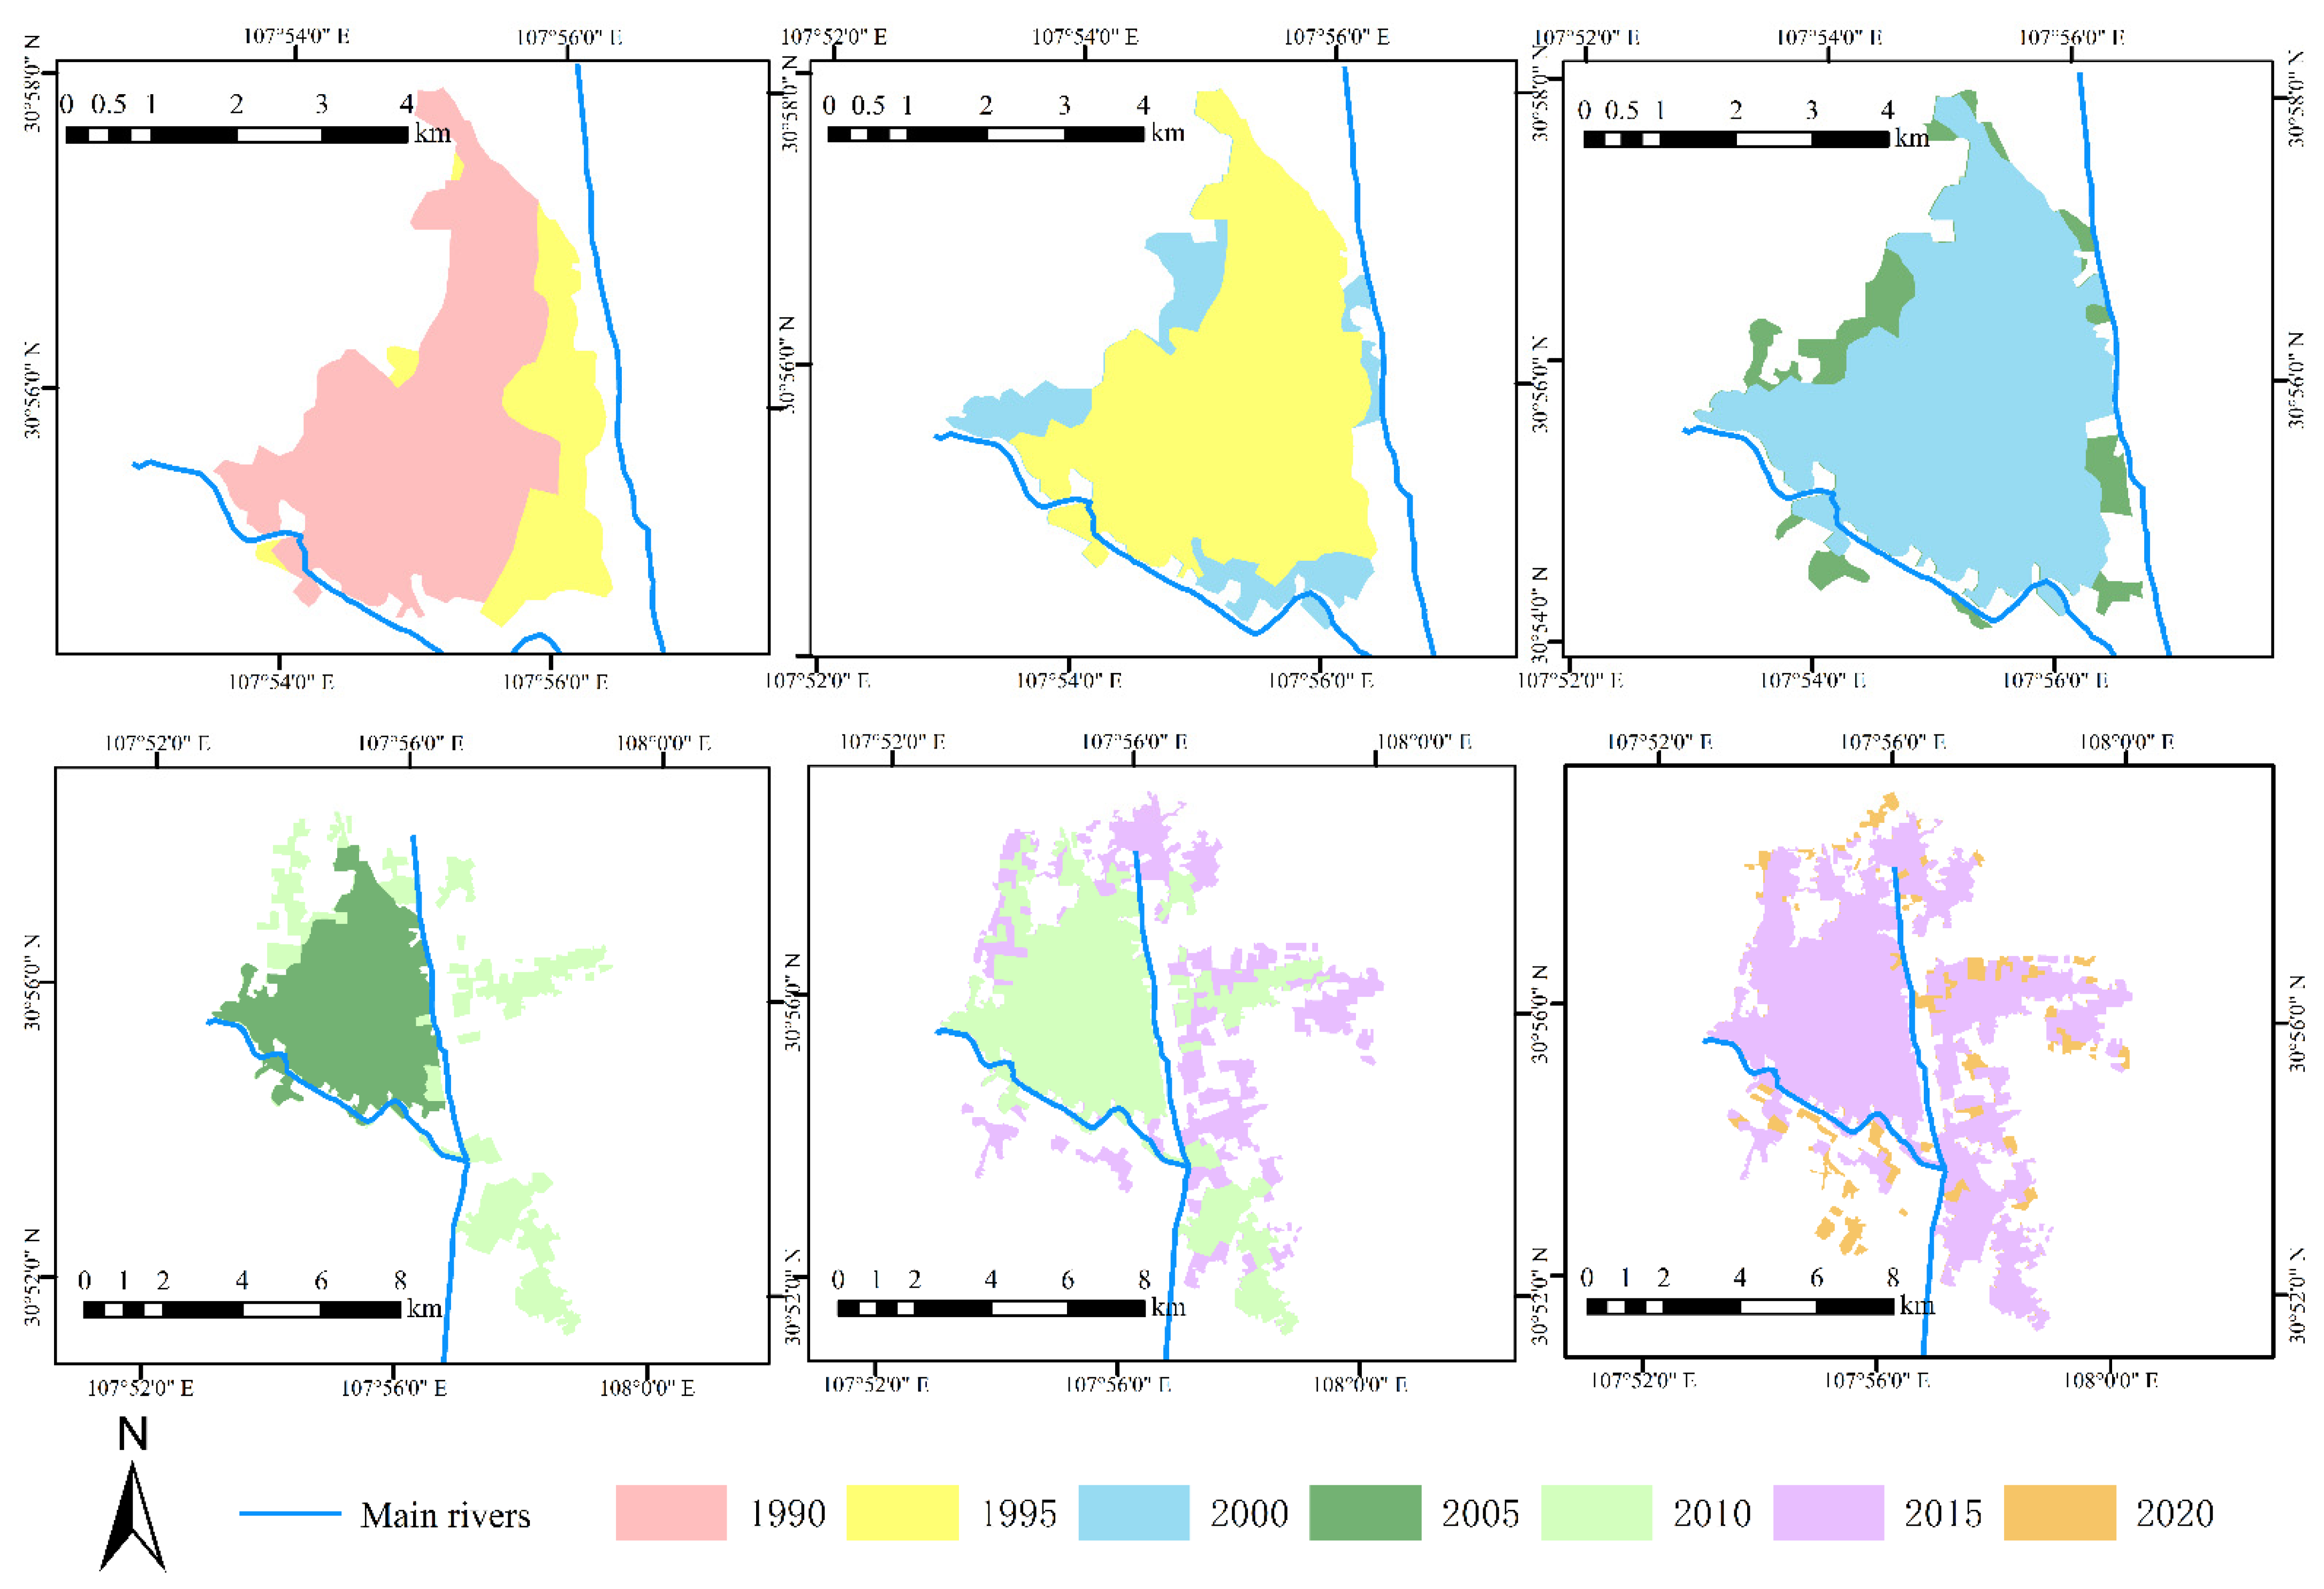
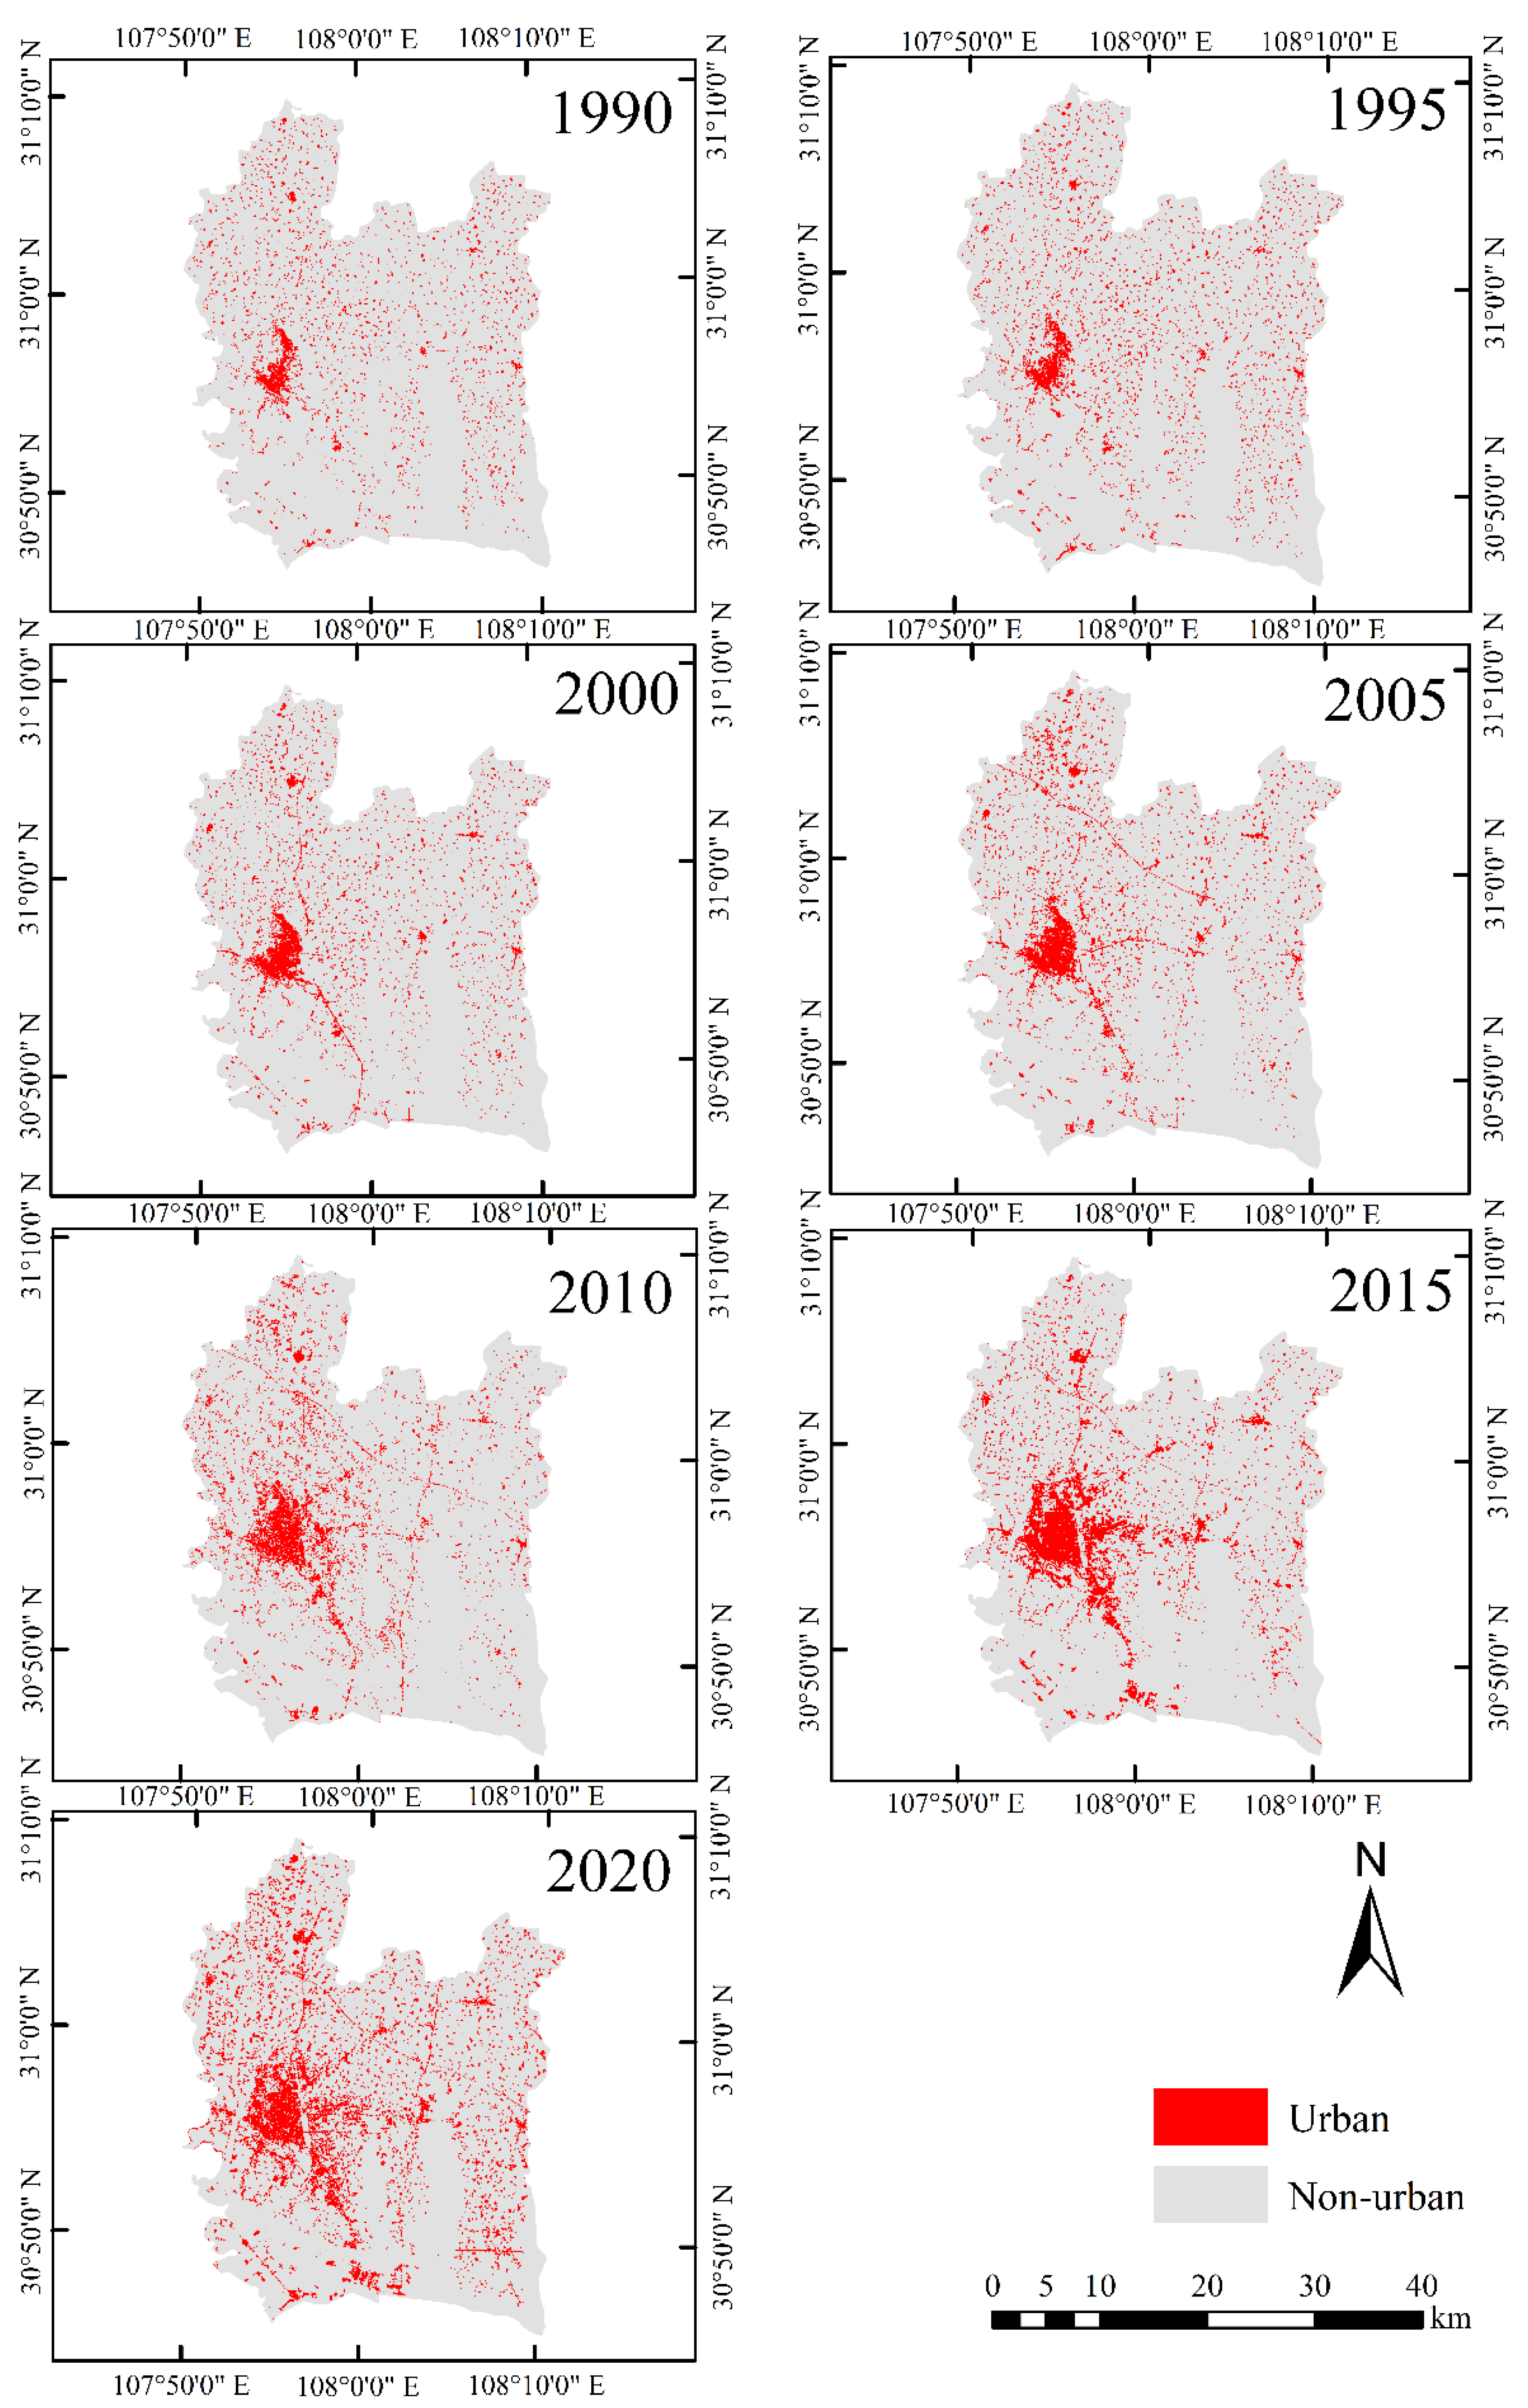
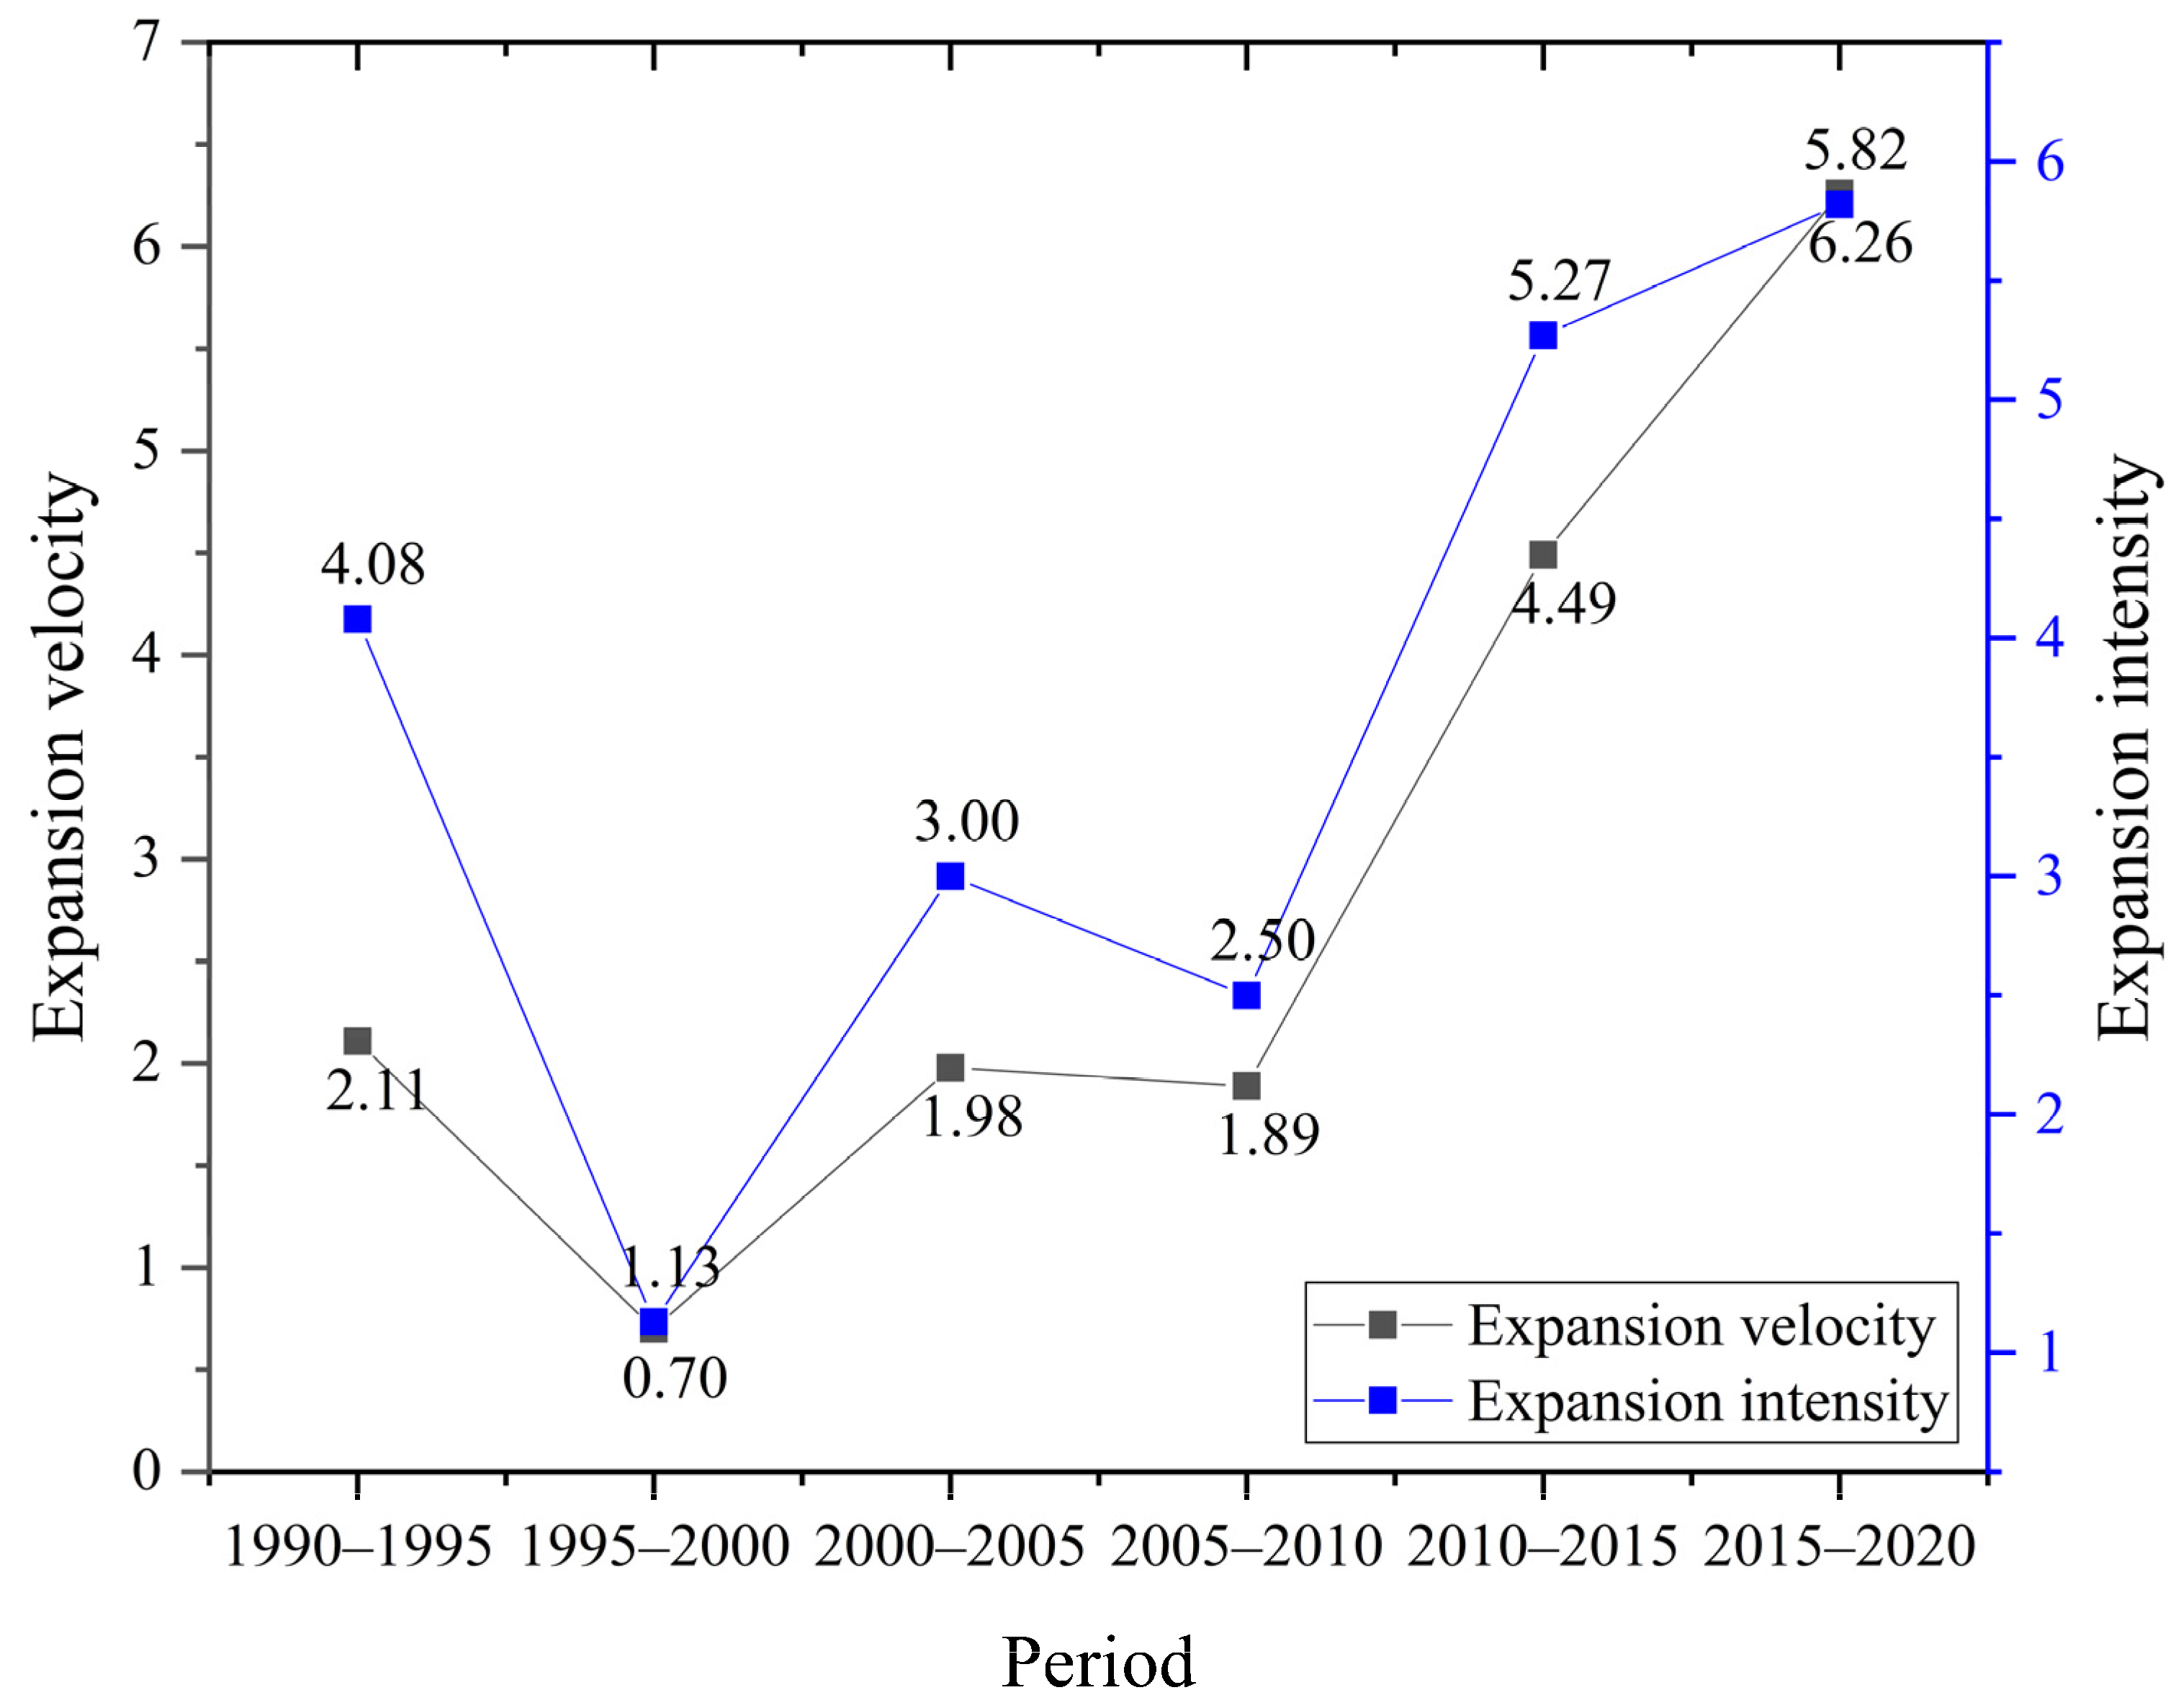
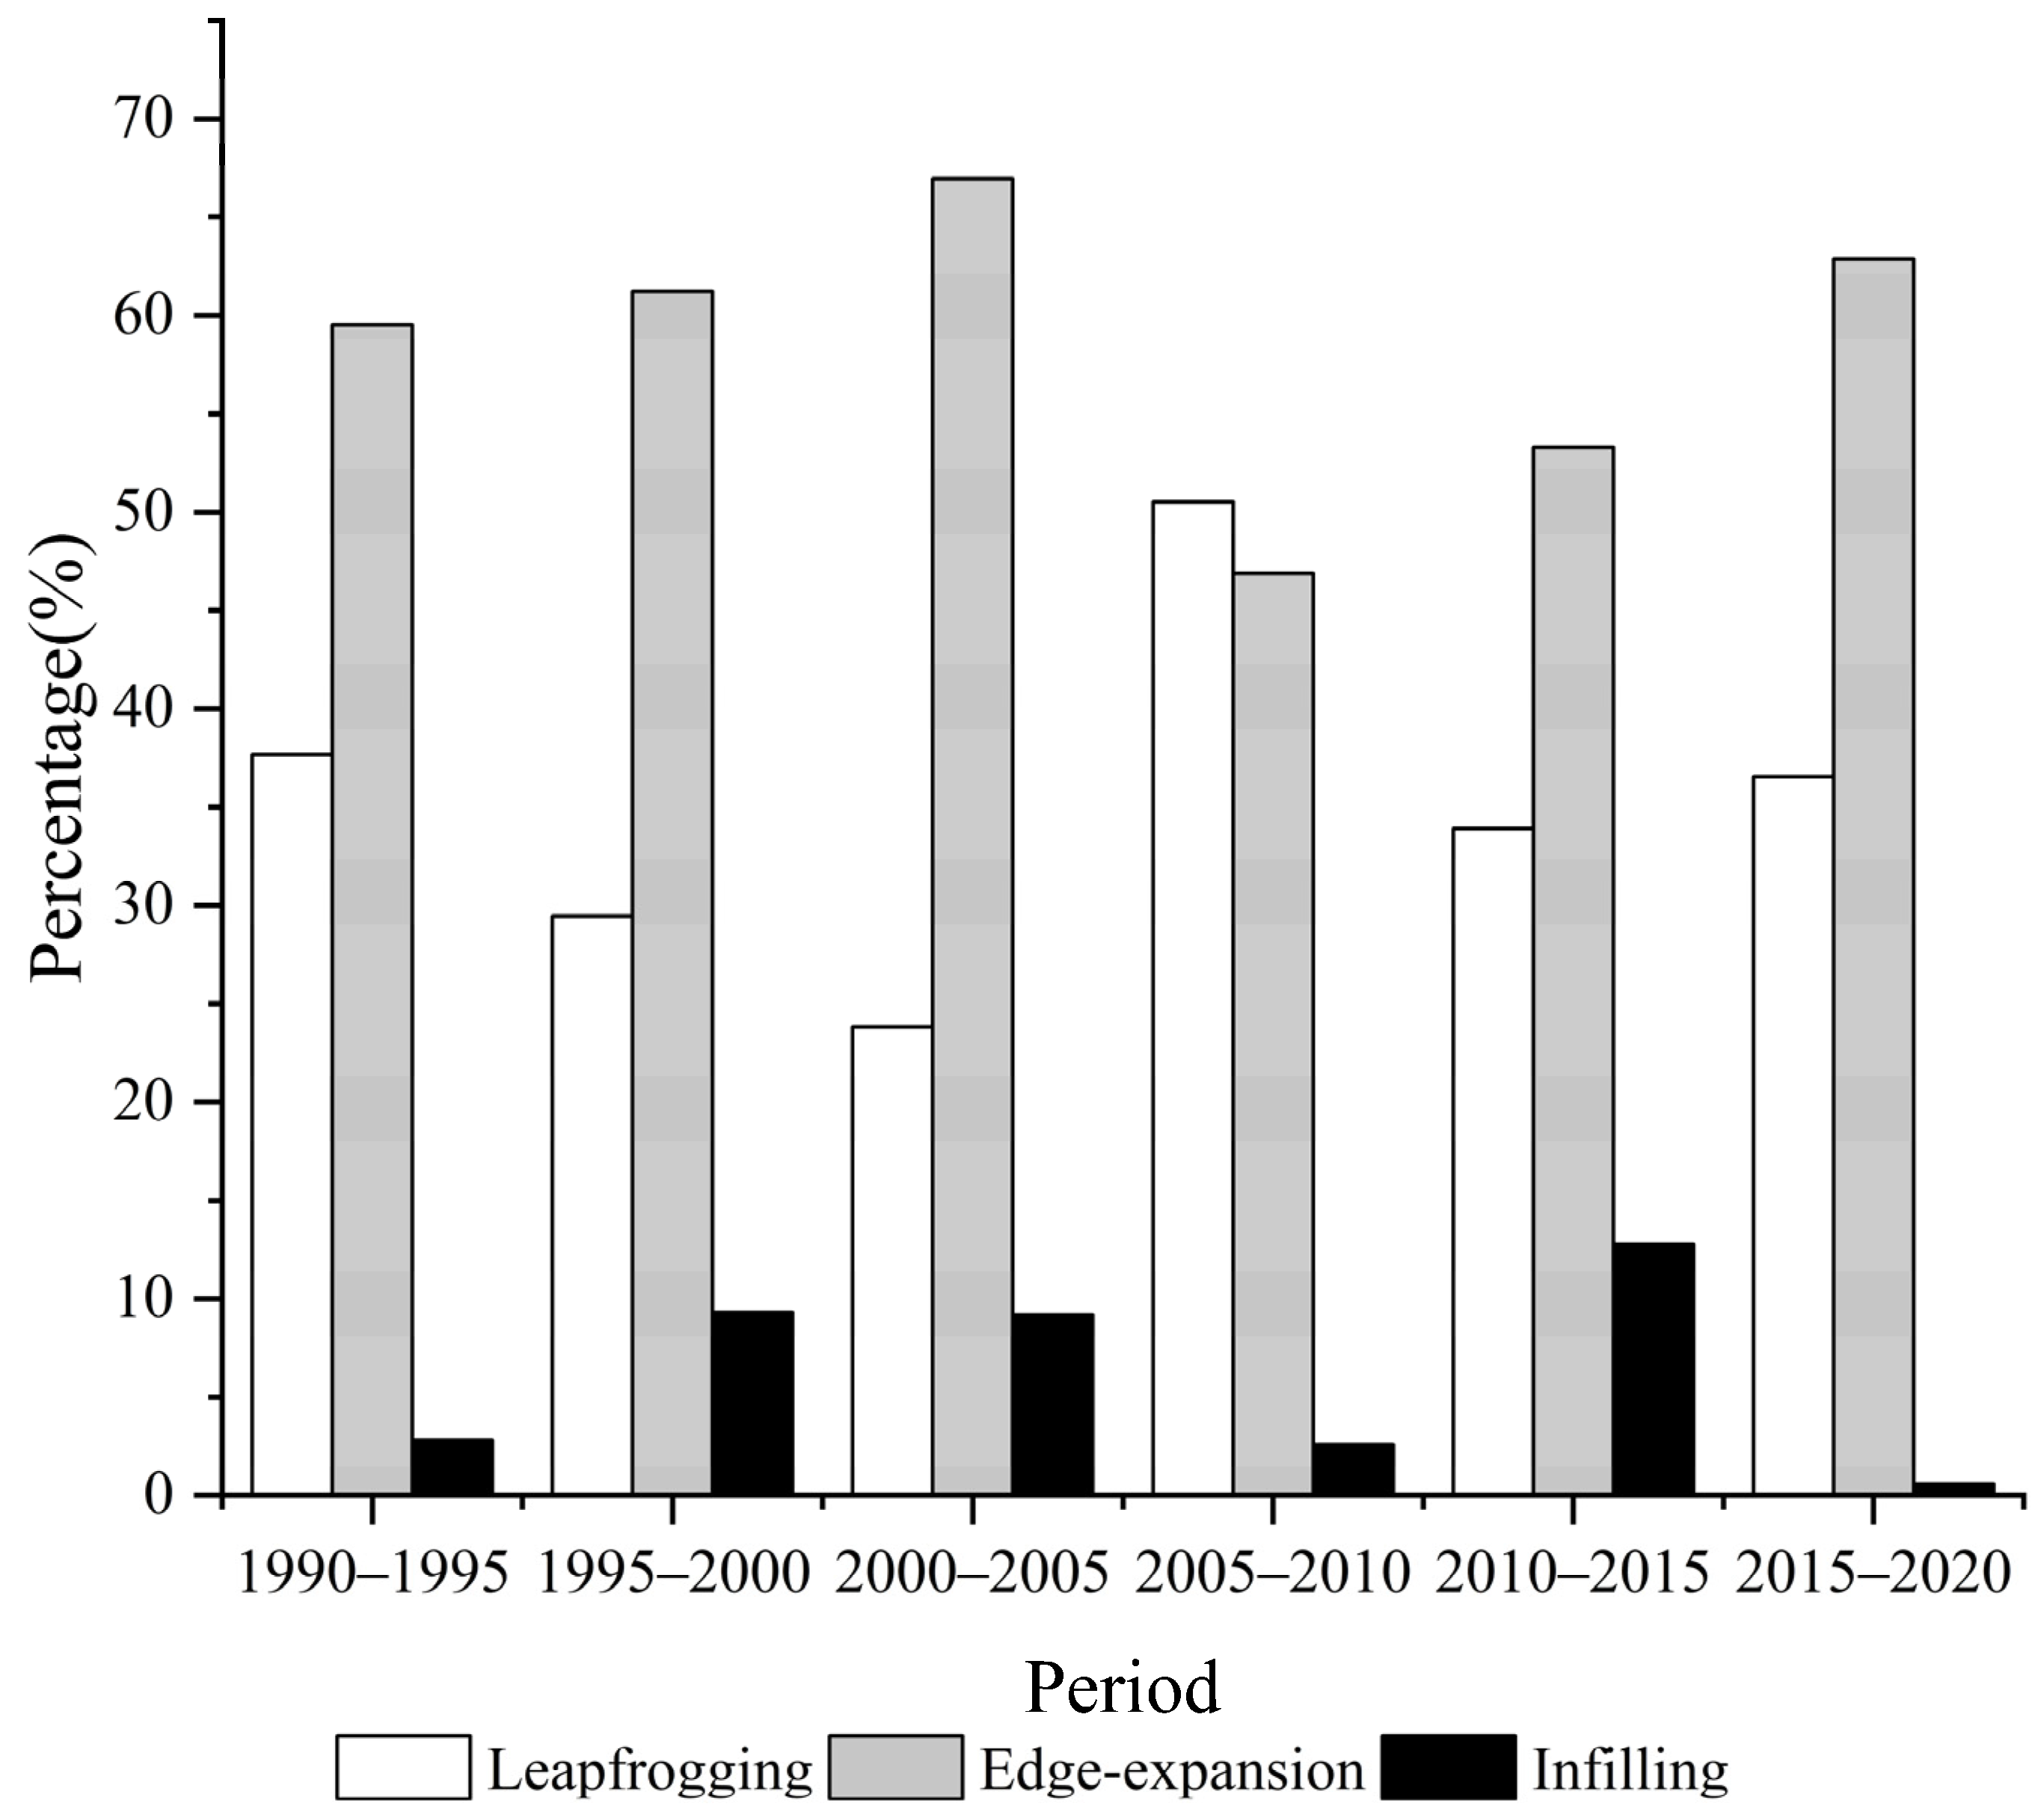
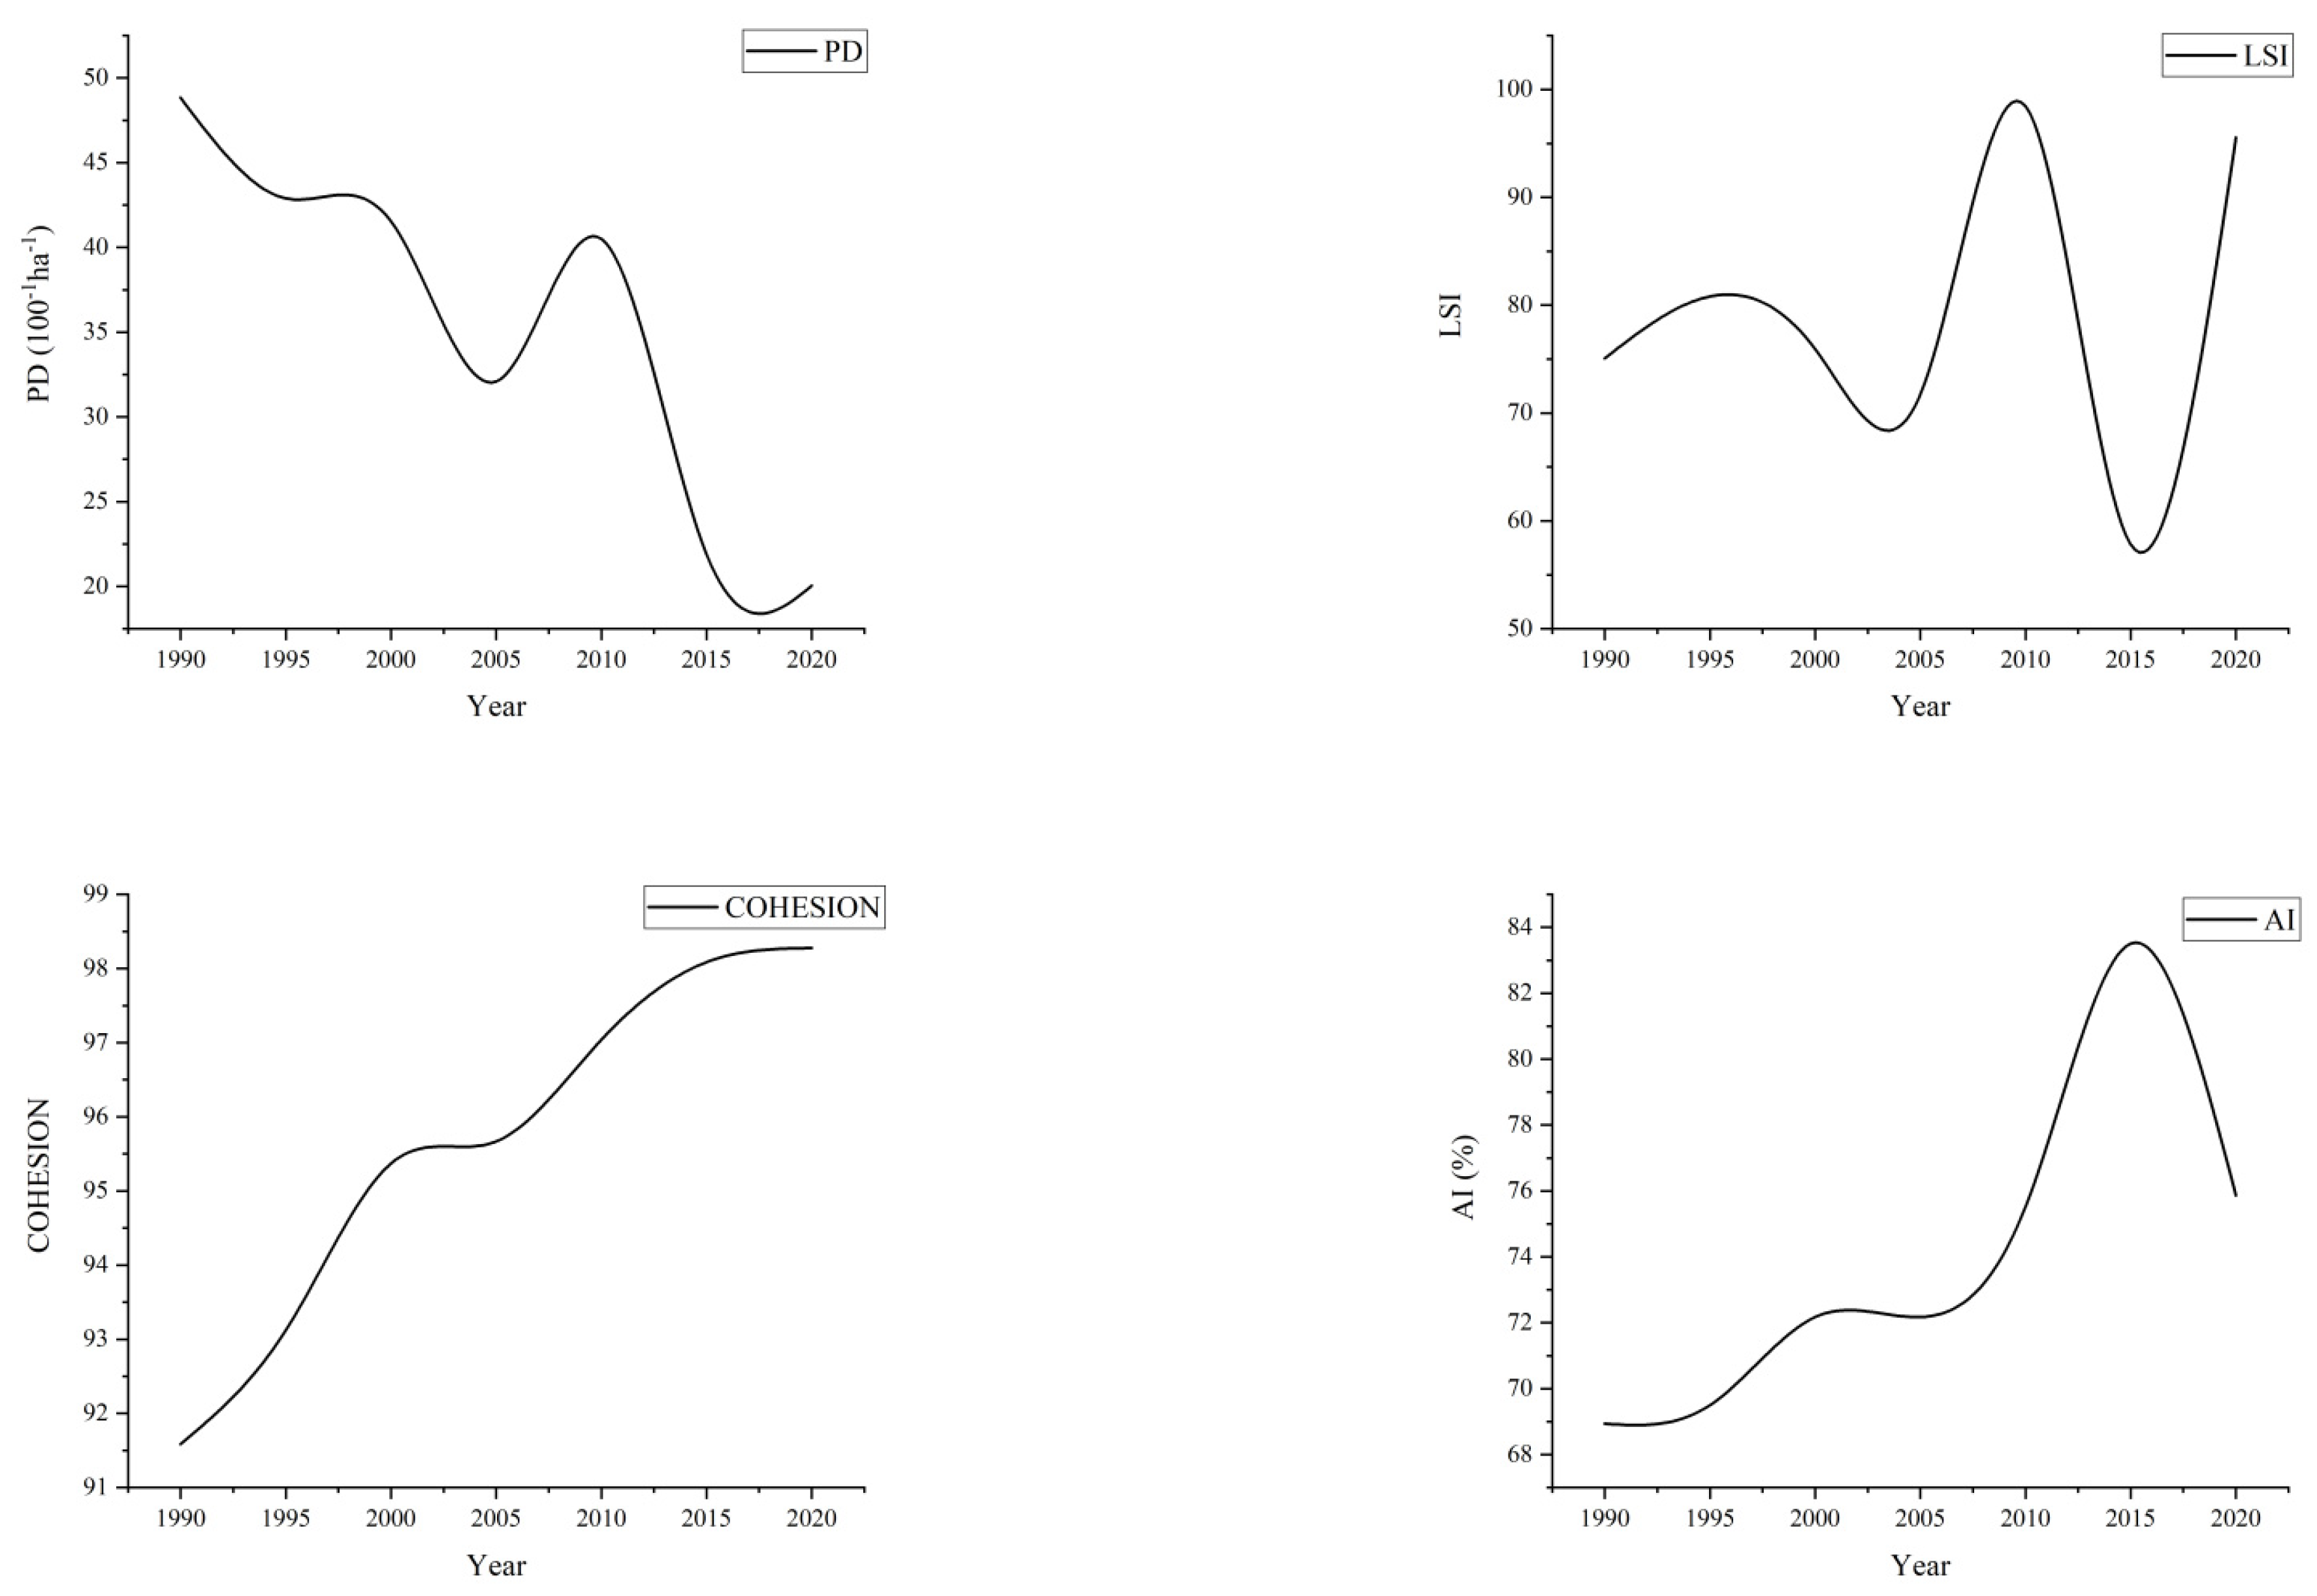
4.1. Spatiotemporal Dynamics of Built-Up Area Expansion

The spatial patterns and expansions of the built-up area are shown in Figure 4. The built-up area of Xiaonan District has increased from 10.87–56.32 km2 in 1990–2020.
The expansion was concentrated to the east of the old built-up area from 1990–1995. Between 1995–2005, the scale of urban expansion was small with the built-up area expanding in every direction. Between 2005–2010, the expansion of the built-up area rose again, and the built-up area mainly extended to the north along the Hongkong Road and the newly built Baocheng Road. The Huaiyin Avenue, Xiaohan Avenue, Xiaowu Avenue, and Qiankun Avenue strengthened the connection among Xinpu Town, Maochen Town, and the built-up area in the east of the Gunzi River, and the built-up area expanded along these main roads to the east. The center of the built-up area began to move southeastward. The urban expansion in the eastern region between 2010–2015 mainly occurred among the new urban patches. The scattered construction land was gradually connected to the pieces. At the same time, the northern built-up area expanded rapidly along the Changxing Road and the National Road 107. Between 2015–2020, the expansion expanded mainly south along the Beijing Road and both sides of the Huanchuan Road. The built-up area in the southeast expanded rapidly from 1990–2020, and the center of built-up area moved southeastward gradually.
In order to make a more detailed analysis of the expansion dynamics of the Xiaonan District’s built-up area, we overlapped the Xiaonan District built-up area every five years (Figure 5). The radar charts that demonstrate the expansion area of each sector and each period were drawn separately (Figure 6). The urban expansion was concentrated to the east of the old built-up area from 1990–1995. The reason was that, in June 1990, the government established the Xiaogan New Industry Development and Opening Pilot Zone in the eastern part of the built-up area. Taking advantage of the opportunity for enterprise relocation, a number of enterprises have been introduced. The Decision of Xiaogan Municipal People’s Government on the Mobilization of the Forces of the Whole Society and Strengthening the Construction of Xiaogan Urban District issued in 1994 actively promoted the development of the western area, resulting in the expansion of the western area. Since then, the urban expansion of built-up area not only pays attention to the quantity but also to the quality, and the construction of new urban areas and the reconstruction of the old city were in parallel. In 2000–2005, the built-up area expanded in all directions except for the southern and eastern areas restricted by the Xian and Gunzi rivers. In addition, the eastward migration of Xiaogan No.1 Middle School and the rise of many buildings and residential communities. The southeast expanded obviously during this period. In August 2006, the former Nanda private economic open development zone and the Maochen town industrial park were integrated into the Xiaonan Economic Development Zone of Hubei Province, which is oriented as a provincial development zone. Thus, between 2005–2015, expansion was mainly concentrated in the east and southeast, where the development zone was located. Between 2010–2015, the expansion of Maochen Town and Xinpu Town gradually increased, leading to the rapid expansion of the eastern and southeastern built-up area.
Figure 7 illustrates the values of the compaction index and fractional exponent. Because of the special geographical location of the study area, the Xian and Gunzi rivers restrict the boundaries of the built-up area (Figure 5 and Figure 6); thus, the value of the compaction index in every period was not high. The value of the compaction index declined between 1990–2020, and the value was relatively high between 1990–2005. This occurred because the built-up area was limited to the river bend between the Xian and Gunzi rivers, and the scale of the built-up area was small and did not reach the highest saturation during this period. The highest compaction index value (0.51) in 1995, which represents the spatial pattern of built-up area in this period was the most compact. After 2005, large urban patches appeared opposite to the Xian and Gunzi rivers, resulting in the pattern of the entire built-up area becoming narrow and complex, and the compaction index of the built-up area was greatly reduced.
The fractional exponent increased from 1990–2020, showing that the internal structure of the built-up area became increasingly complex and irregular during the study period. The lowest fractional exponent of the built-up area occurred in 1995, with a value of 1.41. Throughout the entire study period, the value of the fractional exponent varied greatly from the standard value of 1, indicating that the internal spatial structure of the built-up area was very complex and that the land resources had not been completely utilized.
Our investigation revealed that the change in fractional exponent was closely related to the government’s land planning. For example, the Xiaonan District government created a new plan for development between 1990–2005, which was called “One city, two ring, and three lines” plan. This plan required that urban scale, spatial layout, zoning function, and supporting facilities must be scientifically planned, and the new construction land should be neatly divided according to the traffic road. Thus, the fractional exponent during this period was not large, and urban expansion did not make the internal structure more complex. Between 2005–2010, the fractional exponent increased greatly because the expansion of the built-up area ushered in a new wave during this period under the government’s planning. However, the new construction land had not been connected, leading to an increase in the fractional exponent. Between 2010–2020, the government focused more on the rationality of urban expansion, so the value of the fractional exponent was almost unchanged during this period.

4.2. Spatiotemporal Dynamics of Urban Land Expansion

According to our experimental results, the urban land area increased from 51.74–138.89 km2 in 1990–2020. Spatial distributions of the urban extent and urban expansion for Xiaonan District from1990–2020 can be seen in Figure 8.
Xiaonan District’s urban expansion in 1990–1995 tended to spread outward towards all directions approximately (Figure 8). With the traffic roads gradually developed, a strip expansion along the roads occurred from 2000–2005, with the main built-up area still spread outward towards all directions. In 2005–2010, Xiaonan District had a rapid urbanization process in the east and southeast of the city and the new urban land is distributed in strips on both sides of the main roads. Several urban groups have gradually formed within Xiaonan District through connecting and aggregating with existing urban patches since 2015. In 2010–2020, the existing urban groups became more compact, and a large number of small urban land patches were generated among the patches which have a long distance from each other.
Figure 9 shows the expansion velocity ( V ) and expansion intensity ( R ) of the urban land. The result shows that urban land expanded rapidly during 2015–2020. Throughout the study period, the expansion velocity and intensity both exhibited trends of first decreasing and then increasing gradually. In 1990–1995, the city underwent important changes, including the determination of development goals, the establishment of an economic development zone, and opening and attracting numerous enterprises. As a result, rural construction accelerated at the same time, leading to the rapid expansion of construction land. The main reason for the low expansion velocity between 1995–2000 was that the expansion was limited by the rivers, and there was sufficient space to expand the built-up area. Between 2000–2010, the extension of the roads crossing the rivers facilitated the further expansion of the built-up area. Moreover, the construction of the Xiaohua train line, Beijing-Hong Kong-Macao expressway, Hanshi expressway, and other interurban roads boosted the urban development of surrounding towns. From 2010–2020, the government of Xiaonan District was integrated into the construction of “The Belt and Road” and the Yangtze River Economic Belt. Relying on Wuhan, Xiaonan District developed a large area of urban land near Minji Town, which is the nearest municipality to Wuhan. The economic and social development of Xiaonan District ushered in a boom, and the expansion velocity and intensity were greatly improved.
Figure 10 illustrates the composition of urban growth types among the six neighboring periods over the past three decades, showing that the proportion of the three urban growth types is edge-expansion > leapfrogging > infilling, except for the period from 2005–2010. During each period, infilling patches were the least frequent. Between 1995–2005, the proportion of new construction land continuously increased, and the proportion of leapfrogging patches gradually decreased. By 2005, the old built-up area gradually reached saturation and could not extend outward due to the restriction of the two main rivers. The center of urban development moved to the east side of the Gunzi River, and a large amount of new urban land was observed. Between 2005–2010, leapfrogging patches surpassed edge-expansion patches and became the main expansion type during this period. Between 2010–2015, the urban land expansion in Xiaonan District was mainly based on the edge-expansion of the old patches, followed by leapfrogging, and the proportion of infilling patches increased. Between 2015–2020, the urban patches underwent continuous filling expansion, the patterns were almost complete, and there was hardly any non-urban land inside. Therefore, the proportion of infilling patches in this period was very small, and the expansion was dominated by edge-expansion and leapfrogging.
Figure 11 shows the trends in the urban landscape changes. Because urban expansion was dominated by edge expansion during the research period, the PD gradually decreased between 1990–2020. It is worth mentioning that the value of PD suddenly rose in 2010, but obvious urban land growth was not observed because the main type of urban growth was leapfrogging in 2005–2010. The continuous decline of the PD also indicated that there is a continuous reduction in the degree of fragmentation of urban land. From the perspective of LSI, the overall value is relatively high, which deviates much from the standard value of 1, indicating that the shape of urban land is complex and irregular during the research period. It had the lowest value of LSI in 2015 when the urban land had the most regular shape and the highest centralized use of the land. The AI and COHESION constantly increased during the research period, and the upward trend of AI was not as obvious as COHESION, indicating that the aggregation degree between the urban land types had increased, the distance between the urban patches had constantly decreased, and the urban land had been constantly concentrated and distributed. Simultaneously, the connectivity between the urban patches improved, and the urban land was gradually connected into pieces. Overall, the centralized utilization degree of the land exhibited an increasing trend.

4.3. Temporal Coevolution of Built-Up Area with Urban Population

To obtain further understanding of the urbanization in Xiaonan District, we examined the temporal coevolution of the built-up area with population. It should be noted that because Xiaonan District was established in 1993, the population data had been counted since 1995.
With the urban area-population elastic coefficient and allometry model, which are used to scale the adaptability of urban population growth and built-up area growth in the process of urban expansion, we found that the elastic coefficient generally deviated from the standard value (Table 2). This pattern was disrupted in 2010–2015, during which the coefficient was close to the critical value of 1.12. The value was far less than 1.12 in 2005–2010, showing that the built-up area increased but the urban population declined during this period, and the urban expansion was very unreasonable in that it did not correlate well with the population level. In 1995–2000, the elastic coefficient was less than 1.12, showing that the built-up area expanded more slowly than the urban population. In 2000–2005 and 2015–2020, the elastic coefficient was greater than 1.12, indicating that the built-up area expanded faster than the urban population.
According to the built-up area sequence and urban population sequence of Xiaonan District from 1995–2020, the fitting equation for the allometry model is shown in Figure 12. The results indicate that the fitting accuracy is high, and the allometry coefficient of the allometry model is 1.33, which is greater than the standard value of 0.85, showing that the expansion speed of built-up area was faster than the growth rate of the built-up area population during 1995–2020.
If Xiaonan District does not take some corresponding control measures in the future, it will cause vacant construction land and land resource waste and affect sustainable development in the long term.

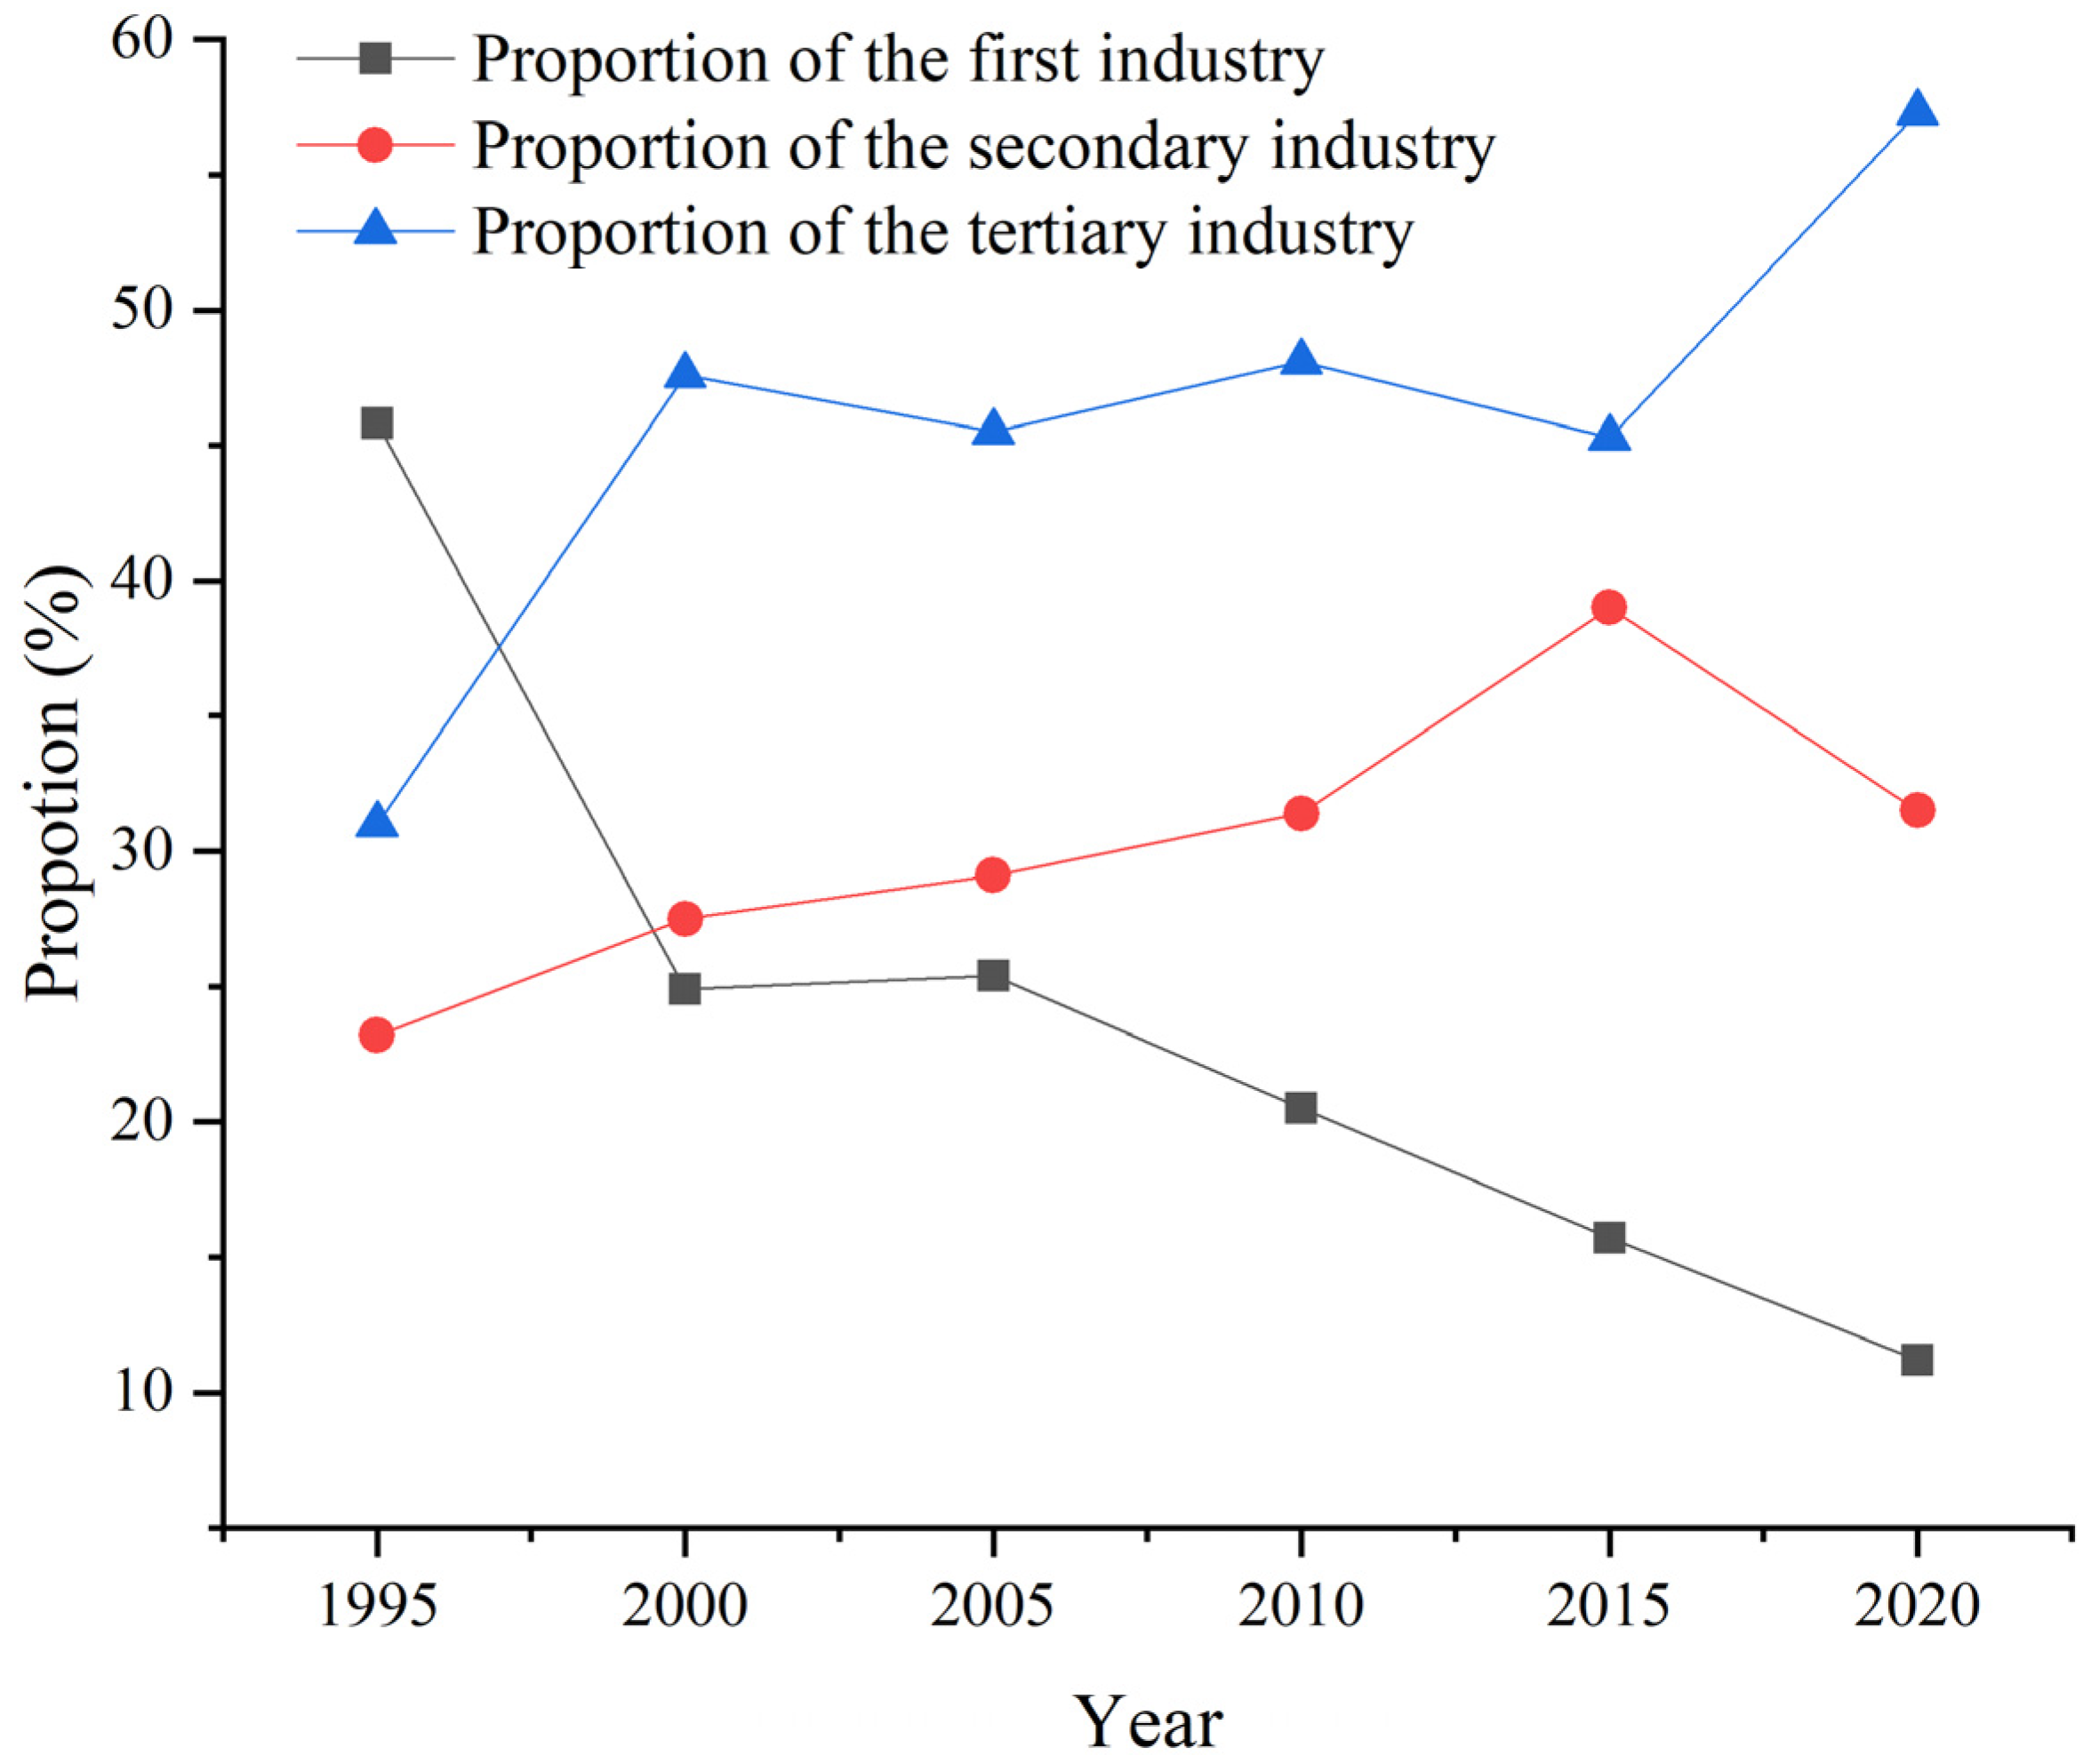
4.4. Driving Force of Urban Expansion in Xiaonan District

The correlation between the driving force indexes and urban expansion was calculated according to grey relation analysis (Table 3). These data were also counted starting in 1995. The results reveal the following order of driving factors: proportion of secondary industry > total population > proportion of tertiary industry > GDP > government revenue > investment in fixed assets of the whole society. Thus, the proportion of secondary industry was identified as the main driving factor.
The primary, secondary, and tertiary industries of Xiaonan District accounted for 45.8, 23.2, and 31%, respectively, in 1995, and 11.2, 31.5, and 57.3% in 2020, respectively. In 1995–2020, the proportion of secondary and tertiary industries continued to increase (Figure 13). High-tech industrial agglomeration areas have been developed and gradually formed a new model that promotes the secondary and tertiary industry development to drive urbanization. Population growth also had a direct driving effect on the expansion. In 1995–2020, the total population increased by 22.3%, the urban population increased by 218.4%, and the proportion of urban population increased from 25.4–66.2% (Figure 14). With the increased inflow of migrants, a lot of people are constantly gathering in urban areas, promoting an increase in urban residential land, public facilities land, and other urban land. In recent years, the natural population growth rate of Xiaonan District has increased, and the migration rate is high. It can be expected that in the next few years, the population of Xiaonan District will grow, and the demand for new urban land will continue to be maintained at a certain level and constantly drive the expansion of urban land.

5. Discussion

5.1. Characteristics and Drivers of Urban Expansion

The main objective of this study is to obtain the characterization of urban expansion in Xiaonan District from 1990–2020; form the two aspects, built-up area and urban land; and explore the temporal coevolution of built-up area with urban populations and main driving factor by using time series Landsat imagery.
Previous studies focused mainly on the spatial pattern of urban land in megacities, large cities, and urban agglomeration by using DMSP/OLS night light data of the U.S. Department of Defense and its follow-on platform, Landsat data of USGS Earth Resources Observation and Science (EROS) Center, or other data sources [77,78,79]. They paid more attention to the growth of the urban land area and boundary, using simulation models of cellular automaton (CA) to simulate the future urban land distribution [80], and concentric circle and sector analysis to compare expansion rates at different distances and in different directions [81,82]. In recent studies, researchers began to care about the dynamics of spatial structure and growth types in the process of urban land expansion, usually using a series of indexes and methods to evaluate them.
The expansion of urban land is indeed the most significant feature of urbanization, but the built-up area is the main urban area with the most densely urban residents, and the reasonable expansion of the built-up area is an important factor affecting the life quality of residents. However, there are few studies considering the expansion of built-up area and whether the expansion corresponds to the urban population when studying urban expansion. Research on the urban expansion of cities surrounding large cities which are usually in a period of rapid development is lacking.
In contrast, this study provides new ideas for studying small-scale urban expansion. We studied the expansion of the Xiaonan District from the two perspectives, the built-up area and overall urban land, and we chose two different methods (object-oriented and SVM classification, respectively) to extract the corresponding information according to the definitions and characterizations of them, which made the results more reasonable. We selected compaction index and fractional exponent to analyze the spatial morphology change and divided Xiaonan District into eight directions to analyze the difference in the expansion direction of the built-up area. Additionally, we also applied the urban area-population elastic coefficient and allometry model to discuss the rationality of the built-up area expansion in Xiaonan District from the perspective of whether the built-up area growth and population growth were suitable, which is helpful for the sustainable and healthy development of the city.
Regression analysis, variance analysis, principal component analysis, and logistic models are usually used to explore which factor has the greatest effect among many influencing factors [83,84,85,86]. Therefore, some researchers introduce them to study the drivers of urban expansion. However, these methods have some common shortcomings: for example, these methods need a lot of supporting data. If there are only a few data, the results will be meaningless. Sometimes these methods also require data to obey a special distribution. However, grey relation analysis is based on developmental trends among factors, and no large size and standard distribution rules of the sample data are required [87,88], which makes it more reasonable to explore the drivers of urban land expansion in areas with inadequate data like Xiaonan District. According to the results of grey relation analysis, the driving forces of urban land expansion of Xiaonan District in 1995–2020 are mainly the increase of proportion of the secondary industry, followed by the population growth, proportion of the tertiary industry, and GDP growth. This is consistent with the view of many previous studies that urban expansion is the result of many comprehensive factors, including society, economy, policy, population, traffic, and natural conditions. The results are also consistent with results of other researchers obtained in the Xiaonan District [89].

5.2. Study Limitations

It should be noted that our study has several limitations. Due to time, space, and funding constraints, we selected medium-resolution remote sensing images as our original data. The area of Xiaonan District is not large, and we can improve the accuracy by using higher resolution images in the future. Moreover, there is a dispute over the scope of the built-up area, and the built-up area was mapped based on object-oriented classification and artificial visual interpretation in our study, which requires further study. The driving force of urban land expansion in Xiaonan District should be further discussed. Although we have analyzed the driving forces of urban expansion qualitatively and quantitatively, the factor system is not comprehensive, and relevant data such as real estate development data are lacking. The selected indicators are universal, but it is difficult to reflect the regional characteristics of Xiaonan District.

6. Conclusions

In the past decades, China’s rapid urbanization and rapid economic growth have aroused worldwide attention. However, studies on the internal rates, forms, and driving forces of cities around the big city are still lacking. In this study, we have a comprehensive understanding of the urban expansion, the temporal evolution of the built-up area and urban population, and main driving factor of the expansion in Xiaonan District.
The expansion rate of the built-up area first decreased and then increased from 1990–2020. It expanded fastest in 2005–2010. The location of rivers was the main factor limiting the expansion of built-up area. The transfer of the city center and main direction of expansion generally corresponded well to the topography, policies, and city development strategies. The degree of land concentration in the built-up area was not high, and the spatial form of the built-up area was complex and irregular. In 1995–2020, the expansion of built-up area was not suitable for urban population growth. The expansion was unreasonable as there is still unused land in the study period.
The magnitude of urban land expansion is ranked as follows: 2015–2020 > 2010–2015 > 1990–1995 > 2000–2005 > 2005–2010 > 1995–2000. The results of landscape metrics show that although the overall shape of urban land remained complex and irregular throughout the research period, the connectivity between urban land patches has improved and gradually connected in recent years. The increase in the proportion of secondary industries leads to the driving force of urban expansion in Xiaonan District over the study period.

Author Contributions

Conceptualization, Y.L., R.Z. and Y.D.; writing—original draft preparation, Y.L.; writing—review and editing, R.Z. and Y.D. All authors have read and agreed to the published version of the manuscript.

Funding

This research was funded by the National Natural Science Foundation of China under Grant 62171417, and in part by the Open Research Fund of CAS Key Laboratory of Spectral Imaging Technology under Grant LSIT201921W.

Institutional Review Board Statement

Not applicable.

Informed Consent Statement

Not applicable.

Data Availability Statement

Not applicable.

Acknowledgments

The authors would like to thank the handling editor and all anonymous reviewers for providing insightful and helpful comments.

Conflicts of Interest

The authors declare no conflict of interest.

References

  1. Zong, J.; Lin, Z. 70 years of retrospect and reflection on China’s urbanization. Econ. Probl. 2019, 1–9. [Google Scholar] [CrossRef]
  2. NBSC. Statistical communique of the People’s Republic of China on the 2020 national economic and social development. China Stat. 2021, 8–22. [Google Scholar]
  3. Zhao, C.; Zhang, J. Problems and countermeasures in Inner Mongolia during the process of urbanization. Forw. Position 2016, 103–107, 112. [Google Scholar] [CrossRef]
  4. Seto, K.C.; Sánchez-Rodríguez, R.; Fragkias, M. The New Geography of Contemporary Urbanization and the Environment. Annu. Rev. Environ. Resour. 2010, 35, 167–194. [Google Scholar] [CrossRef] [Green Version]
  5. Wu, J.; Jenerette, G.D.; Buyantuyev, A.; Redman, C.L. Quantifying spatiotemporal patterns of urbanization: The case of the two fastest growing metropolitan regions in the United States. Ecol. Complex. 2010, 8, 1–8. [Google Scholar] [CrossRef]
  6. Lucas, R.E. On the mechanics of economic development. J. Monet. Econ. 1988, 22, 3–42. [Google Scholar] [CrossRef]
  7. Bettencourt, L.M.A.; Lobo, J.; Helbing, D.; Kuhnert, C.; West, G.B. Growth, innovation, scaling, and the pace of life in cities. Proc. Natl. Acad. Sci. USA 2007, 104, 7301–7306. [Google Scholar] [CrossRef] [Green Version]
  8. Sun, Q. Analysis of the causes of China’s urbanization problem and the way to improve. J. North China Electr. Power Univ. Soc. Sci. 2020, 5, 79–91. [Google Scholar]
  9. Cheng, J. Analysis of the main problems and countermeasures in the process of urbanization in China. Mod. Mark. 2020, 2020, 7–9. [Google Scholar] [CrossRef]
  10. McDonald, R.I.; Kareiva, P.; Forman, R.T. The implications of current and future urbanization for global protected areas and biodiversity conservation. Biol. Conserv. 2008, 141, 1695–1703. [Google Scholar] [CrossRef]
  11. Filloy, J.; Grosso, S.; Bellocq, M.I. Urbanization altered latitudinal patterns of bird diversity-environment relationships in the southern Neotropics. Urban Ecosyst. 2015, 18, 777–791. [Google Scholar] [CrossRef]
  12. Seto, K.C.; Güneralp, B.; Hutyra, L.R. Global forecasts of urban expansion to 2030 and direct impacts on biodiversity and carbon pools. Proc. Natl. Acad. Sci. USA 2012, 109, 16083–16088. [Google Scholar] [CrossRef] [PubMed] [Green Version]
  13. Shao, M.; Tang, X.; Zhang, Y.; Li, W. City clusters in China: Air and surface water pollution. Front. Ecol. Environ. 2006, 4, 353–361. [Google Scholar] [CrossRef]
  14. Zhao, S.; Da, L.; Tang, Z.; Fang, H.; Song, K.; Fang, J. Ecological consequences of rapid urban expansion: Shanghai, China. Front. Ecol. Environ. 2006, 4, 341–346. [Google Scholar] [CrossRef]
  15. Choi, Y.Y.; Suh, M.S.; Park, K.H. Assessment of Surface Urban Heat Islands over Three Megacities in East Asia Using Land Surface Temperature Data Retrieved from COMS. Remote Sens. 2014, 6, 5852–5867. [Google Scholar] [CrossRef] [Green Version]
  16. Li, X.; Zhou, Y.; Ghassem, R.A.; Marc, I.; Li, X. The surface urban heat island response to urban expansion: A panel analysis for the conterminous United States. Sci. Total Environ. 2017, 605–606, 426–435. [Google Scholar] [CrossRef]
  17. Liu, G.; Yang, Z.; Chen, B.; Ulgiati, S. Monitoring trends of urban development and environmental impact of Beijing, 1999–2006. Sci. Total Environ. 2011, 409, 3295–3308. [Google Scholar] [CrossRef]
  18. Tan, M.; Lv, C. Urban land expansion and farmland loss in China. J. Nat. Resour. 2005, 1, 52–58. [Google Scholar]
  19. Tan, M.; Li, X.; Xie, H.; Lu, C. Urban land expansion and arable land loss in China—A case study of Beijing-Tianjin-Hebei region. Land Use Policy 2005, 22, 187–196. [Google Scholar] [CrossRef]
  20. UN. World Cities Report 2020: The Value of Sustainable Urbanization; UN-Habitat Press: New York, NY, USA, 2020.
  21. Dai, M. Research review on urban spatial expansion at home and abroad. Mark. Res. 2020, 16–18. [Google Scholar] [CrossRef]
  22. Zhao, Y. Principles and Methods of Remote Sensing Application Analysis; Science Press: Beijing, China, 2003. [Google Scholar]
  23. Liu, J.; Zhan, J.; Deng, X. Spatiotemporal patterns and driving forces of urban land expansion in China during the economic reform era. AMBIO J. Hum. Environ. 2005, 34, 450–455. [Google Scholar] [CrossRef]
  24. Zhai, H.; Tang, X.; Wang, G.; Li, J.; Xing, L. Monitoring and spatio-temporal patterns of construction land in Chinese megacities. Remote Sens. Inf. 2019, 34, 39–47. [Google Scholar]
  25. Godone, D.; Garbarino, M.; Sibona, E.; Garnero, G.; Godone,, F. Progressive fragmentation of a traditional Mediterranean landscape by hazelnut plantations: The impact of CAP over time in the Langhe region (NW Italy). Land Use Policy 2014, 36, 259–266. [Google Scholar]
  26. Demetris, S.; Vassilis, T.; Ioannis, F. Urbanization in European regions based on night lights. Remote Sens. Appl. Soc. Environ. 2015, 2, 26–34. [Google Scholar]
  27. Li, J.; Zhang, W.; Tang, K. Urbanization of Changzhutan city agglomerations analyzed from night light image. Geomat. World 2020, 6, 42–47. [Google Scholar]
  28. Ning, J.; Guo, L.; Zhao, C.; Wu, H.; Liu, N. Analysis of temporal and spatial characteristics of construction land expansion in Harbin from 2001 to 2017. Sci. Technol. Eng. 2020, 20, 12948–12954. [Google Scholar]
  29. Wang, C. Spatial-Temporal Dynamics of Urban Expansion in Changchun City during the 1970s–2015. Master’s Thesis, Harbin Normal University, Harbin, China, 2017. [Google Scholar]
  30. Wang, L. Research of urban expansion based on remote sensing image. Master’s Thesis, Chang’an University, Xi’an, China, 2014. [Google Scholar]
  31. Weng, Q. Land use change analysis in the Zhujiang Delta of China using satellite remote sensing, GIS, and stochastic modeling. J. Environ. Manag. 2002, 64, 273–284. [Google Scholar] [CrossRef] [Green Version]
  32. Kienast, F.; Walters, G.; Burgi, M. Landscape ecology reaching out. Landsc. Ecol. 2021, 36, 1–10. [Google Scholar] [CrossRef]
  33. Medeiros, A.; Fernandes, C.; Gonalves, J.F.; Paulo, F.M. Research trends on integrative landscape assessment using indicators—A systematic review. Ecol. Indic. 2021, 129, 107815. [Google Scholar] [CrossRef]
  34. Xi, J.; He, Y. Study on the urban expansion and driving force of Xi’an based on landscape ecology. In Proceedings of the 2017 China Urban Planning Annual Conference, Dongwan, China, 18 November 2017. [Google Scholar]
  35. Bian, H.; Gao, J.; Wu, J.; Sun, X.; Du, Y. Hierarchical analysis of landscape urbanization and its impacts on regional sustainability: A case study of the Yangtze River Economic Belt of China. J. Clean. Prod. 2021, 279, 123261. [Google Scholar] [CrossRef]
  36. Sapena, M.; Ruiz, L.A. Analysis of urban development by means of multi-temporal fragmentation metrics from LULC data. Int. Arch. Photogramm. Remote Sens. Spat. Inf. Sci. 2015, XL-7/W3, 11–15. [Google Scholar] [CrossRef] [Green Version]
  37. Verburg, P.H.; Eck, V.; Ritsema, J.R.; Nijs, D.; Ton, C.M.; Martin, J.; Schot, P. Determinants of land-use change patterns in the Netherlands. Environ. Plan. B Plan. Des. 2004, 31, 125–150. [Google Scholar] [CrossRef] [Green Version]
  38. Ademola, K.B.; Takashi, O. Spatial determinants of urban land use change in Lagos, Nigeria. Land Use Policy 2007, 24, 502–515. [Google Scholar]
  39. Peng, Y.; Chen, J. Analysis on the expansion and driving force of urban construction land under the background of new urbanization—A case study of Hunan Province. Sci. New Ground 2019, 19, 29–34. [Google Scholar]
  40. Chen, C. Analysis of construction land expansion drivers based on the grey relation method. China Water Transp. 2020, 20, 45–46. [Google Scholar]
  41. Zhang, L. Study on the Spatial Expansion and Driving Factors of Urban Construction Land in Shandong Province. Master’s Thesis, Qingdao University of Science & Technology, Qingdao, China, 2019. [Google Scholar]
  42. Zhang, Q.; Cui, X. A study on the transformation of small towns’ development in a metropolis—A case of study Beijing. Res. Econ. Manag. 2014, 14–18. [Google Scholar] [CrossRef]
  43. Shi, Y. New urbanization and development in metropolitan areas in China. Urban Plan. Forum 2013, 4, 114–119. [Google Scholar]
  44. Sun, B.; Li, X.; Zhang, Y. Research on multi-center collaborative development of Wuhan City Circle. Reg. Econ. Rev. 2016, 86–91. [Google Scholar] [CrossRef]
  45. Gao, Q. Opportunities and countermeasures of Xiaogan’s economic development under the background of Hubei Free Trade Zone Construction. Pioneer. Sci. Technol. Mon. 2018, 31, 123–125. [Google Scholar]
  46. Xiaochang County Local Chronicles Compilation Committee. Xiaonan Chronicles; Hubei People’s Press: Wuhan, China, 2015. [Google Scholar]
  47. Huang, W.; Dai, S.; Cheng, P.; Hong, S.; Li, S.; Huang, L.; Liu, P.; Xiao, C.; Lu, M. Xiaonan Yearbook; Changjiang Press: Wuhan, China, 2018. [Google Scholar]
  48. Wang, T.; Lei, W.; Wu, F.; Si, N.; Lu, S.; Huang, J.; Ding, S.; Zhang, J.; Wang, Z.; Xiao, Y.; et al. Hubei Yearbook; Hubei Yearbook Society Press: Wuhan, China, 2020. [Google Scholar]
  49. Shi, C.; Yu, Q.; Chen, W. Standard for Basic Terminology of Urban Planning; China Academy of Urban Planning & Design Press: Beijing, China, 1998. [Google Scholar]
  50. Muchoney, D.; Borak, J.; Chi, H.; Friedl, M.; Gopal, S.; Hodges, J.; Morrow, N.; Strahler, A. Application of the MODIS global supervised classification model to vegetation and land cover mapping of Central America. Int. J. Remote Sens. 2000, 21, 1115–1138. [Google Scholar] [CrossRef]
  51. Hui, W. TM image classification based on support vector machine. J. Earth Sci. Environ. 2006, 28, 93–95. [Google Scholar]
  52. Yu, X.; Luo, Y.; Zhuang, D.; Wang, S.; Wang, Y. Comparative analysis of land cover change detection in an Inner Mongolia grassland area. Acta Ecol. Sin. 2014, 34, 7192–7201. [Google Scholar]
  53. Ebenezer, I.; Easwarakumar, K.S.; Joseph, I. Urban landcover classification from multispectral image data using optimized AdaBoosted random forests. Remote Sens. Lett. 2017, 8, 350–359. [Google Scholar]
  54. Matthew, M.H.; Scott, N.M.; Melanie, A.M. High-resolution landcover classification using Random Forest. Remote Sens. Lett. 2014, 5, 112–121. [Google Scholar]
  55. Daniel, B.M.; Marcus, L.; Petter, P. Comparison of algorithms for classifying Swedish landcover using Landsat TM and ERS-1 SAR data. Remote Sens. Environ. 2000, 71, 1–15. [Google Scholar]
  56. Andrea, P.K.; Renatam, P.; Eduardo, R.S.; Mauricio, M.; Marco, A.S.G.; Georgio, G. Cost and environmental impacts reduction through building compactness. Eng. Constr. Archit. Manag. 2021, 28, 1176–1195. [Google Scholar]
  57. Mandelbrot, B.B. How long is the coast of Britain? Statistical self-similarity and fractional dimension. Science 1967, 156, 636–638. [Google Scholar] [CrossRef] [Green Version]
  58. Zhang, Y.; Wang, Q. Fractal study of urban morphology—A case study of Taiyuan city. J. Shanxi Univ. 2000, 23, 365–368. [Google Scholar]
  59. Wang, Q. A quantitative study on the change of urban structure based on Taiyuan city. Econ. Geogr. 2002, 22, 339–341. [Google Scholar]
  60. Peng, Q.; Tang, L. Chaotic history and standardization future of sector analysis model. Sci. Online 2020. Available online: http://www.paper.edu.cn/releasepaper/content/202006-21 (accessed on 18 October 2021).
  61. Leorey, O.M.; Nariida, C.S. A framework for linking urban form and air quality. Environ. Model. Softw. 1999, 14, 541–548. [Google Scholar]
  62. Emily, H.W.; James, D.H.; Daniel, L.C.; Michael, P.P.; Chester, A. Development of a geospatial model to quantify, describe and map urban growth. Remote Sens. Environ. 2003, 86, 275–285. [Google Scholar]
  63. Xu, C.; Liu, M.; Zhang, C.; An, S.; Yu, W.; Jing, M. The spatiotemporal dynamics of rapid urban growth in the Nanjing metropolitan region of China. Landsc. Ecol. 2007, 22, 925–937. [Google Scholar] [CrossRef]
  64. Mcgarigal, K.; Marks, B.J. FRAGSTATS: Spatial Pattern Analysis Program for Quantifying Landscape Structure; General Technical Report PNW; USDA Forest Service: Portland, OR, USA, 1995.
  65. Dai, Z. Urbanization and land-losing farmers. Urban Probl. 2010, 96–101. [Google Scholar] [CrossRef]
  66. Cai, W. Analysis of the status and causes of land urbanization faster than population urbanization in Fujian Province. Fujian Trib. Humanit. Soc. Sci. 2013, 142–146. [Google Scholar]
  67. Dai, W. Problems existing in urban land use in Anhui Province in the process of rapid urbanization. Rev. Econ. Res. 2011, 53–58. [Google Scholar] [CrossRef]
  68. Lee, Y. An allometric analysis of the US urban system: 1960–80. Environ. Plan. A 1989, 21, 463–476. [Google Scholar] [CrossRef]
  69. Li, X.; Chen, G.; Xu, X. Urban allometric growth in China: Theory and facts. Acta Geogr. Sin. 2009, 64, 399–407. [Google Scholar]
  70. Hong, J.; Guo, B.; Fu, Y.; Nie, H. Analytical method for man-land coupling allometric growth under the background of new-type urbanization. J. Geo-Inf. Sci. 2020, 22, 1049–1062. [Google Scholar]
  71. Shen, W.; Zhou, P.; Du, Q.; Lu, F.; Liu, M. An allometric analysis and prediction of the scaling relations between population and land area of Zhengzhou based on time series. Mod. Urban Res. 2017, 100–105. [Google Scholar]
  72. Tan, X.; Deng, J. Grey relation analysis: A new method of multifactor statistical analysis. Stat. Res. 1995, 12, 46–48. [Google Scholar]
  73. Liu, R.; Zhu, D.; Zhu, Z.; Yang, W. Analysis of the driving forces of urban sprawl in Dezhou City based on a Logistic regression model. Resour. Sci. 2009, 31, 1919–1926. [Google Scholar]
  74. Tingwei, Z. Community features and urban sprawl: The case of the Chicago metropolitan region. Land Use Policy 2001, 18, 221–232. [Google Scholar]
  75. Muller, D.; Leitao, P.T.; Sikor, T. Comparing determinants of cropland abandonment in Albania and Romania using boosted regression trees. Agric. Syst. 2013, 117, 66–77. [Google Scholar] [CrossRef]
  76. Marshall, J.D. Urban land area and population growth: A new scaling relationship for Metropolitan expansion. Urban Stud. 2007, 18, 11–58. [Google Scholar] [CrossRef]
  77. Zhang, B.; Li, J.; Wang, M.; Duan, P.; Li, C. Using DMSP/OLS and NPP/VIIRS images to analyze the expansion of 21 urban agglomerations in mainland China. J. Urban Plan. Dev. 2021, 147, 04021024. [Google Scholar] [CrossRef]
  78. Zhong, Y.; Lin, A.; Xiao, C.; Zhou, Z. Research on the spatio-temporal dynamic evolution characteristics and influencing factors of electrical power consumption in three urban agglomerations of Yangtze River Economic Belt, China based on DMSP/OLS night light data. Remote Sens. 2021, 13, 1150. [Google Scholar] [CrossRef]
  79. Ma, J.; Liang, P. Study of urban expansion change monitoring based on GF-1. Geomat. Spat. Inf. Technol. 2017, 40, 61–64. [Google Scholar]
  80. Zhang, Y.; Chang, X.; Liu, Y.; Lu, Y.; Wang, Y.; Liu, Y. Urban expansion simulation under constraint of multiple ecosystem services (MESs) based on cellular automata (CA)-Markov model: Scenario analysis and policy implications. Land Use Policy 2021, 108, 105667. [Google Scholar] [CrossRef]
  81. Yin, J.; Yin, Z.; Zhong, H.; Xu, S.; Hu, X.; Wang, J.; Wu, J. Monitoring urban expansion and land use/land cover changes of Shanghai metropolitan area during the transitional economy (1979–2009) in China. Environ. Monit. Assess. 2011, 177, 609–621. [Google Scholar] [CrossRef]
  82. Zhi, Y.; Dona, J.; Stevan, B.; Jared, T. Changes in urban built-up surface and population distribution patterns during 1986–1999: A case study of Cairo, Egypt. Comput. Environ. Urban Syst. 2005, 29, 595–616. [Google Scholar]
  83. Camerini, A.L.; Gerosa, T.; Marciano, L. Predicting problematic smartphone use over time in adolescence: A latent class regression analysis of online and offline activities. New Media Soc. 2021, 23, 3229–3248. [Google Scholar] [CrossRef]
  84. Hwang, J.; Jones, A.; Bhagat, R.; McGann, K.; Louis, C. Prognostic factors of veno-arterial ecmo patients: A multiple logistic analysis. Chest 2021, 160, A1138. [Google Scholar] [CrossRef]
  85. Lu, A.; Chang, Y.; Wu, H. Analyzing service quality and satisfaction by multivariate analysis of variance: A case of Taiwan tobacco and liquor corporation. Int. J. Inf. Syst. Serv. Sect. 2021, 13, 1–17. [Google Scholar] [CrossRef]
  86. Elemile, O.O.; Ibitogbe, E.M.; Folorunso, O.P.; Ejiboye, P.O.; Adewumi, J.R. Principal component analysis of groundwater sources pollution in Omu-Aran Community, Nigeria. Environ. Earth Sci. 2021, 80, 1–16. [Google Scholar] [CrossRef]
  87. Bayane, I.; Mankar, A.; Brthwiler, E.; Sorensen, J.D. Quantification of traffic and temperature effects on the fatigue safety of a reinforced-concrete bridge deck based on monitoring data. Eng. Struct. 2019, 196, 109357. [Google Scholar] [CrossRef]
  88. Liu, S.; Yang, Y.; Xie, N.; Forrest, J. New progress of grey system theory in the new millennium. Grey Syst. Theory Appl. 2016, 6, 2–31. [Google Scholar] [CrossRef]
  89. Gao, Y. The Driving Force Analysis of Non-Agricultural Construction Land Expansion in Xiaonan District of Xiaogan City; Research on Land Problems in Ecological Civilization; Hubei Provincial Land Society: Wuhan, China, 2008. [Google Scholar]
Figure 1. Location of Hubei Province in China and location of the study area in Hubei Province.
Remotesensing 13 04299 g001
Figure 2. Diagram of the research framework.
Remotesensing 13 04299 g002
Figure 3. The eight sectors defined in the study area, superposed on the 1990 built-up area map. The eight sectors are divided by taking the gravity of Xiaonan District’s built-up area in 1990 as the origin.
Remotesensing 13 04299 g003
Figure 4. The expansion of the built-up area from 1990–2020, main rivers, main roads, and boundaries of towns in Xiaonan District.
Remotesensing 13 04299 g004
Figure 5. The expansion of built-up area every five years. To better illustrate the constraints on the shape and expansion of the built-up area, the two main rivers (Gunzi River and Xian River) were placed in the figures.
Remotesensing 13 04299 g005
Figure 6. Radar chart of the expansion area for each period in different directions every five years.
Remotesensing 13 04299 g006
Figure 7. Compaction index and fractional exponent of the built-up area from 1990–2020.
Remotesensing 13 04299 g007
Figure 8. Spatial distributions and expansion of urban land from 1990–2020 in Xiaonan District.
Remotesensing 13 04299 g008
Figure 9. The expansion velocity (V) and expansion intensity (R) of the urban land from 1990–2020.
Remotesensing 13 04299 g009
Figure 10. Composition of three urban growth types of urban land from 1990–2020.
Remotesensing 13 04299 g010
Figure 11. Landscape changes of urban land in Xiaonan District from 1990–2020.
Remotesensing 13 04299 g011
Figure 12. The allometric relationship between urban population vs. built-up area from 1995 to 2020.
Remotesensing 13 04299 g012
Figure 13. Industrial structure change of Xiaonan District from 1995–2020.
Remotesensing 13 04299 g013
Figure 14. Urban population and total population change of Xiaonan District from 1995–2020.
Remotesensing 13 04299 g014
Table 1. Basic parameters of selected remote sensing images.
NumberSatellitePath-RowTimeResolution (m)
1Landsat5123–38, 123–39September 199030
2Landsat5123–38, 123–39August 199530
3Landsat5123–38, 123–39September 200030
4Landsat5123–38, 123–39May 200530
5Landsat5123–38, 123–39November 201030
6Landsat8123–38, 123–39August 201530
7Landsat8123–38, 123–39February 202030
Table 2. Compaction index and fractional exponent of Xiaonan District from 1995–2020.
PeriodAnnual Area Growth Rate of the Built-Up AreaAnnual Growth Rate of Urban PopulationUrban Area-Population Elastic Coefficient
1995–20000.7041.7240.408
2000–20051.9760.1216.467
2005–20101.892−0.024−78.833
2010–20154.4864.3521.031
2015–20206.2622.2762.751
Table 3. The expansion of urban land from 1995–2020 in Xiaonan District.
Driving Force IndexCorrelation Index
Total population0.9953
GDP0.8997
The proportion of secondary industry0.9964
The proportion of tertiary industry0.9949
Government revenue0.8415
Investment in fixed assets of the whole society0.7081
Publisher’s Note: MDPI stays neutral with regard to jurisdictional claims in published maps and institutional affiliations.

