Abstract
Dramatic urban land expansion and its internal sub-fraction change during 2000–2020 have taken place in Africa; however, the investigation of their spatial heterogeneity and dynamic change monitoring at the continental scale are rarely reported. Taking the whole of Africa as a study area, the synergic approach of normalized settlement density index and random forest was applied to assess urban land and its sub-land fractions (i.e., impervious surface area and vegetation space) in Africa, through time series of remotely sensed images on a cloud computing platform. The generated 30-m resolution urban land/sub-land products displayed good accuracy, with comprehensive accuracy of over 90%. During 2000–2020, the evaluated urban land throughout Africa increased from 1.93 × 10⁴ km2 to 4.18 × 10⁴ km2, with a total expansion rate of 116.49%, and the expanded urban area of the top six countries accounted for more than half of the total increments, meaning that the urban expansion was concentrated in several major countries. A turning green Africa was observed, with a continuously increasing ratio of vegetation space to built-up area and a faster increment of vegetation space than impervious surface area (i.e., 134.43% vs., 108.88%) within urban regions. A better living environment was also found in different urbanized regions, as the newly expanded urban area was characterized by lower impervious surface area fraction and higher vegetation fraction compared with the original urban area. Similarly, the humid/semi-humid regions also displayed a better living environment than arid/semi-arid regions. The relationship between socioeconomic development factors (i.e., gross domestic product and urban population) and impervious surface area was investigated and both passed the significance test (p < 0.05), with a higher fit value in the former than the latter. Overall, urban land and its fractional land cover change in Africa during 2000–2020 promoted the well-being of human settlements, indicating the positive effect on environments.
1. Introduction
In recent decades, the rapid economic development and technological progress made great changes in the way of human life, such as the continuously improving infrastructure [1,2] and medical service [3,4] in urban regions. However, the increasing requirements of human development on consumption resources led to the hazards of local/regional environments [5], and further made the global eco-environmental problems more obvious [6]. The caused issues of climate warming [7], soil erosion [8], extreme rainfall and drought [9,10], carbon emission [11], and public health events [12,13] in the human development not only affected the sustainable development of social economy, but also threatened the well-being of human life [14]. Land use evolution played an irreplaceable basic role in monitoring these globally ecological environments and made the fast response to global changes [15,16]. As one of the main global land use change types, urban land area has been showing a continuous and violent expansion process [17,18], and its area by 2030 will be three times greater than that of 2000 [19]. In particular, the highly spatial mosaic of land use types, such as impervious surface area and vegetation space inside the cities, displayed the surprisingly rapid evolution in the process of urban land expansion [20]. The large-scale assessment and dynamic detection of urban land and its internal land cover changes were conducive to explore their potential impact on the globally eco-environmental issues, such as climate, hydrological system, biodiversity, and biogeochemistry, in the evolution of land use.
Urban land and its internal land cover changes displayed greatly regional differences in the land expansion speed, dimension, spatial form, and internal structure [21]. Currently, most countries in the European continent, North America, and South America have completed the rapid urbanization process and formed a relatively stable urban land pattern [21,22]. The land covers within the cities on these continents were mainly characterized by low-density impervious surface area and high-density vegetation space [22]. A large number of vegetation spaces within the cities showed a good regulatory ecosystem service and urban thermal environment, and, thus, it improved the well-being of human settlements [23]. Meanwhile, most countries on the Asian continent, such as China and India, are experiencing a rapid urbanization process [21]. Urban regions continue to expand outward, along with the complex and dramatic land changes in both newly expanded and original urban regions [24]. An impervious surface area usually had a higher density and vegetation, with lower density in urban regions of Asia compared with that of America and African continents, indicating that the residential vegetation space environment needs to be improved [22,25]. The environmental effect of urban land changes in these continents was also investigated from the perspective of bio-geophysical and bio-geochemical cycles [26]. At present, the urbanization process has become the focus and was investigated in much of the previous literature on a continental scale [22,25,26], but the detection of land and its sub-land changes in urban regions of the whole African continent was often ignored. Especially since 2000, rapid economic growth and large-scale population increases in the African continent may bring about drastic changes in land cover structure within the cities that need to be revealed.
Remotely sensed satellites have become an important data source for land cover mapping at the local, regional, and global scales due to their advantages of time series and spatial coverages [27,28]. High-resolution satellite images, such as quickbird, ikonos, and Gao Fen, can usually depict a clearer pattern of land spatial heterogeneity [29,30], but the automatic extraction technology was difficult to obtain good accuracy considering the “same object with different spectrums” and the “same spectrum with different objects” phenomenon [31]. When using a high-resolution satellite to carry out large-scale land mapping, the purchase cost and data processing capacity also need to be considered. Medium-resolution land resources satellites featuring free availability and good spectral applicability were always used in land mapping [31,32]. Among them, one of the typical satellites, Landsat, with good time continuity since 1972 and the properly local 30-m spatial resolution, was widely applied to monitor land use and related changes at the local and regional scales [18,33]. With the development of computer technology and big data processing, land use from Landsat images achieved large-scale or global-scale 30-m resolution mapping on a cloud computing platform [25,34]. The African continent was very large [25,35]. Urban land mapping in such a large area required the use of a big data processing platform, such as Google Earth Engine.
In this study, urban land and its fractional covers throughout the African continent were surveyed. The aims of our research were as follows: (1) to generate 30-m resolution urban land and its fractional sub-land types (i.e., impervious surface area and vegetation space) data in urban regions of the whole of Africa in 2000, 2010, and 2020, using time series of remotely sensed images and big data Google Earth Engine platform; (2) to monitor urban land size and expansion rate in different stages of 2000–2020 throughout Africa and in different regions and, further, to compare the differences in spatial evolution of the fractional impervious surface area and fractional vegetation space in sub-Africa regions and in different urbanization level regions (i.e., newly expanded urban region during 2000–2020 and original urban region in 2000); and (3) to explore the relationship between urban land/fractional sub-land changes and the climatic/socioeconomic regions to reveal the quantitative relationship among them. At length, we also discussed the different vegetation space and urbanization processes in Africa and other continents, and further discussed the relationship between urban land change and other potential variables.
2. Methods
2.1. Study Area
Africa is located in the western part of the Eastern Hemisphere, south of Europe and west of Asia (Figure 1). The border of the African continent extends to Cape Hafeng (51°24′E, 10°27′N) in the east, Cape Ogalas (20°02′E, 34°51′S) in the south, Cape Verde (17°33′W, 14°45′N) in the west, and Cape Giran (9°50′E, 37°21′N) in the north. It covers an area of about 30.2 million km2, accounting for 20.4% of the total land area in the world and becoming the second largest continent in the world (Asia is the largest continent in the world, with an area of 44.5 million km2) [25]. From the perspective of regional differentiation, Africa is divided into North Africa and sub-Saharan Africa (i.e., Middle Africa, East Africa, South Africa, and West Africa). It had a population of about 1.29 billion on January 2021 and ranks the second in the world after Asia.
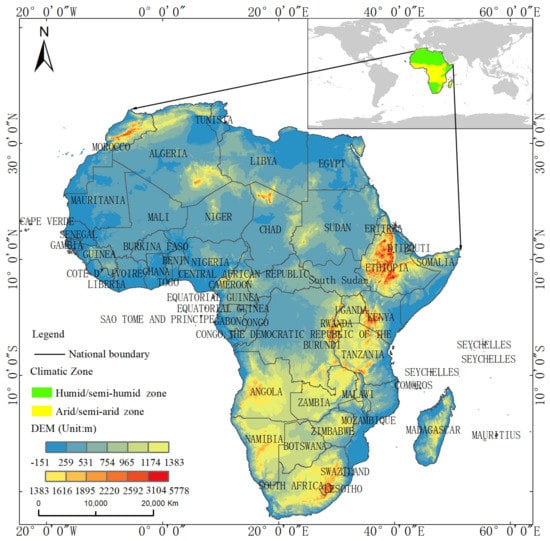
Figure 1.
Geographic information map of Africa. Notes: the yellow and green in the upper right corner of the location diagram represent climatic regions of Africa. The main map represents elevation and administrative divisions of Africa.
The generally social, economic, political, and historical factors usually have an impact on the urban land change in Africa and, here, we give a brief description in the study area section. Africa’s social culture is various, such as the languages and religions. African language culture mainly belongs to four language families, namely, Semito–Hamitic languages/Afroasiatic languages, Nilo–Saharan languages, Niger–Congo languages, and Khoisan family [36]. There are three main religious cultures in Africa, including traditional religion, Islam, and Christianity. Traditional religion is inherent to the native people, with a long history and broad social foundation. Islam and Christianity were later introduced into Africa from other regions [37]. The GDP of the whole of Africa is about USD 0.65 × 10⁸, USD 1.91 × 10⁸, and USD 2.38 × 10⁸ in the years of 2000, 2010, and 2020, along with the total growth of about USD 1.73 × 10⁸ during 2000–2020. Africa is also a civilized continent with a long history, along with the historical development process of ancient, middle ages, modern, and contemporary. In particular, the Nile Valley is one of the cradles of ancient civilization and Egypt in the lower reaches of the Nile River is one of the four ancient civilizations in the world [38]. Multiple political systems coexist in Africa. After independence, most African countries are influenced by colonial countries and follow the capitalist system [39,40]. Taking the whole African continent as the research area, we produce urban expansion and intra-urban component data product, which may serve as natural background carrier data for other scholars to conduct joint research between this dataset and Africa’s unique culture, economy, political system, religion, and so on.
2.2. Data Source Acquisition
The data source used in this study was composed of basic geographic information data, remotely sensed data, and socioeconomic data. Specifically, the basic geographic information data covered African boundary, national border, urban location, and global continental distribution. The remotely sensed data mainly contained the medium-resolution Landsat TM/ETM+/OLI8 images, HJ-1A/1B satellite, high-resolution Google satellites, night-time light image from DMSP/OLS and VIIRS-DNB, digital elevation model, and the Köppen–Geiger climate map of the world. The socioeconomic data included urban population and gross domestic product. A detailed description of these data are provided in the following table (Table 1).

Table 1.
The detailed description of the main data used in the research of the whole of Africa.
2.3. The Establishment of Urban LAND Boundary
For the large-scale urban land mapping, the normalized settlement density index (NSDI) that mainly integrates the NTL and normalized difference vegetation index (NDVI) became an effective method and achieved good results [31], but it showed relatively low accuracy in arid regions compared with humid regions [31,41]. Africa has a vast land area, making it pass through multiple climatic regions. We combined these climatic regions into the humid/semi-humid regions and the arid/semi-arid regions from the perspective of arid and humid characteristics of the climate using a Köppen–Geiger climate map of the world [42] to obtain better urban land mapping under different climate backgrounds. Considering the complex surface environment of Africa, we combined the NSDI and the LSDI (i.e., low albedo and soil difference index) to weaken the interference of bare soil on urban land boundary extraction on the Google Earth Engine platform (GEE) using the NTL and NDVI from time series of Landsat images [28,31,41]. Then, urban land data that covered the whole of Africa in the years of 2000, 2010, and 2020 were downloaded to the local desktops.
Due to the Landsat’s 16-day visit cycle and uncertain spatial interference, such as the rains and shelter from clouds, there were still bad pixels in annual Landsat image extraction (i.e., the image date from 1 January to 31 December), which affected the extraction of urban land. In addition, a high spatial mosaic of different land use types, such as the mosaic of urban parks and their internal roads, in urban regions was also a factor that cannot be ignored, because the urban land extraction from NSDI was carried out according to the density of human settlements [28,31]. A large area of vegetation spaces in urban regions, such as urban parks, was often excluded from urban land because of their super low human settlement density. In fact, the complete urban boundary should include a variety of land covers that are displayed in Equations (1) and (2) [28]. In view of these two issues, namely the uncertain quality of remotely sensed images and the possible lack of a region of urban boundaries, we filtered all urban land boundary results through visualization. The vector urban boundary was superimposed on the false color image of Landsat to correct the regions where urban boundary may be inaccurate in each studied year, using professional geo-science interpretation knowledge. Then, urban land boundary throughout Africa in 2000, 2010, and 2020 was generated.
where, in Equation (1), the ISA, Veg, and Others represent the intra-urban land cover of impervious surface area, vegetation space, and other land use types; in Equation (2), the ISAp, Vegp, and Othersp represent the fractional/compositional land of impervious surface area, vegetation space, and other land use types within urban regions, respectively; and, in Equation (3), the fLow and fSoil represent the fractional/compositional images of low albedo and soil. The training samples of fractional/compositional low albedo objects were from shadows of buildings and water bodies, and that of soil was from bare soil. Both were calculated through the random forest of GEE platform.
2.4. Production of the Fractional Lands of Intra-Urban Impervious Surface Area and Intra-Urban Vegetation Space
2.4.1. Selection of Training Samples
The acquisition of training samples of impervious surface area and vegetation space in intra-urban regions was a very important parameter in the random forest model of the Google cloud computing platform, which may directly affect the classification accuracy. Considering the spatiotemporal complexity of land use types and the heterogeneity of remotely sensed pixels in urban regions, as well as the superposition effect of different climatic backgrounds, the selection of training samples needs to be scientifically designed according to the actual land surface situation. We obtained the sampling points consistent with the area of different climatic zones (i.e., the arid and humid regions). The 10% intervals of impervious surface area fractions and vegetation fractions were designed so as to reduce the underlying interference of uneven distribution of land surface. To obtain more accurate sampling point types, the spatial distribution location of sampling points also included all land coverage types as much as possible. Specifically, the impervious surface area samples included roads, square roofs, etc. The vegetation space samples covered the concentrated distribution of forest land, grassland and parks, and the scattered distribution of vegetation space in roads and residential areas. Other lands within the urban regions were also collected. A visual human–computer interaction scheme was used to obtain the fraction of impervious surface area and vegetation using 2-m resolution Google satellite images, and all sampling points were then obtained. These sampling points were input into a random forest model to obtain the fraction of impervious surface area and vegetation space in the years 2000, 2010, and 2020, respectively.
2.4.2. Retrieval of the Sub-Lands within Urban Regions Using the Random Forest Model
Random forest was proved to be a better land use classification approach compared with other methods, such as SVMs and ANNs, in previous literature [28,43]. Advantage characteristics of random forest were the great ability in dealing with high-dimensional datasets and obtaining good classification accuracy, such as the 30-m resolution impervious surface area mapping on a global scale [28,44]. In this study, random forest was applied to obtain the fraction of impervious surface area and vegetation space through the input parameters, such as the trained sample points from Section 2.4.1 from this study, the time series of Landsat images from 1 January to 31 December of each studied year, and the low-albedo and soil difference index (LSDI, Equation (3) [45]) that was used to distinguish impervious surface area from bare soil in arid and semi-arid regions due to their similar optical bands [18]. A detailed description of the produced land fraction process by random forest was provided in Kuang’s study [28], and thus it was not repeated here. As a result, the 30-m resolution land fractions of impervious surface area and bare soil throughout Africa was generated using random forest in the years of 2000, 2010, and 2020, respectively. After that, these data were downloaded in frames with a 1° × 1° interval and were cut by spatial superposition data from the urban land boundary. We visually checked the blank land regions that were affected by uncertain quality of Landsat images. All missing data regions were filled using the images that were adjacent to one studied year in the random forest model. After that, the obtained impervious surface area was masked by a water body. Finally, the fractional land of impervious surface area and vegetation space within urban regions was generated in 2000, 2010, and 2020, respectively.
2.5. Accuracy Evaluation of Urban Land and Its Sub-Land Scheme
Two-scale accuracy verification was performed using high-resolution Google satellite images, because this study assessed the dynamic changes of urban land and its sub-fractions in Africa from 2000–2020. For the urban land scale (i.e., the verification of pixel level), we randomly distributed 1500 sample points in each studied year of 2000, 2010, and 2020, with a total of 4500 samples, to guide the verification work through the indicators of reference pixels, classified pixels, number correct, producer’s accuracy, user’s accuracy, overall classification accuracy, and kappa coefficient.
For the urban sub-land scale (i.e., the fractional verification of land cover), in order to reduce the potentially spatial position matching error of remotely sensed images, a moving window approach with the size of 3 3 pixels (i.e., 90 m 90 m; a pixel size was 30 m 30 m on the Landsat image scale), the fractional land assessment was performed. We randomly generated 1000 such windows in each studied year using the stratified random sample method. Each window was regarded as a sampling point. We obtained the faction of land cover type in each window through human–computer interaction interpretation and professional geoscience knowledge. In order to further improve the accuracy of data evaluation, the fraction of the evaluated impervious surface area and vegetation space data was reclassified into 10 categories, with 10% fraction increment in each category. The fitting coefficient (R2) and mean square error (RMSE) were performed to evaluate the accuracy of the actual values and the verified values in each studied year, respectively.
2.6. Geographical Division of Africa
Africa was a vast territory with different natural environments, which may lead to a regionally spatial difference in urban expansion. We divided Africa into five regions according to the traditionally geographical reference to present the regionally differentiated patterns of urban expansion in Africa from 2000 to 2020. These five regions contained Middle Africa, Eastern Africa, Southern Africa, Northern Africa, and Western Africa. Specifically, Middle Africa consisted of Chad, Central Africa, Cameroon, Equatorial Guinea, Gabon, Congo, D.R. Congo, and São Tomé and Príncipe. Eastern Africa contained Ethiopia, Eritrea, Somalia, Djibouti, Kenya, Tanzania, Uganda, Seychelles, South Sudan, Rwanda, and Burundi. Southern Africa covered Botswana, Namibia, Angola, South Africa, Swaziland, Lesotho, Madagascar, Malawi, Comoros, Mauritius, Mozambique, Zambia, and Zimbabwe. Northern Africa had the countries of Egypt, Sudan, Libya, Tunisia, Algeria, and Morocco. Western Africa included Mauritania, Senegal, Gambia, Mali, Burkina Faso, Guinea, Guinea-Bissau, Cape Verde, Sierra Leone, Liberia, Côte d’Ivoire, Ghana, Togo, Benin, Niger, and Nigeria.
3. Results
3.1. Accuracy Assessment for Urban Land and Its Fractional Sub-Structures
As we know, the area ratio of built-up land to the whole continent was always very small. This led to the issue of uneven distribution of random verification points, namely, most of the verification points were distributed in nonurban areas, while there were few verification points in built-up land regions. Less verification points in urban regions were not conducive to accuracy evaluation. In order to solve this problem, we tested the buffer zone outside the boundary of each built-up area to balance the verification points in urban land and nonurban land regions. Then, buffer zones with a radius of 100 km were created outside each built-up land boundary, and, thus, the verified regions consisted of urban land and buffer zone (Figure 2).
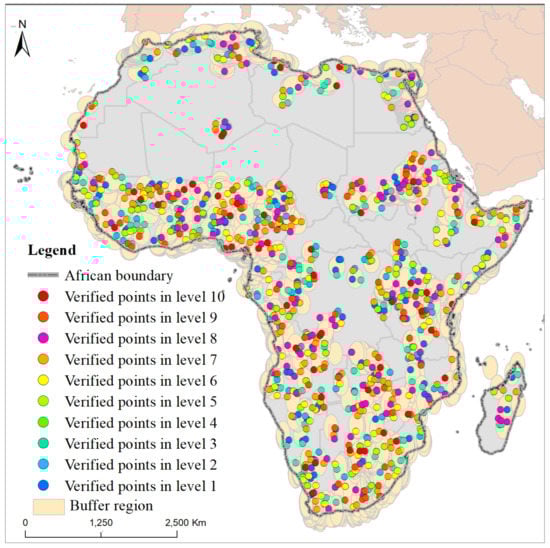
Figure 2.
Examples of the verified points for the fractional land covers within urban regions throughout Africa in 2020. Note: the density levels from 1 to 10 represent the fractions of impervious surface area or vegetation space at 10% intervals from 0.01% to 100%, separately. The buffer region represents an outward buffer distance radius of 100 km from the edge of each city.
We carried out the accuracy verification on two scales, including urban land and fractional land cover structure. In the urban land scale, the 4500 randomly distributed sampling points (i.e., the 1500 sampling points in each studied year) were superimposed on the 2-m resolution Google image to obtain the quantitative accuracy. The indicators, such as reference pixels, classified pixels, number correct, producer’s accuracy, and user’s accuracy, were calculated (Table 2). We collected the total right number of 1351 points, 1359 points, and 1366 points in years of 2000, 2010, and 2020. Overall classification accuracy displayed with high accuracy of 90.07%, 90.60%, and 91.07%, with kappa coefficient values of 0.82, 0.84, and 0.84 (Table 2), respectively. For the urban fractional land cover structure scale, the density levels from 1 to 10 that represented the fractions of impervious surface area or vegetation space at 10% intervals from 0.01% to 100% were executed to ensure that each density level had a certain number of verification points (Figure 2). The accuracy of fractional impervious surface area obtained the R2 and RMSE (%) values of 0.9118 and 13%, with the corresponding vegetation values of 0.9264 and 12%, respectively.
Table 2.
Accuracy evaluation matrix of urban land in Africa in 2000, 2010, and 2020, respectively.
3.2. Analysis of Urban Expansion and Regional Urban Land Differences in Africa during 2000–2020
Throughout Africa, the assessed total urban area was 1.93 104 km2 in the year 2000, which was then increased to 3.09 104 km2 in the year 2010 and 4.18 104 km2 in the year 2020, respectively (Figure 3 and Table 3). This means that the urban area throughout the African continent expanded by 116.49% (total area increment: 2.25 104 km2, average annual urban expansion rate: 0.113 104 km2/year) during 2000–2020, compared with that in 2000, implying a rapid urbanization process. However, our evaluation data showed that the urbanization process in Africa was not uniform and stable. The total urban expansion area increased by 1.16 104 km2 during 2000–2010 and by 1.09 104 km2 during 2010–2010, and, thus, the urban expansion was faster during 2000–2010. Moreover, the proportion of urban area occupying the whole area of Africa was assessed, with the values of 0.065% in 2000, 0.103% in 2010, and 0.140% in 2020, indicating a total increase proportion of 0.075% during 2000–2020.
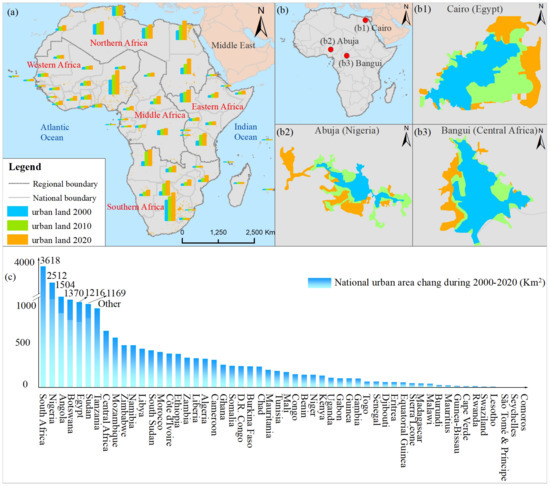
Figure 3.
Spatial distribution and statistical map of urban expansion in Africa during 2000–2020. (a) Urban land distribution in 2020 (dark yellow) in sub-Africa regions of Middle Africa, Eastern Africa, Southern Africa, Northern Africa, and Western Africa; and the urban land statistics at the national scale in years 2000, 2010, and 2020, respectively. (b) The sample cities of urban expansion in Cairo ((b1), Egypt), Abuja ((b2), Nigeria), and Bangui ((b3), Central Africa). (c) Total urban expansion changes at the national scale from 2000 to 2020, and we only marked the number when a total urban expansion area was more than 1000 km2 in each country throughout the studied period.
Table 3.
Statistical analysis of urban land and its expansion change in sub-Africa regions during 2000–2020 (unit: km2).
In different regions, the urban area changes of Middle Africa (MA), Eastern Africa (EA), Southern Africa (SA), Northern Africa (NA), and Western Africa (WA) were counted according to the traditionally regional geographical division of the African continent (Figure 3a,b and Table 3). In 2000, SA had the highest urban land area (6668.45 km2), followed by NA (5690.10 km2) and WA (4646.40 km2). EA and MA had the least urban land area, with 1273.65 km2 and 1048.91 km2, respectively. During 2000–2020, all regions have experienced rapid urban expansion, with the expanded urban land areas of 8840.31 km2 (SA), 5158.18 km2 (WA), 4580.39 km2 (NA), 2068.94 km2 (EA), and 1866.50 km2 (MA). At length, SA still had the highest urban land area in 2020, followed by NA, WA, EA, and MA, which displayed the same order with that of 2000. However, these regions have experienced a different trend of urban expansion during 2000–2010 and 2010–2020. Specifically, urban expansion in most regions has experienced the process of accelerating expansion first, and then slowing down, which was consistent with the trend of urban expansion in the whole of Africa. Only NA showed a continuous and accelerated urban expansion, with areas of 1884.22 km2 during 2000–2010 and 2696.17 km2 during 2010–2020, separately.
At the country level, only 11.11% (i.e., six countries) of the total countries in the whole of Africa expanded the urban land more than 1000 km2 during 2000–2020, and most countries (i.e., 55.56% of the total number) expanded between 100 km2 and 1000 km2; the other 33.33% countries were lower than 100 km2. Thus, the expansion of urban land at the national scale was quite different. Furthermore, the expanded urban area of the top six countries (i.e., South Africa, Nigeria, Angola, Botswana, Egypt, and Sudan) accounted for more than half (50.67%) of the total urban expansion in Africa during 2000–2020 (Figure 3c). This means that urban expansion on the African continent was concentrated in several major countries.
3.3. Assessment of the Fractional Intra-Urban Impervious Surface Area and the Fractional Intra-urban Vegetation Space Change in Africa during 2000–2020
3.3.1. Intra-Urban Land Structure Analysis and Its Differentiated Characteristics in Different Urban Level Areas in Africa
Intra-urban land structure (i.e., impervious surface area, urban vegetation space, and urban other lands) changes very quickly throughout the Africa during 2000–2020. Specifically, total impervious surface area expanded violently with the covers from 1.12 104 km2 to 1.76 104 km2 and 2.34 104 km2 in the years of 2000, 2010, and 2020 (Figure 4 and Figure 5), indicating an overall growth rate of 108.93%. However, in the same period of 2000–2010 and 2010–2020, the change in impervious surface area is not stable, accompanied by the total area increment in these two periods of 0.63 104 km2 and 0.59 104 km2. Interestingly, urban vegetation space showed a continuous increasing trend in these two periods (increments: 0.40 104 km2 and 0.47 104 km2), which showed that the total area of urban vegetation space in Africa has increased by 134.43%. This change in urban vegetation space was conducive to adjust the climate of urban areas and to increase the comfort of human settlements.
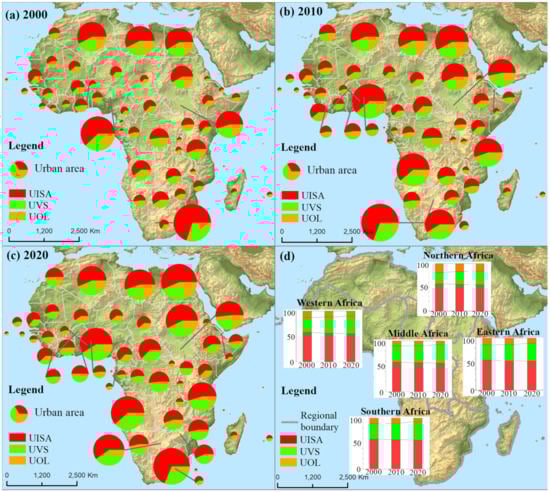
Figure 4.
Spatial statistics of the fractional urban land structure in Africa during 2000–2020. (a–c) Show the average density of the fractional intra-urban impervious surface area (UISA), the fractional intra-urban vegetation space (UVS), and the fractional intra-urban other land-cover (UOL) at the country scale in 2000, 2010, and 2020, respectively, and the size of the circle represents the total area of urban land on a national scale. (d) Statistics of the changes in average density of the fractional UISA, UVS, and UOL in sub-African regions of Middle Africa, Eastern Africa, Southern Africa, Northern Africa, and Western Africa in 2000, 2010, and 2020, respectively.
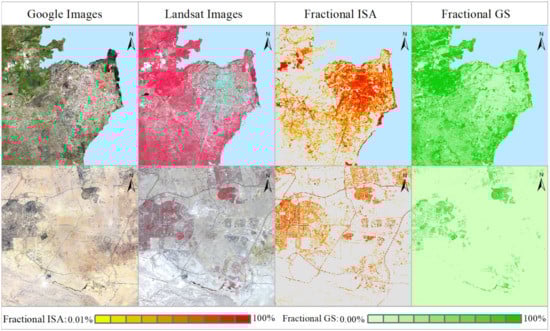
Figure 5.
Regional examples of impervious surface area fractions and vegetation space fractions in Tanzania (i.e., the first line) and Egypt (i.e., the second line) of Africa. In each line, we provide 2-m Google images, 30-m Landsat images, 30-m fractional impervious surface area, and vegetation space, respectively. Notes: the regional example in the first line is located in humid/semi-humid areas and the regional example in the second line is located in arid/semi-arid areas.
In regions with different urbanization levels (i.e., the original urban region (OUR) in 2000 and the newly expanded urban region (NEUR) during 2000–2020), the change process of impervious surface area and urban vegetation space displayed the different characteristics. Average density of the fractional impervious surface area was 58.02% in 2000 and 61.14% in 2020 in OUR, while the value of that was 50.77% in NEUR. This means that the impervious surface area facilities, such as houses, squares, and roads, in OUR have been improved, while low-density impervious surface area was expanding in NEUR. The change in another intra-urban land factor (i.e., urban vegetation space) can explain the reason for such low-density impervious surface expansion. Average density of the fractional urban vegetation space was 29.05% in 2000 and 28.35% in 2020 in OUR, which showed a basically constant vegetation cover. However, the value of this in NEUR was as high as 40.13%. Therefore, the expansion of newly expanded urban areas was mainly characterized by relatively low impervious density and relatively high vegetation density compared with the corresponding values in OUR. Other intra-urban land covers displayed a decreasing density trend over the studied period.
3.3.2. Differences in Spatial Evolution of the Fractional Intra-Urban Impervious Surface Area and Vegetation Space in Sub-Africa Regions
During 2000–2020, the expansion of impervious surface area in sub-Africa regions (Figure 4d) followed the order of Southern Africa (SA, +4908.93 km2), Western Africa (WA, +2748.24 km2), Northern Africa (NA, +2401.64 km2), Eastern Africa (EA, +1126.89 km2), and Middle Africa (MA, +1040.66 km2), which resulted in impervious surface covers of 8796.70 km2 (SA), 1650.54 km2 (MA), 5442.83 km2 (WA), 1866.95 km2 (EA), and 5661.85 km2 (NA) in the year 2020. However, a high impervious surface expansion does not mean a high expansion rate, considering the background area of the initial 2000. Our assessment showed that the impervious surface expansion rate was 170.63% (MA), 152.27% (EA), 126.27% (SA), 101.99% (WA), and 73.67% (NA), respectively. Moreover, we found that the area increments of urban vegetation space in each region displayed the same order as that of the impervious surface area, namely, +3461.58 km2 (SA), +2003.78 km2 (WA), +1620.16 km2 (NA), +751.49 km2 (EA), and +714.01 km2 (MA), and the two regions with the highest urban vegetation space expansion rate appeared in MA (+213.46%) and EA (+199.41%), which still showed the same trend as the impervious expansion rate.
Average density of the fractional impervious surface area in all sub-Africa regions has a decreasing trend, with the maximum change in WA (−2.48%) and the minimum change in MA (−1.53%), due to the increment of impervious density in the original urban region being lower than that in the new urban expansion region. In contrast, average density of the fractional urban vegetation space displayed an increasing trend, with the largest increment occurring in WA. Generally speaking, the mosaic land construction of urban impervious surface and vegetation space (mainly in new urban expansion areas) in the process of urbanization from 2000 to 2020 was formed.
3.4. Analysis of the Fractional Urban Land Change under Climate and Socioeconomic Environments
In order to explore the difference of fractional urban land evolution under different climate environments in Africa during 2000–2020, we combined the climate maps into two type regions, including the humid and semi-humid regions (HSH) and the arid and semi-arid regions (ASA), according to the Köppen–Geiger climate map of the world (Figure 1 and Table 4). The urban land expanded from 7957.69 km2 in 2000 to 19095.28 km2 in 2020, with a total growth rate of 139.96% in the HSH region, which was higher than that (100.06%) in the ASA region. The HSH climatic environments provided a more suitable living environment for human beings, which promoted the faster development of urbanization compared with the ASA climatic environments in Africa. At the same time, the average value of the fractional ISA was 54.91% in the HSH region, but 58.13% in the ASA region (Table 4). In contrast, the average coverage of fractional vegetation space was 36.40% in the HSH region, but only 29.84% in the ASA region. The data displayed that the fractional impervious surface area and vegetation space provided a better living environment in HSH than ASA regions. As for the neglected intra-urban other lands (in fact, most of them were bare soil according to our investigation), its average fraction was only 8.70% in the HSH region, but 12.04% in the ASA region; this showed that its fractional coverage was consistent with the climate backgrounds in Africa during 2000–2020. Therefore, the different climatic environments (i.e., arid or humid backgrounds) affected the proportion of intra-urban land cover types in Africa.
Table 4.
Statistical analysis of the intra-urban land change and its sub-land fractions under different climatic regions.
The relationship between urban land change and socioeconomic conditions (i.e., gross domestic product and urban population) was analyzed (Figure 6). We made the cluster analysis of the dynamic of impervious surface area and gross domestic product using the methods of ordinary least square and geographically weighted regression. In the ordinary least square method, the linear fitting function passed the significance test (p < 0.05) and obtained the best fit value (R2 = 0.7226). This indicated that part of the cost of Africa’s gross domestic product was spent on improving infrastructure in urban impervious surface areas, such as roads, squares, houses, and buildings. The relationship between the dynamic of impervious surface area and urban population was also evaluated, which passed the significance test (p < 0.05) and the fitting value was 0.6944 (R2). Population growth has, to some extent, contributed to the expansion of impervious surface area. Further, the geographically weighted regression (GWR) method that is located on the modeling spatial relationships module on the ArcGIS platform was used to display the related dynamic changes in Africa. We obtained better statistical results, with R2 values of 0.9489 and 0.9262, and the corresponding values were only 0.7226 and 0.6944 in the linear fitting function. Therefore, both the gross domestic product and urban population promoted the development of impervious surface area, and our study showed their quantitative values of Africa during 2000–2020.
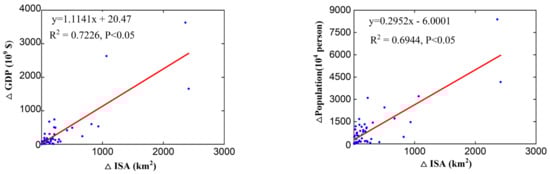
Figure 6.
Statistics of the functional relationship values between the urban impervious surface area and gross domestic product, and between urban impervious surface area and urban population in Africa during 2000–2020. Notes: “Δ” represents the words “dynamic change”, ISA: impervious surface area, GDP: gross domestic product.
4. Discussion
4.1. A Turning Green Africa Is Taking Place in Its Intra-Urban Regions since 2000
Our research first reported the estimation of the urban land expansion and its sub-land change (i.e., impervious surface area, vegetation space, and other lands) in the whole of Africa from 2000 to 2020 according to the Google cloud computing platform and time series of remotely sensed images. We found that a turning green Africa happened in its urban land region (Figure 4), with the average fraction of urban vegetation space increasing from 29.05% in 2000 to 34.21% in 2020. The increased vegetation space of urban regions was more significant for the human settlement feelings in Africa, because Africa was dominated by tropical climate, with a high temperature throughout the whole year [46,47]. This means that the urban vegetation space acted as an essential role in regulating local urban climate of the whole of Africa all year round.
We further compared the differences in urban vegetation space in different climatic regions of Africa and found that the average fraction of urban vegetation space increased in both arid and humid regions (Figure 4 and Table 4). In particular, a higher increment of vegetation space fraction was evaluated in the arid region than that of the humid region during 2000–2020 (Table 4), indicating a stronger demand for urban living environment regulation in the hot arid region of Africa. We also searched the previous literature [18,21,22], which also showed that the urban vegetation existed in the arid region of China and the arid region of “The Belt and Road (i.e., Eurasian continent)” during 2000–2015. However, the climate regulation of urban vegetation was mainly concentrated in summer and autumn in these arid regions because the urban vegetation withered and was covered with snows when the cold weather appeared in winter and spring in the regions, such as arid areas of China [18]. In contrast, the African continent was not controlled by cold and polar climate (Figure 1), and the local climate regulation demand for vegetation in urban areas occurred in any season in Africa [48,49,50]. This means that the increase in vegetation fraction in Africa, especially in its arid areas, was more meaningful to the improvement of urban living environment.
The construction of a newly expanded urban region in Africa during 2000–2020 paid more attention to the design of vegetation space compared with that of the original urban region in 2000 (Table 4), as we found the average fraction of grace space was 40.13% in the new urban region, and, in the original urban region, the average value was only 29.05% in 2000 and 28.35% in 2020. The vegetation space of the new urban region was ahead of the old urban region. Further, we found a lower fraction of impervious surface area in new than old urban regions. A higher fraction of vegetation space and a lower fraction of impervious surface area, along with the very low bare soil cover in the new urban region (Table 4), indicate that urban vegetation construction in Africa is taking place, which is conducive to improving the thermal comfort and ecosystem service in the urban regions of Africa [21].
4.2. Comparison of the Urban Expansion Process between Africa and Other Regions
The urbanization process in different regions of the world always displayed the regional differences due to socioeconomic and natural conditions [51,52]. On a continental scale, we analyzed the urban land expansion and its sub-land change throughout Africa from 2000 to 2020 (Figure 2). The ratio of urban land to total area of Africa was 0.065% in 2000, 0.103% in 2010, and 0.140% in 2020 according to our assessment (Figure 2), which was much lower than the value of Asia in the same period when the ratio of urban land to total area of Asia was already 0.59% in the year of 2010 [53]. This means that the ratio of urban land to the continent was 3.93 times higher in Asia than Africa in 2010. Because, in Asia, there were many developed countries, and these developed countries always had a higher ratio (i.e., urban land to national area), such as Singapore (36.73%), South Korea (8.26%), and Japan (5.75%) [53], this increased the average ratio of urban land to continents on the Asian scale. In contrast, the African continent was basically composed of the developing countries, and the top value of urban land to national area was only 3.72% (i.e., Mauritius). Furthermore, the total GDP in Asia increased by USD 22.07 × 10¹² during 2000–2020, and this increase was over 12 times greater than that of the whole of Africa in the same period, and the total population growth in Asia was also 1.74 times higher than that of Africa according to the published data of International Monetary Fund. A greater wealth increment and faster population growth in Asia during 2000–2020 may promote the more drastic urban land expansion to a certain extent.
At the regional scale, the urban land expansion rate in humid and semi-humid areas was faster than that in arid and semi-arid areas in Africa during 2000–2020 (i.e., 120.66% vs. 83.97%, Table 4). Both regions showed a rapid process of urban expansion, along with the design of urban environmental livability (i.e., high fraction of vegetation space and low-density impervious surface area) in the newly expanded urban area. A higher fraction of vegetation space and a lower fraction of impervious surface area appeared in humid and semi-humid areas compared with the arid and semi-arid areas (i.e., vegetation fraction: 36.40% vs. 29.84%, impervious surface area fraction: 54.91% vs. 58.13%), and it, thus, promoted the faster urban land expansion in the humid climate zone. In addition to comparing the different urbanization processes in different climatic regions of Africa, we also searched urban land expansion in other areas, such as the arid region of China [18,22]. The urban expansion rate was 50.37% during 2000–2014, with an average annual growth rate of 3.60% in the arid region of China, which showed a low growth rate compared with the arid region of Africa (i.e., the average annual growth rate of 4.20%). Further, we also compared the different countries’ wealth and population density between Asia and Africa. During 2000–2020, most Asian countries experienced faster economic growth than African countries. Specifically, the top three countries in Asia were China, India, and South Korea, with the total increment of about USD 13.51 × 10¹², USD 2.15 × 10¹², and USD 1.05 × 10¹², respectively. In contrast, the top three countries in Africa were Nigeria, Egypt, and South Africa, with the corresponding values of only USD 0.36 × 10¹², USD 0.26 × 10¹², and USD 0.17 × 10¹² in the same period from the IMF database. The population density of these countries was also in the front of Asia or Africa considering the changes of population size and urban land during 2000–2020. In particular, in the global population ranking in 2020, China, India, Nigeria, and Egypt were in the first, second, seventh, and fourteenth from the IMF database. Meanwhile, the high density of China’s urban population was mainly due to the control of urban space development [54]. Although China had a large land area, the suitable cultivated land resources were limited [55]. The urban development plan in China may help to ensure sufficient cultivated land to ensure national food security [56], while, in South Korea, it was mainly due to the limited national boundary scope [57]. In Africa, the high population density in Nigeria and Egypt was probably due to a faster urbanization process compared with other African countries.
4.3. Potential Environmental Effects of Intra-Urban Land Change in Africa during 2000–2020
From 2000–2020, the intra-urban land in Africa experienced a rapid evolution, and the potential environmental effects of intra-urban land (i.e., impervious surface area, vegetation space, and other lands (mainly bare soil)) may include the following aspects. The first was the change in surface radiation energy balance. In humid and semi-humid regions, the change in bare soil was relatively small, and the expansion of impervious surface area and loss of vegetation space were the main land change, which brought about an increase in land surface temperature and was easy to form urban heat island phenomena [58,59] due to the perceived energy change by the human body from impervious surface area to vegetation space. In contrast, in arid and semi-arid regions, the type of land change within the urban areas was dominated by both the expansion of impervious surface area and vegetation space and the loss of bare soil. The cover of vegetation space to bare soil led to surface cold regulation. This energy regulation was easy to be perceived by the human body. Meanwhile, the energy discrepancy, such as the land surface temperature, between impervious surface area and bare soil was difficult to distinguish through human perception [60,61]. In fact, when the land cover changed from impervious surface area to bare soil, the higher land surface albedo of impervious surface area compared with that of bare soil brought about more energy reflection from the land surface to the atmosphere [61], leading to a reduction in energy storage, and thus forming a low land surface temperature (i.e., surface cold regulation phenomenon) [60,61]. The intra-urban land change in Africa formed land surface thermal regulation in humid regions and land surface cold regulation in arid regions. In the future, the energy impact of land structure change within cities on the whole African continent should be evaluated by the means of remotely sensed data, actual observation, and model simulation.
Another environmental effect of land change within the cities was the impact on terrestrial ecosystem carbon [62]. During 2000–2020, we found that the cities in Africa were turning to vegetation. A considerable part of the newly expanded urban vegetation space was from previous bare soil, especially in arid and semi-arid urban regions, along with the migration of low-density soil carbon (~5.55 kg C m−2) to medium-density vegetation (~8.08 kg C m−2) [63,64,65,66]. Meanwhile, the land change from bare soil to the impervious surface area during the urban expansion is also a process from carbon source to carbon sink, indicating a carbon sink process [63]. Furthermore, the sustainable greening of urban regions can offset part of carbon emissions through photosynthesis in the urbanized region [67,68], which is conducive to achieving the goal of “carbon neutrality [69,70,71]” in the African continent.
4.4. A Preliminary Discussion between Urban Land Change and Other Potential Variables
In addition to the three discussions of a turning green Africa, the comparison of the urban expansion process between Africa and other regions and the potential environmental effects of intra-urban land change in Africa during 2000–2020, the relationship between urban land change and other potential variables, such as the evolution of the total population, the changes in urban population and in gross wealth, and the impact of recent cultural, social, and historical processes, was preliminarily analyzed to provide a wide and complex way for the potential application prospects of the data produced in this study. Firstly, according to the published data from International Monetary Fund (IMF, https://data.imf.org/ (accessed on 16 September 2021)), the total population throughout the African continent increased by 5.01 × 10⁸ during 2000–2020, and the evolution of the total population per country experienced a population expansion process during the same period, with the largest increment occurring in Nigeria (+0.84 × 10⁸ persons) and the smallest increment in Seychelles (+0.00019 × 10⁸ persons). The gap in population growth at the national level was obvious, although all the countries experienced population growth. We explored the relationship between population growth and impervious surface area change at the national scale and obtained the fitting value of 0.6944 (R2) and p < 0.05 during 2000–2020 (Figure 6). The population growth of each country may promote the expansion of local urban land due to the impervious surface area being the main carrier of human activities inside the cities. Secondly, urban population weight in relation to the total population may affect the urban land change in Africa. From the perspective of population, urbanization rate referred to the changing process of agricultural population into nonagricultural population, which was an indirect indicator to measure the change in urban population weight in relation to the total population per country in the same period. The continuous and rapid process of urbanization in Africa was mainly from the beginning of independence [72], and the urbanization rate was 39% in 2003 and was expected to reach 54% in 2050 [73]. In the context of urbanization throughout the African continent, each country experienced different urbanization, such as the urbanization rate of 42.6% in Egypt, with the corresponding value of 49.8% in 2010 based on the statistics from the world development indicator database of World Bank (https://databank.worldbank.org/home.aspx (accessed on 16 September 2021)). Egypt was at the forefront of urbanization on the African continent. Our remote sensing monitoring also showed that urban land expansion in Egypt was also very big, with a total area of over 5 × 10³ km2 during 2000–2020. Thirdly, the change in gross wealth per country was also a significant factor. During 2000–2020, the total GDP of the whole African continent increased by USD 1.73 × 10¹², and we investigated the change in GDP and impervious surface area at the country level and obtained the fitting value of 0.7226 (R2) and p < 0.05 during 2000–2020 (Figure 6). The growth of wealth promoted the expansion of urban land to a certain extent. Lastly, other variables, such as the cultural and social processes (i.e., religious, political issues, conflicts, etc. [74,75,76]), and the former historical processes (i.e., colonial traditions, international commercial agreements, international integration, etc. [77,78]) may have an impact on the change of urban land, and these variables may bring the complex change in urban spatial heterogeneity on a local scale. Due to the difficulty in obtaining these accurate materials at the urban scale, spatial-scale superposition analysis/quantitatively statistical analysis using the urban data generated from the study was difficult to carry out. In the next plan, we will consider the combination of qualitative and quantitative ways to investigate the relationship between cultural, social, and historical processes and urban land change, through establishing extensive scientific research co-operation with local universities and official institutions from Africa. Furthermore, considering the wide application of the data generated from this study, a more in-depth discussion should be applied to make this research more relevant to geographers, historians, sociologists, and urban research scholars in the future.
5. Conclusions
In this study, we assessed and monitored the dynamic change in urban land and its fractional sub-lands throughout the whole African continent from 2000 to 2020, using time series of remotely sensed images and the Google cloud computing platform. The generated 30-m resolution urban land and sub-land fractions in the African continent showed good accuracy. The assessed total urban area was 1.93 104 km2 in 2000 and 4.18 104 km2 in 2020, with an expansion rate of 116.49%. All sub-African regions experienced rapid urban expansion during 2000–2020, and the expanded urban area of the top six countries accounted for more than half of the total increments, meaning the urban expansion was concentrated in several major countries. For the lands within urban regions, a turning green Africa was taking place, with a faster increment appearing in vegetation space than impervious surface area (134.43% vs. 108.88%) over the studied period. In different urbanization levels, we found the newly expanded urban areas were characterized by lower impervious surface area fraction and higher vegetation fraction compared with the original urban areas, showing the improvement of urban living environments during urbanization. In different climatic regions, the fractional impervious surface area and vegetation space provided a better living environment in HSH than ASA regions (fractional ISA: 54.91% in HSH vs. 58.13% in ASA; fractional vegetation space: 36.40% in HSH vs. 29.84% in ASA). The relationship between impervious surface change and socioeconomic conditions also displayed that both the gross domestic product and urban population passed the significance test, and we obtained a higher fit value in the former than the latter. Overall, the urbanization process in Africa has improved the quality of human settlements.
Author Contributions
Conceptualization and methodology, Z.Y., W.C., Y.D., T.P., Y.B., F.U.O. and W.K.; writing—original draft preparation, Z.Y., writing—review and editing, Y.B. and W.K. All authors have read and agreed to the published version of the manuscript.
Funding
This work was supported by the Special Project of Global Space Remote Sensing Information Submission and Annual Report from the Ministry of Science and Technology (1061302600001).
Data Availability Statement
A description of the produced data in this study was provided on the English website of the ChinaGEOSS (Global Earth Observation System of Systems) Data Sharing Network: http://www.chinageoss.cn/geoarc/en/news/2020C.html (accessed on 16 September 2021), and the produced data were also shared in this platform, English link: http://www.chinageoss.cn/geoarc/en/news/DataSet.html. (accessed on 16 September 2021).
Conflicts of Interest
The authors declare no conflict of interest.
References
- Donou-Adonsou, F.; Lim, S.; Mathey, S.A. Technological Progress and Economic Growth in Sub-Saharan Africa: Evidence from Telecommunications Infrastructure. Int. Adv. Econ. Res. 2016, 22, 65–75. [Google Scholar] [CrossRef]
- Meso, P.; Musa, P.F.; Straub, D.; Mbarika, V.W.A. Information infrastructure, governance, and socio-economic development in developing countries. Eur. J. Inf. Syst. 2009, 18, 52–65. [Google Scholar] [CrossRef]
- Kim, K.-S.; Lee, Y.-J. Developments and General Features of National Health Insurance in Korea. Soc. Work. Public Health 2010, 25, 142–157. [Google Scholar] [CrossRef]
- Flannery, D.; Jarrin, R. Building A Regulatory And Payment Framework Flexible Enough To Withstand Technological Progress. Health Aff. 2018, 37, 2052–2059. [Google Scholar] [CrossRef]
- Akizu-Gardoki, O.; Bueno, G.; Wiedmann, T.; Lopez-Guede, J.M.; Arto, I.; Hernandez, P.; Moran, D. Decoupling between human development and energy consumption within footprint accounts. J. Clean. Prod. 2018, 202, 1145–1157. [Google Scholar] [CrossRef]
- Nguyen, K.-A.; Liou, Y.-A. Global mapping of eco-environmental vulnerability from human and nature disturbances. Sci. Total Environ. 2019, 664, 995–1004. [Google Scholar] [CrossRef]
- Christidis, N.; Stott, P.A.; Brown, S.J. The Role of Human Activity in the Recent Warming of Extremely Warm Daytime Temperatures. J. Clim. 2011, 24, 1922–1930. [Google Scholar] [CrossRef]
- Borrelli, P.; Robinson, D.A.; Fleischer, L.R.; Lugato, E.; Ballabio, C.; Alewell, C.; Meusburger, K.; Modugno, S.; Schütt, B.; Ferro, V.; et al. An assessment of the global impact of 21st century land use change on soil erosion. Nat. Commun. 2017, 8, 1–13. [Google Scholar] [CrossRef] [PubMed]
- Satgé, F.; Espinoza, R.; Zolá, R.P.; Roig, H.; Timouk, F.; Molina, J.; Garnier, J.; Calmant, S.; Seyler, F.; Bonnet, M.-P. Role of Climate Variability and Human Activity on Poopó Lake Droughts between 1990 and 2015 Assessed Using Remote Sensing Data. Remote Sens. 2017, 9, 218. [Google Scholar] [CrossRef]
- Wang, H.; Liu, G.; Li, Z.; Ye, X.; Fu, B.; Lv, Y. Impacts of Drought and Human Activity on Vegetation Growth in the Grain for Green Program Region, China. Chin. Geogr. Sci. 2018, 28, 470–481. [Google Scholar] [CrossRef]
- Steinberger, J.; Roberts, J.T.; Peters, G.; Baiocchi, G. Pathways of human development and carbon emissions embodied in trade. Nat. Clim. Chang. 2012, 2, 81–85. [Google Scholar] [CrossRef]
- Siri, J.G.; Newell, B.; Proust, K.; Capon, A. Urbanization, extreme events, and health: The case for systems approaches in mitigation, management, and response. Asia Pac. J. Public Health 2016, 28, 15S–27S. [Google Scholar] [CrossRef]
- Gibney, E. Coronavirus lockdowns have changed the way Earth moves. Nature 2020, 580, 176–177. [Google Scholar] [CrossRef]
- Sandifer, P.A.; Sutton-Grier, A.; Ward, B.P. Exploring connections among nature, biodiversity, ecosystem services, and human health and well-being: Opportunities to enhance health and biodiversity conservation. Ecosyst. Serv. 2015, 12, 1–15. [Google Scholar] [CrossRef]
- Long, H.; Liu, Y.; Hou, X.; Li, T.; Li, Y. Effects of land use transitions due to rapid urbanization on ecosystem services: Implications for urban planning in the new developing area of China. Habitat Int. 2014, 44, 536–544. [Google Scholar] [CrossRef]
- Liu, J.; Kuang, W.; Zhang, Z.; Xu, X.; Qin, Y.; Ning, J.; Zhou, W.; Zhang, S.; Li, R.; Yan, C.; et al. Spatiotemporal characteristics, patterns, and causes of land-use changes in China since the late 1980s. J. Geogr. Sci. 2014, 24, 195–210. [Google Scholar] [CrossRef]
- Huang, Z.; Wei, Y.D.; He, C.; Li, H. Urban land expansion under economic transition in China: A multi-level modeling analysis. Habitat Int. 2015, 47, 69–82. [Google Scholar] [CrossRef]
- Pan, T.; Lu, D.; Zhang, C.; Chen, X.; Shao, H.; Kuang, W.; Chi, W.; Liu, Z.; Du, G.; Cao, L. Urban Land-Cover Dynamics in Arid China Based on High-Resolution Urban Land Mapping Products. Remote Sens. 2017, 9, 730. [Google Scholar] [CrossRef]
- Seto, K.C.; Güneralp, B.; Hutyra, L.R. Global forecasts of urban expansion to 2030 and direct impacts on biodiversity and carbon pools. Proc. Natl. Acad. Sci. USA 2012, 109, 16083–16088. [Google Scholar] [CrossRef]
- Li, J.; Song, C.; Cao, L.; Zhu, F.; Meng, X.; Wu, J. Impacts of landscape structure on surface urban heat islands: A case study of Shanghai, China. Remote Sens. Environ. 2011, 115, 3249–3263. [Google Scholar] [CrossRef]
- Kuang, W.; Chi, W.; Lu, D.; Dou, Y. A comparative analysis of megacity expansions in China and the US: Patterns, rates and driving forces. Landsc. Urban Plan. 2014, 132, 121–135. [Google Scholar] [CrossRef]
- Pan, T.; Kuang, W.; Hamdi, R.; Zhang, C.; Zhang, S.; Li, Z.; Chen, X. City-Level Comparison of Urban Land-Cover Configurations from 2000–2015 across 65 Countries within the Global Belt and Road. Remote Sens. 2019, 11, 1515. [Google Scholar] [CrossRef]
- Stathakis, D.; Tselios, V.; Faraslis, I. Urbanization in European regions based on night lights. Remote Sens. Appl. Soc. Environ. 2015, 2, 26–34. [Google Scholar] [CrossRef]
- Kuang, W.; Liu, J.; Dong, J.; Chi, W.; Zhang, C. The rapid and massive urban and industrial land expansions in China between 1990 and 2010: A CLUD-based analysis of their trajectories, patterns, and drivers. Landsc. Urban Plan. 2016, 145, 21–33. [Google Scholar] [CrossRef]
- Kuang, W. Mapping global impervious surface area and green space within urban environments. Sci. China Earth Sci. 2019, 62, 1591–1606. [Google Scholar] [CrossRef]
- Mat, N.; Cerceau, J.; Shi, L.; Park, H.-S.; Junqua, G.; Lopez-Ferber, M. Socio-ecological transitions toward low-carbon port cities: Trends, changes and adaptation processes in Asia and Europe. J. Clean. Prod. 2016, 114, 362–375. [Google Scholar] [CrossRef]
- Zhang, Z.; Wang, X.; Zhao, X.; Liu, B.; Yi, L.; Zuo, L.; Wen, Q.; Liu, F.; Xu, J.; Hu, S. A 2010 update of National Land Use/Cover Database of China at 1:100000 scale using medium spatial resolution satellite images. Remote Sens. Environ. 2014, 149, 142–154. [Google Scholar] [CrossRef]
- Kuang, W.; Zhang, S.; Li, X.; Lu, D. A 30 m resolution dataset of China’s urban impervious surface area and green space, 2000–2018. Earth Syst. Sci. Data 2021, 13, 63–82. [Google Scholar] [CrossRef]
- Qian, Y.; Zhou, W.; Li, W.; Han, L. Understanding the dynamic of greenspace in the urbanized area of Beijing based on high resolution satellite images. Urban For. Urban Green. 2015, 14, 39–47. [Google Scholar] [CrossRef]
- Alphan, H.; Çelik, N. Monitoring changes in landscape pattern: Use of Ikonos and Quickbird images. Environ. Monit. Assess. 2016, 188, 1–13. [Google Scholar] [CrossRef] [PubMed]
- Lu, D.; Tian, H.; Zhou, G.; Ge, H. Regional mapping of human settlements in southeastern China with multisensor remotely sensed data. Remote Sens. Environ. 2008, 112, 3668–3679. [Google Scholar] [CrossRef]
- Li, G.; Li, L.; Lu, D.; Guo, W.; Kuang, W. Mapping impervious surface distribution in China using multi-source remotely sensed data. GISci. Remote Sens. 2020, 57, 543–552. [Google Scholar] [CrossRef]
- Yue, W.; Gao, J.; Yang, X. Estimation of Gross Domestic Product Using Multi-Sensor Remote Sensing Data: A Case Study in Zhejiang Province, East China. Remote Sens. 2014, 6, 7260–7275. [Google Scholar] [CrossRef]
- Liu, X.; Huang, Y.; Xu, X.; Li, X.; Li, X.; Ciais, P.; Lin, P.; Gong, K.; Ziegler, A.D.; Chen, A.; et al. High-spatiotemporal-resolution mapping of global urban change from 1985 to 2015. Nat. Sustain. 2020, 3, 564–570. [Google Scholar] [CrossRef]
- Xu, G.; Dong, T.; Cobbinah, P.B.; Jiao, L.; Sumari, N.S.; Chai, B.; Liu, Y. Urban expansion and form changes across African cities with a global outlook: Spatiotemporal analysis of urban land densities. J. Clean. Prod. 2019, 224, 802–810. [Google Scholar] [CrossRef]
- Olufadewa, I.I.; Adesina, M.; Ayorinde, T. From Africa to the World: Reimagining Africa’s research capacity and culture in the global knowledge economy. J. Glob. Health 2020, 10, 010321. [Google Scholar] [CrossRef]
- Smythe, K.R. Africa’s Past, Our Future; Indiana University Press: Bloomington, India, 2015. [Google Scholar]
- Dick, A.L. The Hidden History of South Africa’s Book and Reading Cultures; University of Toronto Press: Toronto, Canada, 2017. [Google Scholar]
- Resnick, D. The Political Economy of Africa’s Emergent Middle Class: Retrospect and Prospects. J. Int. Dev. 2015, 27, 573–587. [Google Scholar] [CrossRef]
- Rogerson, C.M. South Africa’s informal economy: Reframing debates in national policy. Local Econ. J. Local Econ. Policy Unit 2015, 31, 172–186. [Google Scholar] [CrossRef]
- Liu, X.; Hu, G.; Ai, B.; Li, X.; Shi, Q. A Normalized Urban Areas Composite Index (NUACI) Based on Combination of DMSP-OLS and MODIS for Mapping Impervious Surface Area. Remote Sens. 2015, 7, 17168–17189. [Google Scholar] [CrossRef]
- Beck, H.E.; Zimmermann, N.E.; McVicar, T.; Vergopolan, N.; Berg, A.; Wood, E.F. Present and future Köppen-Geiger climate classification maps at 1-km resolution. Sci. Data 2018, 5, 180214. [Google Scholar] [CrossRef]
- Izquierdo-Verdiguier, E.; Zurita-Milla, R. An evaluation of Guided Regularized Random Forest for classification and regression tasks in remote sensing. Int. J. Appl. Earth Obs. Geoinf. 2020, 88. [Google Scholar] [CrossRef]
- Zhang, X.; Liu, L.; Chen, X.; Gao, Y.; Xie, S.; Mi, J. GLC_FCS30: Global land-cover product with fine classification system at 30 m using time-series Landsat imagery. Earth Syst. Sci. Data 2021, 13, 2753–2776. [Google Scholar] [CrossRef]
- Zhang, C.; Chen, Y.; Lu, D. Mapping the land-cover distribution in arid and semiarid urban landscapes with Landsat Thematic Mapper imagery. Int. J. Remote Sens. 2015, 36, 4483–4500. [Google Scholar] [CrossRef]
- Lavaysse, C.; Flamant, C.; Evan, A.; Janicot, S.; Gaetani, M. Recent climatological trend of the Saharan heat low and its impact on the West African climate. Clim. Dyn. 2015, 47, 3479–3498. [Google Scholar] [CrossRef]
- Skinner, C.B.; Ashfaq, M.; Diffenbaugh, N.S. Influence of Twenty-First-Century Atmospheric and Sea Surface Temperature Forcing on West African Climate. J. Clim. 2012, 25, 527–542. [Google Scholar] [CrossRef]
- Trauth, M.H.; Asrat, A.; Berner, N.; Bibi, F.; Foerster, V.; Grove, M.; Kaboth-Bahr, S.; Maslin, M.A.; Mudelsee, M.; Schäbitz, F. Northern Hemisphere Glaciation, African climate and human evolution. Quat. Sci. Rev. 2021, 268, 107095. [Google Scholar] [CrossRef]
- Krinner, G.; Lezine, A.-M.; Braconnot, P.; Sepulchre, P.; Ramstein, G.; Grenier, C.; Gouttevin, I. A reassessment of lake and wetland feedbacks on the North African Holocene climate. Geophys. Res. Lett. 2012, 39. [Google Scholar] [CrossRef]
- Simon, D.; Leck, H. Understanding climate adaptation and transformation challenges in African cities. Curr. Opin. Environ. Sustain. 2015, 13, 109–116. [Google Scholar] [CrossRef]
- Jiang, L.; O’Neill, B.C. Global urbanization projections for the Shared Socioeconomic Pathways. Glob. Environ. Chang. 2017, 42, 193–199. [Google Scholar] [CrossRef]
- Seto, K.C.; Parnell, S.; Elmqvist, T. A global outlook on urbanization. In Urbanization, Biodiversity and Ecosystem Services: Challenges and Opportunities; Springer: Dordrecht, The Netherlands, 2013; pp. 1–12. [Google Scholar]
- Kuang, W.; Chen, L.; Liu, J.; Xiang, W.; Chi, W.; Lu, D.; Yang, T.; Pan, T.; Liu, A. Remote sensing-based artificial surface cover classification in Asia and spatial pattern analysis. Sci. China Earth Sci. 2016, 59, 1720–1737. [Google Scholar] [CrossRef]
- Wei, Y.H.D. Restructuring for growth in urban China: Transitional institutions, urban development, and spatial transformation. Habitat Int. 2012, 36, 396–405. [Google Scholar] [CrossRef]
- Song, W.; Pijanowski, B.C. The effects of China’s cultivated land balance program on potential land productivity at a national scale. Appl. Geogr. 2014, 46, 158–170. [Google Scholar] [CrossRef]
- Huang, J.; Yang, G. Understanding recent challenges and new food policy in China. Glob. Food Secur. 2017, 12, 119–126. [Google Scholar] [CrossRef]
- Park, M.-S.; Park, S.-H.; Chae, J.-H.; Choi, M.-H.; Song, Y.; Kang, M.; Roh, J.-W. High-resolution urban observation network for user-specific meteorological information service in the Seoul Metropolitan Area, South Korea. Atmos. Meas. Tech. 2017, 10, 1575–1594. [Google Scholar] [CrossRef]
- Sekertekin, A.; Zadbagher, E. Simulation of future land surface temperature distribution and evaluating surface urban heat island based on impervious surface area. Ecol. Indic. 2020, 122, 107230. [Google Scholar] [CrossRef]
- Mathew, A.; Khandelwal, S.; Kaul, N. Spatial and temporal variations of urban heat island effect and the effect of percentage impervious surface area and elevation on land surface temperature: Study of Chandigarh city, India. Sustain. Cities Soc. 2016, 26, 264–277. [Google Scholar] [CrossRef]
- Rasul, A.; Balzter, H.; Smith, C.; Remedios, J.; Adamu, B.; Sobrino, J.A.; Srivanit, M.; Weng, Q. A Review on Remote Sensing of Urban Heat and Cool Islands. Land 2017, 6, 38. [Google Scholar] [CrossRef]
- Lazzarini, M.; Marpu, P.R.; Ghedira, H. Temperature-land cover interactions: The inversion of urban heat island phenomenon in desert city areas. Remote Sens. Environ. 2013, 130, 136–152. [Google Scholar] [CrossRef]
- Zhang, Y.; Odeh, I.O.; Han, C. Bi-temporal characterization of land surface temperature in relation to impervious surface area, NDVI and NDBI, using a sub-pixel image analysis. Int. J. Appl. Earth Obs. Geoinform. 2009, 11, 256–264. [Google Scholar] [CrossRef]
- Yan, Y.; Kuang, W.; Zhang, C.; Chen, C. Impacts of impervious surface expansion on soil organic carbon–a spatially explicit study. Sci. Rep. 2015, 5, 1–9. [Google Scholar] [CrossRef]
- Raciti, S.M.; Hutyra, L.R.; Finzi, A. Depleted soil carbon and nitrogen pools beneath impervious surfaces. Environ. Pollut. 2012, 164, 248–251. [Google Scholar] [CrossRef]
- Cannell, M.G.R.; Milne, R.; Hargreaves, K.J.; Brown, T.A.W.; Cruickshank, M.M.; Bradley, R.I.; Spencer, T.; Hope, D.; Billett, M.F.; Adger, W.N.; et al. National Inventories of Terrestrial Carbon Sources and Sinks: The U.K. Experience. Clim. Chang. 1999, 42, 505–530. [Google Scholar] [CrossRef]
- Zhang, C.; Tian, H.; Pan, S.; Lockaby, G.; Chappelka, A.H. Multi-factor controls on terrestrial carbon dynamics in urbanized areas. Biogeosciences 2014, 11, 7107–7124. [Google Scholar] [CrossRef]
- Li, P.; Wang, Z.-H. Environmental co-benefits of urban greening for mitigating heat and carbon emissions. J. Environ. Manag. 2021, 293, 112963. [Google Scholar] [CrossRef]
- Imam, A.U.K.; Banerjee, U.K. Urbanisation and greening of Indian cities: Problems, practices, and policies. Ambio 2016, 45, 442–457. [Google Scholar] [CrossRef] [PubMed]
- Koondhar, M.A.; Tan, Z.; Alam, G.M.; Khan, Z.A.; Wang, L.; Kong, R. Bioenergy consumption, carbon emissions, and agricultural bioeconomic growth: A systematic approach to carbon neutrality in China. J. Environ. Manag. 2021, 296, 113242. [Google Scholar] [CrossRef] [PubMed]
- Shi, X.; Zheng, Y.; Lei, Y.; Xue, W.; Yan, G.; Liu, X.; Cai, B.; Tong, D.; Wang, J. Air quality benefits of achieving carbon neutrality in China. Sci. Total Environ. 2021, 795, 148784. [Google Scholar] [CrossRef] [PubMed]
- Shao, X.; Zhong, Y.; Liu, W.; Li, R.Y.M. Modeling the effect of green technology innovation and renewable energy on carbon neutrality in N-11 countries? Evidence from advance panel estimations. J. Environ. Manag. 2021, 296, 113189. [Google Scholar] [CrossRef]
- Coquery-Vidrovitch, C. The Process of Urbanization in Africa (From the Origins to the Beginning of Independence). Afr. Stud. Rev. 1991, 34. [Google Scholar] [CrossRef]
- Hay, S.I.; Guerra, C.A.; Tatem, A.J.; Atkinson, P.M.; Snow, R. Urbanization, malaria transmission and disease burden in Africa. Nat. Rev. Genet. 2005, 3, 81–90. [Google Scholar] [CrossRef]
- Brenner, L. Histories of religion in Africa. J. Relig. Afr. 2000, 30, 143–167. [Google Scholar] [CrossRef]
- Meyer, B. What Is Religion in Africa? Relational Dynamics in an Entangled World. J. Relig. Afr. 2021, 50, 156–181. [Google Scholar] [CrossRef]
- Atim, G. The impact of refugees on conflicts in Africa. IOSR J. Humanit. Soc. Sci. 2013, 14, 4–9. [Google Scholar] [CrossRef]
- Holter, K. Interpreting Solomon in colonial and post-colonial Africa. Old Testam. Essays 2006, 19, 851–862. [Google Scholar]
- Geda, A.; Seid, E.H. The potential for internal trade and regional integration in Africa. J. Afr. Trade 2015, 2, 19. [Google Scholar] [CrossRef][Green Version]
Publisher’s Note: MDPI stays neutral with regard to jurisdictional claims in published maps and institutional affiliations. |
© 2021 by the authors. Licensee MDPI, Basel, Switzerland. This article is an open access article distributed under the terms and conditions of the Creative Commons Attribution (CC BY) license (https://creativecommons.org/licenses/by/4.0/).