Article

Multitemporal and Multisensor InSAR Analysis for Ground Displacement Field Assessment at Ischia Volcanic Island (Italy)

1
Istituto Nazionale di Geofisica e Vulcanologia, ONT, Via di Vigna Murata 605, 00143 Roma, Italy
2
Istituto Nazionale di Geofisica e Vulcanologia, Sezione di Pisa, Via Cesare Battisti 53, 56125 Pisa, Italy
3
Istituto Nazionale di Geofisica e Vulcanologia, RM2, Viale Pinturicchio 109, 00196 Roma, Italy
*
Author to whom correspondence should be addressed.
Remote Sens. 2021, 13(21), 4253; https://doi.org/10.3390/rs13214253
Submission received: 9 September 2021 / Revised: 17 October 2021 / Accepted: 19 October 2021 / Published: 22 October 2021

Abstract

:
Volcanic islands are often affected by ground displacement such as slope instability, due to their peculiar morphology. This is the case of Ischia Island (Naples, Italy) dominated by the Mt. Epomeo (787 m a.s.l.), a volcano-tectonic horst located in the central portion of the island. This study aims to follow a long temporal evolution of ground deformations on the island through the interferometric analysis of satellite SAR data. Different datasets, acquired during Envisat, COSMO-SkyMed and Sentinel-1 satellite missions, are for the first time processed in order to obtain the island ground deformations during a time interval spanning 17 years, from November 2002 to December 2019. In detail, the multitemporal differential interferometry technique, named small baseline subset, is applied to produce the ground displacement maps and the associated displacement time series. The results, validated through the analysis and the comparison with a set of GPS measurements, show that the northwestern side of Mt. Epomeo is the sector of the island characterized by the highest subsidence movements (maximum vertical displacement of 218 mm) with velocities ranging from 10 to 20 mm/yr. Finally, the displacement time series allow us to correlate the measured ground deformations with the seismic swarm started with the Mw 3.9 earthquake that occurred on 21 August 2017. Such correlations highlight an acceleration of the ground, following the mainshock, characterized by a subsidence displacement rate of 0.12 mm/day that returned to pre-earthquake levels (0.03 mm/day) after 6 months from the event.

1. Introduction

Volcanic islands are often affected by natural hazards, such as eruptions, earthquakes, landslides and mass movements, frequently interrelated to each other and affecting the same zones. For this reason, it is critically important to continuously study these areas, trying to deeply understand natural hazards, leveraging multidisciplinary knowledge and aiming to mitigate the risk of devastating effects risk.
Ischia Island is a quiescent volcano located in Southern Italy within the Gulf of Naples (Figure 1) and it represents an interesting case study for natural hazards interconnections.
The island is characterized by a long eruptive history, lasting more than 150 ka [1]. The oldest volcanic deposits, individuated along the coastline, represent the remnants of an ancient caldera generated by a massive collapse between 150 and 75 ka. Stratigraphic evidence highlighted that a significant ignimbritic eruption dated 55 ka produced a further caldera collapse and the emplacement of the Green Tuff, the best-known volcanic deposit on the island. After this event, the morpho-geodynamic evolution of the island was essentially controlled by a volcano-tectonic activity, which uplifted the Mt. Epomeo block inside the pre-existing caldera depression over the past 33 ka [2]. This 900–1100 m uplift is a quite unique case of intra-calderic resurgence, very rarely recognized in other volcanic areas [3,4]. The last eruptive activity that occurred in 1302 AD is represented by the Arso eruption. This event produced a 2.5 km length lava flow in the eastern sector of the island with a volume of 0.03 km3 [1] and triggered numerous landslides [5].
The seismic activity of Ischia Island is known with a good degree of confidence starting from the 13th century [5] and it is mainly concentrated in the northern area of the island (Casamicciola Terme and Lacco Ameno localities). Analysing the effects of the historical earthquakes, it was observed that even low magnitudes events, e.g., the Mw 2.8 earthquake that occurred on Casamicciola Terme in 1863 with an epicentral intensity MCS (Mercalli–Cancani–Sieberg) equal to “V”, were able to activate ground movements [5]. Following the 1883 destructive event [6] and, subsequently, sporadic and low-magnitude earthquakes, the most recent and severe event is dated 21 August 2017. It was characterized by a seismic swarm started with a Mw 3.9 earthquake [1,5]. In this case, the conjunction of a very shallow seismic source, local ground amplification and the poor resilience of the buildings, caused unexpected severity [7]. The occurrence of this earthquake allowed scientists to acquire and integrate different geophysical and geological datasets (e.g., historical seismicity, macroseismic observations, geodetic and topographic instrumental information) as well as a detailed mapping of the coseismic effects [5].
In this work, the areas on Ischia Island affected by ground displacement are investigated for the first time in a 17-year time span by applying an InSAR technique to several datasets acquired during Envisat, COSMO-SkyMed and Sentinel-1 satellite missions. We started with those zones historically manifesting slope instabilities [1], such as the sector located south of the Lacco Ameno municipality (Figure 2), which, together with Casamicciola Terme, was the most damaged area during the Mw 3.9 earthquake from 21 August 2017 [8].
In the next sections, the multitemporal and multisensor interferometric processing results are presented, followed by the GPS comparisons. Moreover, for the first time, the ground deformation effects caused by the 2017 seismic swarm are investigated over time in the time series analysis and discussion sections.

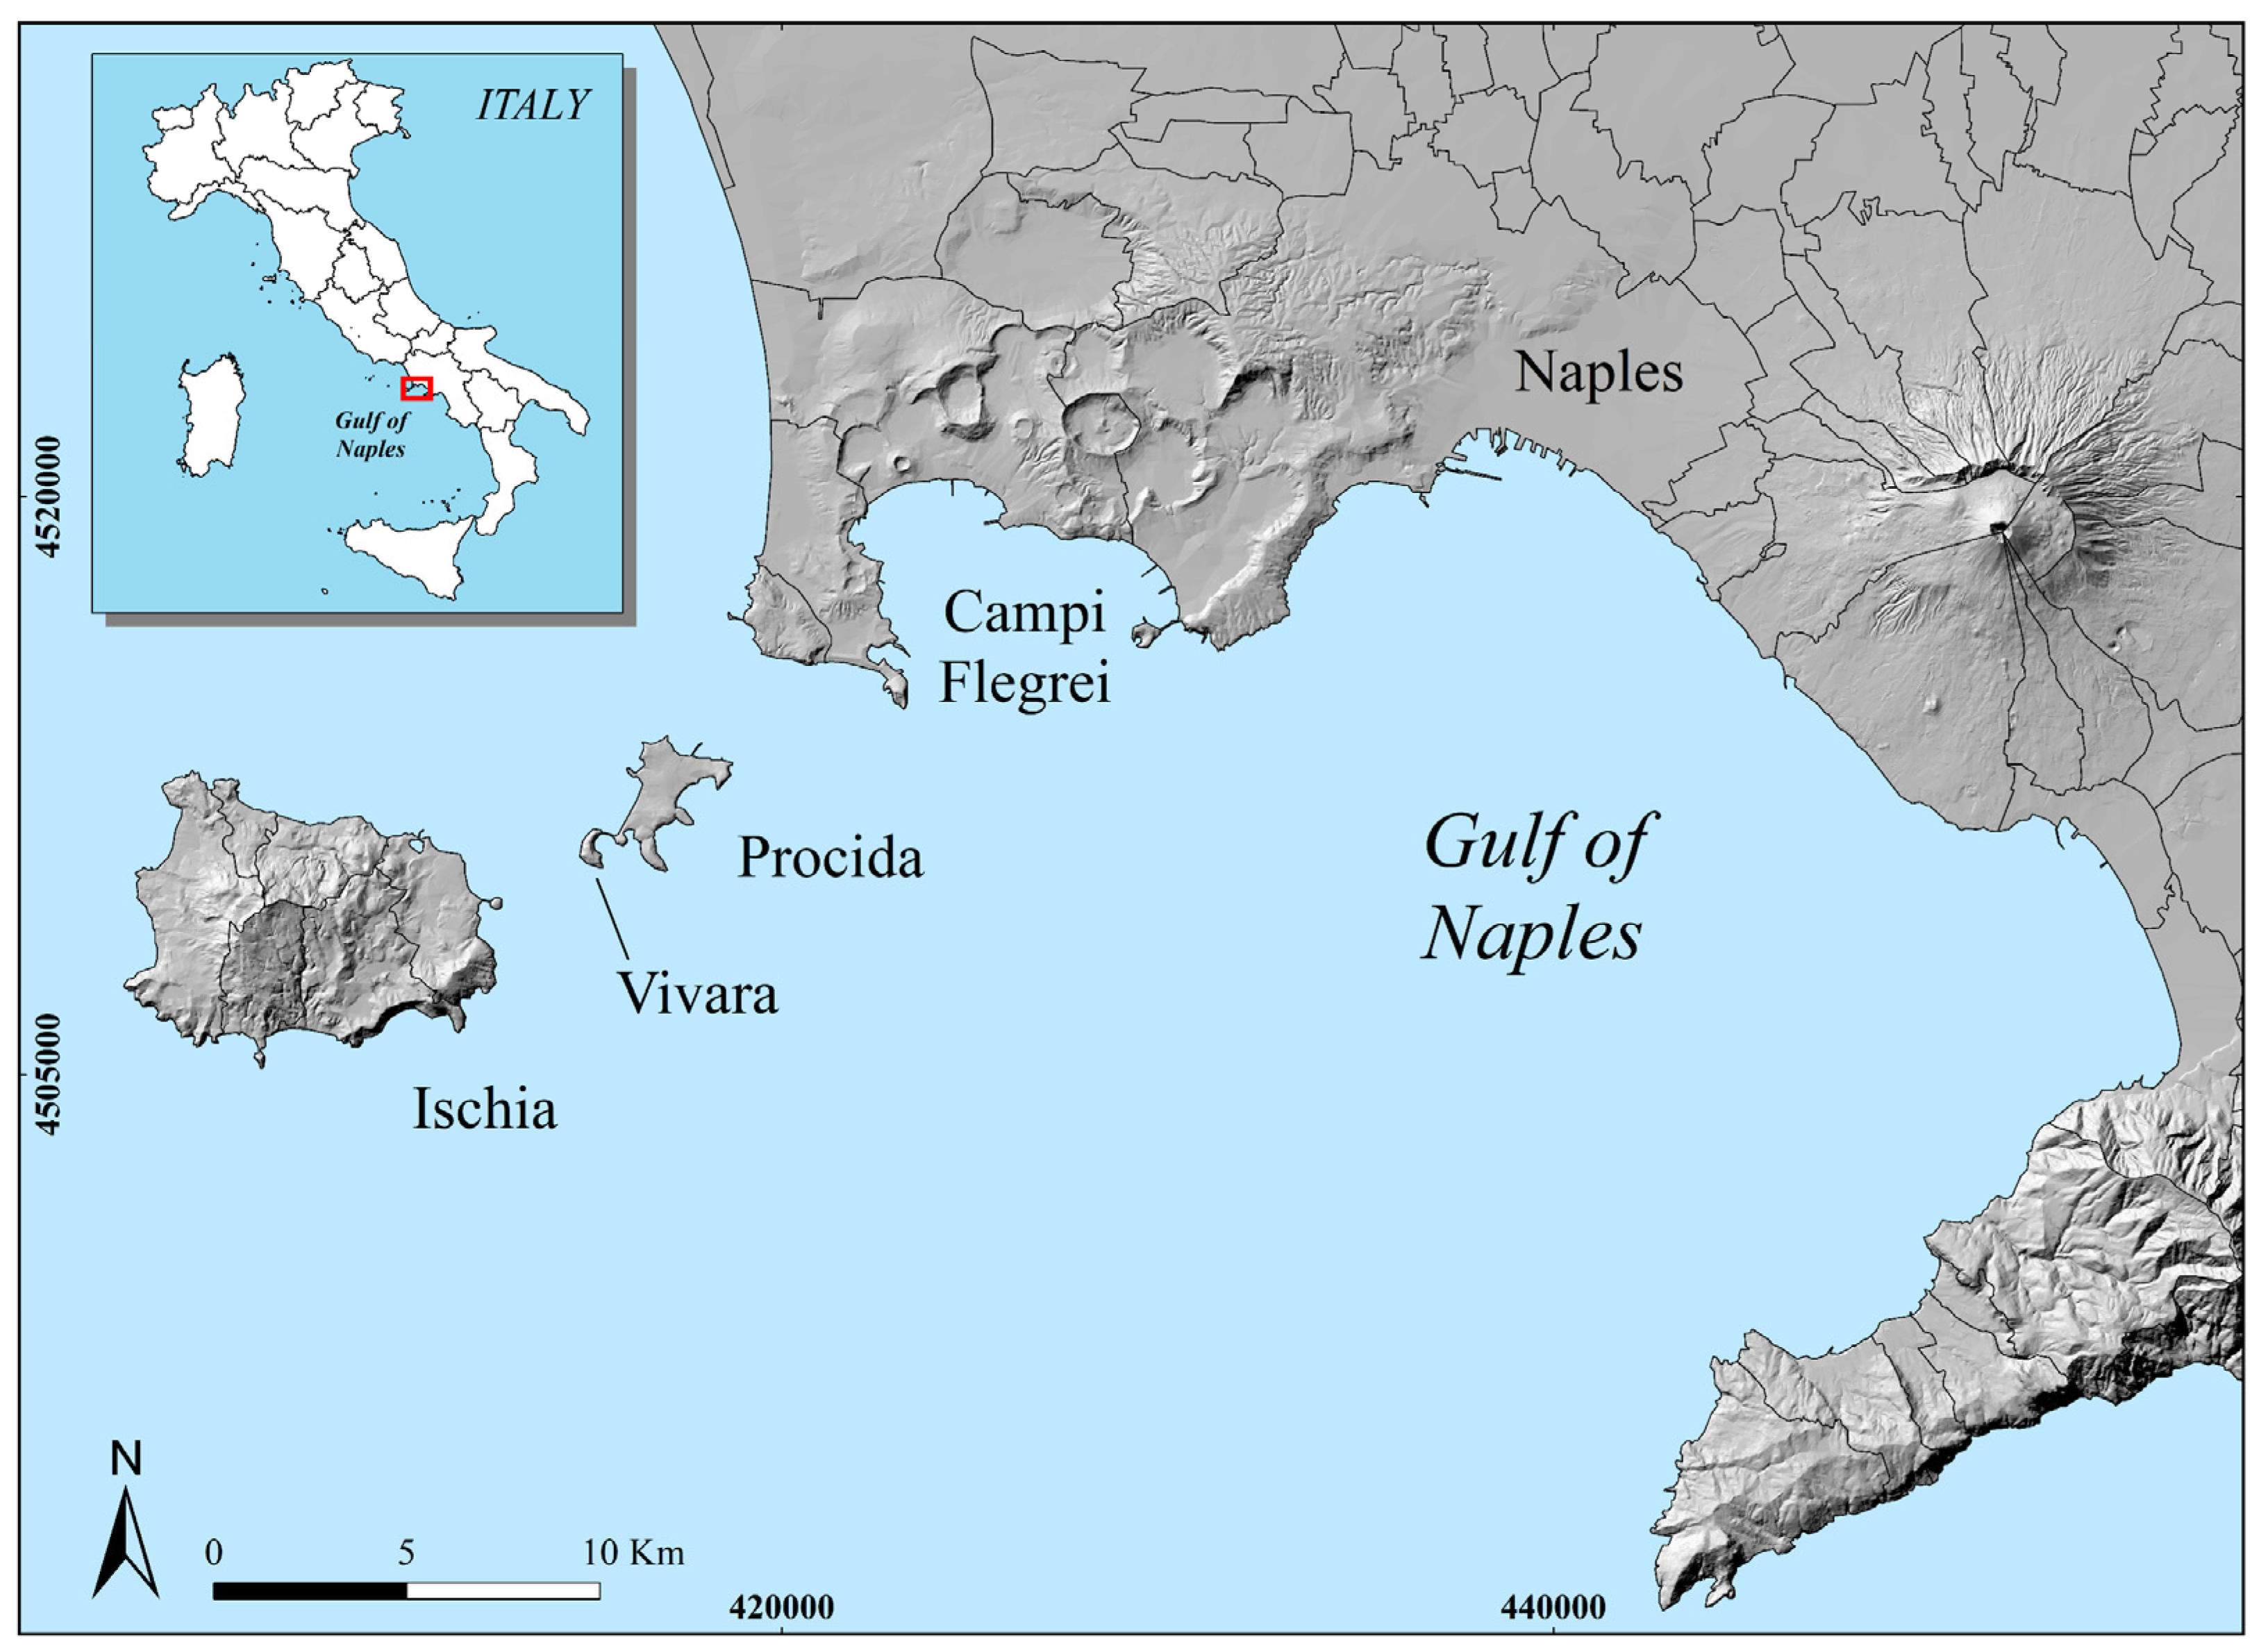
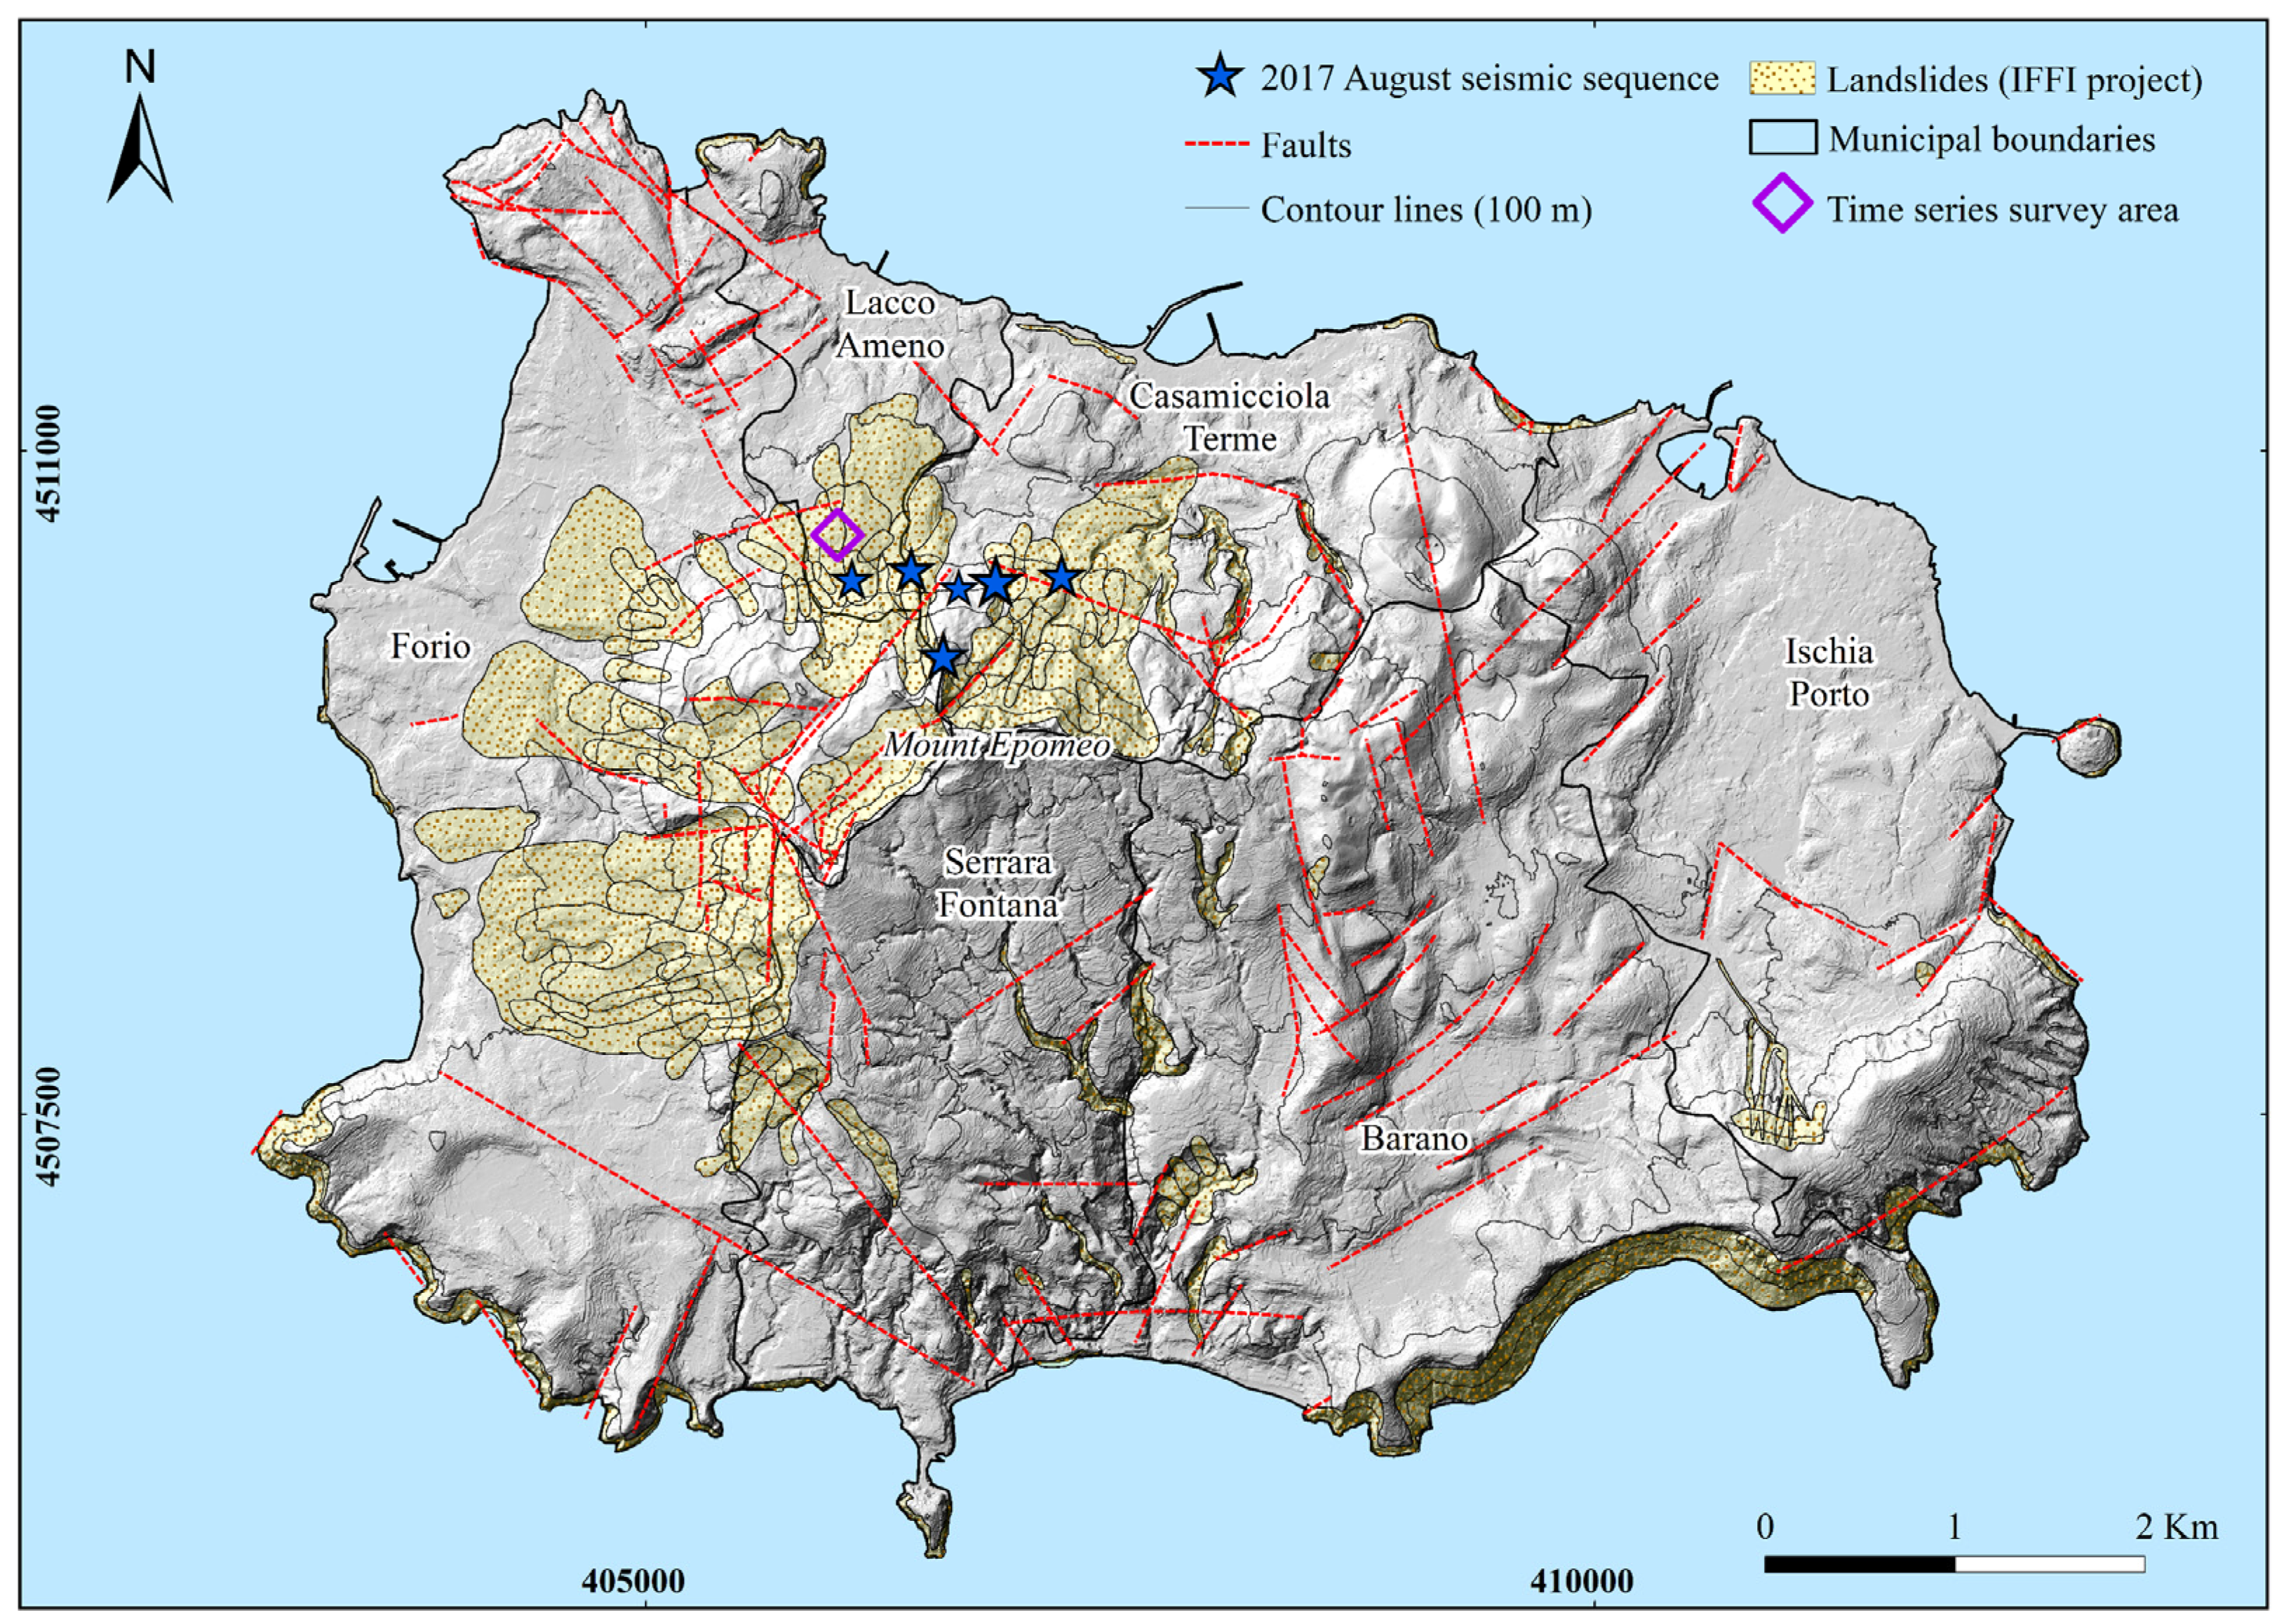
2. Geo-Volcanological Setting

Ischia is a volcanic island belonging to the Phlegraean Volcanic District (PVD), which comprises the Campi Flegrei caldera, Procida and Vivara islands (Figure 1). PVD is the most widespread active volcanic system of the Mediterranean area, established inside the Campanian Plain half-graben following the opening of the Tyrrhenian Sea [11] started in the late Miocene (9–10 Ma) [12]. The volcanism of Ischia is related to the extensional tectonics that caused the eastward and anticlockwise migration of the Italian peninsula, with the consequent activation of NW–SE and NE–SW normal faults systems, which permitted magmas to reach the surface, feeding volcanism. The island is mainly composed by alkali-trachytic volcanic rocks [13], landslide deposits and sedimentary terrigenous rocks that testify its complex history, characterized by the occurrence of volcanic, tectonic and slope instability phases [1]. The eruptive activity of Ischia lasted from the Late Pleistocene up to historical times [13] and the oldest evidences were dated back to about 150 ka, whereas the most recent outcrops were created by the 1302 eruption (Arso lava flow) [14].
The central part of the island is dominated by Mt. Epomeo, a volcano-tectonic horst (787 m a.s.l.) whose origin is due to the resurgence of the caldera formed after the large explosive eruption (55 ka BP), which emplaced Mt. Epomeo’s Green Tuff [14]. The resurgent block, tilted southward and split in smaller portions, is bordered by a system of faults and fractures trending mostly NW–SE, NE–SW and N–S.
Currently, the island morphology is mainly driven by slopes instability affecting Mt. Epomeo’s flanks. Along such slopes, the mobilization of volcanic and sedimentary material can generate landslides phenomena that, according to recent studies [1], have been grouped in two categories: (i) large rock and debris landslides and (ii) impulsive shallow landslides. The numerous historical landslides that occurred in the densely populated island (more than 60,000 inhabitants spread over less than 50 km2) have been recorded and organized in the Inventario dei Fenomeni Franosi in Italia (IFFI) catalogue (Figure 2). These phenomena generally occur following extreme meteorological events, eruptions or earthquakes, as it happened during the last seismic sequence at the end of August 2017. Indeed, many coseismic effects were detected in conjunction with this event along Mt. Epomeo’s flanks, including rockfalls and debris flows in volcanoclastic deposits [8].
Therefore, the detailed study of Ischia’s ground deformations, paying attention to Mt. Epomeo’s slopes instability, is considered crucial to understand the complex dynamic of the island, often influenced by seismic events.

3. Datasets and Methods

The numerous synthetic aperture radar (SAR)-dedicated space missions since the launch of ERS-1, have provided a huge amount of data available for interferometric processing. In detail, using a multitemporal series of SAR images acquired from slightly different satellite positions and in distinct time instants, it is possible to apply differential interferometry techniques (DInSAR). The use of a great number of data allows us to obtain parameters not measurable with a single interferogram, granting the description of the temporal evolution of the deformations [15].
The two main algorithms used in the multitemporal DInSAR techniques are known as persistent scatterers [16] and small baseline subset (SBAS) [17]. The first one is based on the identification and displacement measurements of point targets, objects characterized by high temporal stability of the backscattered signal and by a well-defined geometry like corner reflectors, buildings and stable rocks. Therefore, these points are known as the persistent scatterers. Instead, the second algorithm performs the analysis on natural distributed targets and not very geometrically defined objects, allowing the maximum spatial coverage of the outputs within the study area [18]. Detailed information on the SBAS algorithm was provided in [17,19].
The SBAS approach has been adopted here to process several datasets spanning a frame of 17 years from the end of 2002 to the end of 2019 quite continuously. The datasets comprise stacks of Envisat (11/2002–08/2010), COSMO-SkyMed (02/2011–08/2017) and Sentinel-1A (01/2015–12/2019) data, covering the entire area of Ischia Island. With the aim to obtain correct ground deformations, the 30 m Shuttle Radar Topography Mission (SRTM) digital elevation model (DEM) has been used to remove the topography contribution from the generated interferograms. All the available data have been processed with SARscape software (ENVI platform). The ascending and descending tracks of both Envisat and Sentinel-1 datasets were processed in order to evaluate either the measurement along the satellite’s line of sight (LOS) and the vertical and the horizontal (east–west) components of the displacement. Moreover, the obtained displacement time series allowed us to identify areas affected by ground movements and to measure their relative velocities.
The average velocities resulting from the SAR processing have been validated through the comparison with the displacement rates of the global positioning system (GPS) measurements, acquired in correspondence with the INGV monitoring geodetic network [20,21].
Table 1 summarizes the main characteristics of the processed data: name of the satellite mission, acquisition geometry, track of the satellite, number of images used during each processing, number of interferograms evaluated as reliable for the generation of the outputs, time interval considered in each processing, ground resolution and angle of incidence at the scene centre.

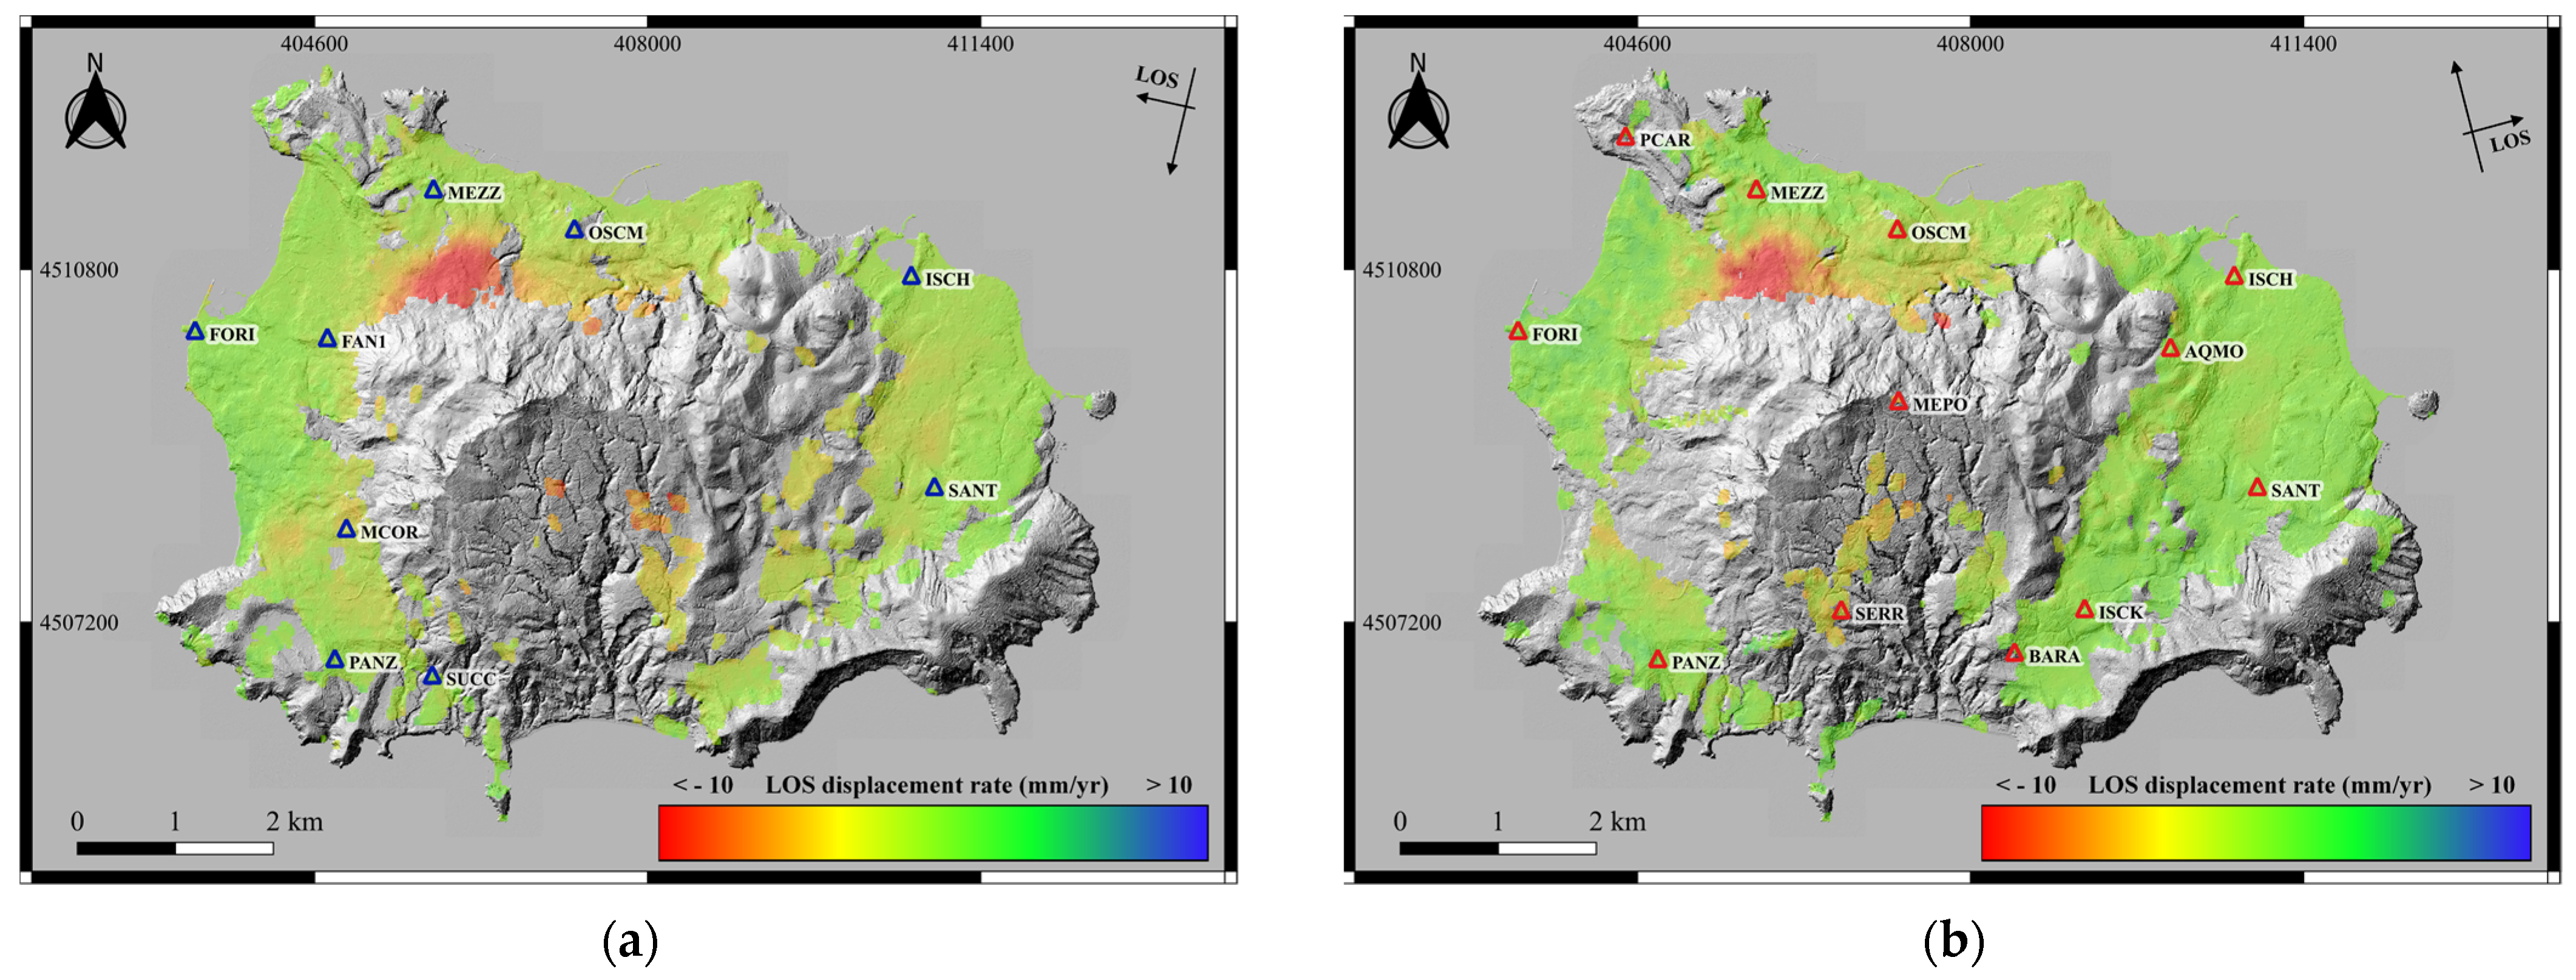
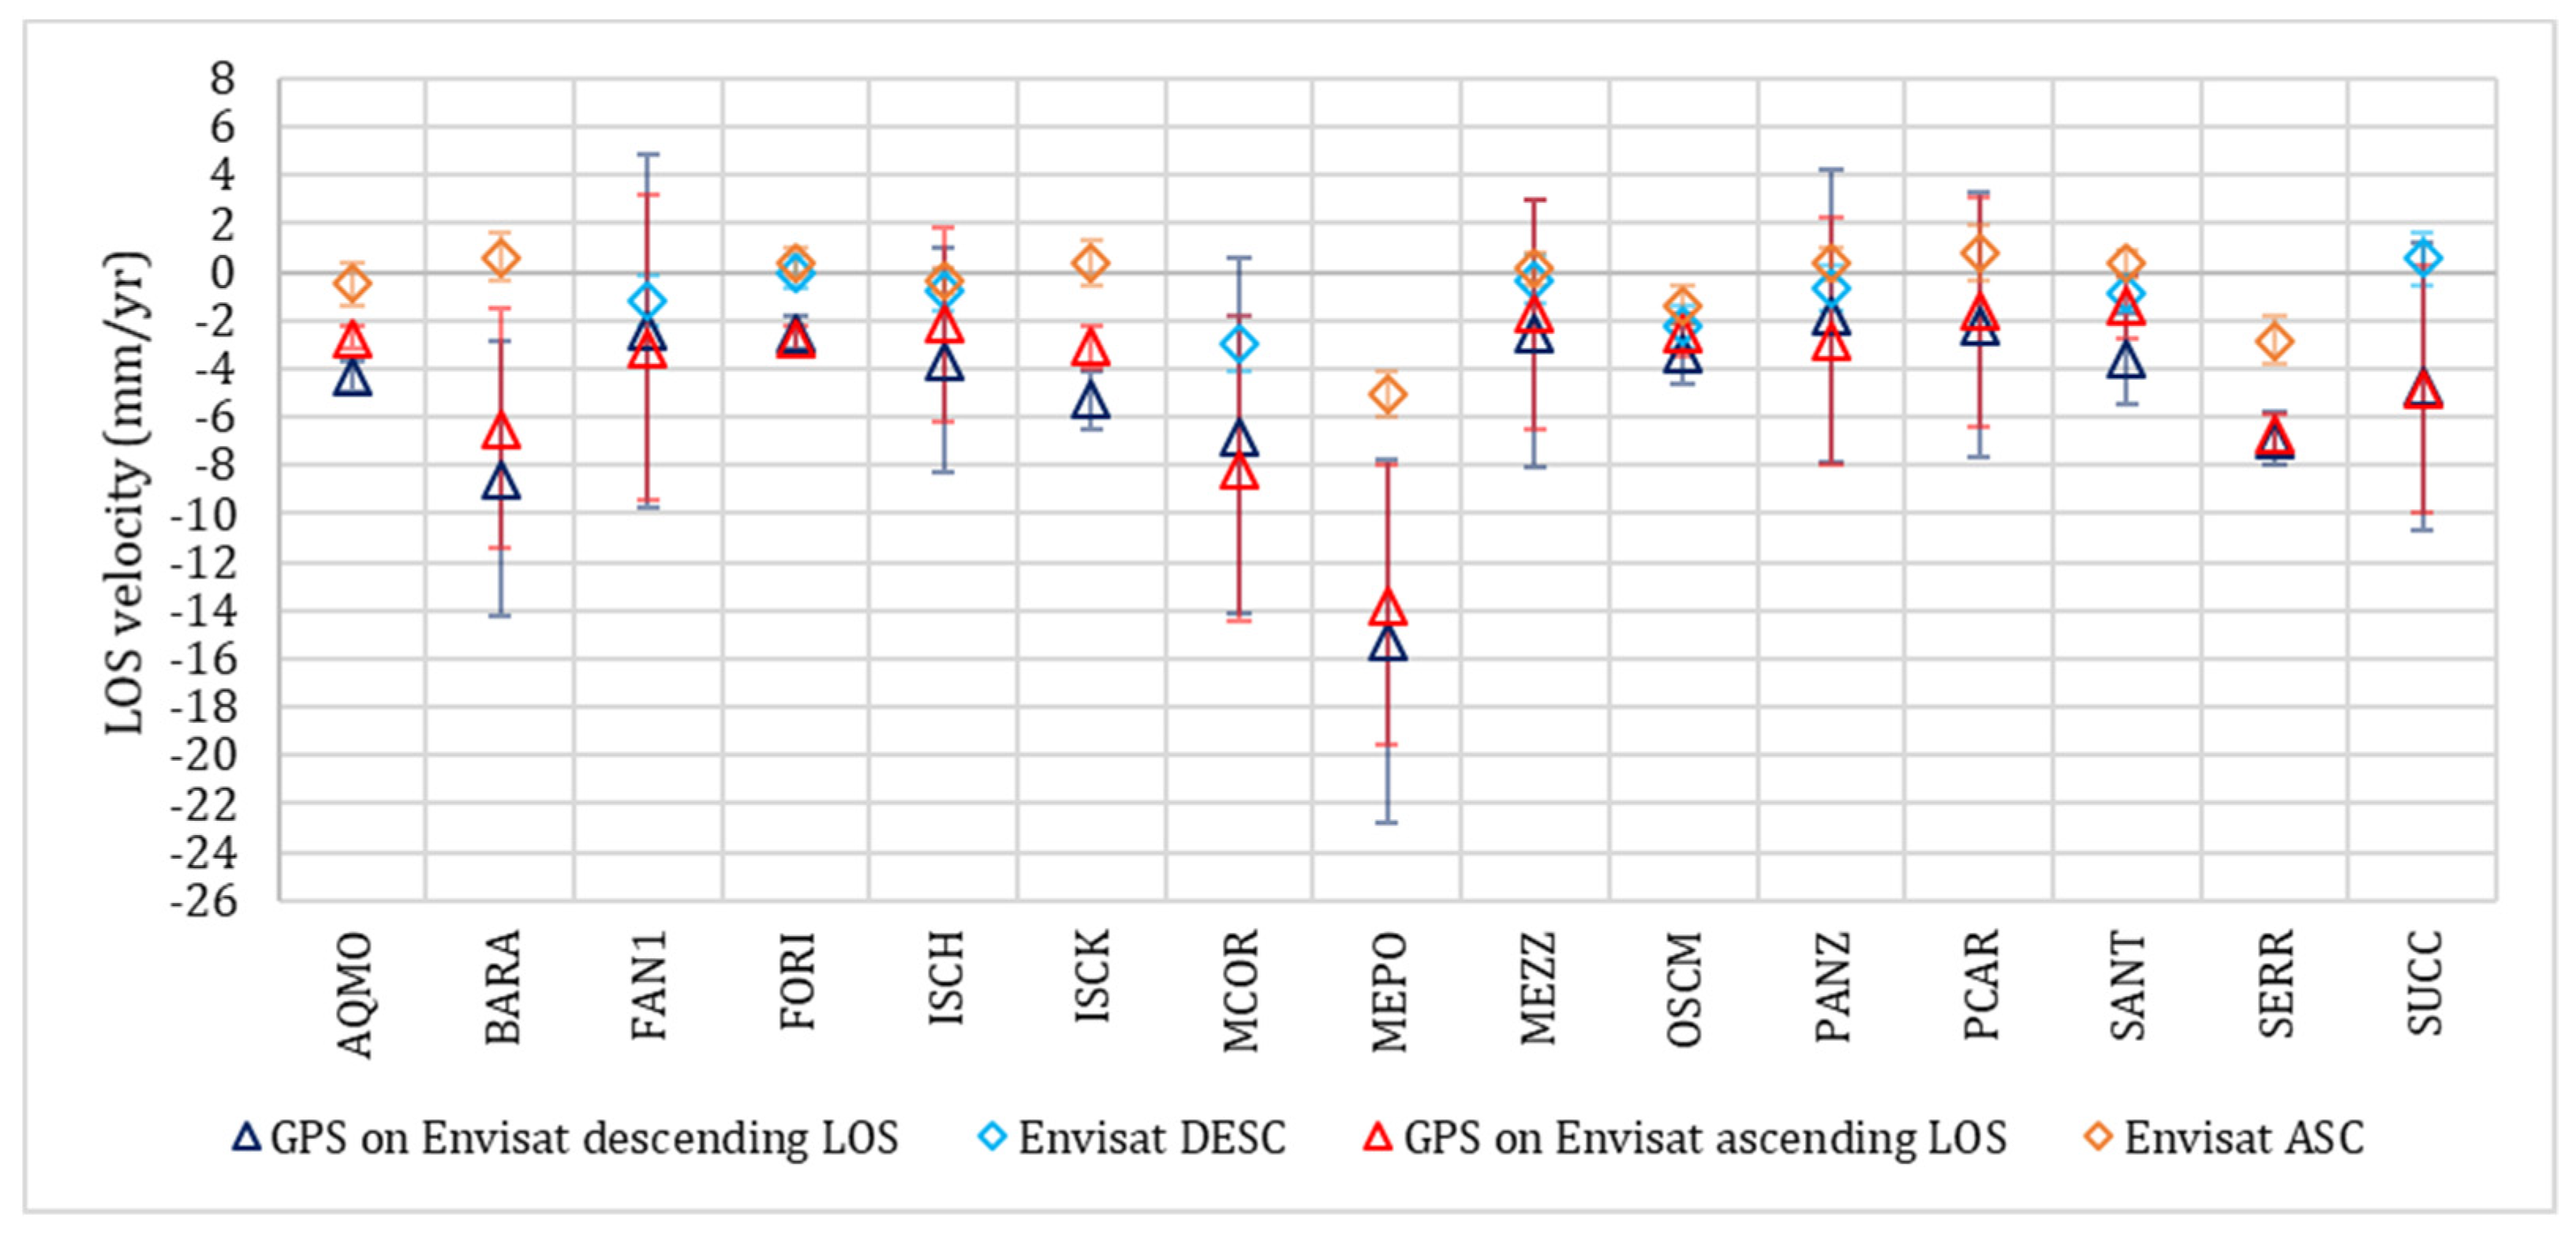
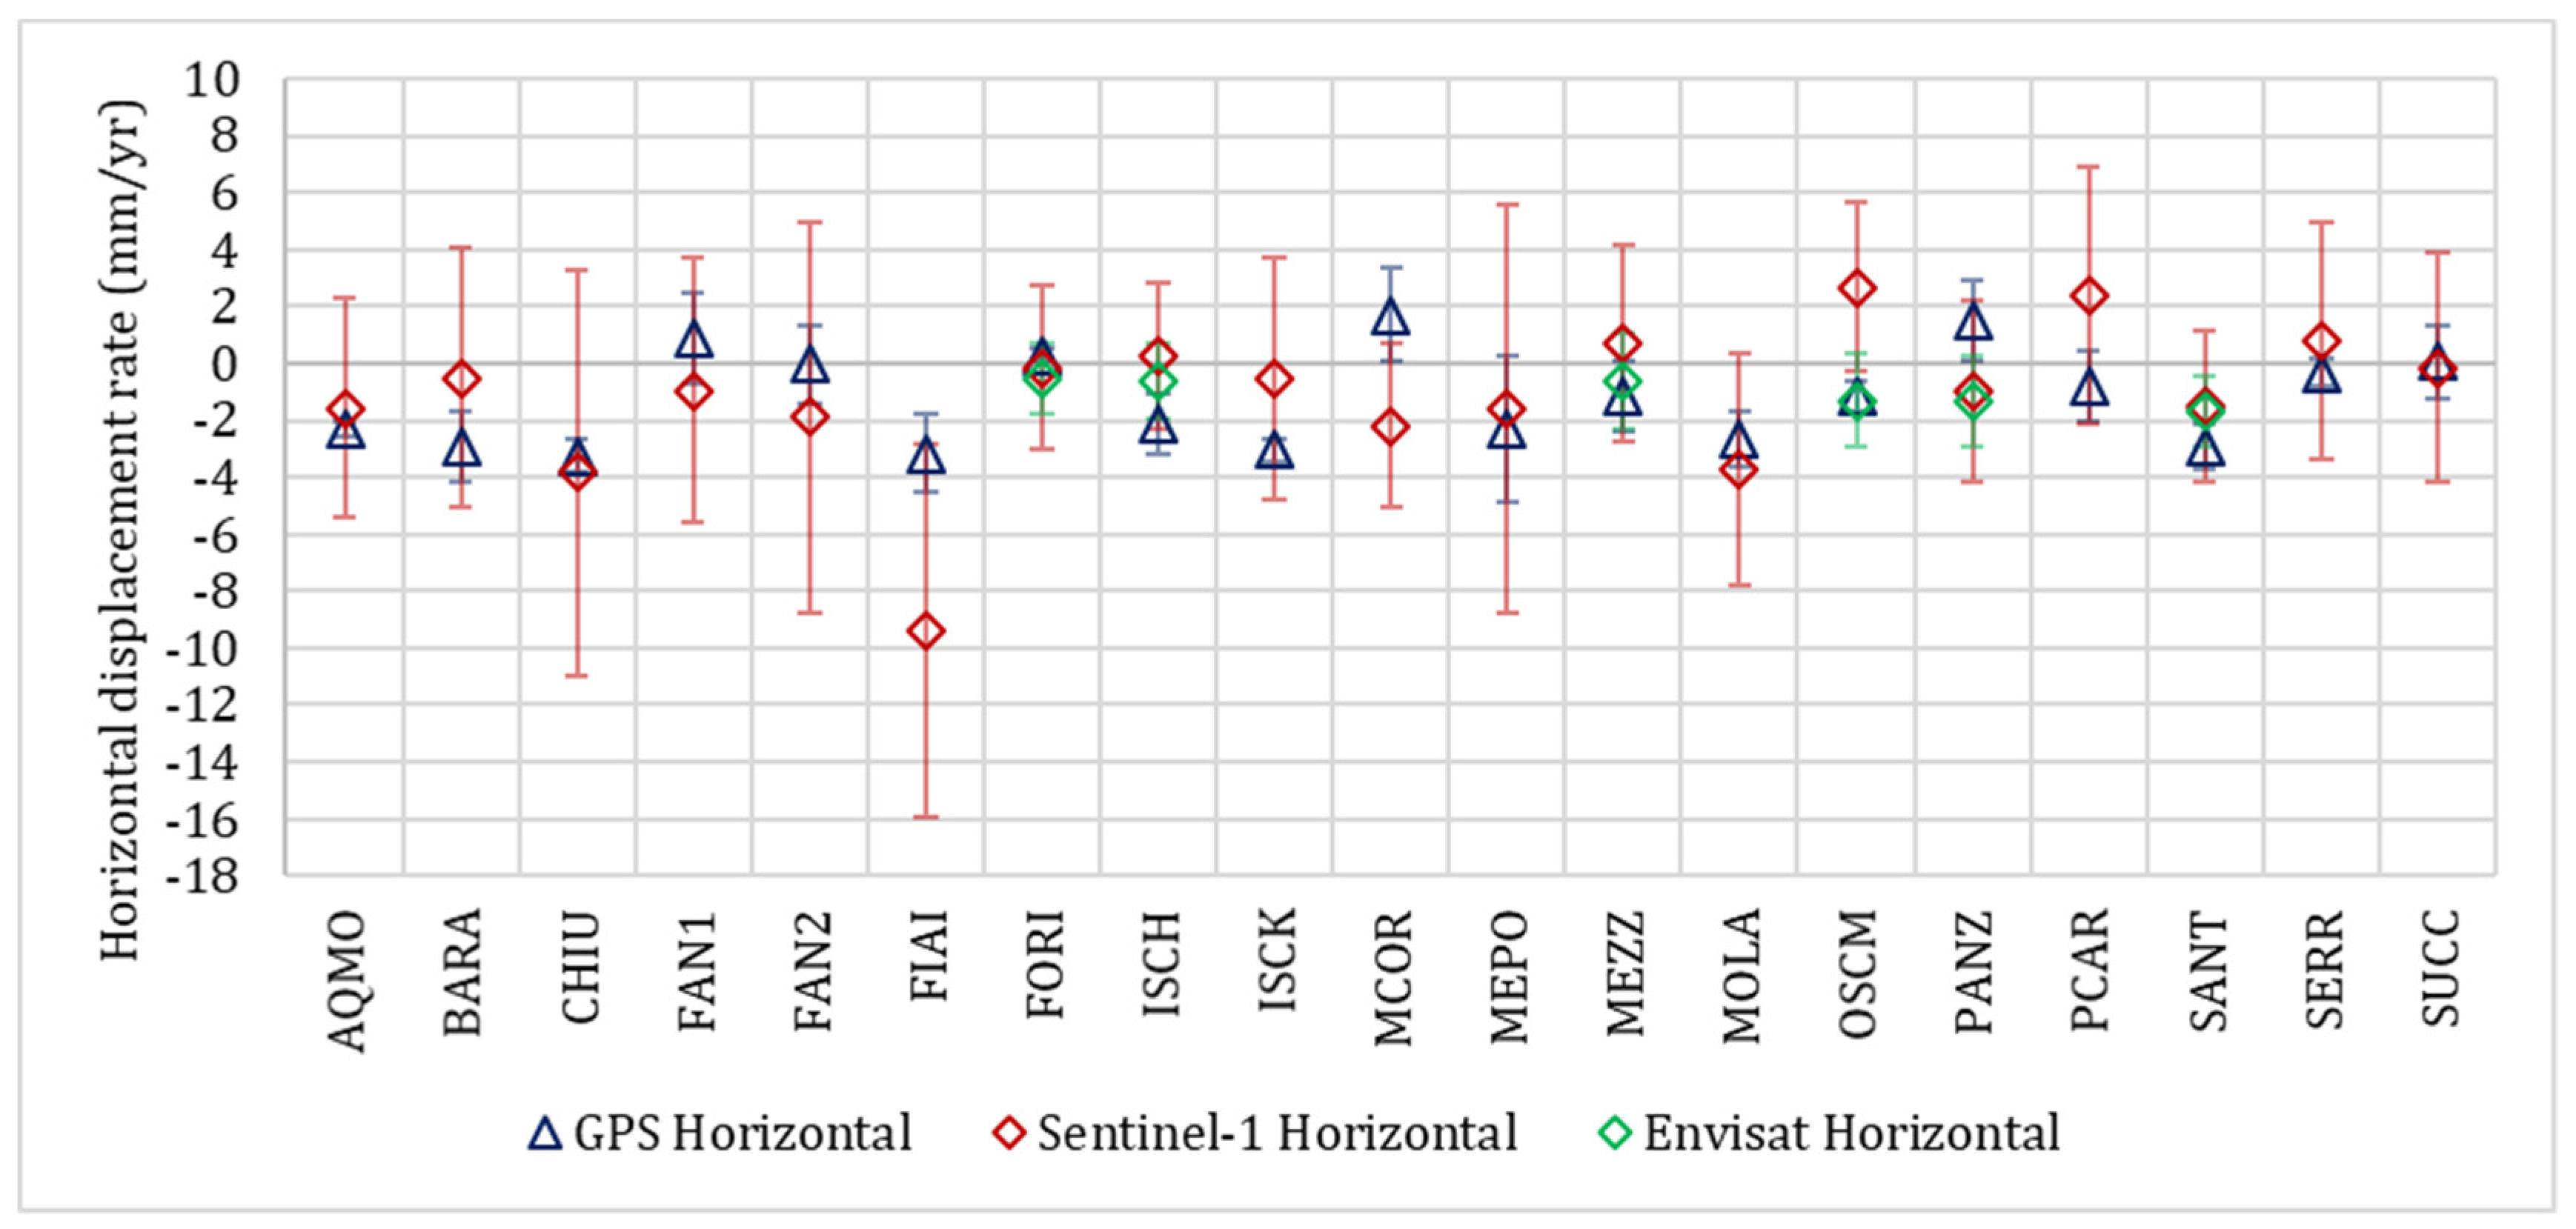
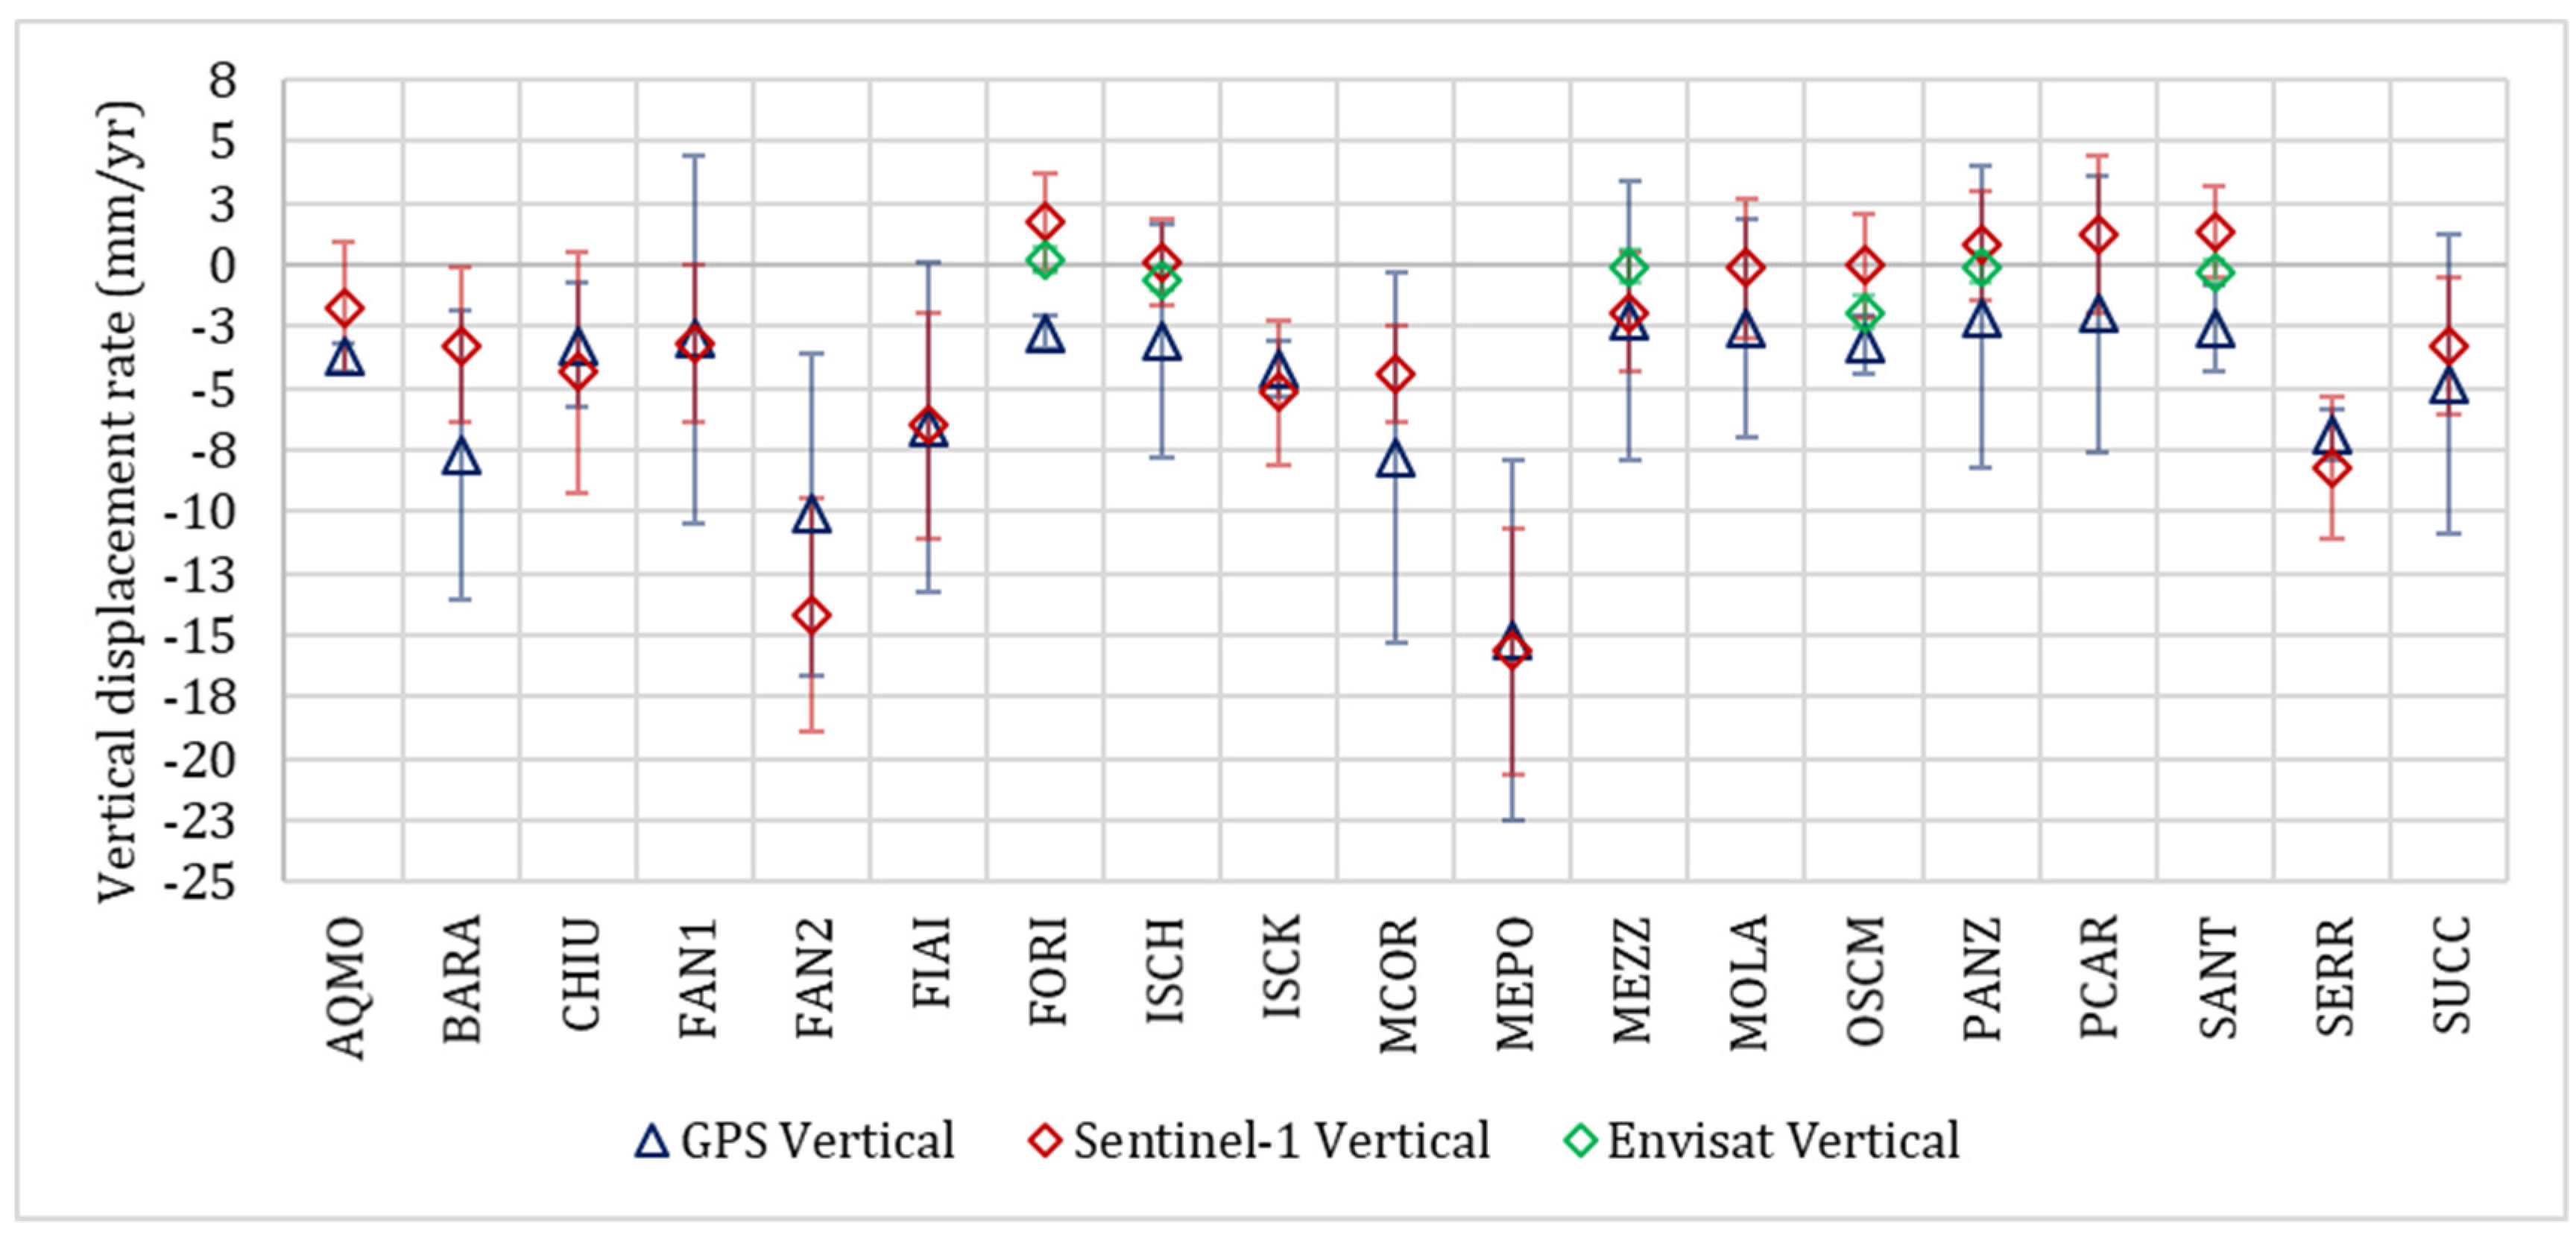
4. Results and GPS Comparisons

The results and the comparative graphs are shown in Figure 3, Figure 4, Figure 5, Figure 6 and Figure 7. In particular, the ground displacement maps, results of the InSAR data processing, are shown in Figure 3, Figure 5a and Figure 6 where the ground displacement rate is in millimetres per year (mm/yr). In detail, the negative LOS velocities indicate ground movements away from the satellite sensor, while positive LOS velocities imply ground movements approaching the satellite sensor. All the displacement maps display the highest negative LOS velocities in: (i) the northwestern sector of the island, (ii) along the north side of Mt. Epomeo and (iii) in the area south of the Lacco Ameno and Casamicciola Terme municipalities. It is evident that the displacement maps obtained by Sentinel-1A (Figure 6) allow the greatest areal coverage. These results also detect significant movements near the southern slope of Mt. Epomeo.
In order to validate such results, the availability of 20 geodetic stations already existing in the island was exploited. The comparisons were made between the average displacement rates derived by using the SBAS technique and those obtained from the GPS measurements reprojected along the relative satellite LOS. This reprojection was based on the incidence line of sight (ILOS) and azimuth line of sight (ALOS) angles. In addition, the error associated with the GPS measurements was appropriately reprojected along the satellite LOS. In order to calculate the interferometric results errors (σInSAR), which are derived from parameters such as coherence and wavelength, the following formula (1), where γ is the interferometric coherence and λ is the wavelength, was used [22,23]:
σ InSAR   = 1 -   γ 2 2 γ 2 λ 4 π ,  
The comparisons are shown in the comparative graphs in Figure 4, Figure 5b, and Figure 7 for Envisat, COSMO-SkyMed and Sentinel-1A, respectively. The accuracies derived from reprojected GPS displacement rates and those derived from the SAR data processing were compared by calculating the root mean square error (RMSE). In detail, the accuracy was calculated as the mean square discrepancy between the values of the GPS data and those measured in the SAR data processing at each measurement station (Table 2).
The availability of both descending and ascending acquisition geometries for Envisat and Sentinel-1A datasets allowed the calculation of the horizontal (east–west) and vertical components of the displacement [24].
The maps of the vertical displacement rate show negative values if the ground motion is downward, while positive values if surface uplift occurs. The maps of the displacement rate in the horizontal direction display negative values if the motion is oriented to the west, while positive values if the movement is oriented towards the east.
Figure 8 shows both the horizontal (Figure 8a,c) and vertical (Figure 8b,d) displacement maps generated for the Envisat (Figure 8a,b) and Sentinel-1A (Figure 8c,d) datasets. Figures depicting the movement in the east–west direction highlight the lack of appreciable horizontal effects, while those showing the vertical displacements reveal a quite localized deformation effect in the northwestern sector, corresponding mainly to the Fango zone and the hilly area of Casamicciola Terme, and a more widespread one throughout the southern slope of Mt. Epomeo.
These results were also validated by comparing the horizontal (Figure 9) and vertical (Figure 10) displacement rates with those obtained directly from GPS measurements acquired at each geodetic station. As performed for LOS comparisons, the accuracy was quantified through the root mean square error calculation. Table 3 summarizes the RMSE retrieved for each comparison.

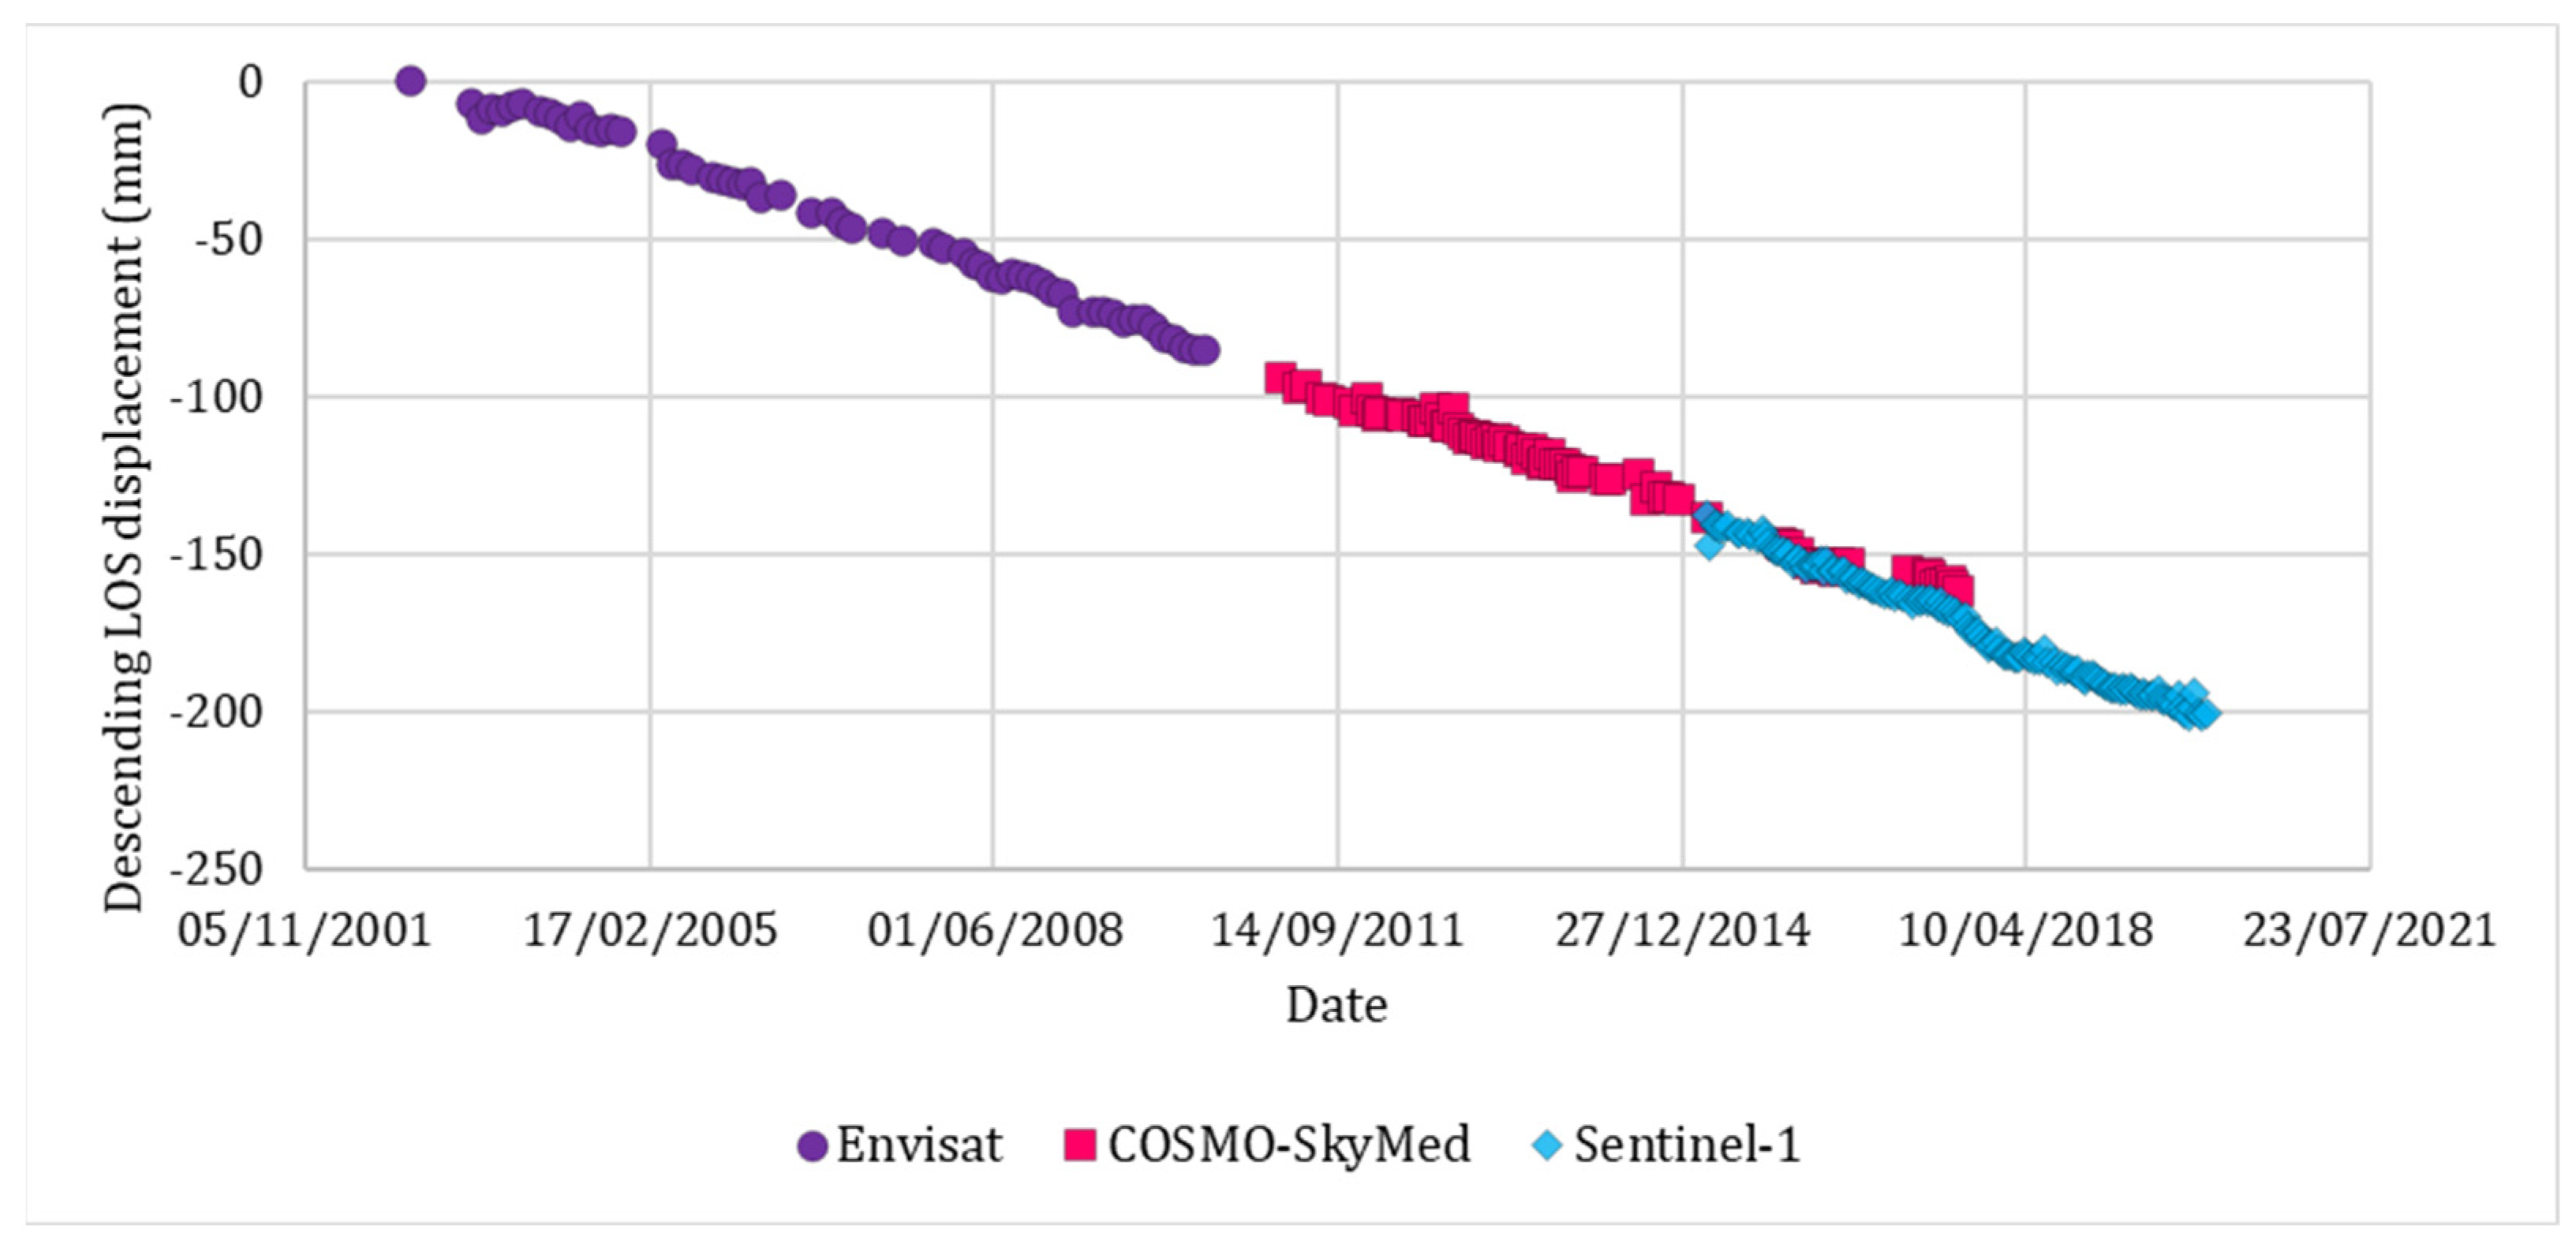
5. Time Series Analysis

The processing of SAR data also provided the opportunity to generate the displacement time series relating to critical areas in order to follow the evolution of slope movements over time. In detail, the time series were generated on the area of maximum deformation identified by the totality of the elaborations, i.e., the area located on the northwestern side of Mt. Epomeo, south of the Lacco Ameno municipality (Figure 2 and Figure 11).
In order to combine the displacements obtained by the three different datasets (Envisat, COSMO-SkyMed and Sentinel-1A), along their respective descending orbits, it was necessary to reproject the displacements according to the same incidence angle. For this aim, the incidence angle of the Sentinel-1 sensor (35.9°) was taken as a reference. The displacements measured along the descending LOS of the Envisat sensor were then divided by the cosine of the difference between the Sentinel-1 and the Envisat (23.6°) incidence angles. The same procedure was applied considering the COSMO-SkyMed descending displacements and the relative angle of incidence (27.4°). Moreover, the cumulative displacements over the entire period were obtained by estimating an average velocity in the absence of temporal coverage data.
In Figure 12, the complete time series, including all the descending datasets available for a time interval of 17 years are shown, whereas in Figure 13a the vertical displacement time series generated for the Envisat and Sentinel-1 datasets are plotted. The plot in Figure 12 shows an almost constant negative displacement rate, measured along the descending LOS of all the datasets, as is also the case in Figure 13a. The only appreciable acceleration in both plots is identified in the time corresponding to the Mw 3.9 earthquake on 21 August 2017. This event is neatly recognized in the time series generated for vertical displacements and is shown in detail in Figure 13b.

6. Discussion

All the displacement maps presented in this study and generated by processing different SAR data (Envisat, COSMO-SkyMed and Sentinel-1) allowed us to define the maximum deformation area within Ischia Island. In particular, LOS, horizontal and vertical ground displacement maps referring to the period November 2002-December 2019, identified the highest deformations localized in the northwestern slope of Mt. Epomeo. The central portion of this area, investigated through the time series analysis, was localized in the Lacco Ameno municipality, at a distance of about 1 km west from the epicentre of the Mw 3.9 earthquake that occurred on 21 August 2017, approximately at the western edge of the fault plane modelled in previous studies [9]. This zone and the Casamicciola Terme hilly area were the most damaged sectors of the island by this seismic event [25], whereas in the Fango locality many ruptures were observed immediately after the earthquake [8]. Moreover, considering the recent assessment of the epicentral environmental seismic intensity (ESI) [26] based on the distribution of the primary (surface ruptures and permanent displacement caused directly by the seismogenic source), secondary coseismic geological data (landslides, hydrological variations) and collapse of drywall [5], the area where the SBAS analysis individuated the highest displacements corresponded to the zone with the maximum degree of intensity (VII ESI 2007 scale). Furthermore, the displacement maps obtained by the Sentinel-1 data processing, with unprecedented multitemporal coverage, highlighted significant movements also along the western and southern slopes of Mt. Epomeo. In fact, these sides are characterized by different geolithological compositions than that of the eastern flank of the Ischia Island, which is instead composed by volcanics younger than 10 ka [7] and where the lack of remote sensing deformation signals is recognized. Precisely, in the western side of Mt. Epomeo, corresponding to the observed slopes instability phenomena, low-strength volcanoclastic deposits occur along the Donna Rachele fumaroles area. In this zone, CO2 and H2S gases rise through the NW–SE normal faults bordering the western side of Mt. Epomeo (Figure 2), these fractures connect highly fractured deep lavas (hosting the hydrothermal aquifer) with the surface [27]. The resulting circulation alters the shallower impermeable pyroclastic cover (Green Tuff and Citara Tuff) [27] weakening its mechanical properties [28,29,30]. Therefore, the displacements recorded by the Sentinel-1A sensor are presumably attributed to the volcanic system of the island, which is still active [10] and currently characterized by the emission of volcanic gas mainly in the western slope of Mt. Epomeo, corresponding to the fumarolic belt of Donna Rachele. Additionally, the observed deformations along the southern slope of Mt. Epomeo are most likely related to the complex relation between the tectonics and the morphology. In fact, by this side, the central resurgent block is marked by a double monocline fold facing toward south–southwest, which is interrupted by depressions, partially filled with debris avalanche, debris flow and volcanoclastic deposits, subsequently cut by deep canyons [31]. In particular, the volcanoclastic sequence of the southern slope of Mt. Epomeo comprises debris avalanche, debris flow and rockslide deposits interlayered with alluvial and shoreline sediments, extending from Mt. Epomeo’s summit to the southern coast [31], according with the distribution of the displacements recorded by the Sentinel-1A sensor at the highly irregular and unstable southern flank of the resurgent block.
Combining the average velocities measured along the ascending and descending LOS of the Sentinel-1 and Envisat sensors it was possible to retrieve the vertical and horizontal displacement rates. In the northwestern slope of Mt. Epomeo, the maximum vertical displacement retrieved considering an almost continuous time interval of 17 years was 218 mm and the associated subsidence rate ranged from 10 to 20 mm/yr. These values are consistent with previous works, confirming the deflation trend of the area. In fact, these rates are in agreement with the SBAS results of C-band ERS-1/2 and Envisat data spanning the 1992–2010 time interval [32]. In addition, the high values of vertical downward deformation found in the northern and southern flanks of Mt. Epomeo are relative to two distinct areas characterized by an evident subsidence individuated by levelling surveys carried out between 1990 and 2003 [33] and high-precision levelling survey realized following the earthquake on November 2017 [34]. Such subsidence was explained through crack closure processes along two main ENE-WSW and E-W pre-existing faults, which represent the preferred degassing pathway of the hydrothermal system beneath Mt. Epomeo [1].
The totality of the results deriving from the SAR data processing were also compared with the ground measurements obtained by the global navigation satellite system (GNSS) stations located on the island. Taking into account the precision associated with each measurement, the comparisons between GPS and SAR data proved that our results were accurate. Indeed, the maximum derived RMSE for the comparisons between GPS and horizontal and vertical derived displacement rates was 2.7 mm/yr.
Finally, the analyses made on the displacement time series allowed us to evaluate the surface ground displacements over time in the maximum deformation zone detected through SBAS processing. The time series, representing the vertical evolution of the displacement, emphasize that the subsidence rate in the area of interest is constantly progressing with average values of 0.03 mm/day. Additionally, it is noted that the only significant acceleration begins immediately after the 21 August 2017 mainshock, speeding up the subsidence rate to 0.12 mm/day for 6 months. After about 180 days from the seismic event, in February 2018, the subsidence rate returned to pre-earthquake levels. This suggests that seismicity and related effects occurring on the island accelerate the subsidence rate specifically in the northern slope of Mt. Epomeo, according to recent findings [7,35], but also that the subsidence process of the resurgent block is in continuous progression, supporting the latest studies that attribute the subsidence phenomenon to the degassing of the magma body located at a depth of 2 km [36].

7. Conclusions

In this paper displacements on Ischia volcanic island ground surface were investigated over a continuous time interval of almost two decades, from November 2002 to December 2019. In particular, the SBAS multitemporal differential interferometry technique was applied to several SAR datasets with different temporal and spatial resolutions (X-band COSMO-SkyMed, C-band Envisat and Sentinel-1 data). Ground displacement maps, characterized by a wide land coverage, allowed us to identify the area on the island most affected by deformation, corresponding to the northwestern sector of Mt. Epomeo. In that zone, a detailed analysis of the ground displacements was performed and for the first time the effects over time caused by the 2017 seismic swarm were individuated. In particular, the ground deformation, following the mainshock, was accelerated by a subsidence rate of 0.12 mm/day that returned to pre-earthquake levels (0.03 mm/day) after 6 months from the event.
This study represents a first step toward an interdisciplinary approach [37] joining remote sensing elaborations, geolithological features and morphometric analyses aimed at the determination of predisposing features that help drive paroxysmal phenomena and identifying the prone areas where they could occur (e.g., landslides).
Finally, the peculiar tectonic, stratigraphic and hydrothermal conditions of the localized area along the northwestern, western and southern Mt. Epomeo’s flanks, together with the determination of the mechanical properties of the outcropping materials, probably at the base of observed slope instability, could be the object of further on-field geophysical investigations, providing very useful information for the prevention and mitigation of such phenomena, recognized as the most frequent natural hazards on Ischia Island.

Author Contributions

Conceptualization, L.B., C.T. and C.S.; methodology, L.B. and C.T.; software, L.B. and C.T.; validation, V.S. and L.B.; writing—original draft preparation, L.B.; writing—review and editing, C.T., C.S., M.B., R.G., L.C., V.S. and R.D.R.; visualization, L.B. and R.G.; supervision, C.S.; project administration, C.S. All authors have read and agreed to the published version of the manuscript.

Funding

The present work is supported by the FRASI—Integrated and multi-scale approach for the definition of seismic-induced landslide hazard in the Italian territory—research project, funded by the MATTM. Copernicus Sentinel-1 data are freely distributed by the European Space Agency and available at the Copernicus Open Access Hub. The Envisat data are provided free of charge by the European Space Agency. The COSMO-SkyMed data was obtained by the Italian Space Agency through the project id.213. Project carried out using CSK® products, © ASI (Italian Space Agency), delivered under an ASI license to use.

Data Availability Statement

The data presented in this study are available on request from the corresponding author.

Acknowledgments

We are very grateful to Alessandro Galvani for providing us the GNSS data.

Conflicts of Interest

The authors declare no conflict of interest. The funders had no role in the design of the study; in the collection, analyses, or interpretation of data; in the writing of the manuscript, or in the decision to publish the results.

References

  1. Selva, J.; Acocella, V.; Bisson, M.; Caliro, S.; Costa, A.; Della Seta, M.; De Martino, P.; de Vita, S.; Federico, C.; Giordano, G.; et al. Multiple natural hazards at volcanic islands: A review for the Ischia volcano (Italy). J. Appl. Volcanol. 2019, 8, 5. [Google Scholar] [CrossRef]
  2. Violante, C.; Budillon, F.; Esposito, E.; Porfido, S.; Vittori, E. Submerged hummocky topographies and relations with landslides on the northwestern flank of Ischia Island, Southern Italy. In Proceedings of the International Workshop on Occurrence and Mechanisms of Flow-Like Landslides in Natural Slopes and Earthfills, Sorrento, Italy, 14–16 May 2003. [Google Scholar]
  3. Orsi, G.; Gallo, G.; Zanchi, A. Simple-shearing block resurgence in caldera depressions. A model from Pantelleria and Ischia. J. Volcanol. Geotherm. Res. 1991, 47, 1–11. [Google Scholar] [CrossRef]
  4. Acocella, V.; Funiciello, R. The interaction between regional and local tectonics during resurgent doming: The case of the island of Ischia, Italy. J. Volcanol. Geotherm. Res. 1999, 88, 109–123. [Google Scholar] [CrossRef]
  5. Nappi, R.; Porfido, S.; Paganini, E.; Vezzoli, L.; Ferrario, M.F.; Gaudiosi, G.; Alessio, G.; Michetti, A.M. The 2017, MD = 4.0, Casamicciola Earthquake: ESI-07 Scale Evaluation and Implications for the Source Model. Geosciences 2021, 11, 44. [Google Scholar] [CrossRef]
  6. Carlino, S.; Pino, N.A.; Tramelli, A.; De Novellis, V.; Convertito, V. A common source for the destructive earthquakes in the volcanic island of Ischia (Southern Italy): Insights from historical and recent seismicity. Nat. Hazards 2021, 108, 177–201. [Google Scholar] [CrossRef]
  7. Albano, M.; Saroli, M.; Montuori, A.; Bignami, C.; Tolomei, C.; Polcari, M.; Pezzo, G.; Moro, M.; Atzori, S.; Stramondo, S.; et al. The Relationship between InSAR Coseismic Deformation and Earthquake-Induced Landslides Associated with the 2017 Mw 3.9 Ischia (Italy) Earthquake. Geosciences 2018, 8, 303. [Google Scholar] [CrossRef] [Green Version]
  8. Nappi, R.; Alessio, G.; Gaudiosi, G.; Nave, R.; Marotta, E.; Siniscalchi, V.; Civico, R.; Pizzimenti, L.; Peluso, R.; Belviso, P.; et al. The 21 August 2017 Md 4.0 Casamicciola earthquake: First evidence of coseismic normal surface faulting at the Ischia Volcanic Island. Seismol. Res. Lett. 2018, 89, 1323–1334. [Google Scholar] [CrossRef]
  9. De Novellis, V.; Carlino, S.; Castaldo, R.; Tramelli, A.; De Luca, C.; Pino, N.A.; Pepe, S.; Convertito, V.; Zinno, I.; De Martino, O.; et al. The 21st August 2017 Ischia (Italy) earthquake source model inferred from seismological, GPS and DInSAR measurements. Geophys. Res. Lett. 2018, 45, 2193–2202. [Google Scholar] [CrossRef]
  10. de Vita, S.; Sansivero, F.; Orsi, G.; Marotta, E.; Piochi, M. Volcanological and structural evolution of the Ischia resurgent caldera (Italy) over the past 10 k.y. Geol. Soc. Am. 2010, 464, 193–241. [Google Scholar] [CrossRef]
  11. Sbrana, A.; Marianelli, P.; Pasquini, G. Volcanology of Ischia (Italy). J. Maps 2018, 14, 494–503. [Google Scholar] [CrossRef]
  12. Zitellini, N.; Ranero, C.R.; Loreto, M.F.; Ligi, M.; Pastore, M.; D’Oriano, F.; Sallares, V.; Grevemeyer, I.; Moeller, S.; Prada, M. Recent inversion of the Tyrrhenian Basin. Geology 2020, 48, 123–127. [Google Scholar] [CrossRef]
  13. Aiello, G. New insights on the late Quaternary geologic evolution of the Ischia Island coastal belt based on high-resolution seismic profiles. Ital. J. Geosci. 2018, 137, 87–106. [Google Scholar] [CrossRef] [Green Version]
  14. Cubellis, E.; Luongo, G.; Obrizzo, F.; Sepe, V.; Tammaro, U. Contribution to knowledge regarding the sources of earthquakes on the island of Ischia (Southern Italy). Nat. Hazards 2020, 100, 955–994. [Google Scholar] [CrossRef]
  15. Tebaldini, S.; Monti Guarnieri, A.M.; Imperatore, P.; Riccio, D. Methods and performances for multi-pass SAR interferometry. In Geoscience and Remote Sensing New Achievements; InTech: London, UK, 2010; pp. 329–357. [Google Scholar] [CrossRef] [Green Version]
  16. Ferretti, A.; Prati, C.; Rocca, F. Permanent scatterers in SAR interferometry. IEEE Trans. Geosci. Remote. Sens. 2001, 39, 8–20. [Google Scholar] [CrossRef]
  17. Berardino, P.; Fornaro, G.; Lanari, R.; Sansosti, E. A new algorithm for surface deformation monitoring based on small baseline differential interferograms. IEEE Trans. Geosci. Remote Sens. 2002, 40, 11. [Google Scholar] [CrossRef] [Green Version]
  18. Pasquali, P.; Cantone, A.; Riccardi, P.; Defilippi, M.; Ogushi, F.; Gagliano, S.; Tamura, M. Mapping of ground deformations with interferometric stacking techniques. In Land Applications of RADAR Remote Sensing; InTech: London, UK, 2014; Volume 8, pp. 234–259. [Google Scholar] [CrossRef] [Green Version]
  19. Lanari, R.; Casu, F.; Manzo, M.; Zeni, G.; Berardino, P.; Manunta, M.; Pepe, A. An overview of the small baseline subset algorithm: A DInSAR technique for surface deformation analysis. In Deformation and Gravity Change: Indicators of Isostasy, Tectonics, Volcanism, and Climate Change; Birkhäuser: Basel, Switzerland, 2007; pp. 637–661. [Google Scholar] [CrossRef]
  20. De Martino, P.; Dolce, M.; Brandi, G.; Scarpato, G.; Tammaro, U. The Ground Deformation History of the Neapolitan Volcanic Area (Campi Flegrei Caldera, Somma–Vesuvius Volcano, and Ischia Island) from 20 Years of Continuous GPS Observations (2000–2019). Remote Sens. 2021, 13, 2725. [Google Scholar] [CrossRef]
  21. De Martino, P.; Tammaro, U.; Obrizzo, F.; Sepe, V.; Brandi, G.; D’Alessandro, A.; Dolce, M.; Pingue, F. La Rete GPS dell’isola di Ischia: Deformazioni del suolo in un’area vulcanica attiva (1998–2010). Quad. Di Geofis. 2011. Available online: http://istituto.ingv.it/l-ingv/produzione-scientifica/quaderni-di-geofisica/ (accessed on 9 September 2021).
  22. SARscape®. User Guide; Sarmap: Purasca, Switzerland, 2014. [Google Scholar]
  23. Just, D.; Bamler, R. Phase statistics of interferograms with applications to synthetic aperture radar. Appl. Opt. 1994, 33, 4361–4368. [Google Scholar] [CrossRef]
  24. Fialko, Y.; Simons, M.; Agnew, D. The complete (3-D) surface displacement field in the epicentral area of the 1999 MW7.1 Hector Mine Earthquake, California, from space geodetic observations. Geophys. Res. Lett. 2001, 28, 3063–3066. [Google Scholar] [CrossRef] [Green Version]
  25. EMERGEO Working Group; Nappi, R.; Alessio, G.; Belviso, P.; Gaudiosi, G.; Marotta, E.; Nave, R.; Peluso, R.; Siniscalchi, V.; Civico, R.; et al. The August 21, 2017 Isola di Ischia (Casamicciola) Earthquake: Coseismic Effects. 2017. Available online: https://doi.org/10.5281/zenodo.1003188 (accessed on 9 September 2021).
  26. Serva, L. History of the Environmental Seismic Intensity Scale ESI-07. Geosciences 2019, 9, 210. [Google Scholar] [CrossRef] [Green Version]
  27. Chiodini, G.; Avino, R.; Brombach, T.; Caliro, S.; Cardellini, C.; De Vita, S.; Frondini, F.; Granirei, D.; Marotta, E.; Ventura, G. Fumarolic and diffuse soil degassing west of Mount Epomeo, Ischia, Italy. J. Volcanol. Geoth. Res. 2004, 133, 291–309. [Google Scholar] [CrossRef]
  28. Marmoni, G.M.; Calabriso, A.; Martino, S.; Borello, D.; Della Seta, M.; Esposito, C.; Fiorucci, M.; Venturini, P. Hydrothermalsystem Influencing Slope-Scale Deformations at Mt. Nuovo (Ischia, Southern Italy): Preliminary Results from 2D-Multiphysics Numerical Modelling. GNGTS 2016, 269–272. Available online: http://www3.ogs.trieste.it/gngts/files/2016/S13/Riassunti/Marmoni.pdf (accessed on 9 September 2021).
  29. Marmoni, G.M.; Martino, S.; Heap, M.J.; Reuschlé, T. Gravitational slope-deformation of a resurgent caldera: New insights from the mechanical behaviour of Mt. Nuovo tuffs (Ischia Island, Italy). J. Volcanol. Geotherm. Res. 2017, 345, 1–20. [Google Scholar] [CrossRef]
  30. Isaia, R.; Di Giuseppe, M.G.; Natale, J.; Tramparulo, F.D.A.; Troiano, A.; Vitale, S. Volcano-tectonic setting of the Pisciarelli fumarole field, Campi Flegrei caldera, southern Italy: Insights into fluid circulation patterns and hazard scenarios. Tectonics 2021, 40, e2020TC006227. [Google Scholar] [CrossRef]
  31. Tibaldi, A.; Vezzoli, L. A new type of volcano flank failure: The resurgent caldera sector collapse, Ischia, Italy. Geophys. Res. Lett. 2004, 31. [Google Scholar] [CrossRef]
  32. Castaldo, R.; Gola, G.; Santilano, A.; Pepe, S.; Manzo, M.; Manzella, A.; Tizzani, P. The role of thermo-rheological properties of the crust beneath Ischia Island (Southern Italy) in the modulation of the ground deformation pattern. J. Volcanol. Geotherm. Res. 2017, 344, 154–173. [Google Scholar] [CrossRef]
  33. Sepe, V.; Atzori, S.; Ventura, G. Subsidence due to crack closure and depressurization of hydrothermal systems: A case study from Mt Epomeo (Ischia Island, Italy). Terra Nova 2007, 19, 127–132. [Google Scholar] [CrossRef]
  34. Ricco, C.; Alessio, G.; Aquino, I.; Brandi, G.; Brunori, C.A.; D’Errico, V.; Dolce, M.; Mele, G.; Nappi, R.; Pizzimenti, L.; et al. High precision leveling survey following the md 4.0 casamicciola earthquake of august 21, 2017 (ischia, southern italy): Field data and preliminar interpretation. Ann. Geophys. 2018, 61, 6. [Google Scholar] [CrossRef] [Green Version]
  35. Montuori, A.; Albano, M.; Polcari, M.; Atzori, S.; Bignami, C.; Tolomei, C.; Pezzo, G.; Mora, M.; Saroli, M.; Stramondo, S.; et al. Using Multi-Frequency Insar Data to Constrain Ground Deformation of Ischia Earthquake. In Proceedings of the IGARSS 2018—2018 IEEE International Geoscience and Remote Sensing Symposium, Valencia, Spain, 22–27 July 2018; pp. 541–544. [Google Scholar] [CrossRef]
  36. Trasatti, E.; Acocella, V.; Di Vito, M.A.; Del Gaudio, C.; Weber, G.; Aquino, I.; Caliro, S.; Chiodini, G.; de Vita, S.; Ricco, C.; et al. Magma Degassing as a Source of Long-Term Seismicity at Volcanoes: The Ischia Island (Italy) Case. Geophys. Res. Lett. 2019, 46, 14421–14429. [Google Scholar] [CrossRef] [PubMed] [Green Version]
  37. Spinetti, C.; Bisson, M.; Tolomei, C.; Colini, L.; Galvani, A.; Moro, M.; Saroli, M.; Sepe, V. Landslide susceptibility mapping by remote sensing and geomorphological data: Case studies on the Sorrentina Peninsula (Southern Italy). GIScience Remote Sens. 2019, 56, 940–965. [Google Scholar] [CrossRef]
Figure 1. Location of Ischia Island within the Gulf of Naples, Southern Italy. Geographic coordinate system is UTM 33N, WGS 84.
Remotesensing 13 04253 g001
Figure 2. Hillshade relief of Ischia with the epicentres of the 2017 seismic sequence [9] and the area examined through the displacement time series analysis in addition to the municipalities and their limits, contour lines, faults [10] and landslides phenomena mapped within the island (IFFI landslides inventory). Geographic coordinate system is UTM 33N, WGS 84.
Remotesensing 13 04253 g002
Figure 3. Descending (a) and ascending (b) LOS displacement maps computed by using Envisat data.
Remotesensing 13 04253 g003
Figure 4. Comparison between GPS displacement rates reprojected on Envisat descending (blue triangles) and ascending (red triangles) LOS and, respectively, displacement rates evaluated through SBAS processing: descending track (light blue diamonds) and ascending track (orange diamonds).
Remotesensing 13 04253 g004
Figure 5. (a) Descending displacement map computed by using COSMO-SkyMed data. (b) Comparison between GPS displacement rates reprojected on satellite LOS (blue triangles) and those ones retrieved by SBAS processing (light blue diamonds).
Remotesensing 13 04253 g005
Figure 6. Descending (a) and ascending (b) LOS displacement maps computed by using Sentinel-1A data.
Remotesensing 13 04253 g006
Figure 7. Comparison between GPS displacement rates reprojected on Sentinel-1A descending (blue triangles) and ascending (red triangles) LOS and, respectively, displacement rates evaluated through SBAS processing: descending track (light blue diamonds) and ascending track (orange diamonds).
Remotesensing 13 04253 g007
Figure 8. Horizontal (a,c) and vertical (b,d) displacement maps for Envisat (a,b) and Sentinel-1A (c,d) datasets.
Remotesensing 13 04253 g008
Figure 9. Comparison between GPS horizontal displacement rates (blue triangles) and those retrieved through SBAS processing using Sentinel-1A data (red diamonds) and Envisat data (green diamonds).
Remotesensing 13 04253 g009
Figure 10. Comparison between GPS vertical displacement rates (blue triangles) and those retrieved through SBAS processing using Sentinel-1A data (red diamonds) and Envisat data (green diamonds).
Remotesensing 13 04253 g010
Figure 11. Detail of the maximum deformation zone and location of the area examined through the time series. Sentinel-1A vertical displacement map, epicentres [9] and faults [10] are also visible.
Remotesensing 13 04253 g011
Figure 12. LOS displacement time series performed at the centre of the maximum deformation area detected by the totality of the elaborations and conducted with all available descending datasets: Envisat from 11/2002 to 06/2010 (purple circles), COSMO-SkyMed from 02/2011 to 08/2017 (pink squares) and Sentinel-1A from 01/2015 to 12/2019 (light blue diamonds).
Remotesensing 13 04253 g012
Figure 13. (a) Time series of vertical displacements plotted at the centre of the maximum deformation area identified by the totality of the elaborations and derived from Envisat (11/2002–06/2010) and Sentinel-1A (01/2015–12/2019) processing. (b) Detail of the acceleration recorded by the Sentinel-1A sensor following the 21 August 2017 earthquake (red line).
Remotesensing 13 04253 g013
Table 1. Main characteristics of the datasets used in the multitemporal interferometric processing.
SatelliteOrbit TypeN. of TracksN. of DataN. of PairsTemporal SpanProcessing
Resolution (m)
Incidence
Angle (°)
EnvisatDescending365922407/11/2002–03/06/20102523.6
Ascending1296127013/11/2002–18/08/201020.7
COSMO-SkyMedDescending1957839524/02/2011–19/08/20171527.4
Sentinel-1ADescending2214340011/01/2015–28/12/20191535.9
Ascending4414742012/01/2015–29/12/201934.5
Table 2. RMSE calculated for each comparison made between GPS displacement rates reprojected on satellite LOS and that deriving from the SAR data processing.
ComparisonAcquisition ModeRMSE (mm/yr)
GPS vs. EnvisatDescending2.8732
Ascending4.0437
GPS vs. COSMO-SkyMedDescending3.4704
GPS vs. Sentinel-1ADescending2.8522
Ascending2.9087
Table 3. RMSE calculated for each comparison made between GPS and SAR horizontal and vertical displacement rates.
ComparisonComponent of DisplacementRMSE (mm/yr)
GPS vs. EnvisatHorizontal1.4714
Vertical2.2661
GPS vs. Sentinel-1AHorizontal2.4944
Vertical2.6999
Publisher’s Note: MDPI stays neutral with regard to jurisdictional claims in published maps and institutional affiliations.

