Article

Interannual Variability of the Lena River Plume Propagation in 1993–2020 during the Ice-Free Period on the Base of Satellite Salinity, Temperature, and Altimetry Measurements

by
Vladislav R. Zhuk
and
Arseny Alexandrovich Kubryakov
*
Federal State Budget Scientific Institution, Marine Hydrophysical Institute of RAS, 299011 Sevastopol, Russia
*
Author to whom correspondence should be addressed.
Remote Sens. 2021, 13(21), 4252; https://doi.org/10.3390/rs13214252
Submission received: 12 August 2021 / Revised: 19 October 2021 / Accepted: 20 October 2021 / Published: 22 October 2021

Abstract

:
The Lena River plume significantly affects the thermohaline, optical and chemical properties of the eastern Arctic seas. We use sea surface salinity (SSS), temperature (SST), and altimetry measurements to study features of the Lena plume propagation during 1993–2020. A comparison of Soil Moisture Active Passive (SMAP) SSS measurements with in situ data obtained using the flow-through system in oceanographic surveys in 2018–2019 demonstrates good coincidence with correlation ~ 0.96 and RMSD ~ 1 psu. The SMAP data were used to reconstruct the plume evolution in 2015–2020 and to identify three main types of Lena plume propagation, which are mainly related to the variability of dominant zonal wind direction: «northern»—the plume moves to the north from the delta up to 78° N; «eastern»—the plume moves eastward along the Siberian coast up to 180° E; «mixed» between two main types. Brackish plume waters were characterized by increased temperature and sea level, which provides the opportunity for studying the Lena plume dynamics using satellite altimetry and infrared measurements. These data were analyzed to study the interannual variability of plume propagation during the ice-free period of 1993–2020. The obtained results show that the «northern» type is observed twice more often than the «eastern» one, but the «eastern» type has intensified since 2010.

1. Introduction

Riverine freshwater significantly affects the hydrological structure, dynamic characteristics, and ecosystem of the Arctic Ocean [1,2,3]. The waters of the continental runoff of the Laptev and East Siberian Seas extend over hundreds of thousands km2 and are among the largest freshwater sources in the Arctic Ocean [1,4,5]. The Lena is one of the large rivers of the Arctic with an annual discharge of ~538 km3/year [6]. This corresponds to about 15% of all river discharge in the Arctic basin [5]. Brackish riverine water plays a significant role in the formation of the thermohaline structure and stratification of the Eastern Arctic, especially in its coastal and shelf areas [7,8,9,10]. Buoyancy gradients at the periphery of river plumes play an important role in the formation and variability of large- and mesoscale dynamics of the coastal seas of the Arctic basin [3,11,12,13]. Riverine waters bring a large amount of dissolved organic matter [3,14,15] and sharpen stratification, which decreases light availability and upward nutrient fluxes suppressing the development of phytoplankton [16]. Riverine heat flux plays an important role in the heat balance of the Arctic seas [17,18], especially in the summer season, when their temperature exceeds ~15°, which is significantly higher than the temperature of the Laptev Sea (~2°) [18,19,20,21,22]. These publications also show that riverine waters can significantly affect sea ice melting in the Arctic [22,23].
The propagation of the Lena River plume is characterized by significant interannual variability, which depends on meteorological and hydrological conditions, in particular, on wind forcing, large-scale circulation, runoff intensity, and self-organizing plume buoyant circulation. The patterns of plume propagation define the regions, which will be most affected by warm, brackish, and chemically complex riverine waters. Hydrological measurements [7,8,9,10,24,25,26] and numerical simulation data [11,26,27,28,29] showed that one of the main factors determining interannual changes in plume position is wind forcing [24,26,27,28] and, in particular, wind vorticity [10,27]. The cyclonic atmospheric circulation promotes the transport of the river plume to the east into the East Siberian Sea, while the anticyclonic circulation promotes its transfer to the north [27,28].
The propagation and salinity of the plume also are characterized by significant high-frequency variability associated with changes in wind speed and mesoscale dynamics [29,30]. Coastal upwelling arising from westerly and northwesterly winds in the near-delta region can cause significant transformation and dilution of the river plumes near the river mouth [30]. In rare cases, the penetration of brackish waters of the Kara Sea through the Vilkitsky Strait can also affect the salinity field in the Laptev Sea [7,31,32].
Riverine waters are characterized by increased temperature and concentration of suspended matter, which makes it possible to study them using optical and infrared satellite measurements [9,30,33,34]. However, the most direct information about the propagation of brackish plume waters is provided by satellite salinity measurements. Several previous studies demonstrated that modern passive microwave salinity measurements can be used for the investigation of the river plumes in the Arctic basin and their interannual variability [9,12,13]. In particular, Aquarius data were used to study the features of the propagation of the Ob-Yenisei plume in the Kara Sea and its relationship with geostrophic and wind circulation [12,13]. In a recent work [9], the authors showed the possibility for the investigation of the Lena River plume propagation using Soil Moisture and Ocean Salinity (SMOS) satellite measurements in August–September 2018.
Global warming and the decrease in sea ice coverage [35,36] give a possibility to obtain more satellite data on the processes in the Arctic regions. The new device, Soil Moisture Active Passive (SMAP), launched in 2015 with the largest antenna size provide salinity measurements with higher resolution and accuracy [37]. The temperature of riverine waters in the summer period is significantly higher [18,19,20,21] than the temperature of the open sea, which gives a possibility to track them using infrared (IR) measurements. In addition, the influx of warm freshwater causes a rise in sea level due to the steric effect and direct rise of water volume. Modern altimetry data provide regular information on sea level fields and provide new information on the spatio-temporal variability of plume dynamics in the Arctic seas [12,13].
In this study, for the first time, we investigate the features of interannual variability of the Lena plume propagation in 1993–2020 based on SMAP salinity measurements, MODIS IR radiometer data, and satellite altimetry measurements. The data are described in Section 2. Validation of SMAP salinity data on the base of comparison with the in situ measurements in the Laptev Sea in 2018–2019 is given in Section 3.1. The interannual features of plume propagation and their relationship with the wind field on the base of SMAP data are analyzed in Section 3.2. In Section 3.3, we compare satellite measurements of salinity, temperature, and sea level in 2015–2020. The comparison shows that the brackish waters of the plume are characterized by increased sea level and temperature. These characteristics are then used to analyze the interannual variability of the Lena River plume propagation based on altimetry measurements in 1993–2020 and MODIS IR measurements in 2003–2020 (Section 3.4).

2. Materials and Methods

We used monthly and 8-day surface salinity maps obtained from measurements of the SMAP instrument for 2015–2020 to study the dynamics of river plumes. The product SMAP sea surface salinity (SSS) V4.0 was downloaded from http://remss.com/missions/smap/salinity/ (accessed on 10 October 2021). The major change in version 4.0 from version 3.0 is an improved land correction, which allows for SMAP salinity retrievals closer to the coast [38]. The monthly averaged maps were used for the description of the plume propagation, while 8-day averaged maps were used for the product validation on the base of comparison with in situ measurements. Both data sets have 0.25° spatial resolution. Data are available since July 2015. Estimated SMAP accuracy is about 0.5 psu [38]. However, at high latitudes (above 65° N) the accuracy of SSS measurements decrease due to lower sea temperature. The authors of [37] show that in the Arctic Ocean RMSD (root–mean–square deviation), bias, correlation coefficients between SMAP data and in situ salinity measurements are 1.20, −0.16, and 0.93, accordingly.
Altimetry data were used to investigate the plume propagation based on its manifestation in sea level fields. We obtained the gridded altimetry data (product identifier: SEALEVEL_GLO_PHY_L4_REP_OBSERVATIONS_088_047) for 1993–2019 from the Copernicus Marine Environmental Monitoring Service (CMEMS). This product consists of daily gridded maps of Absolute Dynamic Topography (ADT) in ice-free regions. These maps are computed as a sum of mapped sea level anomalies (SLA) calculated from combined measurements by different satellites and mean dynamic topography (MDT) [39]. The data were corrected for instrumental errors, tidal influence, wind, and pressure effects, and objectively interpolated to a 1/4° Mercator projection grid [40]. Altimetry maps are produced using spatial interpolation of the along–track data [41]. Quantitative validation of altimetry data on sea level in the Arctic basin was made in several specialized studies [42,43]. The authors of [42] showed that altimetry data generally match tide gauge data and the standard deviation between them, partly related to the differences in the position of the measurement, varies from 2 to 12 cm.
Only altimetry satellites with high-inclination orbits provide useful information in high-latitude regions. However, the convergence of satellite tracks at high latitudes increases the spatio-temporal resolution of altimetry along-track measurements [29]. The maximum number of tracks was available in 2001–2008 [29] when this area was covered simultaneously by three satellites with high orbit inclination (GFO, ERS-2, Envisat). In this period, up to 15–20 altimetric tracks were available in a month in August–September in a 1 × 1° box, that is, the measurements were available almost every two days. During 1991–1996 and in 2012 only one such satellite was at work, resulting in only two tracks per month, while six tracks per month were available in 1998–2000 and 2009–2011 and about 10 tracks in 2013–2020.
We use MODIS Level 3 daily sea surface temperature (SST) with a spatial resolution of 4 km. Data for the 2002–2020 period were downloaded from the OceanColor data archive (http://oceancolor.gsfc.nasa.gov/, accessed on 10 October 2021). These data are corrected routinely for atmospheric and sea surface effects using standard atmospheric correction algorithms. MODIS SST accuracy for the global ocean is 0.07 °C [44]
A sufficient number of measurements were collected only in the ice-free period of a year. This period was shorter for passive microwave SSS measurements with a footprint ~ 40 km (August-October) and longer for altimetry data with a 7 km footprint (June–November). Clouds obstruct SST measurements but are transparent for SSS and altimetry microwave measurements.
Data on the wind velocity at 10 m height were obtained from the Era-5 reanalysis [45] for 1993–2020. The data are available from https://cds.climate.copernicus.eu/ (accessed on 10 October 2021). The temporal resolution is 3 h and the spatial resolution is 0.25°.

3. Results

3.1. Comparison of In Situ and Satellite Measurements of Salinity

Satellite salinity measurements in the Arctic Ocean are less accurate due to the presence of sea ice and low temperatures, which reduce the sensitivity of microwave measurements to salinity changes [37]. Despite this, several studies [9,12,13] demonstrated the possibility of using these measurements to study the propagation of river plumes in the Arctic, in which salinity differs significantly (by 5–10 psu) from the surrounding waters.
To assess the possibility of using SMAP salinity data for the investigation of the Lena plume propagation, SSS data were compared with in situ measurements of surface salinity obtained in several expeditions of Shirshov Institute of Oceanology of Russian Academy of Sciences (IO RAS) in 2018 and 2019. Continuous measurements of salinity in the surface layer were obtained during the 73rd and 78th cruises of the R/V Akademik Mstislav Keldysh using a flow-through system equipped with an SBE21 thermosalinograph. Water was taken from a depth of 2–3 m. Figure 1 shows the routes of the expeditions along which the surface salinity measurements were made in 2018 and 2019. More than 16,000 measurements were used for the comparison in total.
To assess the spatial distribution of the accuracy of satellite measurements, SMAP salinity data were linearly interpolated on the location and time of the in situ measurements. The color in Figure 1 shows the absolute difference between satellite and in situ data. The satellite data error does not exceed 1–2 psu in most cases (blue and cyan colors). Larger errors (4–5 psu) were observed at some scattered points near the coast, in the direct vicinity of the Lena estuary, and in the Laptev Strait.
There are several possible sources of these increased errors in areas. First, the probability of the impact of the reflection from the coast or small islands on the formation of the microwave signal increases in these shallow areas. Second, in situ data were obtained at the horizons 2–3 m, while satellite passive measurements penetrate only to about 1 cm. Sharp vertical gradients of salinity, which are expected in the areas of intense river discharge may affect the comparison. Third, satellite data have a much lower spatial and temporal resolution than in situ measurement data. Near the river mouths, significant spatial and temporal variability of salinity can be expected, associated with the intense baroclinic dynamics observed at river mouths, wind forcing [26,27,28], and the complex structure of the mouth of the Lena River [30].
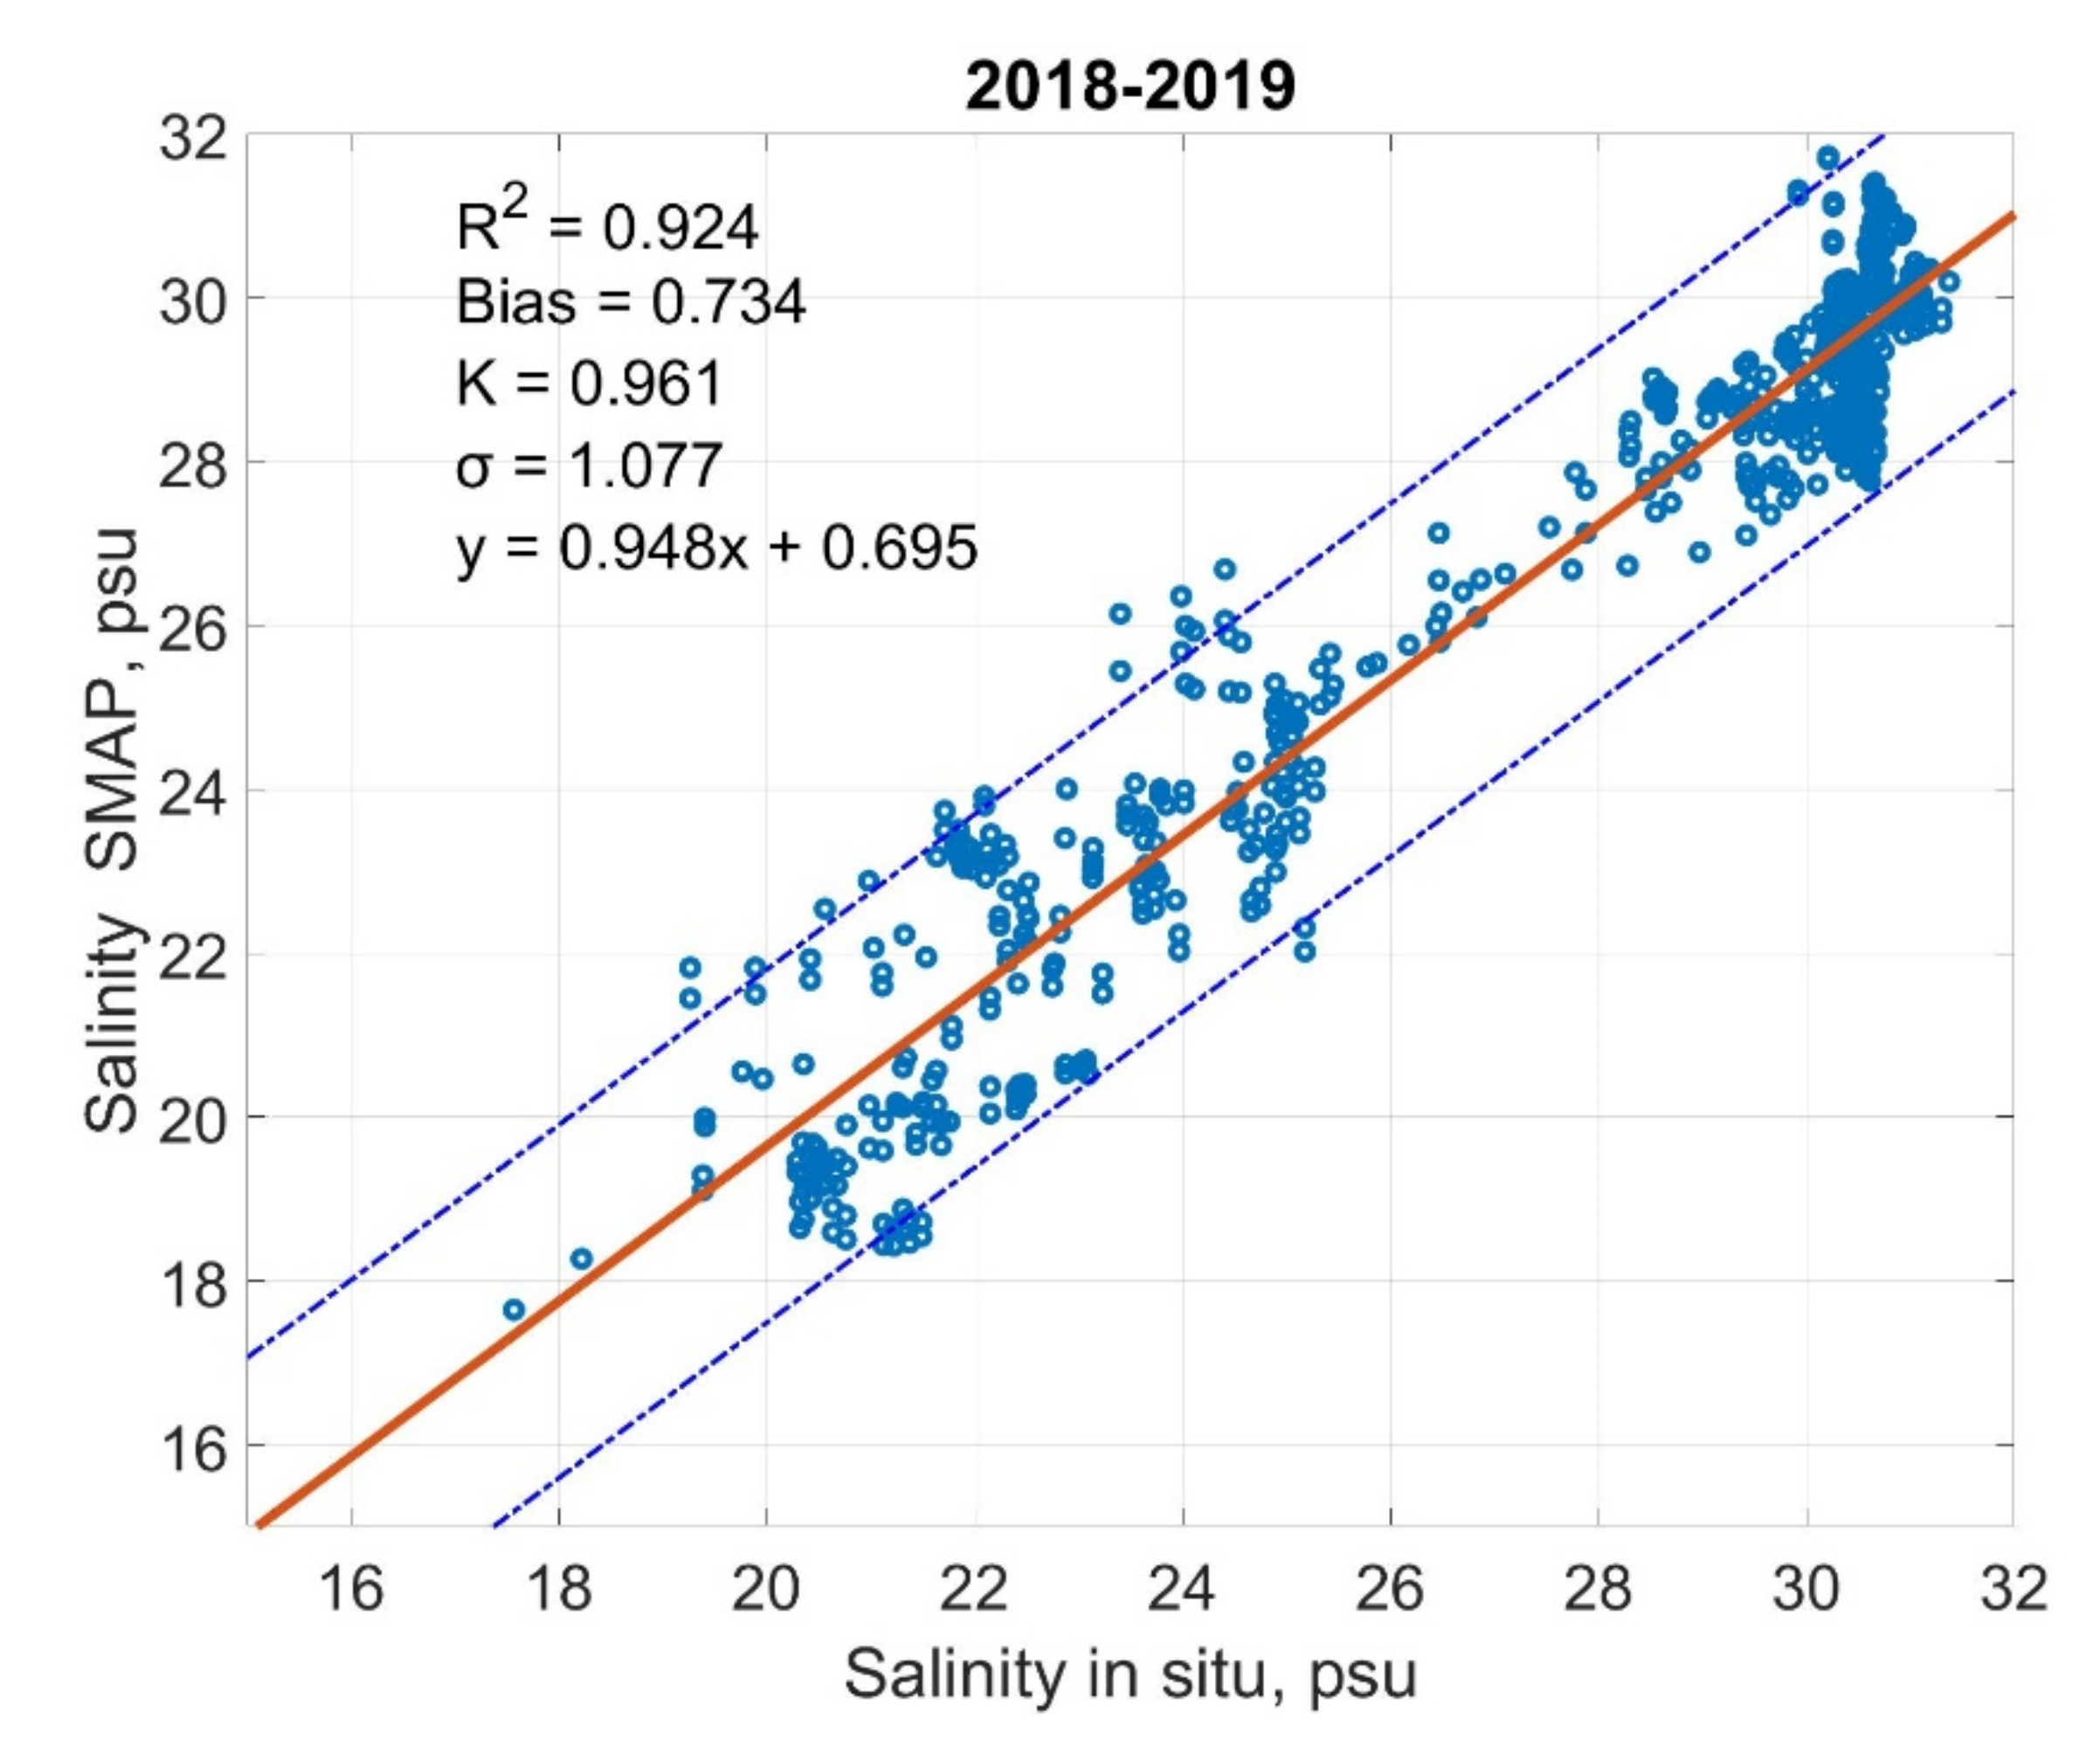
To take the difference in the spatial resolution into account the in situ measurements were averaged in 0.25 × 0.25° cells corresponding to the grid of SMAP data. The number of the in situ measurements in each cell varies from 3 to 40 depending on the vessel speed. The scatter plot between datasets demonstrates their fairly good agreement. The correlation between the two series was 0.96. RMSD between the in situ and satellite measurements was about 1 psu. SMAP salinity estimates are lower than in situ data on the average value of 0.734 psu. Such a bias is possibly related to the difference in the vertical position of the measurements. Passive microwave measurements give information about the most surface layers of the sea (~1 cm), where salinity should be lower than at the depths of in situ measurements (2–3 m). In the diagram (Figure 2), two clusters of points are distinguished—points with salinity above 28 psu, corresponding to the waters of the open sea, and points with salinity less than 26 psu, corresponding to waters affected by the river plume. Note that in our comparison, there is almost no salinity below 20. Therefore, we cannot guarantee an accurate quantitative estimate of salinity in a lower diapason of values.
The average salinity of the Arctic open sea waters is usually higher than 30 psu. The estimate of the SMAP error is about 1 psu, so we can take 28 psu as a boundary of plume-affected waters. Similar values, 30 psu, were used as a plume boundary in the study of [7]. The diagram in Figure 2 shows that satellite data with fairly good accuracy (+/−1 psu) provide a possibility to separate the plume (s < 28 psu) from open sea waters (s > 30 psu).
We note that the discussed above factors also can affect the results of the analysis of the plume propagation from satellite salinity measurements in Section 3.2. Particularly, plume dynamics can not be observed near the coast and ice, where passive microwave measurements are unavailable [38]. The relatively low spatial and temporal resolution of satellite measurements smoothes the salinity gradients and can somewhat overestimate the observed plume area. In our article, we investigate large-scale plume dynamics on monthly periods, so these effects should not significantly alter the presented results.

3.2. Interannual Variability of the Lena Plume Propagation from Satellite Salinity Measurements

The maximum discharge of the Lena is observed in June–July [46,47]. Satellite salinity measurements are mainly available from August to October, as before that time, most of the ocean is covered with ice interfering the microwave measurements. Figure 3 shows the monthly average salinity maps for August for different years of the period 2015–2020. Areas with low salinity correspond to the position of the river plume, which is characterized by significant interannual variability. It should be noted that the melting of sea ice can also affect the salinity distribution in a warm period of a year. However, as ice covers all the study area, its effect should be more or less constant in space. At the same time, SSS measurements show a gradual increase in salinity with a distance from the river mouth. This indicates the riverine origin of the observed brackish areas.
Figure 3 shows three main types of river water propagation directions, which will be further referred as «northern» (2015, 2020 years), «eastern» (2016, 2017), and «mixed» (2018, 2019).
During the «northern» type of propagation, brackish waters propagate mainly to the north from the Lena mouth. Salinity to the north of the New Siberian Islands (SNI) at latitudes higher than 76° N significantly decreases. At the same time, the salinity of the south East Siberian Sea (SES) and salinity to the southeast of New Siberian Islands are significantly higher, i.e SNI<<SES.
A well-defined « northern» type was observed in 2015. Brackish waters with a salinity of 13–17 psu are stretched from the mouth of the Lena to the north to 131.9° E 78° N. Further, they move eastward in the area north of the New Siberian Islands. Here, they mix with the surrounding waters and their salinity rises to ~20 psu. At the same time salinity of the south East Siberian Sea was relatively high (~30 psu). Due to the lack of data near the coast, it was not possible to trace how the plume moved along the islands. However, a lower salinity in the region of 144.6–150° E along 74.38° N to the east of the islands indicates that further, the plume moves southeast, reaching a longitude of 153° E.
A similar «northern» type of propagation was also observed in 2020. However, in this year, the northward movement of the plume was somewhat less intense. Water masses with salinity less than 20 psu reached the area of 124° E 77° N. Then, they also moved eastward. In contrast to 2015, brackish waters were almost absent to the north of the New Siberian Islands.
During the «eastern» type the plume moves eastward along the coast. Contrary to the «northern» type, the salinity to the west of the New Siberian Islands is higher than in the south East Siberian Sea (SNI > SES.). Such type of propagation was observed in 2016 and 2017, when plume moved predominately eastward in the form of alongshore flow. In 2016, the river plume elongated along the coast from longitude 130° E to 165° E, i.e., moved on more than 1500 km to the east. Its salinity varies from 10 in the Laptev Sea area up to 17–20 in the East Siberian Sea at longitude 160–170° E. The plume was pressed to the coast of Eurasia and its cross-shore width does not exceed 200 km.
In 2017, the plume penetrated even further to the east to ~170° E. Average salinity in the coastal part of the East Siberian Sea in this year was less than 12 psu, while in the central part it was above 25 psu. Note that in 2017 the plume also intensively propagated to the north of the Laptev Sea and reached the western tip of the New Siberian Islands.
The propagation type in 2018 and 2019 can be described as «mixed». During «mixed» type, we observe the transport of the plume both to the north, up to 76° N, and to the east (SNI ≈ SES.)
In 2018, plume moved to the north up to the New Siberian Islands (140° E 77° N) and to the east along the coast up to longitude 168° E (see also more details in Section 3.4).
In 2019, a rather unusual «mixed» type of propagation was observed. Brackish waters with salinity ~10 psu spread from the mouth to the north up to 134° E 76° N. Here, probably due to the mixing with the open sea waters, the salinity increased to 12–15 psu. After that, the plume moved eastward across the entire East Siberian Sea. Areas of minimum values of salinity are located at a distance of 100–200 km north of the coast in the East Siberian Sea These propagation patterns differs from the «eastern» type in 2016–2017, because in 2019, the plume was not pressed to the shelf, but occupied vast areas far from the coast. Several patches with low salinity are visible at longitudes 145–175° E. Such brackish lenses were never observed before in these regions due to the very low amount of available in situ measurements. Such a structure can possibly indicate pulse-like formation and transport of the plume due to the time variability of wind mixing and currents or impact of mesoscale eddies.
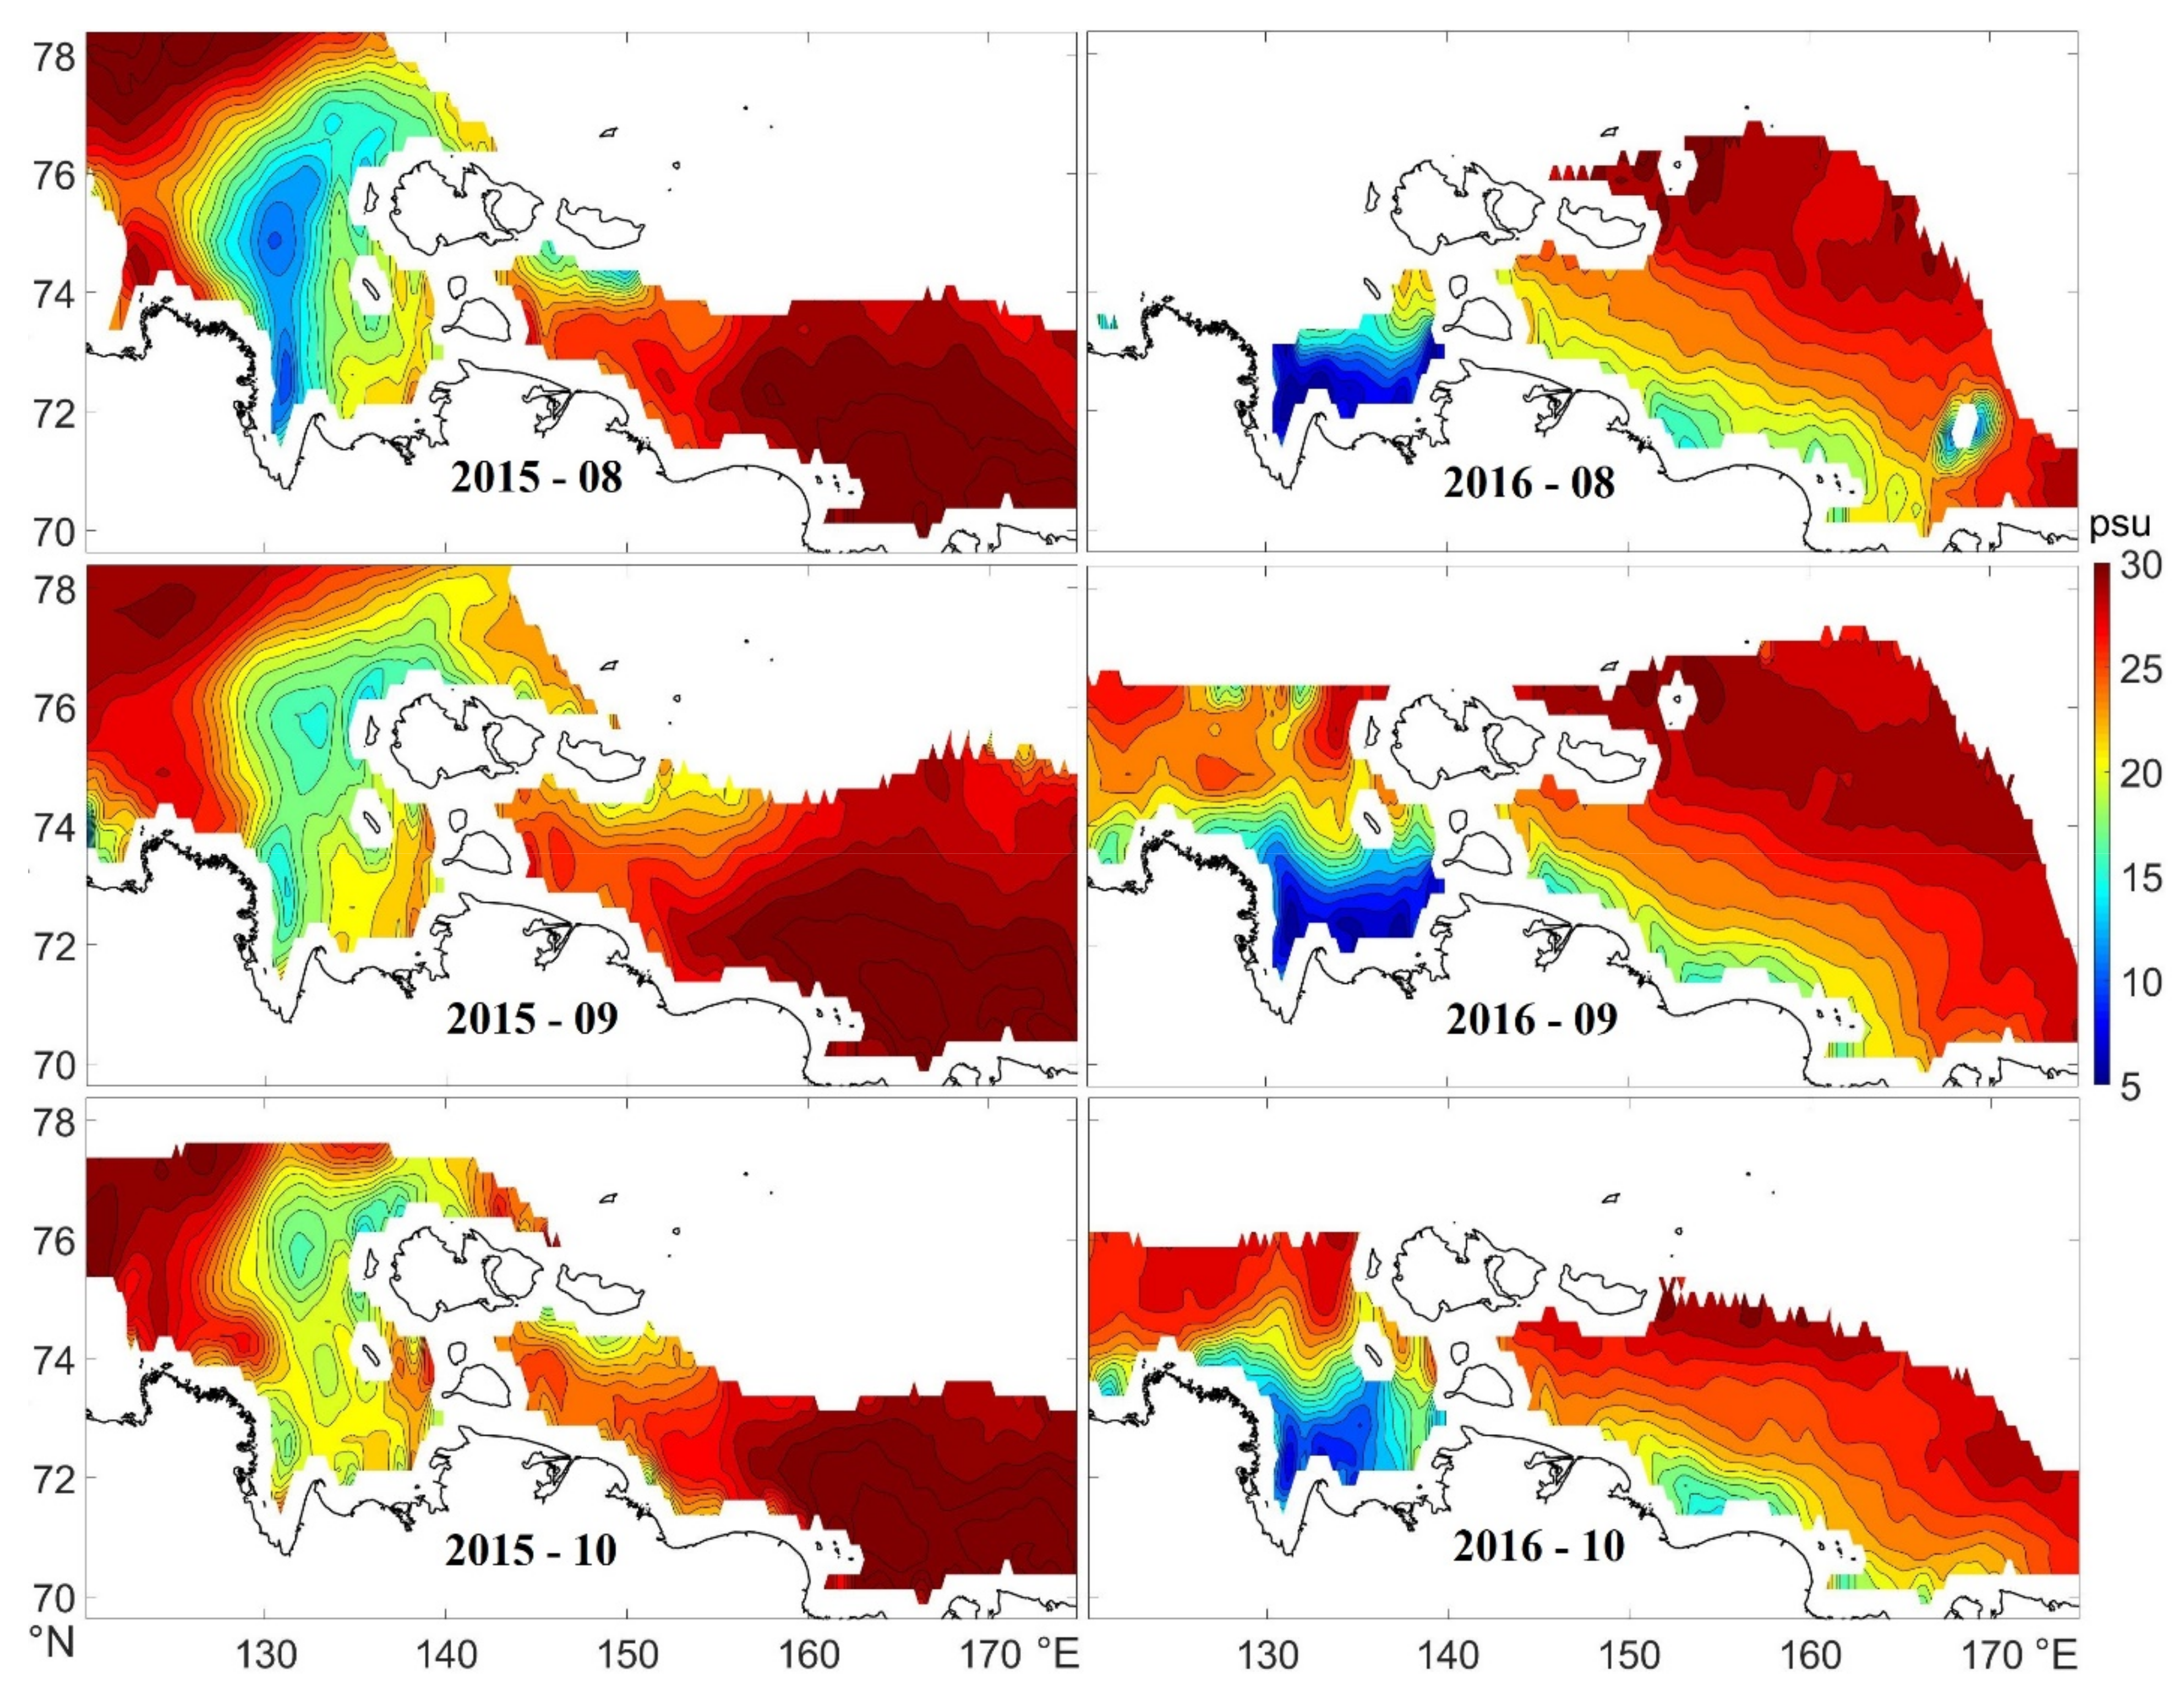
Let us consider the evolution of the «northern» and «eastern» types of propagation using the monthly averaged salinity maps in the ice-free period 2015–2016 (Figure 4). The salinity is minimal ~9–10 psu in August of 2015. It should be noted that these values are less than usual plume salinities reported by in situ data in [7,9,30]. Such a difference is probably caused by the almost complete absence of in situ salinity data in August. The study area is almost inaccessible at this time for the ships going from the major seaports due to complex ice conditions. In such a case, satellite salinity measurements give a unique possibility to investigate plume distribution in August.
In September–October, active transformation and mixing of the plume with the surrounding saltier waters are observed. Plume salinity increased to 15 psu in agreement with in situ data. The likely reason for this mixing is a gradual decrease in river flow and the impact of wind forcing in ice-free conditions. From August to September 2015 brackish waters (S < 20 psu) observed to the north of the New Siberian Islands moved slightly eastward from 150° E to 157–158° E. In October salinity continued to rise. Plume broke down on several patches with minimal values of salinity located near the New Siberian Islands. In this year there were no pronounced low-salinity areas associated with plumes of the Kolyma and Indigirka rivers in the East Siberian Sea. Due to the absence of SMAP data near the coast, we can only assume that during the «northern» type of propagation, active mixing did not allow to observe the plumes of these rivers.
In 2016, plume spread to the east along the Russian coast. The boundary of the plume in August was already located far east at a longitude of 165° E. The plume reached a longitude of 175° E by October. It was even more pressed to the shore at this time. The width of the brackish zone in the East Siberian Sea is about 100 km. In October, a general increase in plume salinity is observed indicating the impact of mixing on the plume dilution.
Note that the difference in the position of the plume from August to October in Figure 4 is not large. This indicates that during the ice-covered period, unavailable for SSS measurements, the plume already propagated at a large distance from the mouth. These results are consistent with the analysis of oxygen isotopes performed in 2018 [9], which show that the propagation of river water to the north in this year occurred long before August when the Laptev Sea was partly covered with ice.
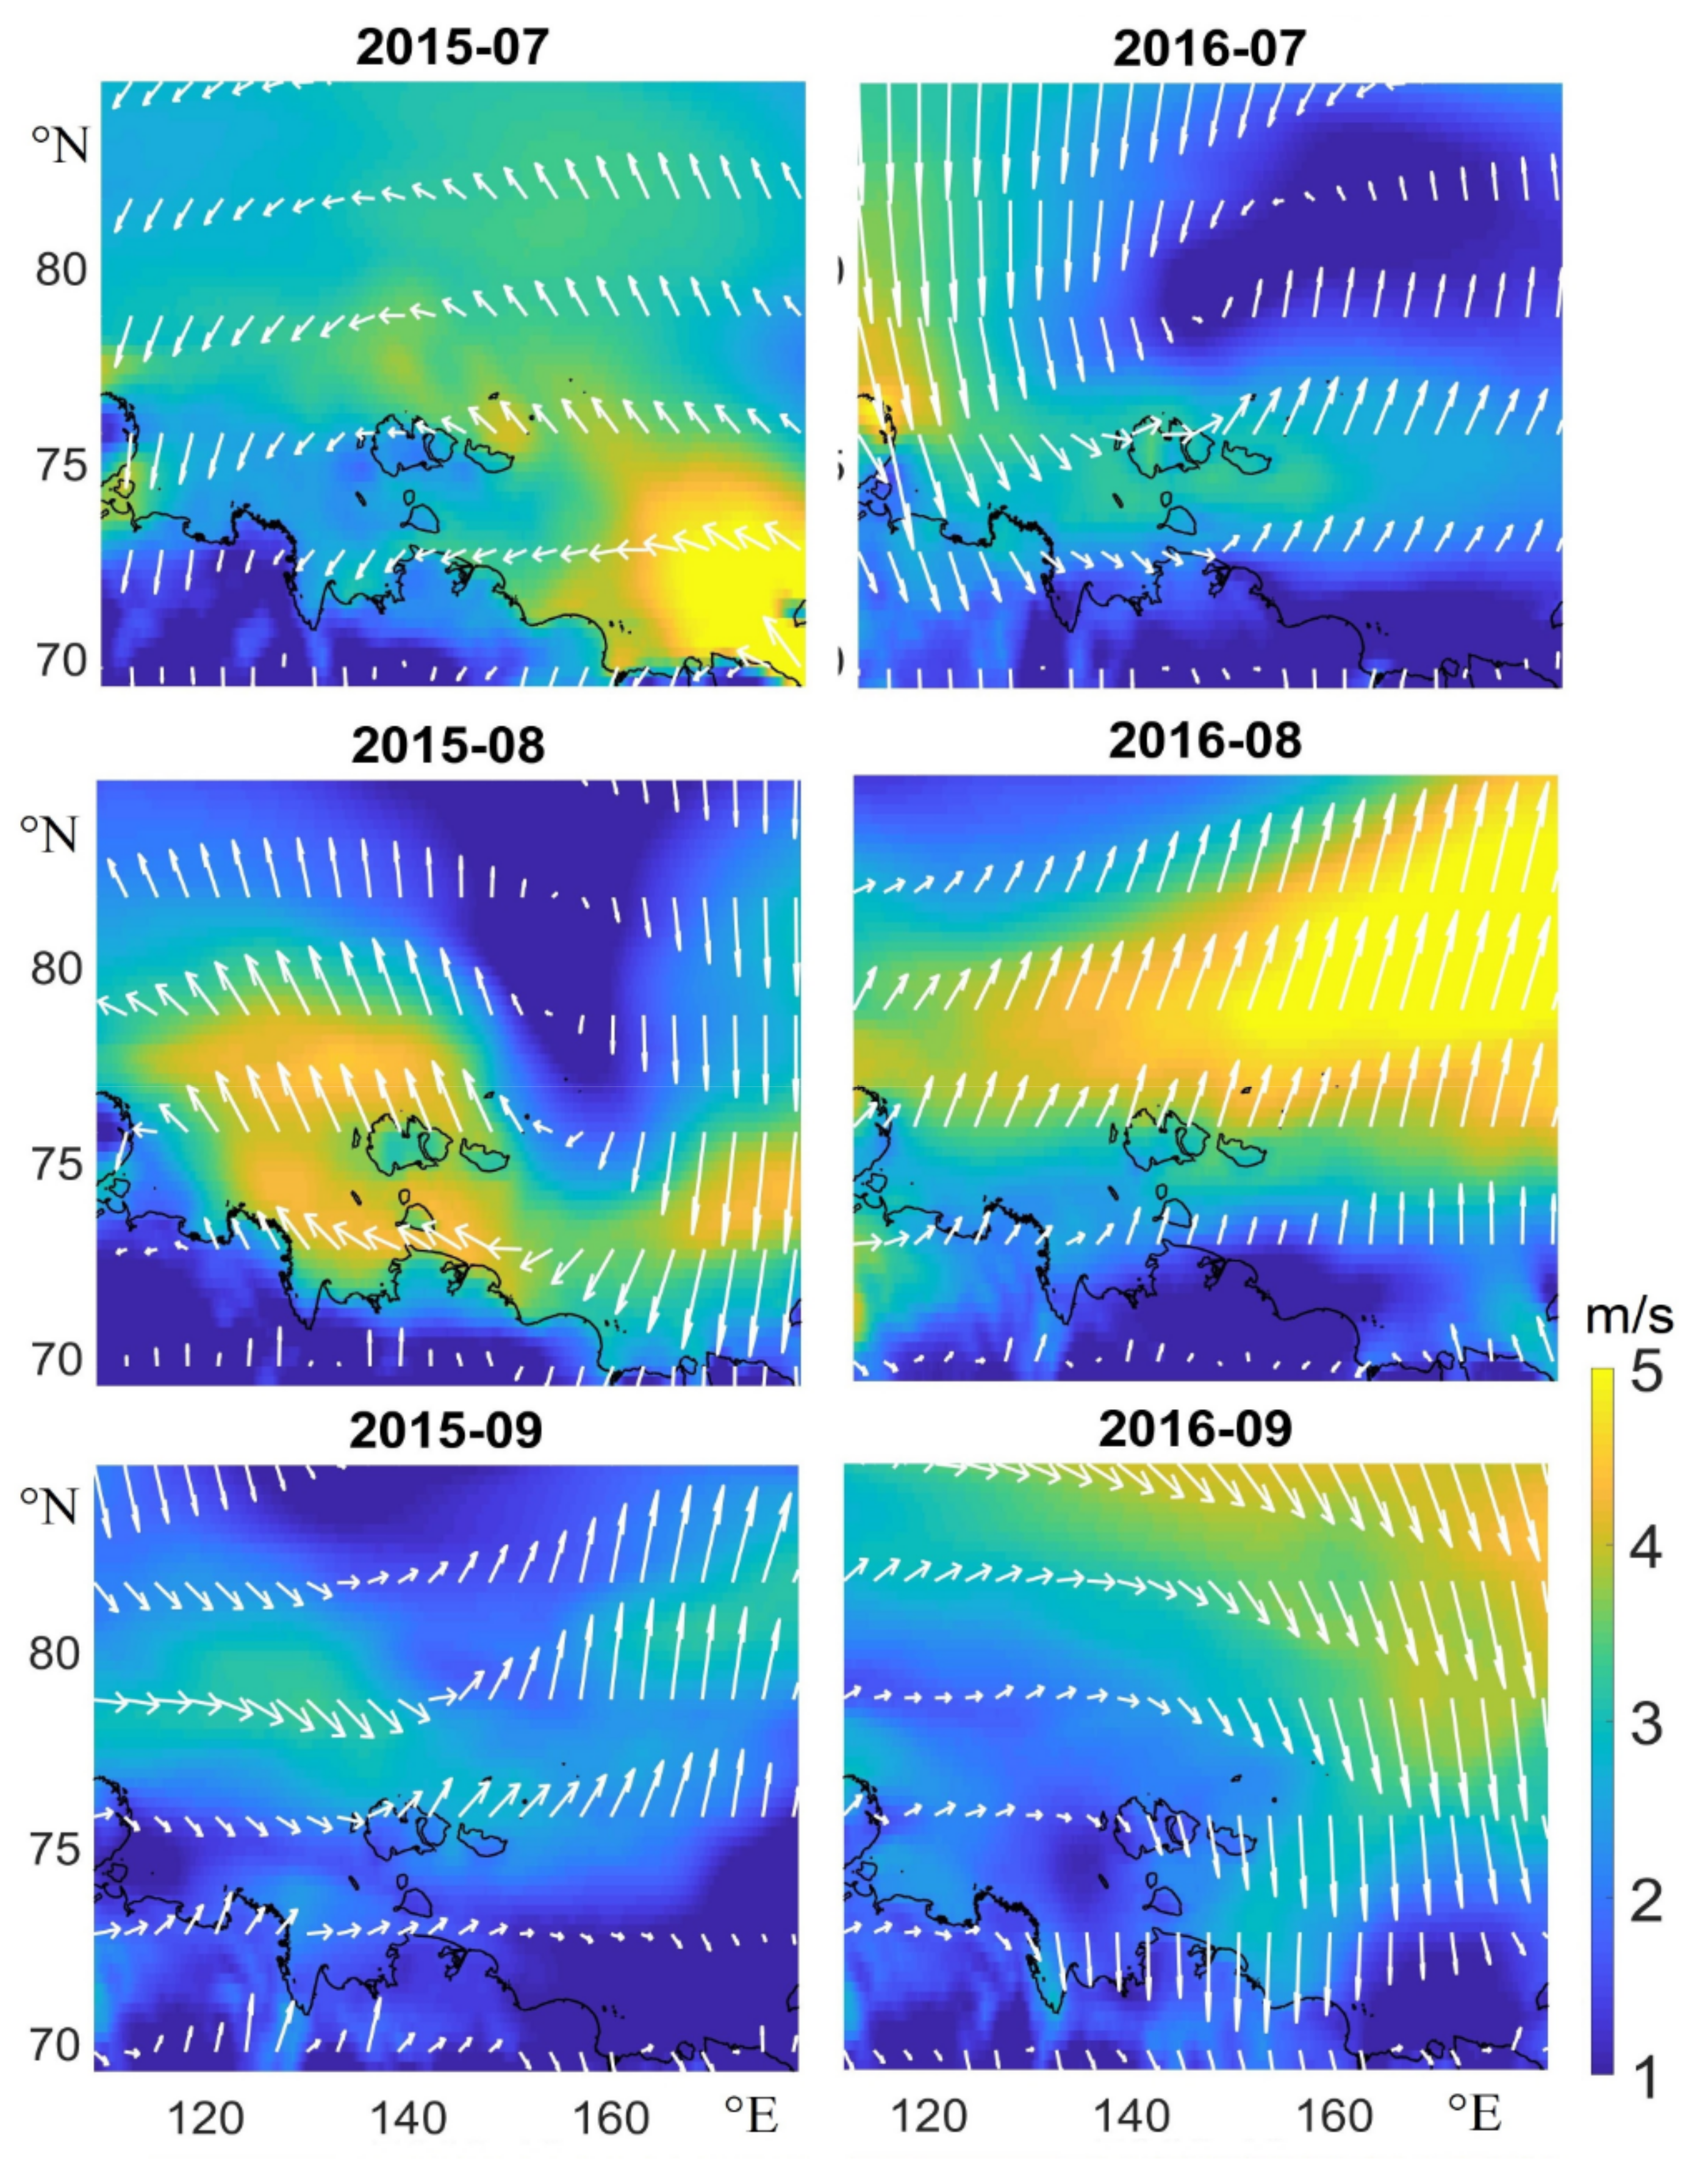
The wind is one of the main reasons for the transport of the Lena plume [24,25,26,27,28]. Figure 5 demonstrates the average monthly wind maps during two different types of plume propagation: «northern» in 2015 and «eastern» in 2016. The analysis shows that the zonal component of the winds over the Lena estuary in these years is different, especially in the summer months.
In June–July 2015, prevailing northeastern winds were observed (Figure 5—left). According to Ekman’s theory, the freshened lens moves to the right of the wind direction. Recent research of Ob-Yenisey plume propagation showed that plume transport is directed on ~60° to the right from the wind direction [12,13]. Note that due to the smaller thickness of the Lena plume, the magnitude of this angle may be different. Therefore, northeastern winds block the plume propagation to the east. As a result, brackish riverine water accumulates near the mouth. Due to the difference in salinity, anticyclonic buoyant circulation is formed at the plume front, which transports it northward from the mouth. Southeast winds prevailing in August of 2015 promoted additional plume transport to the north and northeast. In September–October 2015, the wind changed direction to the western. At this time eastern boundary of the plume located to the north of the New Siberian Islands moved eastward and reached ~158° E.
On the contrary, in 2016, winds above Lena’s mouth were blowing from the northwest and the prevailing zonal component was eastward (Figure 5—right). Such winds move the plume to the south and press it to the coast. The accumulation of light brackish waters leads to a rise of sea level near the coast (see Figure 6b in Section 3.3) and the generation of eastward buoyant alongshore geostrophic currents. Southwest and west winds prevailing in August and September of 2016 provide an additional contribution to the «eastward» propagation of the plume. A similar effect of wind on the propagation of brackish waters was observed in the Kara Sea for the plume of the Ob and Yenisei Rivers [12,13].

3.3. Lena Plume Propagation from Satellite Altimetry and Temperature Measurements

River waters flowing into the Arctic seas in summer have a significantly higher temperature reaching up to 15° in summer months [19]. A decrease in salinity and an increase in temperature in the plume cause an increase in the volume of water due to the steric effect. An additional contribution to the sea level increase is provided by the inflow of a large volume of riverine waters. These factors give a possibility to determine the features of the propagation of the waters of the Lena River by SST and altimetry measurements.
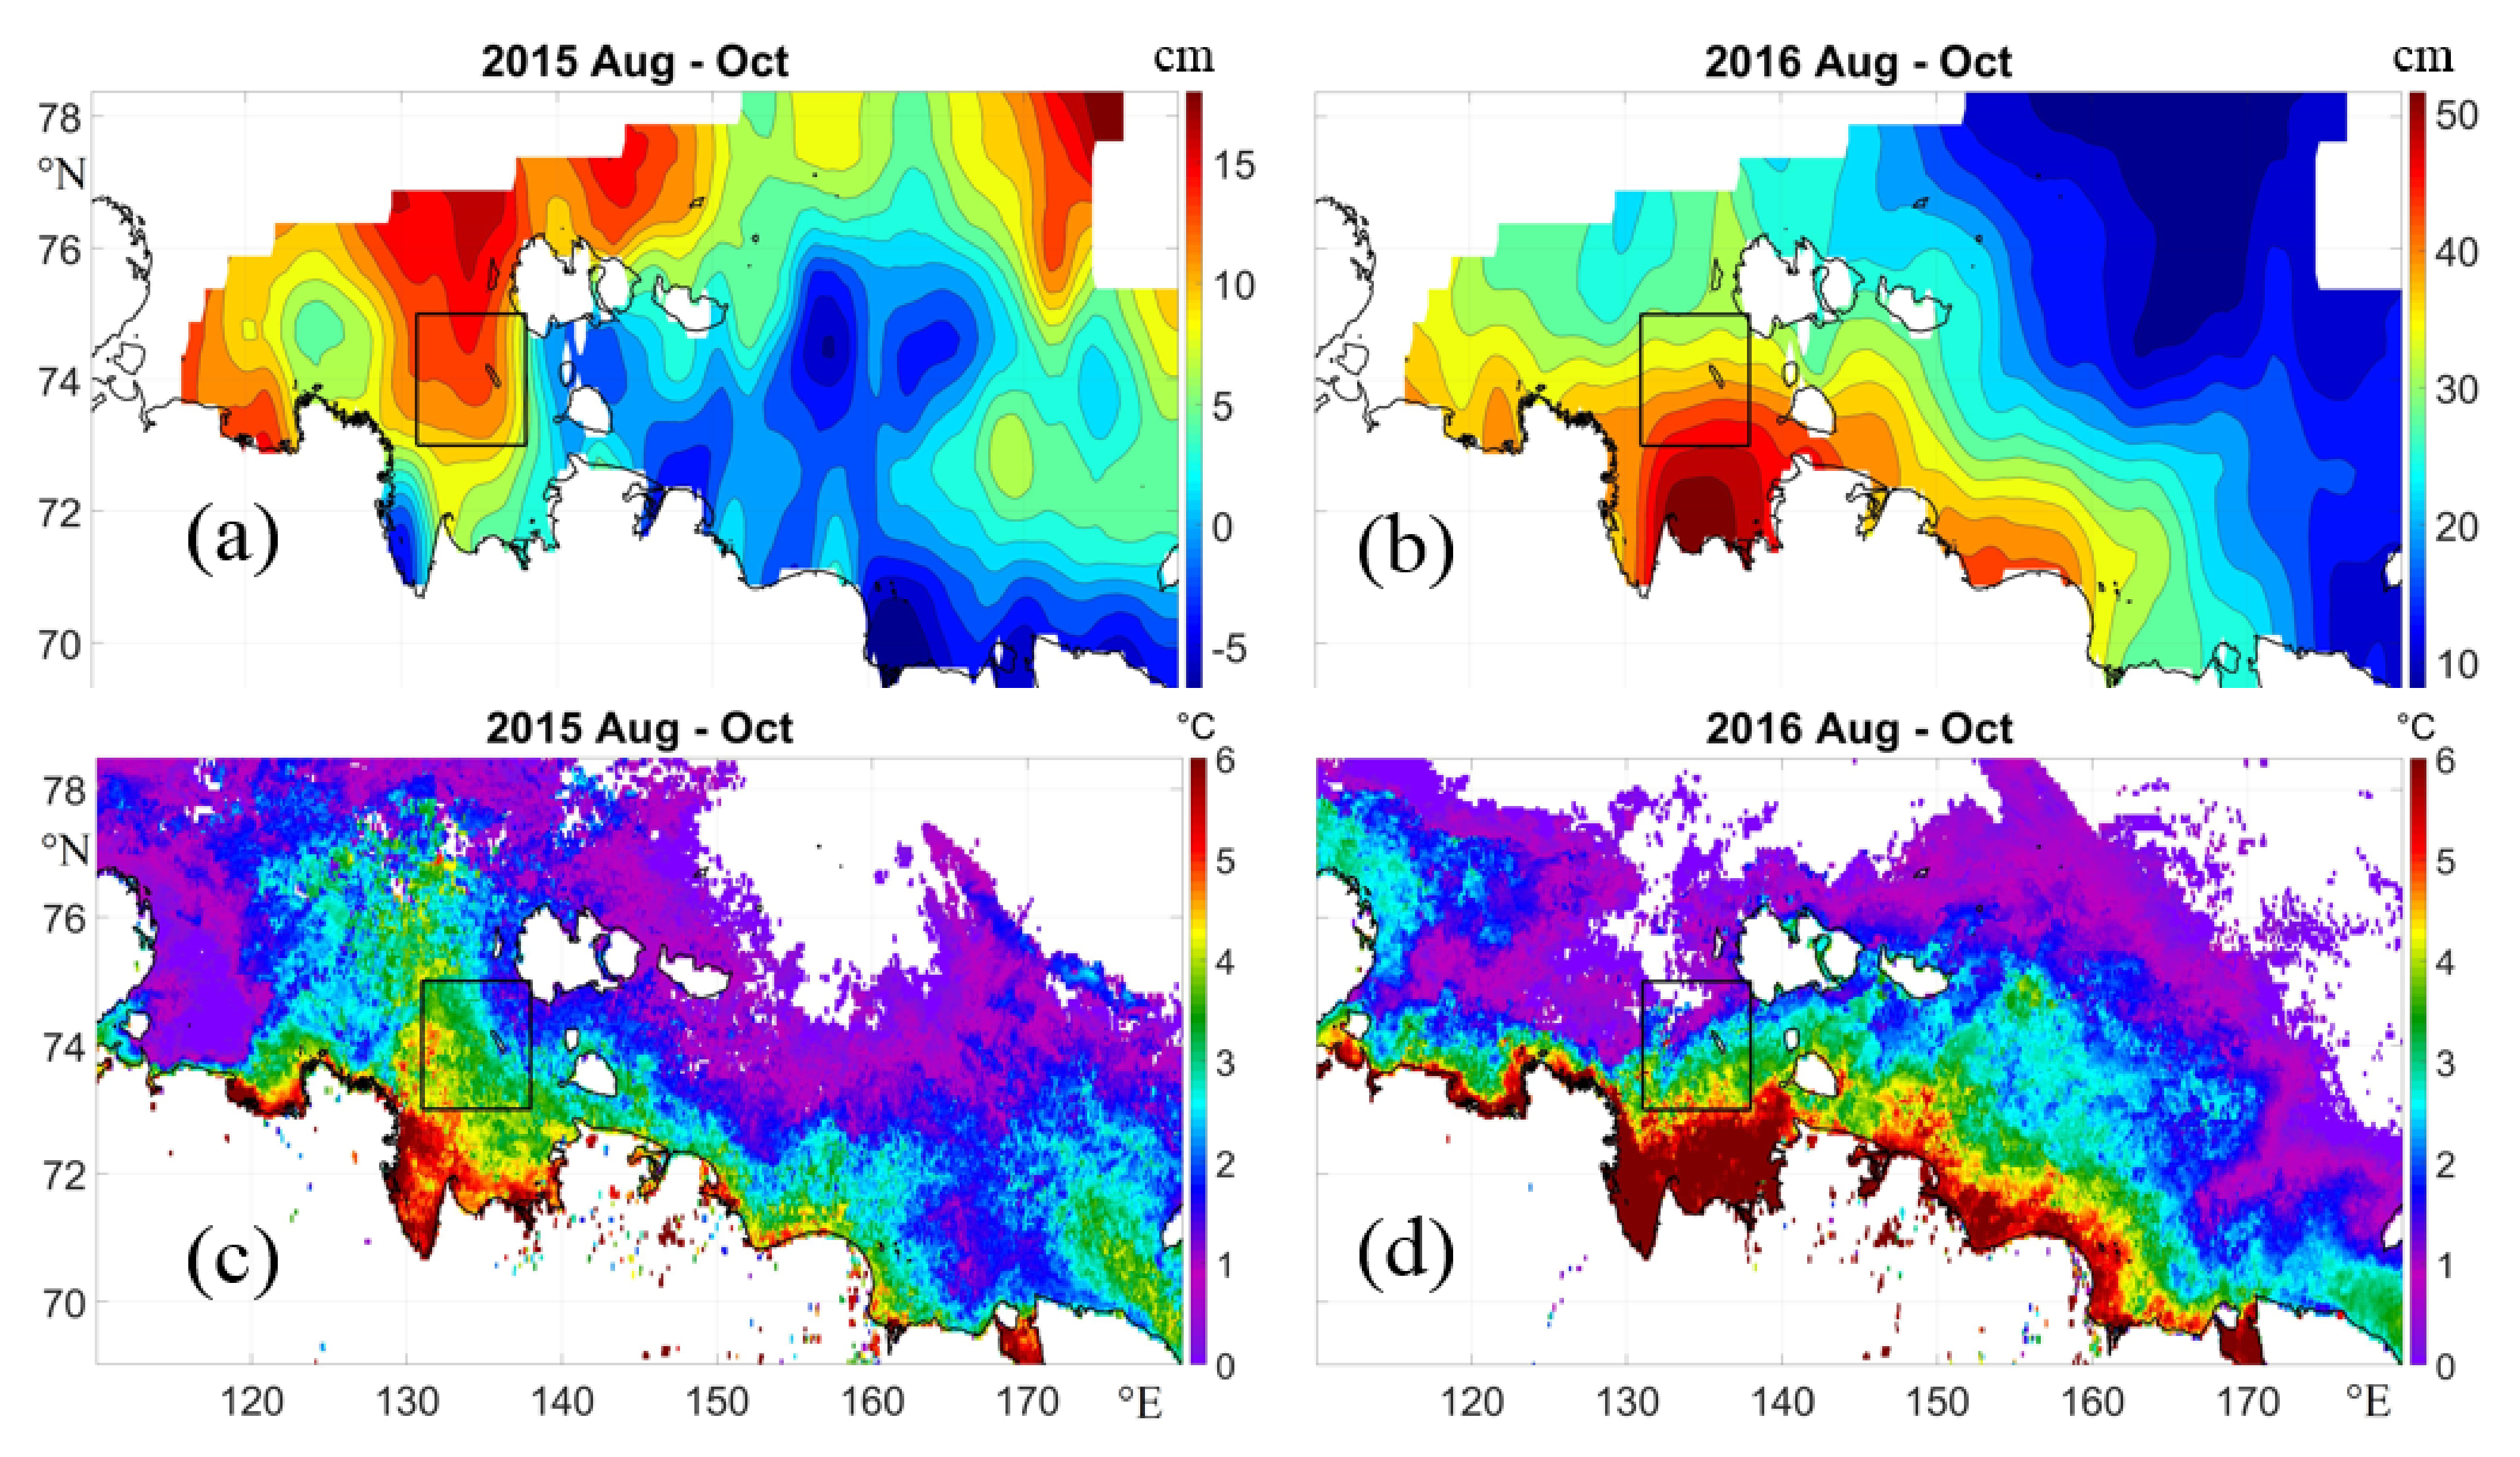
As an example, Figure 6 shows the averaged maps of SST and sea level for the ice-free period (August–October) in 2015 and 2016, when SMAP data detect the «northern» and «eastern» propagation of the plume, respectively.
It can clearly be seen that, in 2015, the warm area with SST > 3 °C extended from the mouth to the north on more than 400 km to 78° N. Its position coincides with the area of low salinity, indicating that the temperature rise is caused by the impact of the plume (Figure 6c). In 2016, during the «eastern» type, warm waters were not observed to the north of the Lena mouth (Figure 6d). In this year, warm waters with SST > 3° moved to the east and occupy most of the coastal zone in the East Siberian Sea. It should be noted that several mechanisms may impact the rise of SST in the plume. First, riverine waters are initially warmer than open sea waters [17,18,19,20,21]. Then, haline stratification increases the stability of the waters, making summer heating more effective (see, e.g., [33]). Additionally, plume waters with large concentrations of suspended matter more effectively absorb solar radiation [48]. All these mechanisms help to trace the plume in SST maps even at a large distance from the mouth.
Changes in sea level are related to the observed changes in temperature and salinity and well coincide with them. In 2015 during the «northern» type of propagation the highest sea level values are observed north of Lena’s mouth in the western part of the study area. At the same time, a sharp decrease in sea level near the coast of Eurasia at longitudes 140–180° was observed. Such features can be associated not only with the absence of brackish riverine waters but also with other dynamic effects. Particularly, stronger southeast winds in the years with “northern” propagation promote upwelling near the Russian coast [30]. Upwelling is caused by the offshore propagation of coastal waters, which also decreases the sea level during such years.
On the contrary, in 2016, with the “eastward” propagation an increased sea level is observed along the coast of the East Siberian Sea and the Laptev Sea (Figure 6b). Relative high values of sea level are observed up to 170° E. The waters with increased sea level and SST are pressed to the Eurasia coast and coincide well with the areas of decreased salinity.
The contribution of temperature and salinity to the steric sea level (hst) can be estimated as:
h s t = 0 H ρ p l u m e ρ s e a ρ s e a d z
Here, H is plume thickness, ρ p l u m e   and   ρ s e a are the density of the plume and surrounding sea waters. Roughly, we can take the following characteristics: plume thickness is H = 5 m, salinity S = 15 psu, temperature T = 6 °C, the salinity of the open sea is S = 30 psu, the temperature of the open sea is T = 2 °C. Then, the calculated hst will be ~ 12 cm. This estimate is close to the observed in Figure 7 difference of sea level between plume and surrounding waters.
To find the relationship between satellite-derived salinity, surface temperature, and absolute dynamic topography (ADT), scatter diagrams between these values were analyzed (Figure 7). For this purpose, the monthly maps of SST with 4 km resolution were averaged in 0.25° cell corresponded to the grid of SMAP data. Monthly maps of altimetry sea level have the same resolution as the SMAP data. Further, the data were compared at each grid point in the area near the mouth with coordinates 131–138° E, 73–75° N, marked with a rectangle in Figure 6. The results of comparison for 2015–2020 are shown in Table 1, and examples of scatterplots for 2015 and 2018 are shown in Figure 7.
In the brackish areas, a significant increase in the sea level is observed. A linear relationship between the sea level and salinity is clearly seen with fairly high correlation values for all years. The average coefficient of correlation is about −0.74 and in some years it reaches minus 0.85–0.89. In some years the correlations are lower, but they are also quite significant. For example, in 2019 they are about 0.55. The decrease in correlation may be related to the Sharp changes in the prevailing winds from the southeast in July to the north in August–September, which lead to a «mixed» type of plume propagation.
Warm river waters are also characterized by higher temperatures. However, the absolute values of the correlation of salinity with SST are somewhat lower than with sea level. On average, it is −0.66 and varies from −0.54 in 2015 to −0.82 in 2016. Slightly lower correlation values are caused by the significant influence of other factors, first of all, summer heat fluxes and wind mixing, which can significantly affect SST depending on meteorological conditions. Interannual variability of heating conditions linked, e.g., with ice cover variations also may impact the value of correlation. Additionally, summer heating should be more intense in the shallowest southern areas. This effect increases the coastal temperature even in years with «northern» type (Figure 6c). Therefore, the reliable indicator of the «northern» type on SST maps is significantly higher SST to the northwest of the New Siberian Islands and relatively low SST to the east of them in the northern East Siberian Sea.
Thus, the results of this subsection show that satellite measurements of sea level and SST gives a possibility to estimate the type of propagation of the Lena River plume.

3.4. Long-Term Variability of the Lena River Plume Propagation on the Base of Altimetry and Infrared Satellite Measurements

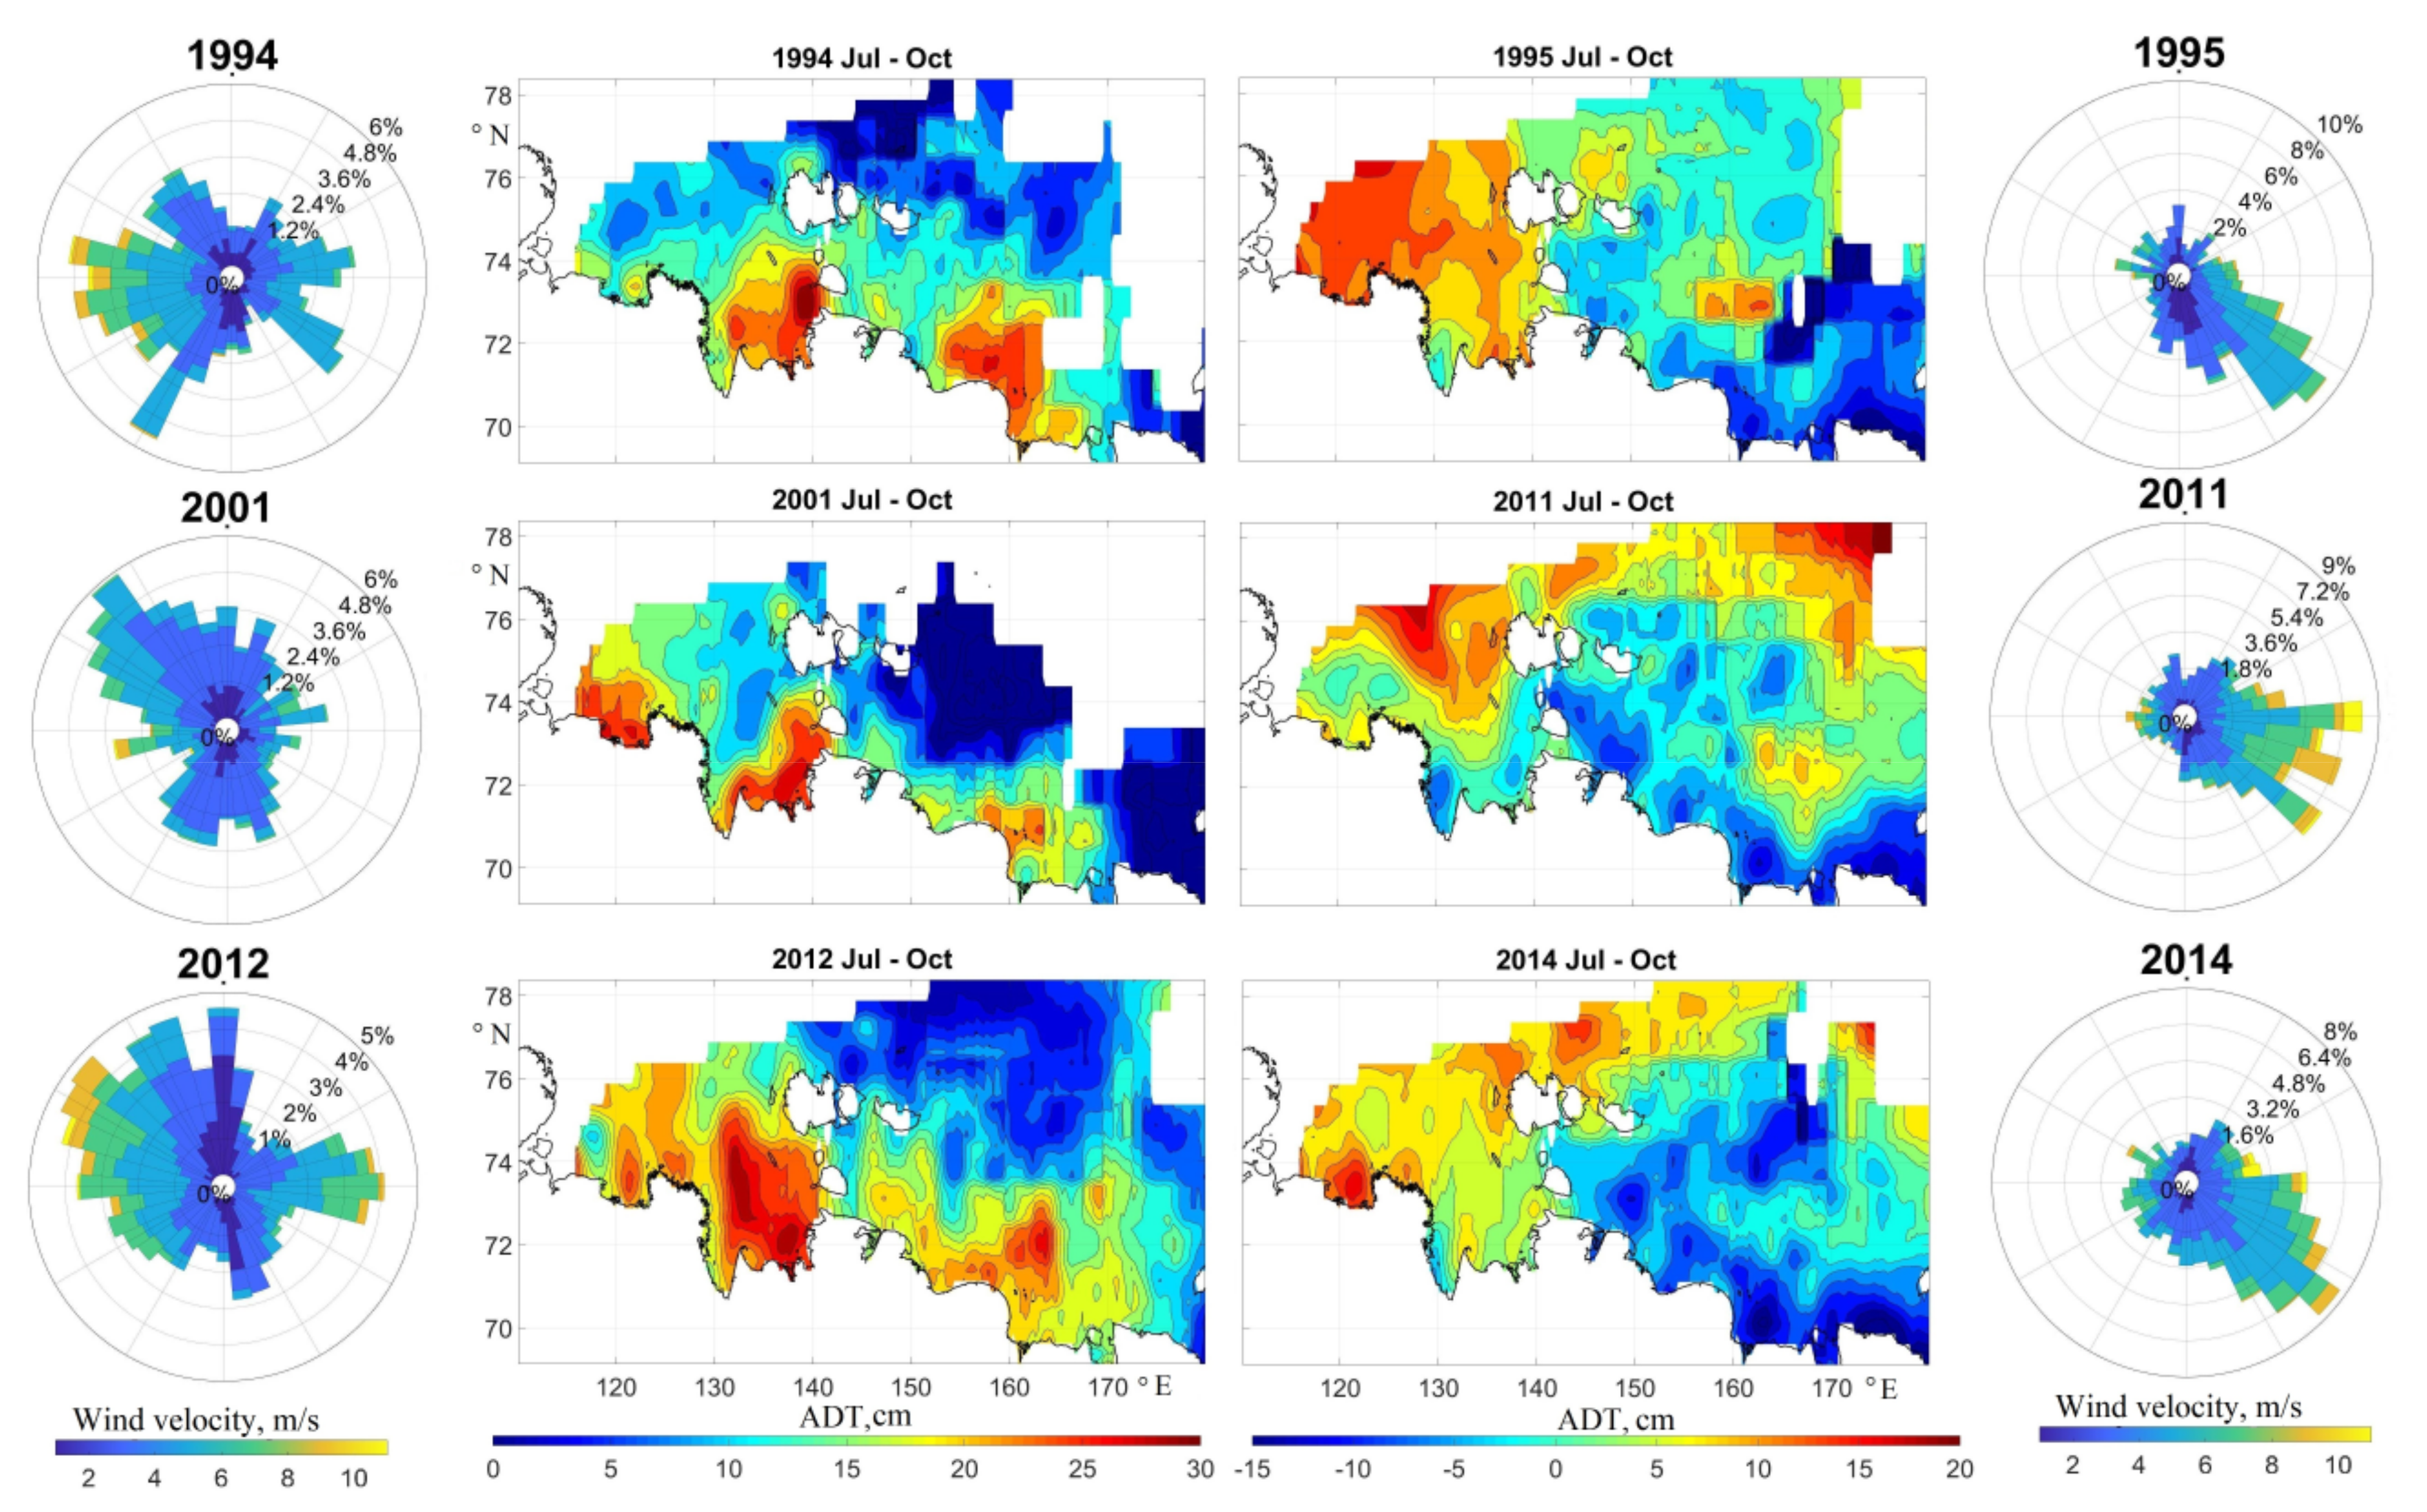
Highly accurate satellite altimetry data have been available since 1993, which makes it possible to study the interannual variability of Lena plume propagation for more than 25 years. Figure 8 shows examples of sea level maps for August of several years and corresponded wind roses for June–October of these years.
The maps on the left in Figure 8 clearly show an increase in the sea level near the coast of Siberia in 1994, 2001, and 2012, which makes it possible to identify the type of plume propagation as «eastern». In all of these years, the prevailing winds were northwest promoting the accumulation of the plume near the Russian coast. In 1994 and 2001, the plume reached 173° E and was limited from the north by the New Siberian Islands. In 2012, altimetry data revealed extremely strong eastward propagation. The largest values of sea level are observed in the south coastal part of the Laptev Sea and the East Siberian Sea. High values of sea level reached 175° E. At the same time in the northern part of the study region (north of 76° N) sea level decreases. In contrast to 1994 and 2001, it is not so strongly pressed to the coast, which can be explained by the presence of not only northwestern but also eastern winds promoting the «northen» type of propagation (see wind roses on the left side of Figure 8).
On the right panel of Figure 8, sea level has a significantly different distribution. The sea level is higher in the northern part of the Laptev Sea and it is lower near the coast of the East Siberian and the Laptev Seas. This makes it possible to identify this type as «northern». For example, in 1995 and 2014 positive level values were observed at longitudes 110–140° E. At these longitudes, they extend northward up to 76° N, which indicates the spread of the plume to these latitudes. At the same time, east of 140° E, the sea level decreased, which indicates the absence of the plume.
Even more intense displacement of the plume into the northern part of the Laptev Sea is observed in 2011. Sea level values below –20 cm occupy vast areas east of longitude 130° up to 220 km from the coast. In all the presented cases, this type is characterized by a predominance of southeasterly wind, which promotes the transport of the plume from the coast to the northern part of the Arctic Basin.
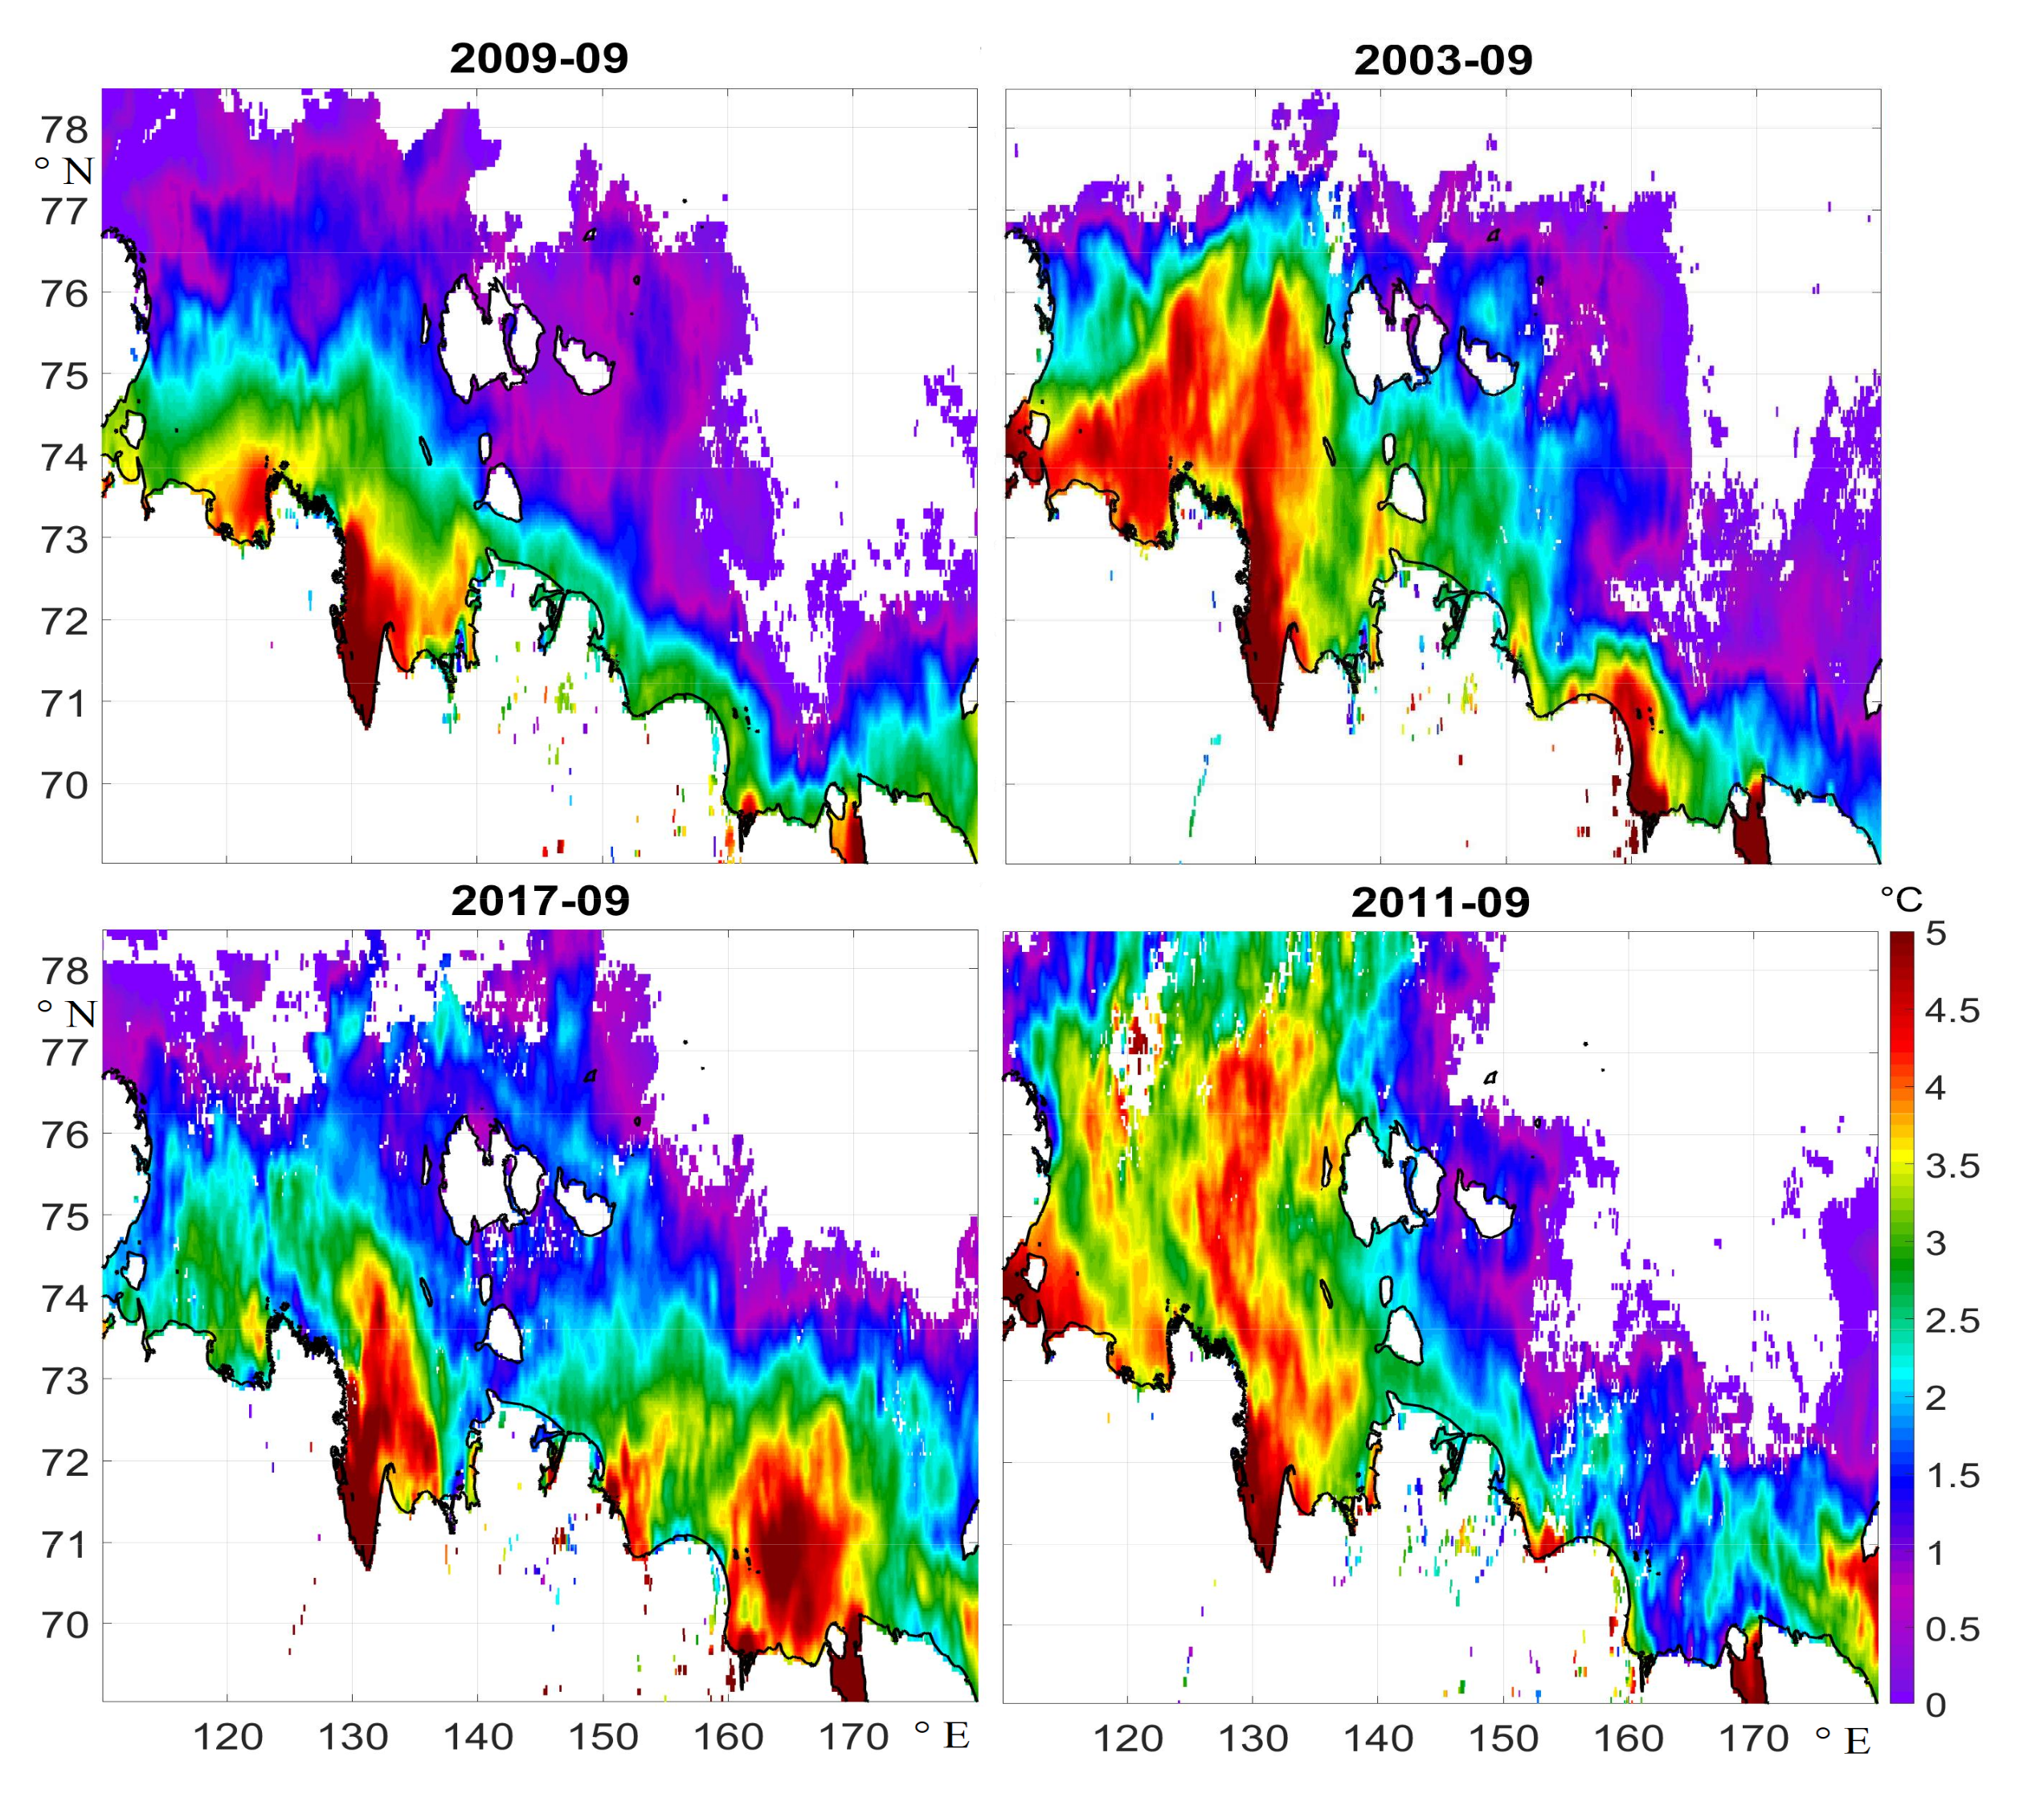
Similarly, Figure 9 demonstrates the ability to track the type of propagation of the brackish layer on the base of SST data. In years with the «eastern» type (2009, 2017), waters with increased SST are pressed to the coast. The warmest waters with temperatures over 3° are located south of the New Siberian Islands.
In years with the «northern» type (2003 and 2011), warm waters intensively move to the north rom the mouth of the Lena River. Waters with SST > 4° reach the New Siberian Islands and even higher latitudes up to 76.5–78° N. This maps demonstrate that the «northern» propagation of river waters can affect the heat balance in the central part of the Arctic basin and, particularly, may facilitate ice melting at high latitudes [23,48].
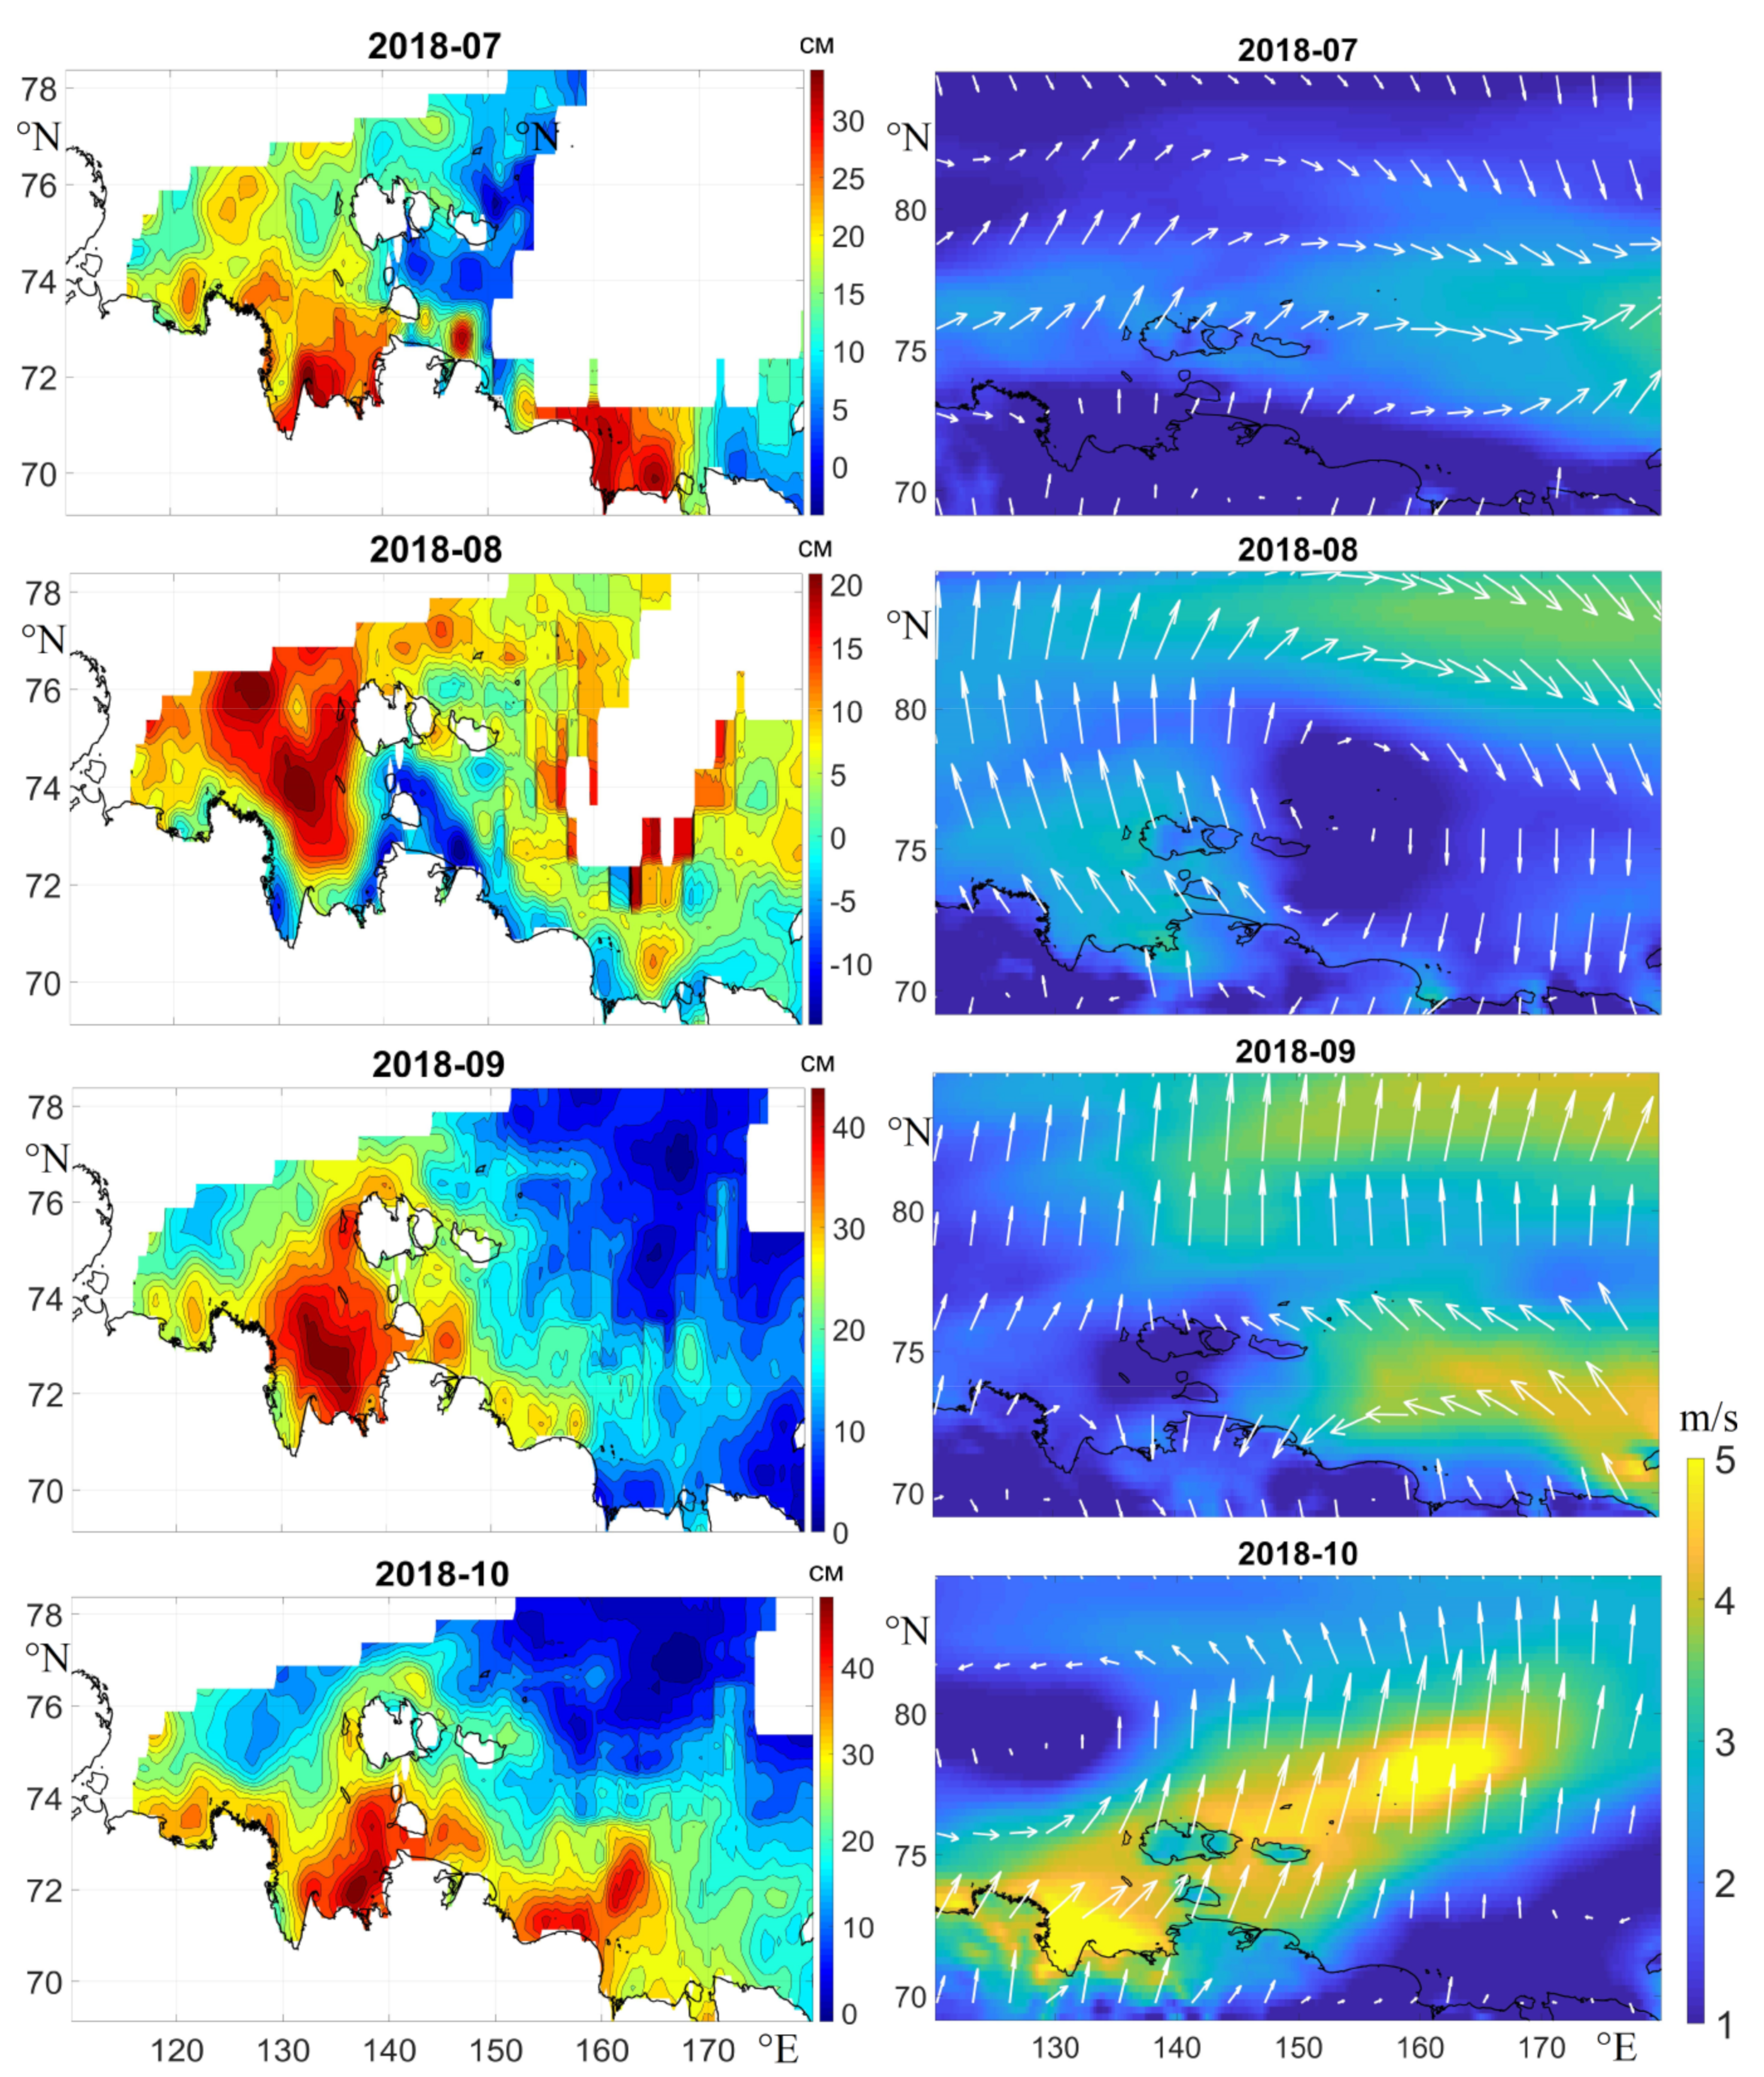
Satellite measurements also showed that in several years (1993, 2004, 2007, 2018, 2019), a «mixed» type of propagation is observed. A striking example of this type was observed in 2018 (Figure 3). Unfortunately, in this year a large part of the region was inaccessible for SSS measurements due to intense ice drift into the northeastern part of the study area (not shown). The penetration of floating ice into the footprint of the passive microwave imager distorts the information and makes it impossible to analyze the salinity field. However, the propagation of the river plume in this year can be investigated using altimetry measurements on Figure 10. Active microwave altimeters have a much higher resolution—7 km than the data of passive salinity measurements (40 km spot). That is why the effect of drifting ice on their coverage is not so strong. As a result, these instruments provide information on the position of the high sea level, related to the plume, over a longer period (from July to October) and with a much larger spatial coverage. In July 2018, the southwestern winds led to an initially «eastern» type of water propagation—the plume was pressed to the coast and high sea level values were observed near the Russian coast (Figure 10). However, in August, the south-westerly winds changed on southeast winds. These winds caused an upwelling and a decrease in the sea level off the Russian coast. At this time the increased sea level was concentrated to the north of the estuary. Thus, the «eastern» propagation, observed on the sea level maps in July, changed to the «northern» in August.The wind direction changed again to the southwestern in September–October, favoring the eastward movement of the plume. As a result, the plume, characterized by high sea level values, began to move eastward. In September 2018, its border reaches 160° E, and in October—170° E longitude. Thus, the total zone of influence of the plume reaches 77° N in the north and 170° E in the east. The same direction of propagation in 2018 was documented on the basis of in situ and satellite salinity data in [9]. Altimetry data make it possible to observe the rapid change of the plume propagation from August to September during «mixed» type, caused by the change in the direction of the dominant winds during the ice-free period of a year.
Analysis of the satellite altimetry measurements in 1993–2020 and SST data in 2003–2020 were used to estimate long-term interannual variability of the types of Lena plume propagation. The results obtained by infrared and altimetry measurements almost coincide (Table 2).
According to altimetry data (Table 2), the «northern» type of propagation of the Lena River plume is observed more often (14 of 28 years) than the «eastern» type (6 of 28 years). Recently the «eastern» type of propagation became more intense. Since 2012, the eastward plume boundary was observed up to longitude 170° E (2012, 2016–2017), and in some years it reaches 180° E (2019). At the same time, until 2010, the plume boundary reached only 169° E with maximum values in 2001–2002.
Analysis of the wind velocity variability over the Laptev Sea in the region of 125–150° E 68–80° N in June–October showed that the reliable indicator of the «eastern» type is the positive zonal wind component (red bars in Figure 11). Western and southwestern winds cause the transport of river waters to the east and are, apparently, the reasons for the most intense «eastern» propagation in 2001, 2012, 2016–2017. During «eastern» propagation salinity and density gradients in the coastal zone of the East Siberian Sea intensify eastward geostrophic currents and are apparently one of the important reasons for the intensification of the East Siberian Current. The results obtained in Table 2 indicate that an eastward extension of the Lena plume during the “eastern” type of propagation is observed in recent years. This process may intensify eastward thermohaline circulation in the coastal part of the East Siberian Sea and strengthen the East Siberian Current.
On the contrary, the dominance of the eastern and southeastern winds (blue bars in Figure 11) causes the «northern» type. During the «northern» type SMAP detects a significant increase in the salinity in the East Siberian Sea (Figure 3). This may be at least partly related to the intensification of the inflow of the Pacific waters in the Arctic ocean and their further spread to the west.
The wind direction above the Laptev Sea and the East Siberian Sea defines the direction of the plume propagation, which, in its turn, affects the thermohaline structure, sea level distribution and current intensity in the coastal part of the East Siberian Sea. Recent investigations [49,50,51] show that these dynamics characteristics may play an important role in the water exchange in the Bering Strait and modulation of the Pacific waters inflow to the Arctic Ocean.

4. Conclusions

In this paper, we, for the first time, investigate interannual variability of the propagation of the Lena plume for more than 25 years from 1993 to 2020 using satellite surface salinity measurements of SMAP, altimetry, and sea surface temperature data. This variability is in good agreement with previous works based on in situ and satellite measurements [9,10].
The comparison of the SMAP data with in situ measurements of salinity, obtained in several expeditions of the IO RAS in 2018–2019, showed sufficient accuracy of satellite measurements. The correlation coefficient between satellite and in situ data is ~ 0.96, and the RMSD is less than 1 psu. This comparison demonstrated that SMAP satellite data can be effectively used to identify areas of river plume whose salinity is several psu lower than that of the open sea.
The characteristics of interannual variability and propagation of Lena plume in 2015–2020 were determined using satellite salinity measurements. Three main types of plume propagation were identified: «northern», «eastern» and «mixed». During the «eastern» type, which was observed in 2016 and 2017, the river plume move is pressed to the coast of Eurasia and moves to the east in the form of an alongshore jet, reaching sometimes 180° E. During «northern» type (2015 and 2020), the plume moves to the north from the mouth up to 78° N, and then turns eastward to the north of the New Siberian Islands. Such different types of propagation significantly affect the salinity of the coastal part of the East Siberian Sea, which decreases during the «eastern» type and increases during the «northern» type.
It is shown that the observed type of propagation depends on wind forcing in agreement with previous studies [8,24,25,26,27,28], mainly on the direction of dominant zonal wind above the Laptev Sea. Eastern winds block the plume propagation to the east and press the plume to the Lena mouth. In this case, wind-driven currents and buoyant plume circulation cause the northward transport of the plume from the mouth. On the contrast, western winds press the plume to the coast. Accumulated brackish waters establish an eastward buoyant current, which transports the plume along the shore to the east.
In some years a «mixed» type of propagation is observed. In these years the plume is observed both to the north and to the east from the mouth. Such complex propagation is caused by a sharp change in the direction of the dominant winds during the warm period of a year. Such propagation pattern was observed in 2018 and 2019.
Comparison of SMAP salinity measurements with sea level and SST data showed that altimetry and infrared measurements can be effectively used to determine the types of river plume propagation. Plume waters are characterized by higher temperatures and lower density. Steric effects and intense river inflow lead to sea level rise in the plume area. As a result, significant negative correlations are observed between salinity and distribution of temperature and sea level in the Laptev Sea for all types of propagation. The «eastern» type of propagation leads to an increase in the sea level and SST in the coastal part of Eurasia in the Laptev Sea and the East Siberian Sea. The «northern» type causes an increase in the sea level and significant warming of the sea surface to the north of the Lena mouth.
These indirect measurements have several advantages over satellite salinity measurements. Primarily, temperature and level data are available for a much longer period. In addition, these data have a significantly higher spatial resolution. SST data have a resolution of about 4 km but are not available in the presence of cloud cover, which is extremely high in the Arctic regions. In contrast, cloudiness does not interfer active microwave altimetry measurements. Altimetry data have an along-track resolution of about 7 km, which is much higher than the SMAP spot area (40 km). This advantage is especially important in Arctic regions partly covered by ice. When floating ice gets into the measurement spot, the data of passive microwave radiometers can be significantly distorted and discarded from the analysis. As a result salinity data are practically unavailable during the period of partial ice cover–ice melting (May–July) and freezing periods (November). Altimeter data provide much more information about the propagation of plume in these months when its propagation is quite intensive (see an example in Figure 10).
Using the obtained relationship we determine the types of propagation of the Lena plume on the base of altimetry data in 1993–2020 and SST measurements in 2002–2020. The results showed that the «northern» type of propagation is observed about 2 times more often than the «eastern» one. However, since 2012, we detect an increase in the maximum eastward extension of the plume, which reached longitude 170° and even 180° in 2019. Such a change in the propagation of brackish riverine waters may significantly affect the thermohaline structure and ecosystem of the coastal East Siberian Sea.

Author Contributions

Conceptualization, V.R.Z. and A.A.K.; methodology, V.R.Z. and A.A.K.; validation, V.R.Z.; formal analysis, V.R.Z.; investigation, V.R.Z. and A.A.K.; writing—original draft preparation, V.R.Z.; writing—review and editing, A.A.K.; visualization, V.R.Z.; supervision, A.A.K. All authors have read and agreed to the published version of the manuscript.

Funding

The analysis of the Lena plume dynamics was supported by the Russian Science Foundation grant 21-17-00278. The analysis of sea surface salinity in the Laptev Sea was supported by the Russian Science Foundation grant 22-27-00797. Data acquisition and analysis were supported by state assignments 0555-2021-0006 and 075-00429-21-03.

Data Availability Statement

Satellite data used in this study are freely available. SMAP sea surface salinity (SSS) V4.0 dataset was downloaded from http://remss.com/missions/smap/salinity/. The gridded altimetry data (product identifier: SEALEVEL_GLO_PHY_L4_REP_OBSERVATIONS_088_047) was obtained from the Copernicus Marine Environmental Monitoring Service (CMEMS). MODIS Level 3 daily sea surface temperature (SST) was downloaded from the OceanColor data archive (http://oceancolor.gsfc.nasa.gov/). Data on the wind velocity at 10 m height was obtained from the Era-5 reanalysis from Copernicus Climate Data Store https://cds.climate.copernicus.eu/. In situ data on surface salinity were obtained and provided by Dr. Osadchiev, Shirshov Institute of Oceanology of Russian Academy of Sciences (IO RAS).

Acknowledgments

We would like to respectfully thank Alexander Osadchiev for providing the in situ data on surface salinity, contributing to the validation of SMAP data, and providing valuable discussion which helped to improve the manuscript.

Conflicts of Interest

The authors declare no conflict of interest.

References

  1. Haine, T.W.; Curry, B.; Gerdes, R.; Hansen, E.; Karcher, M.; Lee, C.; Rudels, B.; Spreen, G.; de Steur, L.; Stewart, K.D.; et al. Arctic freshwater export: Status, mechanisms, and prospects. Glob. Planet. Change 2015, 125, 13–35. [Google Scholar] [CrossRef] [Green Version]
  2. Nummelin, A.; Ilicak, M.; Li, C.; Smedsrud, L.H. Consequences of future increased Arctic runoff on Arctic Ocean stratification, circulation, and sea ice cover. J. Geophys. Res. Oceans 2016, 121, 617–637. [Google Scholar] [CrossRef] [Green Version]
  3. Carmack, E.C.; Yamamoto-Kawai, M.; Haine, T.W.N.; Bacon, S.; Bluhm, B.A.; Lique, C.; Melling, H.; Polyakov, I.V.; Straneo, F.; Timmermans, M.-L.; et al. Freshwater and its role in the Arctic Marine System: Sources, disposition, storage, export, and physical and biogeochemical consequences in the Arctic and global oceans. J. Geophys. Res. Biogeosci. 2016, 121, 675–717. [Google Scholar] [CrossRef]
  4. Aagaard, K.; Carmack, E. The Role of Sea Ice and Other Fresh Water in the Arctic Circulation. J. Geophys. Res. Ocean. 1989, 94, 14485–14498. [Google Scholar] [CrossRef]
  5. Gordeev, V.V.; Martin, J.M.; Sidorov, J.S.; Sidorova, M.V. A reassessment of the Eurasian river input of water, sediment, major elements, and nutrients to the Arctic Ocean. J. Geophys. Atmos. 1996, 296, 664–691. [Google Scholar] [CrossRef]
  6. Bryzgalo, V.A.; Nikanor, A.M.; Kosmenko, L.S.; Reshetnyak, O.S. Estuarine Ecosystem of Major Rivers in Russia: Anthropogenic Load and the Ecological State: Monograph; Publishing House of the Southern Federal University: Rostov, Russia, 2015; p. 46. (In Russian) [Google Scholar]
  7. Osadchiev, A.A.; Pisareva, M.N.; Spivak, E.A.; Shchuka, S.A.; Semiletov, I.P. Freshwater transport between the Kara, Laptev, and East-Siberian sea. Sci. Rep. 2020, 10, 13041. [Google Scholar] [CrossRef]
  8. Dmitrenko, I.A.; Kirillov, S.A.; Krumpen, T.; Makhotin, M.; Abrahamsen, E.P.; Willmes, S.; Bloshkina, E.; Holemann, J.A.; Kassens, H.; Wegner, C. Wind-driven diversion of summer river runoff preconditions the Laptev Sea coastal polynya hydrography: Evidence from summer-to-winter hydrographic records of 2007–2009. Cont. Shelf Res. 2010, 30, 1656–1664. [Google Scholar] [CrossRef]
  9. Tarasenko, A.; Supply, A.; Kusse-Tiuz, N.; Ivanov, V.; Makhotin, M.; Tournadre, J.; Chapron, B.; Boutin, J.; Kolodziejczyk, N.; Reverdin, G. Properties of surface water masses in the Laptev and the East Siberian seas in summer 2018 from in situ and satellite data. Ocean Sci. 2021, 17, 221–247. [Google Scholar] [CrossRef]
  10. Janout, M.A.; Hölemann, J.; Laukert, G.; Smirnov, A.; Krumpen, T.; Bauch, D.; Timokhov, L. On the Variability of Stratification in the Freshwater-Influenced Laptev Sea Region. Front. Mar. Sci. 2020, 7, 543489. [Google Scholar] [CrossRef]
  11. Fofonova, V.; Danilov, S.; Androsov, A.; Janout, M.; Bauer, M.; Overduin, P.; Itkin, P.; Wiltshire, K.H. Impact of wind and tides on the Lena River freshwater plume dynamics in the summer sea. Ocean Dyn. 2015, 65, 951–968. [Google Scholar] [CrossRef]
  12. Kubryakov, A.A.; Stanichny, S.V.; Zatsepin, A.G. River plume dynamics in the Kara Sea from altimetry-based lagrangian model, satellite salinity and chlorophyll data. Remote. Sens. Environ. 2016, 176, 177–187. [Google Scholar] [CrossRef]
  13. Zatsepin, A.G.; Kremenetsky, V.V.; Kubryakov, A.A.; Stanichny, S.V.; Soloviev, D.M. Propagation and transformation of water surface desalinated layer in the Kara Sea. Oceanology 2015, 55, 502. [Google Scholar] [CrossRef]
  14. Kattner, G.; Lobbes, J.M.; Fitznar, H.P.; Engbrodt, R.; Nöthig, E.M.; Lara, R.J. Tracing dissolved organic substances and nutrients from the Lena River through Laptev Sea (Arctic). Mar. Chem. 1999, 65, 25–39. [Google Scholar] [CrossRef]
  15. Loginova, A.N. Chromophoric Dissolved Organic Matter in the Laptev Sea (SiberianArctic): A Comparison of In-Situ Observations, Laboratory Measurements, and Remote Sensing. Ph.D. Thesis, Saint Petersburg State University, Saint Petersburg, Russia, University of Hamburg, Hamburg, Germany, 2011; 98p. [Google Scholar]
  16. Sukhanova, I.N.; Flint, M.V.; Georgieva, E.J.; Lange, E.K.; Kravchishina, M.D.; Demidov, A.B.; Nedospasov, A.A.; Polukhin, A.A. The structure of phytoplankton communities in the eastern part of the Laptev Sea. Oceanology 2017, 57, 75–90. [Google Scholar] [CrossRef]
  17. Park, H.; Yoshikawa, Y.; Yang, D.; Oshima, K. Warming water in Arctic terrestrial rivers under climate change. J. Hydrometeorol. 2017, 18, 1983–1995. [Google Scholar] [CrossRef]
  18. Magritsky, D.V.; Frolova, N.L.; Evstigneev, V.M.; Povalishnikova, E.S.; Kireeva, M.B.; Pakhomova, O.M. Long-term changes of river water inflow into the seas of the Russian Arctic sector. Polarforsch. Bremerhav. Alfred Wegener Inst. Polar Mar. Res. 2018, 87, 177–194. [Google Scholar] [CrossRef]
  19. Lammers, R.B.; Pundsack, J.W.; Shiklomanov, A.I. Variability in river temperature, discharge, and energy flux from the Russian pan-Arctic landmass. J. Geophys. Res. Biogeosci. 2007, 112, 1–15. [Google Scholar] [CrossRef] [Green Version]
  20. Kraineva, M.V.; Malakhova, V.V.; Golubeva, E.N. Numerical simulation of forming temperature anomalies in the Laptev Sea. Bull. Novosib. Comput. Cent. Ser. Numer. Model. Atmos. Ocean. Environ. Stud. 2014, 14, 27–34. [Google Scholar]
  21. Kraineva, M.V.; Malakhova, V.V.; Golubeva, E.N. Numerical modeling of the formation of temperature anomalies in the Laptev Sea caused by the flow of the Lena River. Opt. Atmos. Ocean. 2015, 28, 534–539. [Google Scholar] [CrossRef]
  22. Park, H.; Watanabe, E.; Kim, Y.; Polyakov, I.; Oshima, K.; Zhang, X.; Kimball, J.S.; Yang, D. Increasing riverine heat influx triggers Arctic sea ice decline and oceanic and atmospheric warming. Sci. Adv. 2020, 6, Eabc4699. [Google Scholar] [CrossRef]
  23. Nghiem, S.V.; Hall, D.K.; Rigor, I.G.; Li, P.; Neumann, G. Effects of Mackenzie River discharge and bathymetryon sea ice in the Beaufort Sea. Geophys. Res. Lett. 2014, 41, 873–879. [Google Scholar] [CrossRef] [Green Version]
  24. Dmitrenko, I.; Kirillov, S.; Eicken, H.; Markova, N. Wind-driven summer surface hydrography of the eastern Siberian shelf. Geophys. Res. Lett. 2005, 32, 14. [Google Scholar] [CrossRef] [Green Version]
  25. Dmitrenko, I.; Kirillov, S.; Tremblay, L.B. The long-term and interannual variability of summer fresh water storage over the eastern Siberian shelf: Implication for climatic change. J. Geophys. Res. 2008, 113, C03007. [Google Scholar] [CrossRef] [Green Version]
  26. Guay, C.K.; Falkner, K.; Muench, R.D.; Mensch, M.; Frank, M.; Bayer, R. Wind-driven transport pathways for Eurasian Arctic river discharge. J. Geophys. Res. 2001, 106, 11469–11480. [Google Scholar] [CrossRef]
  27. Golubeva, E.; Platov, G.; Malakhova, V.; Kraineva, M.; Iakshina, D. Modelling the long-term and inter-annual variability in the Laptev Sea hydrography and subsea permafrost state. Polarforsch. 2017, 87, 195–210. [Google Scholar] [CrossRef]
  28. Golubeva, E.; Platov, G.; Malakhova, V.; Iakshina, D.; Kraineva, M. Modeling the impact of the Lena River on the Laptev Sea summer hydrography and submarine permafrost state. Bull. Novosib. Comput. Center. Ser. Numer. Model. Atmos. Ocean. Environ. Stud. 2015, 15, 13–22. [Google Scholar]
  29. Kubryakov, A.A.; Kozlov, I.E.; Manucharyan, G.E. Large mesoscale eddies in the Western Arctic Ocean from satellite altimetry measurements. J. Geophys. Res. Ocean. 2021, 126, e2020JC016. [Google Scholar] [CrossRef]
  30. Osadchiev, A.; Silvestrova, K.; Myslenkov, S. Wind-Driven Coastal Upwelling near Large River Deltas in the Laptev and East-Siberian Seas. Remote Sens. 2020, 12, 844. [Google Scholar] [CrossRef] [Green Version]
  31. Janout, M.A.; Aksenov, Y.; Hölemann, J.A.; Rabe, B.; Schauer, U.; Polyakov, I.V.; Bacon, S.; Coward, A.C.; Karcher, M.; Lenn, Y.-D.; et al. Kara Sea freshwater transport through VilkitskyStrait: Variability, forcing, and furtherpathways toward the western ArcticOcean from a model and observations. J. Geophys. Res. Oceans 2015, 120, 4925–4944. [Google Scholar] [CrossRef]
  32. Makkaveev, P.N.; Polukhin, A.A.; Shchuka, S.A.; Stepanova, S.V. Transport of Continental Runoff Through the Vilkitskiy Strait in September 2017 and 2018. Oceanology 2020, 60, 308–315. [Google Scholar] [CrossRef]
  33. Osadchiev, A.A.; Frey, D.I.; Shchuka, S.A.; Tilinina, N.D.; Morozov, E.G.; Zavialov, P.O. Structure of the freshened surface layer in the Kara Sea during ice-free periods. J. Geophys. Res. Oceans 2021, 126, e2020JC016486. [Google Scholar] [CrossRef]
  34. Glukhovets, D.I.; Artemiev, V.A. Satellite observations of the river runoff distribution in the Laptev Sea. Mod. Probl. Remote Sens.Earth Space 2017, 14, 175–184. [Google Scholar] [CrossRef]
  35. Kwok, R.; Cunningham, G.F.; Wensnahan, M.; Rigor, I.; Zwally, H.J.; Yi, D. Thinning and volume loss of the Arctic Ocean sea ice cover: 2003–2008. J. Geophys. Res. 2009, 114, C07005. [Google Scholar] [CrossRef]
  36. Druckenmiller, M.L.; Moon, T.A.; Thoman, R.L.; Ballinger, T.J.; Berner, L.T.; Bernhard, G.H.; Bhatt, U.S.; Bjerke, J.W.; Box, J.E.; Brown, R.; et al. The Arctic. Bull. Amer. Meteor. Soc. 2021, 102, S263–S315. [Google Scholar] [CrossRef]
  37. Fournier, S.; Lee, T.; Tang, W.; Steele, M.; Olmedo, E. Evaluation and intercomparison of SMOS, Aquarius, and SMAP sea surface salinity products in the Arctic Ocean. Remote Sens. 2019, 11, 3043. [Google Scholar] [CrossRef] [Green Version]
  38. Meissner, T.; Wentz, F.J.; Manaster, A.; Lindsle, R. Remote Sensing Systems SMAP Ocean Surface Salinities [Level 2C, Level 3 Running 8-Day, Level 3 Monthly]; Version 4.0 Validated Release; Remote Sensing Systems: Santa Rosa, CA, USA, 2019. [Google Scholar] [CrossRef]
  39. Rio, M.H.; Mulet, S.; Picot, N. New global Mean Dynamic Topography from a GOCE geoid model, altimeter measurements and oceanographic in-situ data. In Proceedings of the ESA Living Planet Symposium, Edinburgh, UK, 9–13 September 2013. ESA SP-722. [Google Scholar]
  40. Le Traon, P.Y.; Nadal, F.; Ducet, N. An improved mapping method of multisatellite altimeter data. J. Atmos. Ocean. Technol. 1998, 15, 522–534. [Google Scholar] [CrossRef]
  41. Pascual, A.; Faugere, Y.; Larnicol, G.; Le Traon, P.-Y. Improved description of the ocean mesoscale variability by combining four satellite altimeters. Geophys. Res. Lett. 2006, 33. [Google Scholar] [CrossRef] [Green Version]
  42. Volkov, D.L.; Pujol, M.-I. Quality assessment of a satellite altimetry data product in the Nordic, Barents, and Kara seas. J. Geophys. Res. 2012, 117, C03025. [Google Scholar] [CrossRef] [Green Version]
  43. Naumov, L.; Gordeeva, S.; Belonenko, T. Quality assessment of a satellite altimetry data product DT18 in the Norwegian Sea: A comparison to tide gauge records and drifters data. Adv. Space Res. 2021, 68, 432–446. [Google Scholar] [CrossRef]
  44. Minnett, P.; Evans, R.; Kearns, E.; Brown, O. Sea-surface temperature measured by the Moderate Resolution Imaging Spectroradiometer (MODIS). In Proceedings of the IEEE International Geoscience and Remote Sensing Symposium, Toronto, ON, Canada, 24–28 June 2002; Volume 2, pp. 1177–1179. [Google Scholar]
  45. Hersbach, H.; Bell, B.; Berrisford, P.; Hirahara, S.; Horányi, A.; Muñoz-Sabater, J.; Nicolas, J.; Peubey, C.; Radu, R.; Schepers, D.; et al. The ERA5 Reanalysis. Quart. J. Roy. Meteorol. Soc. 2020, 146, 1999–2049. [Google Scholar] [CrossRef]
  46. Domanitsky, A.P.; Dubrovina, R.G.; Isaeva, A.I. The Rivers and Lakes of the Soviet Union; Reference Data; Gidrometeoizdat: Leningrad, USSR, 1971. (In Russian) [Google Scholar]
  47. Pavlov, V.K.; Timokhov, L.A.; Baskakov, G.A.; Kulakov, M.Y.; Kurazhov, V.K.; Pavlov, P.V.; Pivovarov, S.V.; Stanovoy, V.V. Hydrometeorological Regime of the Kara, Laptev, and East-Siberian Seas; University of Washington: Washington, DC, USA, 1996. [Google Scholar]
  48. Bauch, D.; Hölemann, J.A.; Nikulina, A.; Wegner, C.; Janout, M.A.; Timokhov, L.A.; Kassens, H. Correlation of river water and local sea-ice melting on the Laptev Sea shelf (Siberian Arctic). J. Geophys. Res. Oceans 2013, 118, 550–561. [Google Scholar] [CrossRef] [Green Version]
  49. Peralta-Ferriz, C.; Woodgate, R.A. The dominant role of the East Siberian Sea in driving the oceanic flow through the Bering Strait—Conclusions from GRACE ocean mass satellite data and in situ mooring observations between 2002 and 2016. Geophys. Res. Lett. 2017, 44, 11472–11481. [Google Scholar] [CrossRef]
  50. Nguyen, A.T.; Woodgate, R.A.; Heimbach, P. Elucidating large-scale atmospheric controls on Bering Strait throughflow variability using a data-constrained ocean model and its adjoint. J. Geophys. Res. Ocean. 2020, 125, 9. [Google Scholar] [CrossRef]
  51. Zhuk, V.R.; Kubryakov, A.A. Impact of the Eastern Siberian current on water exchange in the Bering strait on the base of satellite altimetry measurements. Oceanology 2021, in press. [Google Scholar]
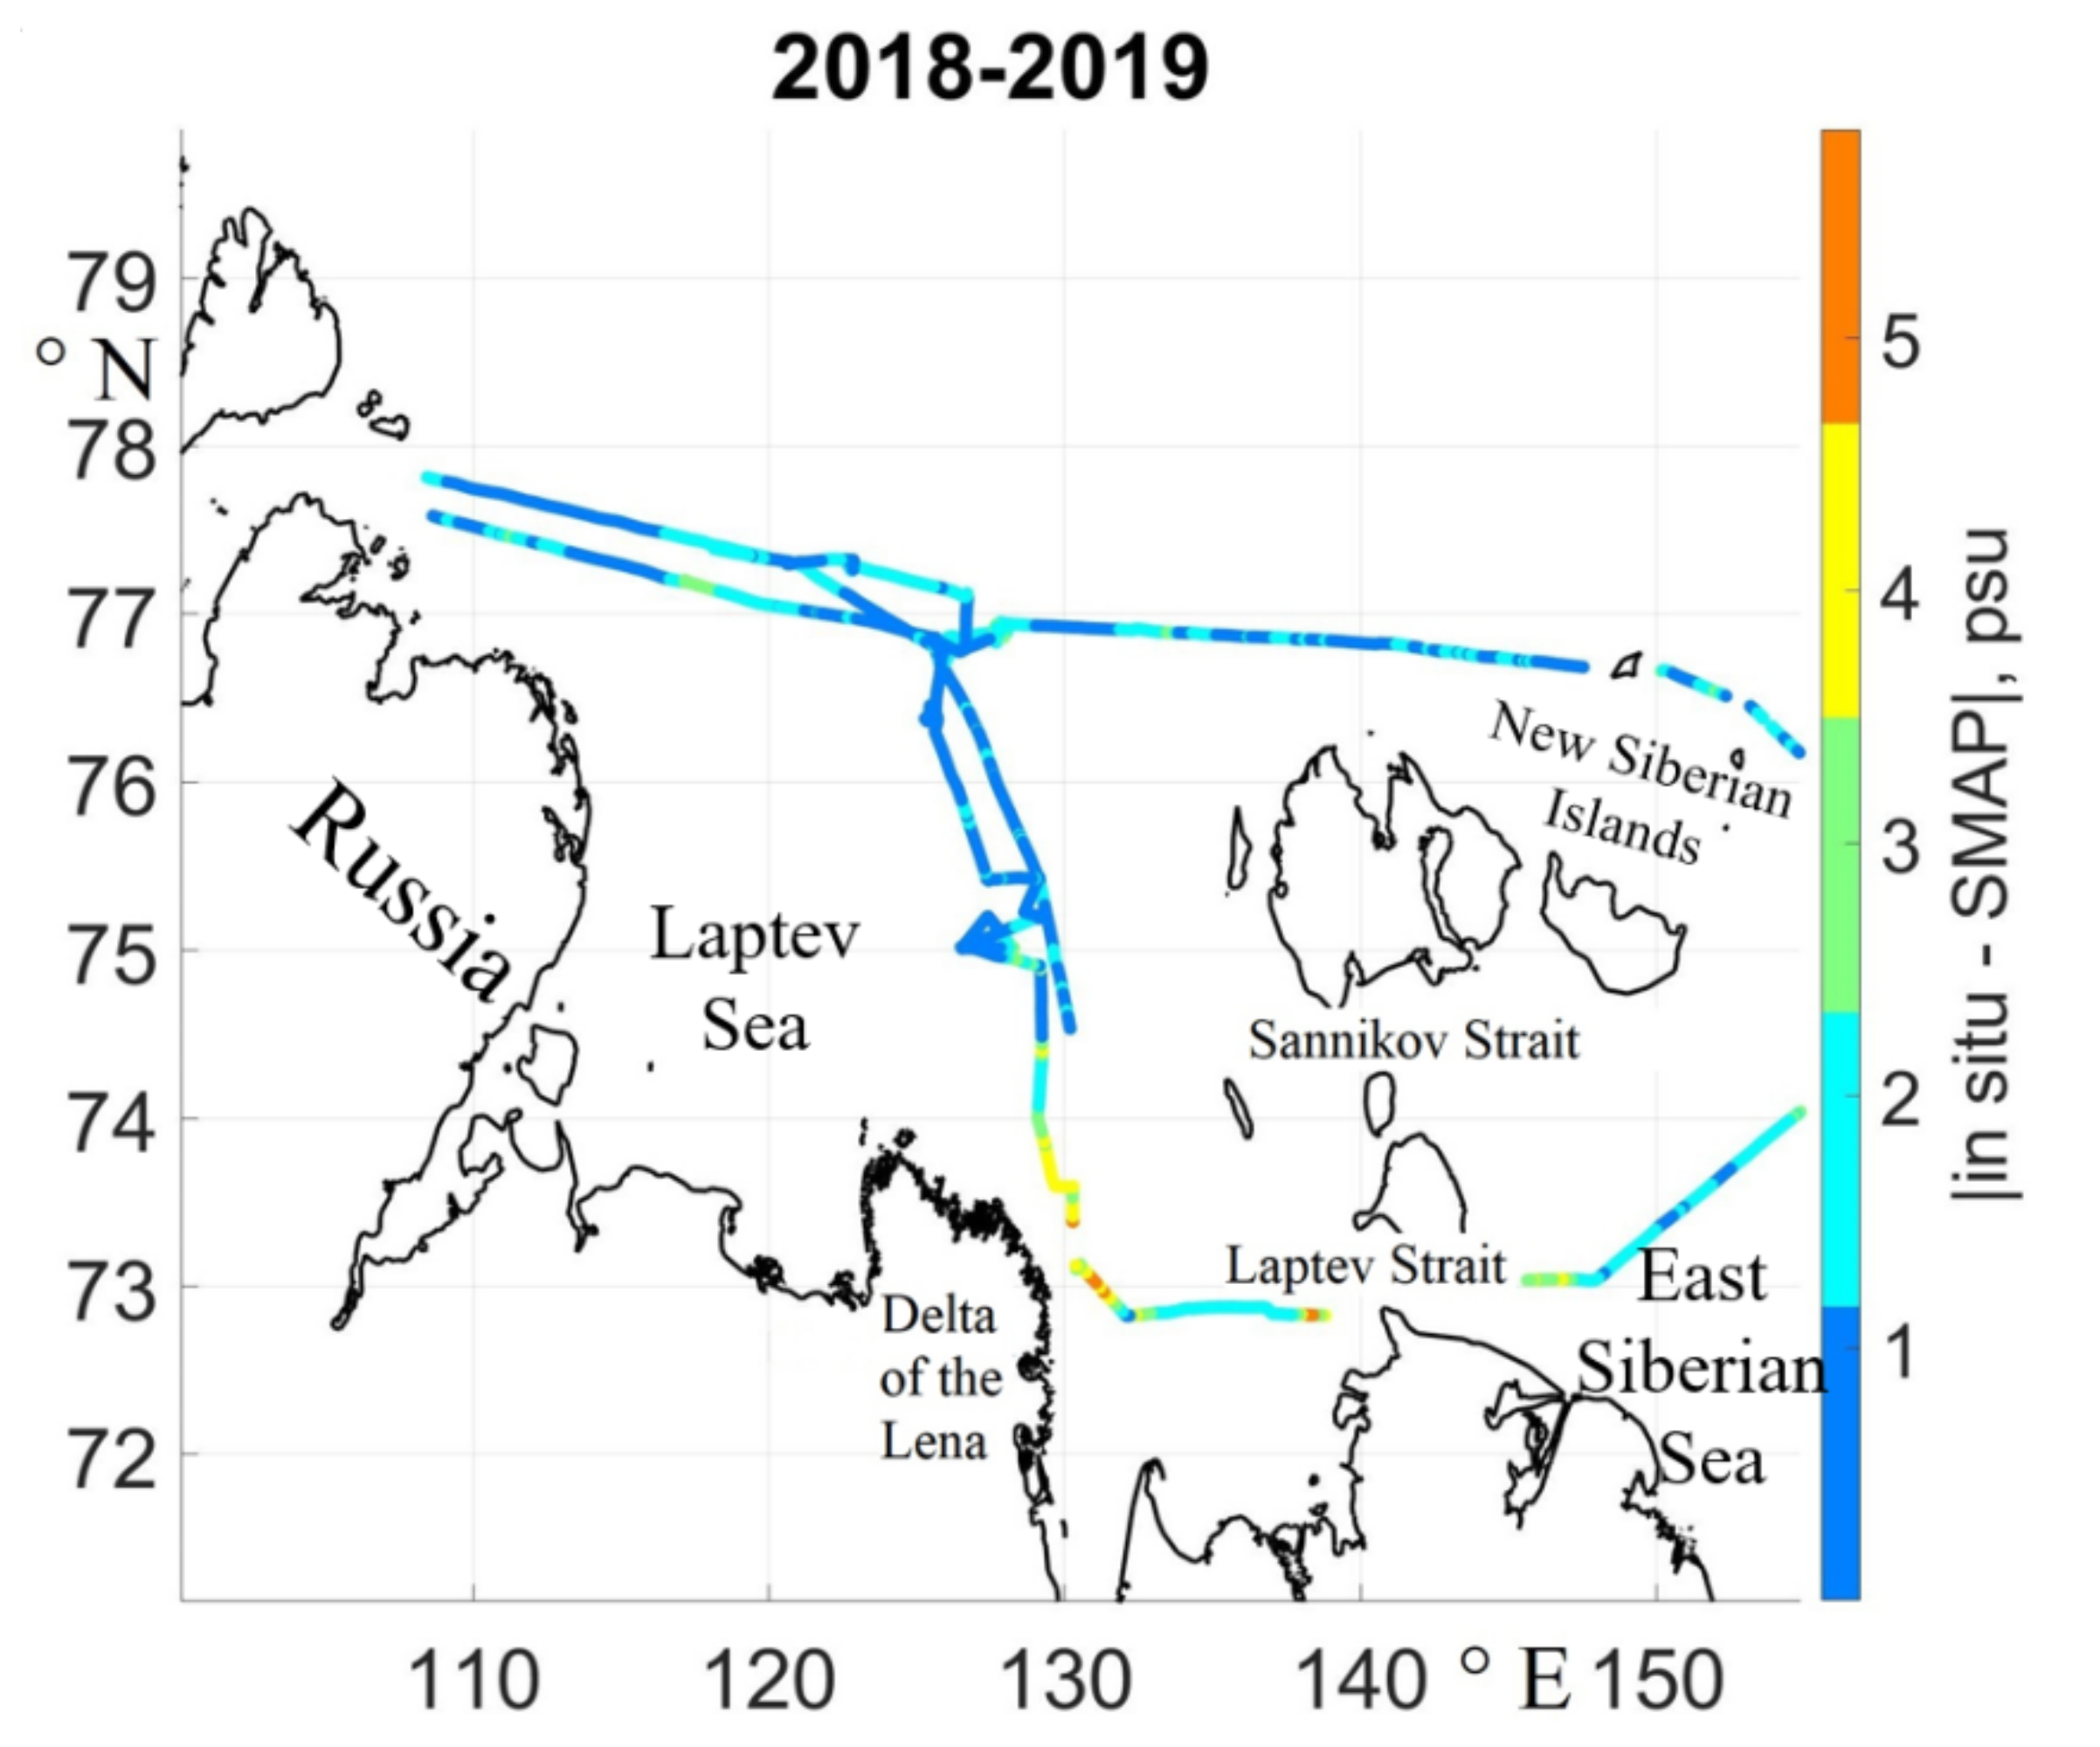
Figure 1. Spatial distribution of the absolute difference of salinity (colors) between in situ data and SMAP salinity measurements in the Laptev Sea in 2018–2019. For the comparison, SMAP data were interpolated on the points of in situ measurements.
Remotesensing 13 04252 g001
Figure 2. Scatter diagram between in situ and SMAP salinity measurements for 2018–2019. The dashed line indicates the 2σ region. R2 is the coefficient of determination. K is the correlation coefficient. Bias is the difference between the averages of the arrays.
Remotesensing 13 04252 g002
Figure 3. Average SMAP salinity maps for August–October of 2015–2020.
Remotesensing 13 04252 g003
Figure 4. Monthly averaged SMAP sea surface salinity maps in August–October of 2015–2016.
Remotesensing 13 04252 g004
Figure 5. Monthly averaged maps of the wind field from the Era-5 reanalysis (Jule–September) in 2015 (left) and 2016 (right). The color shows the magnitude of the monthly averaged wind velocity.
Remotesensing 13 04252 g005
Figure 6. Averaged maps of sea level for August–October (a): in 2015; (b): in 2016. Averaged maps of sea surface temperature for August–October (c): in 2015; (d): in 2016. The black rectangle marks the area selected for the comparison salinity, surface temperature, and sea level in Figure 7 and Table 2.
Remotesensing 13 04252 g006
Figure 7. Comparison of satellite–derived sea surface salinity, sea level, and sea surface temperature in August–September in the region of 131–138° E 73–75° N for 2015–2018 (black rectangle in Figure 6). The dashed line denotes σ. K is the correlation coefficient. R2 is the coefficient of determination.
Remotesensing 13 04252 g007
Figure 8. Average sea level maps during «eastern» (left) and «northern» (right) propagation types and corresponded wind roses for June–October based on Era-5 reanalysis data.
Remotesensing 13 04252 g008
Figure 9. Average September sea surface temperature maps (°C) during «eastern» (left) and «northern» (right) propagation types.
Remotesensing 13 04252 g009
Figure 10. Average monthly maps of ADT (left) and Era-5 wind velocity (right) in July–October 2018.
Remotesensing 13 04252 g010
Figure 11. Average in June–October zonal component of wind velocity in the region 125–140° E 72–77° N 1993–2020. The color indicates the type of propagation: red—«eastern» type; blue—«northern» type; yellow—«mixed» type.
Remotesensing 13 04252 g011
Table 1. Correlation between SMAP SSS, altimetry sea level, and MODIS SST in different years.
YearCorrelation with ADTCorrelation with SST
2015–0.66–0.54
2016–0.88–0.82
2017–0.73–0.62
2018–0.85–0.7
2019–0.54–0.69
2020no delayed data on ADT–0.56
Average–0.74–0.66
Table 2. Types of the plume propagation (red—«eastern»; blue—«northern»; yellow—«mixed»;) and maximum estimated longitude of the plume for the «eastern» and some «mixed» types according to the averaged ice-free season maps of sea level and SST (for July–October).
ADTSST
YearNorthenEasternMixedMax° ENorthenEasternMixed
93 X
94 X 168
95X
96X
97X
98 X
99X
0X
1 X 169
2 X 169 X
3X X
4 X164 X
5X X
6X X
7 X158 X
8X X
9 X 167 X
10 X166 X
11X X
12 X175 X
13X X
14X X
15X X
16 X 173 X
17 X 170 X
18 X170 X
19 X180 X
20X X
Publisher’s Note: MDPI stays neutral with regard to jurisdictional claims in published maps and institutional affiliations.