Abstract
In light of recent Arctic change, there is a need to better understand sea ice dynamic processes at the floe scale to evaluate sea ice stability, deformation, and fracturing. This work investigates the use of the Gamma portable radar interferometer (GPRI) to characterize sea ice displacement and surface topography. We find that the GPRI is best suited to derive lateral surface deformation due to mm-scale horizontal accuracy. We model interferometric phase signatures from sea ice displacement and evaluate possible errors related to noise and antenna motion. We compare the analysis with observations acquired during a drifting ice camp in the Beaufort Sea. We used repeat-scan and stare-mode interferometry to identify two-dimensional shear and to track continuous uni-directional convergence. This paper demonstrates the capacity of the GPRI to derive surface strain on the order of 10−7 and identify different dynamic regions based on sub-mm changes in displacement. The GPRI is thus a promising tool for sea ice applications due to its high accuracy that can potentially resolve pre- and post-fracture deformation relevant to sea ice stability and modeling.
1. Introduction
The Arctic sea ice has undergone widespread decline in recent years [] and a near seasonally ice-free Arctic Ocean is expected within three decades []. Sea ice retreat has implications for climate, marine life, and human activities [] by increasing accessibility for ocean navigation [,,]. Recent changes in sea ice have also led to more challenging or even hazardous conditions for over-ice travel [,,] on an often thinner and less stable ice cover. Increasing our understanding of sea ice stability, fracturing, and failure processes is needed to mitigate risk [], extend windows of operations, and improve pan-arctic and regional sea ice modeling and prediction.
Satellite remote sensing has been instrumental to understand recent change, large-scale dynamics, and processes relevant to sea ice prediction, including passive microwave (e.g., special sensor microwave imager []), optical (e.g., moderate resolution imaging spectroradiometer []), and altimetry (e.g., ice cloud, and land elevation satellite-2 []) systems. Synthetic aperture radar (SAR) missions (e.g., ERS, RADARSAT, Sentinel) have been crucial for providing insight into sea ice properties, e.g., [], dynamics, e.g., [], and change relevant for sea ice use and regional assessments [,,]. SAR interferometry (InSAR) can also be used to evaluate sea ice stability [], deformation [], fracturing [], and drift []. However, the use of InSAR is limited by data availability as analysis is typically based on a few images with hours to days between acquisitions.
Coastal sea ice radars have been used to track sea ice motion and deformation events [,] with minute-scale temporal sampling. These systems are available only at a few locations, are limited to resolutions of several m, and are unable to resolve short-term processes on the order of seconds. Even so, coastal radars have been a valuable tool to examine coastal ice dynamics by tracking ice interaction and landfast ice stability. Although these systems are able to detect breakout events, incoherent radars are unable to track sub-pixel motion that may indicate pre-failure deformation or fractures that do not open by at least dm-scale. These strains and partial failures may lead to localized reduced structural integrity and be indicative of overall ice cover stability.
Multiple high-precision in-situ methods have also been used to resolve floe-scale sea ice dynamics including ice stress buoys and accelerometers [,] and laser-strain observations. However, these sensors typically only provide a few point-based observations which cannot easily be extrapolated to resolve localized deformation events between observation points.
Here, we investigate the use of interferometry with the Gamma portable radar interferometer (GPRI) as a bridge between InSAR and in-situ strain measurements to assess ice deformation and stability. The GPRI has advantages over satellite InSAR as it allows for multiple acquisitions over timescales from milliseconds to days. This enables the evaluation of continuous and short-lived processes that cannot easily be detected with satellite InSAR due to inadequate temporal sampling. The GPRI also has advantages over other in-situ methods; it is portable and deployable on the ice or nearby land or structure, can resolve a displacement field over several kilometers, and is less limited by fog or precipitation impacts on visibility like laser strain measurements.
The GPRI instrument has previously been used to interferometrically derive ground topography [] and deformation [,] on land. It has also been used for cryosphere applications to assess changes in snow cover [] and glacier dynamics []. The GPRI has also been used in an attempt to derive sea ice motion and topography from ship-based observations, but with inconclusive results []. It is therefore timely to evaluate GPRI-based sea ice applications and use. In this work, we investigate the instrument’s sensitivity to motion and topography to evaluate its application for resolving lateral sea ice deformation, vertical buckling or wave fields, and topography at the relevant scales. In particular, we examine the ability to derive lateral strain with accuracy necessary to observe potential elastic, plastic, and viscous modes of deformation leading up to brittle failure events, with implications for sea ice stability. Here, we rely on modeled strain fields and GPRI data capturing two-dimensional shear and compressional strain of drifting sea ice, which was acquired at Camp Seadragon during the U.S. Navy’s ICEX 2020 operation.
2. Data and Methods
2.1. Interferometric Concepts
Interferometry is a technique for measuring the difference in returned phase between two radar scenes commonly used for deriving surface topography or sub-pixel, wavelength-scale surface displacements. Interferograms can be generated from either synthetic aperture radar (SAR) or real aperture radar using a similar processing chain including co-registration, multi-looking, interferogram formation, and adaptive phase filtering [,]. The resulting interferogram consists of phase change values wrapped between −π and π. The phase change, , represents a combination of several factors:
represents the phase change due to surface motion between temporally separated acquisitions. is the phase change due to topography if acquisitions are acquired from different antenna locations (dual receiving antennas permit this as standard practice with the GPRI). These terms can provide information about the motion or morphology of a surface. However, it can be challenging to accurately extract the magnitude of motion or topography in the case of significant phase contributions due to atmospheric effects, , noise, , or positioning errors, . originates from the different effective path lengths resulting from changes in atmospheric path delay between acquisitions and is known to impact InSAR and GNSS measurements []. The GPRI signals exclusively penetrate air close to the ground, which can hold more moisture than air aloft. Therefore, although the GPRI signal penetrates less atmosphere than spaceborne SAR, can be substantial []. With that said, the moisture content will strongly depend on temperature, hence for sea ice, is expected to be most pronounced during spring/summer.
The geometry used for data acquisitions is illustrated in Figure 1. The interferometric phase change is given by the expression:
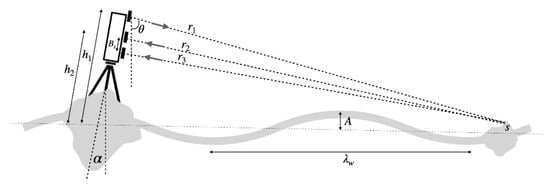
Figure 1.
Geometry illustration of the GPRI mounted on a ridge. The three antennas are each associated with a height above the level ice surface, h, a range to a specific target, r, and an incident angle, θ. The GPRI is free to tilt at an angle, α, relative to a level reference point due to ocean waves with amplitude, A, and wavelength, .
Here, is the wavelength of the signal (1.7 cm) and represents the change in signal path length from the transmitting antenna to the scatterer (i.e., phase center of the backscattered signal) () and back to the receiving antenna (). The sensitivity to vertical and horizontal surface motion depends on the incidence angle of the system, . For applications over relatively level terrain like sea ice, incidence angles typically exceed 85° at ranges beyond approximately 100 m, meaning that sensitivity to horizontal motion is much greater than to vertical motion. The sensitivity can be calculated through and :
representing horizontal and vertical motion resulting in line-of-sight (LOS) displacement of (one full phase cycle). We can further derive the ambiguous velocity by dividing by the temporal baseline between acquisitions,, e.g., in the horizontal:
The phase-derived velocity can be calculated, e.g.,:
The phase changes measured by the GPRI due to topography, , can be expressed by:
where – is the difference in LOS distances from the phase center of the backscattered signal to the receiving antennas. We can estimate the height sensitivity by the ambiguity height. For a vertically mounted antenna ( = 0), can be expressed []:
where the second and third terms are often negligible. Here is the spatial baseline between the GPRI’s receiving antennas.
Interferometric coherence, , is a useful parameter in addition to in interferometric processing. describes the correlation between the signals from the two acquisitions, which can be impacted by spatial (), temporal (), thermal (), and process () decorrelation []:
is impacted by the signal-to-noise ratios of the two acquisitions (SNR1 and SNR2):
is controlled by errors in the interferogram processing. is impacted by the spatial baseline between acquisitions, resulting in an altered scattering response from the surface due to a different incidence angle. is affected by changes in the scattering medium between acquisitions and is generally expected to be minimal over short timescales. Reduced coherence introduces noise in the interferogram, , with standard deviation (Cramer–Rao bound):
here, is the independent number of looks and should exceed []. The phase noise can in turn be used to describe the expected error of the derived displacement:
and similar for topography, which describes the displacement or height value corresponding to a standard deviation of the phase noise.
2.2. Interferometric Processing with the Gamma Portable Radar Interferometer (GPRI)
The Gamma portable radar interferometer (GPRI) is a fully coherent radar operating at Ku-band ( ~1.7 cm) capable of interferometric measurements []. The system consists of three slotted wave guide antennas mounted on a tripod. The antenna configuration is interchangeable; in this case the transmitting antenna is situated 35 cm and 60 cm above the two receiving antennas (Figure 1). The transmit antenna generates a fan-beam spreading 35 degrees in the vertical (zenith) and 0.4 degrees in the horizontal (azimuth) [] resulting in a variable azimuthal pixel ranging from 0.14 m in near range (20 m) to about 30 m in far range (5 km). The bandwidth of 200 MHz results in a consistent 0.75 m pixel spacing in the range direction.
The GPRI can operate in dynamic or stare modes. In the dynamic mode, the antennas rotate azimuthally, collecting data over a partial or near full 360-degree scan. A single scan can be used to map surface topography by using both receiving antennas from one acquisition. A single-scan interferogram has a zero temporal baseline, which eliminates (Equation (1)). Repeat scans can be collected with as short as minute-scale temporal baselines, enabling derivation of the dynamic change in between acquisitions. If the temporal baseline of repeat-scan interferometry is kept to minutes, (Equation (1)) and decorrelation contributing to and (Equation (8)) will be low. When the GPRI is left in place between acquisitions, repeat images do not require coregistration reducing the chance of significant . However, can still result from small-scale antenna movements during the time between acquisitions (e.g., antenna tilting). If the same receive antenna is used during data collection, is eliminated.
Stare-mode enables continuous data collection in one direction only. Each pulse transmitted at 500 Hz is treated as an individual acquisition enabling the formation of interferograms with temporal baselines as short as 2 milliseconds (with no averaging). These short temporal-baseline interferograms between pulses can be used to derive near instantaneous motion and thus ice acceleration (Equation (4)). Alternatively, as done in this work, the first pulse acquisition can be used as the master for all subsequent pulses, resulting in progressively larger temporal baselines for the derivation of accumulated displacement.
2.3. Data Acquisition during ICEX 2020
GPRI images were collected between 3 and 12 March 2020 during ICEX 2020, a US Navy campaign to test submarine readiness and capabilities in Arctic environments about 100 km north of the Alaska Beaufort Sea coast near Kaktovik (~71.1 N, 142.2 W). The GPRI was placed atop a large ridge near the ice camp (Figure 2a). The camp itself was situated on multi-year ice surrounded by scattered ridges adjacent to smooth first-year sea ice (Figure 2b).
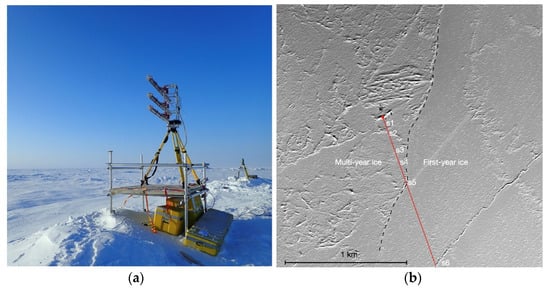
Figure 2.
(a) GPRI stationed on top of a ridge in the Beaufort Sea during the ICEX 2020 campaign. (b) Area overview of the ice camp and surrounding sea ice identified with WorldView-II imagery. The red line in (b) indicates look direction during the stare-mode acquisition. s1–s6 are strong scatterers highlighted in the analysis (see the text for details). s5 is on the boundary between first- and multi-year sea ice, which is highlighted with a dashed line.
Repeat-scans were collected of nearly the full 360-degree scene around the radar at temporal baselines ranging from minutes to hours to investigate the application of the GPRI for examining km-scale deformation processes at these timescales. Stare-mode acquisitions were collected along the red line in Figure 2b to investigate the possibility of resolving continuous ice deformation and short-lived transient sea ice processes. These stare-mode acquisitions enabled the formation of interferograms with temporal baselines ranging between 0.01 (0.05 after coherently averaging 5 acquisitions) and 30 s representing the accumulated phase change from the time of the first signal in a stack of 3000 independent acquisitions.
In the work presented here, we analyze one repeat-scan and one set of stare-mode interferograms. The GPRI system was stationary between and during acquisitions eliminating the need for coregistration. We used only the upper receiver antenna in order to achieve a zero spatial baseline and eliminate sensitivity to topography. No ground validation was collected for these acquisitions. However, interferometry has been validated over sea ice in the past and shown high accuracy in comparison with in-situ strain measurements [].
3. Results
3.1. Deriving Phase Sensitivity to Motion and Topography of Sea Ice
We derived ambiguity displacements, and to investigate the level of sensitivity to horizontal and vertical ice movement (Equation (3)). These values depend on the incidence angle, which is determined by sensor elevation and range. Examples if stationed on level ice (0 m), a ridge (5 m), building (20 m), and higher (50 m) are illustrated in Figure 3a. Here, increases nearly linearly with range and decreases quickly with range down to /2 (dashed and solid lines respectively). The sensitivity to horizontal and vertical motion is inversely proportional to and . We can thus identify a rule of thumb, that the GPRI is more sensitive to horizontal motion past a range distance approximately equivalent to the elevation of the sensor (crossing between dashed and solid lines in Figure 3a).
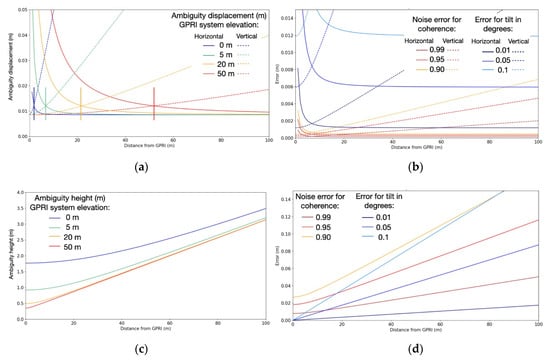
Figure 3.
(a) Horizontal and vertical ambiguity displacement for a GPRI stationed at different elevations. Vertical lines indicate the range distance of equal sensitivity to vertical and horizontal motion. (b) Error in horizontal (solid lines) and vertically (dashed lines) derived motion based on coherence (warm colors) and surface tilt (cool colors) if stationed on a 5-m ridge. (c) Ambiguity height for a GPRI stationed at the same levels as in (a). (d) Error in height estimates with similar coherence and tilt values as in (b).
We also investigate the phase response to potential mm-scale antenna shifts. A likely cause of such antenna motion is a tilt caused by buckling or ocean waves resulting in a tilted ice surface or tilting of the antenna or scaffolding used to mount the tripod (Figure 2a). A tilt with angle will result in a phase error, :
where and are the heights of the transmitting and receiving antennas above the tilting surface (e.g., if placed on a ridge, the height of antenna plus the sail height). is the angle of tilt relative to the look direction. This approximation is accurate to ~0.7 mm in the near range, but quickly increases in quality to <0.03 mm at 100 m range. A potential tilt error will lead to errors in respective displacement (e.g., in horizontal displacement, ):
The relationship between errors and range is illustrated in Figure 3b. It may be possible to distinguish sensor tilt from an actual deformation signal; if interpreted as lateral movement, the contribution will be largely independent of range. If interpreted as vertical motion, it may lead to implausible values in the far range due to the large . Ambiguity values are listed in Table 1 for distinct range values. Here, noise and tilt errors are listed for lower coherence values ( = 0.7) more representative of level ice and subtle tilt values = 3.6 × 10⁻³ degrees and . This tilt corresponds to the tilt of the ice surface due to infragravity waves with A = 1 cm and 1 km. This is also equivalent to the tilt if one leg of the antenna tripod settles with ~4 mm (assuming the tripod height is 1.5 m and the legs 22.5° from vertical). Such tilt will result in and equal 0.43 mm and 6.3 cm respectively at 1 km range (Table 1).

Table 1.
Ambiguity and error values with range.
The interferometric phase is less sensitive to typical sea ice topography than motion. increases nearly linearly and approaches 30 m at a range of 1 km (Figure 3c; Table 1; Equation (7)). A large can be advantageous for assessment of topographic reliefs of hundreds of meters. However, for sea ice, where elevations do not typically exceed 10 m [], this can result in large (cm- to m-scale) relative errors. For single-scan interferometry, height estimates are susceptible to offsets in the sensor orientation. The error is illustrated in Figure 3d and can be described []:
Phase noise is another source of error in the phase estimates of elevation and displacement. The error depends on the number of looks, SNR, and interferometric coherence (Equation (10)). Figure 3b,d exhibit expected errors based on NL = 4 independent looks and 0.9. Example values are also listed in Table 1 (Equation (10)). is limited to less than 1 mm while linearly increase and exceed 14 cm at 1 km ( = 0.7). For topography, exceed 3 m by 1 km (Table 1).
Based on this sensitivity analysis, the GPRI shows promise for deriving horizontal deformation of sea ice based on a small ~8.5 mm. The expected errors are also small (~1 mm) relative to typical strain rate values in the Arctic on the order of 10−7 s−1 (1 mm s−1 at 10 km) []. This suggests that the GPRI may be able to resolve fracturing both on the cm-scale (e.g., thermal cracks) and mm-scale (e.g., microcracks in the structure of the ice). Furthermore, the GPRI is less sensitive in the vertical and implications of this in terms of deriving vertical displacement and topography are examined in the discussion. We therefore focus the remaining analysis on examining how we may recognize and characterize lateral (horizontal) deformation based on both modeled and observed interferograms.
3.2. Modeling Repeat-Scan Interferometric Response to Sea Ice Strain
The repeat-scan mode is suited to assess lateral strain development based on its high accuracy and the ability to capture multiple acquisitions within minutes. To investigate strain applications, we modeled strain fields and associated interferometric phase response to shear and convergence. In this model, the GPRI sensor is stationed on sea ice and the ice within the footprint of the GPRI undergoes uniform displacement (left column in Figure 4). The interferometric phase is only sensitive to the displacement relative to the GPRI. This has two consequences: (1) only the motion field in the reference frame of the GPRI is observed (center column in Figure 4) and (2) only radial changes in motion results in a phase change. The consequence is that there will be zero phase change along the green axis superimposed on Figure 4b,e. On the other hand, maximum phase change will occur along the blue axes.
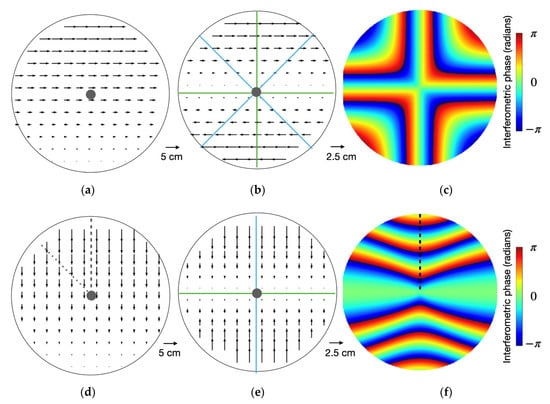
Figure 4.
(a) Right-lateral shear displacement within the footprint of the GPRI. (b) Motion relative to the GPRI sensor. (c) Modeled repeat-scan interferogram of the shear field. (d) Convergence displacement within the footprint of the GPRI. (e) Motion relative to the GPRI sensor. (f) Modeled repeat-scan interferogram of the convergence field. Along the green lines in (b,e) there is no change in relative motion that will have zero phase change in the interferograms. Blue lines indicate orientations of maximum motion gradient in look-direction and will exhibit most pronounced phase change. The change in relative motion over the 5 km range is 5 cm. Dashed and dotted lines in panel d and f indicates example orientations in stare-mode (see text for details).
The interferometric phase value represents 1-dimensional information as only motion towards or away from the antenna is measured. For InSAR, where the look angle is fixed, the interferometric fringes are ambiguous between shear and convergence. This can make it challenging to distinguish between these two deformation modes []. This is not the case for GPRI measurements as the variation in look angle during repeat-scan GPRI measurements results in different fringe patterns for shear and convergence. However, with ground-based radar, there are directional ambiguities both within shear and convergence that can make it challenging to determine the exact direction of deformation, which is not the case with airborne or spaceborne InSAR. For instance, in the case of dextral (right-lateral) shear (Figure 4a), the fringe pattern takes the form of a cross (Figure 4c), identical to a case of perpendicularly oriented sinistral (left-handed) shear. Similarly, the direction of convergence cannot be resolved based on Figure 4f alone as convergence in the opposite direction of Figure 4d will also lead to the same relative motion (Figure 4e) and interferogram.
3.3. Modeling Stare-Mode Interferometric Response to Sea Ice Strain
We further modeled the interferometric phase response for the same convergence field as in Figure 4 in stare-mode. Here, the GPRI is oriented in the direction of motion (dashed line in Figure 4d). The uniform convergence leads to consistent velocity over time that decreases towards the sensor (displayed in Figure 5a in the time-range geometry). The cumulative motion is displayed in the same coordinate system in Figure 5b indicating increasing strain with time. The resulting interferogram is displayed in Figure 5c. The modeled temporal baseline and deformation field is kept the same as in Figure 4. The interferogram in Figure 5c thus exhibits the same phase values at the last timestep (bottom row) as along the dashed line in Figure 4f (three full phase cycles).
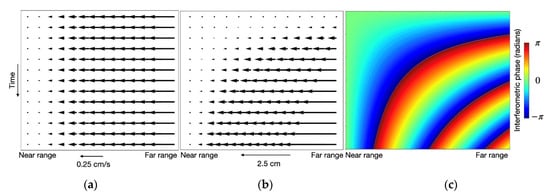
Figure 5.
(a) Shear or convergence displacement velocity (e.g., along blue lines in Figure 4 as viewed in the stare-mode time-range geometry. (b) Cumulative displacement relative to t = 0. (c) Modeled stare-mode interferogram. The motion and interferometric change represent a maximum displacement of 2.5 cm over a 5 km range.
In stare-mode, the look angle of the GPRI is constant, similar to InSAR, resulting in ambiguities between shear and convergence. The rate of absolute deformation is also not known as the stare-mode can only be used to directly derive the minimum displacement. In the case of the GPRI being oriented along the dashed line in Figure 4d, the actual deformation can be derived based on the phase values. However, if the GPRI was oriented along the dotted line in Figure 4d, the derived motion would only represent a radial component of the absolute motion.
4. Data Examples from Drifting Sea Ice
4.1. Observing Shear Strain Using Repeat-Scan Interferometry
We evaluated repeat-scan GPRI imagery acquired during the U.S. Navy’s ICEX 2020 operations on 10 March between 05:00 UTC and 19:30 UTC. The backscatter image indicates a complex ridge system to the west and smoother ice with scattered ridges to the east (Figure 6a) also visible in the optical imagery (Figure 2b). The areas of deformed ice retain generally good coherence in between acquisitions particularly in the near to mid-range (Figure 6b). The interferometric phase can thus be reliably interpreted in these areas. The resulting interferogram (Figure 6c) has a temporal baseline of 14.5 h and a fringe pattern resembling the modeled shear in Figure 4c.
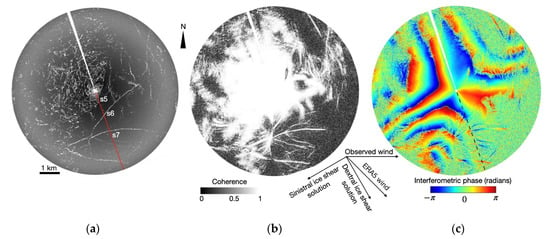
Figure 6.
(a) Backscatter from the GPRI during the ICEX 2020 campaign. (b) Coherence values between acquisitions acquired on 10 March 2020 at 05:00 UTC and 19:30 UTC. (c) Interferogram resulting from the acquisitions in (b). Arrows indicate approximate wind direction from ERA5 reanalysis and the direction of shear as estimated based on the fringe pattern. s5–s7 in (a) represent strong scatterers with high coherence commented on in the text. dB units for backscatter cannot be derived due to the lack of in-situ corner reflectors. Direction of the stare acquisitions is indicated with a red line in (a) and a black dashed line in (c).
This interferogram could represent either of two orthogonal shear fields due to the directionally ambiguous nature of the phase values. It could either represent dextral (right-lateral) shear along an axis oriented 150 degrees from North, or sinistral (left-lateral) shear along an axis oriented 240 degrees from North. We therefore need to consider other dynamical factors in order to resolve this ambiguity. At the time of the GPRI observations, the ice camp was approximately 100 km north of the Alaska coastline, which is oriented approximately ENE/WSW. A microweather station at the camp reported an average windspeed of 3.8 m s−1 from a westerly direction, while the reanalysis ERA5 from the European Centre for Medium Range Weather Forecasts (ECMWF) indicate the regional winds over the southern Beaufort Sea were northwesterly. Position data from satellite tracked buoys at the camp show that the GPRI observations coincided with a period of near-zero ice drift. Between 05:00 and 07:00 on 10 March 2020, the ice camp drifted approximately 60 m southward (toward land) and then effectively came to rest for the next two days.
The near absence of motion indicates the ice was not in free drift and was therefore subject to internal stresses. Although the local stress field at the scale of the GPRI observations will have been affected by variations in ice thickness and strength, we expect that the NW regional winds would have imposed right-lateral stresses on the ice between the camp and Alaska coastline. We therefore consider the solution representing right-lateral shear along an axis approximately parallel to the wind (135 degrees from North) to be the most likely. There is no similar ambiguity in deformation rate. Hence, we are able to estimate the strain (i.e., magnitude of ice deformation relative to the distance from the sensor). We first match the observed interferogram (Figure 6c) with modeled shear interferograms. The strain is then calculated from the motion field used to produce the best match in terms of fringe spacing. We derived a strain of ~10−5 meaning approximately 1 cm of motion per km. Note that the interferogram does not exactly match a shear strain field. Other deformation modes may play a role and result in inaccuracies in this strain estimate.
4.2. Observing Compressional Strain Using Stare-Mode Interferometry
We evaluated a series of stare-mode acquisitions from 4 March at 23:57 UTC. Due to the predominately level ice and large incidence angle, the ridges are clearly identifiable (e.g., s5–s7 in Figure 6a) as bright bands in the backscatter imagery (Figure 7a). Due to the high SNR of these locations, they also feature high coherence (Equation (9); Figure 7b) giving us significant confidence in the interferometric phase (Figure 7c). We evaluated the interferometric phase-derived motion in the line-of-sight direction at seven distinct points: s1–s5 on multi-year ice in the near range, and s6–s7 on first-year in the far range (Figure 8a). The selection was based on > 0.98 and a large spatial spread from 72 m to 2.1 km in range. Through these points, we identified multiple displacement components of the stare-mode signal:
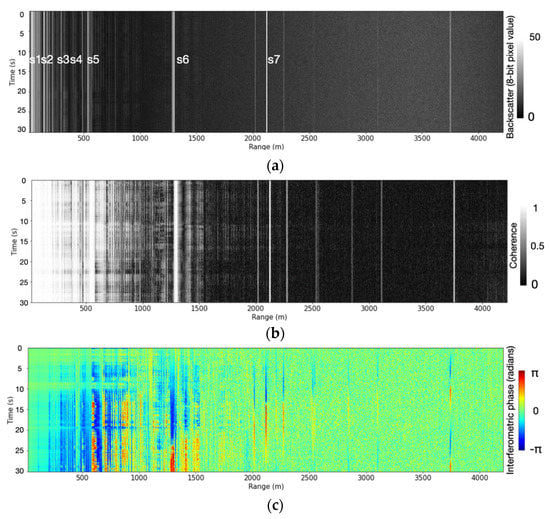
Figure 7.
Stare-mode acquisition acquired 4 March 2020 and derived backscatter (a), coherence (b) and interferometric phase (c). Strong scatterers s5–s7 can be identified in (a). σ0 is not calculated in (a) as absolute calibration was not performed.
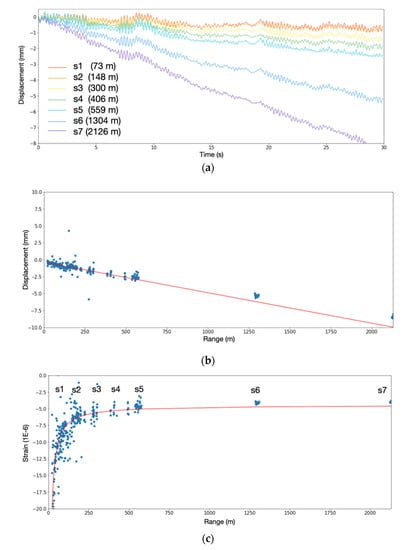
Figure 8.
(a) Derived horizontal displacement of strong scatterers (s1–s7) distributed between near and far range. Total displacement (b) and strain (c) at last timestep for all scatterers exhibiting high (>0.98) coherence. Displacement in (b) indicates increasing displacement with distance. The slope indicates the average strain at 4.6 mm/km. The strain in (c) indicates a gradual tilting of the antenna of 0.3 mm during the time of the acquisitions.
First, we analyzed the trends in the data. All points exhibit a near constant component of motion towards the GPRI over the 30 s interval, resulting in a linear decrease in range over time (Figure 8a). The amount of displacement for all scatterers with coherence >0.98 (not just s1–s7) was approximately proportional to the distance from the GPRI (Figure 8b), indicating convergent strain in the look-direction. The linear fit in Figure 8b suggests a strain of ~4.6 (slope of the line), but is not perfect. Further examination of the strain observed at each scatterer indicates an asymptotic-like decrease in strain magnitude with distance (Figure 8c). This can be explained by tilting of the ridge where the antenna is mounted resulting in apparent horizontal motion of the antenna not related to ice deformation. This shift is constant with range and thus dominating strain values in near range where relative displacement values are lower. We fit a hyperbola to the data y = −338 /x − 4.45 This function indicates two things, that the ridge gradually tilted resulting in a horizontal antenna shift of ~0.3 mm and that the ice was compressing with a total strain of ~4.5 during the 30 s of acquisitions. The stare mode tracks continuous deformation. HHHence we can also calculate the strain rate (change in strain per second) to ~1.4 × 10⁻⁷ s−1 near a typical 1 × 10⁻⁷ s−1 strain rate for Arctic sea ice [].
Second, we detrended the stare-mode displacement data to remove the uniform compression and tilt allowing us to examine motion on timescales shorter than 30 s. The most prominent residual motion is synchronous, periodic oscillations with a frequency and amplitude of approximately 4 Hz and 0.2 mm. We attribute this motion to wind-induced antenna vibrations and remove it using a 1-s running average. The detrended and filtered data also indicate near synchronous motion of all scatters towards and away from the antenna by around 0.2 mm during the 30 s stare interval (Figure 9a). Although the magnitude of this motion varies slightly between scatterers, this variation does not appear to be related to range. Such motion could therefore be related to periodic widening and narrowing of a dislocation fracture close to the antenna or periodic tilting of the antenna or the ridge upon which it was installed.
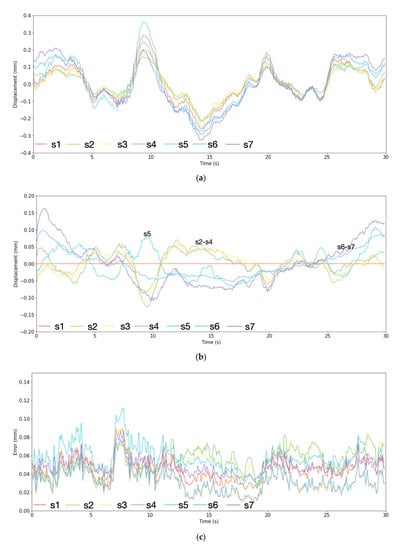
Figure 9.
(a) Detrended and smoothed horizontal displacement. (b) Residual displacement relative to s1 (red line in (a)). (c) Accuracy of displacement based on coherence and assuming 5 independent looks.
Lastly, we evaluated small variation in apparent residual displacement between scatterers by subtracting the residual motion measured at scatterer s1 from the motion measured at other scatterers (Figure 9b). This calculation demonstrates that there may still be some remaining independent motion of each scatterer. Although it is near the measured noise level (Figure 9c), its spatial smoothness and consistency between s2 and s7 indicates that it contains useful information. In particular, we note that the residuals for ridges s2–s4 are highly correlated with each other over time and bear little similarity to the residual for ridges s5–s7. Regardless of the cause of this small residual motion, this result suggests that scatterers s2–s4 are mechanical coupled to each other, while scatters s5–s7 are able to move more independently. As it happens, scatters s2–s4 were all located on the same multiyear ice floe as the GPRI, while s5 corresponds to a small ridge at the transition to an adjacent first-year ice floe that contained scatterers s6 and s7 (Figure 2b). Hence, correlation between residual phase variations of scatters may be a useful way of identifying mechanical discontinuities in an apparently continuous ice pack.
5. Discussion
5.1. Geometrical Constraints of Sea Ice Strain Measurement
This work demonstrates the applicability of the GPRI instrument for the assessment of sea ice strain at scales from tens of meters to kilometers. As we have shown, the accuracy of derived sea ice motion can be high, but depends on the acquisition geometry and the ice surface itself. The horizontal sensitivity is larger if the system is placed near sea level, largely eliminating sensitivity to vertical motion. However, a near 90-degree incidence angle can cause large specular reflection of the radar signal for level ice resulting in low SNR, coherence, and accuracy. Ridges can retain high coherence even in far range, but the ability to derive a continuous motion field over level ice can often be restricted to near- to mid-range and will depend on the presence of cm-scale ice roughness. Also, depending on the surrounding ice morphology, a near 90-degree incidence angle can result in significant areas subjected to radar shadowing behind large ridges. It can therefore be advantageous to place the GPRI system at higher elevations of meters to tens of meters. If placed on a ridge, this may expose the GPRI to increased unwanted motion from elevated tilt at higher elevation. Therefore, grounded ridges may represent an optimal ice surface to mount the GPRI if present.
5.2. Sensitivity to Vertical Ice Motion
GPRI is not only sensitive to horizontal motion, but also to vertical, especially at near range. Therefore, the GPRI can potentially have applications for deriving near range vertical motion. For a system stationed on a ridge, the accuracy in high-coherence areas is at the mm-scale out to roughly 100 m where the ambiguity is 12 cm in the vertical. We thus speculate that the system may be able to characterize cm-scale vertical ice motion as a result of ocean waves. The accuracies here are based on 4 independent looks. Vertical deformation or displacement can occur smoothly across scales of 101 to 103 m; hence accuracy could potentially be significantly improved through increased multi-looking and filtering. This could possibly enable the recognition of vertical motion in mid to far range in the absence of horizontal motion. It may also be possible to change the observation geometry to increase sensitivity to vertical motion including higher elevation of the GPRI system and larger spatial baseline between receiving antennas. The baseline is relevant if interpreting the signals from both antennas to attempt to separate LOS motion into vertical and horizontal components due to a slightly different . This would further be improved by using a synchronous second GPRI system placed at a different elevation. The strong dependence of on range could also likely be used to determine the nature of the different motion signals in many cases. Vertical displacement as a result of underlying ocean waves is an example of a smooth signal that could potentially be identified in the near range part of the image scene.
5.3. Sensitivity to Antenna Movement
In addition to vertical ice motion, other factors may also impact a horizontal strain analysis including sensor tilting, changing sensor elevation, and changing atmospheric conditions. We modeled antenna positioning changes to investigate the resulting magnitude and phase patterns. The directions are relative, but we refer to north as towards the top of the page. First, we modeled the phase change from a 1 cm eastward sensor shift in between acquisitions for repeat scan (Figure 10a) and stare-mode interferometry with a west-facing antenna (Figure 10b). The shift leads to zero phase change in N-S direction and a gradual phase change towards the E-W that is independent of range in mid to far range. Second, we modeled the phase change in response to a 5-cm increase in sensor elevation. This leads to a more localized effect in near-range independent of look angle (Figure 10c,d). This signal is equivalent to a tidal signal if the sensor is stationed on shore and the temporal baseline is on the order of hours. Otherwise, these signals do not resemble our observed or modeled ice deformation signals as presented in Figure 4 and Figure 5.
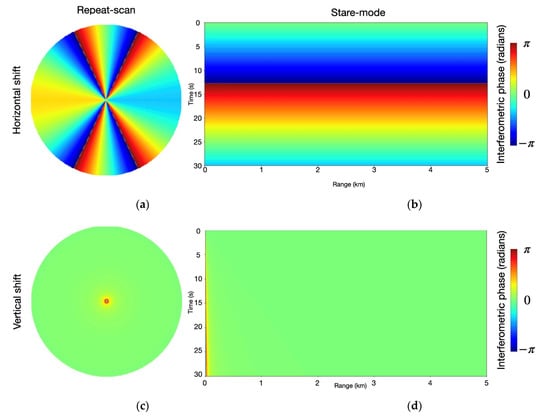
Figure 10.
(a,b) Modeled signals from a tilted/horizontally shifted sensor (1 cm eastward shift). (c,d) modeled signals of a 5 cm vertical antenna displacement.
In this work, we attributed the horizontal sensor movement to tilting of the ridge where the GPRI is positioned. This apparent cyclic tilting back and forth could be wave induced in which the tilt corresponds roughly to waves with an amplitude ~ 1 cm and wavelength ~ 0.5 km. In the case of wave motion, a large part of the signal will be due to antenna tilt resulting in synchronous peaks in the signal (similar to Figure 9a). We also expect part of the signal to be due to the vertical motion of the ice surface, which will result in an offset between the peaks. However, there is no such identifiable range-time delay in the signal. Here, more work is needed to explore how to effectively identify and track waves and other types of vertical motion, e.g., buckling using stare-mode interferometry.
5.4. Sensitivity to Topography
The GPRI can also be used to derive topography using both receiver antennas. However, the application for deriving sea ice morphology is significantly hampered by a relatively small 60 cm of the standard GPRI configuration resulting in low sensitivity to topography (large ). This results in large relative contributions of noise, which cannot easily be filtered due to the often-large spatial variability of sea ice morphology in contrast to an often smoothly varying strain field. This can in turn lead to large dm- to m-scale expected errors. More work is therefore needed to explore whether the GPRI could be useful for assessing sea ice topography with appropriate accuracy []. Here, possibilities to improve accuracy include (1) extending the vertical baseline by utilizing a larger antenna tower, (2) utilizing multiple acquisitions in the absence of ice motion for improved SNR and accuracy, and (3) acquiring bistatic acquisitions using a configuration of two GPRI systems.
6. Conclusions
This work evaluates the Gamma portable radar interferometer (GPRI) as a tool to assess the dynamics and morphology of sea ice. We examined the sensitivity of the GPRI to horizontal and vertical motion as well as topography. The GPRI is highly sensitive to lateral sea ice displacement with an 8.5 mm ambiguity displacement. Expected errors are also relatively low. Examples are 0.3 mm expected noise error for high-coherence areas (>0.95 e.g., rough ice and ridges) and 0.4 mm in the case of underlying ocean waves or antenna settling. The high sensitivity to lateral sea ice motion makes the GPRI a promising tool for examining sea ice dynamics at the km-scale. There is much unknown about floe-scale sea ice rheological behavior partly because of the challenge in obtaining observations with the required accuracy and spatial and temporal coverage. Here, we demonstrated the GPRI as a tool to augment existing methods with potential to improve our understanding of sea ice dynamics.
By modeling the interferometric phase, we investigated the ability to resolve 2-dimensional strain fields in repeat-scan mode. We demonstrated this application by identifying ~10−5 shear strains in repeat-scan data out to a range of ~4 km. We also operated the GPRI in stare-mode, which enabled tracking of near instantaneous sea ice strain rates of ~10−7 s−1 and identification of subtle dynamical boundaries through strain variability. Based on these preliminary results, we speculate that the GPRI may be suitable to identify fracture mechanisms by evaluating emerging spatial discontinuities in continuous repeat-scan acquisitions. Centimeter-scale fracturing mechanisms may also be tracked through stare-mode interferometry by analyzing stark temporal discontinuities in lateral strain. In the case of gradual development of multiple mm-scale cracks, the fracture mechanisms may also be evaluated by estimating strain and yield stress. We also speculate that the GPRI data may further help determine the nature (i.e., elastic, plastic, and viscous deformation) of pre- and post-fracturing mechanisms.
Further investigations into the use of GPRI to evaluate sea ice rheological behavior will depend on more acquisitions and could benefit from improved observations and analysis, including:
- Acquire longer series of acquisitions for different ice regimes including longer stare acquisitions to evaluate wave periods and capture fracturing events.
- Obtain validation data and identify methods to combine observation systems for improved monitoring and reduced directional ambiguities (e.g., second GPRI system, on-ice accelerometers, laser strain profilers).
- Explore optimal processing routines (e.g., filtering techniques) and develop automatic identification of deformation and strain.
Further collection and analysis GPRI data may help examine rheological behavior at the floe-scale relevant for the development of sea ice models. Sea ice dynamics at this scale is also particularly relevant for human activities near sea ice. Here, the GPRI may help track elastic wave propagation upon impact between floes and vessels or investigate ice/coastal interactions. The GPRI may in turn have applications for evaluating sea ice stability in near real time to predict hazards, ice failure, and break-out events.
Author Contributions
D.O.D. conducted the interferometric processing and analysis and drafted the initial manuscript. M.A.J. and E.R.F. contributed to all aspects of the analysis and manuscript. A.R.M., C.M.P., and J.K.H. participated in the design, planning, and execution of the experiment and provided guidance on the data interpretation. E.R.F. and A.R.M. collected the GPRI data during ICEX. C.L.W. and F.J.M. provided critical guidance on processing and interpretation of the GPRI data. All co-authors provided valuable recommendations and corrections resulting in the final manuscript. All authors have read and agreed to the published version of the manuscript.
Funding
This research was funded as part of the U.S. Army Program Element 060311A, Ground Advanced Technology task for Sensing and Prediction of Arctic Maritime Coastal Conditions, and through the Office of Naval Research SIDEx program, grant N000142MP001.
Institutional Review Board Statement
Not applicable.
Informed Consent Statement
Not applicable.
Data Availability Statement
The data presented in this study are available on request.
Acknowledgments
We thank everyone involved in the planning and execution of the ice camp operations for the U.S. Navy’s ICEX 2020 exercise. We are particularly grateful to personnel at the Arctic Submarine Laboratory and Ukpeaġvik Iñupiat Corporation (UIC) Science.
Conflicts of Interest
The authors declare no conflict of interest.
References
- Comiso, J.C.; Meier, W.N.; Gersten, R. Variability and trends in the A rctic S ea ice cover: Results from different techniques. J. Geophys. Res. Oceans 2017, 122, 6883–6900. [Google Scholar] [CrossRef]
- CMIP. Arctic Sea Ice in CMIP6. Geophys. Res. Lett. 2020, 47, e2019GL086749. [Google Scholar] [CrossRef]
- Meier, W.N.; Hovelsrud, G.K.; Oort, B.E.; Key, J.R.; Kovacs, K.M.; Michel, C.; Haas, C.; Granskog, M.A.; Gerland, S.; Perovich, D.K. Arctic sea ice in transformation: A review of recent observed changes and impacts on biology and human activity. Rev. Geophys. 2014, 52, 185–217. [Google Scholar] [CrossRef]
- Melia, N.; Haines, K.; Hawkins, E. Sea ice decline and 21st century trans-Arctic shipping routes. Geophys Res. Lett. 2016, 43, 9720–9728. [Google Scholar] [CrossRef]
- Stephenson, S.R.; Smith, L.C.; Agnew, J.A. Divergent long-term trajectories of human access to the Arctic. Nat. Clim. Chang. 2011, 1, 156–160. [Google Scholar] [CrossRef]
- Ng, A.K.; Andrews, J.; Babb, D.; Lin, Y.; Becker, A. Implications of climate change for shipping: Opening the Arctic seas. Wiley Interdiscip. Rev. Clim. Chang. 2018, 9, e507. [Google Scholar] [CrossRef]
- Dammann, D.O.; Eicken, H.; Mahoney, A.; Meyer, F.; Betcher, S. Assessing sea ice trafficability in a changing Arctic. Arctic 2018, 71, 59–75. [Google Scholar] [CrossRef]
- Ford, J.D.; Maillet, M.; Pouliot, V.; Meredith, T.; Cavanaugh, A.; Team, I.R. Adaptation and Indigenous peoples in the United Nations Framework Convention on Climate Change. Clim. Chang. 2016, 139, 429–443. [Google Scholar] [CrossRef]
- Ford, J.; Clark, D.; Pearce, T.; Berrang-Ford, L.; Copland, L.; Dawson, J.; New, M.; Harper, S. Changing access to ice, land and water in Arctic communities. Nat. Clim. Chang. 2019, 9, 335–339. [Google Scholar] [CrossRef]
- Dammann, D.O.; Eicken, H.; Mahoney, A.; Meyer, F.; Freymueller, J.; Kaufman, A.M. Evaluating landfast sea ice stress and fracture in support of operations on sea ice using SAR interferometry. Cold Reg. Sci. Technol. 2018. [Google Scholar] [CrossRef]
- Fraser, A.D.; Massom, R.A.; Ohshima, K.I.; Willmes, S.; Kappes, P.J.; Cartwright, J.; Porter-Smith, R. High-resolution mapping of circum-Antarctic landfast sea ice distribution, 2000–2018. Earth Syst. Sci. Data Discuss. 2020, 12, 2987–2999. [Google Scholar] [CrossRef]
- Kwok, R.; Markus, T.; Kurtz, N.; Petty, A.; Neumann, T.; Farrell, S.; Cunningham, G.; Hancock, D.; Ivanoff, A.; Wimert, J. Surface height and sea ice freeboard of the Arctic Ocean from ICESat-2: Characteristics and early results. J. Geophys. Res. Ocean. 2019, 124, 6942–6959. [Google Scholar] [CrossRef]
- Zakhvatkina, N.; Smirnov, V.; Bychkova, I. Satellite sar data-based sea ice classification: An overview. Geosciences 2019, 9, 152. [Google Scholar] [CrossRef]
- Berg, A.; Eriksson, L.E.B. Investigation of a hybrid algorithm for sea ice drift measurements using synthetic aperture radar images. IEEE Trans. Geosci. Remote Sens. 2014, 52, 5023–5033. [Google Scholar] [CrossRef]
- Dammann, D.O.; Eicken, H.; Saiet, E.; Mahoney, A.; Meyer, F.; George, J.C. Traversing sea ice—Linking surface roughness and ice trafficability through SAR polarimetry and interferometry IEEE J. Sel. Top. Appl. Earth Obs. Remote Sens. 2017, 11, 416–433. [Google Scholar] [CrossRef]
- Bell, T.; Briggs, R.; Bachmayer, R.; Li, S. Augmenting Inuit knowledge for safe sea-ice travel—The SmartICE information system. In Proceedings of the 2014 Oceans’14 St. John’s, Newfoundland, NL, Canada, 14–19 September 2014; pp. 1–9. [Google Scholar]
- Dammann, D.O.; Eriksson, L.E.; Mahoney, A.R.; Eicken, H.; Meyer, F.J. Mapping pan-Arctic landfast sea ice stability using Sentinel-1 interferometry. Cryosphere 2019, 13, 557–577. [Google Scholar] [CrossRef]
- Marbouti, M.; Eriksson, L.E.; Dammann, D.O.; Demchev, D.; Jones, J.; Berg, A.; Antropov, O. Evaluating Landfast Sea Ice Ridging near UtqiaġVik Alaska Using TanDEM-X Interferometry. Remote Sens. 2020, 12, 1247. [Google Scholar] [CrossRef]
- Dammann, D.O.; Eriksson, L.E.B.; Jones, J.M.; Romeiser, R.; Mahoney, A.R.; Fukamachi, Y. Instantaneous sea ice drift speed from TanDEM-X interferometry. Cryosphere 2019. [Google Scholar] [CrossRef]
- Rohith, M.; Jones, J.; Eicken, H.; Kambhamettu, C. Extracting quantitative information on coastal ice dynamics and ice hazard events from marine radar digital imagery. IEEE Trans. Geosci. Remote Sens. 2013, 51, 2556–2570. [Google Scholar]
- Jones, J.M.; Eicken, H.; Mahoney, A.R.; Rohith, M.V.; Kambhamettu, C.; Fukamachi, Y.; Ohshima, K.I.; George, J.C. Landfast sea ice breakouts: Stabilizing ice features, oceanic and atmospheric forcing at Barrow, Alaska. Cont. Shelf Res. 2016, 126. [Google Scholar] [CrossRef]
- Rabault, J.; Sutherland, G.; Gundersen, O.; Jensen, A.; Marchenko, A.; Breivik, Ø. An open source, versatile, affordable waves in ice instrument for scientific measurements in the Polar Regions. Cold Reg. Sci. Technol. 2020, 170, 102955. [Google Scholar] [CrossRef]
- Johnson, M.; Mahoney, A.; Sybrandy, A.; Montgomery, G. Measuring Acceleration and Short-Lived Motion in Landfast SEA-ICE. J. Ocean. Technol. 2020, 15, 115–131. [Google Scholar]
- Strozzi, T.; Werner, C.; Wiesmann, A.; Wegmüller, U. Topography mapping with a portable real-aperture radar interferometer. IEEE Geosci. Remote Sens. Lett. 2011, 9, 277–281. [Google Scholar] [CrossRef]
- Kos, A.; Strozzi, T.; Stockmann, R.; Wiesmann, A.; Werner, C. Detection and characterization of rock slope instabilities using a portable radar interferometer (GPRI). In Landslide Science and Practice; Springer: Berlin/Heidelberg, Germany, 2013; pp. 325–329. [Google Scholar]
- Strozzi, T.; Raetzo, H.; Wegmüller, U.; Papke, J.; Caduff, R.; Werner, C.; Wiesmann, A. Satellite and terrestrial radar interferometry for the measurement of slope deformation. In Engineering Geology for Society and Territory-Volume 5; Springer: Cham, Switzerland, 2015; pp. 161–165. [Google Scholar]
- Wiesmann, A.; Caduff, R.; Strozzi, T.; Papke, J.; Mätzler, C. Monitoring of dynamic changes in alpine snow with terrestrial radar imagery. In Proceedings of the 2014 IEEE Geoscience and Remote Sensing Symposium, Quebec City, QC, Canada, 13–18 July 2014; pp. 3662–3665. [Google Scholar]
- Riesen, P.; Strozzi, T.; Bauder, A.; Wiesmann, A.; Funk, M. Short-term surface ice motion variations measured with a ground-based portable real aperture radar interferometer. J. Glaciol. 2011, 57, 53–60. [Google Scholar] [CrossRef]
- Asbjørnslett, A.H. Analysis of the potential of the Ku-band Gamma Portable Radar Interferometer for sea ice information extraction. Master’s Thesis, UiT Norges arktiske universitet, Tromsø, Norway, 2020. [Google Scholar]
- Ferretti, A.; Monti-Guarnieri, A.; Prati, C.; Rocca, F.; Massonet, D. InSAR Principles-Guidelines for SAR Interferometry Processing and Interpretation; ESA Publications: Auckland, New Zealand, 2007; p. TM-19. [Google Scholar]
- Bamler, R.; Hartl, P. Synthetic aperture radar interferometry. Inverse Probl. 1998, 14, R1. [Google Scholar] [CrossRef]
- Ding, X.; Li, Z.; Zhu, J.; Feng, G.; Long, J. Atmospheric effects on InSAR measurements and their mitigation. Sensors 2008, 8, 5426–5448. [Google Scholar] [CrossRef] [PubMed]
- Wadge, G.; Costa, A.; Pascal, K.; Werner, C.; Webb, T. The variability of refractivity in the atmospheric boundary layer of a tropical island volcano measured by ground-based interferometric radar. Bound.-layer Meteorol. 2016, 161, 309–333. [Google Scholar] [CrossRef] [PubMed]
- Zebker, H.A.; Villasenor, J. Decorrelation in interferometric radar echoes. IEEE Trans. Geosci. Remote Sens. 1992, 30, 950–959. [Google Scholar] [CrossRef]
- Rosen, P.A.; Hensley, S.; Joughin, I.R.; Li, F.K.; Madsen, S.N.; Rodriguez, E.; Goldstein, R.M. Synthetic aperture radar interferometry. Proc. IEEE 2000, 88, 333–382. [Google Scholar] [CrossRef]
- Werner, C.; Wiesmann, A.; Strozzi, T.; Kos, A.; Caduff, R.; Wegmiüler, U. The GPRI multi-mode differential interferometric radar for ground-based observations. In Proceedings of the EUSAR 2012; 9th European Conference on Synthetic Aperture Radar, Nuremberg, Germany, 23–26 April 2012; pp. 304–307. [Google Scholar]
- Weeks, W. On Sea Ice; University of Alaska Press: Fairbanks, Alaska, 2010; 664p. [Google Scholar]
- Rampal, P.; Weiss, J.; Marsan, D. Positive trend in the mean speed and deformation rate of Arctic sea ice, 1979–2007. J. Geophys. Res. Ocean. 2009, 114. [Google Scholar] [CrossRef]
- Dammann, D.O.; Eicken, H.; Meyer, F.; Mahoney, A. Assessing small-scale deformation and stability of landfast sea ice on seasonal timescales through L-band SAR interferometry and inverse modeling. Remote Sens. Environ. 2016, 187, 492–504. [Google Scholar] [CrossRef]
Publisher’s Note: MDPI stays neutral with regard to jurisdictional claims in published maps and institutional affiliations. |
© 2020 by the authors. Licensee MDPI, Basel, Switzerland. This article is an open access article distributed under the terms and conditions of the Creative Commons Attribution (CC BY) license (http://creativecommons.org/licenses/by/4.0/).