Article

Tree Recognition on the Plantation Using UAV Images with Ultrahigh Spatial Resolution in a Complex Environment

1
Research Institute of Forest Resource Information Techniques, Chinese Academy of Forestry, Beijing 100091, China
2
School of Computer and Information Technology, Xinyang Normal University, Xinyang 464000, China
3
Key Laboratory of Forest Management and Growth Modeling, National Forestry and Grassland Administration, Beijing 100091, China
4
Institute of Forestry, Tribhuwan University, Kirtipur 44600, Nepal
5
College of Information Science and Technology, Nanjing Forestry University, Nanjing 210037, China
*
Author to whom correspondence should be addressed.
Remote Sens. 2021, 13(20), 4122; https://doi.org/10.3390/rs13204122
Submission received: 9 September 2021 / Revised: 10 October 2021 / Accepted: 11 October 2021 / Published: 14 October 2021

Abstract

:
The survival rate of seedlings is a decisive factor of afforestation assessment. Generally, ground checking is more accurate than any other methods. However, the survival rate of seedlings can be higher in the growing season, and this can be estimated in a larger area at a relatively lower cost by extracting the tree crown from the unmanned aerial vehicle (UAV) images, which provides an opportunity for monitoring afforestation in an extensive area. At present, studies on extracting individual tree crowns under the complex ground vegetation conditions are limited. Based on the afforestation images obtained by airborne consumer-grade cameras in central China, this study proposes a method of extracting and fusing multiple radii morphological features to obtain the potential crown. A random forest (RF) was used to identify the regions extracted from the images, and then the recognized crown regions were fused selectively according to the distance. A low-cost individual crown recognition framework was constructed for rapid checking of planted trees. The method was tested in two afforestation areas of 5950 m2 and 5840 m2, with a population of 2418 trees (Koelreuteria) in total. Due to the complex terrain of the sample plot, high weed coverage, the crown width of trees, and spacing of saplings vary greatly, which increases both the difficulty and complexity of crown extraction. Nevertheless, recall and F-score of the proposed method reached 93.29%, 91.22%, and 92.24% precisions, respectively, and 2212 trees were correctly recognized and located. The results show that the proposed method is robust to the change of brightness and to splitting up of a multi-directional tree crown, and is an automatic solution for afforestation verification.

Graphical Abstract

1. Introduction

The global ecosystem has been seriously threatened with the increase of greenhouse gas emissions, which will also have a devastating impact on biodiversity [1,2]. The forest is the largest ecosystem on the land, providing a wide range of economic and social benefits for humans through various forest products. The forest is also an important carbon sink system, reducing the concentration of greenhouse gases in the atmosphere [3,4]. Although forests have brought huge benefits, the problem of deforestation still exists, and the global forest area is declining [5,6,7]. Therefore, afforestation has been used as an effective strategy to alleviate global warming, especially in mountainous and hilly areas with little economic value. It is important to assess afforestation in these regions. Manual checking of surviving trees is laborious and costly. With the wide application of UAV remote sensing in agriculture and forestry, different airborne equipment can be used to obtain ultrahigh spatial resolution data [8,9,10,11,12]. The efficiency of vegetation monitoring and environmental parameter acquisition could be improved and the cost of agriculture and forestry production reduced [13,14]. The image visualization technology can be used to efficiently assess afforestation. Recognition of individual tree crowns (ITCs) has been the key method of afforestation assessment in the complex environment [15,16,17,18].
Most UAV-based studies have focused on plant detection and counting. The common method is to use different algorithms to generate the corresponding data structure according to the data characteristics of the airborne equipment, and analyze the data to distinguish the number and location of plants. The spectral, spatial, and contextual features of aerial images taken at different locations are different, and the methods used to extract image features for identifying ITCs are different. Color is the most important feature for ITC recognition, and different color indexes are usually used to enhance the recognition effect. The most commonly used color indexes exist in the red, green, and blue (RGB) color space, which have different efficiency in identifying plants under various soil, residue, and light conditions. In a study by Loris, green grass comparison was used to compare and test the measured data of ten different grassland management methods, and the results showed that the G-R index of aerial imagery was highly correlated with the ground truth [19,20]. By evaluating the application of high-resolution UAV digital photos in vegetation remote sensing, the Normalized Green–Red Difference Index (NGRDI) was used to reduce the changes caused by the difference of irradiance and exposure, and to explore the prediction of vegetation reflectance through the scattering model of arbitrarily inclined leaves [21]. After studying the optical detection of plants, and discussing the color distribution of plants and soil in digital images in detail, various color indexes used to identify vegetation and background were calculated, and several color coordinate indexes were used to successfully distinguish weeds and non-plant surfaces [22]. The correlation coefficient between the spectral reflectance and sugar beet diseases was the highest in the visible light band [23]. Long-term practice has shown that the use of UAV to quickly evaluate forest regeneration can help reduce the cost of investigation. Through experiments, using a sampling-based consumer camera shooting method, a decision rule for seedling detection based on simple RGB and red edge (RE) image processing can be established. The results have shown that drones can use RGB cameras to detect conifer seedlings [24]. According to the study, convolutional neural network (CNN), hyper-spectral UAV images and a watershed algorithm [25], object clustering extraction method, etc. were mainly applied in structured environments, and are difficult to apply in complex environment. In the case of high weed coverage, the multi-scale retinex (MSR) method can enhance the distinction between foreground and background, and the average accuracy of the results obtained by a fruit tree SVM segmentation model is 85.27% ± 9.43% [16]. Not only that, the Normalized Excessive Green Index was used to indicate the green vegetation in UAV automatic urban monitoring [26], and a variety of indices were also used to segment vegetation, estimate biomass, and guide precision agricultural production [27,28,29,30]. All these studies have shown that the spectral characteristics of UAV images can be used to initially classify vegetation.
At the same time, the International Commission on Illumination (CIE) L*a*b* color space is also often used to identify vegetation and soil [31]. In L*a*b*, the extraction accuracy of vegetation coverage is further improved by applying a Gaussian mixture model [32,33,34]. K-means and L*a*b* color space have been used to detect individual trees from the oblique imaging taken by UAV in cities [35]. XGBoost classification algorithm was used to solve the identification problem of interlacing orchard canopy [15]. Dynamic segmentation, Hough transform, and generalized linear model have been widely used in missing plant detection [36,37]. Computer-unified device architecture (CUDA) speeds up the calculation speed in the process of finding the largest canopy blob area [38], and light detection and ranging (LiDAR) point cloud analysis method also plays an important role [39]. Mathematical morphology also plays an important role, combined with elevation information to realize automatic counting and geographic positioning of olive crowns [40]. Multispectral images can accurately measure the structure of litchi trees [41]. In addition, the airborne multispectral laser scanning technology improves the recognition accuracy of individual trees and dominant trees [42,43,44]. Deep learning further improves segmentation accuracy [45,46], and is widely used in tree crown contour recognition—using the convolutional neural network Mask RCNN algorithm for crown contour identification and rendering, accuracy reached 0.91 [47]. The detection of economic tree species in high-resolution remote sensing images has always been a consideration. Although palm crowns in the study area often overlap, with the support of large-scale multi-class samples collected, the detection accuracy of oil palm trees based on the deep convolutional neural network DCNN has reached 92–97% [48]. The tree crown in simple scenes can also be automatically extracted from UAV images using neural networks to estimate biomass [49] and tree species classification [50].
This paper proposes a simple and effective method to detect and count tree crowns, multi-radius extraction and fusion based on a chromatic mapping method (MREFCM). Based on the statistical results of the transformation of multiple color indexes as a reference, the crown morphology extraction method was tested to obtain the optimized extraction parameters and a multi-scale extraction fusion method was defined, including a multi-radius closed filter and the fusion of multiple extraction results. The aims of the study were: (1) to determine whether the RF classifier shows good performance in crown recognition; (2) to test if the inclusion of two texture features improves the classification accuracy of tree crown; (3) to compare the proposed method with other crown extraction methods in a complex environment to verify the performance.
This study also intended to accurately extract tree crowns as well as further improve the recognition effect of ITCs and improve the efficiency of monitoring afforestation. In order to better adapt to the various crown forms of broad-leaved seedlings in new afforestation, this study used the combination of fusion extraction of multiple radius filters and an RF was used to recognize ITCs. The proposed method can be used as a supplement to the research on ITC recognition using color index technology.

2. Materials and Methods

2.1. Study Area

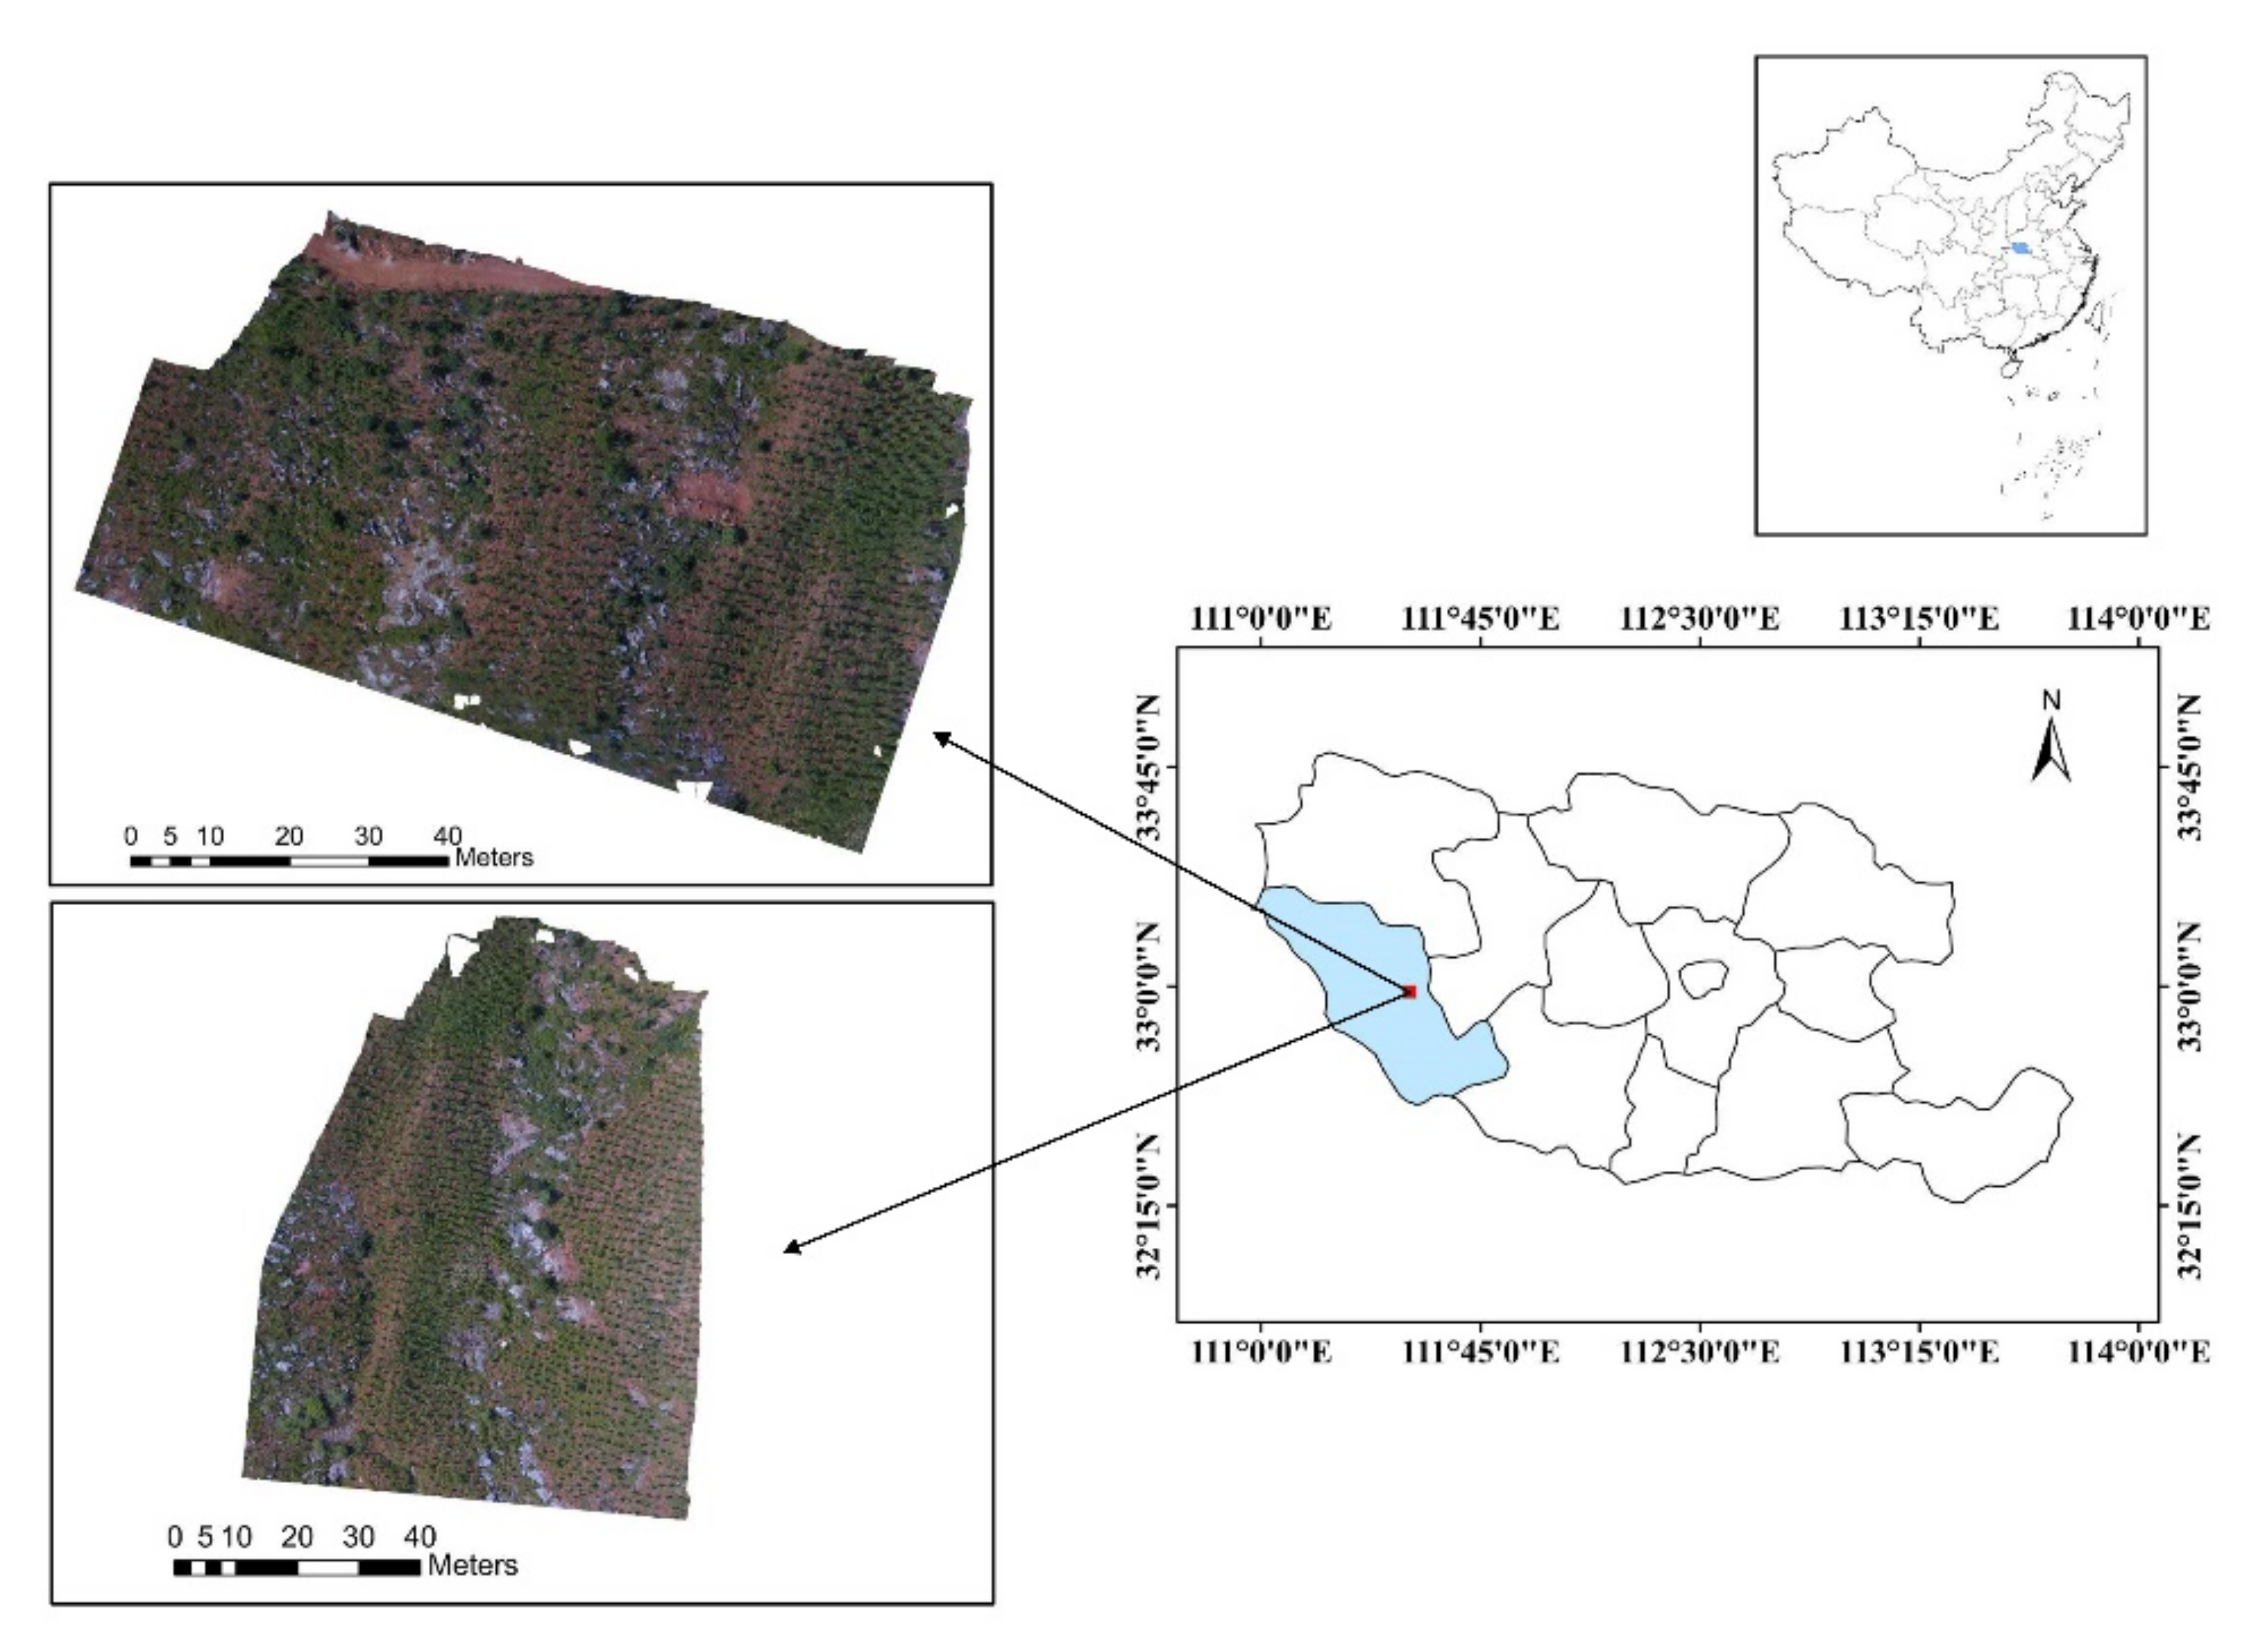
The study area is located in the west of Xichuan County, Nanyang City, Henan Province, China, 110°58′ E–111°53′ E, 32°55′ N–33°23′ N (Figure 1). The mountains in the county are widely distributed, extending from northwest to southeast, and the altitude gradually decreases, which belongs to the monsoon climate zone of transition from the northern subtropical to warm temperate zone, including Dashiqiao Township, Maotang Township, Xihua Township, and Taohe Township, with a total area of 2820 km2. The annual average temperature is 15.8 °C, and the annual rainfall is between 391.3 mm and 1423.7 mm. Two adjacent woodlands on both sides of the ridge in Dashiqiao Township were selected as the test sites for tree crown extraction and recognition. The sites are pure forests of Koelreuteria paniculata Laxm, where the crown diameters are between 20–70 cm. As a common tree species for afforestation in China, the selection of this study area is helpful to understand the effect of mountain afforestation. It should be noted that the weed coverage between the trees varies greatly, and the interspersed bushes are very lush, some of which are larger than the adjacent crown. The average altitude of the study area is 390 m, with an area of 5900 m2 and 5840 m2, respectively. An overall image of the study sites is shown in Figure 1.

2.2. Data Sources

The images were collected in June 2018 using DJI Phantom4 UAV (Shenzhen Dajiang Innovation Technology Co., Ltd., Shenzhen, China). The image acquisition component under the quadrotor supports GPS/GLONASS dual-mode positioning system, and the 3-axis gimbal stabilization provides a steady platform for the attached CMOS digital camera (Sony Exmor R CMOS 1/2.3-inch).
The flying height of the UAV is 20 m and 35 m, and the ground sampling distance is 0.7 cm and 1.3 cm, respectively, verifying the applicability of the proposed algorithm to images of different resolutions. These digital images are stored in the red–green–blue (RGB) color space with JPEG format. Using this color space to store natural scenes is conducive to transforming each channel of RGB to obtain more specific features in the image [51]. The specifications of drones and airborne cameras are shown in Table 1.
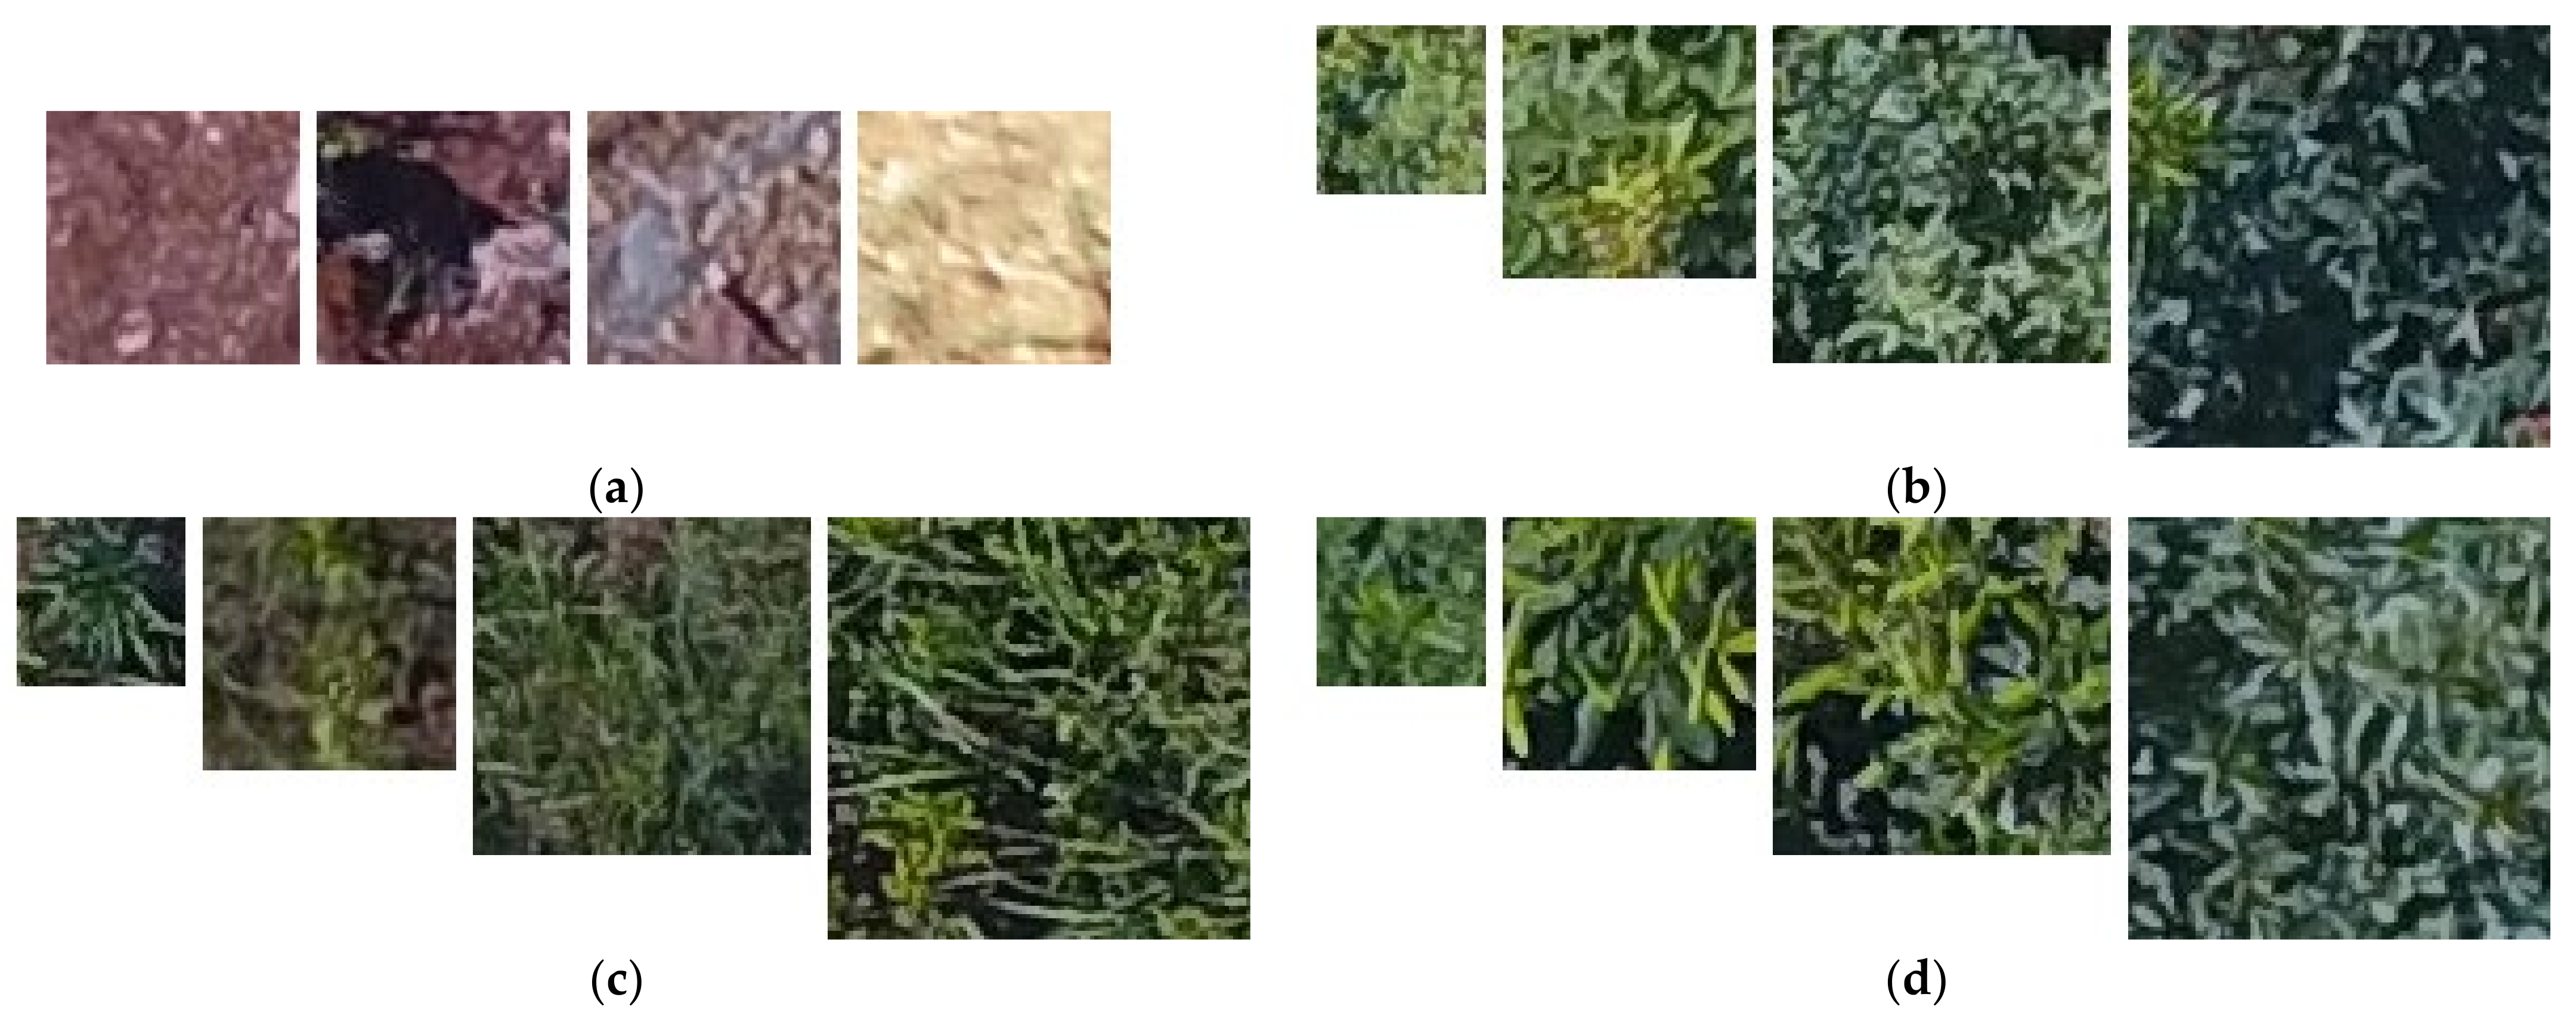
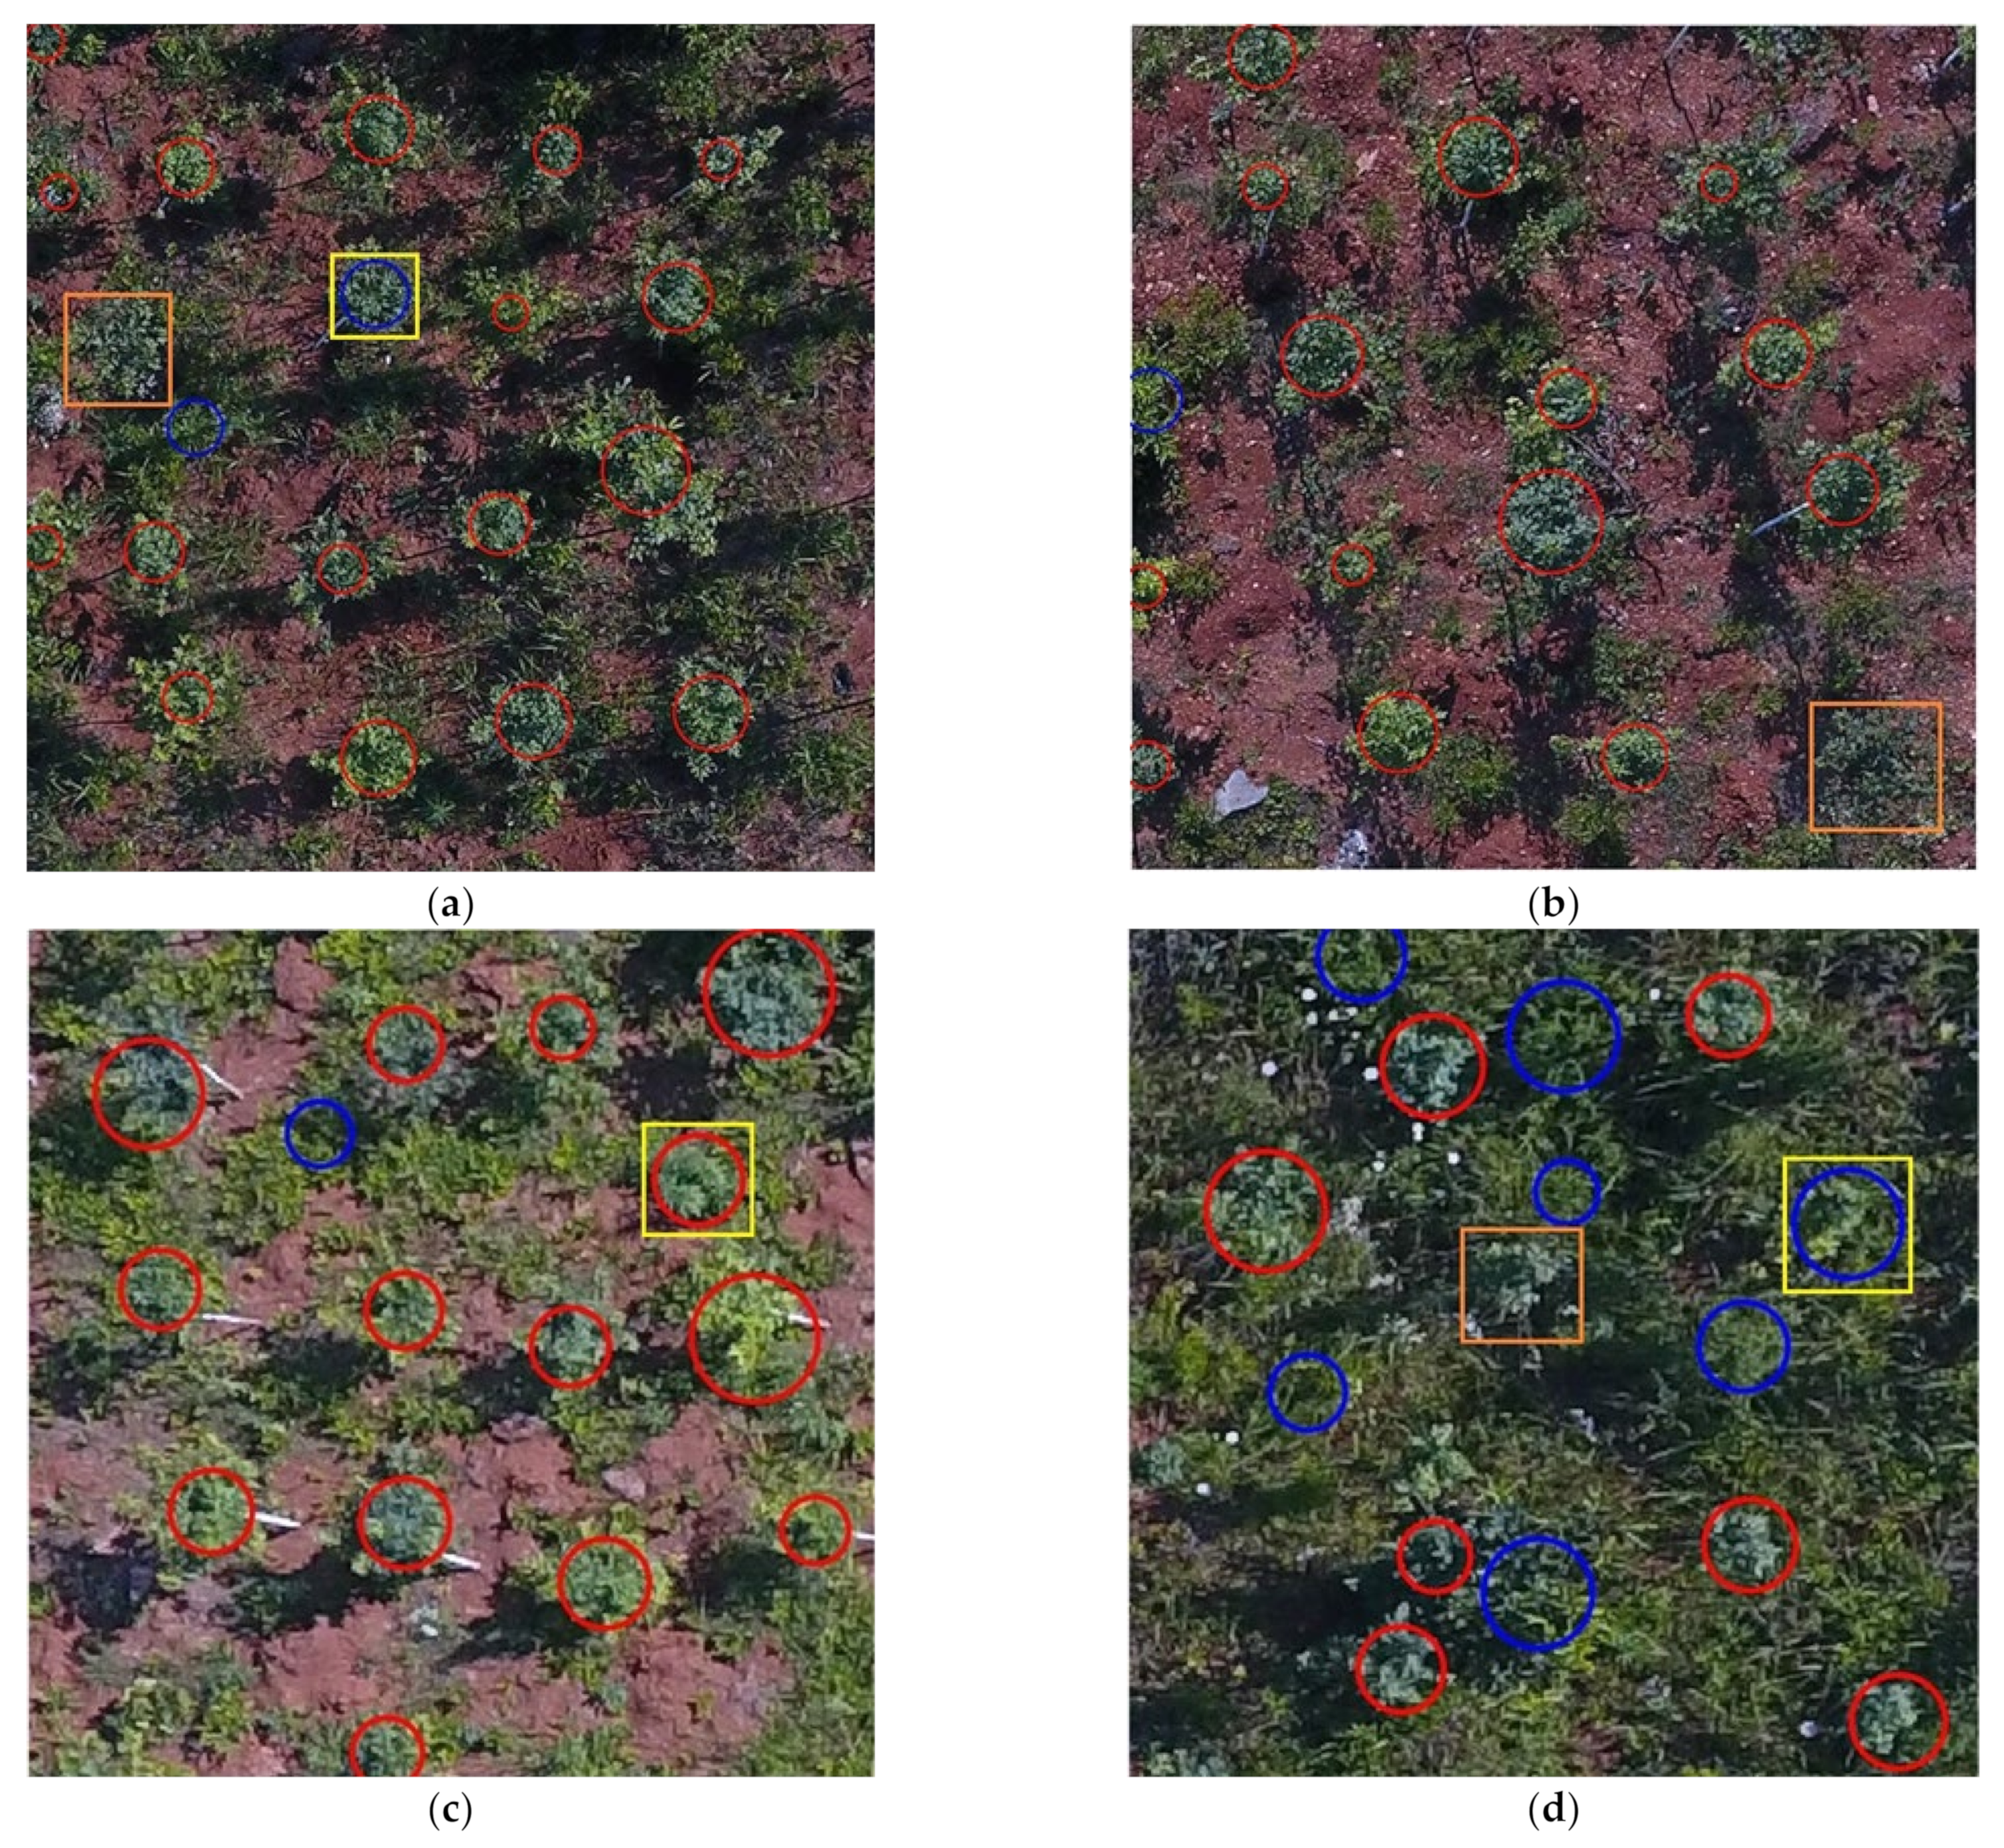
A total of 180 images were randomly selected for training and 168 images for testing, and the test dataset comprised 2418 trees. The crown size of broad-leaved seedlings varies greatly (20–70 cm), therefore, in order to improve the recognition effect, the crown training area in the training set was manually marked as a rectangle of 40 × 40~100 × 100 pixels with a size interval of 20 pixels. At the same time, the soil has no clear “individual” boundary and clear size, so only training samples of 60 × 60 pixels were collected from the soil. A total of 1400 areas were randomly selected to form the training set, including 600 positive samples of trees, 500 negative samples of weeds, 200 negative samples of shrubs, and 100 negative samples of soil (some samples include shadows). The color features and texture features of samples were used to build feature data pool, which was used to build RF model. Figure 2 shows some image samples in the training set under different conditions.
The images were classified according to the fraction vegetation coverage (FVC), flight height, and brightness. FVC is the percentage of the total image in the HSI color space where the hue is in [π/2, π]. It shows the growth of vegetation in the image, which is used to measure the weed coverage under the forest, and indicates the interference degree of tree crown extraction. The classification of FVC is as follows: LFVC (low FVC), h < 45%; MFVC (middle FVC), 45% ≤ h < 60%; HFVC (high FVC), h ≥ 60%, where h is the ratio of the vegetation to the image area. Two flight altitudes were selected: 35 m and 20 m. Two kinds of brightness intensities were also selected (BI): insufficient brightness (IB) and sufficient brightness (SB), IB means I < 0.3 in HSI color space and SB means I ≥ 0.3. The images of the test set were calculated and grouped according to the above classification criteria, as shown in Table 2. FVC and BI in the table are the average values of the corresponding groups. Details can be found in the literature [16].

2.3. Framework of Research

At present, there are many studies that have introduced ITC recognition. For the detailed introduction of color index and morphological filtering, please refer to the literature [16,17,22,24].
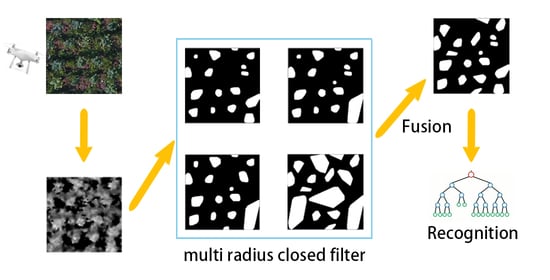
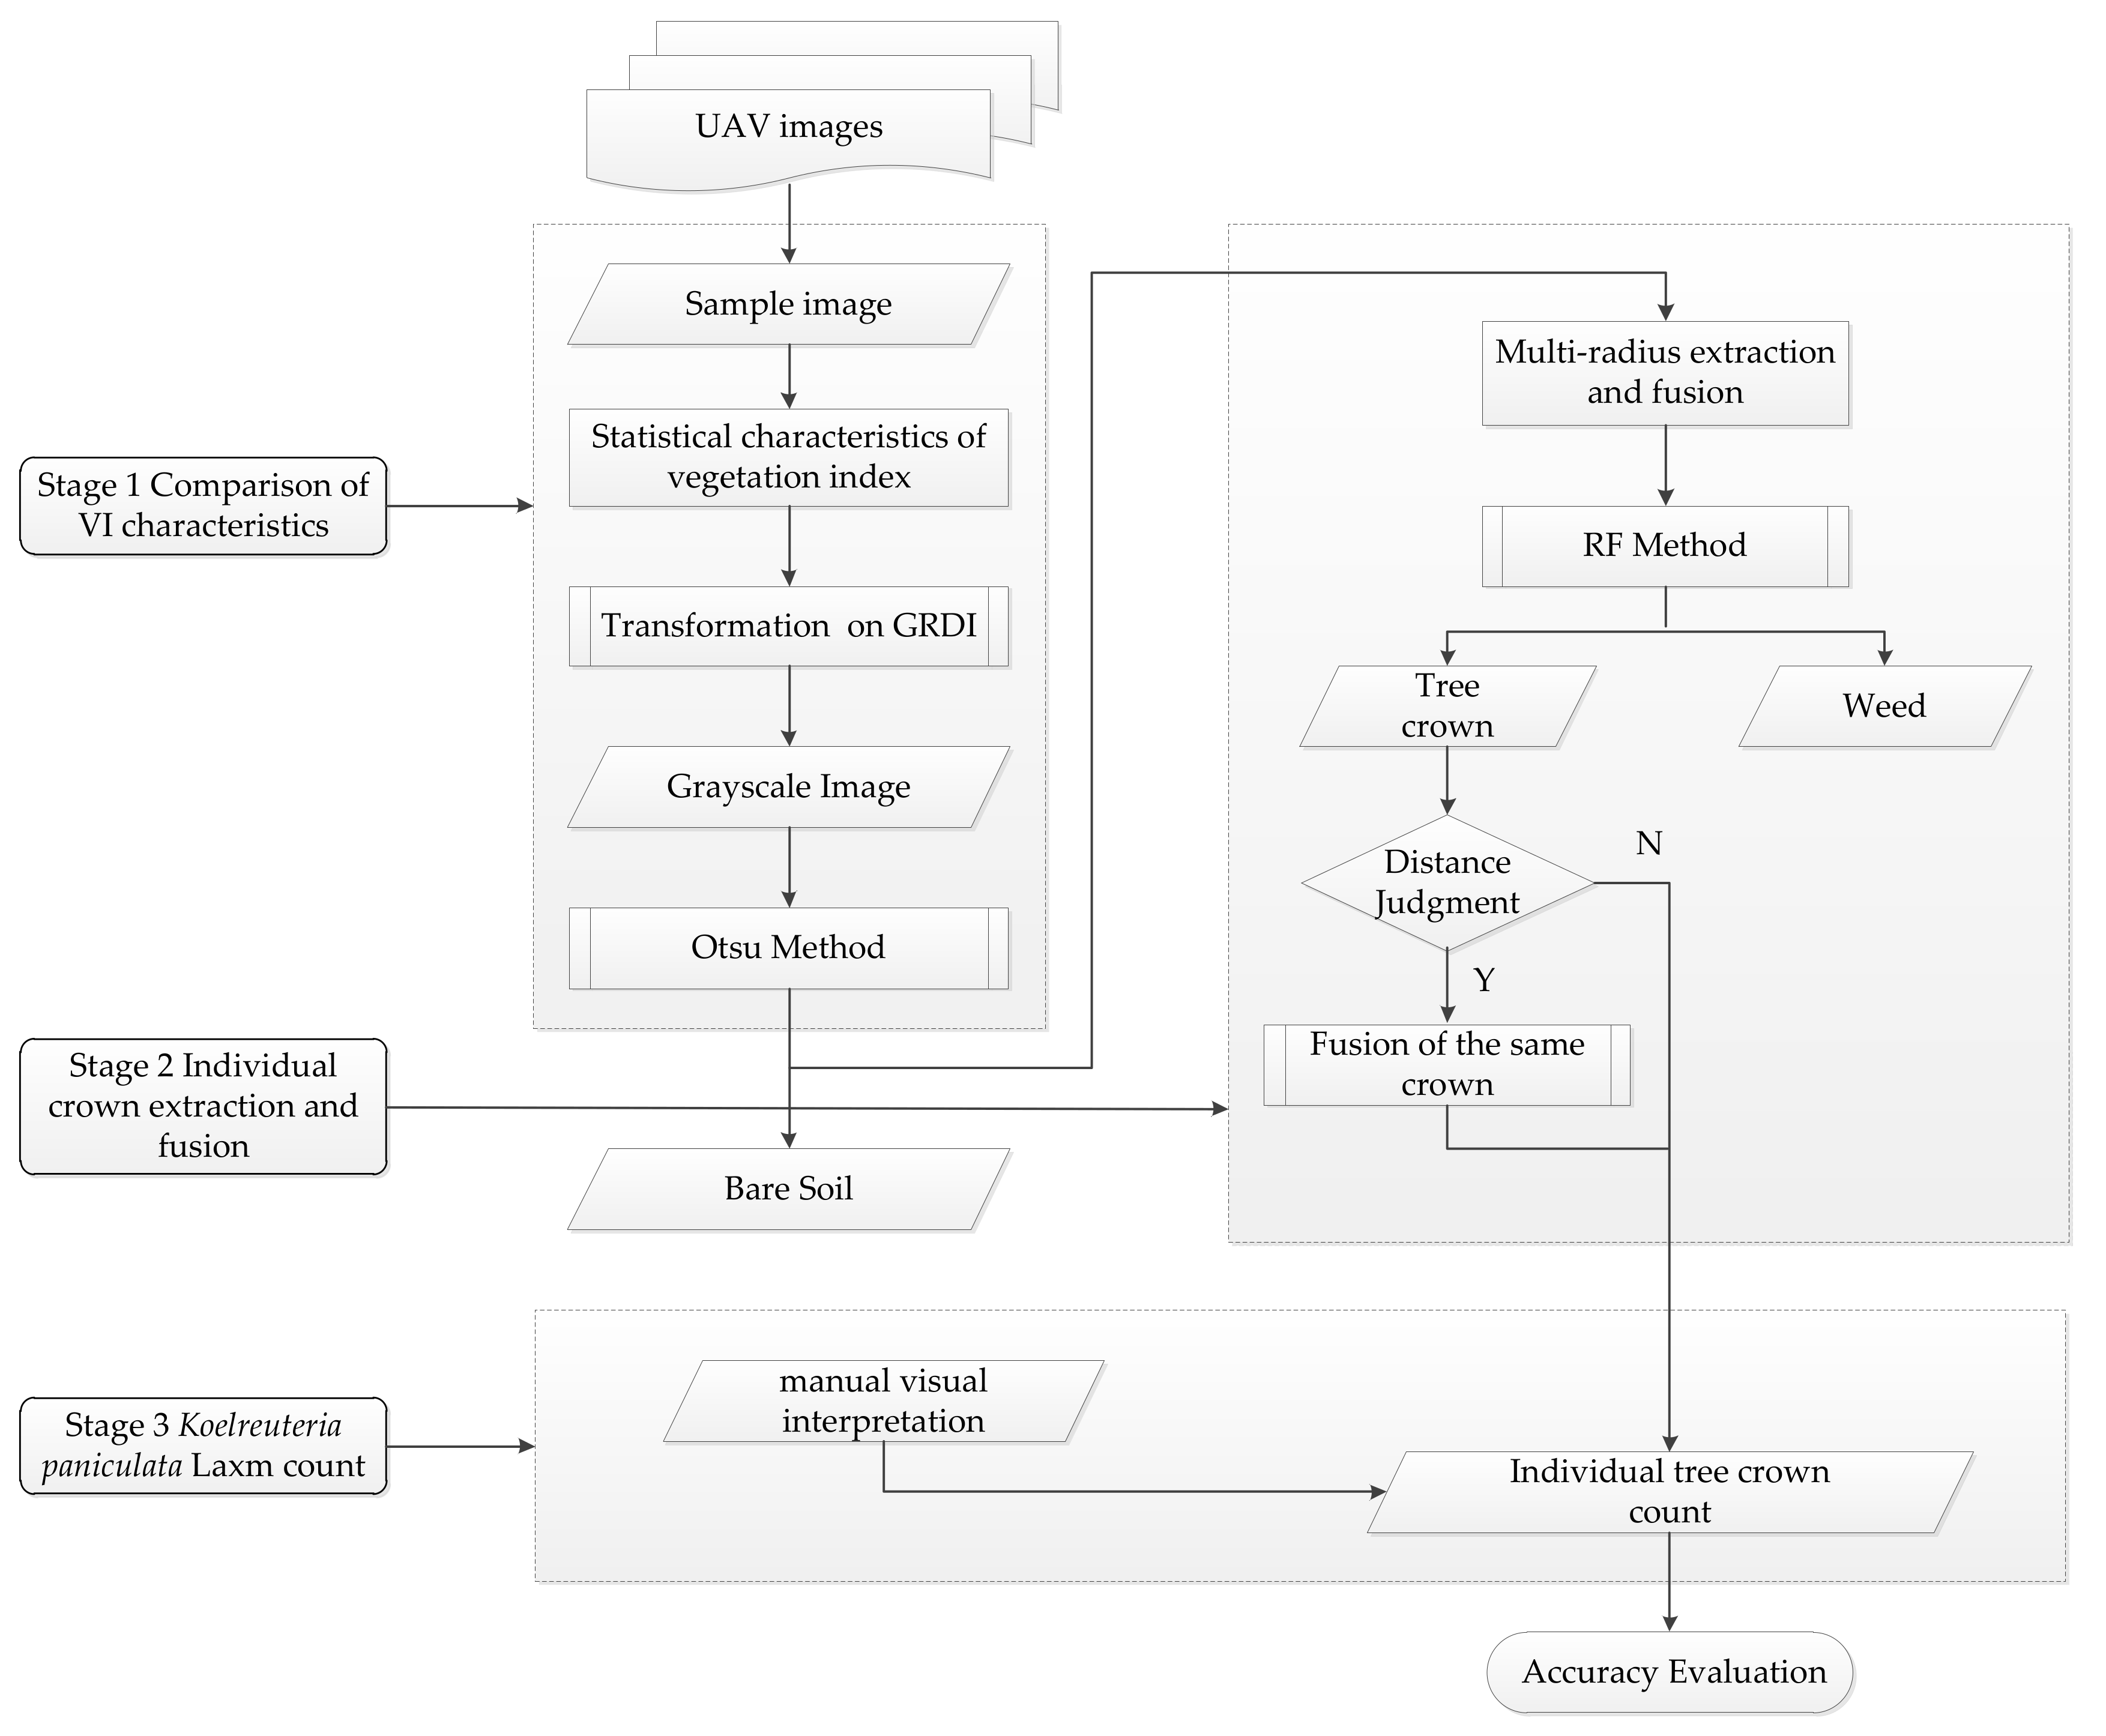
Figure 3, which is a summarized form of the methodological flowchart, shows the three main stages of the proposed method in this paper: in the vegetation index selection stage, the most suitable color mapping method was selected by comparing the statistical results of the vegetation index. Then, the multi-radius extraction and fusion method was used to obtain the potential tree crown regions, namely the region of interest (RoI). Finally, RF was used to identify the extracted regions and fusion was performed selectively according to the distance.

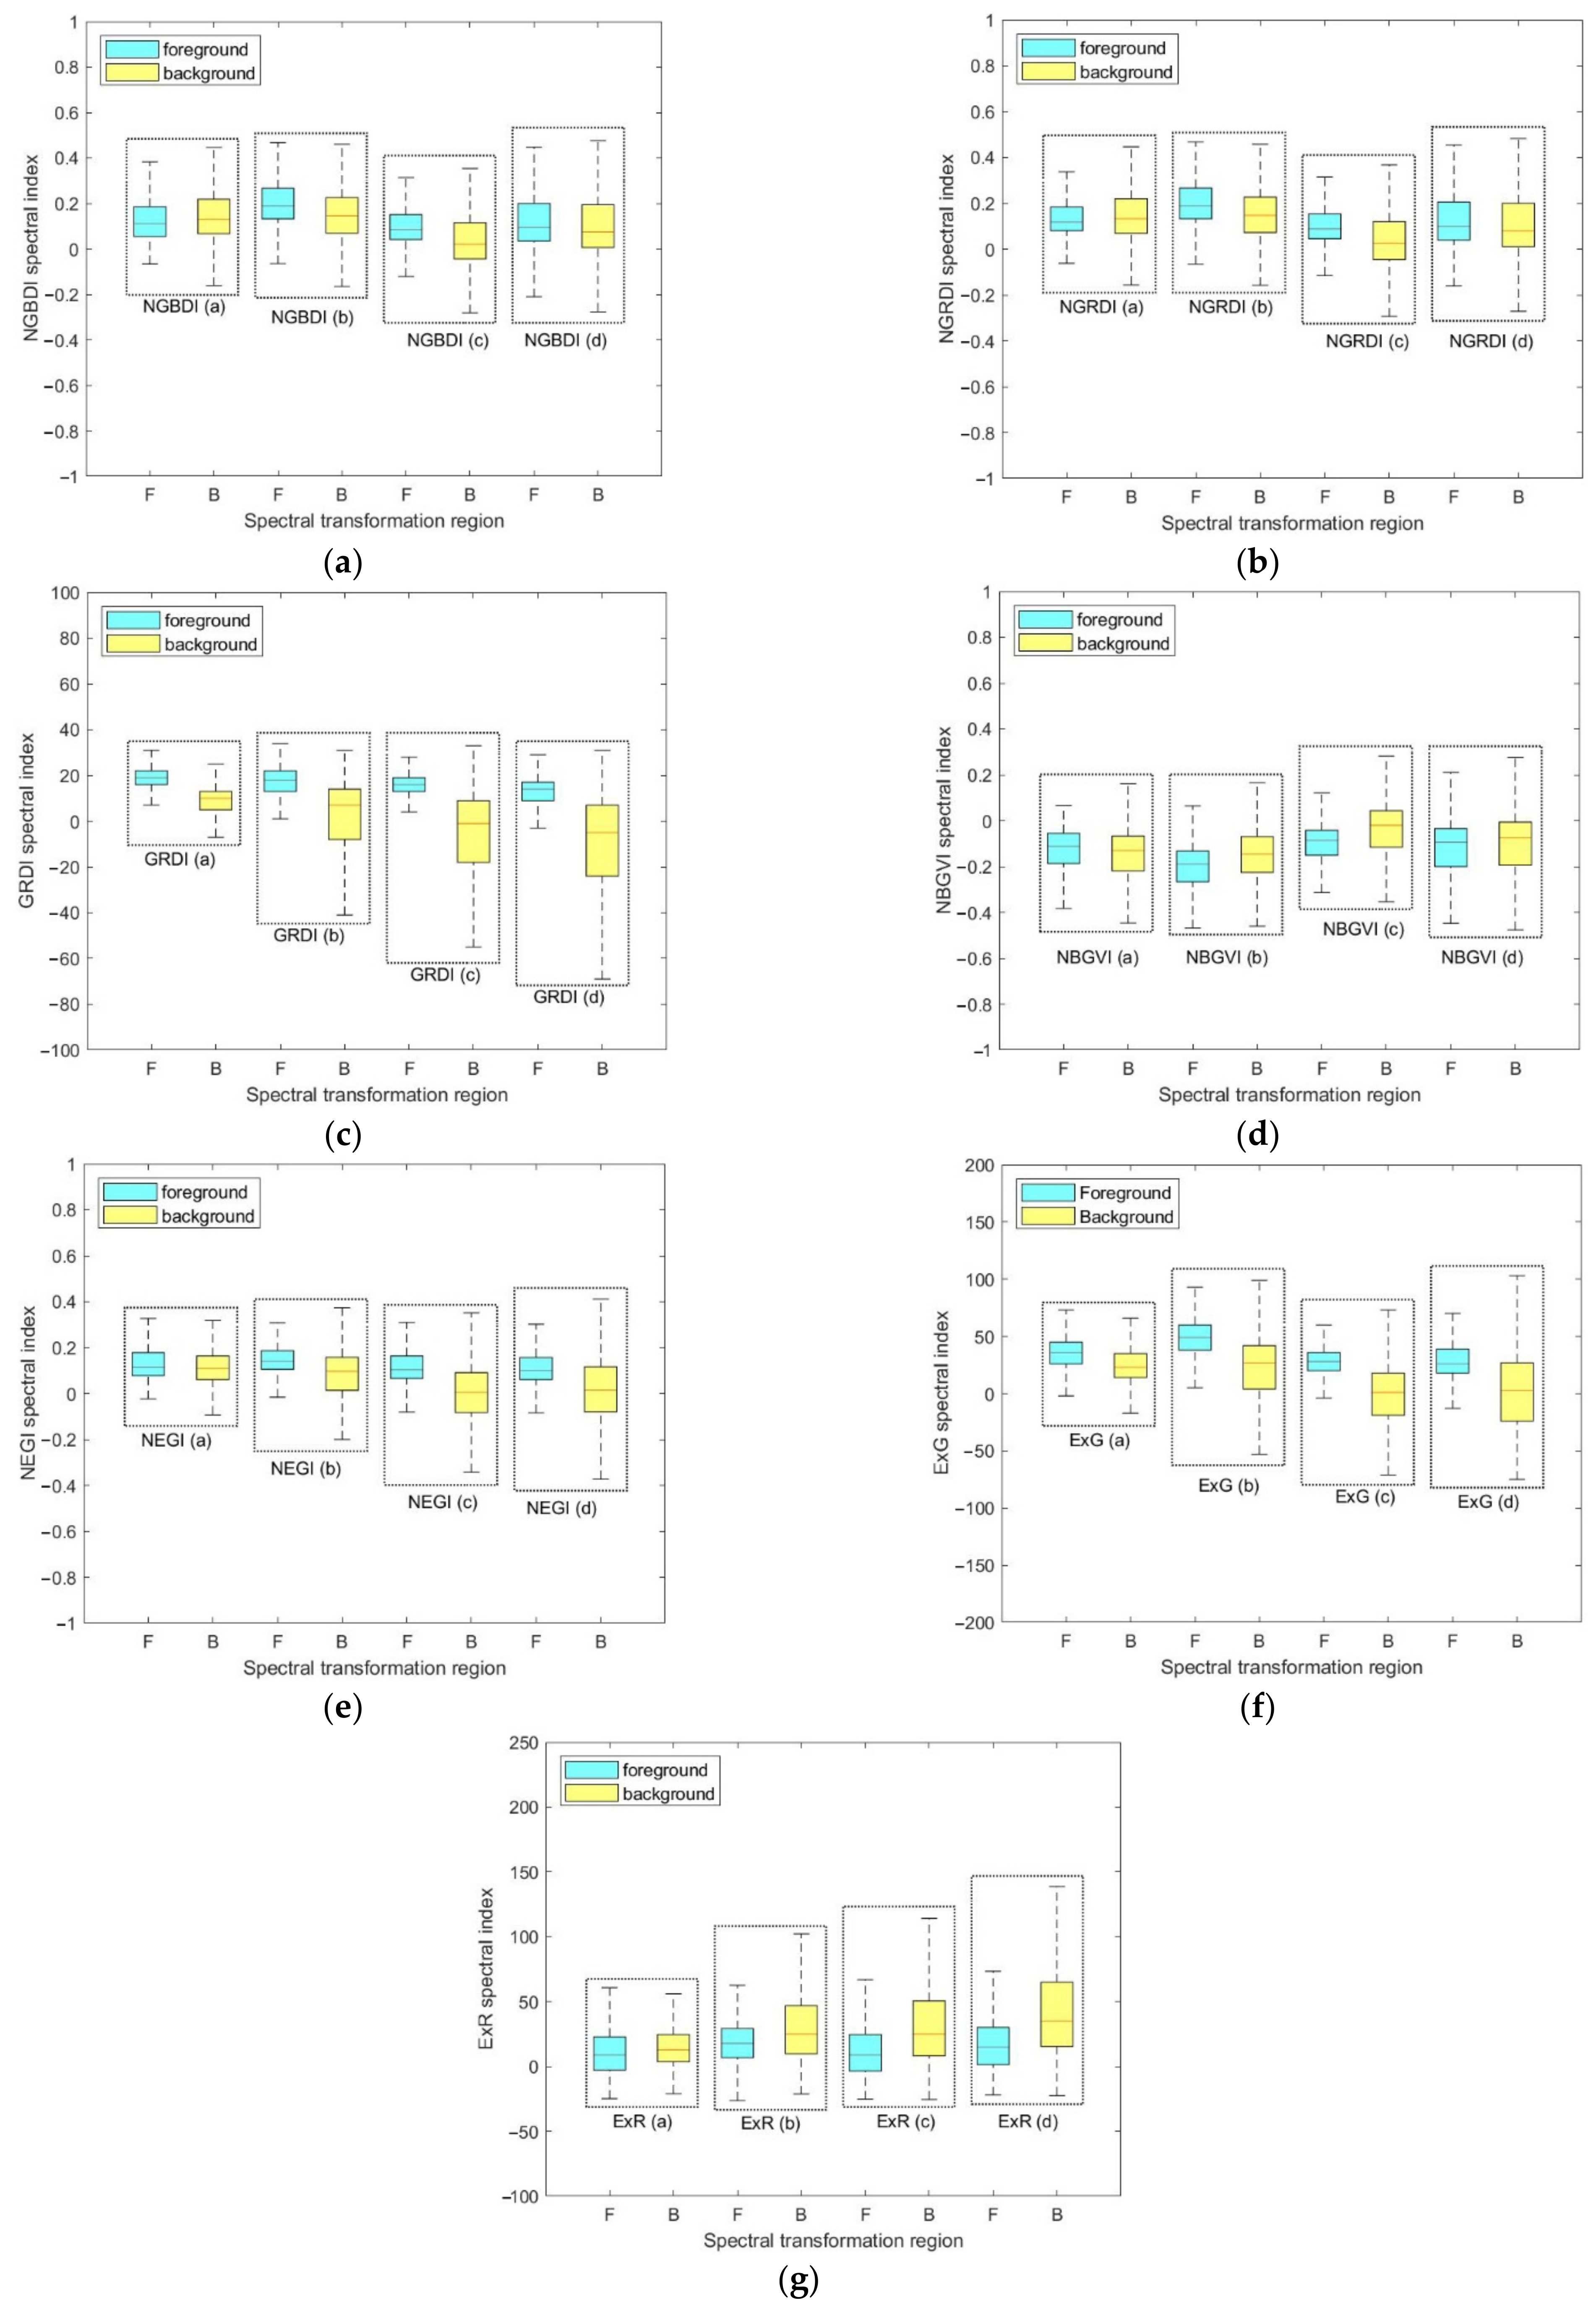
2.4. Spectral Index Selection

As the first step of image processing, the images collected by UAV were preprocessed with an appropriate spectral index to obtain better extraction results, a process that was confirmed in previous studies [27,
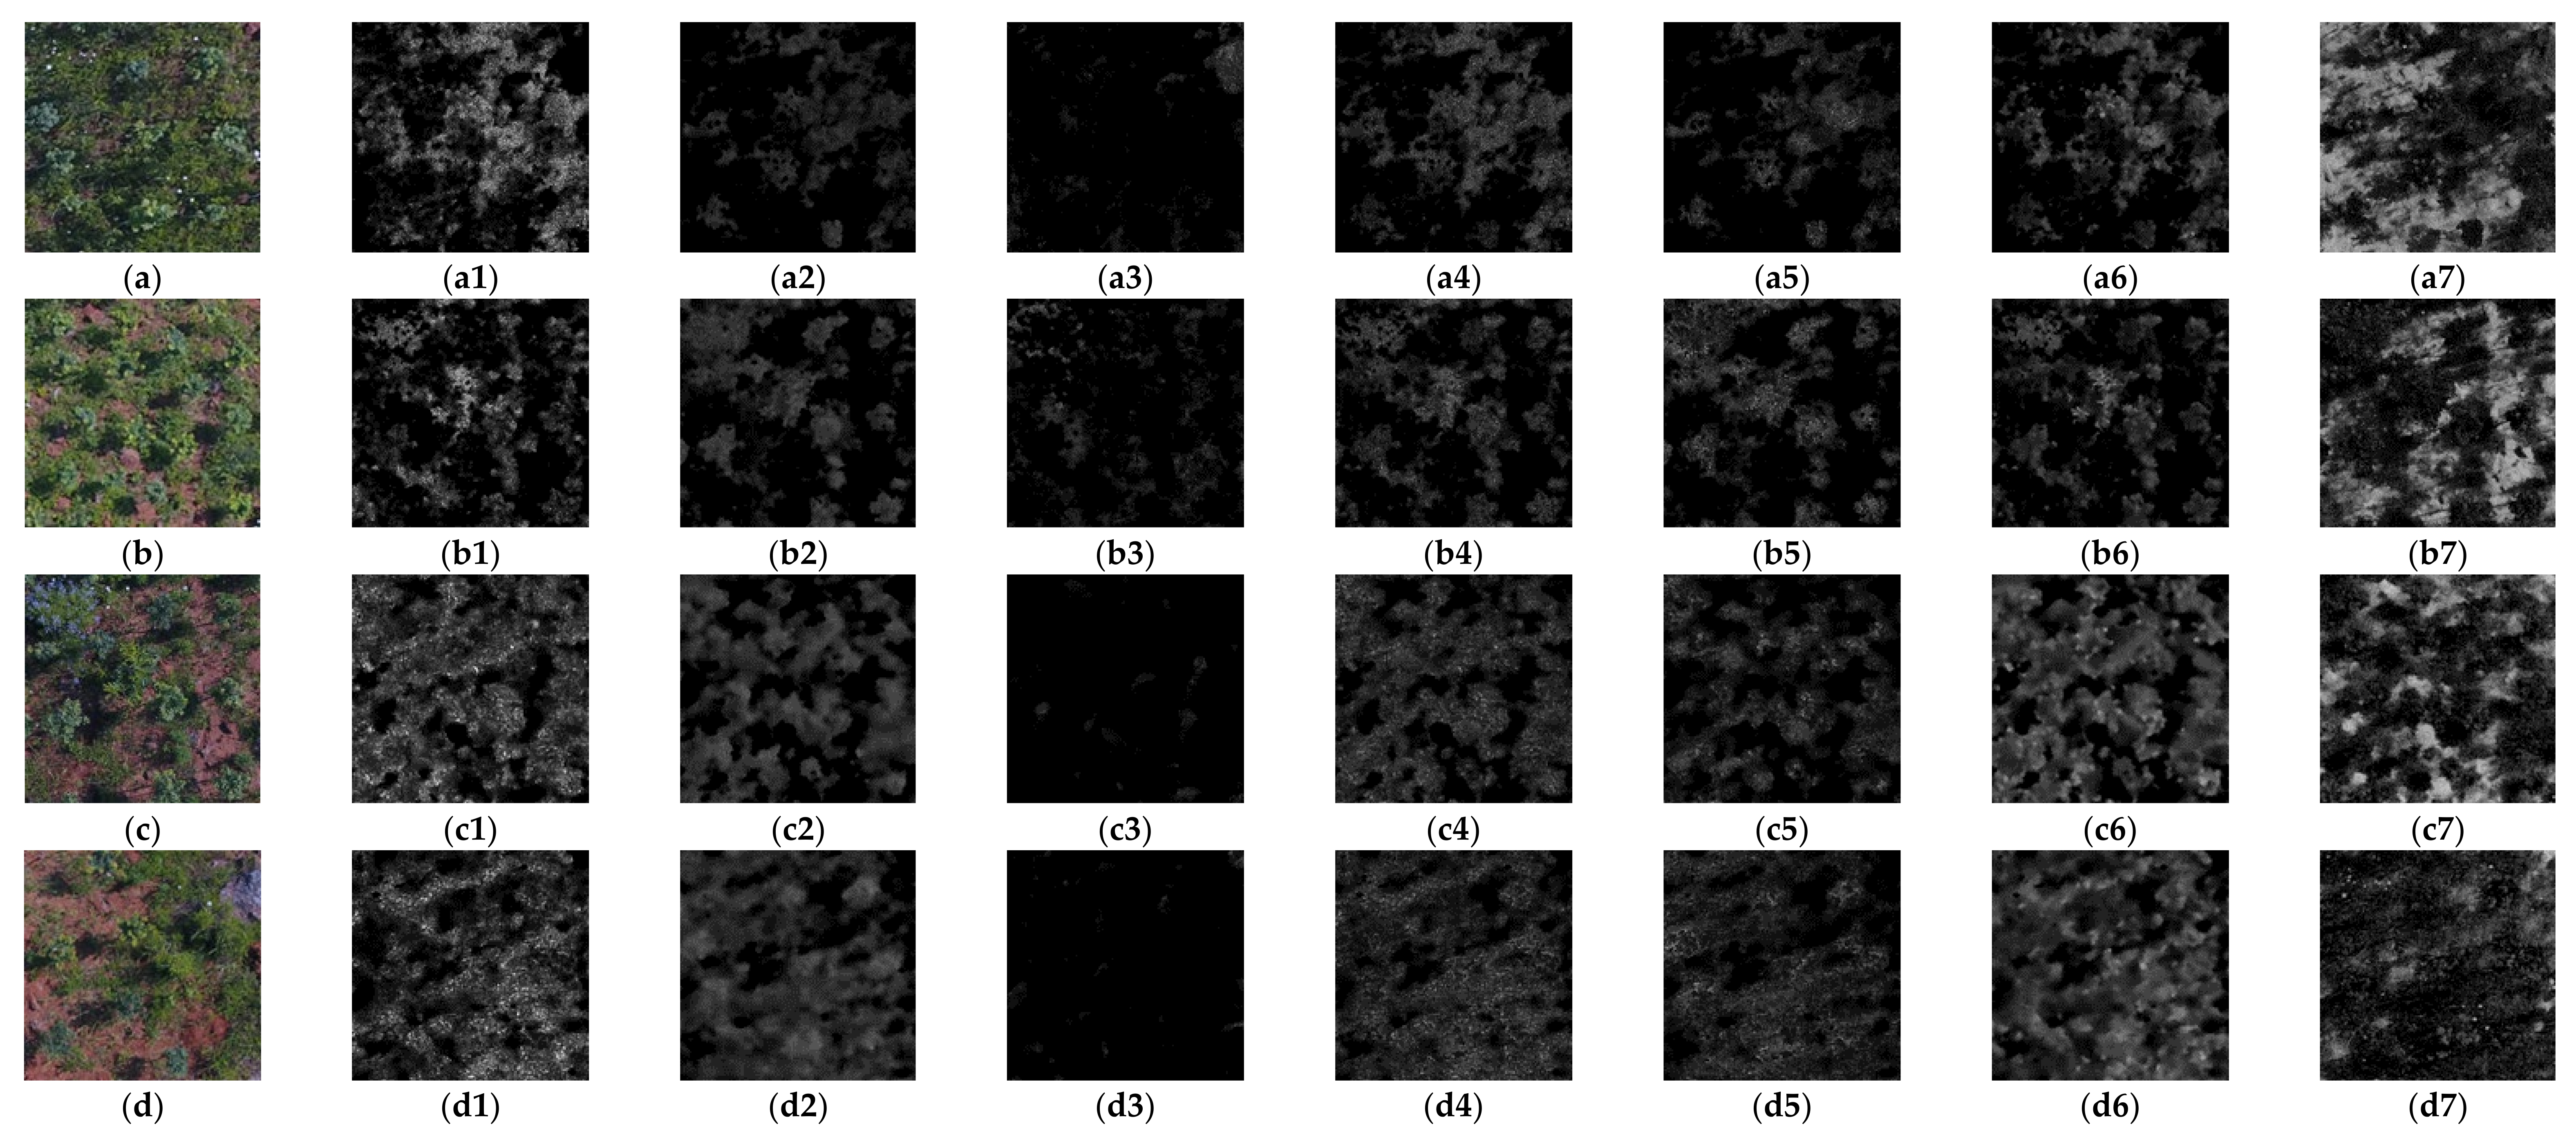
52]. The effect of the spectral index depends on the spectral characteristics of the dataset; the four sample images of different scenes, as shown in Figure A1a–d (Appendix A), were selected from the training set. These images were selected by intuitive judgment of vegetation coverage through manual vision, so the time cost was negligible. Figure A1a–d shows the original images of different scenes. Figure A1(a1–a7,b1–b7,c1–c7,d1–d7) is the transformation results of Figure A1a–d, respectively. It can be seen intuitively that there were great differences in the transformation effects of the seven spectral indexes. We manually drew the foreground (tree crown) and background of the four sample images and used the spectral indexes shown in Table 3 for color mapping. Using statistical methods, it was determined that the most suitable spectral index for this study was GRDI.

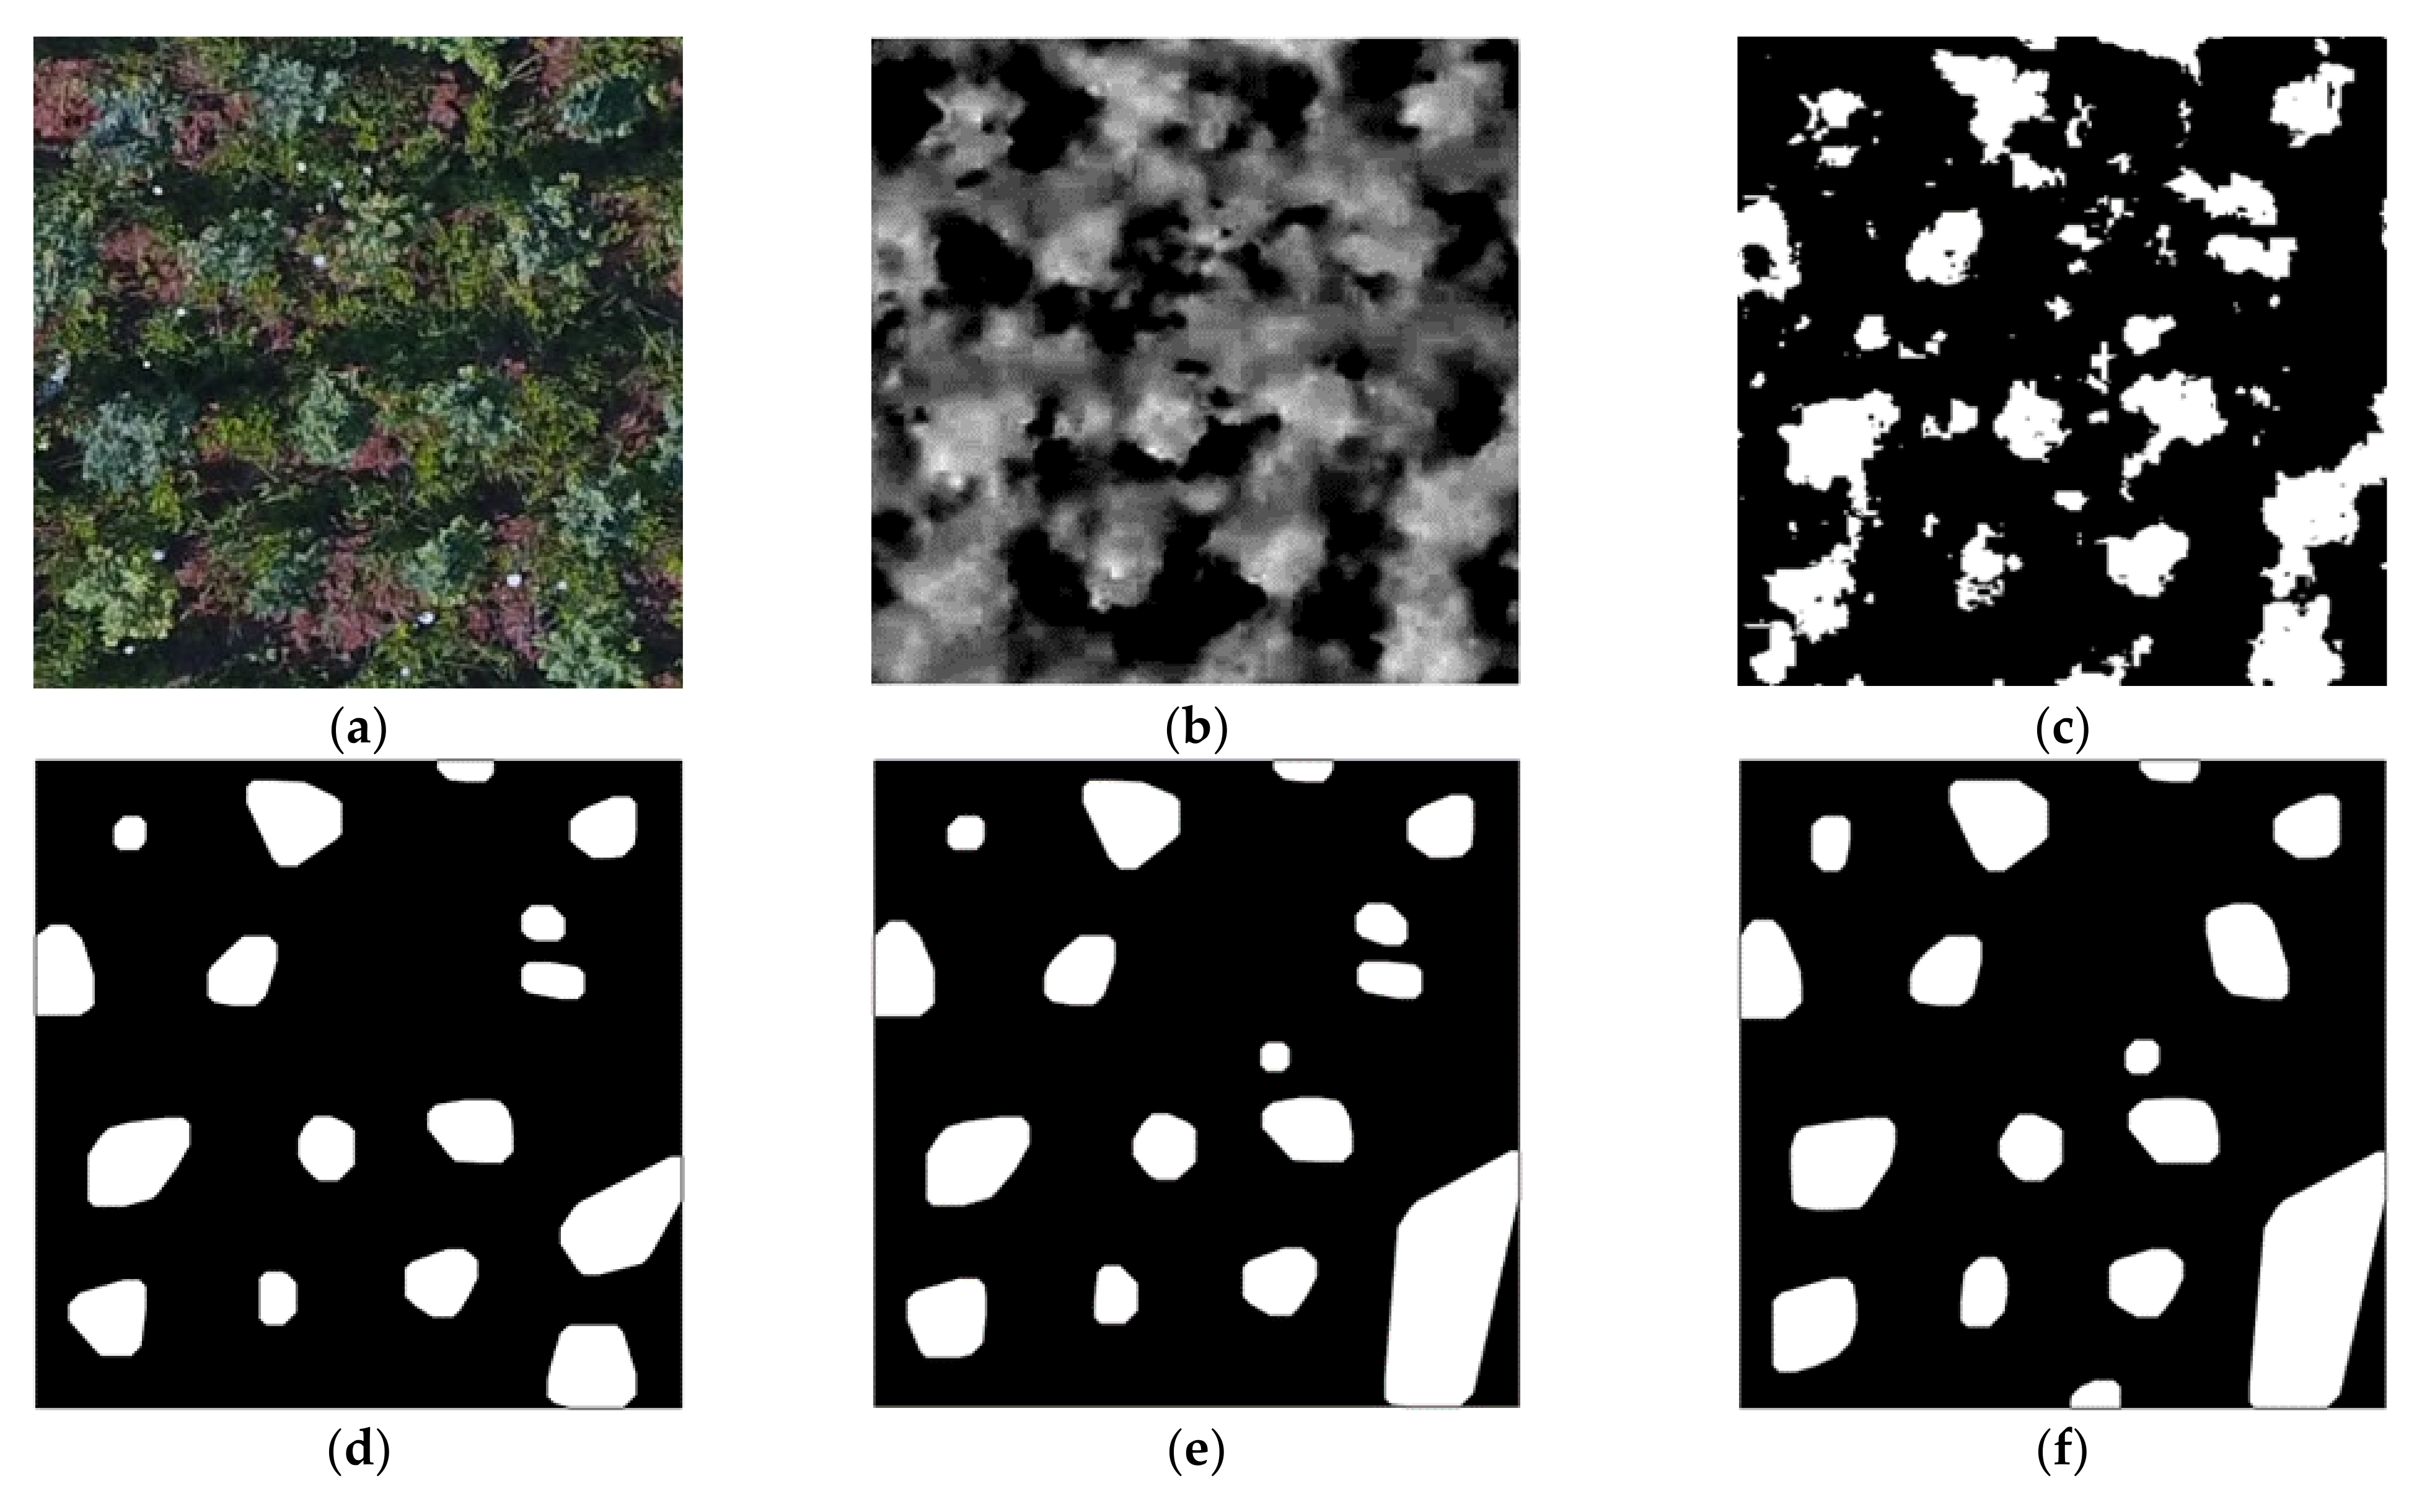
2.5. Potential Tree Crown Extraction

The image was first transformed using GRDI to enhance the separation of foreground and background, which means that the crowns in weeds were enhanced and the preliminary range of tree crowns could be obtained. As shown in Figure A1(a2–d2), there were still some foreground and background features that were not separated after GRDI transformation. In order to separate trees from background better, morphological methods were needed for further processing. Considering that the images of the afforestation area were different in terms of the shooting height, background weed density and illumination intensity, the radii of the closed filters were selected as 3, 5, 7, and 9 after the experiment on the sample images.
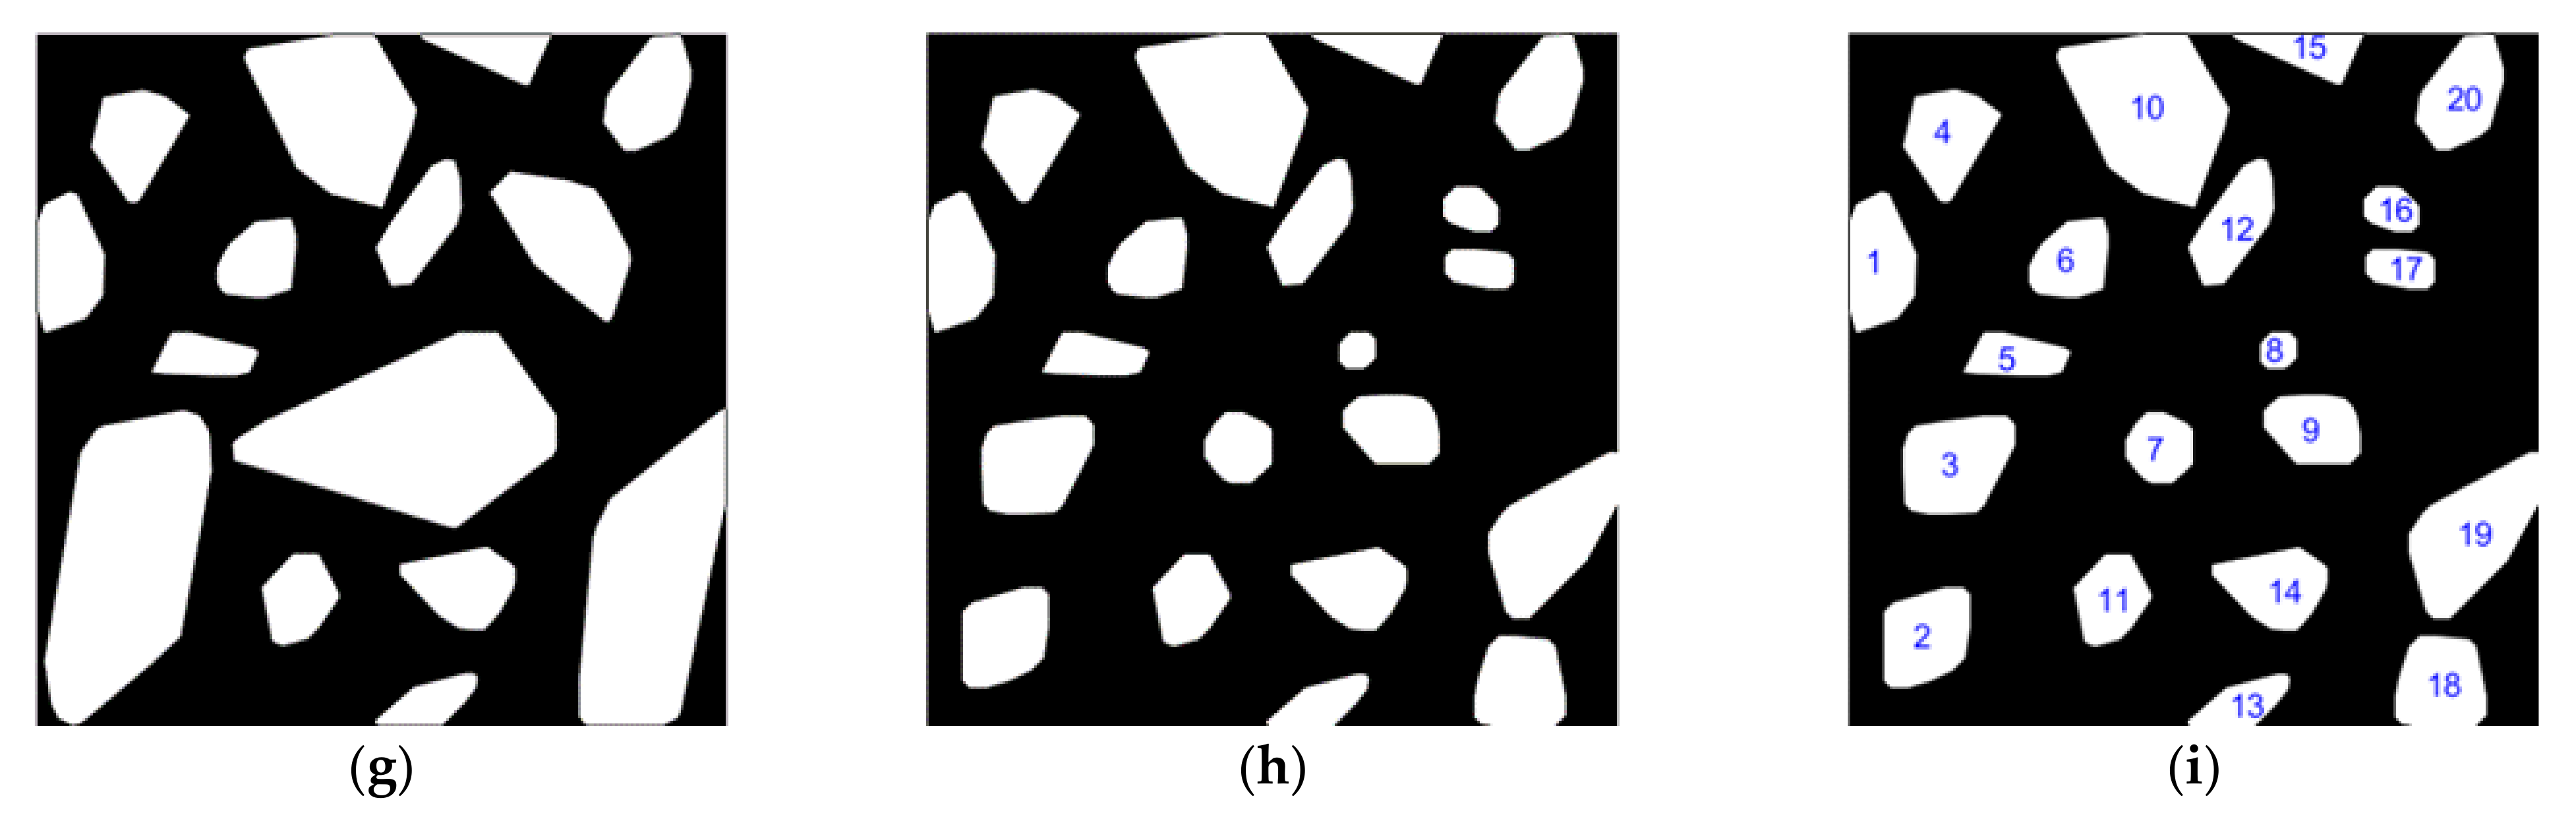
Firstly, the Otsu method was used to segment the gray image after GRDI transform, and then four closed filters with different radii were used to process the image to eliminate the small gaps in the tree crown area, which may have been due to the different reflectance of leaves in the tree crown. Then, the hole filling method was used to eliminate the interference caused by the large holes in the image, which may have been caused by the branches of the tree crown expanding in different directions. Next, an open filter with a radius of 10 was used to remove the interference caused by isolated spots and small branches. In addition, there were still some little fragments in the image, usually because some weeds had similar spectral characteristics with the tree crown, so the region exclusion method with a threshold of 200 pixels was used to eliminate them, and the minimum crown area exceeded 400 pixels. Four extraction results of the same image could be obtained by using the above series processing method. It was obvious that the four extracted maps collectively represented the multi-scale structure of the target forest. In order to reduce the loss of crown edge information caused by morphological processing, a convex hull algorithm was used to fill the edges of extraction regions to improve the accuracy of crown recognition. Finally, four extraction results were fused to obtain more accurate crown position.
Given a large radius extraction map and a small radius extraction map, which contained the results of coarse segments and fine segments, one or more small radius extraction maps could be superimposed by a large radius extraction map, but this was not neatly suitable for the latter. In this study, the coarse segment and its corresponding fine segment were fused according to the following steps: (1) All fine segments with more than half of the area covered by the corresponding coarse segment were searched. (2) If the number of corresponding fine segments was larger than that of coarse segments, the coarse segments were replaced with all the selected fine segments; otherwise, we kept the coarse segments. (3) We kept all coarse segments that did not contain fine segments. The four extraction maps were fused according to the radius of the closed filter from large to small. The entire extraction process is shown in Table 4.

2.6. Features for RoIs Recognition

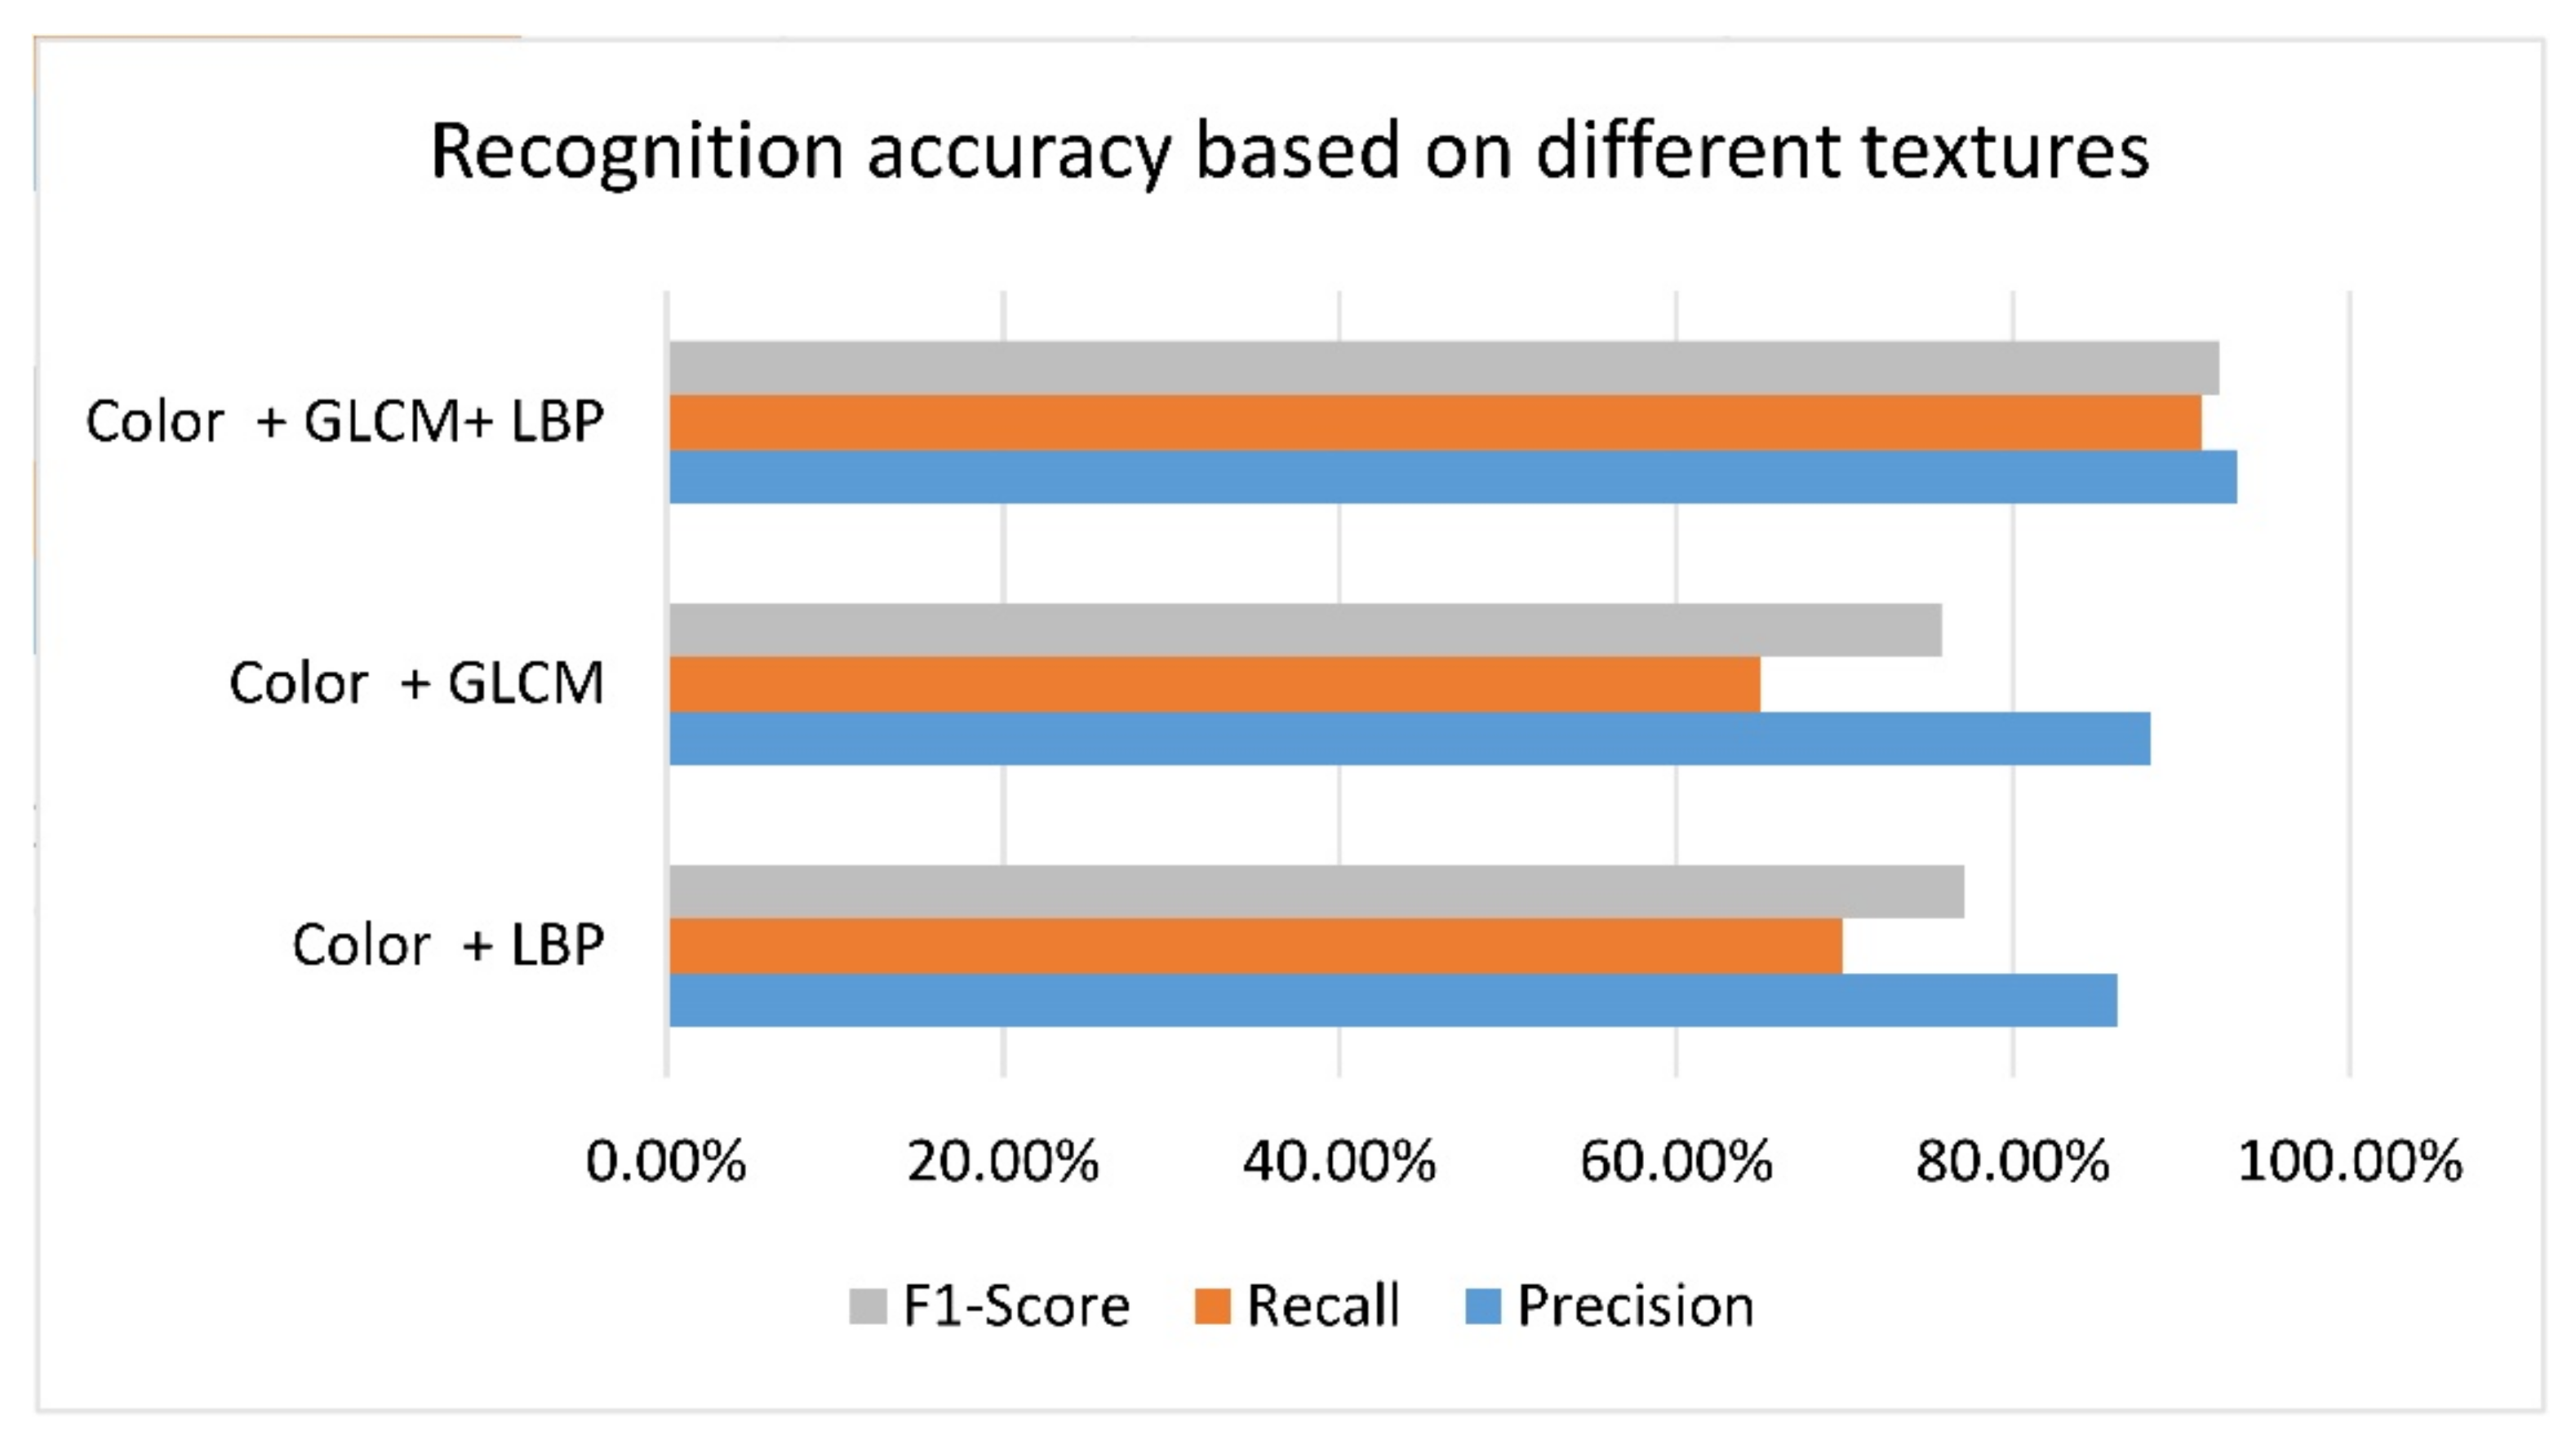
To improve the accuracy of extraction regions classification and tree counting, the second part of this study included the use of effective color and texture features to discriminate trees, bare soil, weeds, and bushes in the extracted region.
The first category is color feature, the values of which were obtained by calculating the mean and variance of the color components in the RGB and L*a*b* color spaces. Since the L component in the L*a*b* color space reflects the illumination intensity of the image, it was not used as the source of the feature to eliminate the interference caused by the illumination intensity. Therefore, the color feature of samples was a 10-dimensional vector composed of the mean and variance of R, G, B, a*, and b* components.
The second category is the grey-level co-occurrence matrix (GLCM), which is a matrix that describes the gray-level relationship between pixels in an image and adjacent pixels or pixels within a certain distance, and can be used to identify tree species at high resolution [53]. It can reflect the gray level of the local area or the entire area of the image. The comprehensive information about the direction, the adjacent interval, and the amplitude of change is the basis for analyzing the gray level change and texture characteristics of the image, and usually describes the texture features quantitatively according to different statistics of GLCM [54]. Thus, the GLCMs of these samples in the feature pool were calculated, and five texture statistics of the GLCMs were calculated. Where and j represent the element row and column subscripts of GLCMs.
Energy: it is the sum of squares of the gray level co-occurrence matrix elements, which reflects the uniformity of gray-level distribution and texture thickness of the image. Equation (1) can be used for calculation.
A s m = i , j p i , j 2
Contrast: Equation (2) reflects the clarity of the image and the depth of the texture groove. The deeper the texture groove, the greater the contrast and the clearer the visual effect.
C o n t = i , j i j 2 p i , j
Correlation: it reflects the similarity degree of gray level co-occurrence matrix elements in row or column direction, the equation is shown in (3).
C o r r = i , j i μ i j μ j p i , j σ i σ j
where μ i and σ i are the mean and variance of p i , and μ j and σ j are the mean and variance of p j , respectively.
Entropy: it represents the degree of non-uniformity or complexity of the texture in the image, which is formulated as:
E n t = i = 1 k j = 1 k p i , j log p i , j
where k indicates the gray scale of the image, which is usually represented by 16 levels.
Homogeneity: it reflects the homogeneity of image texture and measures the local change of image texture, which can be mathematically defined as follows:
H o m = i = 1 k j = 1 k p i , j 1 + i j 2
Therefore, the texture features of extracted regions are composed of GLCM statistics in 0 ° , 45 ° , 90 ° , and 135 ° directions, which constitute a vector of 20 dimensions.
The third category is local binary pattern (LBP), which can be calculated using Equation (6):
LBP x c , y c = p = 0 p 1 2 p s l p l c
where x c , y c is the center pixel, l c is the gray value of the center pixel, l p is the gray value of the adjacent pixels of the center pixel, s is a sign function, and the expression is
s x = 1   i f   x 0 0   e l s e
LBP is an operator used to describe the local texture features of an image. In the uniform pattern, 59 dimensional features vector can be calculated according to reference [55], which has the advantages of rotation invariance and gray invariance.

2.7. RF Model and Accuracy Evaluation

In order to distinguish whether the extracted regions are tree crowns or not, an RF recognition model based on the above 89 dimensional features was established. RF is a machine learning method widely used in classification, regression, and other tasks. In this study, a five-fold cross-validation method was used to evaluate the reliability of the model, that is, the sample of 1400 training set images were divided into five subsets, one single subset was retained as the test set, and the other four subsets were used for training. This process was completed circularly until all subsets were used as the test set once.
In order to evaluate its recognition effect, the number of trees in the study area was first determined, which was done manually. As the ground truth of the study area, compared with the machine recognition results of the RF model, its performance determines the accuracy of the same tree crown fusion in the next step. In order to quantitatively evaluate the recognition effect, the following indicators were used.
Precision: it means the probability of actual positive samples among all predicted positive samples. The precision can be calculated using Equation (8).
P = T P / T P + F P
where true positive (TP) is the number of correctly identified tree crowns, on the contrary, false positive (FP) is the number of mistakenly identified tree crowns.
Recall: refers to the probability of being predicted as a positive sample in the actual positive sample, the equation for this is shown in (9).
R = T P / T P + F N
where false negative (FN) is defined as the number of tree crowns not recognized by the model.
F1 score: this is the weighted harmonic average of precision and recall, as shown in (10).
F 1 = 2 × P × R / P + R

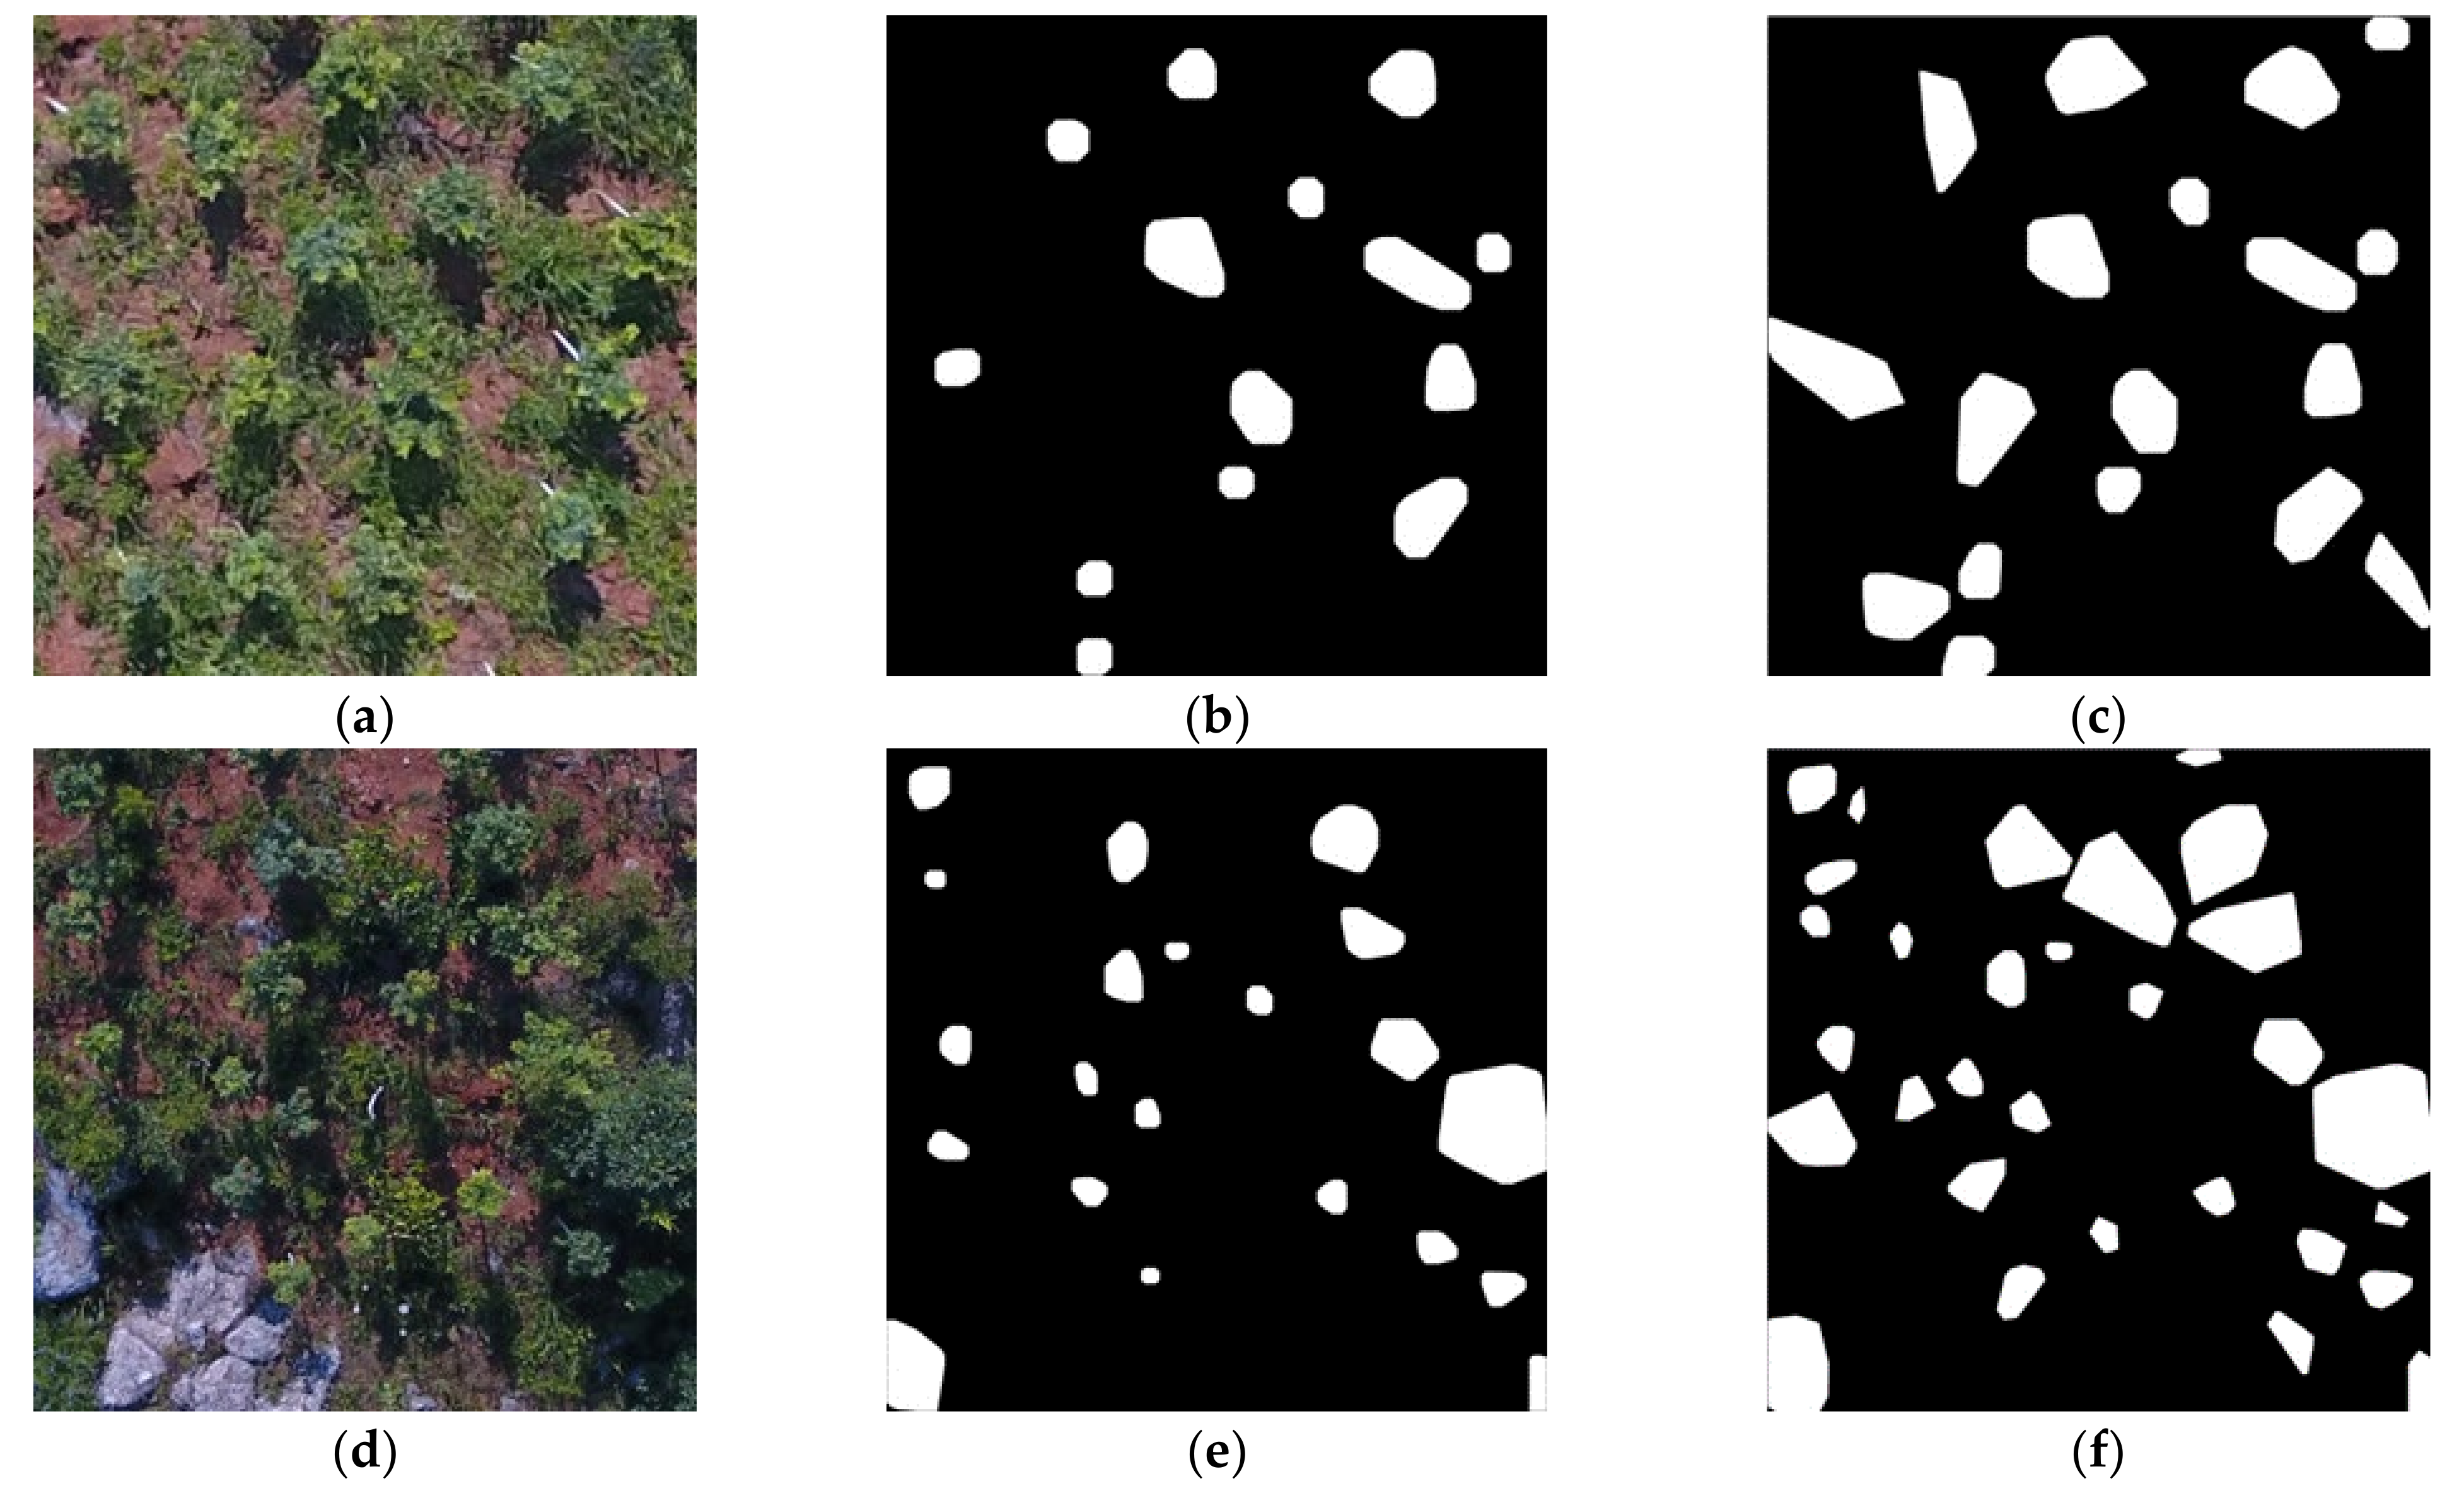
2.8. Repeat Count Region Fusion

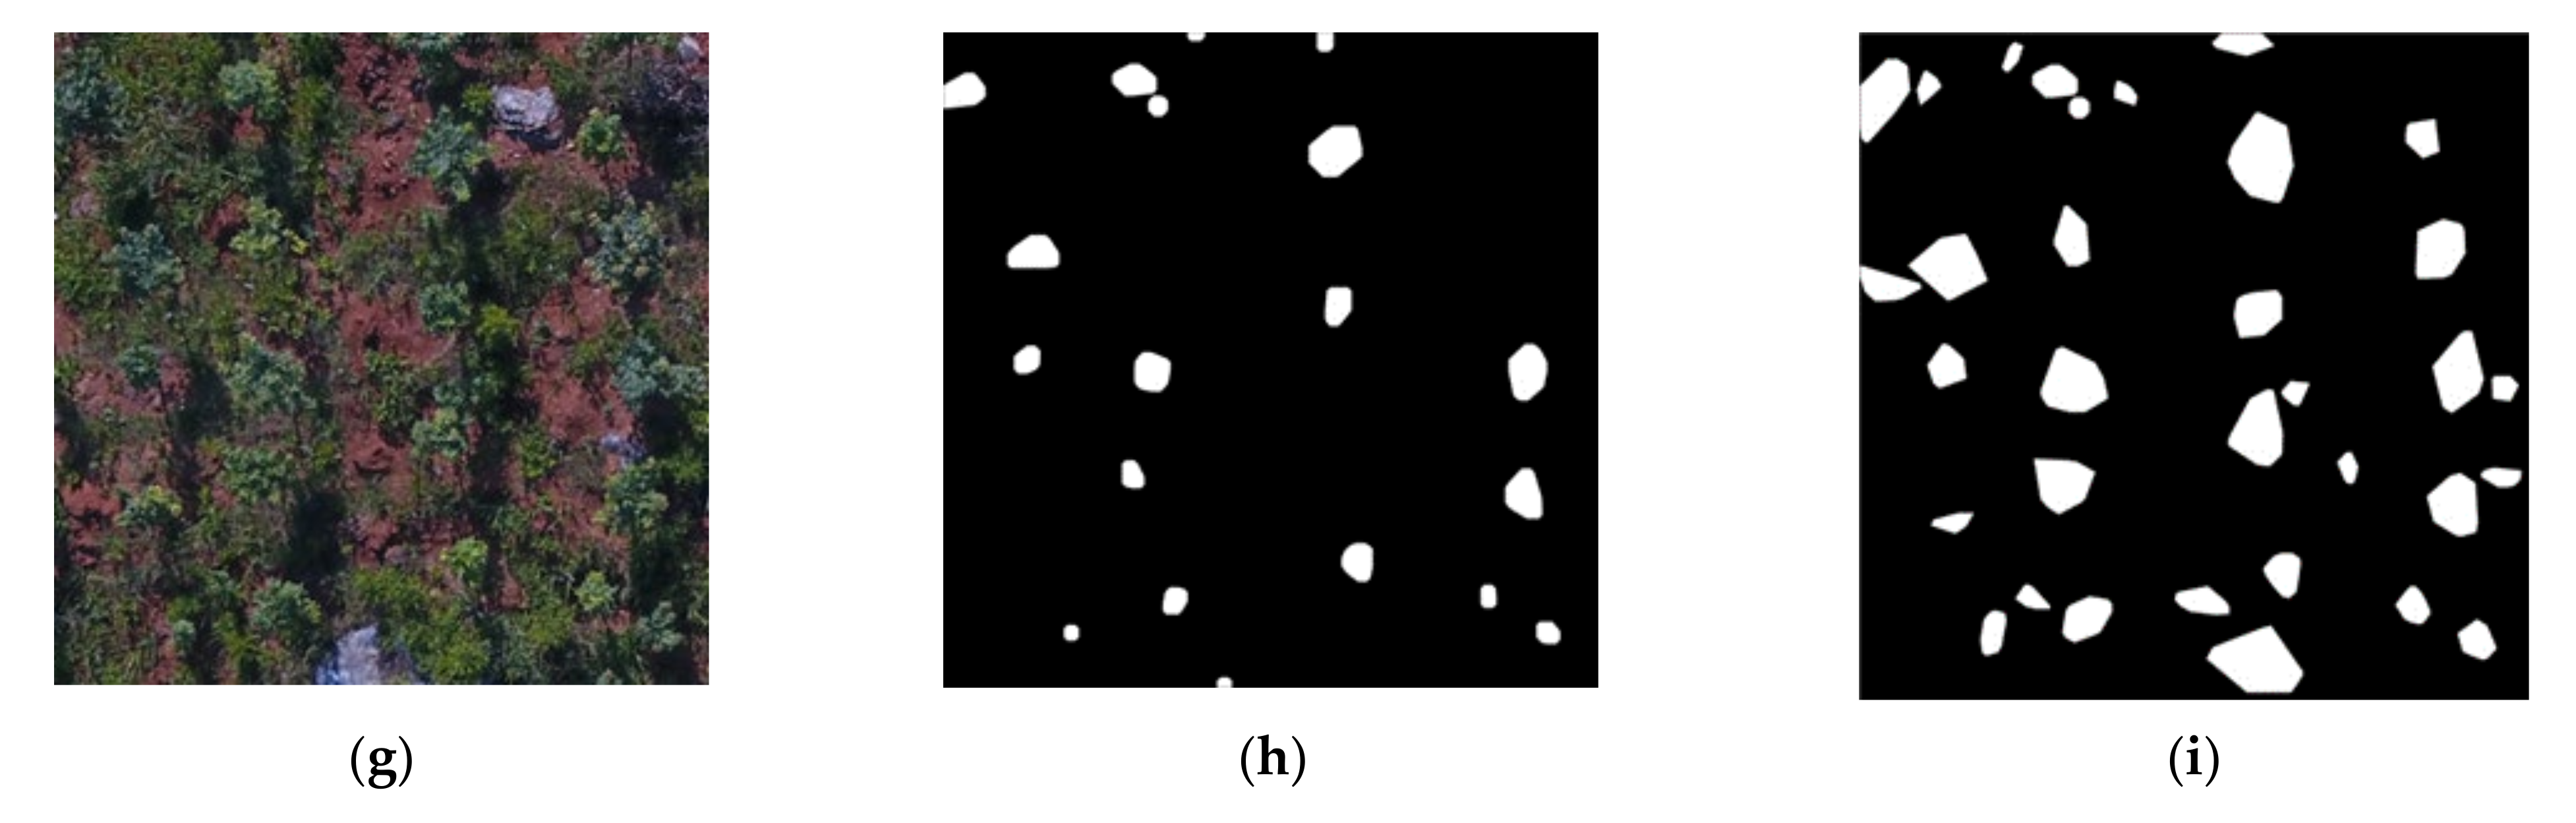
The above-mentioned multi-scale region extraction method enhances the ability to distinguish potential regions of crowns, but it should be noted that the shape of the deciduous tree crown does not present a regular umbrella shape, specifically, the branches in the larger tree crown are often divided by shadows into separate areas, so some branches are similar to individual trees. Moreover, the difference in reflectivity of the branches may cause multiple extractions of the same crown. These factors all reduce the counting accuracy.
As shown in Figure 1, the crown diameters in the test sites were obviously smaller than the distance between trees, so the average distance could be used to measure whether different extraction regions belonged to the same crown to eliminate multiple counting.
Therefore, after the tree canopy was identified by the RF method, the distance between all the identified tree canopies and their nearest neighbors could be calculated to obtain the average distance between the tree canopies, and finally the threshold L was set to half of the average distance. The regions whose centroid spacing was less than the threshold L calculated by (11) were regarded as the same crown and fused.
L = n = 1 m x n x s / 2 k
where n is the current tree crown number, s is the nearest neighbor tree crown number of n, and m is the total number of identified tree crowns.

3. Results

3.1. Statistical Results of Spectral Indices

The statistical results of four sample images are shown in Figure 4. In Figure A1a, due to the extremely high FVC and insufficient brightness, only GRDI and ExG indices were more separable in the foreground and background than other spectral indices, and GRDI was the best. The statistical results can be visually verified from Figure A1(a1–a7). In Figure A1b, higher FVC and sufficient brightness, GRDI, NEGI, and ExG showed higher separability, and NEGI was the highest, which can be compared and observed from Figure A1(b1–b7). In Figure A1c, GRDI, NEGI, ExG, and ExR all showed high separability, of which the best was still GRDI, and the lower limit of foreground GRDI was far away from the median value of the background, which indicates that GRDI still showed good separability in the case of shrub interference. These results are also shown in Figure A1(c1–c7). In Figure A1d, under the conditions of medium FVC and insufficient brightness, all indexes except GRDI showed low resolution and obvious consistency, as shown in Figure A1(d1–d7). In conclusion, in this study, the most appropriate index to identify ROI from images was found to be GRDI.

3.2. Multiple Scale Extraction and Fusion

Figure 5 shows the effect of each stage of morphological extraction and the final fusion of an image. Figure 5a is the original image under the conditions of IB and HFVC. Figure 5b shows the grayscale image transformed by GRDI chromatic mapping on Figure 5a, in which the brightness value at the corresponding position of the tree crown was higher than that of other parts, which laid the foundation for the next morphological operation. Figure 5c is a binary image transformation for the area with the non-zero gray value of Figure 5b. Figure 5d was produced by the morphological method described in Section 2.4 of Figure 5c, where the radius of the closed filter was 3 pixels. Figure 5e is the result of processing (c) with a closed filter radius of 5 pixels, and more regions were extracted than Figure 5d. Figure 5f shows the processing result with a closed filter radius of 7 pixels, from which it can be seen that the effective range of each region continued to increase. Figure 5g shows the processing result with a closed filter radius of 9 pixels, as well as the range of each region. This was further expanded. Figure 5h shows the result of the fusion of Figure 5d–g according to the method proposed in Section 2.4; that is, if a large region contained several small RoIs, then these small RoIs were used to replace the corresponding large region. As a result, this leads to more effective extraction regions and reduces the background interference. Figure 5i marks the regions extracted from the original image with numbers. The numbers in the figure were generated by the fusion process, so the serial numbers were not arranged in order, but this did not affect the recognition of the region. Among them, No. 2 and No. 3 regions and No. 18 and No. 19 regions corresponded to two overall regions in Figure 5g, which were a result of the subdivision effects combined with the extraction results of the small radius filter. Similarly, there were the No. 16 and No. 17 regions. No. 5 and No. 12 regions were extracted in Figure 5g, but were not extracted in the previous filtering results, and the No. 8 region was not extracted in Figure 5d.
Figure 6 shows the results of RoI extraction using MREFCM under different height, brightness, and FVC conditions, which proves the effectiveness of the method. Figure 6a shows an image taken at a height of 20 m, with HFVC and SB, while Figure 6b shows the result of extraction using a filter with a radius of 3 pixels, and Figure 6c shows the result of fusion of four extraction results with different radii. Figure 6d,g shows images taken at a height of 20 m, with MFVC and HFVC, respectively, both in low brightness conditions. Figure 6e,h shows the results of RoI extraction with a radius of 3 pixels, and Figure 6g,i shows the final extraction results of Figure 6d,g. Compared with the original images in Figure 6a,d,g, it can be seen that, similarly to Figure 5, the fused binary images contained more potential crown regions and obtained better results.

3.3. Same Tree Crown Fusion

To illustrate the final tree crown recognition results, Figure 7 shows the examples under different conditions. In order to display the recognition effect more clearly, different colors of plane graphics were used for marking. The red circles in Figure 7b,e,h,k and Figure 7c,f,i,l marked the position and size of the crown recognized by RF. The center of each red circle was the same point as the centroid of the corresponding RoI, and the areas of the two were equal. The weed areas were marked with blue circles. The green rectangles were used to show the position and size of the fused crowns, indicating that the corresponding positions were different fragments of the same crown before the fusion.
As shown in Figure 7c,f,i,l, the green rectangle marked the fused crown, corresponding to the fragments in the extraction region caused by illumination or crown shape in Figure 7b,e,h,k. The Equation (11) introduced in Section 2.6 was used to calculate the distance threshold L, the judgment of the threshold between RoIs depended on the distance between the trees, which represented the minimum expected distance between the crown segments to be fused and avoided the limitation of manual settings.

3.4. Comparison of the Recognition Effect of Different Texture Features

There were 2418 trees in the test set. In order to evaluate the effect of the proposed method on tree crown counting, the method described in Section 2 was used to extract the regions from the image test set, and an RF model consisting of 500 trees was used for recognition. The algorithm automatically located and counted all the tree crowns in the test set, and used the visual interpretation method to mark the ground truth in the image to calculate the accuracy of the method. In order to quantify the difference of crown recognition accuracy before and after inclusion of different texture features, three combined feature spaces of color vector + GLCM, color vector + LBP, and color vector + LBP + GLCM were used for crown recognition in the test set. It can be clearly seen from Figure 8 that the recognition accuracy of the RF model based on the combination of these two texture features has been significantly improved.
More detailed recognition results are shown in Table 5, Table 6 and Table 7. It can be seen that the precision (P), recall (R), and F1 score of each texture category were significantly different. The combination of GLCM + LBP had a significant impact on the recognition accuracy, 93.3% of the crowns were judged correctly and 91% of the actual crowns were found.
Although the proposed method had good illumination intensity and shadow robustness, there were still a few errors, such as extraction omission and recognition errors. For example, in Figure 9a–d, yellow rectangles were used to mark the regions that were misrecognized. The missing tree crowns in Figure 9a,d were marked with orange rectangles, and the images in Figure 9a,b were taken at the altitude of 20 m, while those in Figure 9c,d were taken at 35 m.

4. Discussion

4.1. Accuracy Comparison

In order to eliminate the effects of weed interference, crown shape, and shooting height on the extraction of broad-leaved tree crowns, this study used spectral transformation, multi-radius filtering, and RF methods to enhance the recognition effect of ITCs in the test dataset. In the previous literature, the research on the recognition of ITCs has mainly focused on mature trees [17,18], many studies were undertaken in “clean” orchards [9,15,31,37,40], and little attention was paid to the detection of broad-leaved saplings, especially in the sites with complex forest conditions. As mentioned above, the four sample images in Figure A1 are typical scenes of manual screening, which means that in similar surveys, only a small amount of work is needed for intuitive manual selection, and a different number of sample images can be selected flexibly, so it is suitable for rapid survey inspection of forest plantation in an extensive area. As can be seen from Figure 4, in all scenarios, the statistical results of GRDI were obviously better than other spectral indexes. Interestingly, the resolution showed a downward trend with the increase of light intensity, which may be due to the change of lightness and saturation caused by higher brightness intensity. GRDI is essentially a simple differential vegetation index. This is similar to previous studies [20]. In our study site, FVC and flight altitude had no strong correlation with the separation of foreground and background (Figure 4c). In contrast, although the gray distribution range of the background changed due to the difference of FVC, the flight altitude did not interfere with the pixel-level spectral transformation in this study, and it did not deviate from the ground truth through the interference of various noises, like satellite data [20]. Therefore, in similar inspection work, the difference of flight altitude will not affect the ITC counting effect.
The extraction of broad-leaved tree crowns is different from coniferous trees. Early studies in Italy and Finland reported the characteristics of broad-leaved tree recognition in high-resolution images, that is, the point with the highest light intensity does not represent the midpoint of the broad-leaved crown [17,18]. In this study site, unlike coniferous species [24], the multiple main branches of the broad-leaved crown extended outward in almost random directions, specifically, the crown diameters of sapling had obvious differences, so the window sizes of the filter could not be unified, which means the detection strategy of ITC was affected [12,25]. Four closed filters with different radii were used to process the image, and Figure 5 and Figure 6 show the extraction effect and change process. The results of crown extraction in various scenes show the relationship between the shape of broad-leaved crown and the radius of closed filter, and the final fusion effect. The interference caused by the difference of crown radius and the random extension of multiple branches was controlled, so that the potential areas of the crown with different radii were extracted. It should be noted that one RoI extracted by the large radius filter may correspond to several small RoIs extracted by the small radius filter, which shows the different extraction range of filters with different radii. Therefore, using closed filters with different radii for extraction and fusion can improve the accuracy of RoI extraction and expand the extraction range.
Unlike many previous studies on ITC recognition reported in the literature, the dataset in this study only contained RGB images, without data such as near-infrared and LiDAR, and the coverage of weeds far exceeded that of common orchards. Therefore, the method proposed by Chen et al. [16] under similar weed coverage conditions was reproduced, and all the data in the test set were used for comparison. Table 8 shows the results of comparing the proposed method with the published method, which also aimed at automatic crown detection in complex scenarios. The emphasis is that our work would be superior to that used for control ones, and it was evaluated under higher weed coverage rate, including wider variability in crown shape and interference caused by shrubs.
In Chen’s literature [16], a large radius filter was used to cover the entire crown and eliminate small interference areas, but the filter with a fixed radius was difficult to apply to the extraction of crowns with different diameters and shapes. The multi-radius filter method proposed in this paper can adapt to different tree crowns in typical scenarios, so the application scope is more extensive. The experimental results show that the precision of the compared method (90.37%) was slightly lower than that of the proposed method (93.29%), while the recall (53.28%) was significantly lower than that of the proposed method (91.22%). The main reason may be that the number of RoIs extracted by a single-radius filter was limited, and a considerable part of the crown was not extracted, resulting in the support vector machine (SVM) not getting enough input. This can be verified from the precision and recall data in Table 6. Similarly, using color to divide tree crowns in olive groves is also a beneficial approach [31], but this approach relies on a “clean” olive forest environment and uses only a single small radius filter to eliminate weed interference. However, in a complex environment, the accuracy of tree crown segmentation and detection counts will be affected.

4.2. Strengths and Limitation

The crown morphology of broad-leaved seedlings in the study area is different from that of adult trees. The 3D shape of the adult crown is similar to a semi-ellipsoid with a radius determined by the outermost branches. The surface of the crown is composed of leaves, thin branches, and the gaps between them. It presents a repetitive texture, but generally there is no obvious fracture, and its surface is relatively “smooth”. In contrast, the crown of broad-leaved seedlings is completely different from that of adult trees. The crowns of larger seedlings in the image show irregular branches, and the canopy is divided into several parts, which resemble a flower in the image (Figure 5, Figure 6 and Figure 7). In addition, the trunk may tilt in different directions, further increasing the deformation of the crown, while the crowns of smaller seedlings have continuous contour lines, the two are very different. The closed filter can be used to bridge narrow discontinuities and elongated gullies, eliminate small holes, and fill in the breaks in the contour. In this study, the radius of the filter was determined according to the size of the crown (20–70 cm) and the ground sampling distance (0.7 cm, 1.3 cm). The closed filter with a larger radius can eliminate the gap formed by splitting in multiple directions within the circumscribed circle of the seedling crown. Obviously, the radius of the filter should be greater than half of the average value of the gaps between different branches, but the irregular tree spacing caused by the terrain and tree stem inclination should be noted, and a closed filter with a large radius may connect adjacent tree crowns together. Therefore, the use of small filters can be used to determine the position of small seedling crowns and eliminate the misconnection of adjacent crowns in subsequent fusion. Thus, the main strength of this study was the use of a multi-radius closed filter. This was designed for the difference of crown shape to enhance the ability to capture the crown of saplings. In other regions, the radius of the filters can be quickly determined according to the range of crown diameter and the ground sampling distance, which means that the proposed method of transfer only needs to set a few parameters.
The optimal parameter selection of the proposed algorithm refers to the radius selection of the closed filter [16]. The typical scene sample images were quickly selected manually and the filter radius was selected in combination with the ground sampling distance, so as to eliminate the interference caused by the wider variability of individual characteristics of tree crown and their distribution in the whole study area. This design was particularly advantageous because only RGB images of the study area were used and the morphological differences among the sapling crowns were obvious. Although the UAV images used in different studies were different, most of the published studies so far only used a single fixed radius filter to eliminate interference or as a template for detecting tree crown. The radii of the four closed filters used in this method were determined by experiments on typical scene samples. As shown in Figure 5 and Figure 6, compared with the single-radius closed filter, the multi-radius extraction fusion algorithm significantly improved the extraction effect, which is a comprehensible parameter as it represents the different expected radii in pixels of the tree crown to be segmented. It can be seen that the large radius extraction results included the missing areas of the small radius, while the small radius extraction results subdivided the mixed areas in the large radius extraction. The manual evaluation showed that the multi-radius extraction realized the extraction of different sizes crown in the image and reduced the interference caused by the change of light and crown shape.
The interference caused by weeds, brightness intensity difference, and multiple main branches growing randomly in the crown of broad-leaved saplings may lead to the fragmentation of a single crown. Another strength of MREFCM is in fusing the fragments of the same crown. In most agricultural plantations, the tree spacing is ideally regular [40], so the distance parameter can be used to determine the center of the crown and eliminate the interference of fragments. However, compared with plantations, in this study area, the tree spacing and the crown radii were quite different, so it was impossible to use the distance parameter to determine the crown center. In this study, by judging the average crown distance calculated, selective fusion of crown fragments avoided repeated counting of the same crown, thus improving the accuracy of counting (Figure 7).
Although the proposed method has good illumination intensity and shadow robustness, there were still a few errors, such as extraction omission and identification error. For example, in Figure 9a–d, yellow rectangles were used to mark the regions with wrong recognition, where a tree crown was recognized as weeds or weeds were recognized as tree crowns, which may be because those weeds and tree crown areas showed similar color and texture features, which will be studied in the future. The missing tree crowns in Figure 9a,d were marked with orange rectangles, and Figure 9a,b was taken at altitude of 20 m, while Figure 9c,d was taken at 35 m. The reason for the omission may be that the illumination intensity of the tree crown was lower than that of other crowns or the effective illumination area was smaller, choosing to shoot when the illumination is sufficient may reduce this effect.
In this study, only the most common RGB images were used for tree crown recognition. Although the proposed method did manually select the spectral index of the study area based on typical images, the workload was very small and suitable for rapid inspection of newly planted land. The method used in this study required spectral transformation to enhance the difference between the crown and the background. Therefore, in different tree species areas, different spectral indexes may need to be used, which may require the collection of more kinds of seedling images for testing.

4.3. Future Studies

The method used in this study can be used to extract the crowns of broad-leaved saplings of different shapes to increase the frequency of verification of new afforestation and examine the impact of environmental driving factors on the survival rate of afforestation. The crown recognition of broad-leaved saplings may be affected by many factors, including the color difference between the crown and the background, the shape of the crown, the density of the crown, and the interference of complex background on ITC recognition. Recent studies have discussed the relationship between multiple data sources and enhancing ITC recognition capability [44,47,49], LiDAR point cloud analysis [39], multispectral analysis [41], convolutional neural network [46], and other methods that improve the effect of ITC recognition by collecting data such as RE and LiDAR to obtain more broad-leaved sapling features [24,39], using CNN and other algorithms to improve the recognition effect of crowns [9,45]. Therefore, in future studies, more data sources should be considered to extract potential features of tree crowns to further enhance the accuracy of ITC recognition. These factors should be considered in future studies so that beneficial afforestation measures can be used for intervention (e.g., replanting, fertilizing, watering) at the right time.

5. Conclusions

This paper proposed a method that combines multi-radius filtering and fusion with random forest to recognize ITCs in new forests. Experiments were carried out on the drone image test set collected from the newly planted forest land in Xichuan County. This study used statistical methods to select the appropriate spectral index to reduce the impact of high coverage weeds in drone images. Multiple closed filters with different radii were used to bridge the scattered canopy branches and reduce the interference of canopy debris. The texture features and color vectors of LBP and GLCM together constituted the recognition effect of texture feature space. A random forest composed of 500 trees is used to identify RoI. The experimental results showed that the average recognition of the canopy in the test set increased from 75.76% and 77.15% of a single texture feature to 92.94%, which indicates that the combination of the two texture features plays an important role in improving the recognition accuracy. When using high-resolution UAV images for new afforestation verification, it is best to consider multiple texture features to improve the recognition effect.
The proposed method demonstrates the potential of UAV in forest monitoring. The proposed method can be used as a valuable tool for precision forestry to improve the efficiency of forest monitoring. However, red edge (RE) and LiDAR data should be collected in future studies, and the verification of the proposed method should be extended to fog or dust weather and different tree species.

Author Contributions

Conceptualization, X.G., L.F., Q.L. and S.T.; formal analysis and writing—original draft preparation X.G., L.F., Q.L., Q.C., R.P.S. and S.T.; validation, L.F., Q.L. and Q.Y. All authors contributed to interpreting results and the improvement of the paper. All authors have read and agreed to the published version of the manuscript.

Funding

This research was funded by the Central Public Interest Scientific Institution Basal Research Fund under (Grant No. CAFYBB2019QD003).

Institutional Review Board Statement

Not applicable.

Informed Consent Statement

Not applicable.

Data Availability Statement

The field data are not publicly available due to privacy of the private landowners. The availability of the images data should adhere with the data sharing policy of the funders.

Conflicts of Interest

The authors declare no conflict of interest.

Appendix A

Figure A1 shows the original images of four typical fraction vegetation coverage (FVC), and brightness intensity (BI), as well as the corresponding results of seven spectral transformation methods, which are used to evaluate the optimal transformation methods under different conditions.
Figure A1. Detail of the UAV image from the study area. (a) 35 m (1.34 cm spatial resolution), HFVC, IB; (a1a7) the result of transformation of (a) with image spectral index in Table 3. (b) 35 m, HFVC, SB; (b1b7) the result of transformation of (b) with image spectral index in Table 3. (c) 20 m (7.34 mm spatial resolution), MFVC, IB; (c1c7) the result of transformation of (c) with image spectral index in Table 3. (d) 20 m, MFVC, IB; (d1d7) the result of transformation of (d) with image spectral index in Table 3.
Remotesensing 13 04122 g0a1

References

  1. Allison, T.D.; Root, T.L.; Frumhoff, P.C. Thinking globally and siting locally—Renewable energy and biodiversity in a rapidly warming world. Clim. Change 2014, 126, 1–6. [Google Scholar] [CrossRef] [Green Version]
  2. Sunday, J.M. The pace of biodiversity change in a warming climate. Nature 2020, 580, 460–461. [Google Scholar] [CrossRef] [Green Version]
  3. Pan, Y.; Birdsey, R.A.; Fang, J.; Houghton, R.; Kauppi, P.E.; Kurz, W.A.; Phillips, O.L.; Shvidenko, A.; Lewis, S.L.; Canadell, J.G. A Large and Persistent Carbon Sink in the World’s Forests. Science 2011, 333, 988–993. [Google Scholar] [CrossRef] [PubMed] [Green Version]
  4. Bala, G.; Krishna, S.; Narayanappa, D.; Cao, L.; Nemani, R. An estimate of equilibrium sensitivity of global terrestrial carbon cycle using NCAR CCSM4. Clim. Dyn. 2013, 40, 1671–1686. [Google Scholar] [CrossRef]
  5. Amankwah, A.A.; Quaye-Ballard, J.A.; Koomson, B.; Kwasiamankwah, R.; Adu-Bredu, S. Deforestation in Forest-Savannah Transition Zone of Ghana; Boabeng-Fiema Monkey Sanctuary. Global Ecol. Conserv. 2020, 25, e01440. [Google Scholar] [CrossRef]
  6. Saha, S.; Saha, M.; Mukherjee, K.; Arabameri, A.; Paul, G.C. Predicting the deforestation probability using the binary logistic regression, random forest, ensemble rotational forest and REPTree: A case study at the Gumani River Basin, India. Sci. Total Environ. 2020, 730, 139197. [Google Scholar] [CrossRef] [PubMed]
  7. Kyere-Boateng, R.; Marek, M.V. Analysis of the Social-Ecological Causes of Deforestation and Forest Degradation in Ghana: Application of the DPSIR Framework. Forests 2021, 12, 409. [Google Scholar] [CrossRef]
  8. Yu, Z.; Cao, Z.; Wu, X.; Bai, X.; Qin, Y.; Zhuo, W.; Xiao, Y.; Zhang, X.; Xue, H. Automatic image-based detection technology for two critical growth stages of maize: Emergence and three-leaf stage. Agric. Forest Meteorol. 2013, 174–175, 65–84. [Google Scholar] [CrossRef]
  9. Csillik, O.; Cherbini, J.; Johnson, R.; Lyons, A.; Kelly, M. Identification of Citrus Trees from Unmanned Aerial Vehicle Imagery Using Convolutional Neural Networks. Drones 2018, 2, 39. [Google Scholar] [CrossRef] [Green Version]
  10. Wu, X.; Shen, X.; Cao, L.; Wang, G.; Cao, F. Assessment of Individual Tree Detection and Canopy Cover Estimation using Unmanned Aerial Vehicle based Light Detection and Ranging (UAV-LiDAR) Data in Planted Forests. Remote Sens. 2019, 11, 908. [Google Scholar] [CrossRef] [Green Version]
  11. Malambo, L.; Popescu, S.C.; Murray, S.C.; Putman, E.; Pugh, N.A.; Horne, D.W.; Richardson, G.; Sheridan, R.; Rooney, W.L.; Avant, R.; et al. Multitemporal field-based plant height estimation using 3D point clouds generated from small unmanned aerial systems high-resolution imagery. Int. J. Appl. Earth Obs. Geoinf. 2018, 64, 31–42. [Google Scholar] [CrossRef]
  12. Hirschmugl, M.; Ofner, M.; Raggam, J.; Schardt, M. Single tree detection in very high resolution remote sensing data. Remote Sens. Environ. 2007, 2007, 533–544. [Google Scholar] [CrossRef]
  13. Pádua, L.; Vanko, J.; Hruška, J.; Adão, T.; Sousa, J.J.; Peres, E.; Morais, R. UAS, sensors, and data processing in agroforestry: A review towards practical applications. Int. J. Remote Sens. 2017, 38, 2349–2391. [Google Scholar] [CrossRef]
  14. Johanna, A.; Sylvie, D.; Fabio, G.; Anne, J.; Michel, G.; Hervé, P.; Jean-Baptiste, F.; Gérard, D. Detection of flavescence dorée grapevine disease using unmanned aerial vehicle (UAV) multispectral imagery. Remote Sens. 2017, 9, 308. [Google Scholar] [CrossRef] [Green Version]
  15. Cheng, Z.; Qi, L.; Cheng, Y.; Wu, Y.; Zhang, H. Interlacing Orchard Canopy Separation and Assessment using UAV Images. Remote Sens. 2020, 12, 767. [Google Scholar] [CrossRef] [Green Version]
  16. Chen, Y.; Hou, C.; Tang, Y.; Zhuang, J.; Luo, S. Citrus Tree Segmentation from UAV Images Based on Monocular Machine Vision in a Natural Orchard Environment. Sensors 2019, 19, 5558. [Google Scholar] [CrossRef] [PubMed] [Green Version]
  17. Jing, L.; Hu, B.; Noland, T.; Li, J. An individual tree crown delineation method based on multi-scale segmentation of imagery. Isprs J. Photogramm. Remote Sens. 2012, 70, 88–98. [Google Scholar] [CrossRef]
  18. Jiang, M.; Lin, Y. Individual deciduous tree recognition in leaf-off aerial ultrahigh spatial resolution remotely sensed imagery. IEEE Geosci. Remote Sens. Lett. 2012, 10, 38–42. [Google Scholar] [CrossRef]
  19. Shimada, S.; Matsumoto, J.; Sekiyama, A.; Aosier, B.; Yokohana, M. A new spectral index to detect Poaceae grass abundance in Mongolian grasslands. Adv. Space Res. 2012, 50, 1266–1273. [Google Scholar] [CrossRef]
  20. Loris, V.; Damiano, G. Mapping the green herbage ratio of grasslands using both aerial and satellite-derived spectral reflectance. Agric. Ecosyst. Environ. 2006, 115, 141–149. [Google Scholar] [CrossRef]
  21. Hunt, E.R.; Cavigelli, M.; Daughtry, C.S.T.; Mcmurtrey, J.E.; Walthall, C.L. Evaluation of Digital Photography from Model Aircraft for Remote Sensing of Crop Biomass and Nitrogen Status. Precis. Agric. 2005, 6, 359–378. [Google Scholar] [CrossRef]
  22. Woebbecke, D.M.; Meyer, G.E.; Bargen, K.V.; Mortensen, D.A. Color Indices for Weed Identification Under Various Soil, Residue, and Lighting Conditions. Trans. Asae 1995, 38, 259–269. [Google Scholar] [CrossRef]
  23. Mahlein, A.K.; Steiner, U.; Dehne, H.W.; Oerke, E.C. Spectral signatures of sugar beet leaves for the detection and differentiation of diseases. Precis. Agric. 2010, 11, 413–431. [Google Scholar] [CrossRef]
  24. Feduck, C.; Mcdermid, G.; Castilla, G. Detection of Coniferous Seedlings in UAV Imagery. Forests 2018, 9, 432. [Google Scholar] [CrossRef] [Green Version]
  25. Wang, L. A Multi-scale Approach for Delineating Individual Tree Crowns with Very High Resolution Imagery. Photogramm. Eng. Remote Sens. 2010, 76, 371–378. [Google Scholar] [CrossRef]
  26. Qin, R. An Object-Based Hierarchical Method for Change Detection Using Unmanned Aerial Vehicle Images. Remote Sens. 2014, 6, 7911–7932. [Google Scholar] [CrossRef] [Green Version]
  27. Jannoura, R.; Brinkmann, K.; Uteau, D.; Bruns, C.; Joergensen, R.G. Monitoring of crop biomass using true colour aerial photographs taken from a remote controlled hexacopter. Biosyst. Eng. 2015, 129, 341–351. [Google Scholar] [CrossRef]
  28. Jensen, J.R. Remote Sensing of the Environment: An Earth Resource Perspective, 2nd ed.; Pearson Prentice Hall: Hoboken, NJ, USA, 2007. [Google Scholar]
  29. Zheng, L.; Shi, D.; Zhang, J. Segmentation of green vegetation of crop canopy images based on mean shift and Fisher linear discriminant. Pattern Recognit. Lett. 2010, 31, 920–925. [Google Scholar] [CrossRef]
  30. Laliberte, A.S.; Browning, D.M.; Rango, A. A comparison of three feature selection methods for object-based classification of sub-decimeter resolution UltraCam-L imagery. Int. J. Appl. Earth Obs. Geoinf. 2012, 15, 70–78. [Google Scholar] [CrossRef]
  31. Salamí, E.; Gallardo, A.; Skorobogatov, G.; Barrado, C. On-the-Fly Olive Tree Counting Using a UAS and Cloud Services. Remote Sens. 2019, 11, 316. [Google Scholar] [CrossRef] [Green Version]
  32. Liu, Y.; Mu, X.; Wang, H.; Yan, G. A novel method for extracting green fractional vegetation cover from digital images. J. Veg. Sci. 2012, 23, 406–418. [Google Scholar] [CrossRef]
  33. Wanjuan, S.; Xihan, M.; Guangjian, Y.; Shuai, H. Extracting the Green Fractional Vegetation Cover from Digital Images Using a Shadow-Resistant Algorithm (SHAR-LABFVC). Remote Sens. 2015, 7, 10425–10443. [Google Scholar]
  34. Linyuan, L.; Xihan, M.; Craig, M.; Wanjuan, S.; Jun, C.; Kai, Y.; Guangjian, Y. A half-Gaussian fitting method for estimating fractional vegetation cover of corn crops using unmanned aerial vehicle images. Agric. For. Meteorol. 2018, 262, 379–390. [Google Scholar]
  35. Lin, Y.; Lin, J.; Jiang, M.; Yao, L.; Lin, J. Use of UAV oblique imaging for the detection of individual trees in residential environments. Urban For. Urban Green. 2015, 14, 404–412. [Google Scholar] [CrossRef]
  36. Primicerio, J.; Caruso, G.; Comba, L.; Crisci, A.; Gay, P.; Guidoni, S.; Genesio, L.; Ricauda Aimonino, D.; Vaccari, F.P. Individual plant definition and missing plant characterization in vineyards from high-resolution UAV imagery. Eur. J. Remote Sens. 2017, 50, 179–186. [Google Scholar] [CrossRef]
  37. Koc-San, D.; Selim, S.; Aslan, N.; San, B.T. Automatic citrus tree extraction from UAV images and digital surface models using circular Hough transform. Comput. Electron. Agric. 2018, 150, 289–301. [Google Scholar] [CrossRef]
  38. Hao, J.; Shuisen, C.; Dan, L.; Chongyang, W.; Ji, Y. Papaya Tree Detection with UAV Images Using a GPU-Accelerated Scale-Space Filtering Method. Remote Sens. 2017, 9, 721. [Google Scholar]
  39. Picos, J.; Bastos, G.; Míguez, D.; Martínez, L.A.; Armesto, J. Individual Tree Detection in a Eucalyptus Plantation Using Unmanned Aerial Vehicle (UAV)-LiDAR. Remote Sens. 2020, 12, 885. [Google Scholar] [CrossRef] [Green Version]
  40. Sarabia, R.; Martín, A.A.; Real, J.P.; López, G.; Márquez, J.A. Automated Identification of Crop Tree Crowns from UAV Multispectral Imagery by Means of Morphological Image Analysis. Remote Sens. 2020, 12, 748. [Google Scholar] [CrossRef] [Green Version]
  41. Johansen, K.; Raharjo, T.; McCabe, M.F. Using multi-spectral UAV imagery to extract tree crop structural properties and assess pruning effects. Remote Sens. 2018, 10, 854. [Google Scholar] [CrossRef] [Green Version]
  42. Yu, X.; Hyyppä, J.; Litkey, P.; Kaartinen, H.; Vastarant, M.; Holopainen, M. Single-Sensor Solution to Tree Species Classification Using Multispectral Airborne Laser Scanning. Remote Sens. 2017, 9, 108. [Google Scholar] [CrossRef] [Green Version]
  43. Budei, B.C.; St-Onge, B.; Hopkinson, C.; Audet, F.-A. Identifying the genus or species of individual trees using a three-wavelength airborne lidar system. Remote Sens. Environ. 2017, 204, 632–647. [Google Scholar] [CrossRef]
  44. Arvid, A.; Eva, L.; HåKan, O. Exploring Multispectral ALS Data for Tree Species Classification. Remote Sens. 2018, 10, 183. [Google Scholar]
  45. Pleoianu, A.I.; Stupariu, M.S.; Sandric, I.; Stupariu, I.; Drǎgu, L. Individual Tree-Crown Detection and Species Classification in Very High-Resolution Remote Sensing Imagery Using a Deep Learning Ensemble Model. Remote Sens. 2020, 12, 2426. [Google Scholar] [CrossRef]
  46. Onishi, M.; Ise, T. Explainable identification and mapping of trees using UAV RGB image and deep learning. Sci. Rep. 2021, 11, 1–15. [Google Scholar] [CrossRef]
  47. Bragra, J.R.G.; Peripato, V.; Dalagnol, R.; Ferreira, M.P.; Wagner, F.H. Tree Crown Delineation Algorithm Based on a Convolutional Neural Network. Remote Sens. 2020, 12, 1–27. [Google Scholar]
  48. Li, W.; Fu, H.; Yu, L. Deep convolutional neural network based large-scale oil palm tree detection for high-resolution remote sensing images. In Proceedings of the International Geoscience and Remote Sensing Symposium, Fort Worth, TX, USA, 23–28 July 2017. [Google Scholar]
  49. Kolanuvada, S.R.; Ilango, K.K. Automatic Extraction of Tree Crown for the Estimation of Biomass from UAV Imagery Using Neural Networks. J. Indian Soc. Remote Sens. 2020, 49, 651–658. [Google Scholar] [CrossRef]
  50. Zhang, B.; Zhao, L.; Zhang, X. Three-dimensional convolutional neural network model for tree species classification using airborne hyperspectral images. Remote Sens. Environ. 2020, 247, 111938. [Google Scholar] [CrossRef]
  51. Philipp, I.; Rath, T. Improving plant discrimination in image processing by use of different colour space transformations. Comput. Electron. Agric. 2002, 35, 1–15. [Google Scholar] [CrossRef]
  52. Lu, J.; Ehsani, R.; Shi, Y.; De Castro, A.I.; Wang, S. Detection of multi-tomato leaf diseases (late blight, target and bacterial spots) in different stages by using a spectral-based sensor. Sci. Rep. 2018, 8, 2793. [Google Scholar] [CrossRef] [Green Version]
  53. Deur, M.; Gaparovi, M.; Balenovi, I. Tree Species Classification in Mixed Deciduous Forests Using Very High Spatial Resolution Satellite Imagery and Machine Learning Methods. Remote Sens. 2020, 12, 3926. [Google Scholar] [CrossRef]
  54. Castro, A.; Peña, J.; Torres-Sánchez, J.; Jiménez-Brenes, F.; López-Granados, F. Mapping Cynodon Dactylon Infesting Cover Crops with an Automatic Decision Tree-OBIA Procedure and UAV Imagery for Precision Viticulture. Remote Sens. 2019, 12, 56. [Google Scholar] [CrossRef] [Green Version]
  55. Ojala, T.; Pietikainen, M.; Maenpaa, T. Multiresolution Gray-Scale and Rotation Invariant Texture Classification with Local Binary Patterns. IEEE Trans. Pattern Analysis Mach. Intell. 2002, 24, 971–987. [Google Scholar] [CrossRef]
Figure 1. Location of two afforestation areas surveyed for this study in the western part of Xichuan County, Henan Province, China.
Remotesensing 13 04122 g001
Figure 2. Examples of samples at different sizes. (a) Negative samples of soil with a resolution of 60 × 60 pixels. (b) Positive samples of trees with a resolution of 40 × 40~100 × 100 pixels. (c) Negative samples of weeds with a resolution of 40 × 40~100 × 100 pixels. (d) Negative samples of shrubs with a resolution of 40 × 40~100 × 100 pixels.
Remotesensing 13 04122 g002
Figure 3. Flow chart of the proposed individual tree crown count method.
Remotesensing 13 04122 g003
Figure 4. The statistical results of the four transformed sample images by (a) NGBDI, (b) NGRDI, (c) GRDI, (d) NBGVI, (e) NEGI, (f) ExG, and (g) ExR.
Remotesensing 13 04122 g004
Figure 5. Tree crown extraction and fusion results of IB and high FVC images based on different radius open filters. (a) An example image in RGB color space. (b) The transformed result of (a) using GRDI. (c) The result of (b) using binary image transformation. (dg) The extracted results of (c) using open filters with different radii (3, 5, 7, and 9 pixels). (h) The result of fusion of the four images of (dg). (i) The result of digitally labeling the regions in Figure (h).
Remotesensing 13 04122 g005aRemotesensing 13 04122 g005b
Figure 6. MREFCM results under different conditions. (a) An example image of HFVC and SB. (b) The extracted result of (a) with a close filter with a 3-pixel radius. (c) The result obtained by fusing the areas extracted of (a) through the four radius filters. (d) An example image from a 20 m height with MFVC and IB. (e) The extracted result of (d). (f) The fusion result of (d). (g) An example image from a 20 m height with HFVC and IB. (h) The extracted result of (g) with a 3-pixel radius. (i) The fusion result of (g) through the four radius filters.
Remotesensing 13 04122 g006aRemotesensing 13 04122 g006b
Figure 7. Recognition and fusion results of MREFCM under different conditions. (a) Sample image under LFVC and IB; (b) recognition results of (a) by RF; (c) fusion results of (b); (d) sample image of HFVC and IB; (e) recognition results of (d); (f) fusion result of (e); (g) sample image of HFVC and SB; (h) recognition results of (g); (i) fusion result of (h); (j) sample image of HFVC and IB; (k) recognition results of (j); (l) fusion result of (k).
Remotesensing 13 04122 g007aRemotesensing 13 04122 g007b
Figure 8. Comparison of the recognition effect of different texture feature combinations.
Remotesensing 13 04122 g008
Figure 9. Recognition errors and omissions detected during performance evaluation. (a) The recognition results under 20 m, high FVC, and IB conditions. (b) The recognition results under 20 m, low FVC, and IB conditions. (c) The recognition results under 35 m, high FVC, and SB conditions. (d) The recognition results under 35 m, very high FVC, and IB conditions. The red circles mark the tree crown areas that were correctly identified, the blue circles mark the weed areas that were correctly identified, the orange rectangle marks the missing tree crown area, and the yellow rectangles mark the incorrectly identified areas.
Remotesensing 13 04122 g009
Table 1. The specifications of the UAV and the airborne camera.
UAV (DJI Phantom4) SpecificationsValue
DescriptionQuadrotor
Weight (Battery & Propellers Included)1.38 kg
Max Flight Time28 min
Max Speed20 m/s
Camera Sensor1/2.3″ CMOS
Image Size12.4 M
Image Dimensions4000 × 3000
ISO100
Shutter Speed1/1000
Table 2. Crown statistics of test set. BI: brightness intensity; FVC: fraction vegetation coverage.
HeightBIFVC%Actual Crown
20 m0.25481027
0.2458429
35 m0.2579501
0.3843461
total 2418
Table 3. Image spectral index for extracting target region.
Spectral IndexDescriptionSource
Normalized Green Blue Difference Index N G B D I = G B G + B [19]
Normalized Green Red
Difference Index
N G R D I = G R G + R [21]
Green Red Difference Index G R D I = G R [20]
Normalized Blue Green Vegetation Index N B G V I = B G B + G [24]
Normalized Excessive Green Index N E G I = 2 G R B 2 G + R + B [26]
Excess Green E x G = 2 G R B [29]
Excess Red E x R = 1.4 R G [30]
Table 4. The multi-scale filter extraction process of image foreground.
InputThe Image Ig Transformed by GRDI
Step 1Apply the Otsu method to obtain the binary image Ibw
Step 2Remove patches with area less than 200 pixels
Step 3Closed filters with radii of 3, 5, 7, and 9 pixels are applied to obtain Ic1-4
Step 4Apply the holes filling method to obtain Ich1-4
Step 5Apply an open filter with a 10-pixel radius to obtain Ico1-4
Step 6Use a convex hull method to obtain Ifc
Step 7Fuse images Ico1-4 to obtain If
OutputThe possible foreground region of the extracted image Iroi
Table 5. Statistical table of crown recognition (color vector + LBP + GLCM).
HeightBIFVCActual CrownTPFPFNP (%)R (%)F1 (%)
20 m0.250.481027961456695.5393.5794.54
0.240.58429387404290.6390.2190.42
35 m0.250.79501435226695.1986.8290.81
0.380.43461429523289.1993.0591.08
Average2418221215921393.2991.2292.24
Table 6. Statistical table of crown recognition (color vector + GLCM).
HeightBIFVCActual CrownTPFPFNP (%)R (%)F1 (%)
20 m0.250.48102765712036984.5664.0472.88
0.240.584292535415982.4161.4170.38
35 m0.250.795013673710690.8477.5983.69
0.380.434612532413591.3465.2176.09
Average2418153023576988.2065.0675.76
Table 7. Statistical table of crown recognition (color vector + LBP).
HeightBIFVCActual CrownTPFPFNP (%)R (%)F1 (%)
20 m0.250.48102766815035881.6665.1172.45
0.240.584292896812380.9570.1575.16
35 m0.250.795013593711490.6675.9082.62
0.380.434612662512291.4168.5678.35
Average2418158228071786.1769.9377.15
Table 8. Performance comparison of tree counting methods published in the literature.
MethodHeightBIFVCP (%)R (%)F1 (%)
Proposed method20 m0.250.4895.5393.5794.54
0.240.5890.6390.2190.42
35 m0.250.7995.1986.8290.81
0.380.4389.1993.0591.08
Average93.2991.2292.24
Chen et al. [16]20 m0.250.4880.7063.1870.87
0.240.5888.8270.5678.64
35 m0.250.7996.2635.5151.88
0.380.4395.6943.8760.16
Average90.3753.2865.39
Publisher’s Note: MDPI stays neutral with regard to jurisdictional claims in published maps and institutional affiliations.

