Article

Identifying Pine Wood Nematode Disease Using UAV Images and Deep Learning Algorithms

1
School of Resources and Environmental Engineering, Anhui University, Hefei 230601, China
2
Anhui Engineering Research Center for Geographical Information Intelligent Technology, Hefei 230601, China
*
Author to whom correspondence should be addressed.
Remote Sens. 2021, 13(2), 162; https://doi.org/10.3390/rs13020162
Submission received: 17 November 2020 / Revised: 23 December 2020 / Accepted: 4 January 2021 / Published: 6 January 2021
(This article belongs to the Special Issue Individual Tree Detection and Characterisation from UAV Data)

Abstract

:
Pine nematode is a highly contagious disease that causes great damage to the world’s pine forest resources. Timely and accurate identification of pine nematode disease can help to control it. At present, there are few research on pine nematode disease identification, and it is difficult to accurately identify and locate nematode disease in a single pine by existing methods. This paper proposes a new network, SCANet (spatial-context-attention network), to identify pine nematode disease based on unmanned aerial vehicle (UAV) multi-spectral remote sensing images. In this method, a spatial information retention module is designed to reduce the loss of spatial information; it preserves the shallow features of pine nematode disease and expands the receptive field to enhance the extraction of deep features through a context information module. SCANet reached an overall accuracy of 79% and a precision and recall of around 0.86, and 0.91, respectively. In addition, 55 disease points among 59 known disease points were identified, which is better than other methods (DeepLab V3+, DenseNet, and HRNet). This paper presents a fast, precise, and practical method for identifying nematode disease and provides reliable technical support for the surveillance and control of pine wood nematode disease.

Graphical Abstract

1. Introduction

Pine wood nematode is a forest disease caused by Bursaphelenchus xylophilus. Since 1982, this disease has caused damage to hundreds of millions of pine trees when it invaded China, with economic losses amounting from hundreds to 30 billion yuan and damaging an area of 700 thousand hectares [1]. It is highly contagious and destructive, causing great damage to forest resources worldwide, especially in Europe and Asia [2]. The identification of pine wood nematodes is important for prevention and control.
Remote sensing technology has become an important technical means for identifying forest diseases and insect pests [3,4]. The spectral characteristics of infected plants constitute the main basis for identifying forest pests via remote sensing technology [5]. When forests are invaded by diseases and insect pests, the spectral characteristics of vegetation will change, such as chlorophyll, water content, and cell activity [6,7]. In as early as the 1970s, resource satellites were used to study forest pests and diseases, and forest information was effectively identified [8]. Satellite remote sensing images were used to conduct more in-depth research on pine disease identification, and the results showed that the spectral characteristics of pine trees before and after infection are quite different. This proves the feasibility of identifying pine wood nematodes via the relationships among transpiration rate, spectral response, and different vegetation indices [9,10]. Since then, an increasing number of studies have been conducted on the identification of forest disease by different types of remote sensing images [11,12]. However, the spatial resolution of the early satellite remote sensing images was low, and most remote sensing studies only used the spectral information of the images to perform identification. By selecting the spectral index of forest diseases and insect pests, pine wood nematode diseases were determined [13].
With the development of technology and the improved quality of remote sensing data, identifying disease in forest areas is now one of the most important applications of land cover monitoring using remote sensing data. However, if only the spectral information of high-resolution remote sensing imagery is considered, misclassification can easily result [14]. Therefore, some studies have started to make use of spectral information as well as the textural and geometric information of the image target and to use the K-nearest neighbour (KNN) and maximum entropy methods to establish a pine wood nematode disease identification model; these methods have achieved good classification and have been able to rapidly identify large-scale pine disease areas [6,15]. For example, using the colour and texture features of unmanned aerial vehicle (UAV) images as input and using the minimum relative distance method and membership function method to identify diseased pine, pine trees and other ground objects in different health states can be accurately classified [3,16]. However, the accuracy of the pine wood nematode disease results is dependent on many factors, such as geographic location, calibration, and the experience of the analyst. Making use of the detailed information and high-level features in some classification methods are difficult, since they only consider low-level features, such as colour or texture features, which greatly affects the identification of pine nematodes in high-resolution UAV images [17,18]. Therefore, modification of these algorithms is a must in order to minimize misclassification and to improve the accuracy of identifying pine wood nematode disease.
In recent years, deep learning has been able to automatically learn in the field of target identification in remote sensing images [19,20,21]; it has been widely used to identify targets in ultra-high-resolution remote sensing images, and significant results have been achieved [22,23,24]. Compared with traditional machine learning algorithms such as support vector machines (SVMs) [25], deep learning has been recognized as a high-precision identification method [26]. To improve the detection accuracy of pests and diseases, some studies have used convolutional neural networks (CNNs) such as AlexNet to automatically identify forest pests and diseases. These networks use a convolutional layer to extract target information, the full connection layer is used to highly purify the feature, and a classifier determines whether the image contains diseases [27]. However, these methods have not been able to provide accurate location information, and ground staff is still needed to find the specific location of diseases through visual interpretation [18]. The fully convolutional networks (FCNs) proposed in 2014 can locate targets more accurately and can separate them from the background [20,22]. They remove fully connected layers on the basis of a CNN and the spatial information of the image, and a deconvolution operation establishes the output segmentation results of the upsampling process. Some studies have proposed a series of semantic models, including DeepLab V3+ [28], HRNet [29], and DenseNet [30]. In the task of tree species classification, FC-DenseNet and other semantic segmentation networks can effectively identify different tree species in images and can position different tree species [14,31]. When acquiring target information, conventional deep learning methods have difficulty accounting for detailed spatial information and the receptive field, resulting in a loss of details. Additionally, the disease target of a single pine wood nematode is too small to lose target information during the downsampling process, which affects identification.
Therefore, we propose a new method to reduce the loss of detailed information in the convolution process focused on the problem of small targets and complex backgrounds in images acquired by UAVs, which have an ultra-high spatial resolution. In order to improve the accuracy of disease identification, this method identifies high-level and low-level features. This method is called the spatial-context-attention network (SCANet). SCANet is mainly composed of a spatial information retention module (SIRM) and a context information module (CIM), which can reduce the loss of spatial information, expand the receptive field, and obtain rich context information. In addition, to effectively suppress the interference of background information and to highlight target feature information, we added the attention refinement module (ARM) to the context information module to strengthen the target feature in this study [32]. The contributions of this paper are summarized as follows:
(1)
We present a new method to identify pine wood nematode disease with high accuracy using UAV images.
(2)
An SIRM is used to retain spatial information to obtain low-level features, and a CIM can expand the receptive field to obtain high-level features.
(3)
The method can also be used to identify trees with single pine wood nematode disease.
The rest of this paper is organized as follows. A detailed description of the proposed method is given in Section 2. The experimental data and the sample base are introduced in Section 3. The results and analysis are presented in Section 4. Finally, the conclusions are given in Section 5.

2. Methods

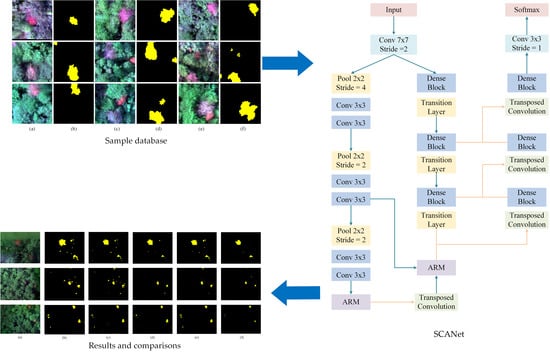
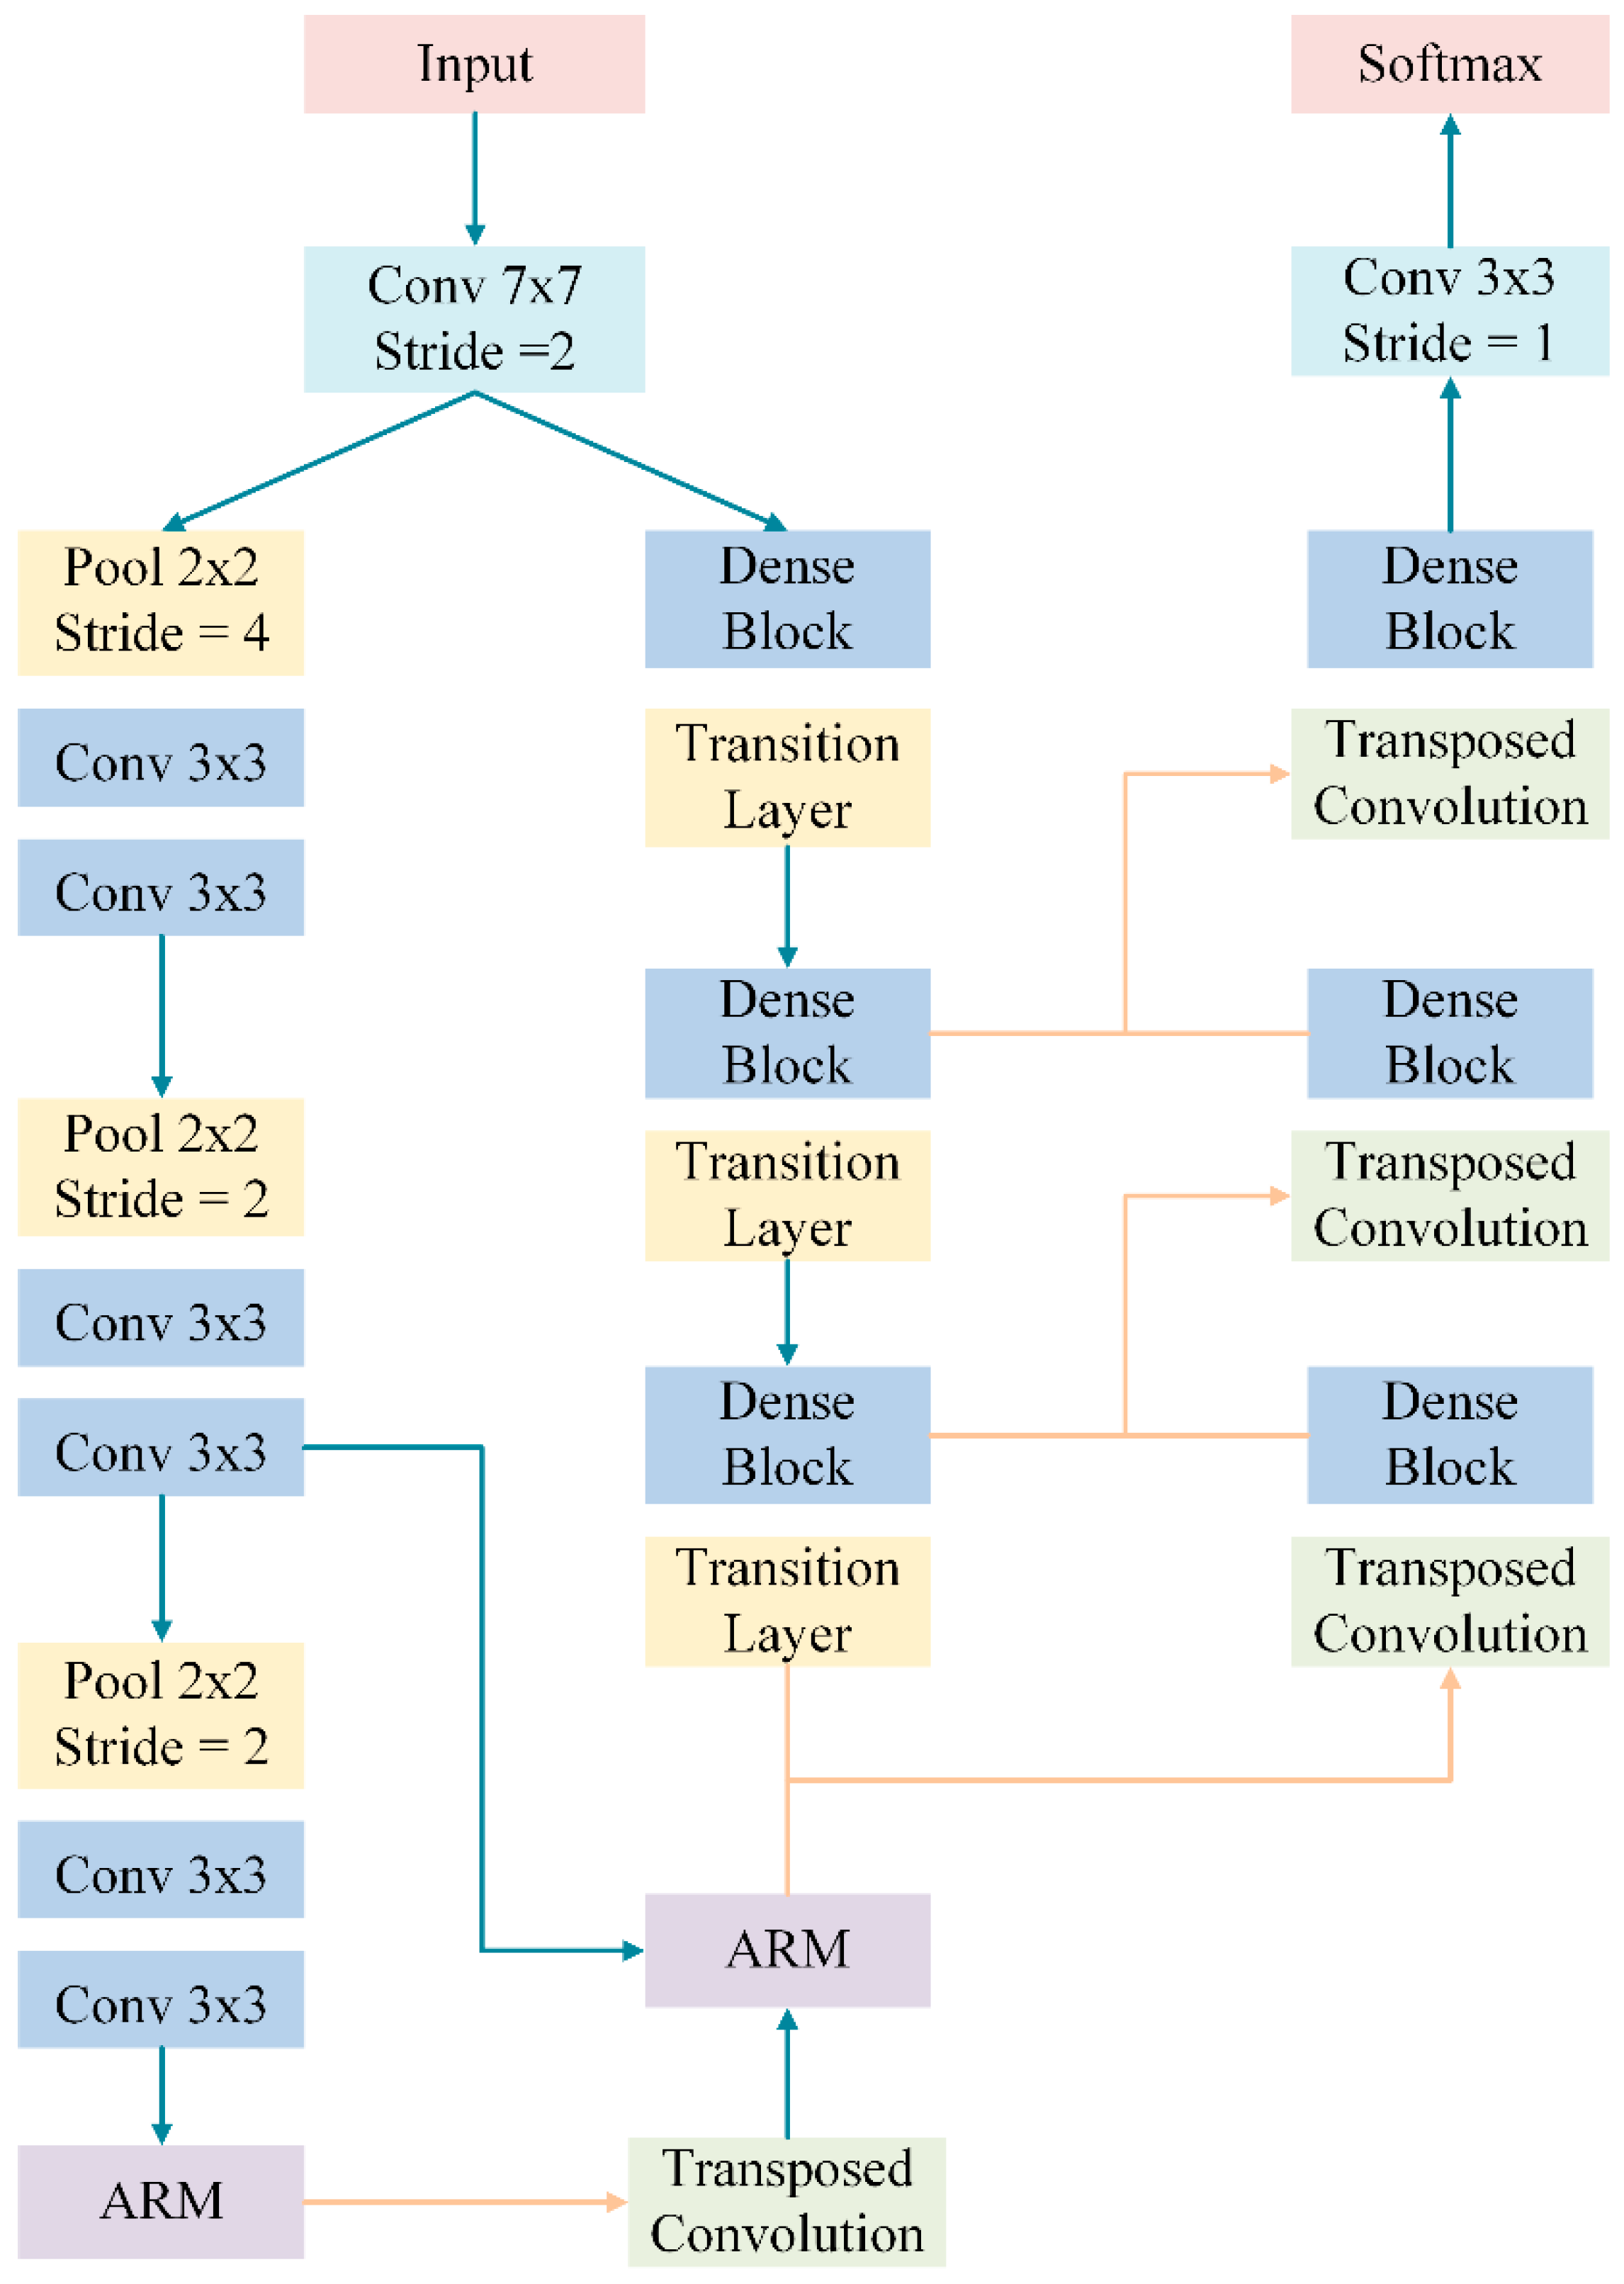
2.1. The Network Structure

In order to comprehensively consider spatial information and the receptive field and to reduce the loss of single pine wood nematode disease information, we proposed SCANet to better identify pine nematode disease. The network structure is shown in Figure 1. In downsampling, after the original image entered the first convolutional layer, we divided the network into two branches: the SIRM and the CIM. We then performed feature fusion after the end of the two branches. The SIRM was mainly composed of three dense blocks and three transition layers (mainly composed of a convolutional layer, a dropout layer, and a pooling layer). The CIM consisted of three convolutional layers, three pooling layers, and two ARMs. The stride of the first pooling layer was 4, and two ARMs were then used to refine the results of the latter two pooling layers. The output of the ARM was fused with the output of the SIRM. In upsampling, the network mainly consisted of three dense blocks and three transposed convolutions. Rapid upsampling allowed for amplification of the feature map to produce the same resolution as the original image, and a softmax classifier was used to output the prediction map.

2.2. Spatial Information Retention Module

Aiming at the problem that spatial information of a single plant disease is easy to lose in the process of downsampling, this paper proposes an SIRM to extract the spatial details of the target. The module consisted of three dense blocks and three transition layers. There was direct information transformation between two feature layers of a dense block [33]. For each layer, the output of all the previous layers was used as the input, and its output was used as the input for subsequent layers. Dense blocks have several advantages, such as enhanced feature reuse, a reduced number of parameters, and mitigated gradient dispersion, which make the network easier to train. Its formula is expressed as follows:
Xl = Hl ([X0, X1, …, Xl−1])
where [X0, X1…, Xl−1] represents the connection of the output of all previous layers and where the nonlinear transformation Hl is usually a composite function consisting of a batch-normalization layer, an activate function, and a 3 × 3 convolution layer. The transition layer includes a 1 × 1 convolutional layer, a dropout layer, and an average pooling layer with a step size of 2. Abundant spatial information and detailed features can be obtained by using dense blocks to reuse information from the front layer and sampling under the transition layer.

2.3. Context Information Module

In semantic segmentation tasks, the receptive field has an important influence on the performance of semantic segmentation. To expand the receptive field, some methods use pyramid pooling modules [34], atrous space pyramid modules [35,36], or large convolution kernels [37]. Although these modules consider part of the spatial information, they require a large number of computations and considerable memory consumption, resulting in a slow training speed. To solve this problem, the context information module was designed. By strengthening the context background information, the deep features of the target were highlighted, the accuracy of model recognition was improved, the shadow caused by a single spectral feature was reduced, and the phenomenon of a “foreign object in the same spectrum” and the “same object with different spectrums” was avoided. The CIM primarily included a series of downsampling layers (including simple convolution and pooling) and two ARMs. The rapid pooling operation can make the network obtain a larger receptive field, reducing the number of parameters and memory consumption. The ARM mainly consisted of an average pooling layer, a 1 × 1 convolutional layer, a batch standardization layer, and a sigmoid layer, shown in Figure 2. The attention vector was calculated to guide the learning of target features, which could effectively suppress interference of complex backgrounds and enhanced the target features.

2.4. Evaluation Index

In order to verify efficiency of the model in identifying the disease, the results were quantitatively evaluated. The main evaluation methods included (1) overall accuracy, i.e., the ratio of the number of correctly extracted targets to the total number of samples; (2) precision, i.e., the ratio of the number of correctly extracted targets to all extracted targets; (3) recall, i.e., the ratio between the number of correctly extracted targets and the number of true targets; and (4) the missing alarm rate, i.e., the ratio between the number of missed targets and the true number of missed targets. We set Ptp as the number of correctly extracted targets, Pfp as the number of erroneously extracted targets, Ptn as the number of correctly extracted negative targets, and Pfn as the number of missed extracted targets. The formulas for each evaluation method are as follows:
O v e r a l l   A c c u r a c y = P t p + P t n P t p + P f p + P t n + P f n
P r e c i s i o n = P t p P t p + P f p
R e c a l l = P t p P t p + P f n
M i s s i n g A l a r m = P f p P t p + P f n

3. Data and Experiments

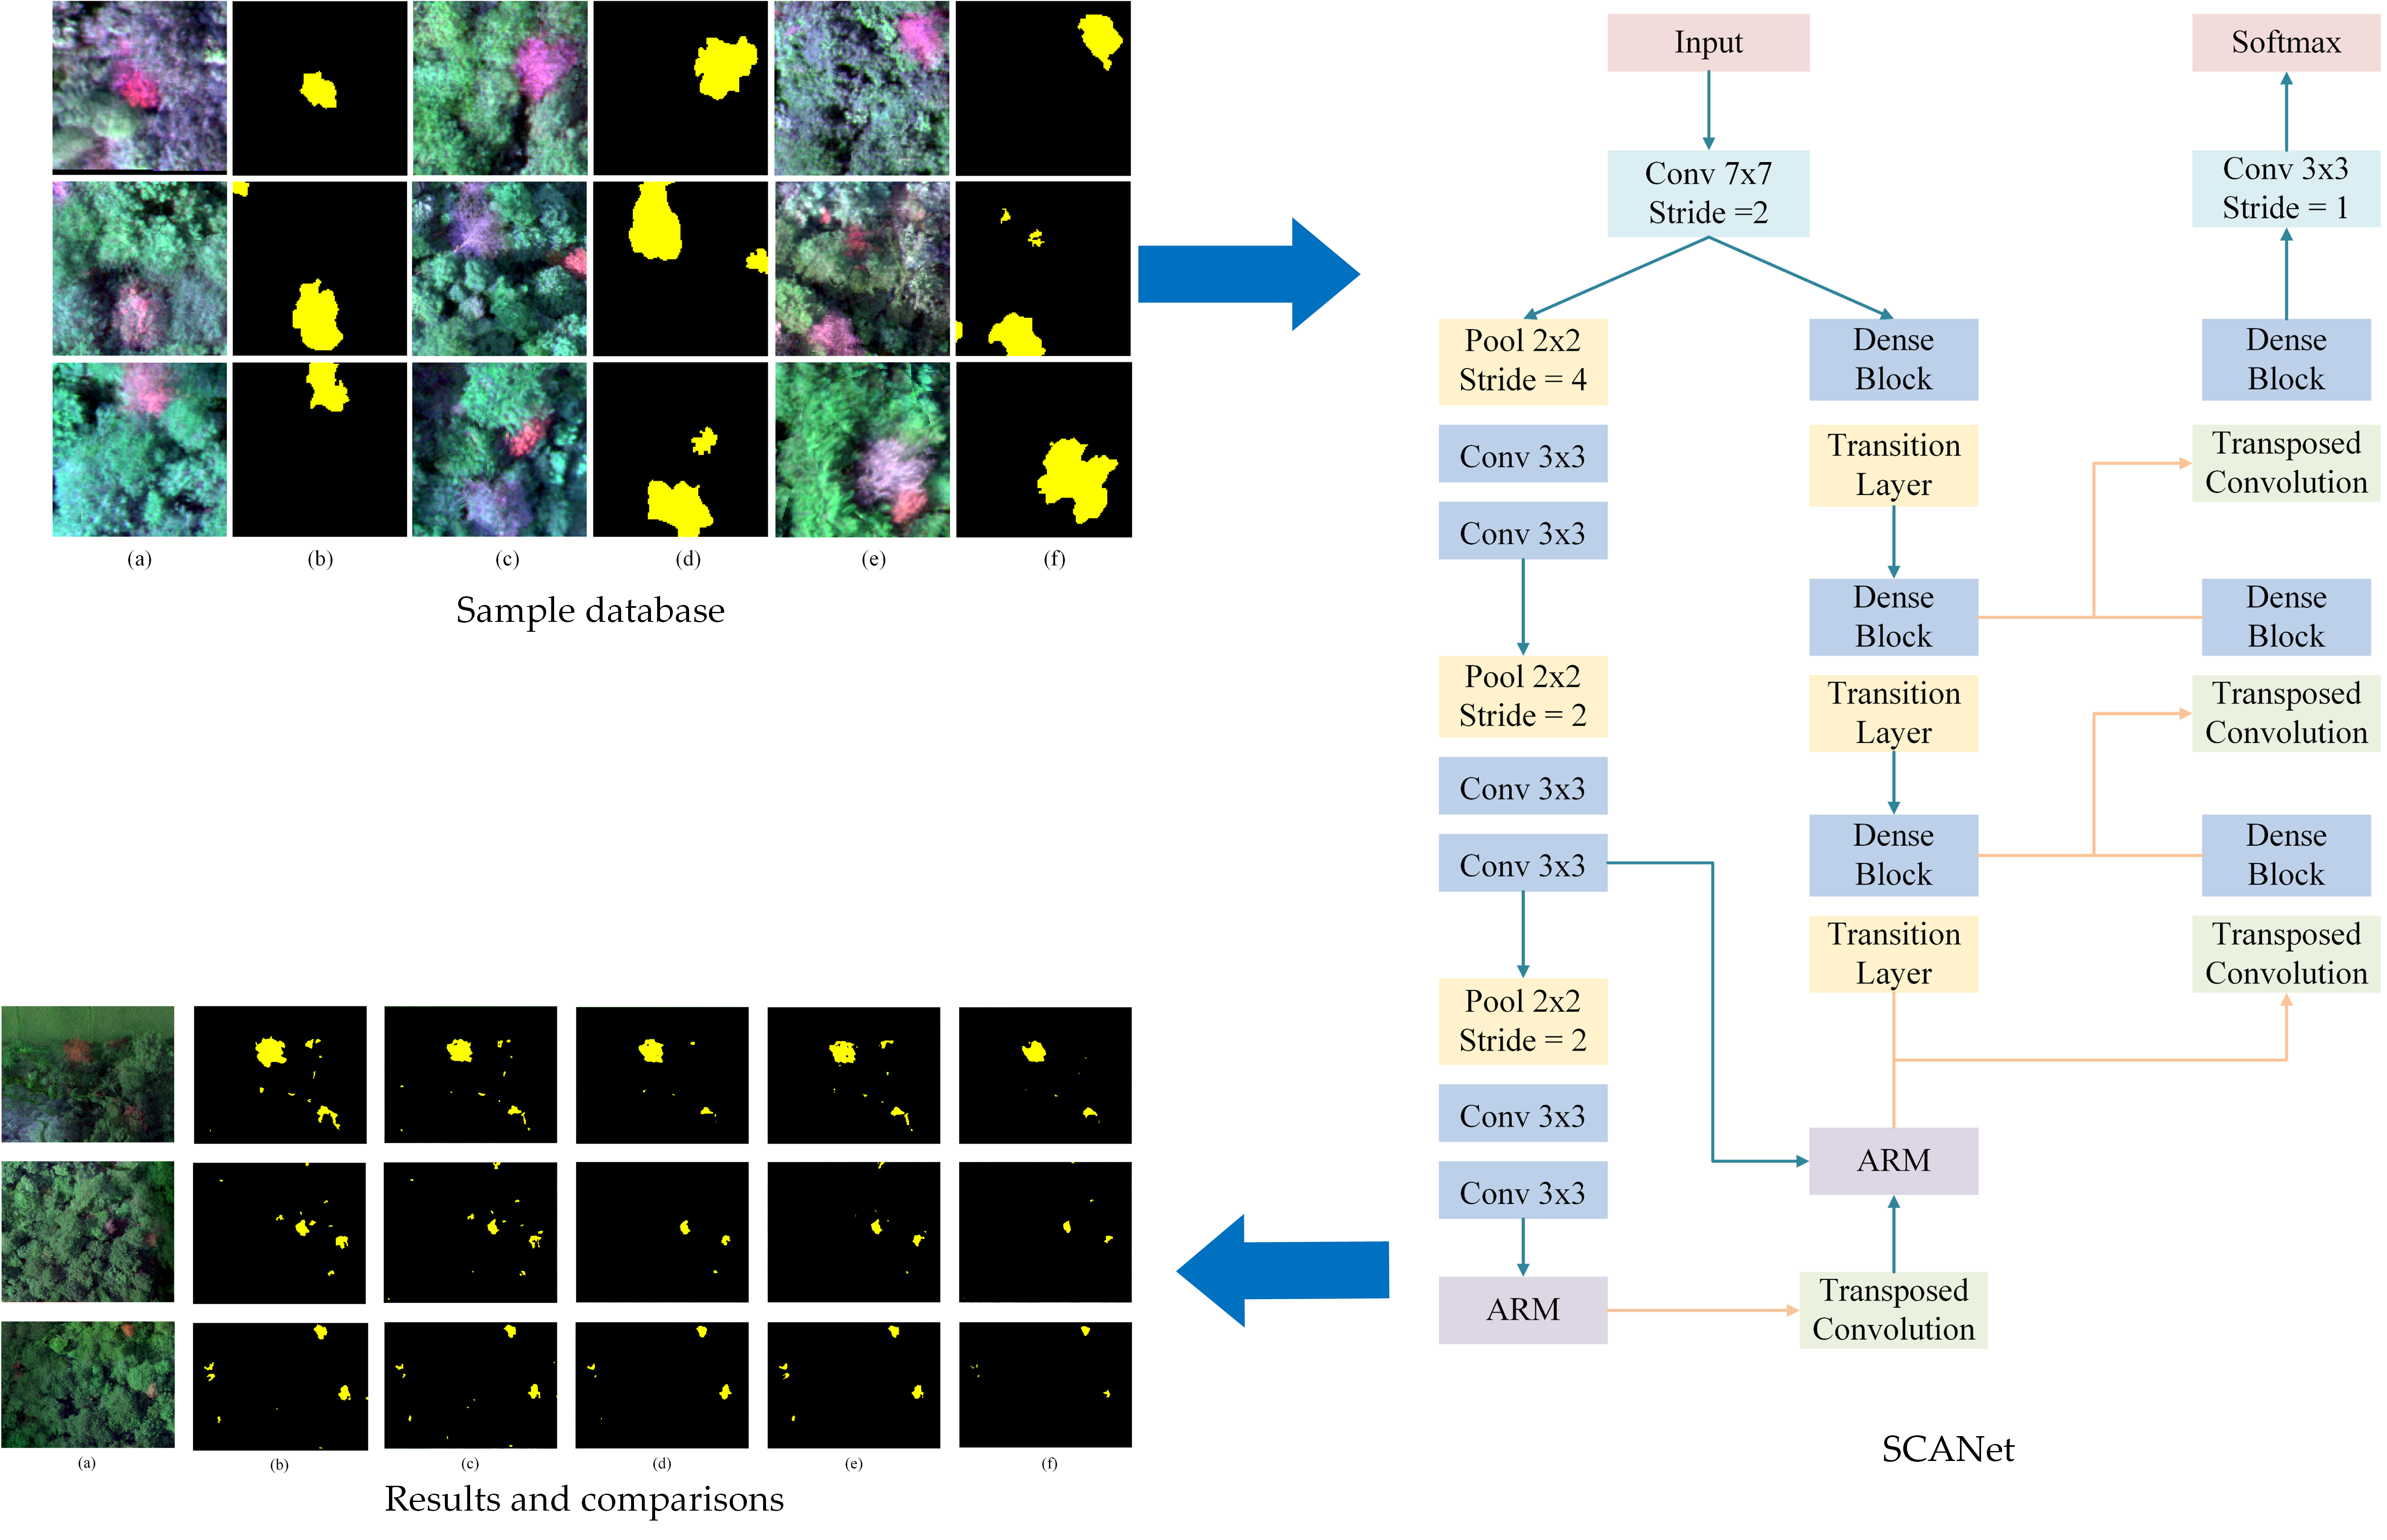
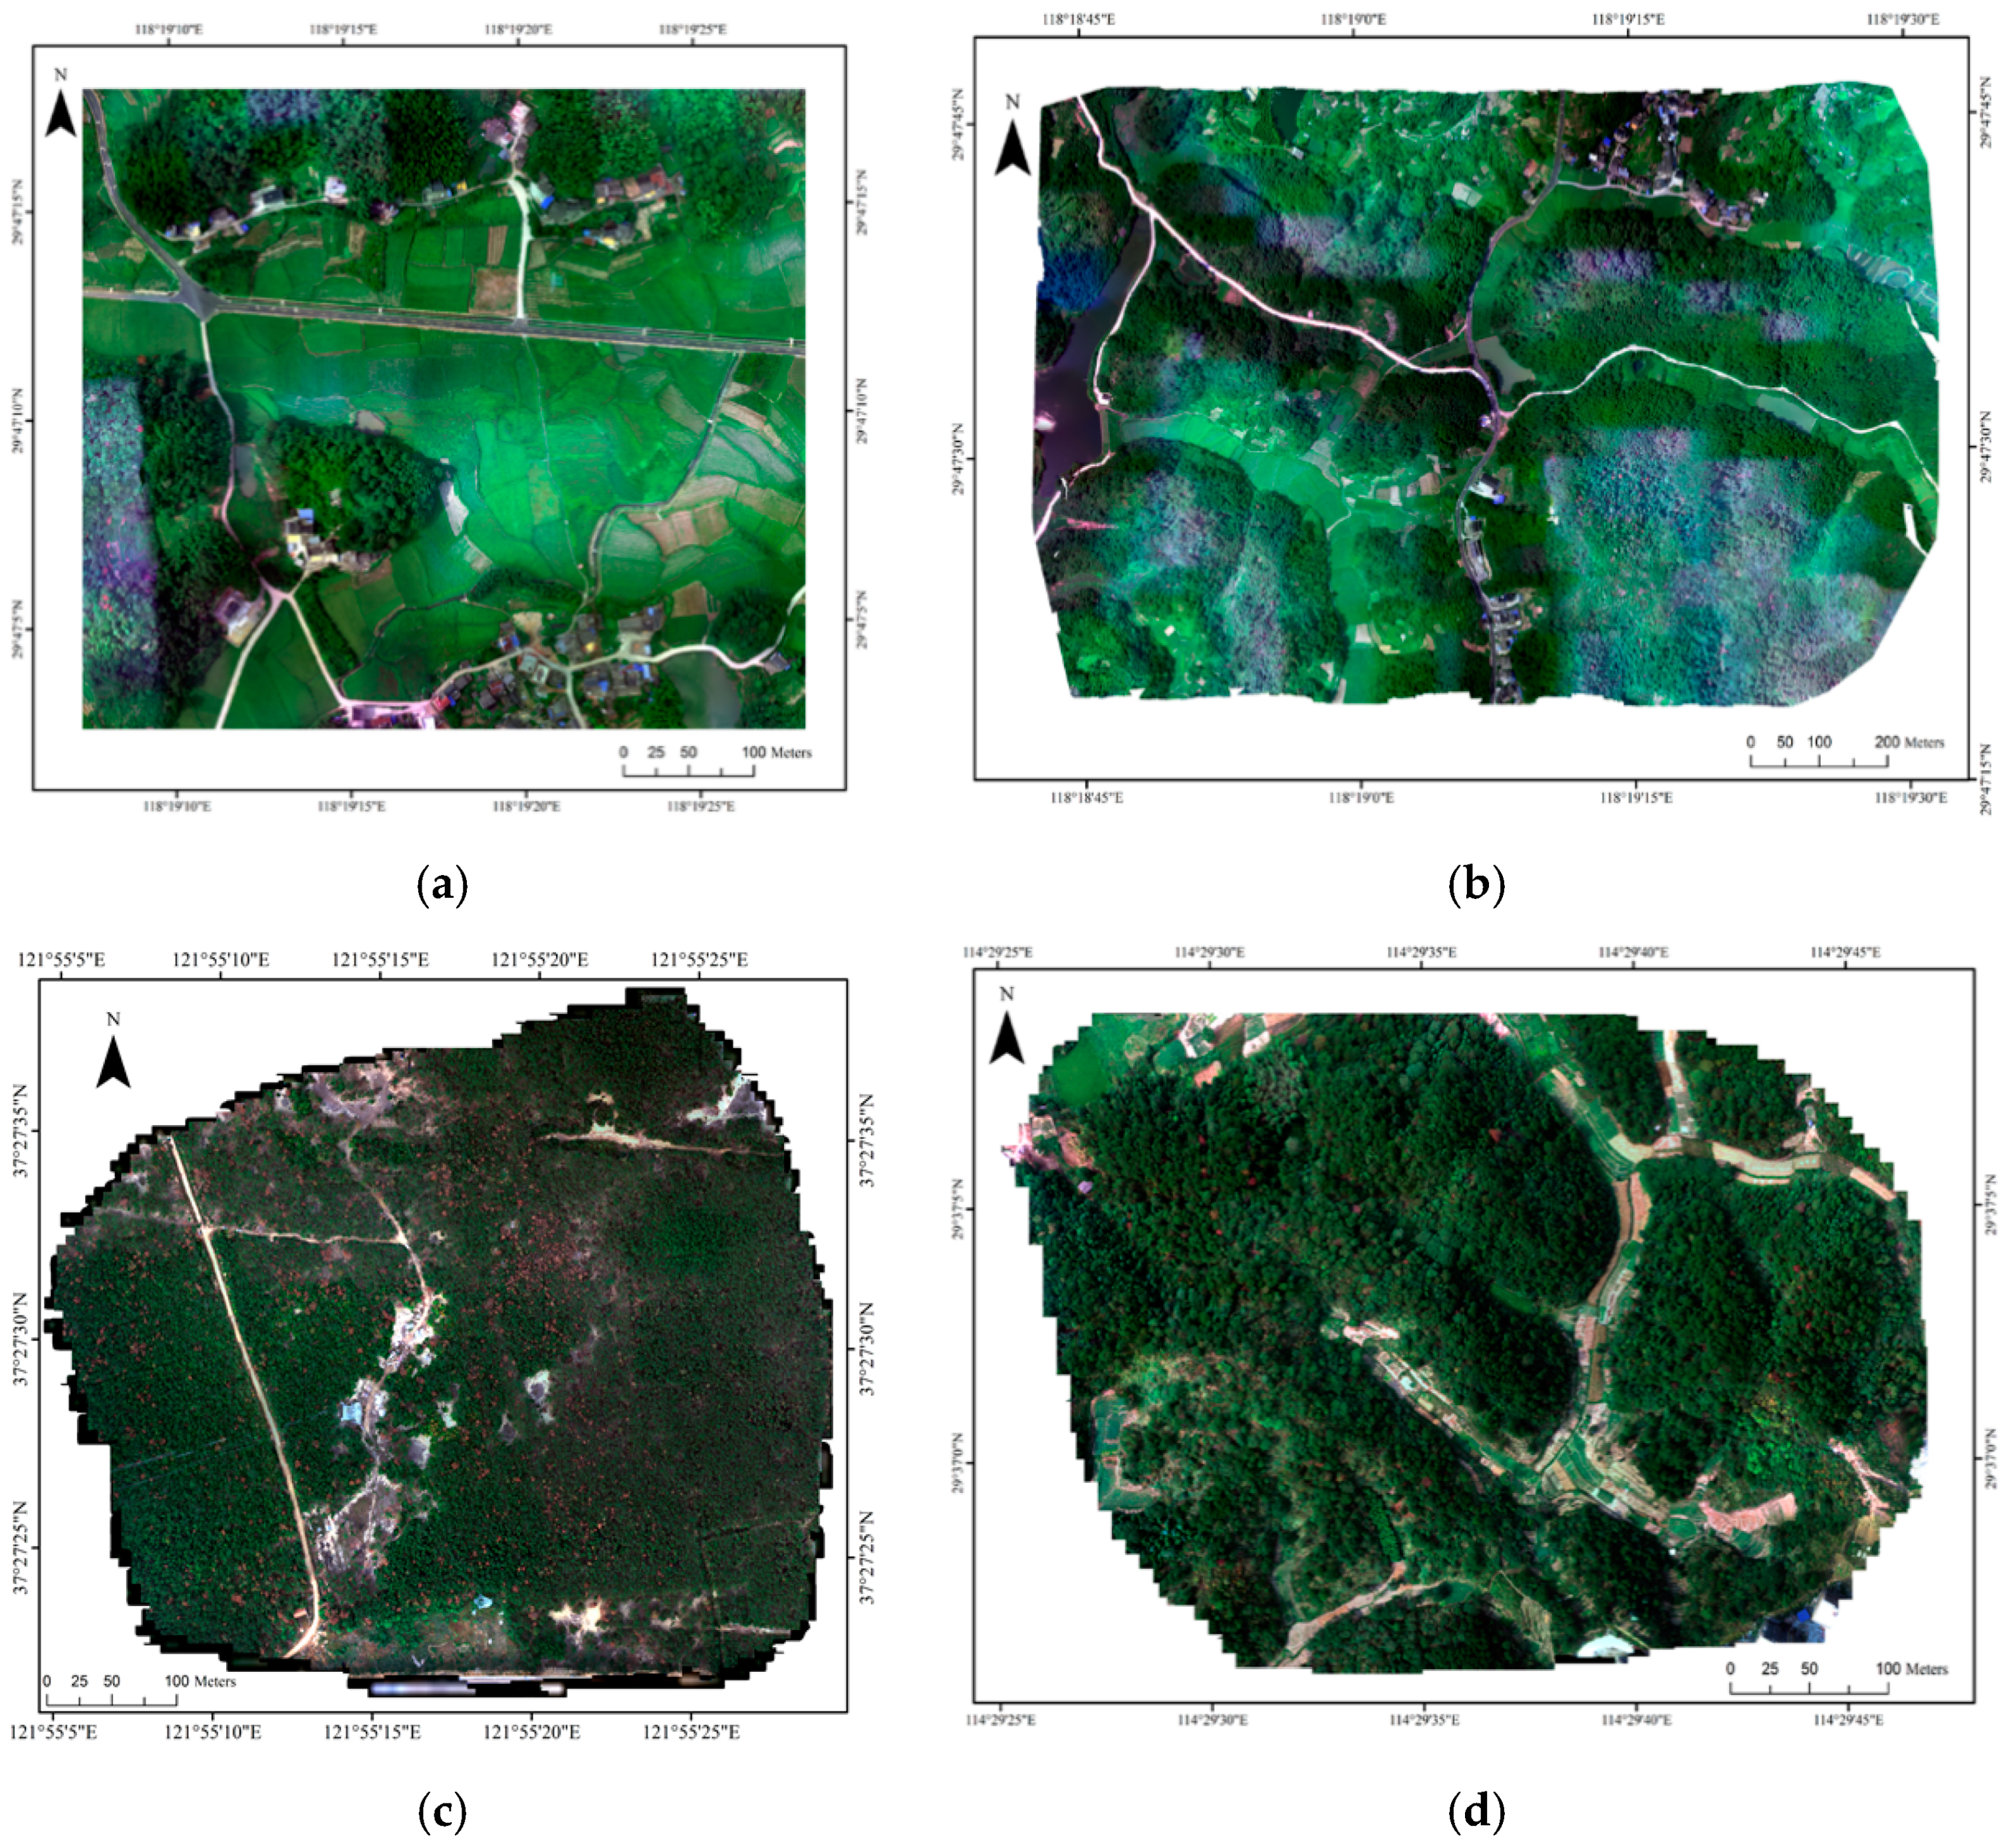
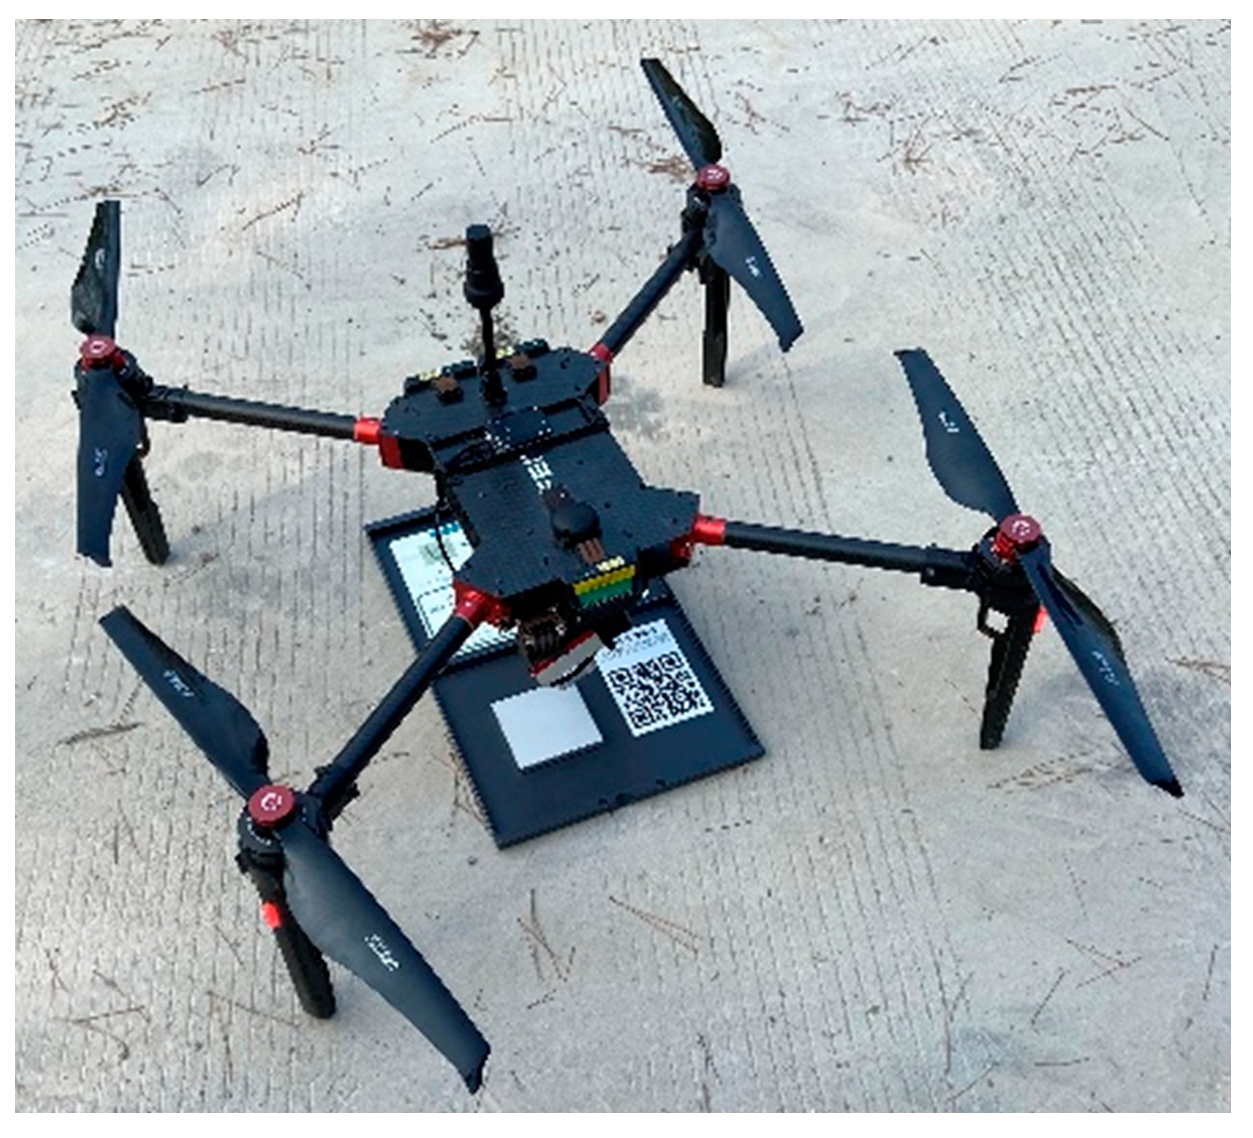
3.1. Data Information

The experimental aerial flight platform was the FeimaD200 quadrotor. A multi-spectral camera, model RedEdge-MX, was equipped on the UAV, and the camera included blue (475 nm), green (560 nm), red (670 nm), rededge (720 nm), and near red (840 nm) bands. A total of four UAV images were obtained, as shown in Figure 3. The data information is shown in Table 1. These areas are located in the eastern and central parts of China. Huangshan-1 and Huangshan-2 are located in Anhui. The main species are bamboo and Masson pine, with a few hardwood trees. Wuhan is located in Hubei, which has mixed forests in the flight area. Yantai is located in Shandong, which is dominated by coniferous forests. Huangshan-2 was used as training data, and Huangshan-1, Wuhan, and Yantai were used as test data.
Since the UAV flight platform adopted in this experiment was equipped with a real-time kinematic system, high-precision foreign image elements were provided, so a data acquisition method without image control was adopted. The orthographic production of multi-spectral images included camera internal orientation, coordinate system selection, radiation calibration, band registration, aerial triangulation, a digital elevation model, and multi-spectral orthographic production. The radiometric calibration was performed with a diffuse plate before flight, as shown in Figure 4 [38].

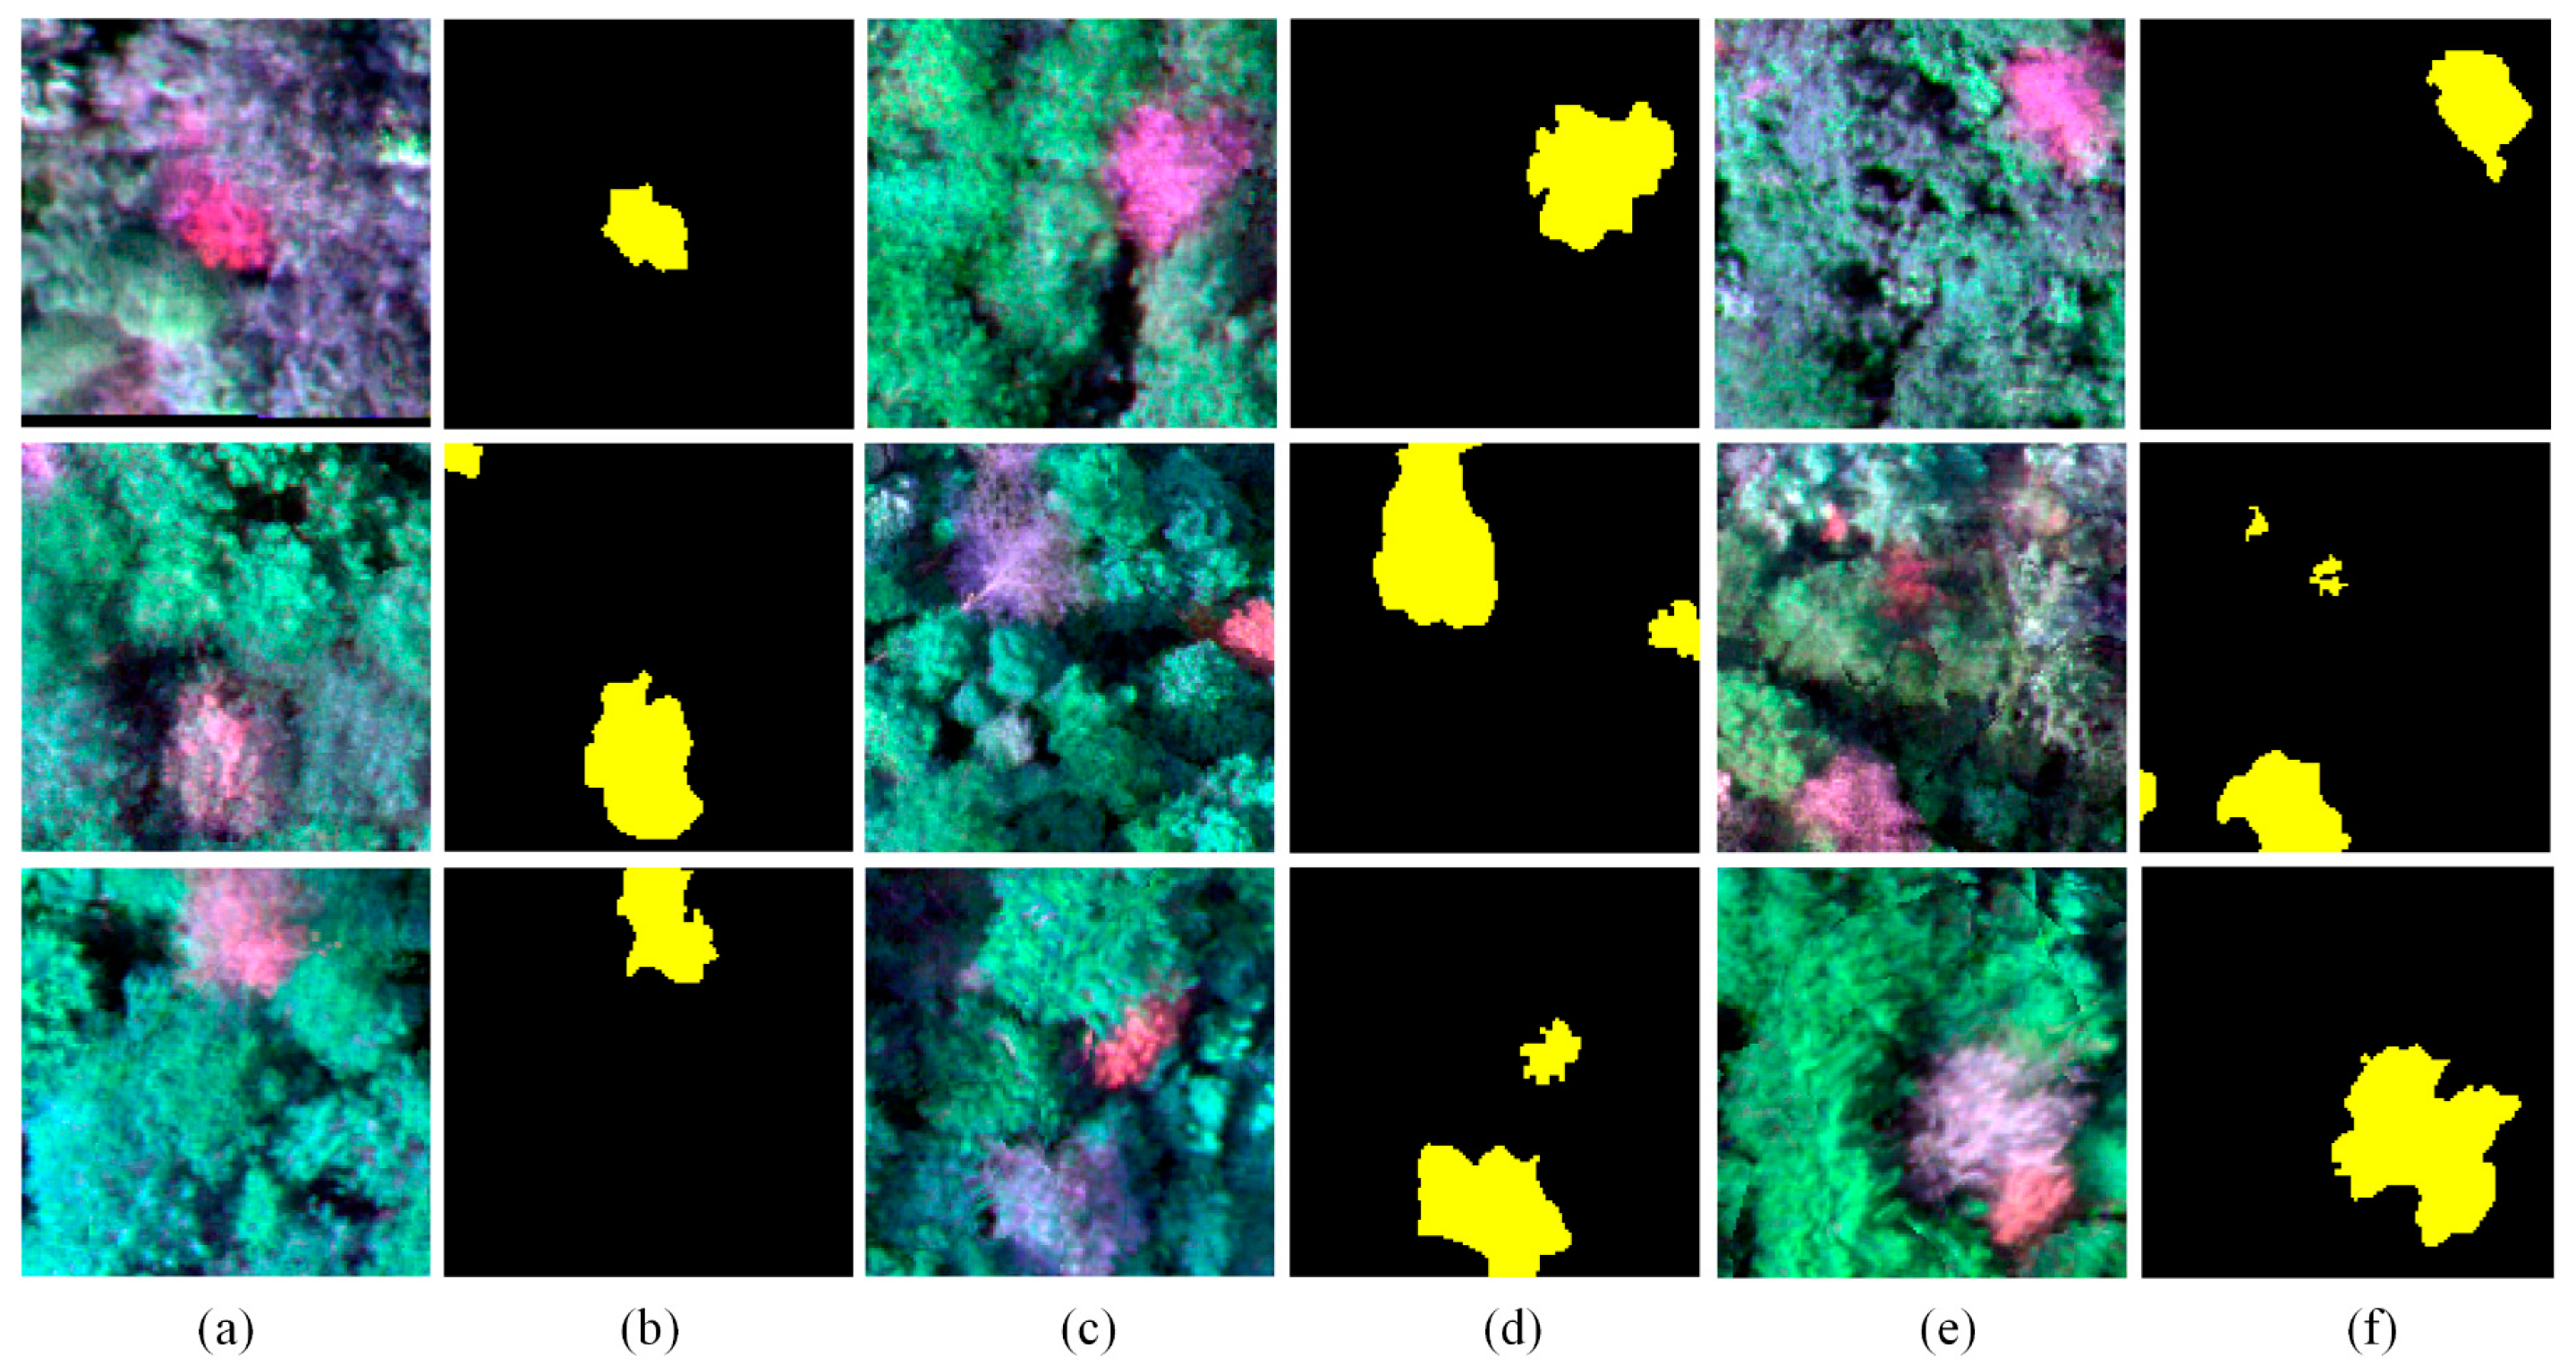
3.2. Dataset Details

In this paper, the Huangshan-2 image was taken as sample data, and the vector data of pine nematode disease is drawn by a visual interpretation method to obtain the corresponding label of pine nematode disease. Multi-scale segmentation is helpful to improve the number and diversity of samples and to prevent overfitting of models. Therefore, Huangshan-2 images and label data were divided into 128 × 128 pixels and 256 × 256 pixels, and a training sample base of the pine nematode disease identifying model was constructed after combination. To test the validity of the model, all sample data were randomly divided into a training set and a test set at a ratio of 3:1. After eliminating a small number of invalid samples, the training samples contained 4862 sub-images and 1712 sub-images were verified. Some samples are shown in Figure 5.

4. Results and Analysis

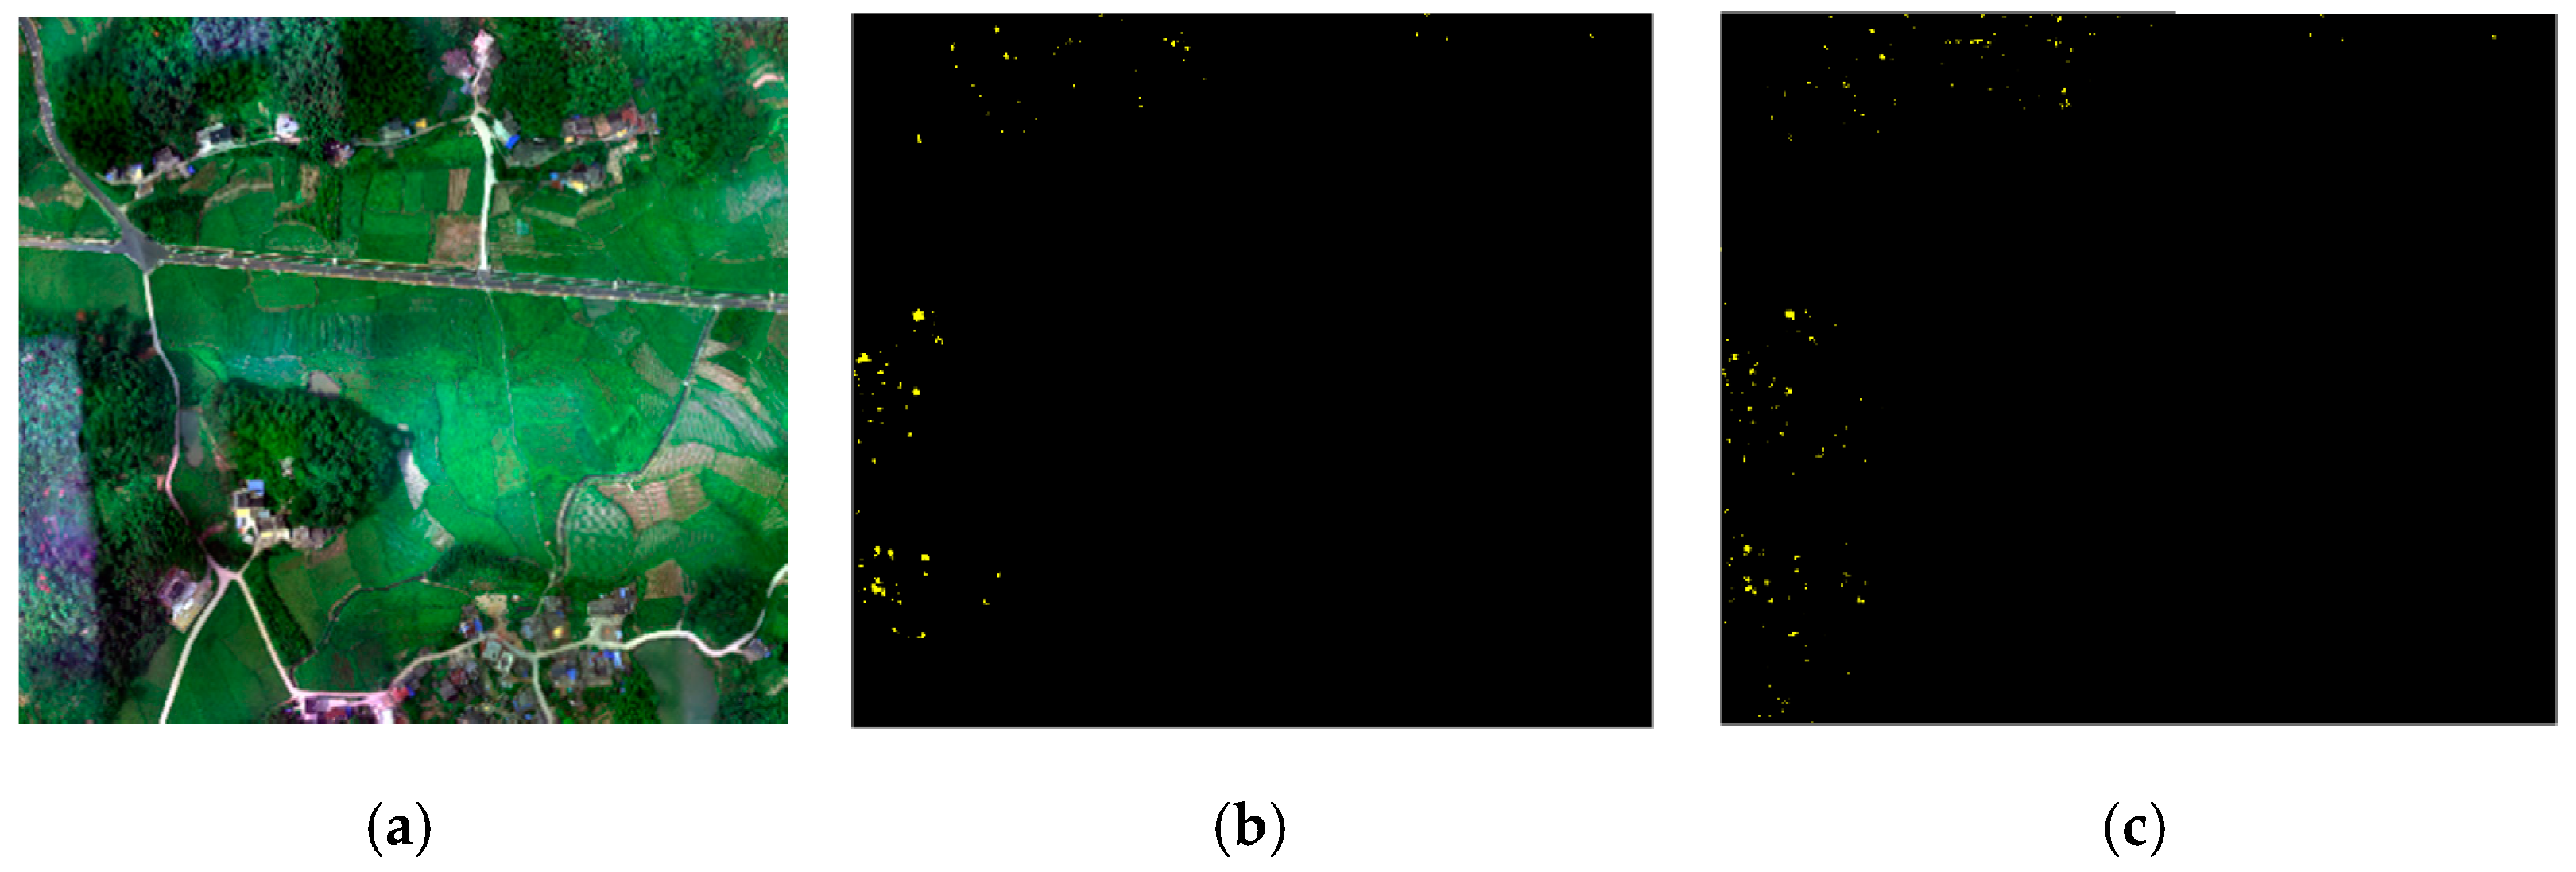
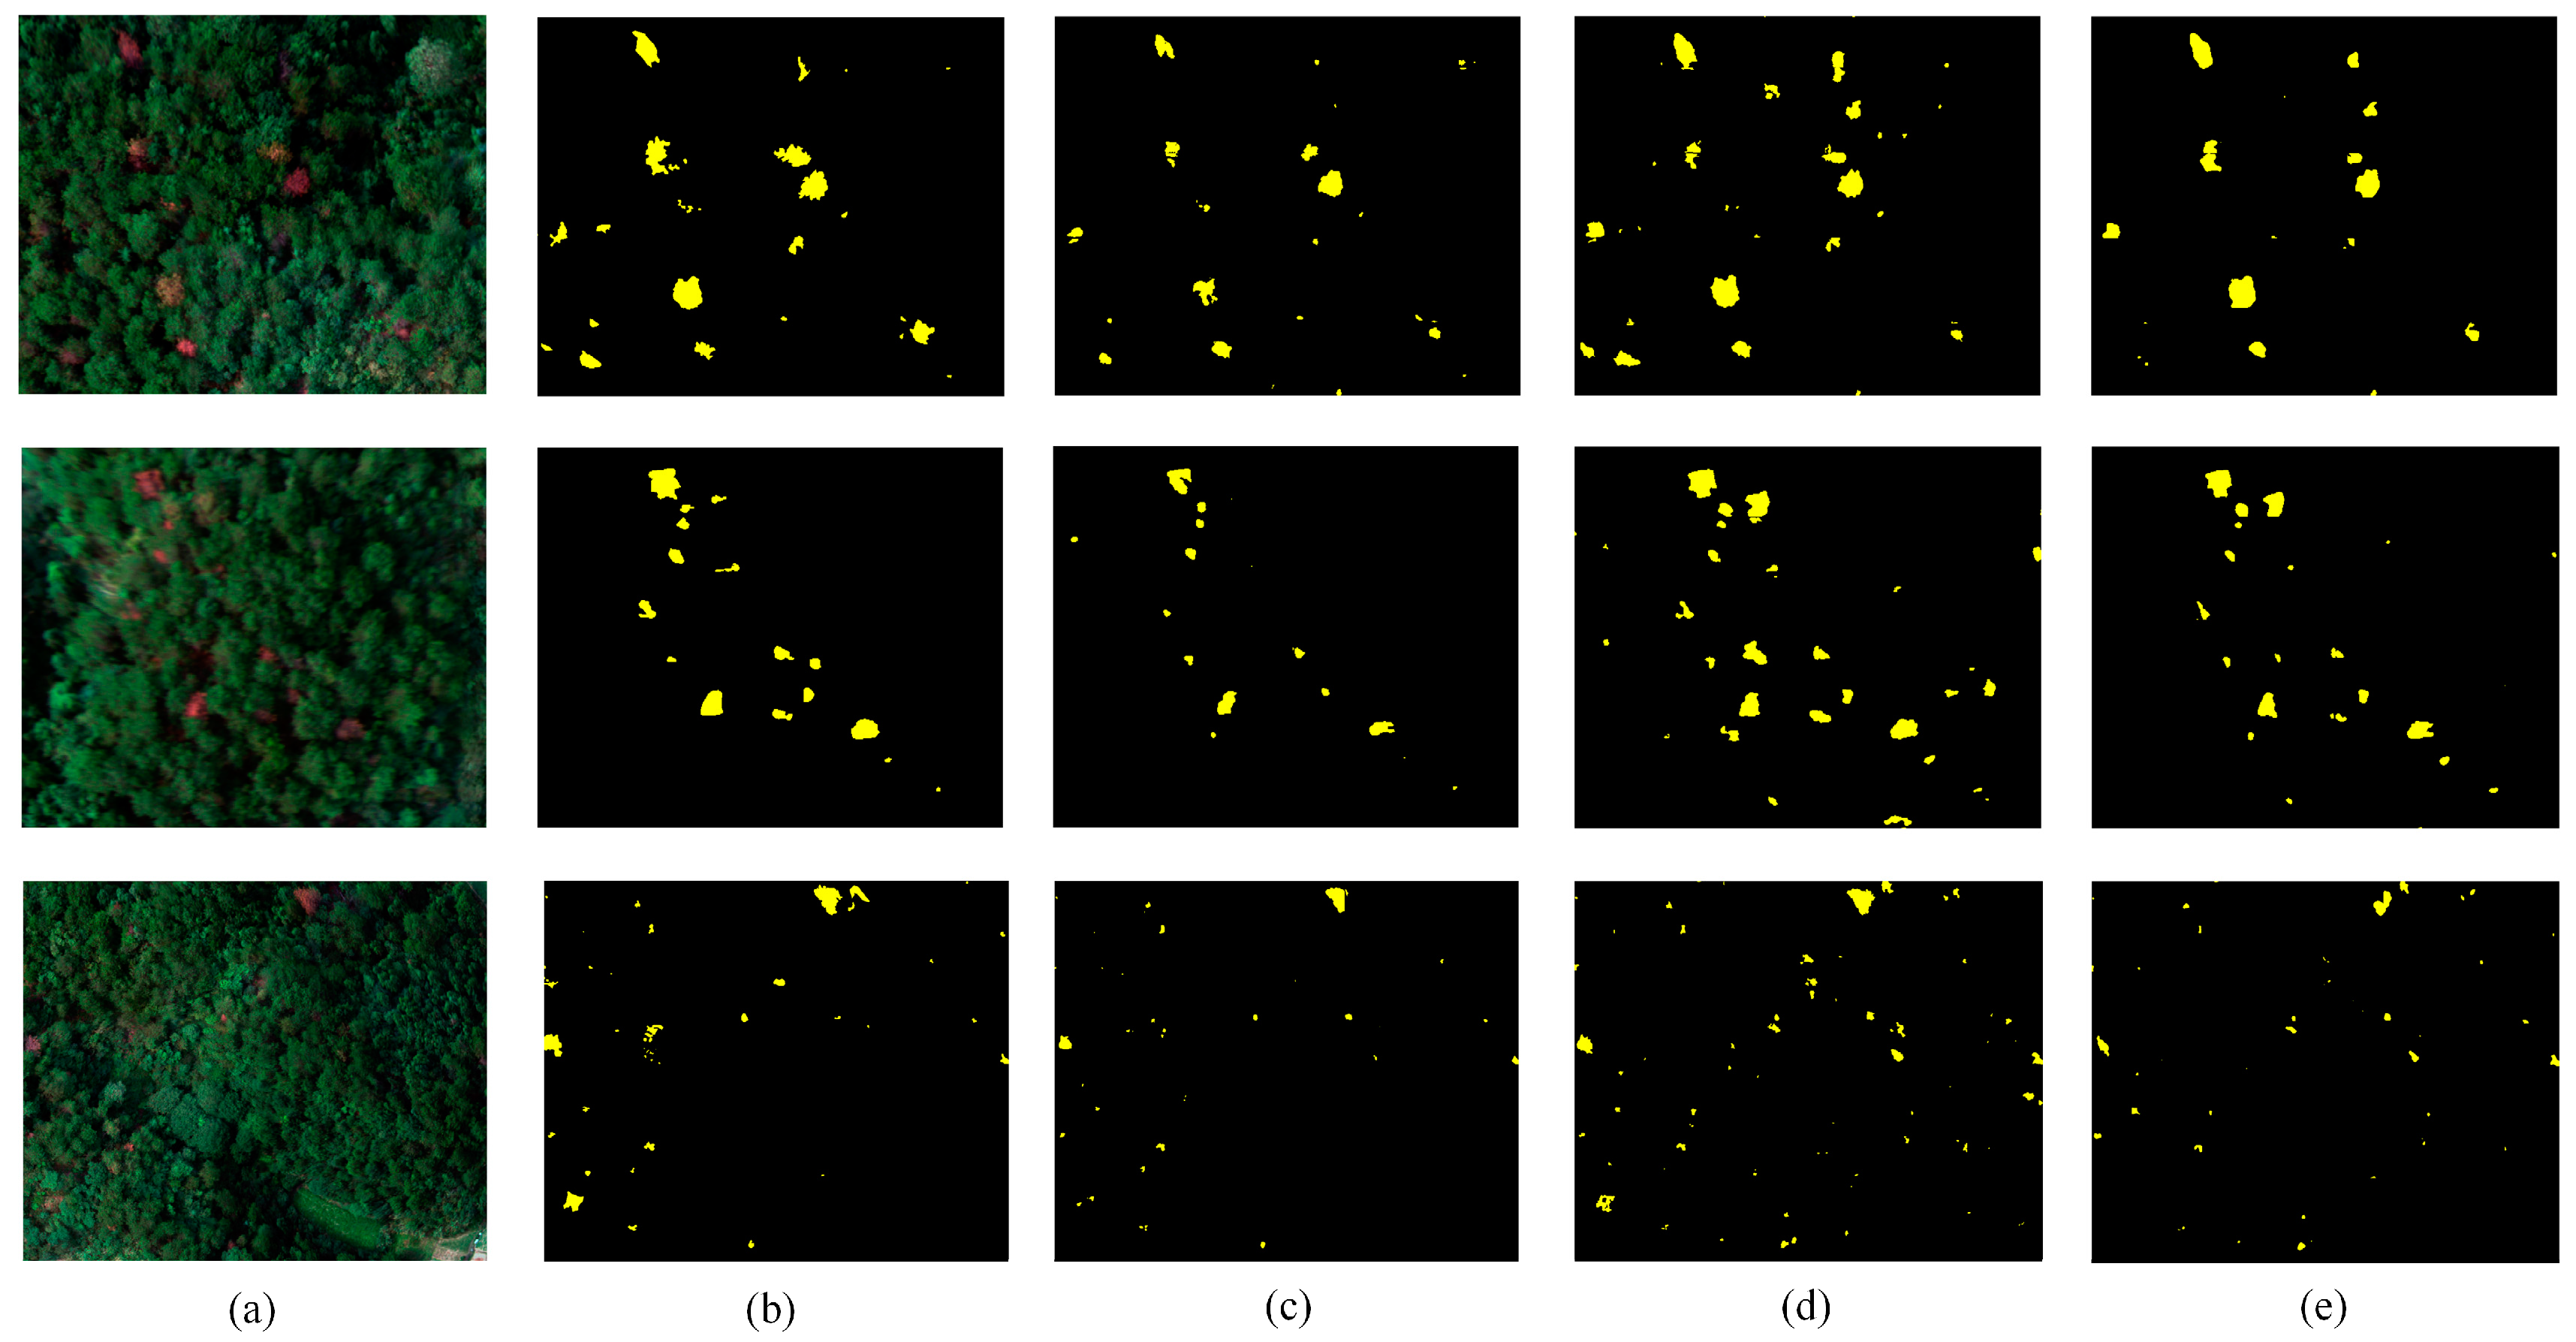
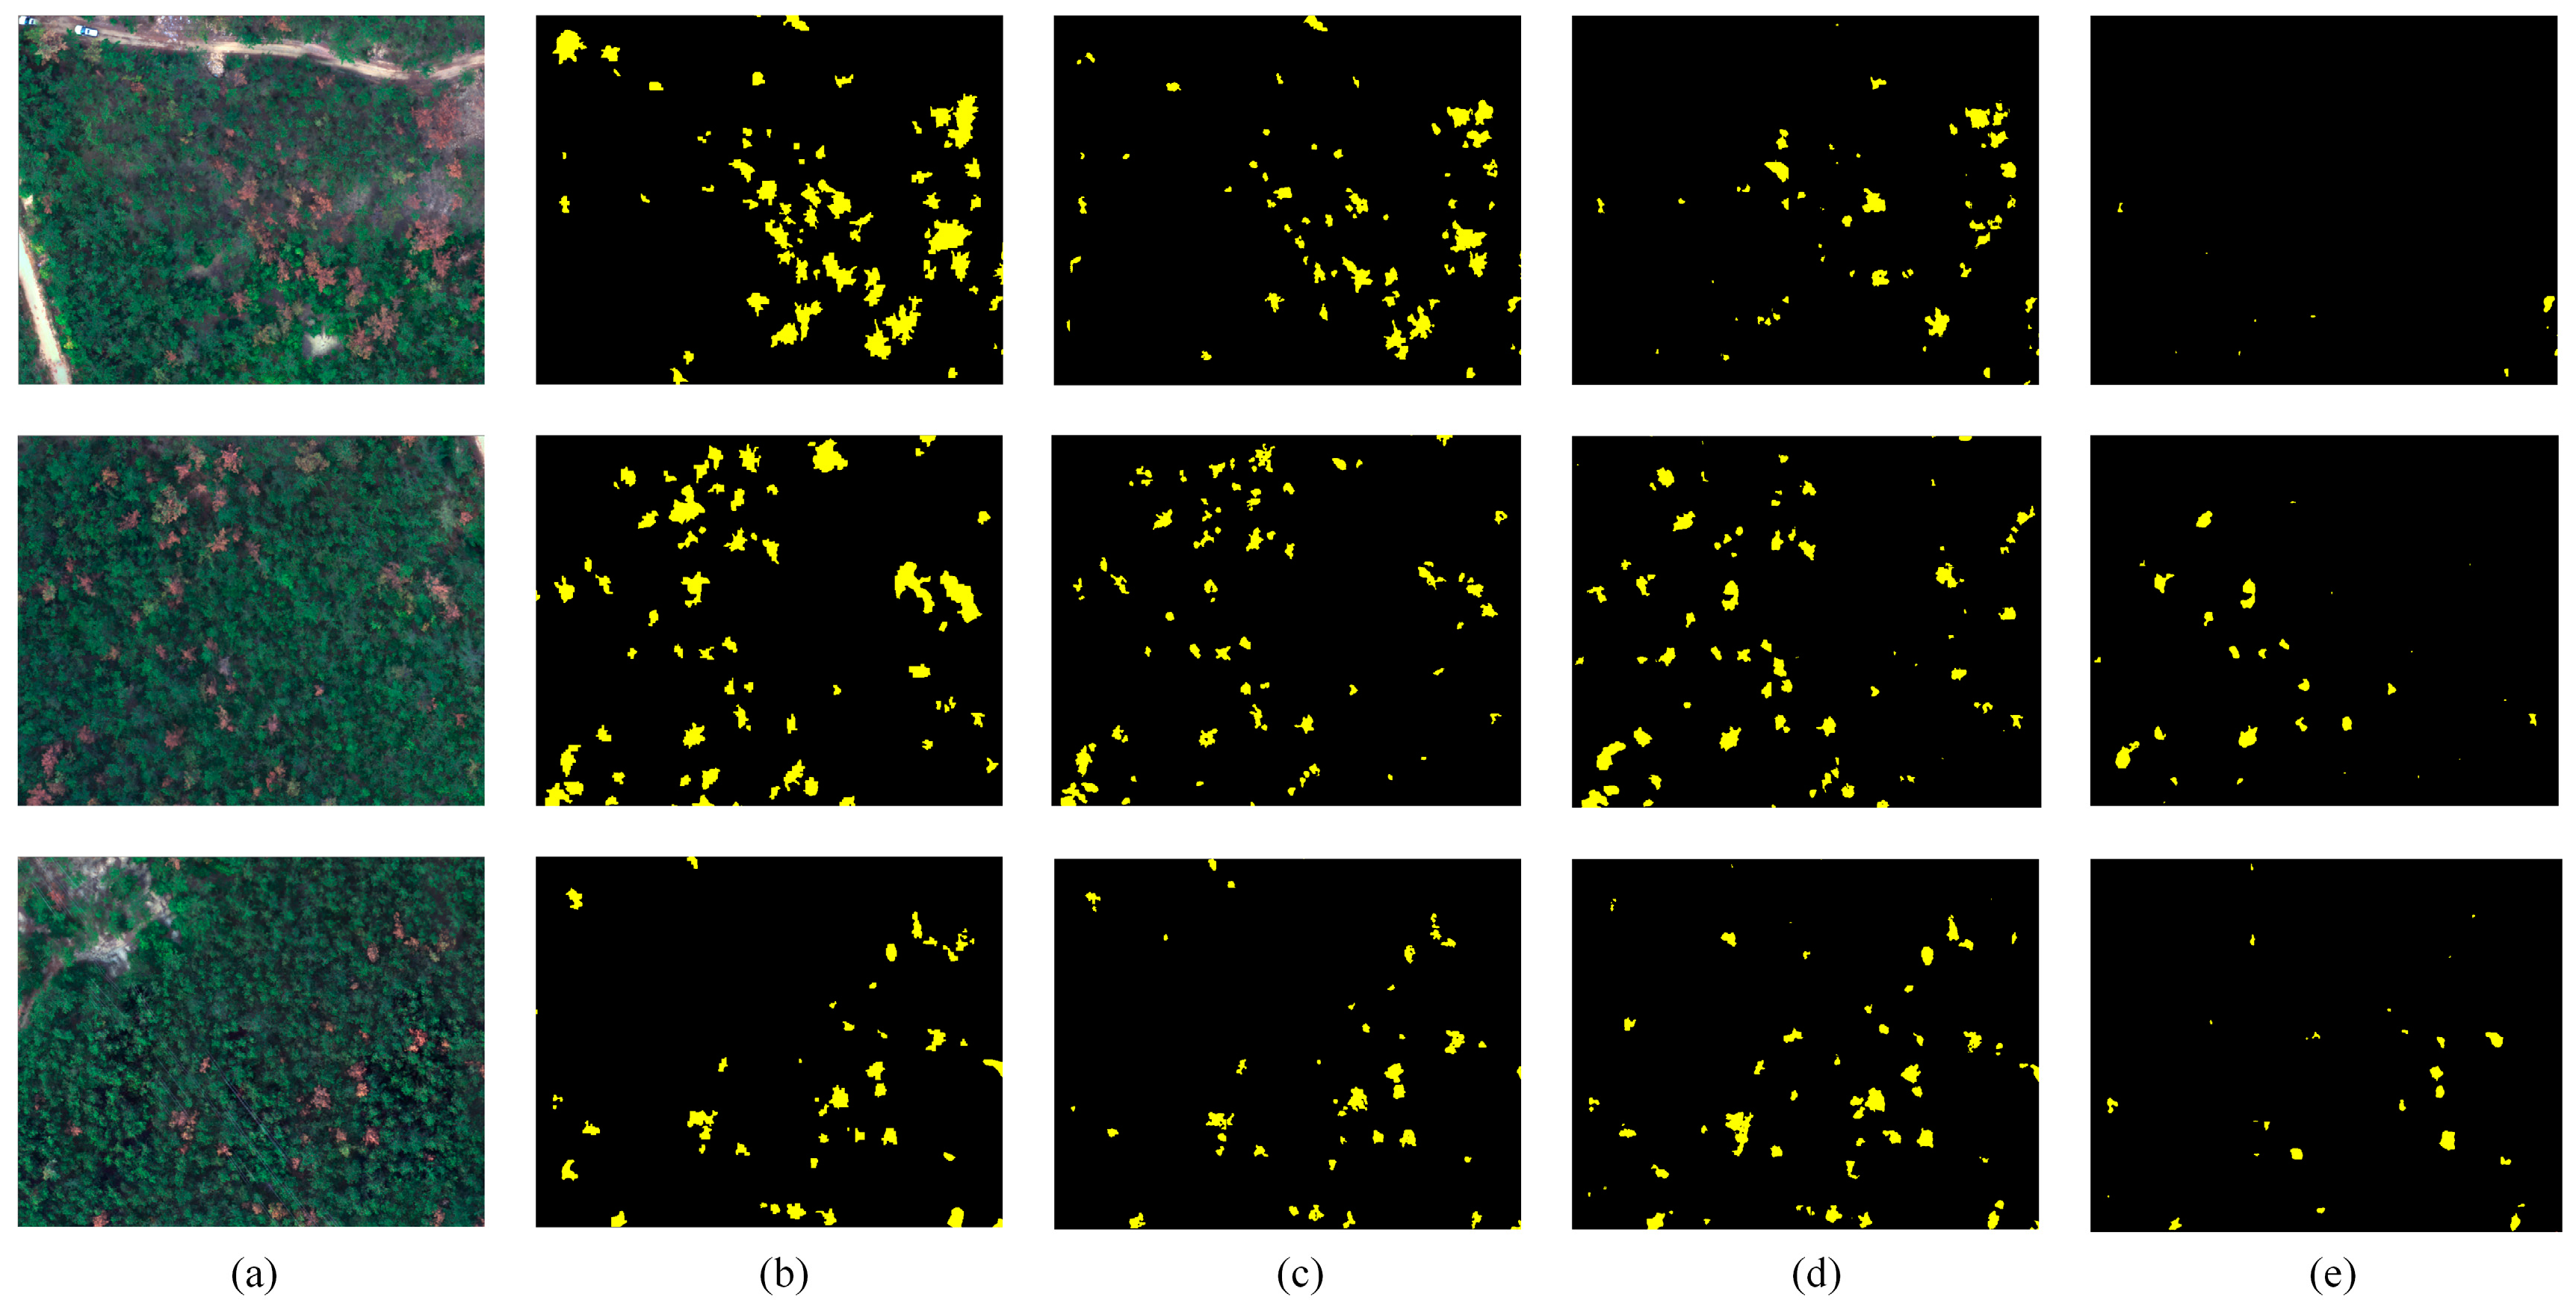
4.1. Identification of Pine Wood Nematode Disease

The test data of pine nematode disease were outlined by visual interpretation. In addition, 59 disease spots on Huangshan Mountain were verified as test data. The identification results of Huangshan-1, Wuhan, and Yantai are shown in Figure 6, Figure 7 and Figure 8, respectively. It can be seen in the figures that the method presented in this paper identify pine nematode disease in the test images with good accuracy. Accuracy values are shown in Table 2. The mean overall accuracy was 79.33%, the mean precision of all test images was 0.86, and the mean recall of all test images was 0.91. Meanwhile, the recall of the verified Huangshan-1 data is shown in Table 3. Among 59 known disease spots, 55 were identified by the proposed method. The recall was 0.93, and the missing alarm value was 0.07. The validity of the visual interpretation data is demonstrated through the verified data.

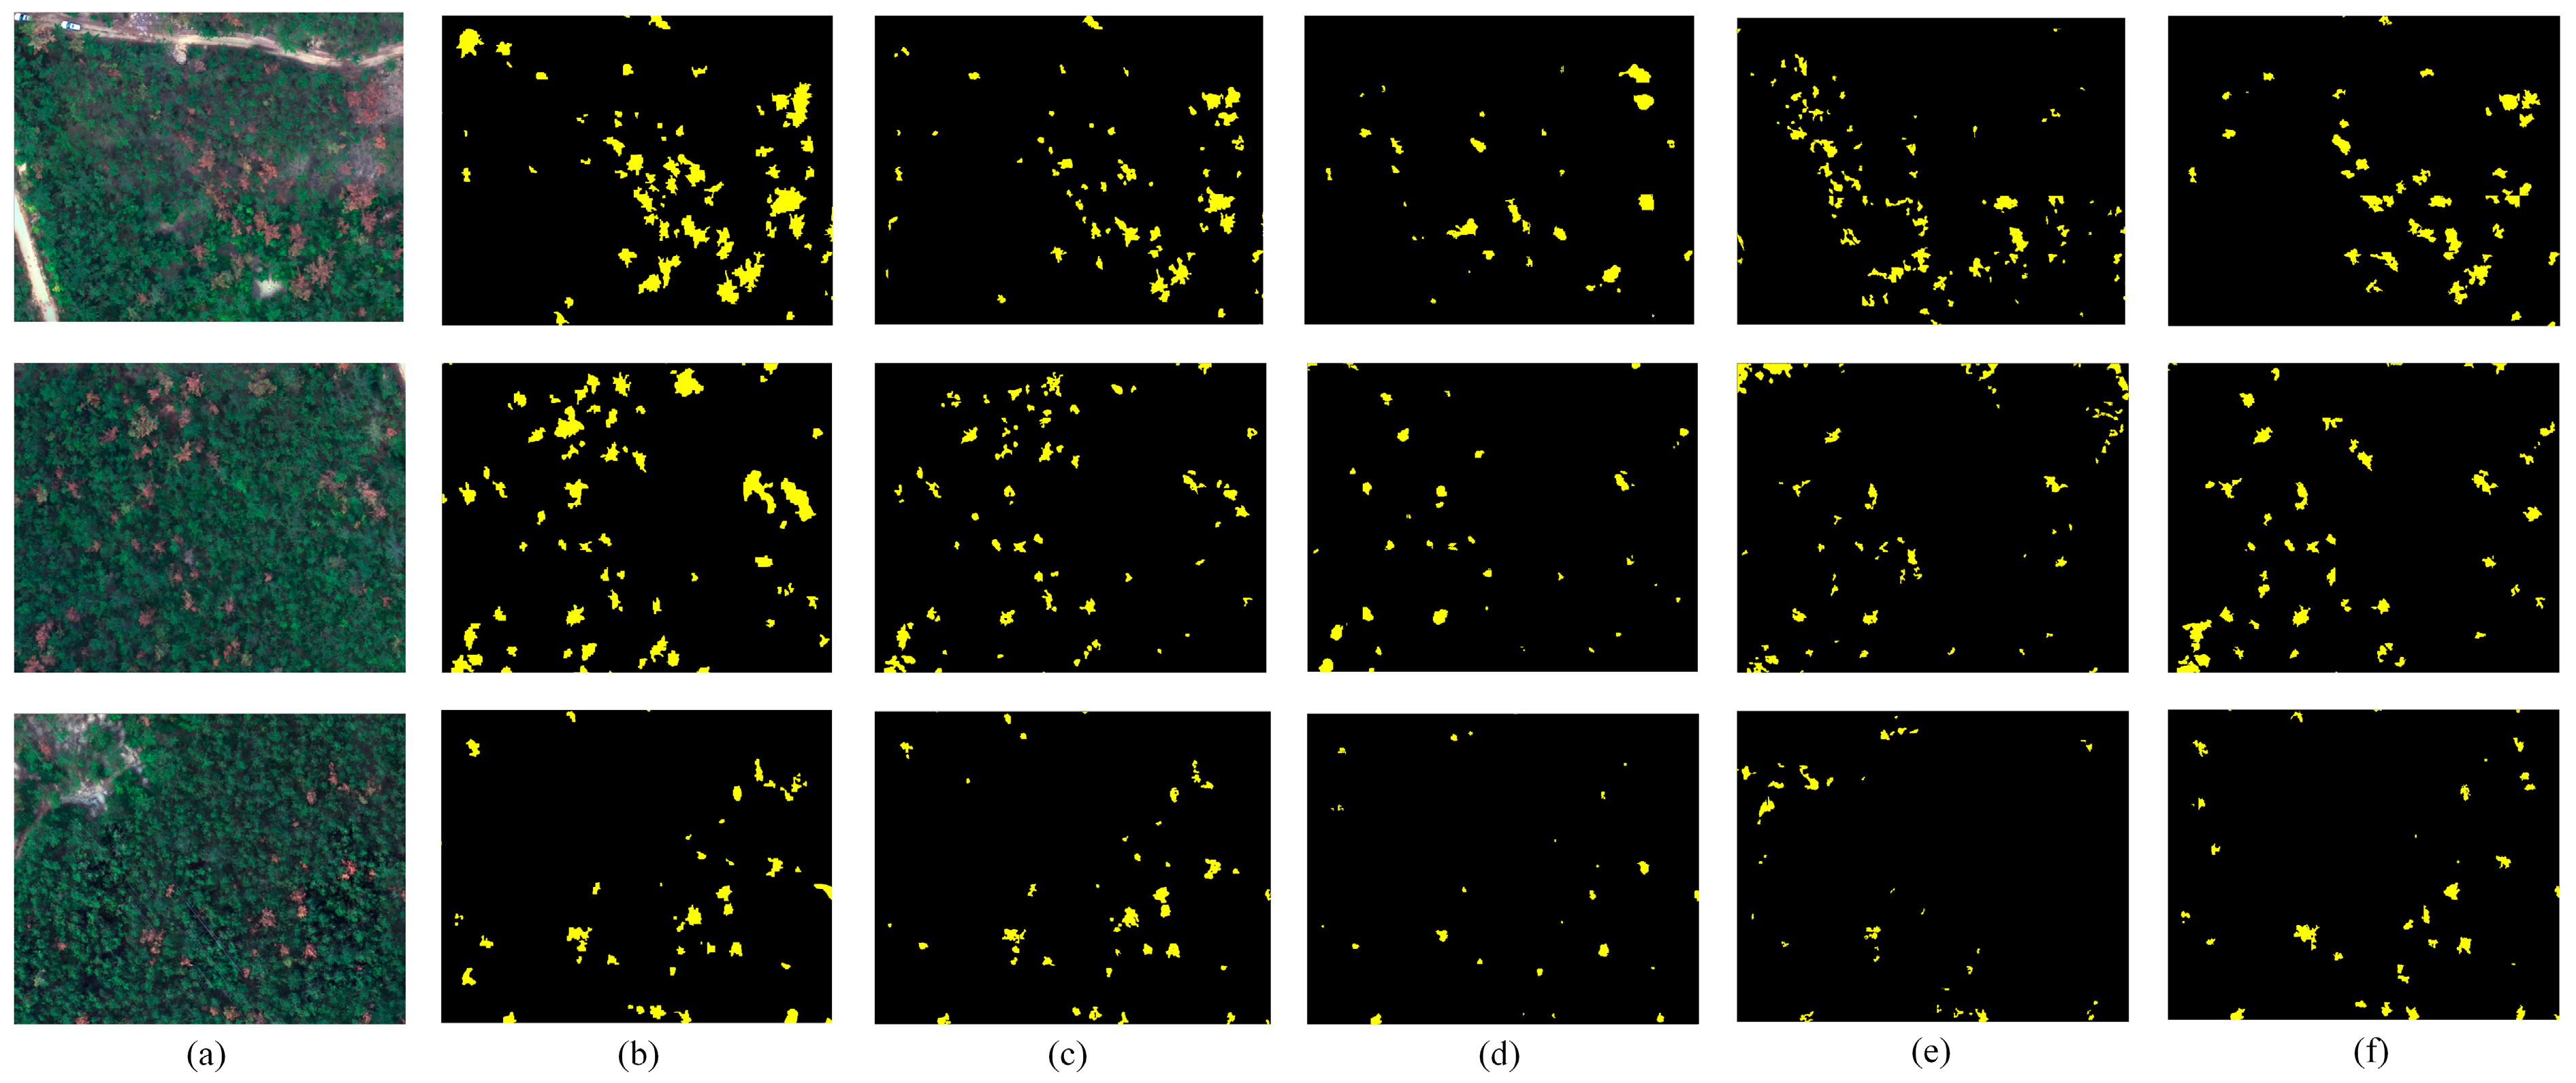
4.2. Comparisons with Related Networks

To verify the method advanced on pine wood nematode disease identification, deep learning methods (Deeplab V3+ [35], HRNet [39], and DenseNet [33]) were used. Deeplab V3+ uses atrous spatial pyramid pooling (ASPP) to expand the receptor field and to acquire features of different scales. DenseNet uses dense blocks to enhance feature utilization and to reduce information loss. HRNet connects different hierarchical network structures in parallel to maintain low-level and high-resolution features. Ablation experiments were also carried out. All methods were adopted in contrast to methods with the same postprocessing, including deep learning methods with the same data set and method under the training and testing environment.
The proposed method was compared with other deep learning methods on Huangshan-1, Wuhan, and Yantai in Figure 9, Figure 10 and Figure 11, respectively. Qualitative analysis of the identification results shows that SCANet was successful in most of the test images. Because the spatial information and receptive field cannot be taken into account, it is difficult to comprehensively consider low-level and high-level features. Therefore, DenseNet, DeepLab V3+, and HRNet show more omissions than SCANet and cause excessive segmentation. By reducing the loss of spatial information and by expanding the receptive field, the results show that pine wood nematode disease can be identified effectively and that misclassification can be reduced. In order to make a quantitative comparison between SCANet, DenseNet, DeepLab V3+, and HRNet, Table 4 lists the correct number, precision, overall accuracy, and recall of these networks. Compared with the visual interpretation results, except the overall accuracy of Huangshan-1 being lower than that of HRNet, our evaluation results are better than that of other deep learning methods, especially on Wuhan and Yantai. SCANet shows excellent performance in all images, but other methods on Wuhan and Yantai have many missing and incorrect marks. This may be caused by the different forest types in the regions, resulting in different feature information from the image and thus causing interference in other identification methods. In the construction of SCANet, a context information module and an attention mechanism were added to focus on important disease information. The background information was ignored, which enhanced the ability to extract the characteristics of pine nematode disease, and identification was improved. In general, although SCANet showed some local omissions, it is better than HRNet or DenseNet. However, SCANet’s overall performance is better than that of the other networks and still well identifies pine nematode disease.

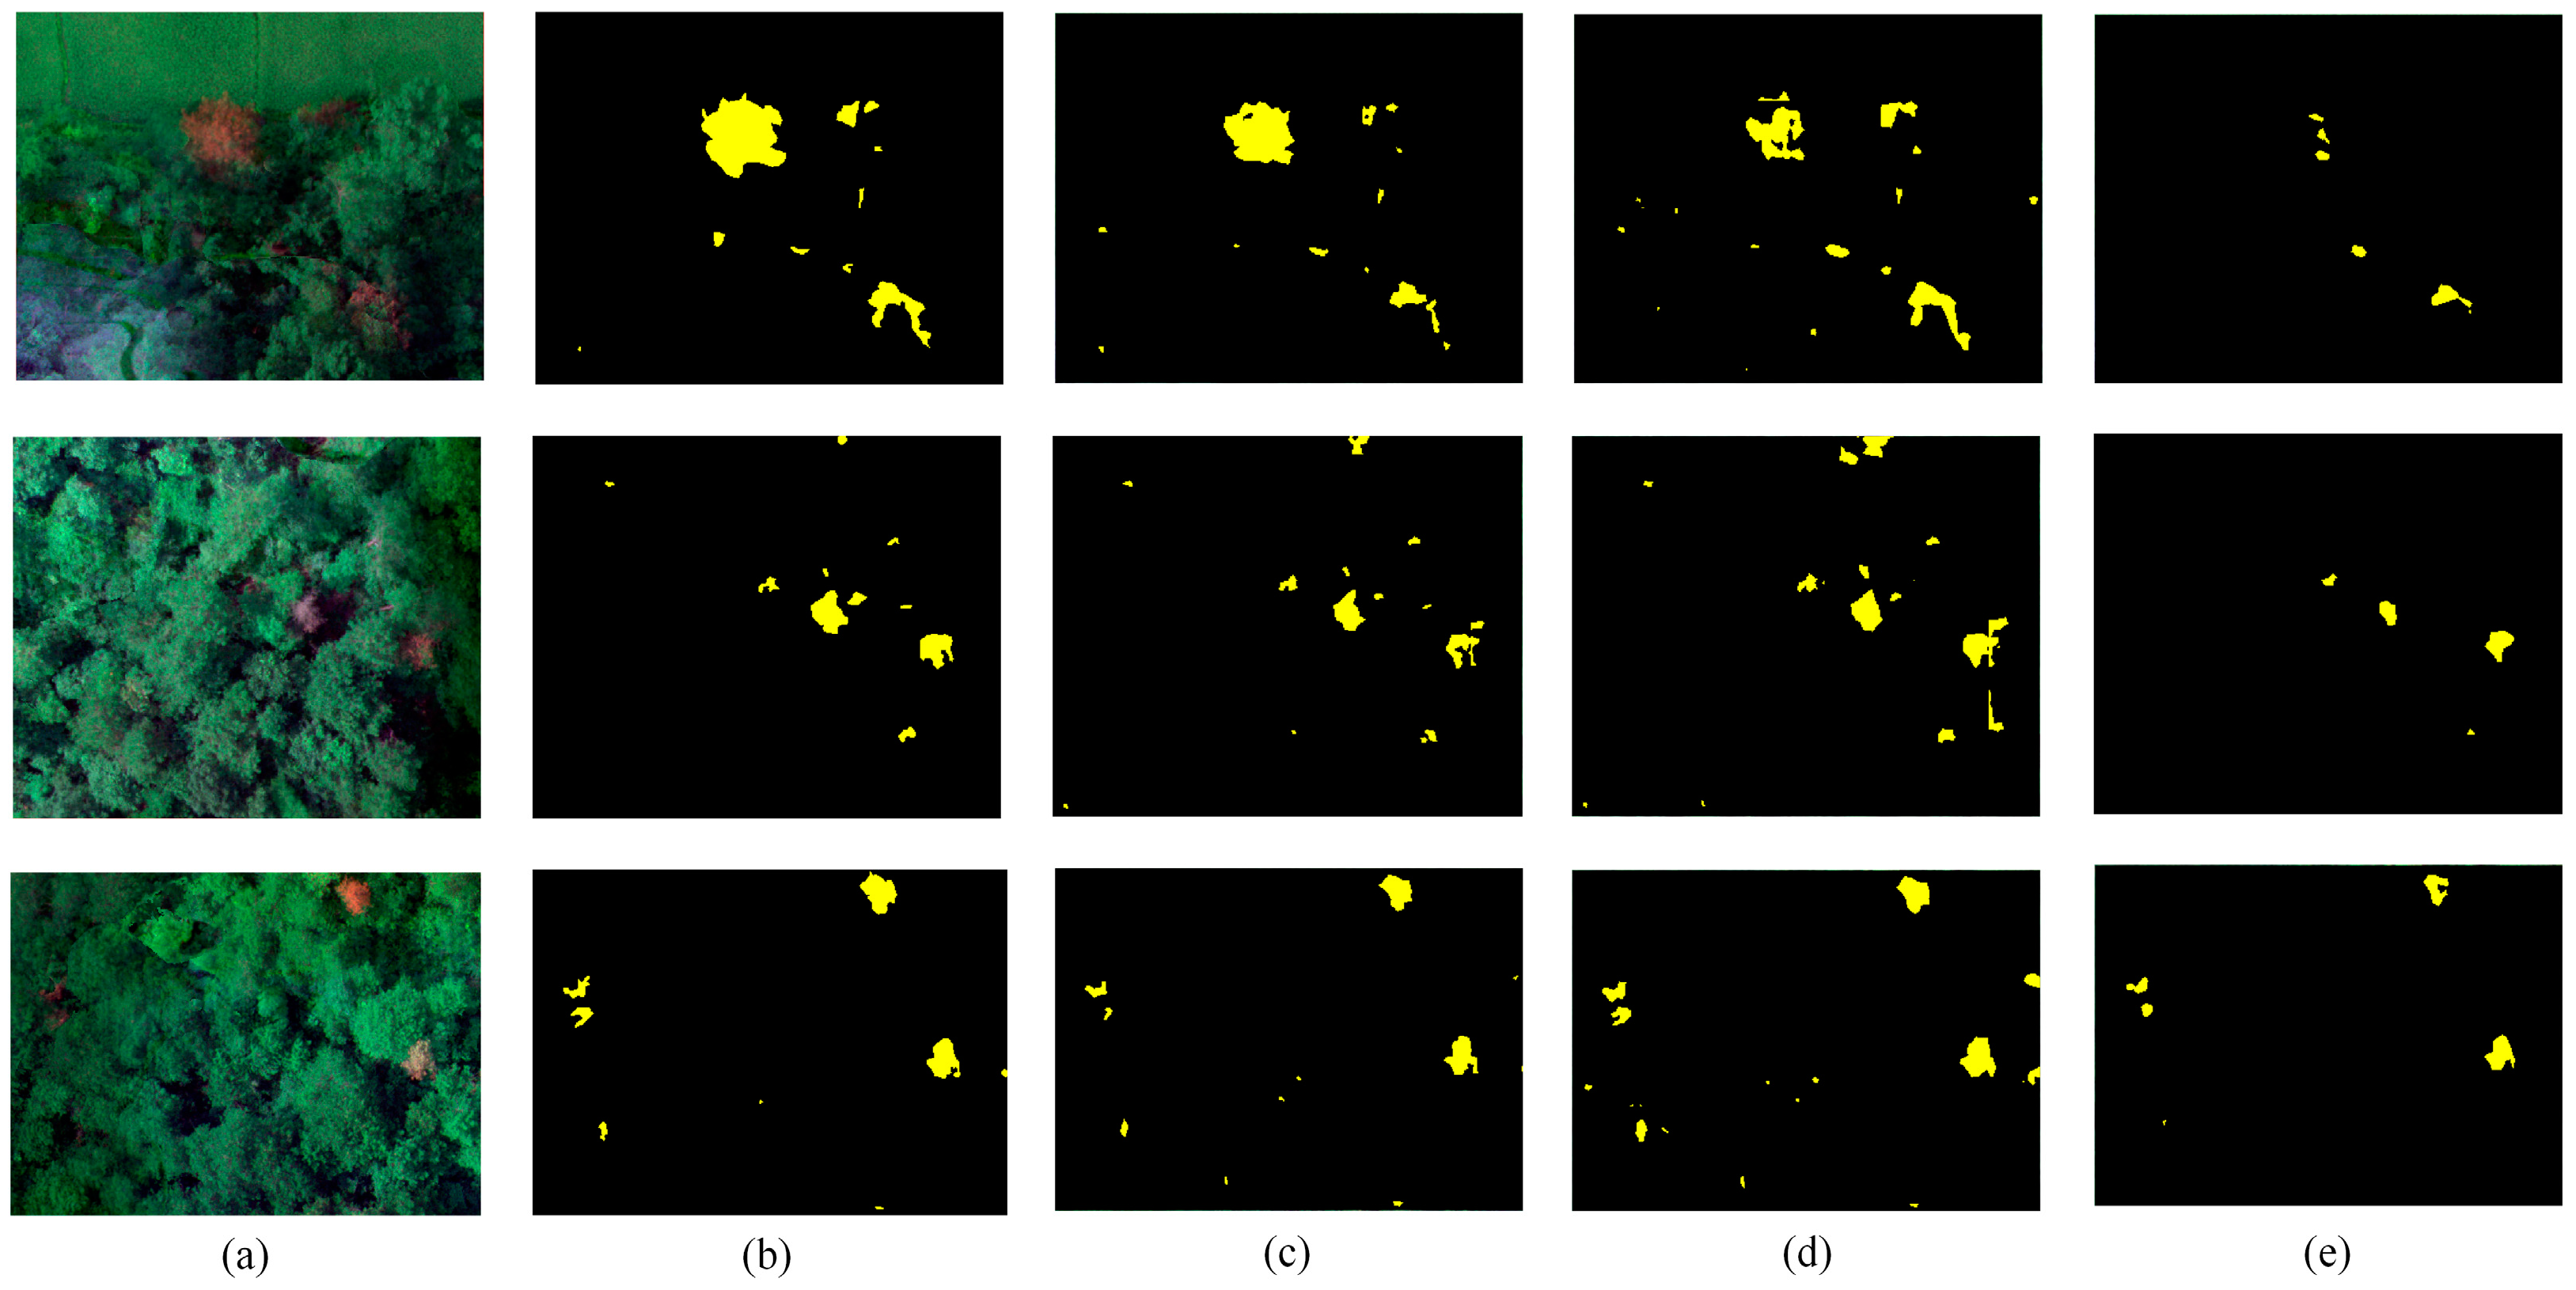
4.3. Comparison with Ablation Experiments

The results of these different approaches are shown in Table 5 and in Figure 12, Figure 13 and Figure 14. The context information module was removed in SNet, and the spatial information retention module was removed in CANet. CANet conducted rapid downsampling to increase the receptive field. Although the attention optimization module was used to enhance the disease characteristics, spatial information was seriously lost, which made it impossible to accurately identify pine nematode disease. Although SNet has only a few missed points, it could not highlight the disease features or suppress the interference of background features due to the absence of a context information module and an attention optimization module. As a result, serious misclassification occurs. By combining the two modules, this paper plays a role in feature selection and fusion, making the model retain abundant spatial information while enhancing the characteristics of target diseases, thus having the advantages of fewer misclassifications, fewer missing points, and higher recognition accuracy.

5. Conclusions

In this paper, based on remote sensing images from UAVs, a new SCANet structure was designed to automatically identify pine wood nematode disease. In order to reduce the loss of spatial information, we designed a spatial information retention module to obtain low-level features. We also designed a context information module to expand the receptive field and used an attention refinement module to highlight disease characteristics. SCANet was shown to inhibit background interference and to extract single plant disease information. The experimental results show that the method presented in this paper can well recognize infected pine trees. The mean overall accuracy was 79.33%, the mean precision was 0.86, and the mean recall rate was 0.91. SCANet, with its high-resolution UAV images, can conveniently and efficiently identify pine nematode disease and therefore has great potential in locating hitherto undiscovered pine nematode disease and in protecting pine forest resources. In the future, we will study other models in efforts to reduce the interference between other tree species and ground objects.

Author Contributions

J.Q. and B.W. designed the experiments; Y.W. contributed analysis tools; Q.L. and H.Z. made the sample database; J.Q. and Q.L. performed the experiments; J.Q. and B.W. wrote the paper. All authors have read and agreed to the published version of the manuscript.

Funding

This research was funded by the National Natural Science Foundation of China (grant numbers 41604028, 41901282, and 41971311), the National Natural Science Foundation of Anhui (grant number 20080885QD18), and the Department of Human Resources and Social Security of Anhui: Innovation Project Foundation for Selected Overseas Chinese Scholar.

Institutional Review Board Statement

Not applicable.

Informed Consent Statement

Not applicable.

Data Availability Statement

Data sharing is not applicable to this article.

Conflicts of Interest

The authors declare that there is no conflict of interest.

References

  1. Ye, J. Epidemic Status of Pine Wilt Disease in China and Its Prevention and Control Techniques and Counter Measures. Sci. Silvae Sin. 2019, 55. [Google Scholar] [CrossRef] [Green Version]
  2. Fuente, B.D.L.; Beck, P.S.A. Management measures to control pine wood nematode spread in Europe. J. Appl. Ecol. 2019, 56. [Google Scholar] [CrossRef]
  3. Brockhaus, J.A.; Khorram, S.; Bruck, R.I.; Campbell, M.V.; Stallings, C. A comparison of Landsat TM and SPOT HRV data for use in the development of forest defoliation models. Int. J. Remote Sens. 1992, 13, 3235–3240. [Google Scholar] [CrossRef]
  4. Nakane, K.; Kimura, Y. Assessment of pine forest damage by blight based on Landsat TM data and correlation with environmental factors. Ecol. Res. 1992, 7, 9–18. [Google Scholar] [CrossRef]
  5. Wu, H. A study of the potential of using worldview-2 of images for the detection of red attack pine tree. In Proceedings of the Eighth International Conference on Digital Image Processing. International Society for Optics and Photonics, Chengu, China, 29 August 2016. [Google Scholar]
  6. Du, H.; Ge, H.; Fan, W.; Jin, W.; Zhou, Y.; Li, J. Study on relationships between total chlorophyll with hyperspectral features for leaves of Pinus massoniana forest. Spectrosc. Spectr. Anal. 2009, 29, 3033–3037. [Google Scholar]
  7. Kong, Y.; Huang, Q.; Wang, C.; Chen, J.; Chen, J.; He, D. Long Short-Term Memory Neural Networks for Online Disturbance Detection in Satellite Image Time Series. Remote Sens. 2018, 10, 452. [Google Scholar] [CrossRef] [Green Version]
  8. Luo, Q.; Xin, W.; Qiming, X. Identification of pests and diseases of Dalbergia hainanensis based on EVI time series and classification of decision tree. Iop Conf. 2017, 69, 012162. [Google Scholar] [CrossRef]
  9. Shimu, S.A.; Aktar, M.; Afjal, M.I.; Nitu, A.M.; Uddin, M.P.; Mamun, M.A. NDVI Based Change Detection in Sundarban Mangrove Forest Using Remote Sensing Data. In Proceedings of the 2019 4th International Conference on Electrical Information and Communication Technology (EICT), Khulna, Bangladesh, 20–22 December 2019; pp. 1–5. [Google Scholar] [CrossRef]
  10. Murakami, T. Forest Remote Sensing Using UAVs. J. Remote Sens. Soc. Jpn. 2018, 38, 258–265. [Google Scholar]
  11. Mukhopadhyay, A.; Maulik, U. Unsupervised Pixel Classification in Satellite Imagery Using Multiobjective Fuzzy Clustering Combined with SVM Classifier. IEEE Trans. Geosci. Remote Sens. 2009, 47, 1132–1138. [Google Scholar] [CrossRef]
  12. Meigs, G.W.; Kennedy, R.E.; Cohen, W.B. A Landsat time series approach to characterize bark beetle and defoliator impacts on tree mortality and surface fuels in conifer forests. Remote Sens. Environ. 2011, 115, 3707–3718. [Google Scholar] [CrossRef]
  13. Kim, B.J.; Jo, M.H.; Oh, J.S.; Lee, K.J.; Park, S.J. Extraction method of damaged area by pine tree pest using remotely sensed data and GIS. In Proceedings of the 22nd Asian Conference on Remote Sensing, Singapore, 5–9 November 2001; Volume 10, pp. 123–134. [Google Scholar]
  14. Shi, Y.; Skidmore, A.K.; Wang, T.; Stefanie, H.; Uta, H.; Nicole, P.; Xi, Z. Tree species classification using plant functional traits from LiDAR and hyperspectral data. Int. J. Appl. Earth Obs. Geoinf. 2018, 73, 207–219. [Google Scholar] [CrossRef]
  15. Hellesen, T.; Matikainen, L. An Object-Based Approach for Mapping Shrub and Tree Cover on Grassland Habitats by Use of LiDAR and CIR Orthoimages. Remote Sens. 2013, 5, 558–583. [Google Scholar] [CrossRef] [Green Version]
  16. Takenaka, Y.; Katoh, M.; Deng, S.; Cheung, K. Detecting forests damaged by pine wilt disease at the individual tree level using airborne laser data and worldview-2/3 images over two seasons. In Proceedings of the ISPRS-International Archives of the Photogrammetry, Remote Sensing and Spatial Information Sciences, Jyväskylä, Finland, 25–27 October 2017; Volume XLII-3/W3, pp. 181–184. [Google Scholar]
  17. Iordache, M.D.; Mantas, V.; Baltazar, E.; Pauly, K.; Lewyckyj, N. A Machine Learning Approach to Detecting Pine Wilt Disease Using Airborne Spectral Imagery. Remote Sens. 2020, 12, 2280. [Google Scholar] [CrossRef]
  18. Deng, X.; Tong, Z.; Lan, Y.; Huang, Z. Detection and Location of Dead Trees with Pine Wilt Disease Based on Deep Learning and UAV Remote Sensing. AgriEngineering 2020, 2, 294–307. [Google Scholar] [CrossRef]
  19. Alex, K.; Ilya, S.; Geoffrey, E.H. ImageNet Classification with Deep Convolutional Neural Networks. Commun. ACM 2017, 84–90. [Google Scholar] [CrossRef]
  20. Shelhamer, E.; Long, J.; Darrell, T. Fully Convolutional Networks for Semantic Segmentation. IEEE Trans. Pattern Anal. Mach. Intell. 2017, 39, 640–651. [Google Scholar]
  21. Wu, P.; Yin, Z.; Yang, H.; Wu, Y.L.; Ma, X. Reconstructing Geostationary Satellite Land Surface Temperature Imagery Based on a Multiscale Feature Connected Convolutional Neural Network. Remote Sens. 2019, 11, 300. [Google Scholar] [CrossRef] [Green Version]
  22. Yao, X.D.; Yang, H.; Wu, Y.L.; Wu, P.H.; Wang, S. Land Use Classification of the Deep Convolutional Neural Network Method Reducing the Loss of Spatial Features. Sensors 2019, 19, 2792. [Google Scholar] [CrossRef] [Green Version]
  23. Yin, Z.; Wu, P.; Foody, G.M.; Wu, Y.L.; Ling, F. Spatiotemporal Fusion of Land Surface Temperature Based on a Convolutional Neural Network. IEEE Trans. Geoence Remote Sens. 2020, PP(99), 1–15. [Google Scholar] [CrossRef]
  24. Guo, Q.; Wang, H.; Kang, L.; Li, Z.; Xu, F. Aircraft Target Detection from Spaceborne SAR Image. In Proceedings of the IGARSS 2019—2019 IEEE International Geoscience and Remote Sensing Symposium, Yokohama, Japan, 28 July–2 August 2019. [Google Scholar]
  25. Tetila, E.C.; Machado, B.B.; Belete, N.A.S.; Guimaraes, D.A. Identification of Soybean Foliar Diseases Using Unmanned Aerial Vehicle Images. IEEE Geoence Remote Sens. Lett. 2017, 14, 2190–2194. [Google Scholar] [CrossRef]
  26. Hu, W.; Huang, Y.; Wei, L.; Zhang, F.; Li, H.C. Deep Convolutional Neural Networks for Hyperspectral Image Classification. J. Sens. 2015, 2015, 1–12. [Google Scholar] [CrossRef] [Green Version]
  27. Minh, D.L.; Syed, I.H.; Irfan, M.; Hyeonjoon, M. UAV based wilt detection system via convolutional neural networks. Sustain. Comput. Inform. Syst. 2020, 28. [Google Scholar] [CrossRef] [Green Version]
  28. Chen, L.-C.; Zhu, Y.; Papandreou, G.; Schroff, F.; Adam, H. Encoder-Decoder with Atrous Separable Convolution for Semantic Image Segmentation. arXiv 2018, arXiv:1802.02611. [Google Scholar]
  29. Sun, K.; Xiao, B.; Liu, D.; Wang, J. Deep High-Resolution Representation Learning for Human Pose Estimation. In Proceedings of the IEEE Conference on Computer Vision and Pattern Recognition, Long Beach, CA, USA, 15–21 June 2019; pp. 5693–5703. [Google Scholar]
  30. Yang, H.; Wu, P.; Yao, X.; Wu, Y.; Wang, B.; Xu, Y. Building Extraction in very High Resolution Remote Sensing Imagery by Dense-Attention Networks. Remote Sens. 2018, 10, 1768. [Google Scholar] [CrossRef] [Green Version]
  31. Liao, W.; Coillie, F.V.; Gao, L.; Li, L.; Chanussot, J. Deep Learning for Fusion of APEX Hyperspectral and Full-waveform LiDAR Remote Sensing Data for Tree Species Mapping. IEEE Access 2018, 6, 8716–68729. [Google Scholar]
  32. Zhou, X.; Wang, Y.; Zhu, Q.; Mao, J.; Xiao, C.; Lu, X.; Zhang, H. A Surface Defect Detection Framework for Glass Bottle Bottom Using Visual Attention Model and Wavelet Transform. IEEE Trans. Ind. Informatics 2019, 16, 2189–2201. [Google Scholar] [CrossRef]
  33. Huang, G.; Liu, Z.; Laurens, V.D.M.; Weinberger, K.Q. Densely Connected Convolutional Networks. In Proceedings of the IEEE Conference on Computer Vision and Pattern Recognition (CVPR), Honolulu, HI, USA, 21–26 July 2017. [Google Scholar] [CrossRef] [Green Version]
  34. Zhao, H.; Shi, J.; Qi, X.; Wang, X.; Jia, J. Pyramid scene parsing network. In Proceedings of the IEEE Conference on Computer Vision and Pattern Recognition, Honolulu, HI, USA, 21–26 July 2017. [Google Scholar] [CrossRef] [Green Version]
  35. Chen, L.C.; Papandreou, G.; Kokkinos, I.; Murphy, K.; Yuille, A.L. DeepLab: Semantic Image Segmentation with Deep Convolutional Nets, Atrous Convolution, and Fully Connected CRFs. IEEE Trans. Pattern Anal. Mach. Intell. 2016, 40, 834–848. [Google Scholar] [CrossRef]
  36. Chen, L.C.; Papandreou, G.; Schroff, F.; Adam, H. Rethinking Atrous Convolution for Semantic Image Segmentation. arXiv 2017, arXiv:1706.05587v2. [Google Scholar]
  37. Peng, C.; Zhang, X.; Yu, G.; Luo, G.; Sun, J. Large Kernel Matters—Improve Semantic Segmentation by Global Convolutional Network. In Proceedings of the 2017 IEEE Conference on Computer Vision and Pattern Recognition (CVPR), Honolulu, HI, USA, 21–26 July 2017; pp. 1743–1751. [Google Scholar] [CrossRef] [Green Version]
  38. He, Y.; Chen, G.; Potter, C.; Meentemeyer, R.K. Integrating multi-sensor remote sensing and species distribution modeling to map the spread of emerging forest disease and tree mortality. Remote. Sens. Environ. 2019, 231, 111238. [Google Scholar] [CrossRef]
  39. Wang, S.; Yang, H.; Wu, Q.; Zheng, Z.; Wu, Y.L.; Li, J. An Improved Method for Road Extraction from High-Resolution Remote-Sensing Images that Enhances Boundary Information. Sensors 2020, 20, 2064. [Google Scholar] [CrossRef] [Green Version]
Figure 1. SCANet network structure.
Remotesensing 13 00162 g001
Figure 2. Attention refinement module.
Remotesensing 13 00162 g002
Figure 3. The experimental data. (a) Huangshan-1. (b) Huangshan-2. (c) Yantai. (d) Wuhan.
Remotesensing 13 00162 g003
Figure 4. Unmanned aerial vehicle (UAV) and diffuse plate.
Remotesensing 13 00162 g004
Figure 5. Sample database. (a,c,e) Images. (b,d,f) Labels.
Remotesensing 13 00162 g005
Figure 6. Identification results of pine wood nematode disease on Huangshan-1. (a) Huangshan-1. (b) Ground Truth. (c) Result.
Remotesensing 13 00162 g006
Figure 7. Identification results of pine wood nematode disease on Wuhan. (a) Wuhan. (b) Ground Truth. (c) Result.
Remotesensing 13 00162 g007
Figure 8. Identification results of pine wood nematode disease on Yantai. (a) Yantai. (b) Ground Truth. (c) Result.
Remotesensing 13 00162 g008
Figure 9. Differences between deep learning methods on Huangshan-1 when identifying pine wood nematode disease. (a) Images. (b) Ground Truth. (c) SCANet. (d) HRNet. (e) DenseNet. (f) DeepLab V3+.
Remotesensing 13 00162 g009
Figure 10. Differences between deep learning methods on Wuhan when identifying pine wood nematode disease. (a) Images. (b) Ground Truth. (c) SCANet. (d) HRNet. (e) DenseNet. (f) DeepLab V3+.
Remotesensing 13 00162 g010
Figure 11. Differences between deep learning methods on Yantai when identifying pine wood nematode disease. (a) Images. (b) Ground Truth. (c) SCANet. (d) HRNet. (e) DenseNet. (f) DeepLab V3+.
Remotesensing 13 00162 g011
Figure 12. Differences between the ablation experimental method on Huangshan-1 when identifying pine wood nematode disease. (a) Images. (b) Ground Truth. (c) SCANet. (d) SNet. (e) CANet.
Remotesensing 13 00162 g012
Figure 13. Differences between the ablation experimental method on Wuhan when identifying pine wood nematode disease. (a) Images. (b) Ground Truth. (c) SCANet. (d) SNet. (e) CANet.
Remotesensing 13 00162 g013
Figure 14. Differences between the ablation experimental method on Yantai when identifying pine wood nematode disease. (a) Images. (b) Ground Truth. (c) SCANet. (d) SNet. (e) CANet.
Remotesensing 13 00162 g014
Table 1. Flight parameters.
ImagesHuangshan-1Huangshan-2WuhanYantai
LocateAnhui ProvinceAnhui ProvinceHubei ProvinceShandong Province
Flight height150 m150 m200 m160 m
Spatial resolution0.1 m0.1 m0.125 m0.1 m
Flight date2019-08-122019-08-132019-8-212019-10-16
Centre coordinatesE118°19′12″
N29°47′19″
E118°18′44″
N29°47′33″
E114°29′36″
N27°37′03″
E121°55′18″
N37°27′30″
Wavelength (nm)Blue: 475 nm
Green: 560 nm
Red: 670 nm
RedEdge: 720 nm
Near IR: 840 nm
Table 2. The accuracy of pine wood nematode disease identification using SCANet.
ImagesTotal Visual InterpretationTotal Number of IdentificationCorrect NumberOverall AccuracyPrecisionRecall
Huangshan-118620317480.93%0.850.94
Wuhan51552145377.70%0.870.88
Yantai1005109092779.37%0.850.92
Mean---79.33%0.860.91
Table 3. The identification accuracy of verified Huangshan-1 data.
ImagesTotal Number of CheckpointCorrect NumberRecallMissing Alarm
Huangshan-159550.930.07
Table 4. Results of different deep learning methods when identifying pine wood nematode disease.
ImagesModelsTotal Visual InterpretationNumber of IdentificationCorrect NumberAccuracyPrecisionRecall
Huangshan-1SCANet18620317480.93%0.860.94
Deeplab V3+18617314668.54%0.840.78
HRNet18617515272.73%0.870.82
DenseNet18618916074.42%0.850.86
WuhanSCANet51552145377.70%0.870.88
Deeplab V3+51580138541.53%0.480.75
HRNet51546032650.23%0.710.63
DenseNet51569140550.56%0.590.79
YantaiSCANet1005109092779.37%0.850.92
Deeplab V3+1005109878759.80%0.720.78
HRNet100590061747.80%0.690.61
DenseNet1005134066039.17%0.490.65
Table 5. Results of the ablation experimental when identifying pine wood nematode disease.
ImagesModelsTotal Visual InterpretationNumber of IdentificationCorrect NumberAccuracyPrecisionRecall
Huangshan-1SCANet18620317480.93%0.860.94
SNet18629716953.82%0.570.91
CANet1861266526.31%0.580.35
WuhanSCANet51552145377.70%0.870.88
SNet51571146260.47%0.650.90
CANet51536720530.28%0.560.40
YantaiSCANet1005109092779.37%0.850.92
SNet1005136890061.09%0.660.90
CANet100556532626.21%0.570.32
Publisher’s Note: MDPI stays neutral with regard to jurisdictional claims in published maps and institutional affiliations.

