Detecting Individual Tree Attributes and Multispectral Indices Using Unmanned Aerial Vehicles: Applications in a Pine Clonal Orchard


Abstract

1. Introduction
2. Materials and Methods
2.1. Study Area
2.2. Workflow
2.3. UAV Image Acquisition and Processing
2.4. Estimates of Tree-Level Attributes
2.5. Multispectral Image Analysis
3. Results
4. Discussion
5. Conclusions
Author Contributions
Funding
Acknowledgments
Conflicts of Interest
References
- Brockerhoff, E.G.; Barbaro, L.; Castagneyrol, B.; Forrester, D.I.; Gardiner, B.; González-Olabarria, J.R.; Lyver, P.O.B.; Meurisse, N.; Oxbrough, A.; Taki, H.; et al. Forest biodiversity, ecosystem functioning and the provision of ecosystem services. Biodivers. Conserv. 2017, 26, 3005–3035. [Google Scholar] [CrossRef]
- Holopainen, M.; Vastaranta, M.; Hyyppä, J. Outlook for the Next Generation’s Precision Forestry in Finland. Forests 2014, 5, 1682–1694. [Google Scholar] [CrossRef]
- Williams, A.P.; Allen, C.D.; Macalady, A.K.; Griffin, D.; Woodhouse, C.A.; Meko, D.M.; Swetnam, T.W.; Rauscher, S.A.; Seager, R.; Grissino-Mayer, H.D.; et al. Temperature as a potent driver of regional forest drought stress and tree mortality. Nat. Clim. Chang. 2013, 3, 292–297. [Google Scholar] [CrossRef]
- Fornal-Pieniak, B.; Ollik, M.; Schwerk, A. Impact of different levels of anthropogenic pressure on the plant species composition in woodland sites. Urban For. Urban Green. 2019, 38, 295–304. [Google Scholar] [CrossRef]
- Hedwall, P.-O.; Gustafsson, L.; Brunet, J.; Lindbladh, M.; Axelsson, A.-L.; Strengbom, J. Half a century of multiple anthropogenic stressors has altered northern forest understory plant communities. Ecol. Appl. 2019, 29, e01874. [Google Scholar] [CrossRef]
- Gallardo-Salazar, J.L.; Pompa-García, M.; Aguirre-Salado, C.A.; López-Serrano, P.M.; Meléndez-Soto, A. Drones: Tecnología con futuro promisorio en la gestión forestal. Rev. Mex. Cienc. For. 2020, 11. [Google Scholar] [CrossRef]
- Gollob, C.; Ritter, T.; Nothdurft, A. Forest Inventory with Long Range and High-Speed Personal Laser Scanning (PLS) and Simultaneous Localization and Mapping (SLAM) Technology. Remote Sens. 2020, 12, 1509. [Google Scholar] [CrossRef]
- Lefsky, M.A.; Cohen, W.B.; Parker, G.G.; Harding, D.J. Lidar Remote Sensing for Ecosystem Studies. BioScience 2002, 52, 19–30. [Google Scholar] [CrossRef]
- Puliti, S.; Breidenbach, J.; Astrup, R. Estimation of Forest Growing Stock Volume with UAV Laser Scanning Data: Can It Be Done without Field Data? Remote Sens. 2020, 12, 1245. [Google Scholar] [CrossRef]
- Bokalo, M.; Stadt, K.J.; Comeau, P.G.; Titus, S.J. The Validation of the Mixedwood Growth Model (MGM) for Use in Forest Management Decision Making. Forests 2013, 4, 1–27. [Google Scholar] [CrossRef]
- Li, Y.; Wang, W.; Zeng, W.; Wang, J.; Meng, J. Development of Crown Ratio and Height to Crown Base Models for Masson Pine in Southern China. Forests 2020, 11, 1216. [Google Scholar] [CrossRef]
- Corona, P.; Chianucci, F.; Quatrini, V.; Civitarese, V.; Clementel, F.; Costa, C.; Floris, A.; Menesatti, P.; Puletti, N.; Sperandio, G.; et al. Precision forestry: Riferimenti concettuali, strumenti e prospettive di diffusione in Italia. Forest@ Riv. Selvic. Ecol. For. 2017, 14, 1–12. [Google Scholar] [CrossRef]
- Modica, G.; Messina, G.; De Luca, G.; Fiozzo, V.; Praticò, S. Monitoring the vegetation vigor in heterogeneous citrus and olive orchards. A multiscale object-based approach to extract trees’ crowns from UAV multispectral imagery. Comput. Electron. Agric. 2020, 175, 105500. [Google Scholar] [CrossRef]
- Xue, J.; Su, B. Significant Remote Sensing Vegetation Indices: A Review of Developments and Applications. J. Sens. 2017, 2017, 1353691. [Google Scholar] [CrossRef]
- Motohka, T.; Nasahara, K.N.; Oguma, H.; Tsuchida, S. Applicability of Green-Red Vegetation Index for Remote Sensing of Vegetation Phenology. Remote Sens. 2010, 2, 2369–2387. [Google Scholar] [CrossRef]
- Bray, D.B.; Merino-Pérez, L.; Barry, D. The Community Forests of Mexico: Managing for Sustainable Landscapes; University of Texas Press: Austin, TX, USA, 2005. [Google Scholar]
- Alvarado-Barrera, R.; Pompa-García, M.; Zúñiga-Vásquez, J.M.; Jiménez-Casas, M. Spatial analysis of phenotypic variables in a clonal orchard of Pinus arizonica Engelm. in northern Mexico. Rev. Chapingo Ser. Cienc. For. Ambiente 2019, 25, 185–199. [Google Scholar] [CrossRef]
- Farjon, A. A Handbook of the World's Conifers; Brill: Leiden, The Netherlands, 2010; Volume 1, p. 1111. [Google Scholar]
- Dempewolf, J.; Nagol, J.; Hein, S.; Thiel, C.; Zimmermann, R. Measurement of Within-Season Tree Height Growth in a Mixed Forest Stand Using UAV Imagery. Forests 2017, 8, 231. [Google Scholar] [CrossRef]
- Mazzetto, F.; Calcante, A.; Mena, A.; Vercesi, A. Integration of optical and analogue sensors for monitoring canopy health and vigour in precision viticulture. Precis. Agric. 2010, 11, 636–649. [Google Scholar] [CrossRef]
- Caruso, G.; Tozzini, L.; Rallo, G.; Primicerio, J.; Moriondo, M.; Palai, G.; Gucci, R. Estimating biophysical and geometrical parameters of grapevine canopies (‘Sangiovese’) by an unmanned aerial vehicle (UAV) and VIS-NIR cameras. Vitis 2017, 56, 63–70. [Google Scholar] [CrossRef]
- Uribeetxebarria, A.; Daniele, E.; Escolà, A.; Arnó, J.; Martínez-Casasnovas, J.A. Spatial variability in orchards after land transformation: Consequences for precision agriculture practices. Sci. Total Environ. 2018, 635, 343–352. [Google Scholar] [CrossRef]
- Arnó-Satorra, J.; Martínez-Casasnovas, J.A.; Ribes Dasi, M.; Rosell Polo, J.R. Review. Precision Viticulture. Research topics, challenges and opportunities in site-specific vineyard management. Span. J. Agric. Res. 2009, 7. [Google Scholar] [CrossRef]
- Ballesteros, R.; Ortega, J.F.; Hernandez, D.; Moreno, M.A. Onion biomass monitoring using UAV-based RGB imaging. Precis. Agric. 2018, 19, 840–857. [Google Scholar] [CrossRef]
- Tu, Y.-H.; Johansen, K.; Phinn, S.; Robson, A. Measuring Canopy Structure and Condition Using Multi-Spectral UAS Imagery in a Horticultural Environment. Remote Sens. 2019, 11, 269. [Google Scholar] [CrossRef]
- Jorge, J.; Vallbé, M.; Soler, J.A. Detection of irrigation inhomogeneities in an olive grove using the NDRE vegetation index obtained from UAV images. Eur. J. Remote Sens. 2019, 52, 169–177. [Google Scholar] [CrossRef]
- Jiménez-Brenes, F.M.; López-Granados, F.; de Castro, A.I.; Torres-Sánchez, J.; Serrano, N.; Peña, J.M. Quantifying pruning impacts on olive tree architecture and annual canopy growth by using UAV-based 3D modelling. Plant Methods 2017, 13, 55. [Google Scholar] [CrossRef] [PubMed]
- Salamí, E.; Gallardo, A.; Skorobogatov, G.; Barrado, C. On-the-Fly Olive Tree Counting Using a UAS and Cloud Services. Remote Sens. 2019, 11, 316. [Google Scholar] [CrossRef]
- Leduc, M.-B.; Knudby, A.J. Mapping Wild Leek through the Forest Canopy Using a UAV. Remote Sens. 2018, 10, 70. [Google Scholar] [CrossRef]
- Jun, W.; Zhongkui, D.; Guoqing, Z. Geo-registration and mosaic of UAV video for quick-response to forest fire disaster. In Proceedings of the MIPPR 2007: Pattern Recognition and Computer Vision, Wuhan, China, 15 November 2007; Volume 678810. [Google Scholar]
- Suziedelyte Visockiene, J.; Brucas, D.; Ragauskas, U. Comparison of UAV images processing softwares. J. Meas. Eng. 2014, 2, 111–121. [Google Scholar]
- Mesas-Carrascosa, F.-J.; Notario García, M.D.; Meroño de Larriva, J.E.; García-Ferrer, A. An Analysis of the Influence of Flight Parameters in the Generation of Unmanned Aerial Vehicle (UAV) Orthomosaicks to Survey Archaeological Areas. Sensors 2016, 16, 1838. [Google Scholar] [CrossRef]
- Liba, N.; Berg-Jürgens, J. Accuracy of Orthomosaic Generated by Different Methods in Example of UAV Platform MUST Q. IOP Conf. Ser. Mater. Sci. Eng. 2015, 96, 012041. [Google Scholar] [CrossRef]
- Agüera-Vega, F.; Carvajal-Ramírez, F.; Martínez-Carricondo, P. Accuracy of Digital Surface Models and Orthophotos Derived from Unmanned Aerial Vehicle Photogrammetry. J. Surv. Eng. 2017, 143, 04016025. [Google Scholar] [CrossRef]
- Giannetti, F.; Puletti, N.; Puliti, S.; Travaglini, D.; Chirici, G. Assessment of UAV photogrammetric DTM-independent variables for modelling and mapping forest structural indices in mixed temperate forests. Ecol. Indic. 2020, 117, 106513. [Google Scholar] [CrossRef]
- González-Elizondo, M.S.; González-Elizondo, M.; Tena-Flores, J.A.; Ruacho-González, L.; López-Enríquez, I.L. Vegetación de la Sierra Madre Occidental, México: Una síntesis. Acta Bot. Mex. 2012, 100, 351–403. [Google Scholar] [CrossRef]
- González-Cásares, M.; Pompa-García, M.; Camarero, J.J. Differences in climate–growth relationship indicate diverse drought tolerances among five pine species coexisting in Northwestern Mexico. Trees 2017, 31, 531–544. [Google Scholar] [CrossRef]
- P4 Multispectral. Available online: www.dji.com/mx/p4-multispectral (accessed on 3 September 2020).
- Lu, H.; Fan, T.; Ghimire, P.; Deng, L. Experimental Evaluation and Consistency Comparison of UAV Multispectral Minisensors. Remote Sens. 2020, 12, 2542. [Google Scholar] [CrossRef]
- DJI Ground Station Pro. Available online: www.dji.com/mx/ground-station-pro (accessed on 3 September 2020).
- Syetiawan, A.; Gularso, H.; Kusnadi, G.I.; Pramudita, G.N. Precise topographic mapping using direct georeferencing in UAV. IOP Conf. Ser. Earth Environ. Sci. 2020, 500, 012029. [Google Scholar] [CrossRef]
- P4 Multispectral Specs. Available online: https://www.dji.com/p4-multispectral/specs (accessed on 23 November 2020).
- OpenDroneMap. Available online: www.opendronemap.org (accessed on 10 September 2020).
- Groos, A.R.; Bertschinger, T.J.; Kummer, C.M.; Erlwein, S.; Munz, L.; Philipp, A. The Potential of Low-Cost UAVs and Open-Source Photogrammetry Software for High-Resolution Monitoring of Alpine Glaciers: A Case Study from the Kanderfirn (Swiss Alps). Geosciences 2019, 9, 356. [Google Scholar] [CrossRef]
- Burdziakowski, P. Evaluation of Open Drone Map Toolkit for Geodetic Grade Aerial Drone Mapping—Case Study. Int. Multidiscip. Sci. Geoconference 2017, 17, 101–109. [Google Scholar] [CrossRef]
- Lee, S.; Yu, B.-H. Automatic detection of dead tree from UAV imagery. In Proceedings of the 39th Asian Conference on Remote Sensing, Kuala Lumpur, Malaysia, 15–19 October 2018. [Google Scholar]
- QGIS. A Free and Open Source Geographic Information System. Available online: www.qgis.org (accessed on 10 September 2020).
- Iizuka, K.; Yonehara, T.; Itoh, M.; Kosugi, Y. Estimating Tree Height and Diameter at Breast Height (DBH) from Digital Surface Models and Orthophotos Obtained with an Unmanned Aerial System for a Japanese Cypress (Chamaecyparis obtusa) Forest. Remote Sens. 2018, 10, 13. [Google Scholar] [CrossRef]
- Ke, Y.; Quackenbush, L.J. A review of methods for automatic individual tree-crown detection and delineation from passive remote sensing. Int. J. Remote Sens. 2011, 32, 4725–4747. [Google Scholar] [CrossRef]
- Larsen, M.; Eriksson, M.; Descombes, X.; Perrin, G.; Brandtberg, T.; Gougeon, F.A. Comparison of six individual tree crown detection algorithms evaluated under varying forest conditions. Int. J. Remote Sens. 2011, 32, 5827–5852. [Google Scholar] [CrossRef]
- ForestTools: Analyzing Remotely Sensed Forest Data. Available online: https://CRAN.R-project.org/package=ForestTools (accessed on 15 September 2020).
- The R Project for Statistical Computing. Available online: www.r-project.org/ (accessed on 15 September 2020).
- Abdalla, A.; Elmahal, A. Augmentation of vertical accuracy of digital elevation models using Gaussian linear convolution filter. In Proceedings of the 2016 Conference of Basic Sciences and Engineering Studies SGCAC, Khartoum, Sudan, 20–23 February 2016; pp. 206–210. [Google Scholar]
- The Whitebox Geospatial Analysis Tools Project and Open-Access GIS. Available online: https://jblindsay.github.io/ghrg/WhiteboxTools/index.html (accessed on 9 November 2020).
- Popescu, S.C.; Wynne, R.H. Seeing the Trees in the Forest: Using Lidar and Multispectral Data Fusion with Local Filtering and Variable Window Size for Estimating Tree Height. Photogramm. Eng. Remote Sens. 2004, 70, 589–604. [Google Scholar] [CrossRef]
- Beucher, S.; Meyer, F. The Morphological Approach to Segmentation: The Watershed Transformation. In Mathematical Morphology in Image Processing; Dougherty, E.R., Ed.; CRC Press: Boca Raton, FL, USA, 1993; Volume 34, pp. 433–481. [Google Scholar]
- Gujarati, D.N. Basic Econometrics; The McGraw-Hill Education: New York, NY, USA, 2004. [Google Scholar]
- Wang, Y.; Lehtomäki, M.; Liang, X.; Pyörälä, J.; Kukko, A.; Jaakkola, A.; Liu, J.; Feng, Z.; Chen, R.; Hyyppä, J. Is field-measured tree height as reliable as believed—A comparison study of tree height estimates from field measurement, airborne laser scanning and terrestrial laser scanning in a boreal forest. ISPRS J. Photogramm. Remote Sens. 2019, 147, 132–145. [Google Scholar] [CrossRef]
- DJI TERRA Index Descriptions. Available online: https://www.dji.com/dji-terra (accessed on 25 November 2020).
- He, J.; Li, Y.; Zhang, K. Research of UAV Flight Planning Parameters. Positioning 2012, 3, 43–45. [Google Scholar] [CrossRef]
- Gougeon, F.; Leckie, D. The Individual Tree Crown Approach Applied to Ikonos Images of a Coniferous Plantation Area. Photogramm. Eng. Remote Sens. 2006, 72, 1287–1297. [Google Scholar] [CrossRef]
- Iglhaut, J.; Cabo, C.; Puliti, S.; Piermattei, L.; O’Connor, J.; Rosette, J. Structure from Motion Photogrammetry in Forestry: A Review. Curr. For. Rep. 2019, 5, 155–168. [Google Scholar] [CrossRef]
- Krause, S.; Sanders, T.G.M.; Mund, J.-P.; Greve, K. UAV-Based Photogrammetric Tree Height Measurement for Intensive Forest Monitoring. Remote Sens. 2019, 11, 758. [Google Scholar] [CrossRef]
- SEMARNAT-NOM-152. Available online: http://www.diariooficial.gob.mx/nota_detalle.php?codigo=5064731&fecha=17/10/2008 (accessed on 20 September 2020).
- Wu, D.; Johansen, K.; Phinn, S.; Robson, A.; Tu, Y.-H. Inter-comparison of remote sensing platforms for height estimation of mango and avocado tree crowns. Int. J. Appl. Earth Obs. Geoinf. 2020, 89, 102091. [Google Scholar] [CrossRef]
- Roşca, S.; Suomalainen, J.; Bartholomeus, H.; Herold, M. Comparing terrestrial laser scanning and unmanned aerial vehicle structure from motion to assess top of canopy structure in tropical forests. Interface Focus 2018, 8, 20170038. [Google Scholar] [CrossRef]
- Falkowski, M.J.; Smith, A.M.S.; Hudak, A.T.; Gessler, P.E.; Vierling, L.A.; Crookston, N.L. Automated estimation of individual conifer tree height and crown diameter via two-dimensional spatial wavelet analysis of lidar data. Can. J. Remote Sens. 2006, 32, 153–161. [Google Scholar] [CrossRef]
- Johansen, K.; Raharjo, T.; McCabe, M.F. Using Multi-Spectral UAV Imagery to Extract Tree Crop Structural Properties and Assess Pruning Effects. Remote Sens. 2018, 10, 854. [Google Scholar] [CrossRef]
- Ritter, T.; Nothdurft, A. Automatic Assessment of Crown Projection Area on Single Trees and Stand-Level, Based on Three-Dimensional Point Clouds Derived from Terrestrial Laser-Scanning. Forests 2018, 9, 237. [Google Scholar] [CrossRef]
- Grulke, N.; Bienz, C.; Hrinkevich, K.; Maxfield, J.; Uyeda, K. Quantitative and qualitative approaches to assess tree vigor and stand health in dry pine forests. For. Ecol. Manag. 2020, 465, 118085. [Google Scholar] [CrossRef]
- Zhao, H.; Yang, C.; Guo, W.; Zhang, L.; Zhang, D. Automatic Estimation of Crop Disease Severity Levels Based on Vegetation Index Normalization. Remote Sens. 2020, 12, 1930. [Google Scholar] [CrossRef]
- Brovkina, O.; Cienciala, E.; Surový, P.; Janata, P. Unmanned aerial vehicles (UAV) for assessment of qualitative classification of Norway spruce in temperate forest stands. Geo-Spatial Inf. Sci. 2018, 21, 12–20. [Google Scholar] [CrossRef]
- Wahab, I.; Hall, O.; Jirström, M. Remote Sensing of Yields: Application of UAV Imagery-Derived NDVI for Estimating Maize Vigor and Yields in Complex Farming Systems in Sub-Saharan Africa. Drones 2018, 2, 28. [Google Scholar] [CrossRef]
- Bausch, W.C.; Halvorson, A.D.; Cipra, J. Quickbird satellite and ground-based multispectral data correlations with agronomic parameters of irrigated maize grown in small plots. Biosyst. Eng. 2008, 101, 306–315. [Google Scholar] [CrossRef]
- Ren, H.; Zhou, G. Determination of green aboveground biomass in desert steppe using litter-soil-adjusted vegetation index. Eur. J. Remote Sens. 2014, 47, 611–625. [Google Scholar] [CrossRef]
- Minařík, R.; Langhammer, J. Use of a multispectral UAV photogrammetry for detection and tracking of forest disturbance dynamics. Int. Arch. Photogramm. Remote Sens. Spatial Inf. Sci. 2016, XLI-B8, 711–718. [Google Scholar] [CrossRef]
- Xing, N.; Huang, W.; Xie, Q.; Shi, Y.; Ye, H.; Dong, Y.; Wu, M.; Sun, G.; Jiao, Q. A Transformed Triangular Vegetation Index for Estimating Winter Wheat Leaf Area Index. Remote Sens. 2020, 12, 16. [Google Scholar] [CrossRef]
- Garrity, S.R.; Vierling, L.A.; Smith, A.M.S.; Falkowski, M.J.; Hann, D.B. Automatic detection of shrub location, crown area, and cover using spatial wavelet analysis and aerial photography. Can. J. Remote Sens. 2014, 34, S376–S384. [Google Scholar] [CrossRef]
- Jing, L.; Hu, B.; Noland, T.; Li, J. An individual tree crown delineation method based on multi-scale segmentation of imagery. ISPRS J. Photogramm. Remote Sens. 2012, 70, 88–98. [Google Scholar] [CrossRef]


| Band | Central Wavelength (nm) | Wavelength Width (nm) |
|---|---|---|
| Blue | 450 | 32 |
| Green | 560 | 32 |
| Red | 650 | 32 |
| Red-edge | 730 | 32 |
| Near-infrared | 840 | 52 |
| Descriptive Measurement | BD (cm) | DBH (cm) | H (m) | CD (m) | CA (m2) |
|---|---|---|---|---|---|
| Minimum | 7.64 | 2.22 | 1.15 | 0.76 | 0.45 |
| First quarter | 16.55 | 13.21 | 4.60 | 3.37 | 8.94 |
| Average | 21.22 | 16.25 | 5.63 | 4.72 | 19.26 |
| Median | 20.69 | 15.59 | 5.70 | 4.63 | 17.53 |
| Third quarter | 26.10 | 19.99 | 6.70 | 6.00 | 28.27 |
| Maximum | 36.76 | 38.19 | 10.20 | 8.65 | 58.76 |
| Height (m) | Crown Area (m2) | Crown Diameter (m) | ||||
|---|---|---|---|---|---|---|
| c | e | c | e | c | e | |
| Minimum | 2.05 | 1.05 | 1.59 | 0.06 | 1.42 | 0.27 |
| First quarter | 4.79 | 3.12 | 9.59 | 3.80 | 3.49 | 2.20 |
| Average | 5.76 | 3.98 | 19.93 | 12.35 | 4.75 | 3.54 |
| Median | 5.77 | 3.93 | 18.28 | 10.16 | 4.82 | 3.59 |
| Third quarter | 6.78 | 4.76 | 28.57 | 18.81 | 6.03 | 4.89 |
| Maximum | 10.20 | 7.25 | 58.76 | 46.60 | 8.65 | 7.70 |
| RMSE | 0.36 | 3.88 | 0.47 | |||
| Bias | −5.46 × 10⁻⁵ | 2.17 × 10⁻⁴ | −3.57 × 10⁻⁵ | |||
| r (p < 0.001) | 0.97 | 0.95 | 0.95 | |||
| Dependent Variable | Independent Variables | B | Standard Error | t | Significance |
|---|---|---|---|---|---|
| Diameter at breast height | Constant | 0.4966 | 0.8031 | 0.603 | 0.548 |
| Height estimate using UAV | 4.1123 | 0.1979 | 20.781 | <2 × 10⁻¹⁶ | |
| Basal diameter | Constant | 10.3006 | 0.5825 | 17.68 | <2 × 10⁻¹⁶ |
| Crown-diameter estimate using UAV | 3.2024 | 0.1469 | 21.80 | <2 × 10⁻¹⁶ |
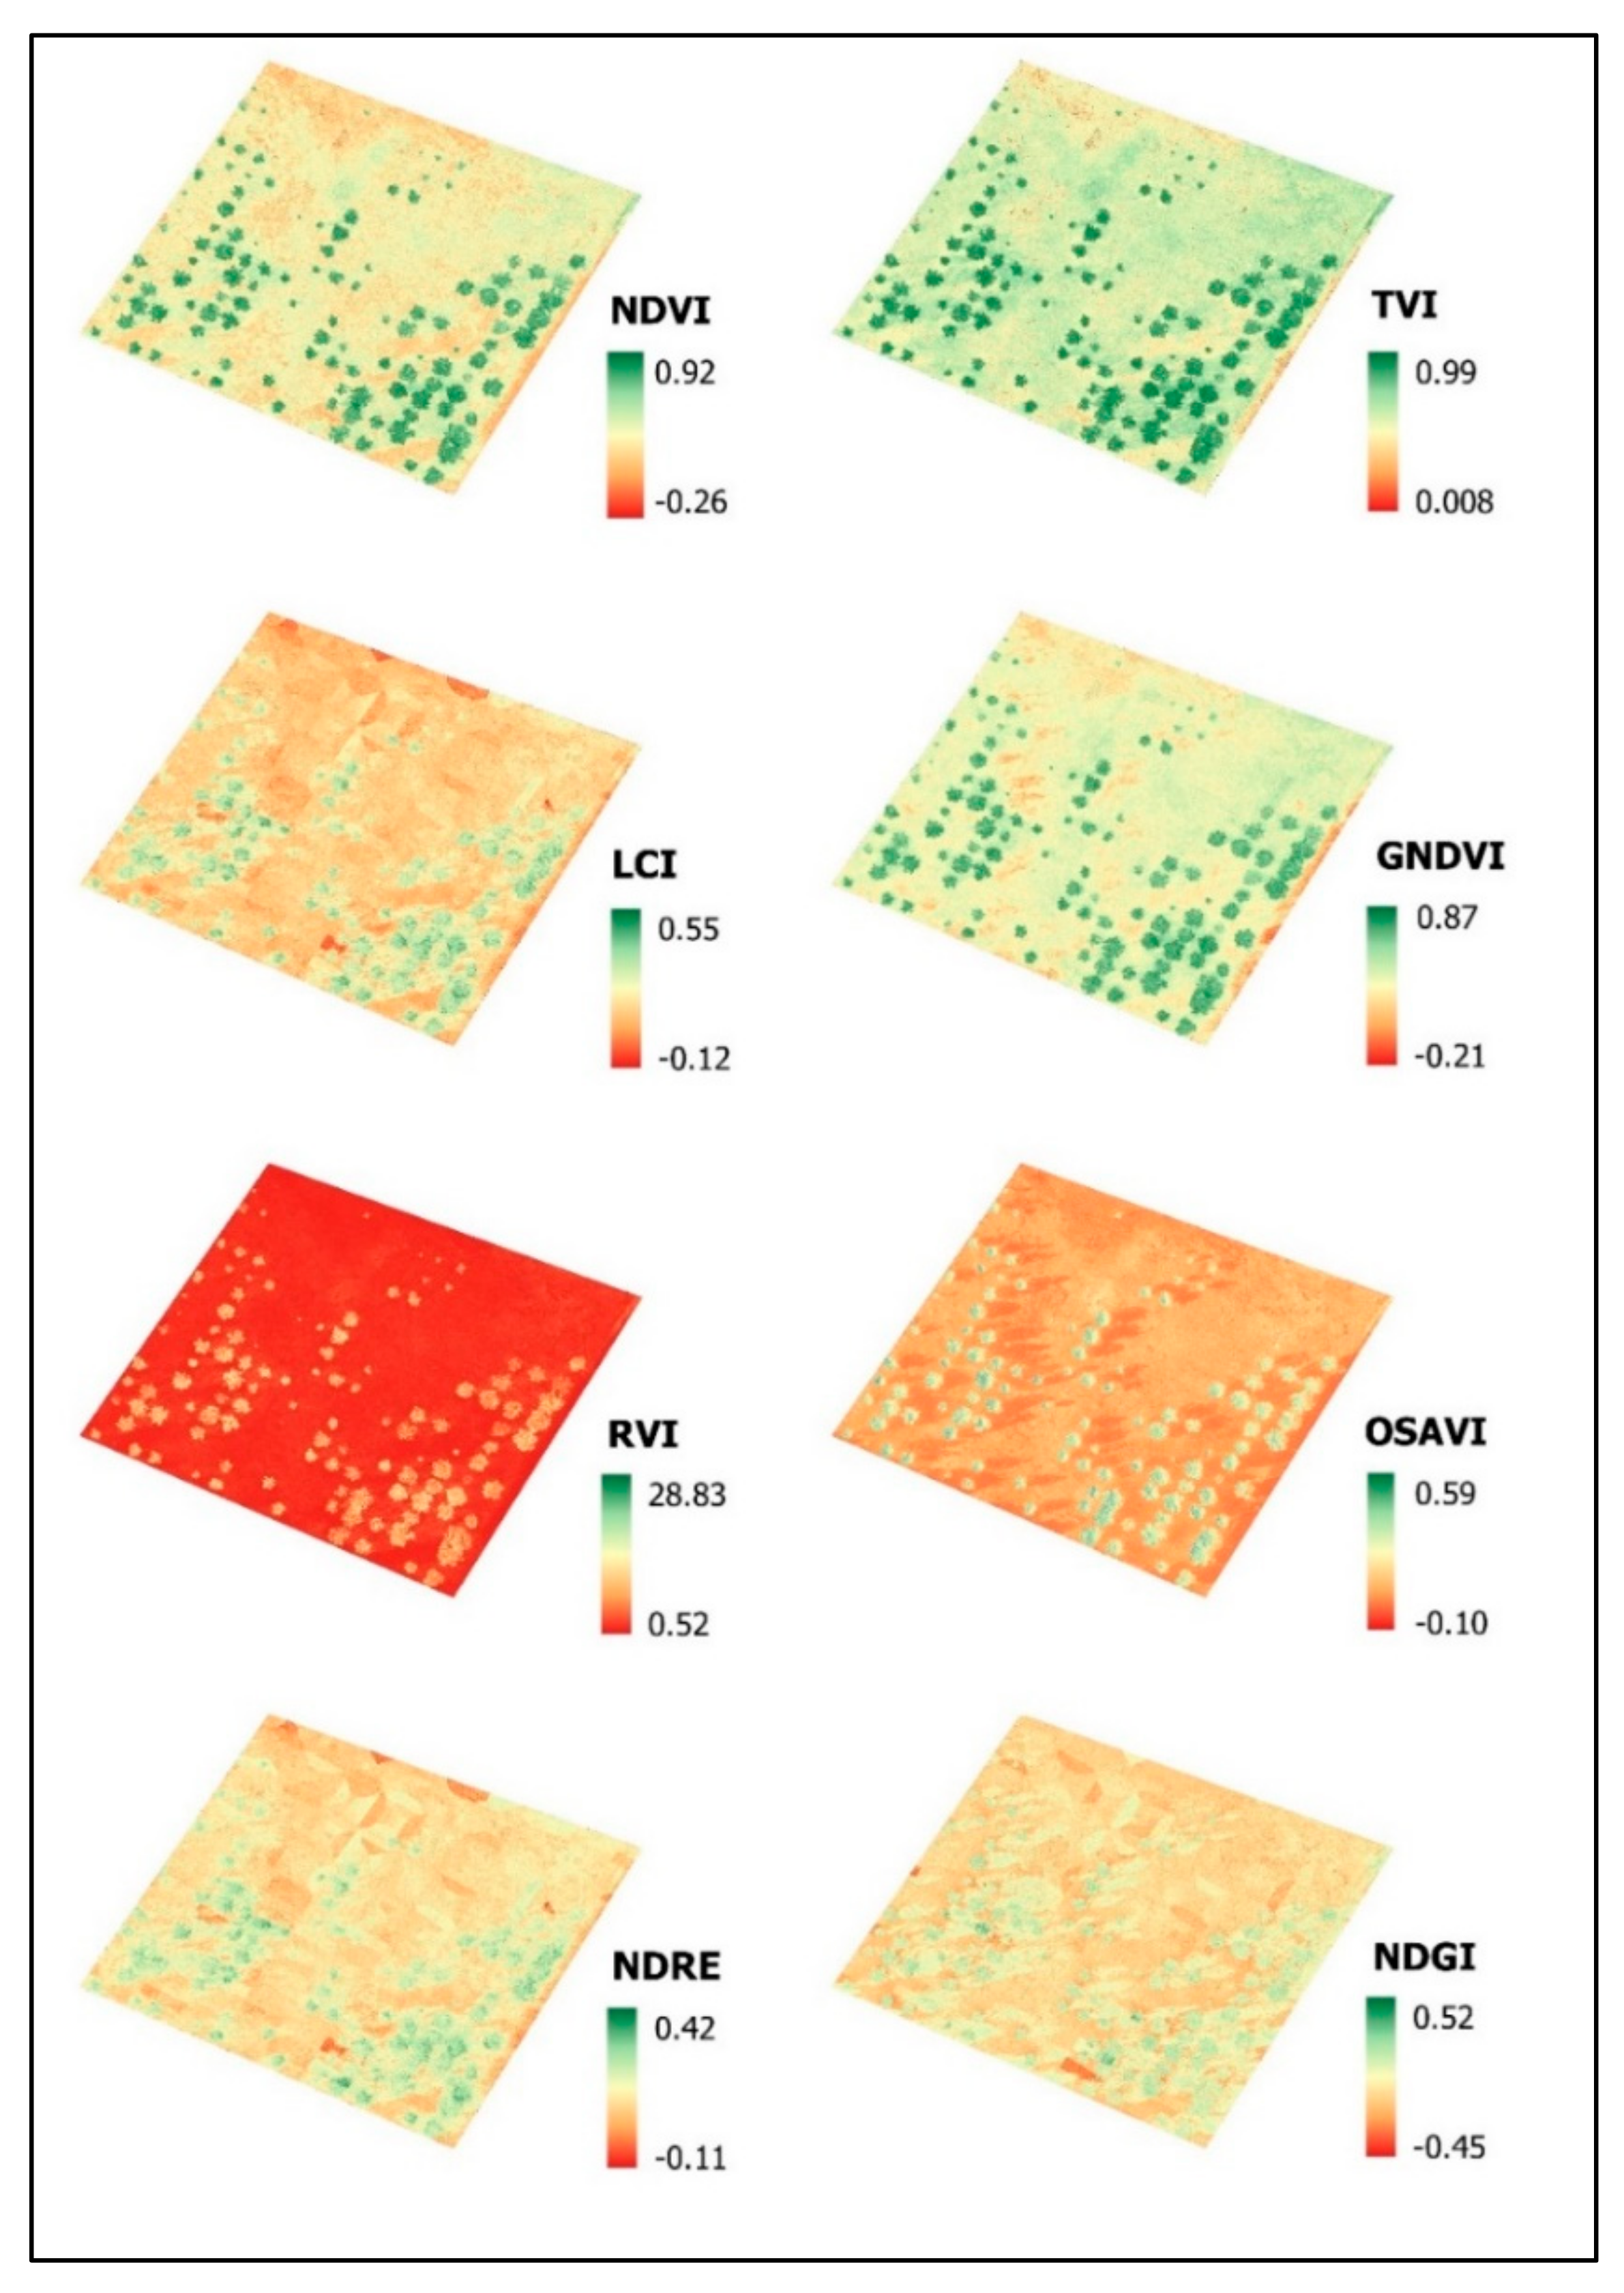
| Descriptive Measurement | NDVI | TVI | LCI | GNDVI | RVI | OSAVI | NDRE | NDGI |
|---|---|---|---|---|---|---|---|---|
| Average | 0.36 | 0.63 | 0.16 | 0.39 | 2.74 | 0.10 | 0.13 | −0.02 |
| Maximum | 0.92 | 0.99 | 0.55 | 0.87 | 28.85 | 0.59 | 0.42 | 0.52 |
| Minimum | −0.26 | 0.008 | −0.12 | −0.21 | 0.52 | −0.10 | −0.11 | −0.45 |
| Standard deviation | 0.18 | 0.14 | 0.08 | 0.14 | 2.32 | 0.09 | 0.06 | 0.11 |
Publisher’s Note: MDPI stays neutral with regard to jurisdictional claims in published maps and institutional affiliations. |
© 2020 by the authors. Licensee MDPI, Basel, Switzerland. This article is an open access article distributed under the terms and conditions of the Creative Commons Attribution (CC BY) license (http://creativecommons.org/licenses/by/4.0/).
Share and Cite
Gallardo-Salazar, J.L.; Pompa-García, M. Detecting Individual Tree Attributes and Multispectral Indices Using Unmanned Aerial Vehicles: Applications in a Pine Clonal Orchard. Remote Sens. 2020, 12, 4144. https://doi.org/10.3390/rs12244144
Gallardo-Salazar JL, Pompa-García M. Detecting Individual Tree Attributes and Multispectral Indices Using Unmanned Aerial Vehicles: Applications in a Pine Clonal Orchard. Remote Sensing. 2020; 12(24):4144. https://doi.org/10.3390/rs12244144
Chicago/Turabian StyleGallardo-Salazar, José Luis, and Marín Pompa-García. 2020. "Detecting Individual Tree Attributes and Multispectral Indices Using Unmanned Aerial Vehicles: Applications in a Pine Clonal Orchard" Remote Sensing 12, no. 24: 4144. https://doi.org/10.3390/rs12244144
APA StyleGallardo-Salazar, J. L., & Pompa-García, M. (2020). Detecting Individual Tree Attributes and Multispectral Indices Using Unmanned Aerial Vehicles: Applications in a Pine Clonal Orchard. Remote Sensing, 12(24), 4144. https://doi.org/10.3390/rs12244144