Abstract
Global alpine ecosystems contain a large amount of carbon, which is sensitive to global change. Changes to alpine carbon sources and sinks have implications for carbon and climate feedback processes. To date, few studies have quantified the spatial-temporal variations in ecosystem carbon storage and its response to global change in the alpine regions of the Qinghai-Tibet Plateau (QTP). Ecosystem carbon storage in the northeastern QTP between 2001 and 2019 was simulated and systematically analyzed using the Integrated Valuation of Ecosystem Services and Tradeoffs (InVEST) model. Furthermore, the Hurst exponent was obtained and used as an input to perform an analysis of the future dynamic consistency of ecosystem carbon storage. Our study results demonstrated that: (1) regression between the normalized difference vegetation index (NDVI) and biomass (coefficient of determination (R2) = 0.974, p < 0.001), and between NDVI and soil organic carbon density (SOCD) (R2 = 0.810, p < 0.001) were valid; (2) the spatial distribution of ecosystem carbon storage decreased from the southeast to the northwest; (3) ecosystem carbon storage increased by 13.69% between 2001 and 2019, and the significant increases mainly occurred in the low-altitude regions; (4) climate and land use (LULC) changes caused increases in ecosystem carbon storage of 4.39 Tg C and 2.25 Tg C from 2001 to 2019, respectively; and (5) the future trend of ecosystem carbon storage in 92.73% of the study area shows high inconsistency but that in 7.27% was consistent. This study reveals that climate and LULC changes have positive effects on ecosystem carbon storage in the alpine regions of the QTP, which will provide valuable information for the formulation of eco-environmental policies and sustainable development.
1. Introduction
Ecosystem carbon storage is recognized as a key indicator of ecosystem function because it is closely related to the climate regulation and productivity of terrestrial ecosystems [1,2]. Ecosystem carbon storage refers to the cumulative amount of carbon stored in terrestrial ecosystems [3]. The maintenance of ecosystem carbon storage is one of the hotspots of common concern around the world [4,5]. Quantitative studies of ecosystem carbon storage can provide a theoretical basis for the integrated management of natural ecosystems and the sustainable utilization of natural resources [5,6].
The quantitative methods of ecosystem carbon storage include field surveys, model simulations, and remote sensing [7]. As one of the assessment methods, modeling is becoming increasingly prominent because it can conduct evaluations of carbon storage at different scales, including global [8], national [9], and regional [10]. Many models have been used to evaluate carbon storage, such as Vector Autoregression (VAR) [11], High Accuracy Surface Modeling (HASM) [12], Century [13], Biome-BGC [14], General Ensemble Biogeochemical Modeling System (GEMS) [4,15], and InVEST [16,17]. The InVEST model provides new technology for conducting spatial expression, dynamic analysis, and quantitative evaluations of ecosystem service function [18]. More importantly, the InVEST model can easily be used to assess the impacts of climate and LULC changes on ecosystem carbon storage.
The InVEST model has been used in the United States, Tanzania, Indonesia, and China [7,19,20]. However, most of these studies have focused on the carbon pool of single ecosystems, and there are few systematic studies on the carbon storage of terrestrial ecosystems [7]. Previous studies have shown that climate and LULC changes are the major factors affecting ecosystem carbon storage [21,22,23,24]. Generally, climate change controls the balance between carbon inputs from plant productivity and carbon outputs from soil carbon decomposition and alters ecosystem carbon storage [25]. LULC change is an important process that affects carbon storage: changes in LULC from one type to another are usually accompanied by a large amount of carbon exchange [23,26]. LULC change can alter the carbon cycle process by changing the ecosystem’s structure (species composition, biomass) and function (energy balance, biodiversity, and the cycle of carbon, nitrogen, and water.) [23].
The QTP is the highest and largest plateau in the world, with an average elevation of more than 4000 m [22,27]. The soil has been reported to have accumulated plentiful soil organic matter, and its carbon density is obviously higher than that at similar latitudes, mainly due to its relatively low temperature and very high altitude, and thus the QTP has been regarded as a huge carbon pool [22,28,29]. Some studies of the QTP have evaluated carbon storage by using the InVEST model, but the spatial-temporal pattern of ecosystem carbon storage is still uncertain due to studies with low statistical power and insufficient sample sizes [30]. In addition, due to its unique geographic and ecological conditions, the alpine ecosystem of the QTP is very fragile and sensitive to climate change [31]. In the past 50 years, the air temperature of the QTP has increased by 0.2 °C per decade, roughly twice the observed rate of global warming [22], and annual precipitation has increased at the rate of 0.91 mm per year (1961–2007) [32]. Rapid warming and wetting undoubtedly shape the structures and processes of the ecosystem, which, in turn, lead to dramatic changes in the carbon cycle. Because climate warming tends to boost both plant production and soil respiration, there is some uncertainty about the change trend of ecosystem carbon [33,34]. It should be noted that the global warming trend will continue, according to the Fifth Assessment Report of the Intergovernmental Panel on Climate Change (IPCC) [35], which may further modify the dynamics of ecosystem carbon storage and amplify the uncertainty regarding the QTP. Hence, it has become urgent to analyze the spatial-temporal patterns of ecosystem carbon storage in the QTP more accurately, assess the impact of global change on ecosystem carbon storage, and detect the dynamic consistency of ecosystem carbon in the future.
Currently, studies on the spatial-temporal patterns of ecosystem carbon storage and their response to global change in the Shule River Basin on the northeastern margin of the QTP are especially rare. Taking the upstream regions of the Shule River Basin as a case study, the main goals of this research were: (1) to clarify and analyze the spatial-temporal patterns of ecosystem carbon storage and its change trend; (2) to explore the response characteristics of ecosystem carbon storage to climate and LULC changes; and (3) to detect the consistency of dynamic of ecosystem carbon storage in the future. This study has important guiding significance for the rational planning of environmental protection and the formulation of relevant policies in alpine regions.
2. Materials and Methods
2.1. Study Area and Climate Conditions
The Shule River, known as the “natural water tower” and “lifeline” of herders and farmers, is the second-largest inland river in the Hexi Corridor of China [36]. The upstream regions of the Shule River Basin (96.2°–99.0°E, 38.2°–40.0°N) lies in a mountainous area with abundant precipitation, which is the catchment area of the main stream of the Shule River Basin, and covers an area of about 1.38 × 10⁴ km2 (Figure 1). The altitude ranges from 1900 to 5733 m and gradually decreases from the edge to the middle region. Further, dozens of glaciers lie in this area [37]. The study area has a typical continental climate [38,39], with a low mean annual air temperature, little precipitation, and high actual evaporation [36,37]. The mean annual air temperature and annual precipitation from 1990 to 2019 were −5.24 °C and 201.64 mm, respectively (Figure 2). During this period, the mean annual air temperature and annual precipitation increased at the rate of 0.03 °C and 4.70 mm per year (p < 0.01), respectively. The change in climate in the study area showed a trend towards warmer and wetter conditions. In addition, the dominant vegetation types are alpine swamp meadows, alpine steppes, and alpine meadows [40].
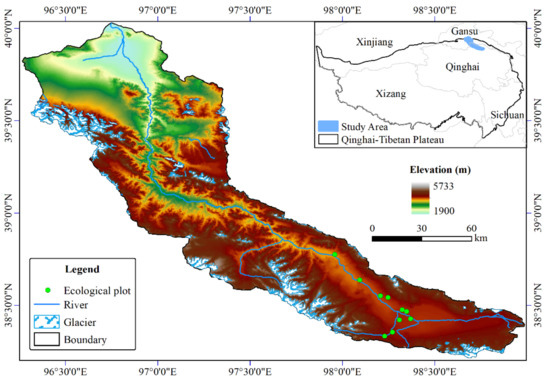
Figure 1.
Location of the study area and ecological plots.
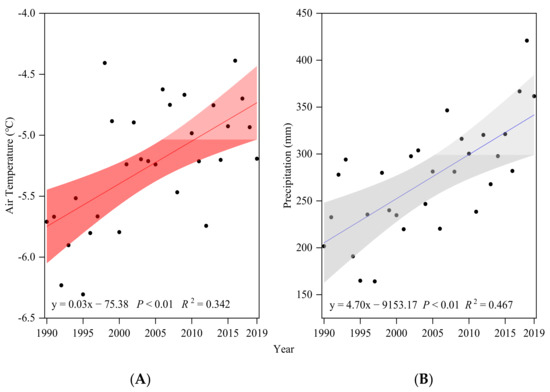
Figure 2.
Temporal dynamics of the mean annual air temperature (A) and annual precipitation (B) in 1990–2019. These dots are data points for each year, and the shaded areas represent the 99.0% confidence intervals of the regression equation.
2.2. Data Source and Processing
Meteorological data. The meteorological station data from around China from 1990–2019 were provided by the China Meteorological Data Service Center (http://data.cma.cn/ (accessed on 7 October 2019)). Original air temperature and precipitation data were interpolated into grid data using the spatial interpolation tool of geographic information systems.
LULC data. The Moderate Resolution Imaging Spectroradiometer (MODIS) Land Cover Type (MCD12Q1) Version 6 product provides global LULC types at yearly intervals (2001–2019). The classification method of the International Geosphere Biosphere Program (IGBP) was used in this study. The product was provided by NASA Earth Science Data Systems (https://search.earthdata.nasa.gov/search (accessed on 16 October 2020)).
NDVI data. Based on the SPOT/VEGETATION NDVI satellite remote sensing data, datasets of monthly NDVI were generated using the maximum value synthesis method. The NDVI values for the growth seasons (May to September) from 2000 to 2019 were obtained for this study. The datasets were provided by the Resource and Environmental Science and Data Center (http://www.resdc.cn/ (accessed on 21 November 2020)).
Ecosystem carbon parameters. Biomass and SOCD data were collected in 2000. The biomass data were obtained from the Carbon Dioxide Information Analysis Center (CDIAC), and SOCD data were provided by the European Soil Data Centre (ESDAC) (0–30 cm). Because biological carbon is relatively stable and small, it was obtained from field surveys and the literature [7,41,42,43]. In addition, the root-to-shoot ratios (RSRs) of different LULC types were collected from the IPCC 2006 national greenhouse gas emission inventory [44].
Field survey data. The LULC type of the ecological plots is grassland. Sampling occurred during the growth seasons of 2011–2019. The locations of the ecological plots can be found in Figure 1. We collected about 374 biomass samples (including aboveground biomass (AGB) and belowground biomass (BGB)) and 585 soil organic carbon (SOC) samples. In detail, each 50 × 50 cm quadrat was selected randomly in each ecological plot, and the living AGB was harvested. Previous studies reported that more than 90% of the BGB in alpine grassland is concentrated in the top 30 cm of the soil [38,45]. Hence, we collected BGB from each quadrat at a depth of 0–30 cm using soil cores 4.8 cm in diameter. Soil samples were crumbled by hand, rocks were removed, and samples were then passed through a sieve with a 0.2 cm pore size, then cleaned repeatedly to obtain the BGB. The AGB and BGB were weighed (0.01 g) after drying (24 h at 80 °C), and the carbon contents were converted by a ratio of 0.475 [44].
Samples for SOC were collected from each quadrat and were split into 0–10, 10–20, and 20–30 cm sections, then packed in plastic bags and brought to the laboratory. The dichromate oxidation method (Walkley–Black procedure) was used to measure the SOC [46]. In addition, volumetric soil samples for each depth were sampled using a cutting ring (volume of 100 g/cm3) and dried at 105 °C to determine the bulk density. The volume of rock fragments (i.e., coarser than 2 mm) was measured by submerging moist rock fragments and recording the volume of displaced water [38]. The soil organic carbon density (SOCD, unit: kg/m2) was calculated using Equation (1) [38,47]:
where , , , and are soil thickness (cm), bulk density (g/cm3), SOC (g/kg), and the volume percentage of soil particles >2 mm at layer , respectively.
In addition, all grid data were resampled with a spatial resolution of 500 m and projected using the World Geodetic System 1984.
2.3. Methods
2.3.1. Carbon Module
The carbon storage module in the InVEST model was used to estimate the ecosystem carbon storage in a specific region. This module consists of four carbon pools: aboveground biomass carbon, belowground biomass carbon, SOC, and humus carbon [1]. Aboveground biomass includes living plant materials above the soil level (such as leaves, bark, branches, trunks, etc.); belowground biomass refers to the living root systems of the aboveground plants. In contrast, soil organic matter comprises the organic component of soil, whereas humus is derived from leaf litter and the wood of standing and lying trees. The LULC types and their carbon density are the basic parameters of the module [18]. In the InVEST 3.2.0 User’s Guide, more detailed descriptions can be found [48]. The calculation formulae are shown in Equations (2) and (3):
where , ,, , and are the ecosystem carbon, aboveground biomass carbon, belowground biomass carbon, SOC, and humus carbon, respectively; is the carbon density of the LULC type i; and is the area of LULC type i.
2.3.2. Parameter Inversion of the Key Carbon Pool
Reviewing previous studies, we found that four main methods are used to estimate carbon density: literature reviews, field measurements, empirical modeling, and remote sensing. Due to differences in the estimation methods, the results may vary greatly [30]. Some studies used MODIS-NDVI products to establish the relationship between biomass and SOCD and demonstrated the scientific adaptability of this approach [30,49,50,51]. In this study, we used the spatial analysis tool of ArcGIS to acquire various values (including NDVI, biomass carbon, and SOCD) for each LULC type based on the dataset of 2000. Jan Joseph et al. [52] thought that the carbon density of built-up land and water bodies is zero, and thus the urban and built-up land, permanent snow and ice, and other water bodies were not considered in our study. In addition, nonirrigated farmland and bare land were also not considered due to their anomalous carbon density data. In accordance with the requirements of the fit of strong correlation, two quadratic curve equations, namely Biomass–NDVI and SOCD–NDVI, were constructed (Table 1). The key parameters (including biomass and SOCD) were calculated for 2001–2019 according to the regression equations and NDVI. Additionally, the biomass of each LULC type was divided into AGB and BGB according to the RSRs.

Table 1.
The regression equations of biomass–NDVI and SOCD–NDVI.
In addition, the performance of regression equations can be assessed by comparing the simulated and observed values, and systematic quantification of their performance accuracy can be determined by the coefficient of determination (R2) (ranging from 0 to 1), p-value (p), and root mean squared errors (RMSE). Among these, the R2 describes the decrease in collinearity between the measured and simulated data [39,53]. A higher value of R2 represents less error variance, and values above 0.5 are regarded as acceptable. RMSE is one of the statistical indicators of error. It is commonly accepted that the lower the RMSE, the better the model performance [54]. All R2 values in the text refer to the adjusted R2.
2.3.3. Hypotheses of Climate and LULC Changes
Generally, changes in ecosystem carbon storage in the region can be attributed to changes in the LULC type and carbon density [49]. To some extent, the change in carbon density is a direct indicator that reflects the effect of climate change on ecosystem carbon storage. To further explore the main factor affecting the change in ecosystem carbon storage, we took 2001 as the control year, and three hypotheses were designed regarding 2019 values: actual condition, LULC change only, and climate change only (Figure 3). This process is described as follows [49]:
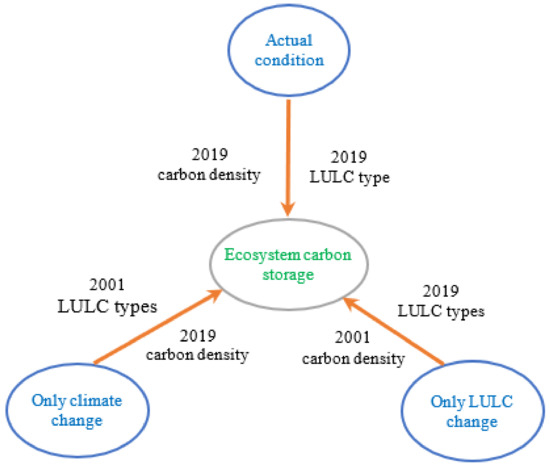
Figure 3.
Simulation of ecosystem carbon storage under different hypotheses.
- The change in ecosystem carbon storage under actual condition is described as , and the formula is expressed in Equation (4):where and are the area of LULC type before and after the change, respectively; and are the ecosystem carbon densities of LULC type before and after the change, respectively.
- The change in ecosystem carbon storage caused by climate change only can be expressed by Equation (5):
- The ecosystem carbon density of each LULC type is constant, and thus the change in ecosystem carbon storage is caused by LULC change only, which can be expressed as Equation (6):
- According to all three hypotheses, the contribution of climate and LULC change to the change in the ecosystem carbon storage can be described by Equations (7) and (8):where and are the contributions of LULC and climate changes to the change in ecosystem carbon storage, respectively.
2.3.4. Linear Regression Analysis
Linear regression analysis was used to detect the spatial change in the research objects (including meteorological elements and ecosystem carbon storage) with time-series data. The slope of the linear regression is considered to be the best index for quantifying the change trend of the research object during the study period. The slope can be calculated by Equation (9):
where is the number of years in the study period, is the serial number of the year, and is the value of research object in the year . Positive and negative values of the slope refer to positive and negative trends, respectively.
The correlation coefficient (r) of the linear regression can be used to test the significance of the change trend. It is expressed in Equation (10):
where and are the covariance and variance functions, respectively. When p < 0.01, the change trend is extremely significant; when 0.01 < p < 0.05, the change trend is significant; and when p > 0.05, the change trend is non-significant.
2.3.5. Hurst Exponent
The Hurst exponent is a classic method for detecting long memory in time series, which was proposed by the hydrologist H.E Hurst in 1951 [55]. R/S analysis is a superior and well-known method used for estimating Hurst exponent and was introduced by Mandelbrot [55,56]. In this study, we used this method to test the consistency of the future dynamics of ecosystem carbon. The main calculation procedures are shown in Equations (11)–(15) [56]:
- Divide the time series () into subseries , and, for each subseries,
- Define the mean sequence of the time series:
- Calculate the cumulative deviation:
- Create the range sequence:
- Create the standard deviation sequence:
- Rescale the range:
The value of the Hurst exponent ranges from 0 to 1, according to Hurst [57] and Mandelbrot [58]. When the value is equal to 0.5, this indicates that the time series is a random series without consistency (i.e., the change trend of the time series in the future would not be related with that in the study period); when the value is greater than 0.5, it refers to the consistency of the time series (i.e., the change trend of the time series in the future is the same as that in the study period, with the greater value for the more consistency); and when the value is less than 0.5, which indicates the inconsistency of the time series in the future, with theless value for the more inconsistency.
3. Results
3.1. Verification of Key Carbon Pool Parameters
To evaluate the performance of the regression equations, we analyzed the relationships between the observed values from the field survey and the simulated values (including AGB, BGB, and SOCD) for 2011–2019 (Figure 4). The R2, p, and RMSE were used to evaluate the agreement between the observed and simulated variables. The results indicated that the simulated values were sufficiently consistent with the measured values (p < 0.01), with correlation coefficients of 0.901, 0.925, and 0.866, respectively. Additionally, the RMSE values were relatively small.

Figure 4.
Comparisons of the simulated and observed aboveground biomass (AGB) (A), belowground biomass (BGB) (B), and soil organic carbon density (SOCD) (C) of grassland in 2011–2019. These lines are the fitting lines of the regression equation, and the shaded areas represent the 99.0% confidence intervals of the regression equations.
3.2. Climate Change
The spatial distribution of mean air annual temperature and annual precipitation could be characterized by large regional features. Specifically, the spatial variation range in the mean annual air temperature was -17.35 to 6.20 °C, gradually increasing from southeast to northwest (Figure 5A), while annual precipitation varied from 100.17 to 533.24 mm, diminishing from the southeast to northwest (Figure 5B). In addition, as shown in Figure 5C, significant warming mainly occurred in parts of the northwest (p < 0.05) from 2001 to 2019, and the rest of the study area also experienced obvious increases (p > 0.05). Figure 5D shows the changes in annual precipitation during the study period, which clearly indicate an extremely significant increase in precipitation across the whole study area (p < 0.01).
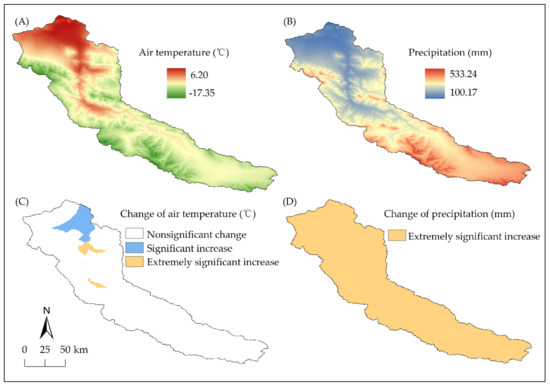
Figure 5.
Distributions of the mean annual air temperature (A), and annual precipitation (B), and changes in the mean annual air temperature (C) and annual precipitation (D) in 2001–2019.
3.3. Distribution of LULC and Change in LULC
In this study area, grassland is the major LULC type, encompassing more than 44.74% of the regional area. This LULC type is mostly located at the east of the northwest and in low-altitude regions of the southeast (Figure 6). The second most common LULC type is desert, accounting for about 41.40%, mainly distributed in the west of the northwest and in high-altitude regions of the southeast. Further, cropland, permanent snow and ice, permanent wetland, and built-up land accounted for about 4.72%, 4.04%, 2.73%, and 2.37%, respectively. In the marginal high-altitude regions, the main LULC types are desert and permanent snow and ice. Cropland and permanent wetland are located in the northwest of the study area, while built-up land is scattered throughout the study area.
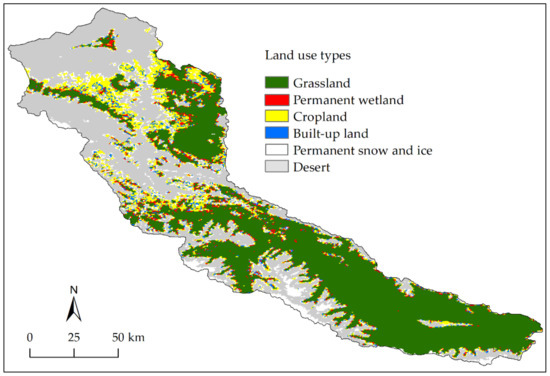
Figure 6.
Geographical distribution of LULC types during the study period.
In Table 2, the rows and columns represent the area of the six LULC types in 2001 and 2019, respectively. The values of the main diagonal represent the area of each LULC type that persisted in 2019, and the off-diagonal values show the converted area of each LULC type from 2001 to 2019. In fact, only the desert showed a diminishing trend in 2019 compared with 2001, shrinking by 1492.86 km2. Compared with 2001, the area increased by 1174.33 km2 for grassland and by 128.11, 97.28, 60.64, and 32.49 km2 for permanent snow and ice, cropland, permanent wetland, and built-up land in 2019, respectively (Table 2). Hence, the area of grassland increased the most during the study period (78.66%), followed by permanent snow and ice (8.58%). In practice, there was a decline in desert, which can be mainly attributed to the transition from desert to grassland, permanent snow and ice, cropland, and permanent wetland: 691.85, 300.59, 322.26, and 151.05 km2, respectively. Additionally, a small part of the grassland was also converted to built-up land (17.50 km2) and permanent snow and ice (11.04 km2).

Table 2.
Conversion of LULC types between 2001 and 2019 (unit: km2).
3.4. Differences in Ecosystem Carbon among LULC Types
The ecosystem carbon density in different LULC types is shown in Figure 7A. The highest amount of ecosystem carbon density was found in grassland, reaching 52.80 Mg/ha, followed by permanent wetland and cropland (about 44.83 and 42.00 Mg/ha, respectively), whereas the ecosystem carbon density of desert was the lowest, up to 29.87 Mg/ha. Compared with 2001, the ecosystem carbon density of grasslands, permanent wetland, cropland, and desert increased by 4.14, 7.90, 6.71, and 2.15 Mg/ha in 2019, respectively; the permanent wetland increased the most.
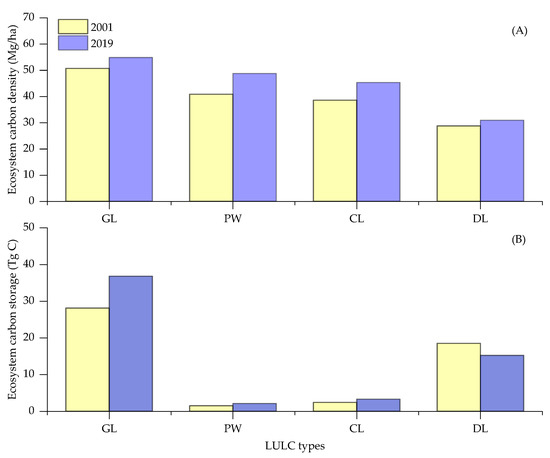
Figure 7.
The ecosystem carbon density (A) and ecosystem carbon storage (B) of various LULC types.
In terms of ecosystem carbon storage, grassland had the highest, reaching 32.48 Tg C, followed by desert (up to 16.87 Tg C) (Figure 7B). In contrast, the ecosystem carbon storage of permanent wetland and cropland was relatively small, up to just 1.81 and 2.86 Tg C, respectively. Ecosystem carbon storage in 2001 and 2019 was 50.56 and 57.49 Tg C, respectively, implying that ecosystem carbon storage increased during this period. Specifically, the ecosystem carbon storage of grassland increased the most (8.69 Tg C), followed by permanent wetland (0.61 Tg C) and cropland (0.88 Tg C), while ecosystem carbon storage in deserts decreased (−3.26 Tg C).
3.5. Spatial Distribution of and Change in Ecosystem Carbon Storage
The ecosystem carbon storage exhibited strong spatial heterogeneity in the study area, and the spatial distribution of the ecosystem carbon storage was basically consistent throughout the study period, i.e., decreasing from southeast to northwest (Figure 8). In detail, the lowest value of ecosystem carbon storage was for water bodies (close to 0), where were mainly distributed in marginal high-altitude regions. The highest value of ecosystem carbon storage occurred in the east of the northwest and in low-altitude regions of the southeast.
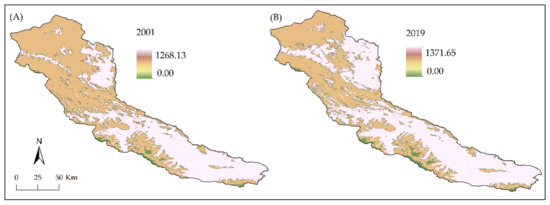
Figure 8.
Distribution of ecosystem carbon storage in 2001(A) and 2019 (B).
The change trend of ecosystem carbon storage of each pixel is shown in Figure 9, indicating that the linear trend of ecosystem carbon storage showed distinct spatial differences from 2001 to 2019. In sum, more than 51.48% of the study area experienced extremely significant (p < 0.01) or significant (p < 0.05) increases in ecosystem carbon storage, mainly distributed in the east of the northwest and low-altitude regions of the southeast, while 6.11% of the area had extremely significant or significant decreases; these locations were scattered throughout the study area. In contrast, the area with non-significant changes in ecosystem carbon storage made up about 42.41%, mainly concentrated in the northwest and high-altitude regions of the southeast.
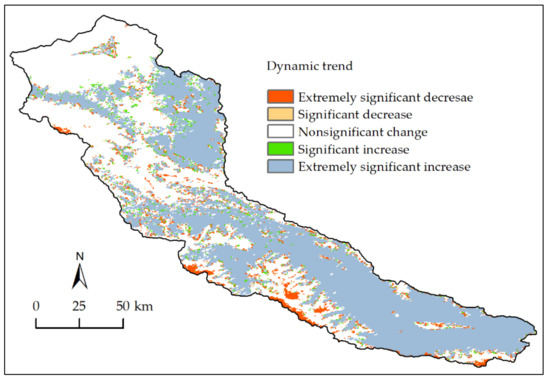
Figure 9.
Changes in ecosystem carbon storage between 2001 and 2019.
3.6. Impacts of Changes in Climate and LULC on Ecosystem Carbon Storage
Under actual conditions, the ecosystem carbon storage increased by 6.92 Tg C between 2001 and 2019 (Table 3). Under the hypothesis with LULC change, the ecosystem carbon storage increased or decreased with LULC change, depending on the type of conversion. However, the amplitude of the increase was greater than the amplitude of the decrease, leading to a net increase of 2.25 Tg C in total ecosystem carbon storage. The major increase in ecosystem carbon storage was caused by land conversion from desert to grassland (691.85 km2), cropland (322.26 km2), and permanent wetland (151.05 km2). In contrast, land conversion from grassland, cropland, and permanent wetland to desert caused only minor variations in ecosystem carbon storage. Under the hypothesis with climate change, the total ecosystem carbon storage increased by 4.39 Tg C in 2019 compared with 2001, an increase of 8.69%, which can be attributed to the increase in carbon density promoted by climate warming and wetting.

Table 3.
Ecosystem carbon storage under the different hypotheses (unit: Tg C).
When the three hypotheses were compared, we found that the contribution of climate change to the change in total regional ecosystem carbon storage was 66.10%, whereas LULC change only accounted for 33.90%. This reveals the fact that the impact of climate change on the total ecosystem carbon storage was far greater than that of LULC change. Further, under the hypothesis with LULC change, the ecosystem carbon density per pixel was lower than actual conditions (Figure 10A,B). The main regions with a reduction in ecosystem carbon storage were distributed in the northwest under the hypothesis with climate change (Figure 10C), compared with actual conditions.

Figure 10.
Ecosystem carbon storage under actual condition (A), the hypotheses with LULC change (B), and the hypothesis with climate change (C) in 2019.
3.7. Future Trends of Ecosystem Carbon Storage
The Hurst exponent of the ecosystem carbon storage time series in the study area distinctly increased from southeast to northwest (Figure 11), but the Hurst exponent in most of the study area, accounting for about 92.73%, was lower than 0.5, indicating that the trend in ecosystem carbon storage in the future is highly inconsistent. The trend for ecosystem carbon storage was consistent with the future in only 7.27% of the study area; these areas were scattered throughout the region.
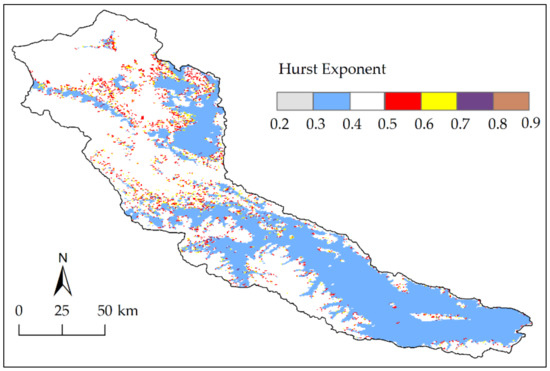
Figure 11.
Distribution of Hurst exponent for the ecosystem carbon storage time series.
4. Discussion
4.1. Temporal Dynamics and Factors Influencing Ecosystem Carbon Storage
The QTP makes an important contribution to the global carbon pool and carbon cycle, and this ecosystem’s carbon dynamics can mitigate or enhance the impact on atmospheric CO2 and global warming [59]. In this context, some scholars have explored the temporal dynamics of ecosystem carbon storage in the QTP. Among them, Zhao et al. [49] found that the ecosystem carbon storage of the QTP exhibited overall growth in 2001–2010. The Qinghai Lake Basin (QLB), located in the northeastern margin of the QTP, is the largest saltwater lake in China and is an important wetland globally. Li et al. [7] evaluated the temporal dynamics of the ecosystem carbon storage of the QLB in 1990–2015, indicating that the ecosystem carbon storage increased by 1.60 Tg C. Located in the hinterland of the QTP, the Three-River Headwaters Region (TRHR) is the source of the Yangtze River, the Yellow River, and the Lancang River, and it is also an extremely sensitive area of China’s ecological environment and the initiating area of climate change. Zhang et al. [60] discovered that the ecosystem carbon storage in the TRHR fluctuated upward in 2000–2010. In this study, we found that ecosystem carbon storage obviously increased in the upstream regions of the Shule River Basin between 2019 and 2001, which is consistent with the results of the abovementioned studies. This may be attributed to the increase in vegetation productively caused by climate and LULC changes. On the one hand, over the past few decades, the study area has experienced warming and wetting. Meanwhile, a significant portion of it is underlaid by permafrost, and with climate warming, permafrost thawing is likely to occur. These changes have induced changes in the ecosystem carbon processes, such as carbon gains attributed to stimulated vegetation productivity and carbon losses from thawing permafrost; the balance of these fluxes depends on the feedback of permafrost to warming [30,61]. In fact, the increase in carbon inputs from vegetation caused by climate change was greater than the loss of carbon, resulting in an obvious increase in ecosystem carbon storage during the study period. Further, the increase in ecosystem carbon density in the desert was the least, and deserts were largely replaced by other LULC types, resulting in the ecosystem carbon storage of deserts decreasing by 3.26 Tg C from 2001 to 2019. However, the increase in ecosystem carbon storage of other LULC types (which increased by 10.18 Tg C) is enough to offset the corresponding decrease in deserts; most of the increased ecosystem carbon storage is due to grassland. Interestingly, compared with other LULC types, although the ecosystem carbon density of permanent wetland increased the most (7.90 Mg/ha) in 2019 compared with 2001, its carbon storage increased the least, up to just 0.61 Tg C, mainly attributed to its relatively small area.
Through analysis of the three hypotheses, we found that the contribution of climate change to the change in ecosystem carbon storage was 66.10%, while the contribution of LULC change was 33.90%. Thus, climate change is more important than LULC change in affecting the regional ecosystem carbon storage, which has been confirmed by previous studies [49]. The main reason is that the scale of LULC change is small, and the conversion patterns between LULC types can cause both positive and negative effects on ecosystem carbon storage, whereas climate change can directly alter the inputs and outputs of ecosystem carbon storage.
4.2. Spatial Distribution and Factors Affecting Ecosystem Carbon Storage
The spatial distribution of ecosystem carbon storage in the study area was basically consistent over the study period. Under the integrated impact of climate and LULC changes, ecosystem carbon storage exhibited strong spatial heterogeneity, decreasing from southeast to northwest. The lowest values were mainly located in the marginal high-altitude regions. Because the mean annual air temperature of the high-altitude regions is lower than 0 °C, the LULC type is dominated by permanent snow and ice, so it is difficult for vegetation to survive, and the ecosystem carbon storage is close to 0. In contrast, the low-altitude regions can provide more suitable water and temperature environments for vegetation growth, and the ecosystem carbon storage in these areas is higher. In particular, the highest ecosystem carbon storage was found in the east of the northwest and in low-altitude altitude regions of the southeast due to their relatively low air temperature and favorable precipitation. Plants in these regions grow well and create higher primary productivity, which is beneficial for carbon accumulation, whereas the opposite is true in the other parts of the northwest.
In 2001–2019, the precipitation in the whole study area increased significantly, and air temperature showed an obvious increasing trend. Previous studies [62,63,64] have demonstrated that warming and wetting can stimulate plant growth, thus promoting gross and net primary production. Further, desert has been largely replaced by grassland. Hence, more than 51.48% of the study area experienced significant increases in ecosystem carbon storage in 2001–2019. Additionally, only 6.11% of the study area experienced significant decreases in ecosystem carbon storage, which can be attributed to the conversion of a small part of the desert and grassland into built-up land between 2001 and 2019. It is worth mentioning that the inconsistent dynamic trend of ecosystem carbon storage in the future may be related to climate change and the intensification of human activities such as urbanization and overgrazing.
4.3. Uncertainties and Limitations
Firstly, the InVEST model can reliably estimate ecosystem carbon storage in alpine regions, but the model does not consider the process of carbon sequestration and release [49]. Secondly, the parameter inversion of the regression model springs from remote sensing data, which may bring some uncertainty to estimates of carbon storage. Thirdly, RSRs usually change under the influence of grazing and climate change [59]. The RSRs come from the IPCC in this study, which may increase the uncertainty of the simulation. Further, due to the defects of the InVEST model, we assessed the impact of climate change on ecosystem carbon storage by controlling the change in carbon density. Finally, detecting the future trend of ecosystem carbon storage using R/S analysis was a great advance in this study, but the time of the expected dynamic trends in the future could not be determined.
5. Conclusions
We analyzed the spatial-temporal patterns and change trends of ecosystem carbon storage and explored the impact of climate and LULC changes on ecosystem carbon storage between 2001 and 2019. Under the integrated influence of climate and LULC changes, ecosystem carbon storage increased from 50.56 Tg C in 2001 to 57.49 Tg C in 2019, an increase of 13.69%. Between 2001 and 2019, more than 51.48% of the ecosystem carbon storage in the study area increased significantly, and regions with significant decreases accounted for 6.11%. Additionally, the spatial distribution of ecosystem carbon storage was heterogeneous, i.e., it decreased from southeast to northwest. By varying three hypotheses, we found that climate change has a dominant impact on the change in ecosystem carbon storage, while LULC change has a relatively small impact. The future trend of ecosystem carbon storage may be dominated by inconsistency. Evaluations of ecosystem carbon storage in alpine areas are of great significance for decision-making regarding ecological environmental protection and sustainable development.
Author Contributions
Conceptualization, P.W., M.W., S.C.; visualization, P.W., Y.J.; methodology, Y.J., H.X.; resources, P.W., H.X. and D.L.; formal analysis, P.W., M.W.; data curation, S.C., H.X.; writing—original draft preparation, P.W.; writing—review and editing, P.W., M.W., S.C. and H.X.; S.C.; funding acquisition, S.C.; supervision, S.C.; project administration. All authors have read and agreed to the published version of the manuscript.
Funding
This research was funded by the National Science Foundation of China (41871064, 41690142), Qinghai Key R&D and Transformation Program (2020-SF-146), the Freedom Project of the State Key Laboratory of Cryospheric Science, Northwest Institute of Eco-Environment and Resources, Chinese Academy of Sciences (SKLCS-ZZ-2021) and Qinghai Province High-level Innovative “Thousand Talents” Program.
Data Availability Statement
Not applicable.
Conflicts of Interest
The authors declare no conflict of interest.
References
- Zhao, M.; He, Z.; Du, J.; Chen, L.; Lin, P.; Fang, S. Assessing the effects of ecological engineering on carbon storage by linking the CA-Markov and InVEST models. Ecol. Indic. 2019, 98, 29–38. [Google Scholar] [CrossRef]
- Houghton, R.A. Revised estimates of the annual net flux of carbon to the atmosphere from changes in land use and land management 1850–2000. Tellus B Chem. Phys. Meteorol. 2003, 55, 378–390. [Google Scholar]
- He, C.; Zhang, D.; Huang, Q.; Zhao, Y. Assessing the potential impacts of urban expansion on regional carbon storage by linking the LUSD-urban and InVEST models. Environ. Model. Softw. 2016, 75, 44–58. [Google Scholar] [CrossRef]
- Zhao, S.; Liu, S.; Yin, R.; Li, Z.; Deng, Y.; Tan, K.; Deng, X.; Rothstein, D.; Qi, J. Quantifying terrestrial ecosystem carbon dynamics in the Jinsha watershed, upper Yangtze, China from 1975 to 2000. Environ. Manag. 2010, 45, 466–475. [Google Scholar] [CrossRef]
- Chen, D.; Deng, X.; Jin, G.; Samie, A.; Li, Z. Land-use-change induced dynamics of carbon stocks of the terrestrial ecosystem in Pakistan. Phys. Chem. Earth Parts A/B/C 2017, 101, 13–20. [Google Scholar] [CrossRef]
- Upadhyay, T.P.; Sankhayan, P.L.; Solberg, B. A review of carbon sequestration dynamics in the Himalayan region as a function of land-use change and forest/soil degradation with special reference to Nepal. Agric. Ecosyst. Environ. 2005, 105, 449–465. [Google Scholar] [CrossRef]
- Li, J.; Gong, J.; Guldmann, J.; Li, S.; Zhu, J.C. Dynamics in the Northeastern Qinghai–Tibetan Plateau from 1990 to 2030 Using Landsat Land Use/Cover Change Data. Remote Sens. 2020, 12, 528. [Google Scholar] [CrossRef] [Green Version]
- Quéré, C.L.; Peters, G.P.; Andres, R.J.; Andrew, R.M.; Boden, T.A.; Ciais, P.; Friedlingstein, P.; Houghton, R.A.; Marland, G.; Moriarty, R.; et al. Global carbon budget 2013. Earth Syst. Sci. Data 2014, 6, 235–263. [Google Scholar] [CrossRef] [Green Version]
- Fang, J.; Chen, A.; Peng, C.; Zhao, S.; Ci, L. Changes in forest biomass carbon storage in China between 1949 and 1998. Science 2001, 292, 2320–2322. [Google Scholar] [CrossRef] [PubMed]
- Tao, Y.; Li, F.; Liu, X.; Zhao, D.; Sun, X.; Xu, L. Variation in ecosystem services across an urbanization gradient: A study of terrestrial carbon stocks from Changzhou, China. Ecol. Model. 2015, 318, 210–216. [Google Scholar] [CrossRef]
- Wu, S.; Li, Y.; Yu, D.; Zhou, L.; Zhou, W.; Guo, Y.; Wang, X.; Dai, L. Analysis of factors that influence forest vegetation carbon storage by using the VAR model: A case study in Shaanxi Province. Acta Ecol. Sin. 2015, 35, 196–203. [Google Scholar]
- Zhao, M.; Yue, T.; Zhao, N.; Sun, X.; Zhang, X. Combining LPJ-GUESS and HASM to simulate the spatial distribution of forest vegetation carbon stock in China. J. Geogr. Sci. 2014, 24, 249–268. [Google Scholar] [CrossRef]
- Parton, W.J.; Scurlock, J.M.O.; Ojima, D.S.; Gilmanov, T.G.; Scholes, R.J.; Schimel, D.S.; Kirchner, T.; Menaut, J.C.; Seastedt, T.; Moya, E.G.; et al. Observations and modeling of biomass and soil organic matter dynamics for the grassland biome worldwide. Glob. Biogeochem. Cycles 1993, 7, 785–809. [Google Scholar] [CrossRef] [Green Version]
- Running, S.W.; Hunt, E.R., Jr. Generalization of a Forest Ecosystem Process Model for Other Biomes, Biome-BCG, and an Application for Global-Scale Models; Academic Press, Inc.: San Diego, CA, USA, 1993. [Google Scholar]
- Zhao, S.; Liu, S.; Sohl, T.; Young, C.; Werner, J. Land use and carbon dynamics in the southeastern United States from 1992 to 2050. Environ. Res. Lett. 2013, 8, 044022. [Google Scholar] [CrossRef] [Green Version]
- Zhang, Y.; Zhang, X.; Chen, Z.; Wang, W.; Chen, D. Research on the spatiotemporal variation of carbon storage in coastal zone ecosystem of Jiangsu based on InVEST Model. Res. Soil Water Conserv. 2016, 23, 100–105. [Google Scholar]
- Liang, Y.; Liu, L.; Huang, J. Integrating the SD-CLUE-S and InVEST models into assessment of oasis carbon storage in northwestern China. PLoS ONE 2017, 12, e0172494. [Google Scholar] [CrossRef]
- Liu, S.; Hu, N.; Zhang, J.; Lv, Z. Spatiotemporal change of carbon storage in the Loess Plateau of northern Shaanxi, based on the InVEST Model. Sci. Cold Arid. Reg. 2018, 10, 240–250. [Google Scholar]
- Huang, C.; Yang, J.; Zhang, W. Development of ecosystem services evaluation models: Research progress. Chin. J. Ecol. 2013, 32, 3360–3367. [Google Scholar]
- Wu, Z.; Chen, X.; Liu, B.; Chu, J.; Peng, L. Research progress and application of InVEST model. Chin. J. Trop. Agric. 2013, 33, 58–62. [Google Scholar]
- Feng, W. Change Characteristics of Soil Organic Carbon in Shiyang River Basin and Its Response to Climate and Land Use Changes. Master’s Thesis, Northwest Normal University, Lanzhou, China, 2020. [Google Scholar]
- Chen, H.; Zhu, Q.; Peng, C.; Wu, N.; Wang, Y.; Fang, X.; Gao, Y.; Zhu, D.; Yang, G.; Tian, J.; et al. The impacts of climate change and human activities on biogeochemical cycles on the Qinghai-Tibetan Plateau. Glob. Chang. Biol. 2013, 19, 2940–2955. [Google Scholar] [CrossRef]
- Chen, G.; Tian, H. Land use/cover change effects on carbon cycling in terrestrial ecosystems. Chin. J. Plant Ecol. 2007, 31, 189–204. [Google Scholar]
- Hayes, D.J.; McGuire, D.A.; Kicklighter, D.W.; Burnside, T.J.; Melillo, J.M. The effects of land cover and land use change on the contemporary carbon balance of the arctic and boreal terrestrial ecosystems of northern Eurasia. In Eurasian Arctic Land Cover and Land Use in a Changing Climate; Gutman, G., Reissell, A., Eds.; Springer: Berlin, Germany, 2010; pp. 109–136. [Google Scholar]
- Wang, X.; Li, Y.; Gong, X.; Niu, Y.; Chen, Y.; Shi, X.; Li, W. Storage, pattern and driving factors of soil organic carbon in an ecologically fragile zone of northern China. Geoderma 2019, 343, 155–165. [Google Scholar] [CrossRef]
- Noble, I.R.; Bolin, B.; Ravindranath, N.H.; Verardo, D.J.; Dokken, D.J. Land use, land use change, and forestry. Environ. Conserv. 2000, 28, 284–293. [Google Scholar]
- Baumann, F.; HE, J.; Schmidt, K.; Kuhn, P.; Scholten, T. Pedogenesis, permafrost, and soil moisture as controlling factors for soil nitrogen and carbon contents across the Tibetan Plateau. Glob. Chang. Biol. 2009, 15, 3001–3017. [Google Scholar] [CrossRef]
- Zhang, Y.; Tang, Y.; Jiang, J.; Yang, Y. Characterizing the dynamics of soil organic carbon in grasslands on the Qinghai-Tibetan Plateau. Sci. China Ser. D Earth Sci. 2007, 50, 113–120. [Google Scholar] [CrossRef]
- Wang, S.; Zhou, C. Estimating soil carbon reservoir of terrestrial ecosystem in China. Geo. Res. 1999, 18, 349–356. [Google Scholar]
- Liu, S.; Sun, Y.; Dong, Y.; Zhao, H.; Dong, S.; Zhao, S.; Beazley, R. The spatio-temporal patterns of the topsoil organic carbon density and its influencing factors based on different estimation models in the grassland of Qinghai-Tibet Plateau. PLoS ONE 2019, 14, e0225952. [Google Scholar] [CrossRef] [PubMed] [Green Version]
- Klein, J.A.; Harte, J.; Zhao, X. Experimental warming causes large and rapid species loss, dampened by simulated grazing, on the Tibetan Plateau. Ecol. Lett. 2004, 7, 1170–1179. [Google Scholar] [CrossRef]
- Li, L.; Yang, S.; Wang, Z.; Zhu, X.; Tang, H. Evidence of warming and wetting climate over the Qinghai-Tibet Plateau. Arct. Antarct. Alp. Res. 2010, 42, 449–457. [Google Scholar] [CrossRef]
- Zhang, Y.; Qi, W.; Zhou, C.; Ding, M.; Liu, L.; Gao, J.; Bai, W.; Wang, Z.; Zheng, D. Spatial and temporal variability in the net primary production of alpine grassland on the Tibetan Plateau since 1982. J. Geogr. Sci. 2014, 24, 269–287. [Google Scholar] [CrossRef]
- Zhuang, Q.; He, J.; Lu, Y.; Ji, L.; Xiao, J.; Luo, T. Carbon dynamics of terrestrial ecosystems on the Tibetan Plateau during the 20th century: An analysis with a process-based biogeochemical model. Glob. Ecol. Biogeogr. 2010, 19, 649–662. [Google Scholar] [CrossRef]
- Peng, L.; Lin, Y.; Chen, G.; Lien, W. Climate change impact on spatiotemporal hotspots of hydrologic ecosystem services: A case study of Chinan catchment, Taiwan. Water 2019, 11, 867. [Google Scholar] [CrossRef] [Green Version]
- Chen, S.; Liu, W.; Qin, X.; Liu, Y.; Zhang, T.; Chen, K.; Hu, F.; Ren, J.; Qin, D. Response characteristics of vegetation and soil environment to permafrost degradation in the upstream regions of the Shule River Basin. Environ. Res. Lett. 2012, 7, 045406. [Google Scholar] [CrossRef] [Green Version]
- Sheng, Y.; Li, J.; Wu, J.-C.; Ye, B.-S.; Wang, J. Distribution patterns of permafrost in the upper area of Shule River with the application of GIS technique. J. China Univ. Min. Technol. 2010, 39, 32–39. [Google Scholar]
- Liu, W.; Chen, S.; Qin, X.; Baumann, F.; Scholten, T.; Zhou, Z.; Sun, W.; Zhang, T.; Ren, J.; Qin, D. Storage, patterns, and control of soil organic carbon and nitrogen in the northeastern margin of the Qinghai–Tibetan Plateau. Environ. Res. Lett. 2012, 7, 035401. [Google Scholar] [CrossRef]
- Wei, P.; Chen, S.; Wu, M.; Deng, Y.; Xu, H.; Jia, Y.; Liu, F. Using the InVEST Model to Assess the Impacts of Climate and Land Use Changes on Water Yield in the Upstream Regions of the Shule River Basin. Water 2021, 13, 1250. [Google Scholar] [CrossRef]
- Liu, W.; Chen, S.; Liang, J.; Qin, X.; Kang, S.; Ren, J.; Qin, D. The effect of decreasing permafrost stability on ecosystem carbon in the northeastern margin of the Qinghai–Tibet Plateau. Sci. Rep. 2018, 8, 1–10. [Google Scholar] [CrossRef] [Green Version]
- Chuai, X.; Huang, X.; Zheng, Z.; Zhang, M.; Liao, Q.; Lai, L.; Lu, J. Land use change and its influence on carbon storage of terrestrial ecosystems in Jiangsu Province. Resour. Sci. 2011, 33, 1932–1939. [Google Scholar]
- Huang, M.; Ji, J.; Cao, M.; Li, K. Modeling study of vegetation shoot and root biomass in China. Acta Ecol. Sin. 2006, 26, 4156–4163. [Google Scholar]
- Xie, X.; Sun, B.; Zhou, H.; Li, Z. Soil carbon stocks and their influencing factors under native vegetations in China. Acta Pedol. Sin. 2004, 41, 699–705. [Google Scholar]
- Eggleston, H.S.; Buendia, L.; Miwa, K.; Ngara, T.; Tanabe, K. IPCC Guidelines for National Greenhouse Gas Inventories; Institute for Global Environmental Strategies: Hayama, Japan, 2006. [Google Scholar]
- Yang, Y.; Fang, J.; Ji, C.; Han, W. Above-and belowground biomass allocation in Tibetan grasslands. J. Veg. Sci. 2009, 20, 177–184. [Google Scholar] [CrossRef]
- Nelson, D.W.; Sommers, L.E. Total carbon, organic carbon, and organic matter. Methods of soil analysis. Chem. Microbiol. Prop. 1983, 09, 539–579. [Google Scholar]
- Liu, W.; Chen, S.; Zhao, Q.; Sun, Z.; Ren, J.; Qin, D. Variation and control of soil organic carbon and other nutrients in permafrost regions on central Qinghai-Tibetan Plateau. Environ. Res. Lett. 2014, 9, 114013. [Google Scholar] [CrossRef]
- Sharp, R.; Tallis, H.; Ricketts, T.; Guerry, A.; Wood, S.; Chaplin-Kramer, R.; Nelson, E.; Ennaanay, D.; Wolny, S.; Olwero, N.; et al. Invest Version 3.2. 0 User’s Guide. The Natural Capital Project; Stanford University: Stanford, CA, USA, 2015. [Google Scholar]
- Zhao, Z.; Liu, G.; Mou, N.; Xie, Y.; Xu, Z.; Li, Y. Assessment of carbon storage and its influencing factors in Qinghai-Tibet Plateau. Sustainability 2018, 10, 1864. [Google Scholar] [CrossRef] [Green Version]
- Dai, E.; Zhai, R.; Ge, Q.; Wu, X. Detecting the storage and change on topsoil organic carbon in grasslands of Inner Mongolia from 1980s to 2010s. J. Geogr. Sci. 2014, 24, 1035–1046. [Google Scholar] [CrossRef] [Green Version]
- Jia, Y.; Guo, N.; Huang, L.; Jia, J. Ananlyses on MODIS-NDVI index saturation in northwest China. Plateau Meteorol. 2008, 27, 896–903. [Google Scholar]
- Dida, J.J.V.; Tiburan, C.; Tsutsumida, N.; Saizen, I. Carbon Stock Estimation of Selected Watersheds in Laguna, Philippines Using InVEST. Philipp. J. Sci. 2021, 150, 501–513. [Google Scholar]
- Van Liew, M.W.; Arnold, J.G.; Garbrecht, J.D. Hydrologic simulation on agricultural watersheds: Choosing between two models. Trans. ASAE 2003, 46, 1539. [Google Scholar] [CrossRef]
- Moriasi, D.N.; Arnold, J.G.; Van Liew, M.W.; Bingner, R.L.; Harmel, R.D.; Veith, T.L. Model evaluation guidelines for systematic quantification of accuracy in watershed simulations. Trans. ASABE 2007, 50, 885–900. [Google Scholar] [CrossRef]
- Sánchez Granero, M.A.; Trinidad Segovia, J.E.; Pérez, J.G. Some comments on Hurst exponent and the long memory processes on capital markets. Phys. A Stat. Mech. Its Appl. 2008, 387, 5543–5551. [Google Scholar] [CrossRef]
- Peng, J.; Liu, Z.; Liu, Y.; Wu, J.; Han, Y. Trend analysis of vegetation dynamics in Qinghai–Tibet Plateau using Hurst Exponent. Ecol. Indic. 2012, 14, 28–39. [Google Scholar] [CrossRef]
- Hurst, H.E. Long-term storage capacity of reservoirs. Trans. Am. Soc. Civ. Eng. 1951, 116, 770–799. [Google Scholar] [CrossRef]
- Mandelbrot, B.B.; Wallis, J.R. Robustness of the rescaled range R/S in the measurement of noncyclic long run statistical dependence. Water Resour. Res. 1969, 5, 967–988. [Google Scholar] [CrossRef]
- Dai, L.; Ke, X.; Guo, X.; Du, Y.; Zhang, F.; Li, Y.; Li, Q.; Lin, L.; Peng, C.; Shu, K.; et al. Responses of biomass allocation across two vegetation types to climate fluctuations in the northern Qinghai–Tibet Plateau. Ecol. Evol. 2019, 9, 6105–6115. [Google Scholar] [CrossRef] [PubMed] [Green Version]
- Zhang, J.; Liu, C.; Hao, H.; Sun, L.; Qiao, Q.; Wang, H. Spatial-temporal changes of carbon storage and carbon sink of grassland ecosystem in the Three-River Headwaters Region based on MODIS GPP/NPP data. Ecol. Environ. Sci. 2015, 24, 8–13. [Google Scholar]
- Ding, J.; Chen, L.; Ji, C.; Hugelius, G.; Li, Y.; Liu, L.; Qin, S.; Zhang, B.; Yang, G.; Li, F.; et al. Decadal soil carbon accumulation across Tibetan permafrost regions. Nat. Geosci. 2017, 10, 420–424. [Google Scholar] [CrossRef] [Green Version]
- Piao, S.; Fang, J.; He, J. Variations in vegetation net primary production in the Qinghai-Xizang Plateau, China, from 1982 to 1999. Clim. Chang. 2006, 74, 253–267. [Google Scholar] [CrossRef]
- Zhao, M.S.; Running, S.W. Drought-induced reduction in global terrestrial net primary production from 2000 through 2009. Science 2010, 329, 940–943. [Google Scholar] [CrossRef] [Green Version]
- Wang, S.; Duan, J.; Xu, G.; Wang, Y.; Zhang, Z.; Rui, Y.; Luo, C.; Xu, B.; Zhu, X.; Chang, X.; et al. Effects of warming and grazing on soil N availability, species composition, and ANPP in an alpine meadow. Ecology 2012, 93, 2365–2376. [Google Scholar] [CrossRef]
Publisher’s Note: MDPI stays neutral with regard to jurisdictional claims in published maps and institutional affiliations. |
© 2021 by the authors. Licensee MDPI, Basel, Switzerland. This article is an open access article distributed under the terms and conditions of the Creative Commons Attribution (CC BY) license (https://creativecommons.org/licenses/by/4.0/).