Article

Using BDS MEO and IGSO Satellite SNR Observations to Measure Soil Moisture Fluctuations Based on the Satellite Repeat Period

1
School of Geography, Nanjing Normal University, Nanjing 210023, China
2
College of Civil Engineering, Nanjing Forestry University, Nanjing 210037, China
3
Key Laboratory of Virtual Geographic Environment, Nanjing Normal University, Ministry of Education, Nanjing 210023, China
4
Jiangsu Center for Collaborative Innovation in Geographical Information Resource Development and Application, Nanjing 210023, China
5
School of Marine Science and Engineering, Nanjing Normal University, Nanjing 210023, China
*
Author to whom correspondence should be addressed.
Remote Sens. 2021, 13(19), 3967; https://doi.org/10.3390/rs13193967
Submission received: 23 August 2021 / Revised: 17 September 2021 / Accepted: 29 September 2021 / Published: 3 October 2021
(This article belongs to the Special Issue Beidou/GNSS Precise Positioning and Atmospheric Modeling)

Abstract

:
Soil moisture is an important geophysical parameter for studying terrestrial water and energy cycles. It has been proven that Global Navigation Satellite System Interferometry Reflectometry (GNSS-IR) can be applied to monitor soil moisture. Unlike the Global Positioning System (GPS) that has only medium earth orbit (MEO) satellites, the Beidou Navigation Satellite System (BDS) also has geosynchronous earth orbit (GEO) satellites and inclined geosynchronous satellite orbit (IGSO) satellites. Benefiting from the distribution of three different orbits, the BDS has better coverage in Asia than other satellite systems. Previous retrieval methods that have been confirmed on GPS cannot be directly applied to BDS MEO satellites due to different satellite orbits. The contribution of this study is a proposed multi-satellite soil moisture retrieval method for BDS MEO and IGSO satellites based on signal-to-noise ratio (SNR) observations. The method weakened the influence of environmental differences in different directions by considering satellite repeat period. A 30-day observation experiment was conducted in Fengqiu County, China and was used for verification. The satellite data collected were divided according to the satellite repeat period, and ensured the response data moved in the same direction. The experimental results showed that the BDS IGSO and MEO soil moisture estimation results had good correlations with the in situ soil moisture fluctuations. The BDS MEO B1I estimation results had the best performance; the estimation accuracy in terms of correlation coefficient was 0.9824, root mean square error (RMSE) was 0.0056 cm3cm−3, and mean absolute error (MAE) was 0.0040 cm3cm−3. The estimations of the BDS MEO B1I, MEO B2I, and IGSO B2I performed better than the GPS L1 and L2 estimations. For the BDS IGSO satellites, the B1I signal was more suitable for soil moisture retrieval than the B2I signal; the correlation coefficient was increased by 19.84%, RMSE was decreased by 42.64%, and MAE was decreased by 43.93%. In addition, the BDS MEO satellites could effectively capture sudden rainfall events.

1. Introduction

Soil moisture is a fundamental variable in the study of terrestrial water and energy cycles [1,2,3,4]. It is very important to obtain accurate and real-time soil moisture for climate research. Conventional soil moisture measurement methods include field measurement methods such as time-domain reflectometry (TDR) [5] and frequency-domain reflectometry (FDR), as well as remote sensing [4,6,7]. In recent years, in addition to traditional applications such as positioning, navigation, and timing (PNT), it has been found that GNSS reflected signals received by ordinary geodetic receivers could be used to monitor the geophysical parameters, including soil moisture [8,9], snow depth [10,11], vegetation water content [12,13], and significant wave height [14]. The technique has been termed Global Navigation Satellite System Interferometry Reflectometry (GNSS-IR). Since signal-to-noise ratio (SNR) oscillations are influenced by soil moisture around a GNSS receiver, GNSS-IR can obtain the soil moisture fluctuations by processing the SNR observations. This technology has higher spatial (40 m) and temporal resolution (1 day) as compared with in situ observations and remote sensing [6,15], and is suitable for wide applications due to its low cost and continuous observations as compared with field measurements [5,16].
Soil moisture retrieval based on SNR observations was first studied by Larson et al. [17,18]; they demonstrated that soil moisture can be obtained by the Global Positioning System (GPS) multipath signals. Chew et al. [9] further studied multipath modulation and proved that phase was the best proxy for describing linear soil moisture variations with a slope of 65.1° cm3cm−3, while amplitude and frequency had a suboptimal nonlinear relationship with soil moisture. Zavorotny et al. [8] described the electrodynamic model relationship between soil moisture and reflected signals to study the mechanism of SNR modulation caused by soil moisture variations, and proposed recommendations for improving the performance of bare soil moisture retrievals using GPS multipath modulation. Moreover, Chew et al. [19] presented a method to determine whether SNR data were influenced by vegetation and established a soil moisture retrieval model for bare and vegetated soil. The algorithm significantly improved the agreement between estimated soil moisture and in situ measurements where vegetation had a non-negligible impact effect. Small et al. [20] further compared the performance of three different retrieval algorithms which represented vegetation effects with different degrees of complexity. The results showed the algorithm that simply corrected for the vegetation had a better performance even in the case of low vegetation water content. In addition, Yang et al. [21] discussed single-satellite soil moisture retrieval based on the Beidou Navigation Satellite System (BDS) medium earth orbit (MEO) and inclined geosynchronous satellite orbit (IGSO) SNR observations. They confirmed that both the previous phase method and the interference method were still applicable to BDS MEO and IGSO satellites, and the BDS B1 and B2 signals were as sensitive to surface geometry as those of GPS. Ban et al. [22] proposed a soil moisture estimation approach based on BDS geosynchronous earth orbit (GEO) SNR observations. Even though the GEO results had good consistency among different GEO satellites, the GEO estimation performance was worse than GPS.
On 31 July 2020, the third generation of BDS (BDS-3) was officially completed and put into operation. The BDS has become one of the most important satellite navigation systems worldwide. The BDS consists of MEO, GEO, and IGSO satellites which provide better coverage of satellites in Asia than other satellite navigation systems [23]. In this context, research on GNSS-IR based on the BDS is significant. However, due to the different orbits of BDS MEO, IGSO, and GPS satellites, previous multi-satellite soil moisture retrieval methods which have confirmed on GPS cannot be directly applied to BDS MEO satellites.
In this study, a method to measure soil moisture fluctuations based on BDS MEO and IGSO satellites was proposed. Satellite repeat periods were calculated to select the initial SNR observations. Then, a second-order function was used to describe the single-satellite track model, and the multi-satellite model was established based on the correlation between the single-satellite track model estimations and soil moisture. The structure of this article is as follows: In Section 2, we describe the theory of soil moisture retrieval based on GNSS-IR, the calculation method for satellite repeat period, and the proposed multi-satellite retrieval methods of BDS MEO and IGSO satellites; then, in Section 3, we describe and show the experimental results from Fengqiu County, China; and finally, the discussions and conclusions are provided in Section 4.

2. Background

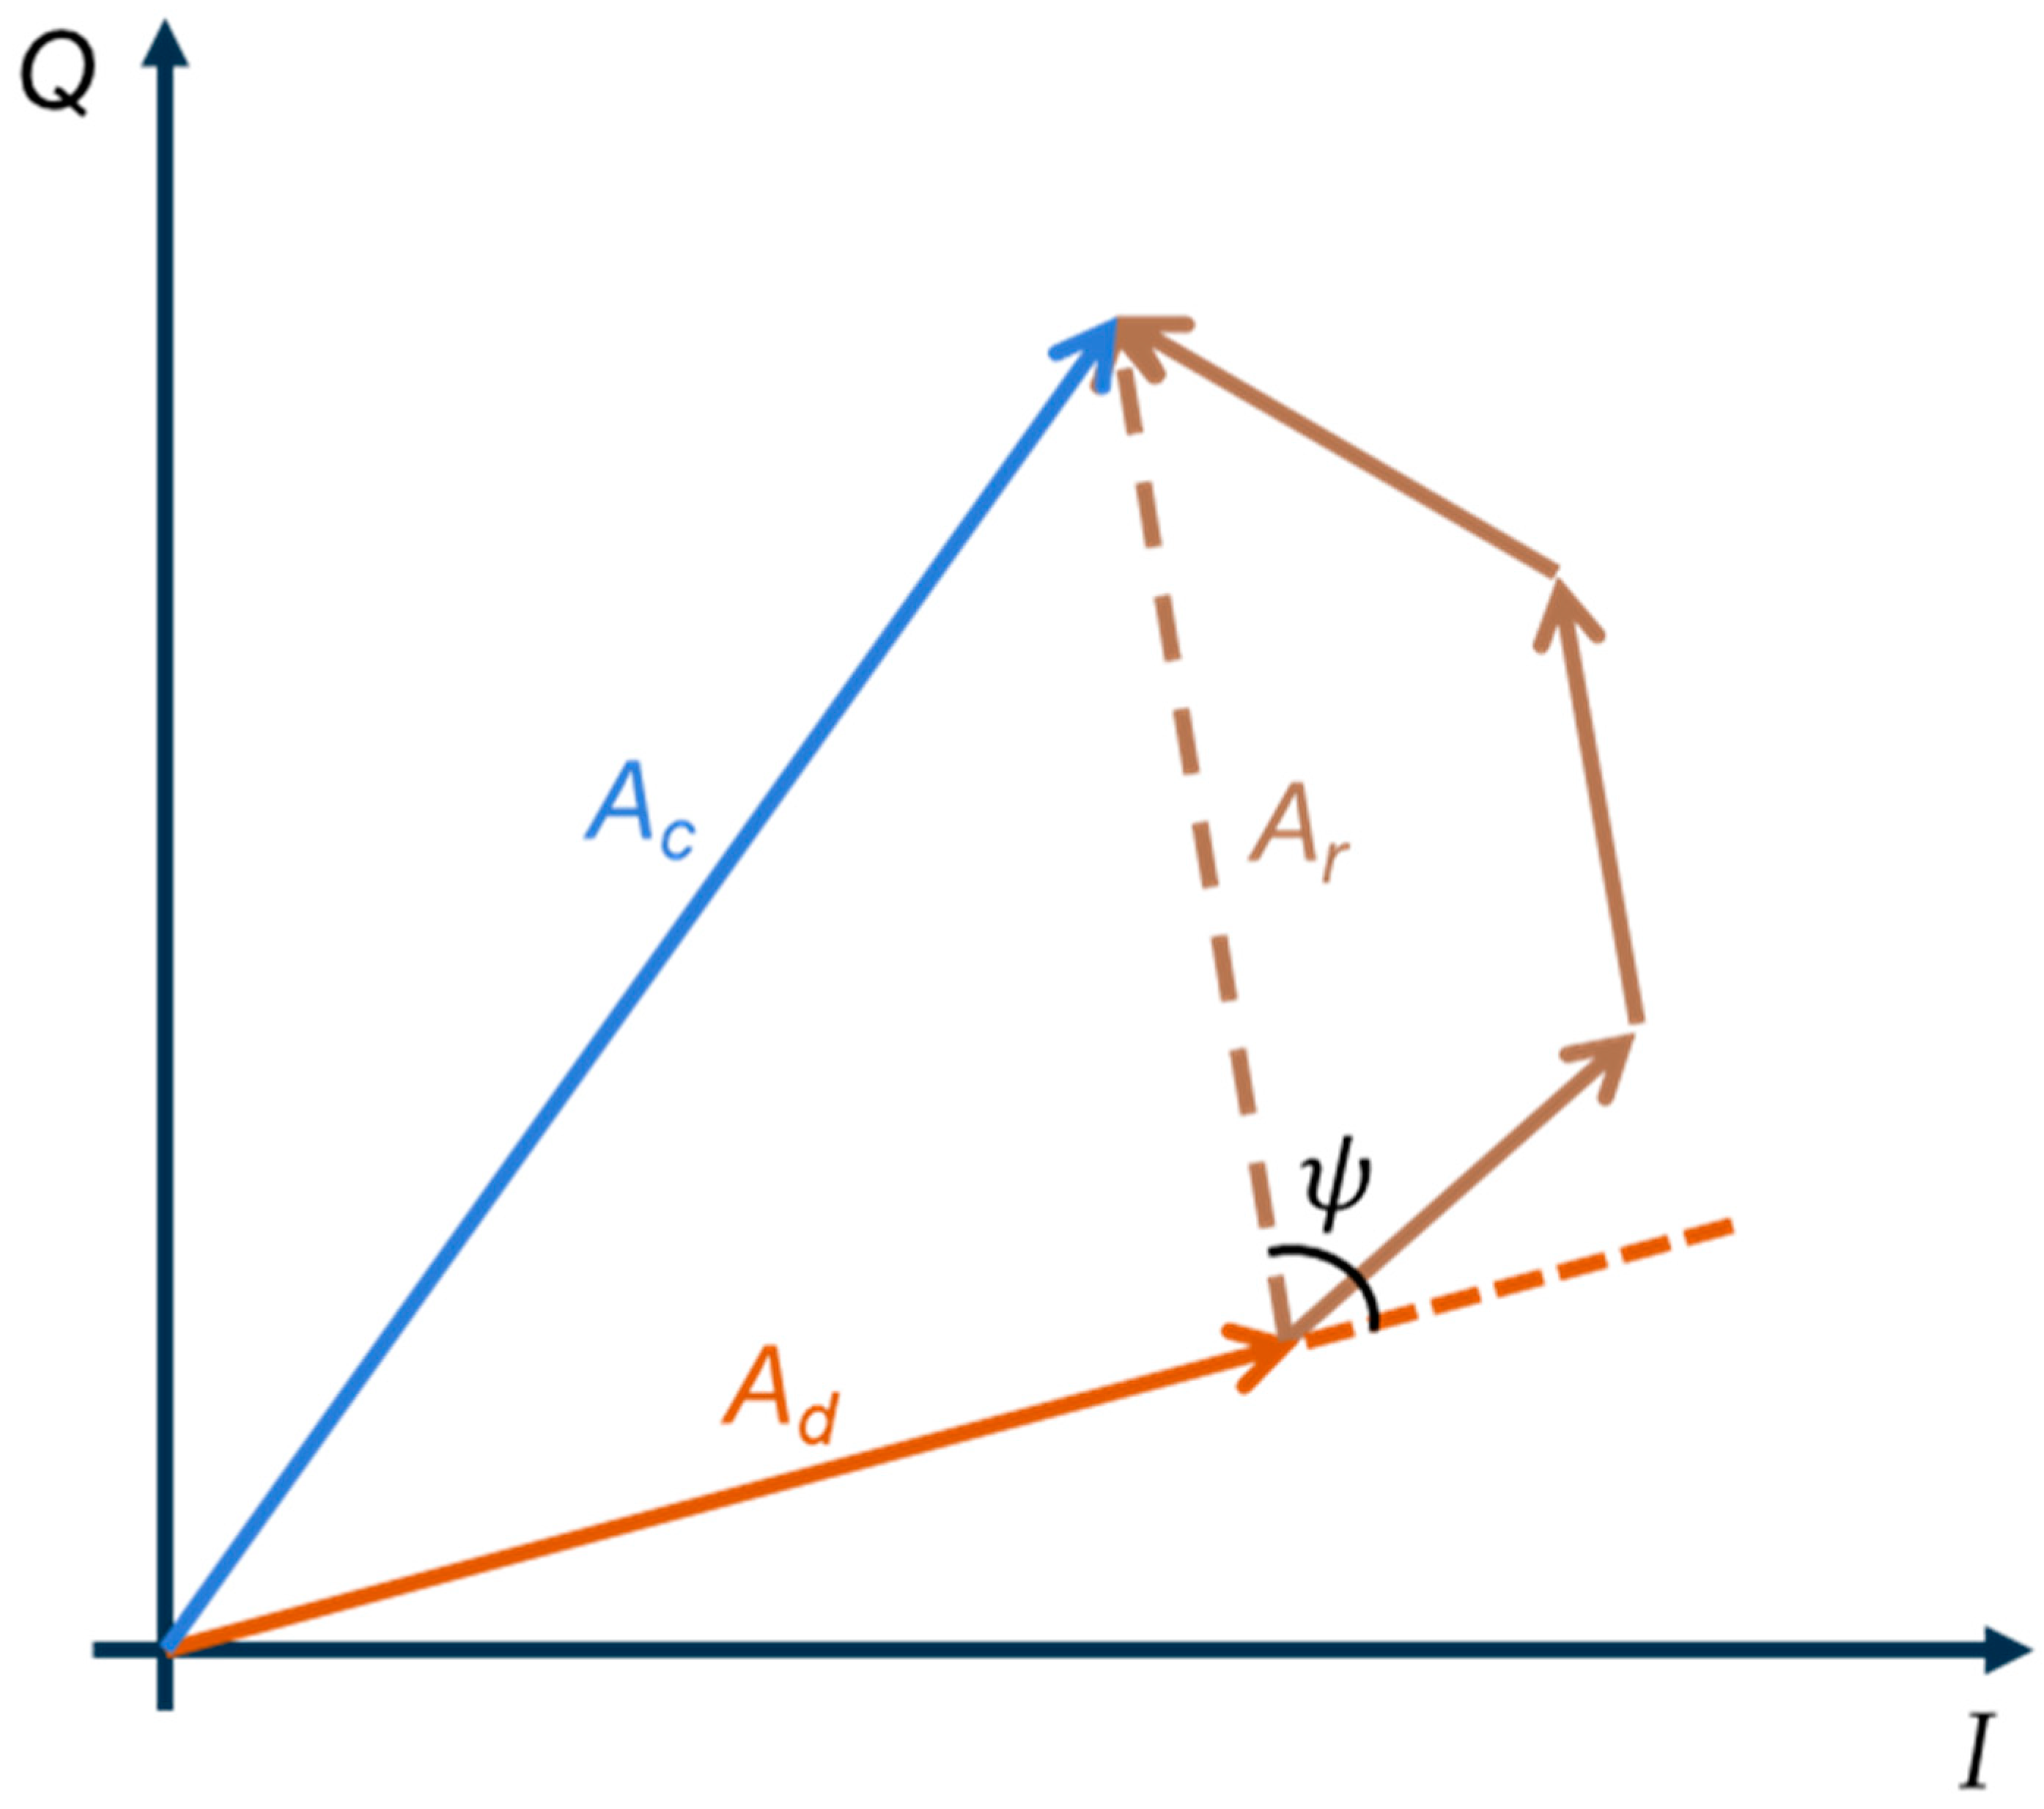
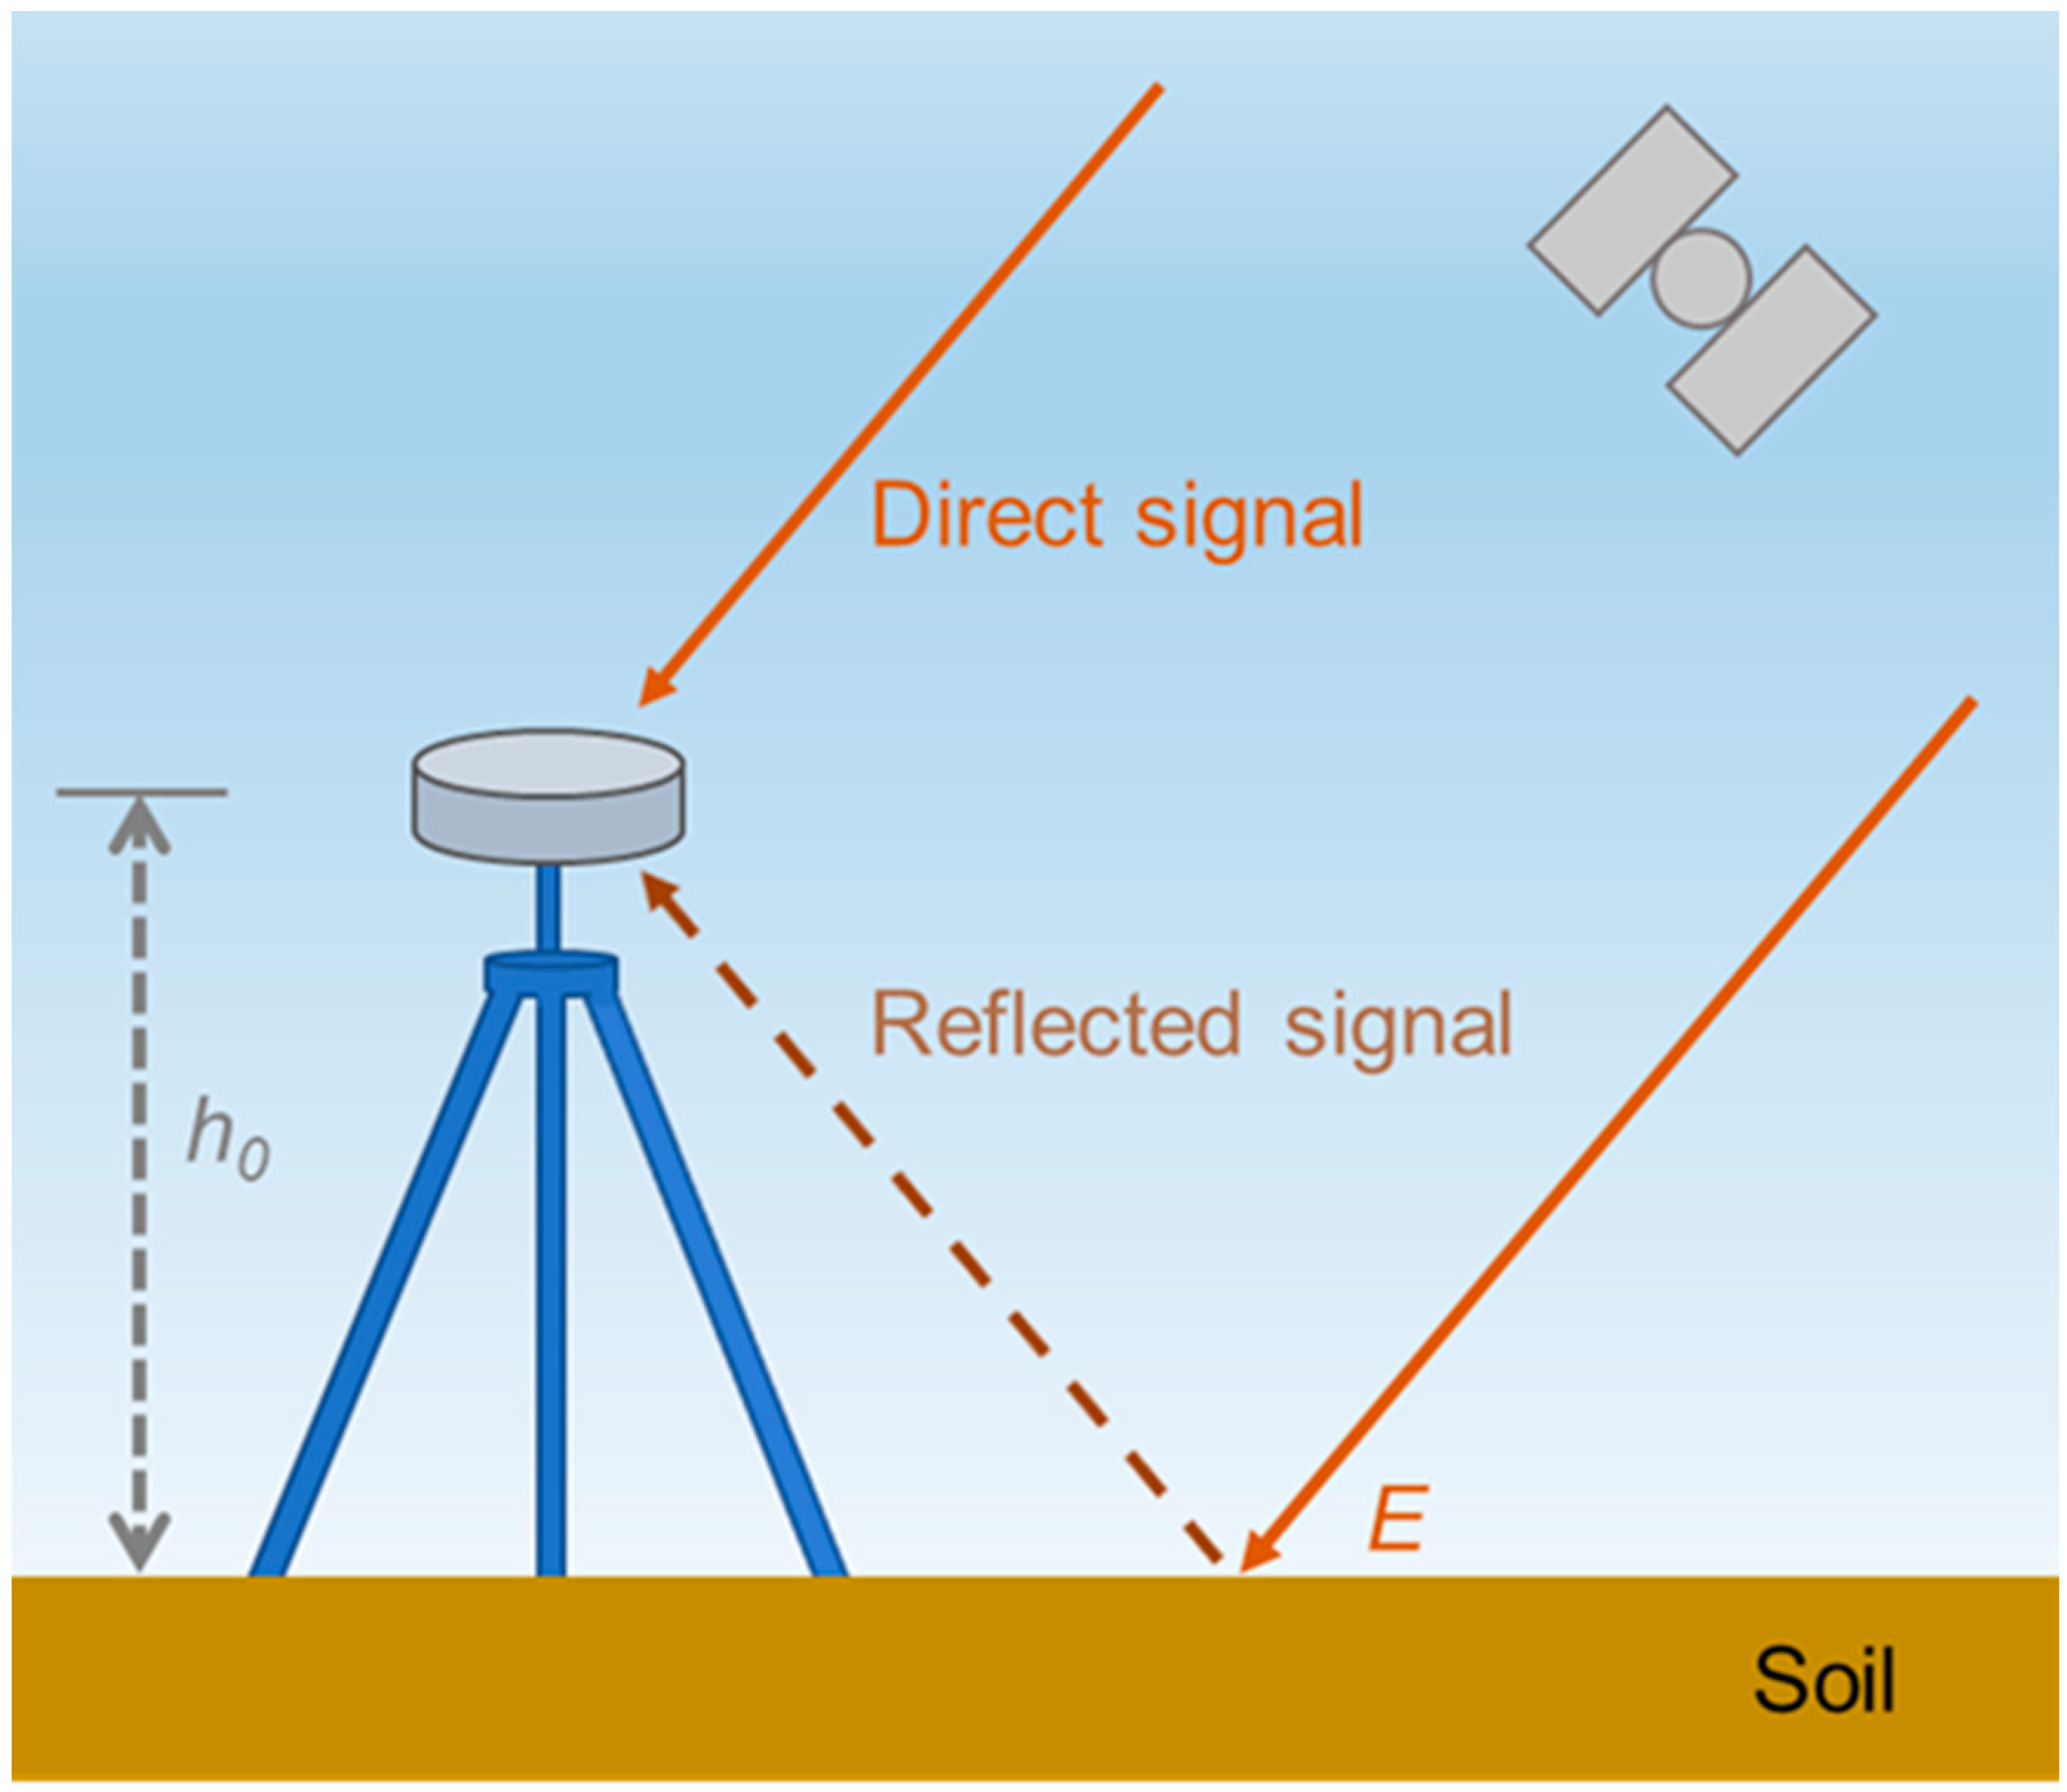
2.1. Soil Moisture Retrieval Theory

SNR oscillations are caused by interference of direct and reflected GNSS signals, which are more intense at low satellite elevations due to strong reflected signals. Soil permittivity is related to soil moisture, which changes ground reflectivity and affects interference. Therefore, soil moisture can be retrieved through SNR. The relationship between SNR and signals can be expressed by the following formula and is illustrated in Figure 1 [16]:
S N R 2 A c 2 = A d 2 + A r 2 + 2 A d A r cos ψ
where A c denotes the amplitude of the composite signal recorded by the receiver; A d and A r denote the amplitudes of the direct and reflected signals, respectively; and ψ denotes the phase difference between the two signals.
On an approximately horizontal surface, the typical multipath reflection geometry of GNSS-IR is shown in Figure 2. The residual SNR multipath interferogram S N R m p i , which has removed the direct signal from SNR using a low-order polynomial, can be expressed as follows [9]:
S N R m p i = A m p i cos ( 4 π h 0 λ sin E + φ m p i )
where A m p i and φ m p i denote the amplitude and phase shift, respectively; h 0 denotes the priori reflector height; λ denotes the carrier wavelength; and E  denotesthe elevation angle. Note that the S N R m p i model is characterized based on the satellite track, not the satellite.
Previous studies have shown that phase shift φ m p i is strongly correlated with soil moisture. In this study, a second-order function is used to describe the relationship as follows:
S M C = a 2 φ m p i + b φ m p i + c
where S M C denotes the soil moisture content and a , b , and c are constants. Note that the above theory is only suitable for flat ground, and it is different on sloping ground.

2.2. Satellite Repeat Period

Some satellites (e.g., all GPS satellites) appear in the same position in the sky within a time period, which we refer to as the satellite repeat period [24]. For GPS satellites, the satellite repeat period is about 1 day, which means each satellite track of GPS satellites appears in the same direction every day. In a traditional GPS soil moisture retrieval model presented by Larson et al. [18], the same satellite track was used every day to establish the model, although it did not need to consider this influence on the model due to the special satellite repeat period (about 1 day) of GPS. However, for other satellites that do not repeat every day, satellite tracks in two adjacent days may not appear in the same direction, and therefore they may be influenced by different environments if the previous model was used.
The orbital period, T , refers to the time required for the same satellite to pass through the same location twice in a row, and can be expressed by:
T = 2 π G M a 3 + Δ n
where a denotes the semimajor axis, Δ n denotes the correction to the mean motion, G denotes the gravitational constant, M denotes the Earth’s mass, and G M = 1.996498 × 10 7 m 2 / k g . If the influence of the Earth’s revolution around the sun and satellite orbit precession are not taken into consideration, the number of times that the satellite orbits the earth per day, Q , can be expressed by:
Q = T 1 T
where T 1 denotes the period of Earth’s rotation and is equal to 1 sidereal day. Then, Q can be expressed as a fraction:
Q = I + K D
where I , K , and D are integers. When K and D are relatively prime, the approximate satellite repeat period is equal to D . However, even for GPS satellites that are all MEO satellites, the values of a are not exactly the same, and the values of K and D need to be determined by the search and test process [25]. Note that the value of D is an approximate satellite repeat period, and the difference with the real satellite repeat period is the satellite repeat shift time, which is several minutes [25]. Since it only needs to determine which days the satellite tracks are in the same direction, it is only necessary to calculate the approximate repeat period. Table 1 gives the approximate satellite repeat periods of GPS and BDS satellites.

2.3. Multi-Satellite Retrieval Methods of BDS MEO and IGSO Satellites
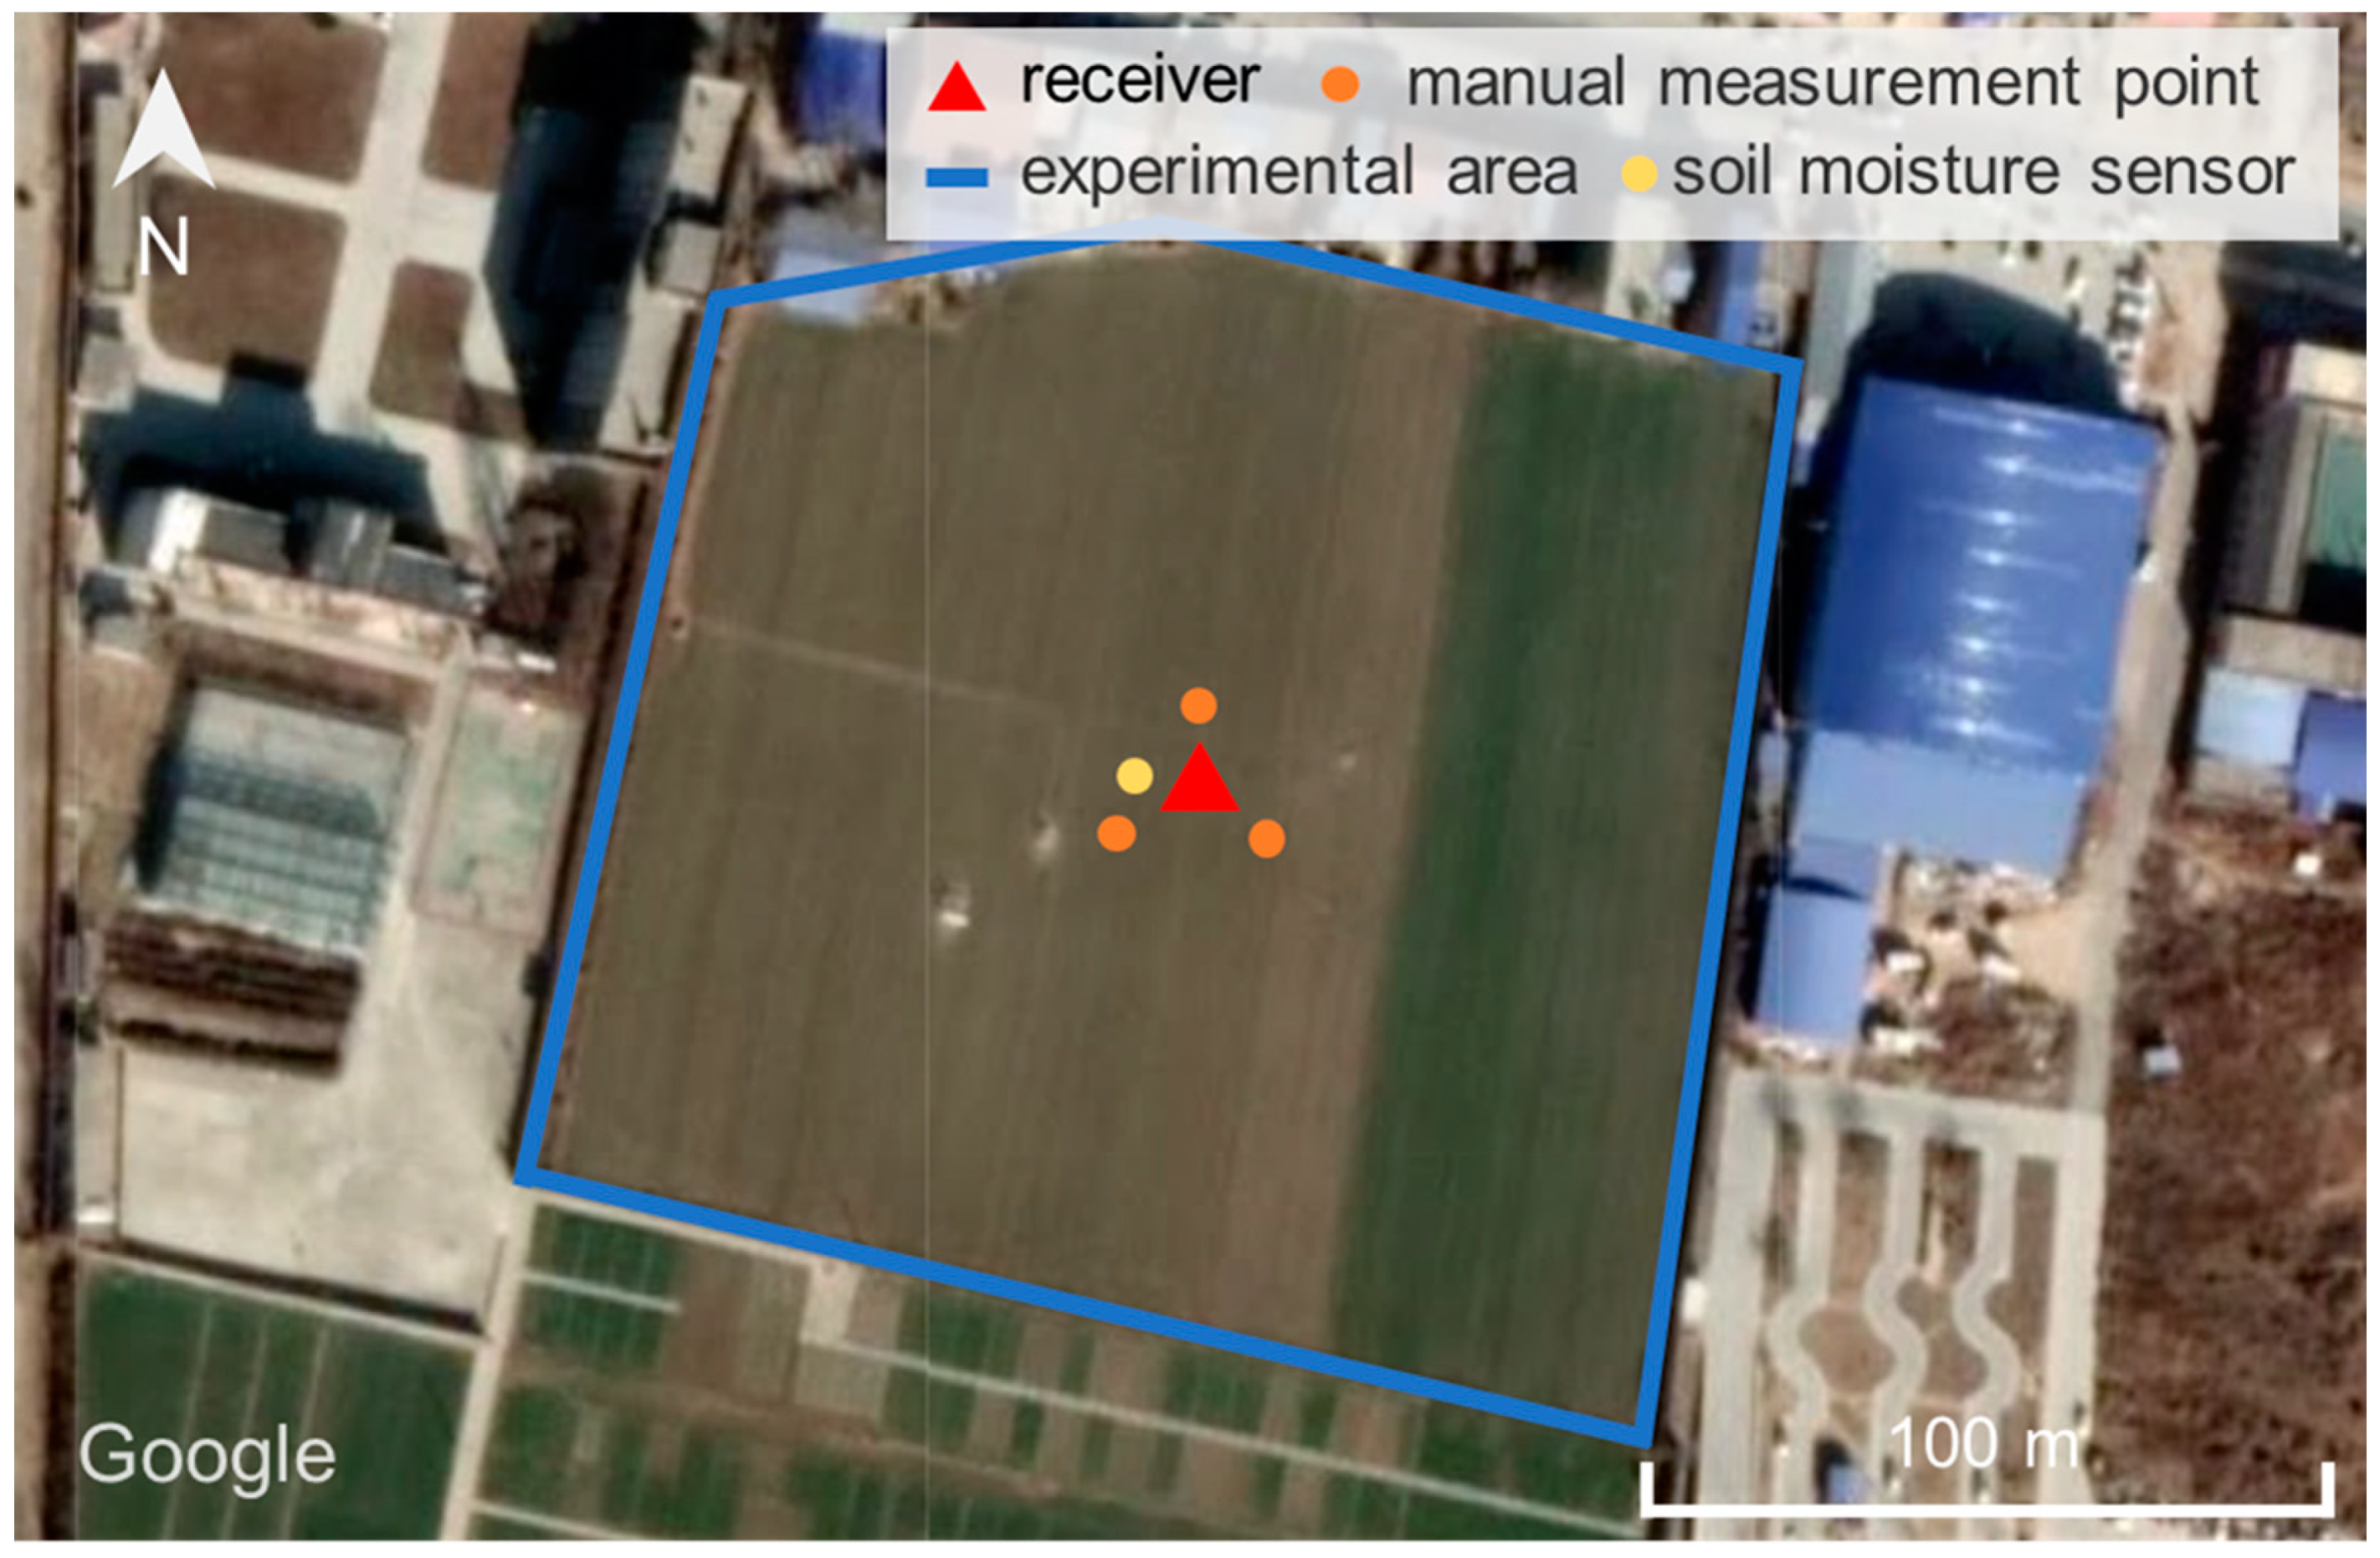
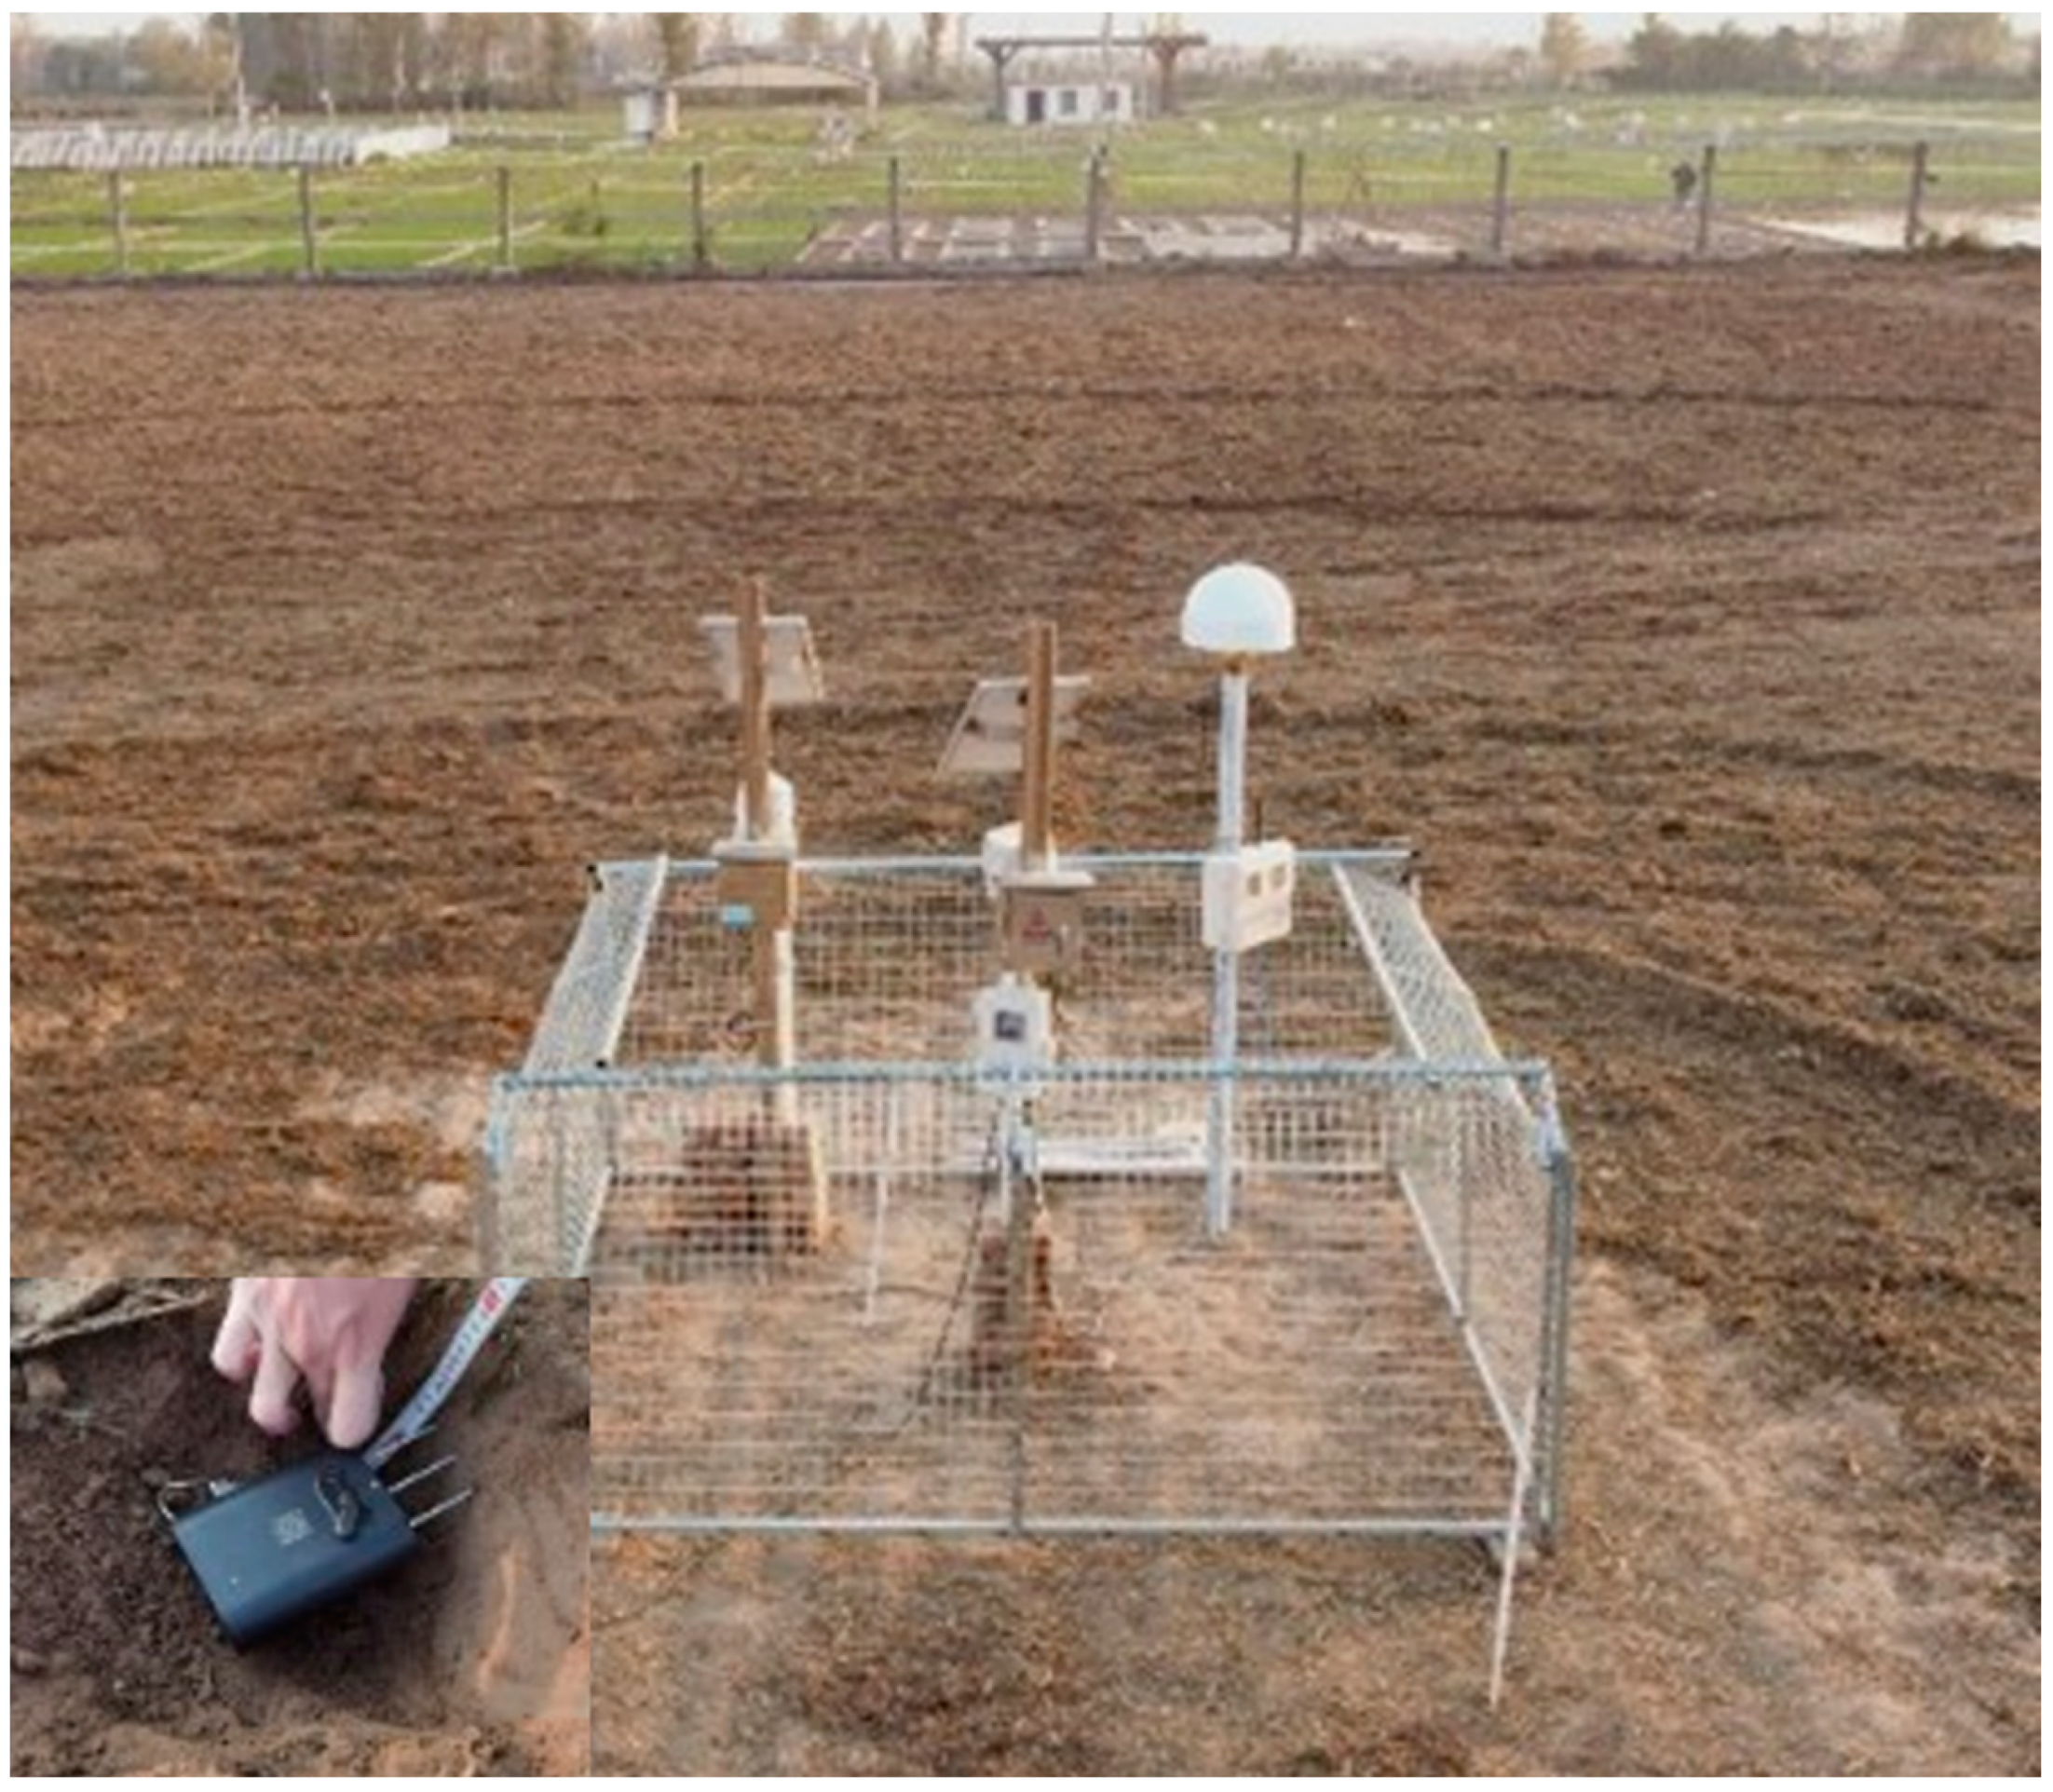
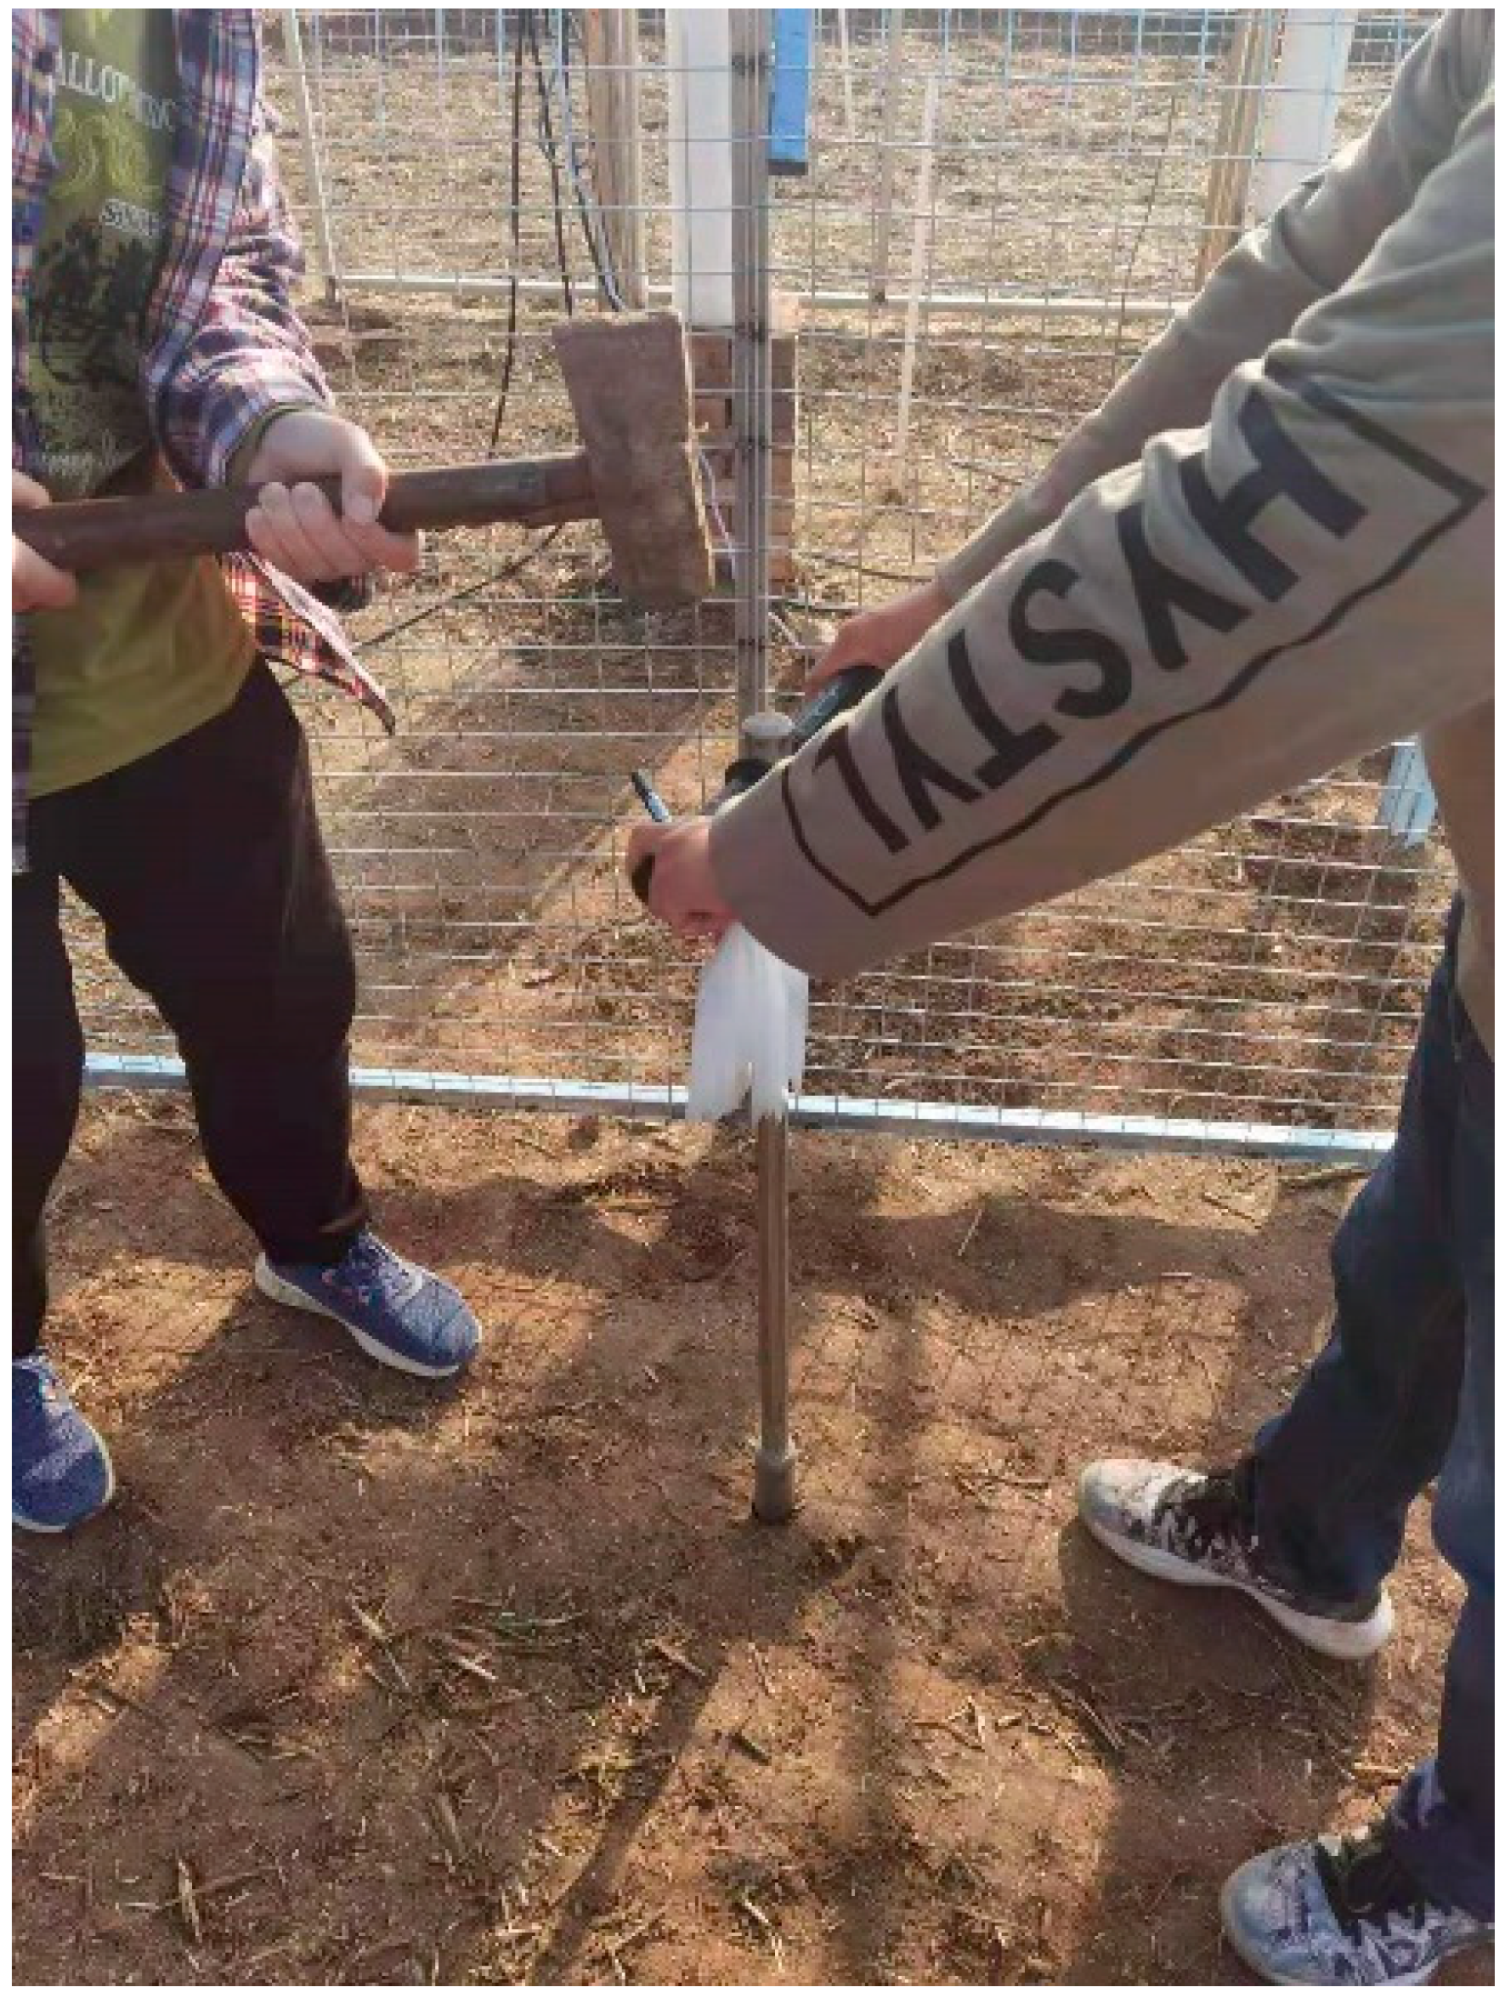
Different satellites have different positions relative to the station, and reflect soil moisture variations in different directions. Since the satellite is in motion, the position of the satellite is different at any time. In order to avoid the influence of different environments, it is necessary to build the retrieval model based on the approximate satellite repeat period, which can guarantee that the data used from a satellite track (i.e., SNR observations) are all responses in the same direction. Here, we describe the multi-satellite retrieval methods of BDS MEO and IGSO satellites.
Suppose there is a sequence of reflected signals:
{ S N R m p i ( s , t , d m ) }
where S N R m p i indicates the residual SNR multipath interferogram, s is the satellite number, t is the satellite track number, and d m is the day sequences involved in the calculation. After adding the satellite repeat period to the consideration, d m can be expressed as:
m { 1 , 2 , , T A R P } , d m = { m + n T A R P } , n { 0 , 1 , 2 , , N }
where T A R P denotes the approximate satellite repeat period and N is related to the sequence size. Similarly, the phase shift sequences, φ m p i , can be expressed as:
{ φ m p i ( s , t , d m ) }
Then, the phase shift sequences, φ m p i , need to be normalized as follows:
φ n o r m ( s , t , d m ) = { φ m p i ( s , t , d m ) Z ( s , t , d m ) }
where φ n o r m denotes the normalized phase shift sequences and Z denotes the normalized reference value which uses the median of φ m p i :
Z ( s , t , d m ) = m e d i a n ( φ m p i ( s , t , d m ) )
Then, the single-satellite track soil moisture retrieval models can be established based on the relationship between φ n o r m and the soil moisture content:
E S M C ( s , t , d m ) = F ( φ n o r m ( s , t , d m ) )
where E S M C denotes the estimated soil moisture content by each satellite track, and this step is the same as Formula (3). Finally, the multi-satellite soil moisture retrieval model can be established as follows:
S M C ( d m ) = s = 1 t = 1 m = 1 ( E S M C ( s , t , d m ) w ( s , t , d m ) )
w ( s , t , d m ) = R 2 ( s , t , d m ) s = 1 t = 1 m = 1 R 2 ( s , t , d m )
where S M C denotes the estimated multi-satellite soil moisture content, w is the weight of E S M C , and R is the correlation coefficient between E S M C and the soil moisture content. The environment and soil conditions in different directions of the GNSS station may be different, and the usage of weight is to reduce the effects of bad satellite tracks which are affected by interference and environmental noise. When T A R P = 1 , the model is a traditional retrieval model suitable for GPS satellites.
The steps of BDS multi-satellite soil moisture retrieval are shown in Figure 3. The SNR observations are, first, classified according to the satellite repeat period, d m , and the corresponding normalized phase shift sequences are calculated. Then, the single-satellite track retrieval models are built respectively and correlation coefficients between the estimations and soil moisture are calculated. Finally, the multi-satellite track retrieval model is established based on the above correlation coefficients.

3. Experiment

An experimental site was set up in Fengqiu County, Henan Province, China (latitude 35°01′34″ and longitude 114°33′30″). The surrounding environment and experimental equipment are shown in Figure 4 and Figure 5. The receiver was installed on flat ground. Winter wheat had just been sown in the soil and was in a dormant period. During the measurement period, there was no vegetation growth, and the soil was be considered to be bare soil. The experimental area was approximately a square with side lengths of 160 m; therefore, the reflected signal was not affected by surrounding houses and other ground surfaces. A Sino M300 Pro Ⅱ receiver and antenna were used to collect the GNSS signals. The receiver coulf track BDS B1I, BDS B2I, GPS L1, and GPS L2 signals; however, it could only record the B2I signal from some satellites due to equipment limitations. In this experiment, we tracked and recorded data with an elevation ranging from 5 to 25 degrees. The soil moisture sensor was installed at 5 cm depth and provided soil moisture values at two-hour intervals. The experiment lasted 30 days, from day of year (DOY) 26–55 in 2021, and three rainfall events occurred. In addition, in order to ensure the soil moisture measured by the sensor was reliable, we used 10 days of manual measurement data (which could be regarded as the true soil moisture) to calibrate the soil moisture. Figure 6 shows a photograph of the manual measurement of soil moisture.
It is important to note that, although the sampling frequency of the soil moisture sensor was 2 h, we aggregated the daily soil moisture (i.e., we used the average of 12 values per day). This can be easily explained, since, although using the two-hour scale soil moisture data closest to the satellite observation time is more accurate, it would have been difficult to compare using the results obtained by these satellites because the satellite repeat observation times were not the same each day for all satellites. Therefore, we averaged the soil moisture per day and used it as the actual soil moisture variations. In fact, the soil moisture variation in a single day was very small without rainfall, and it hardly affected the results. When the rainfall events occurred, it was difficult to accurately measure the actual soil moisture that determined the reflected signal due to the seepage speed of rain and the soil heterogeneity. This is another reason why we chose daily soil moisture.

4. Results

Following the steps shown in Figure 3, we compared the normalized phase shift sequences, single-satellite track soil moisture estimations, and multi-satellite soil moisture estimations, as described below. In addition, GPS results were calculated for further comparisons.

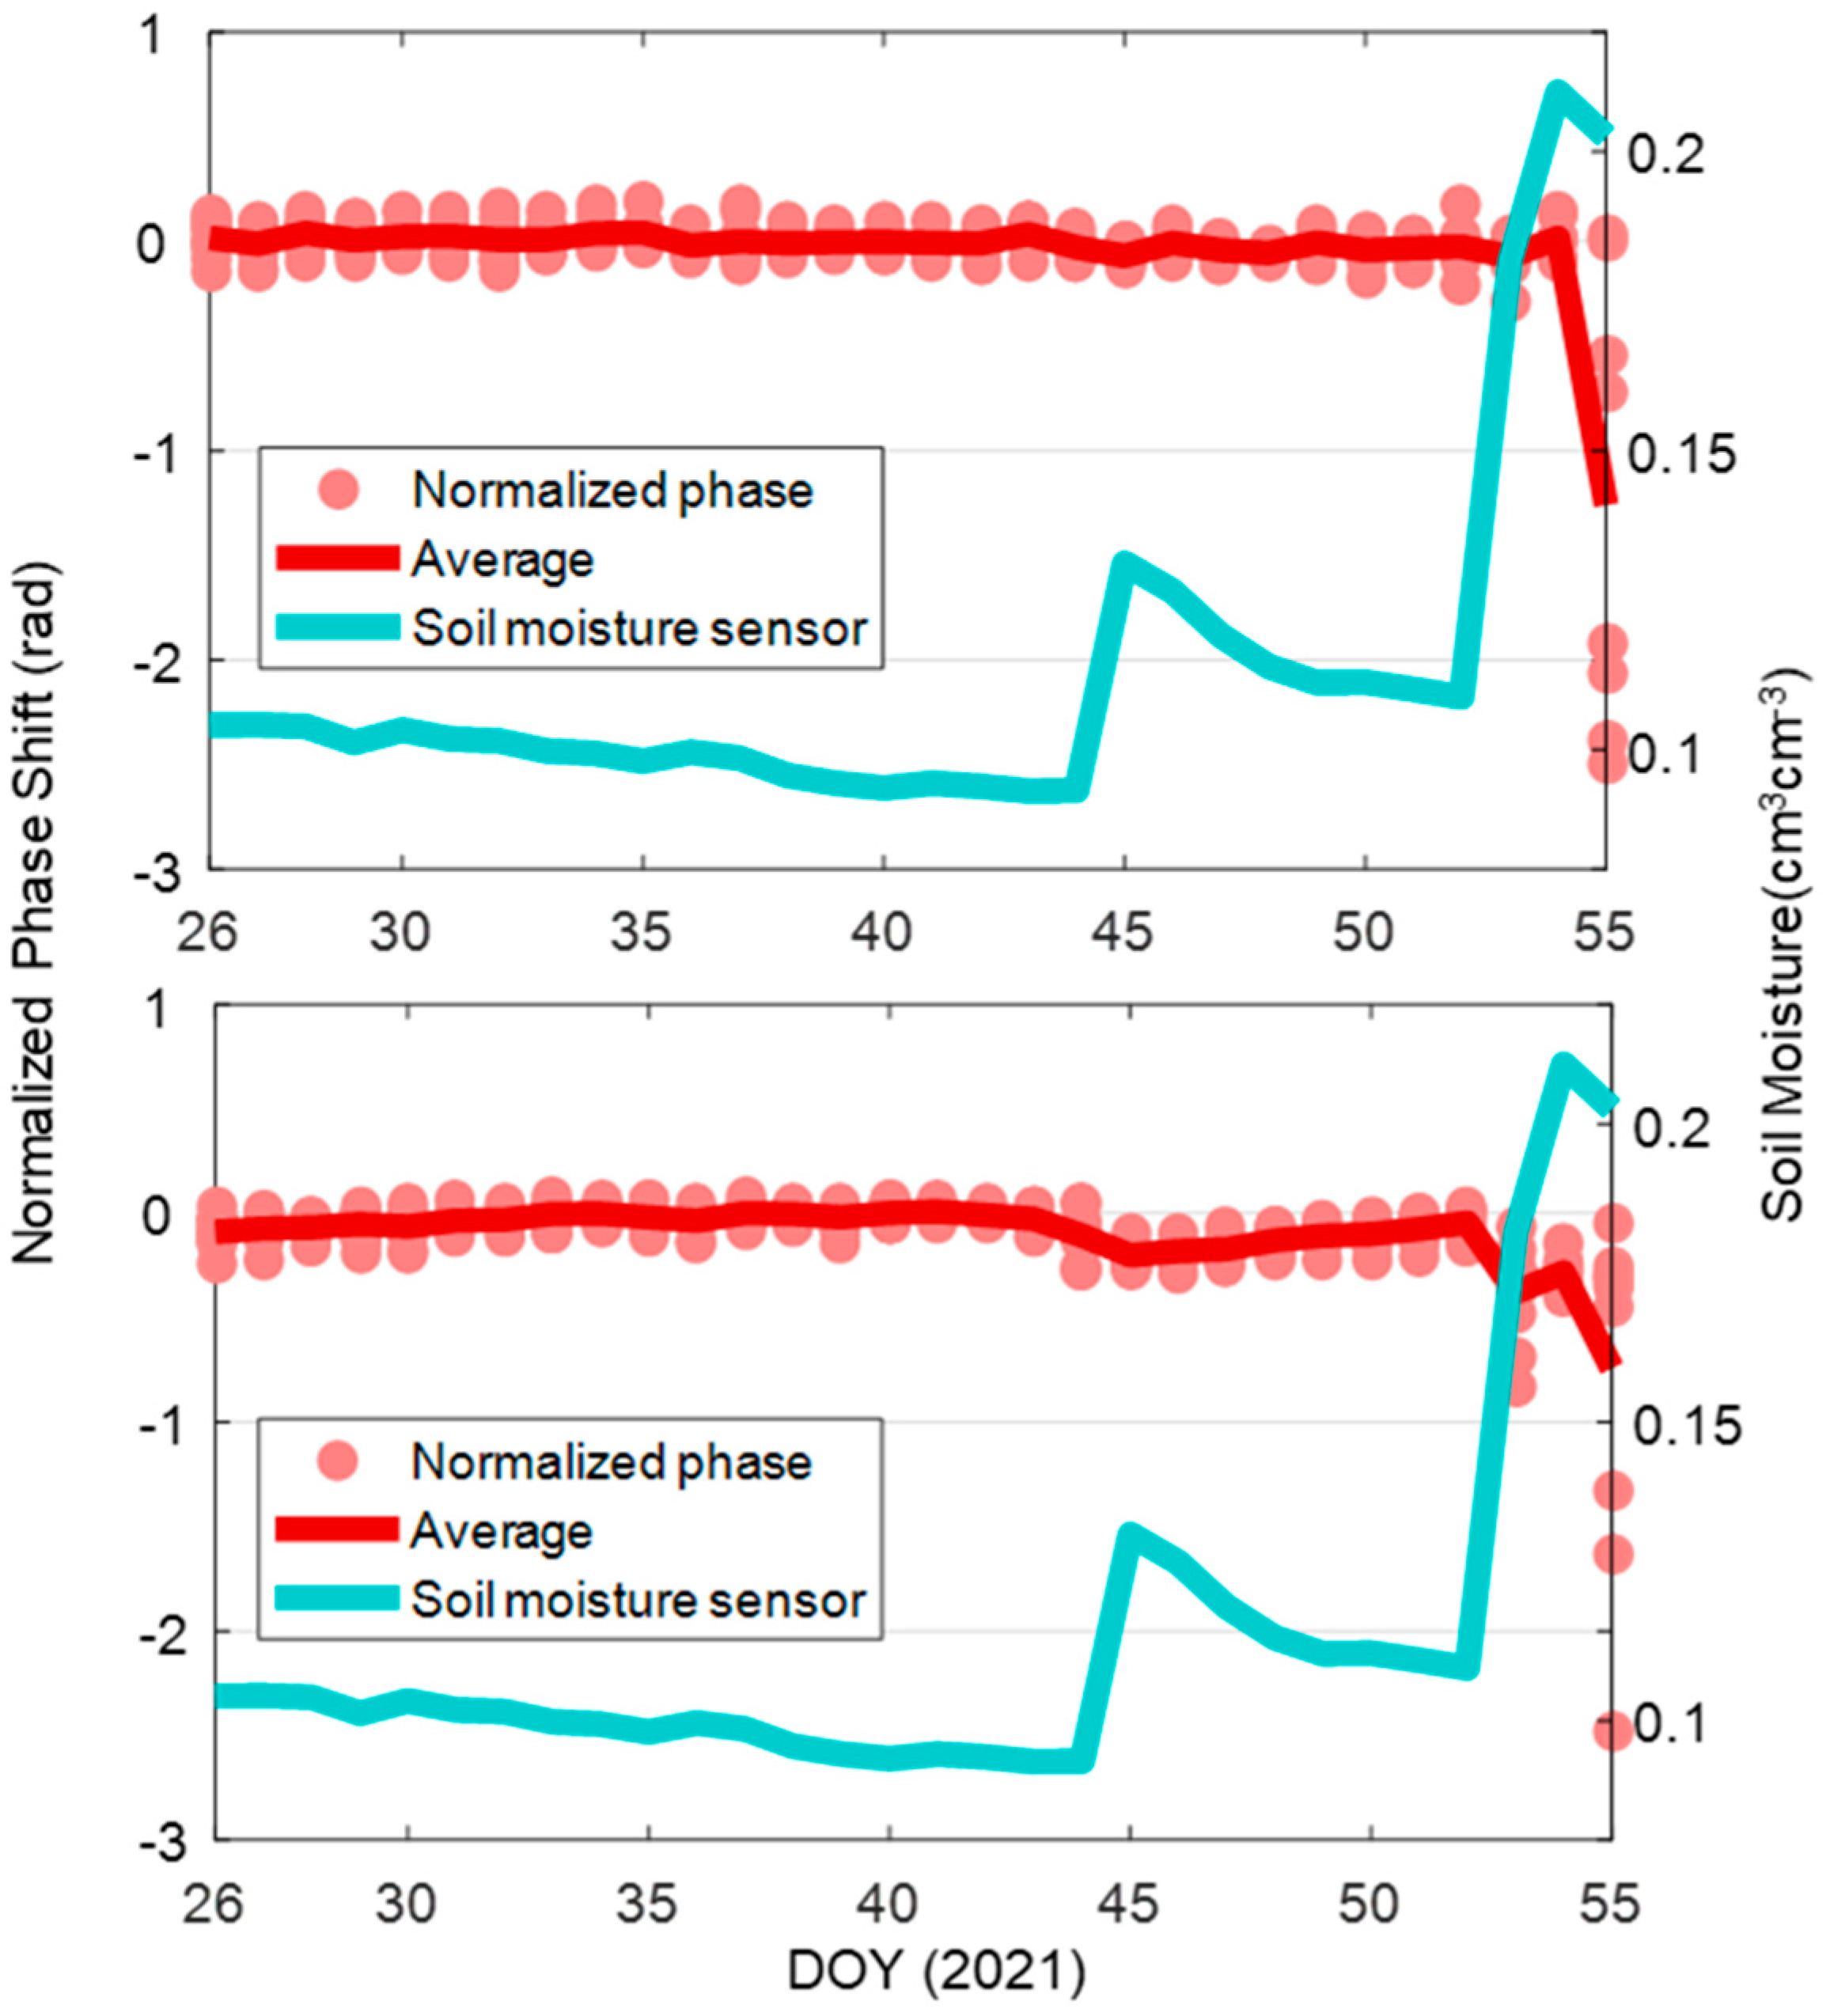
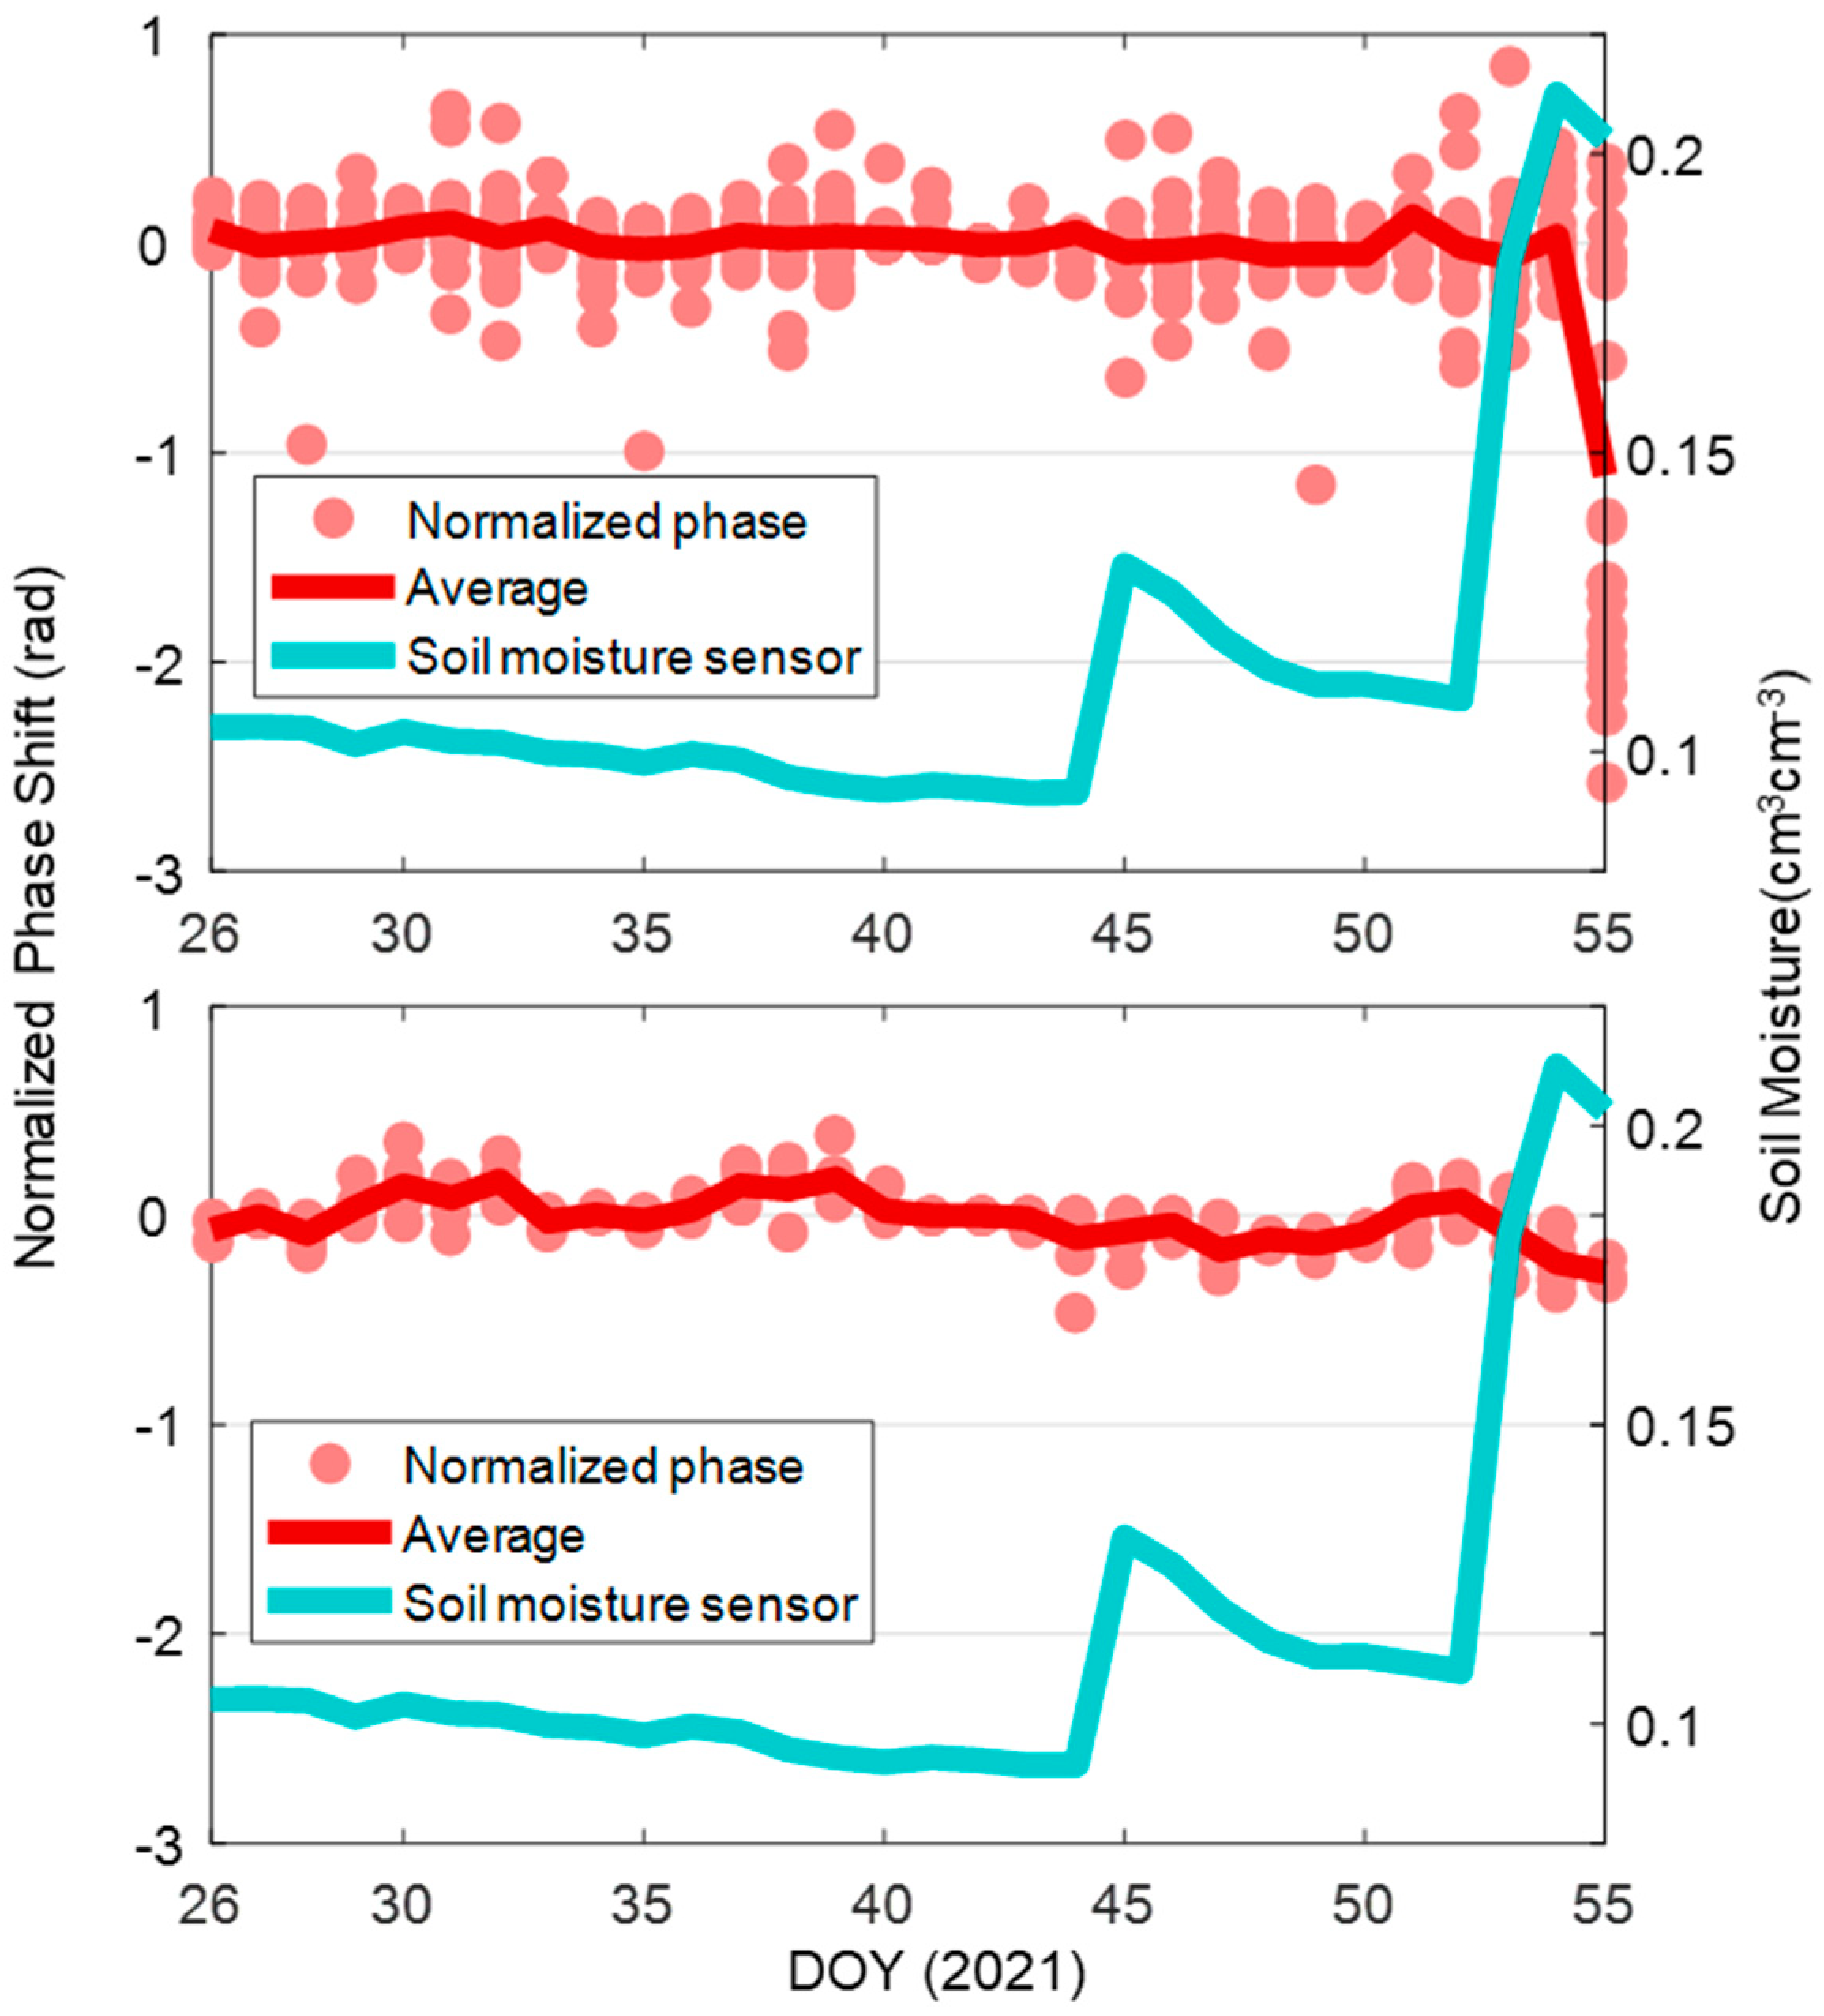
4.1. Comparison of Normalized Phase Shift Sequences

According to Formula (8), the phase shift sequences need to be normalized, and then a second-order function is used to build the ESMC model. The correlations between the normalized phase shift sequences and soil moisture are shown in Figure 7. Regarding the two selected satellites, the results of C12 B1I achieve the highest correlation (R = −0.9730), and the normalized phase shift sequences of all results are negatively correlated with soil moisture. For the IGSO C06 satellite, the correlation of B2I results is 4.84% higher than that of B1I, while it is the opposite for the MEO C12 satellite. The results suggest that the normalized phase shift sequences are sensitive to soil moisture variations. However, the phase values of C06 are unstable when the soil moisture is high, which may be caused by a rainfall event.
Figure 8 shows the normalized phase shift sequences of all the IGSO satellite tracks and the phase shift average results. During the experimental period, three rainfall events occurred, and the soil moisture changed significantly on DOY 45, 53, and 54. The IGSO B1I and B2I phase shift results both show a good correlation with drastic changes in soil moisture. When soil moisture increases about 0.1 cm3cm−3 on DOY 53–54, both B1I and B2I phase shift average results decrease about 1.2 rad and 0.6 rad, respectively; however, when the soil moisture only rises insignificantly (i.e., DOY 45), the IGSO B1I phase shift hardly changes, while the B2I phase shift has a clear downward trend. Similar to the result of C06 in Figure 7, the phase shift of C06 is also unstable on DOY 55. It further proves that a rainfall event increases the uncertainty of the phase shift. In addition, the normalized phase shift average results of BDS MEO and IGSO satellites are negatively correlated with soil moisture, which is similar to the GPS satellites in the previous studies.
However, it may have a significant difference for BDS MEO satellites. Figure 9 shows the normalized phase shift of all the MEO satellite tracks and the average phase shift results. Unlike the phase shift result of IGSO, the phase shift of BDS MEO is more discrete, and there seems to be no connections between the B2I phase shift sequences and soil moisture, which may be caused by the difference in the normalized reference value level of Z in Formula (8). The soil moisture corresponding to the normalized reference value of each IGSO satellite phase shift sequence is almost the same, while this is different for MEO because each of the MEO satellites contains various data days. Therefore, it is necessary to estimate the soil moisture based on each phase shift sequence.

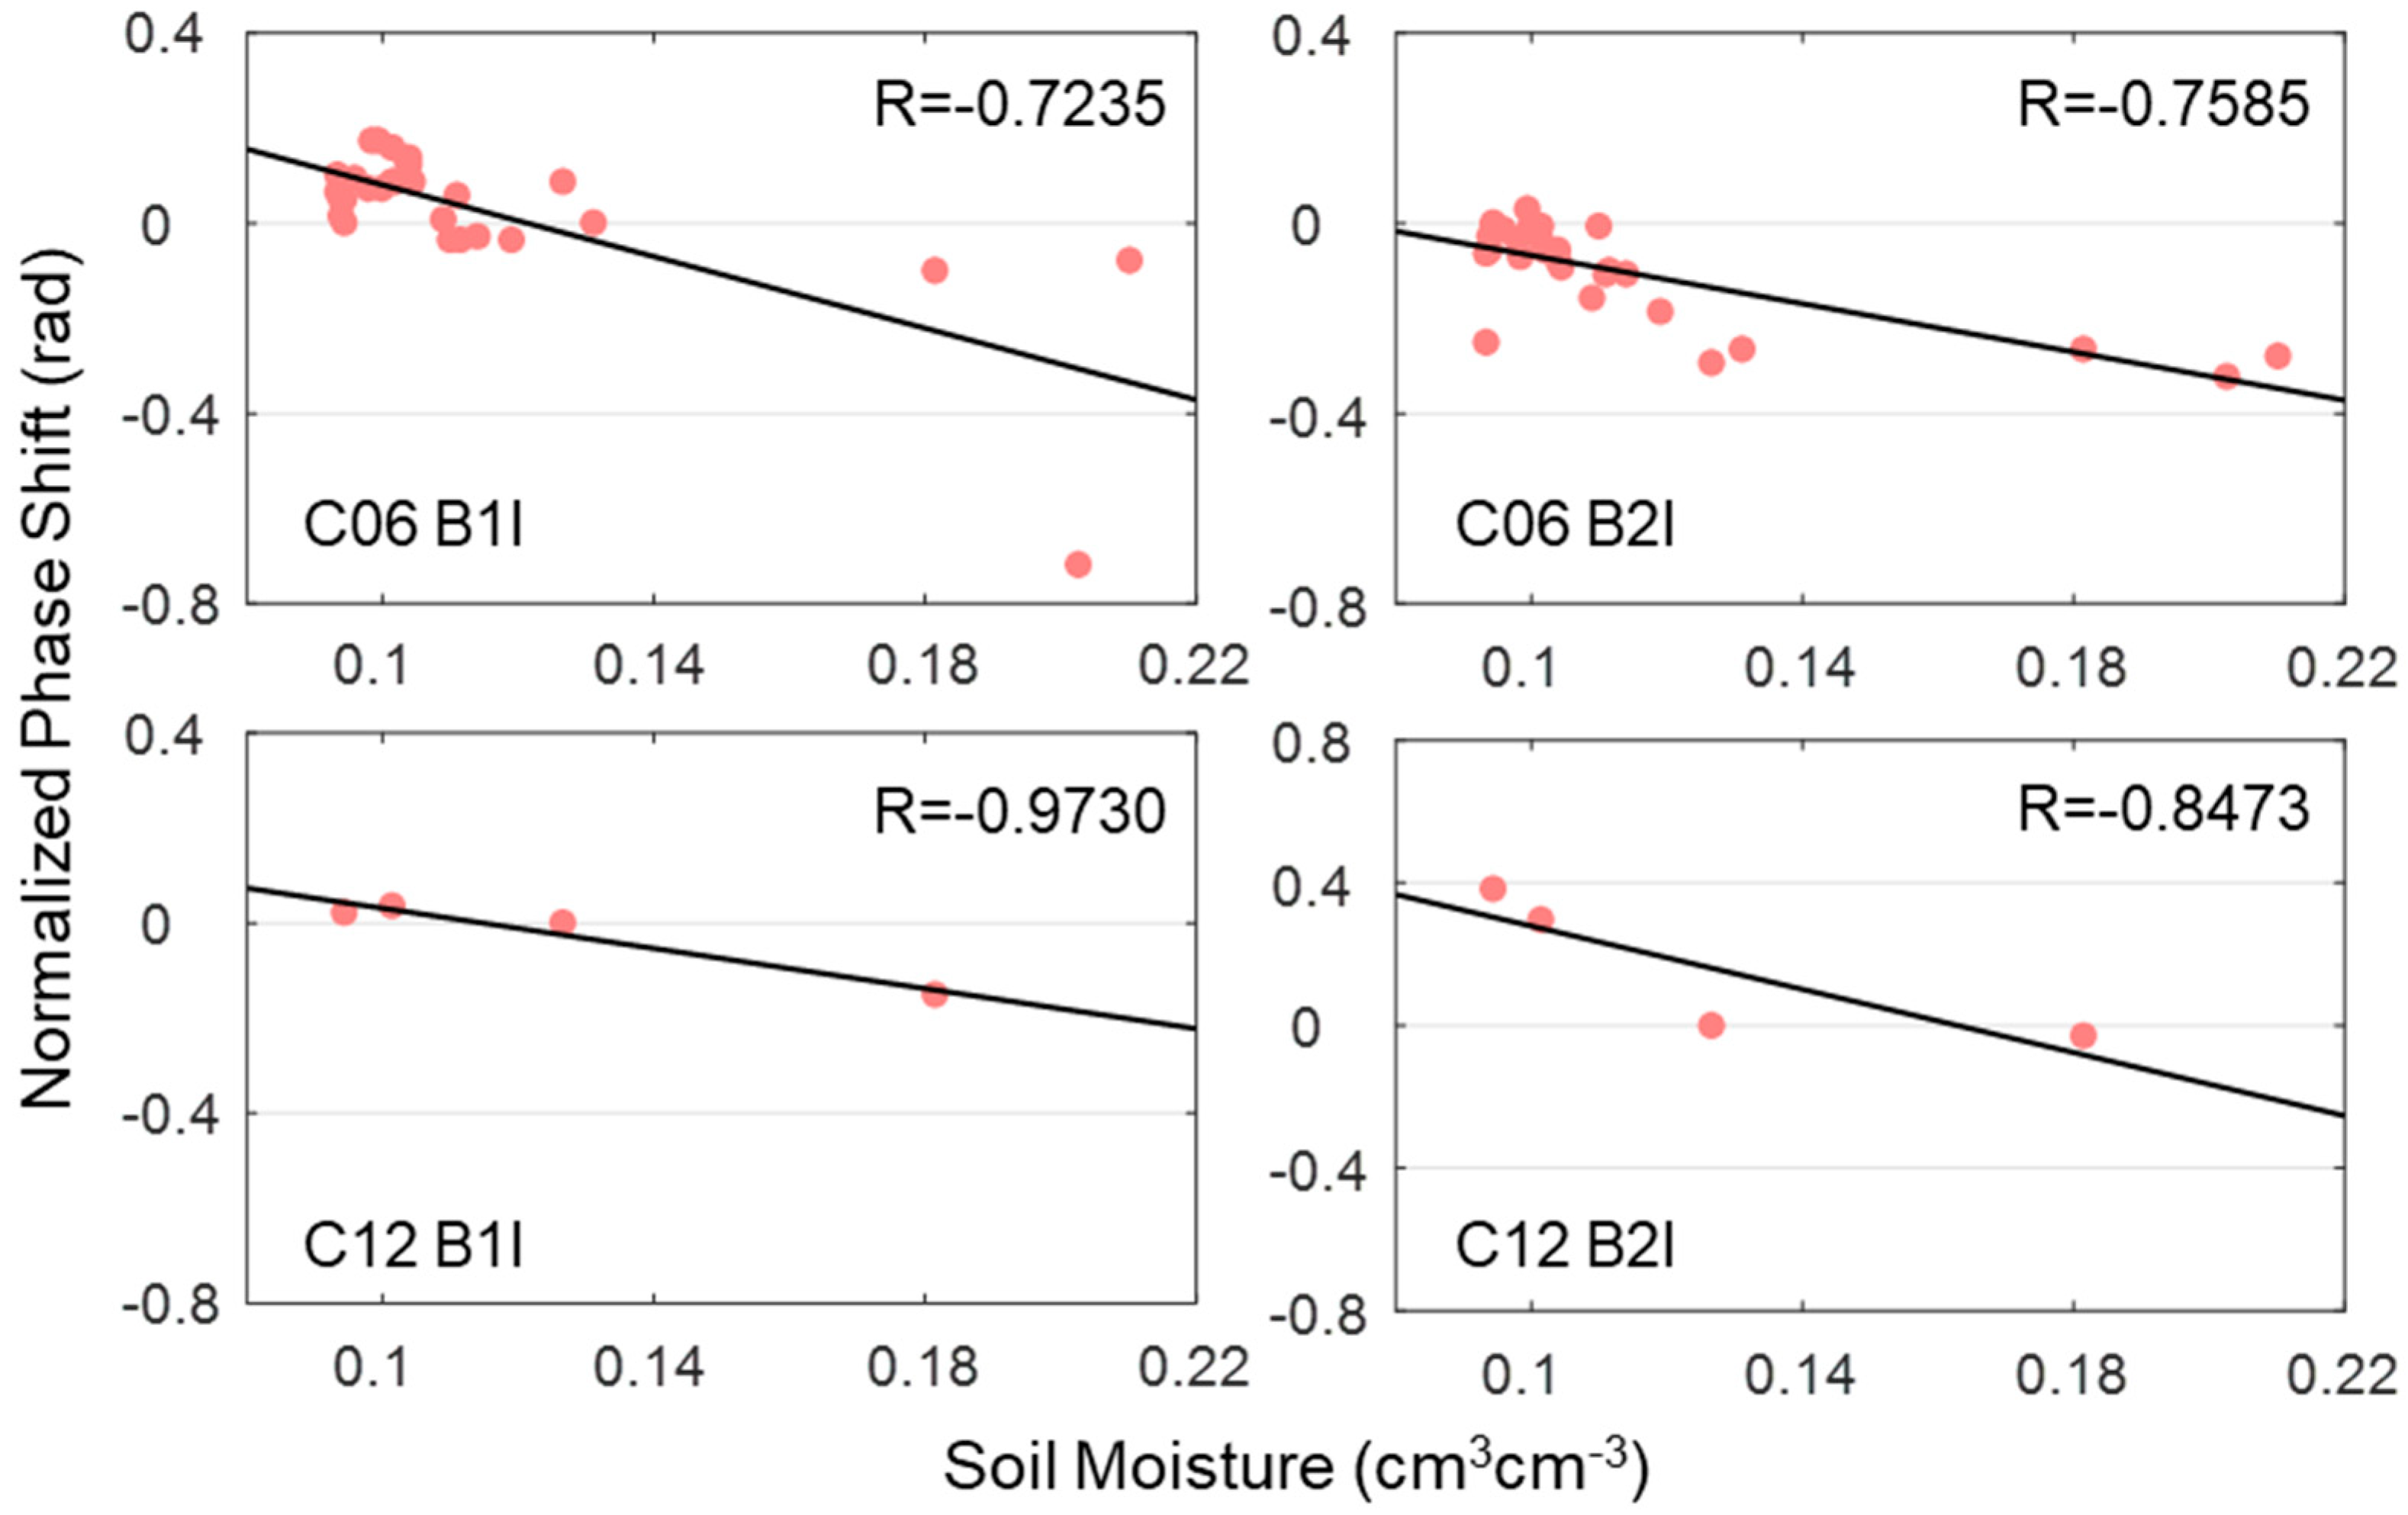
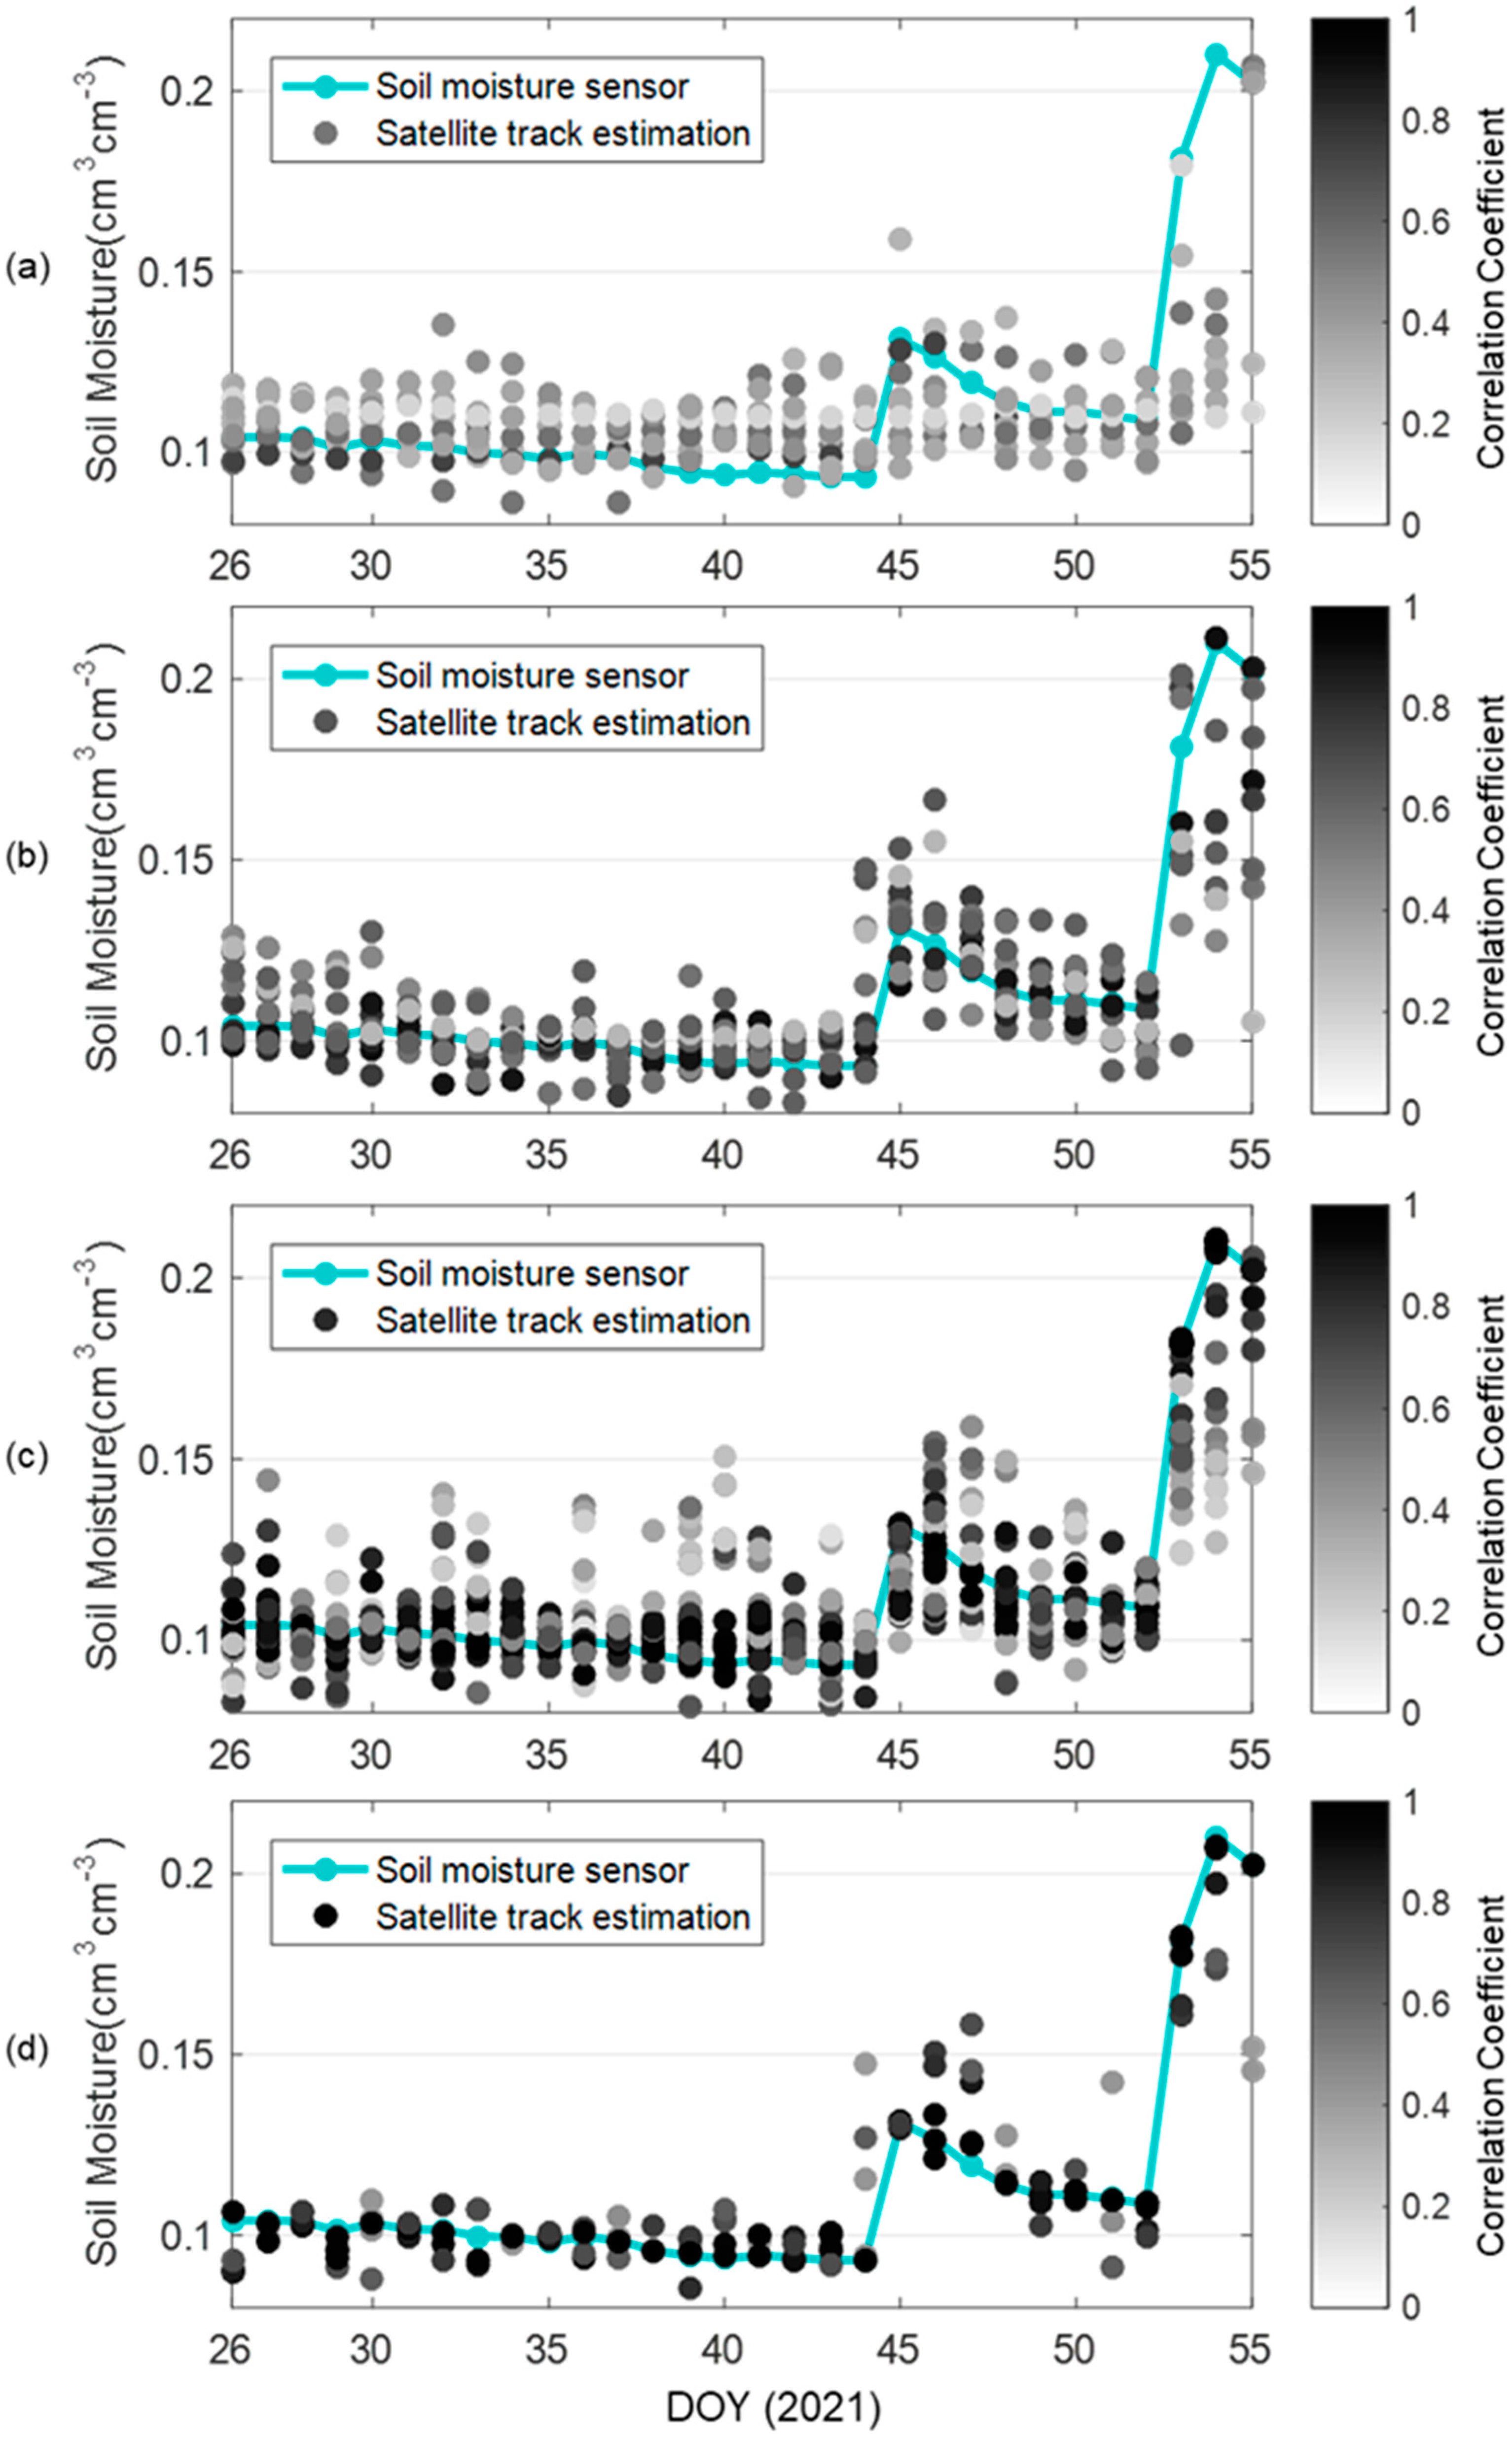
4.2. Comparison of Single-Satellite Track Soil Moisture Estimations

Following the establishment procedures of the ESMC model, the second-order model is used to describe the relationship. Figure 10 displays the second-order estimations of the single-satellite track. The results of C12 B1I achieve the highest correlation (R = 0.9805). Similar to the results in Figure 7, the normalized phase shift sequence that has a higher correlation with soil moisture would have a better performance in the second-order soil moisture estimation. Table 2 shows the comparison between linear and second-order estimations. As compared with the linear estimations, the accuracy of the second-order model in terms of the error statistics has been improved by 2–66%. The second-order model is more suitable for describing the relationship between normalized phase shift sequences and soil moisture. This explains why, in this study we use the second-order model to establish the ESMC model.
Figure 11 shows the single-satellite track soil moisture estimations (i.e., ESMC described in Section 2.3) by BDS MEO and IGSO satellites based on B1I and B2I signals. The number of dots each day in Figure 11d is obviously smaller than the other estimations because the receiver can only record the BDS MEO B2I signal from several satellites. As shown in Figure 11a,b, the satellite track estimations of the B2I signal are better than that of the B1I signal in terms of correlation. Most of the IGSO B2I results have a correlation coefficient of around 0.8, while that of B1I is around 0.5. After the rainfall events, the BDS IGSO B2I satellite track estimations also respond better to the soil moisture changes. The dots of the IGSO B2I satellite track estimations have an obvious rise, while the dots of B1I only rise slightly.
However, although the data amount of BDS MEO B2I is less than B1I due to the limitation of the receiver and satellites, as shown in Figure 11c,d, we can still see that the results of BDS MEO B1I and B2I seem to be similar. The estimations of the two BDS MEO signals show a significant correlation with soil moisture. The dots of B1I or B2I satellite track estimations that correlate well with soil moisture ( R > 0.9 ) are very close to the soil moisture curve.
By comparing the BDS IGSO and MEO satellites, the BDS MEO satellites have a better response to drastic changes in soil moisture than the IGSO satellites (i.e., DOY 45, 53, and 54). The estimations of the BDS MEO satellites on these days are closer to the soil moisture (i.e., dots on these days are closer to the soil moisture curve) and the corresponding satellite track estimations have a higher correlation with soil moisture (i.e., dots are darker).

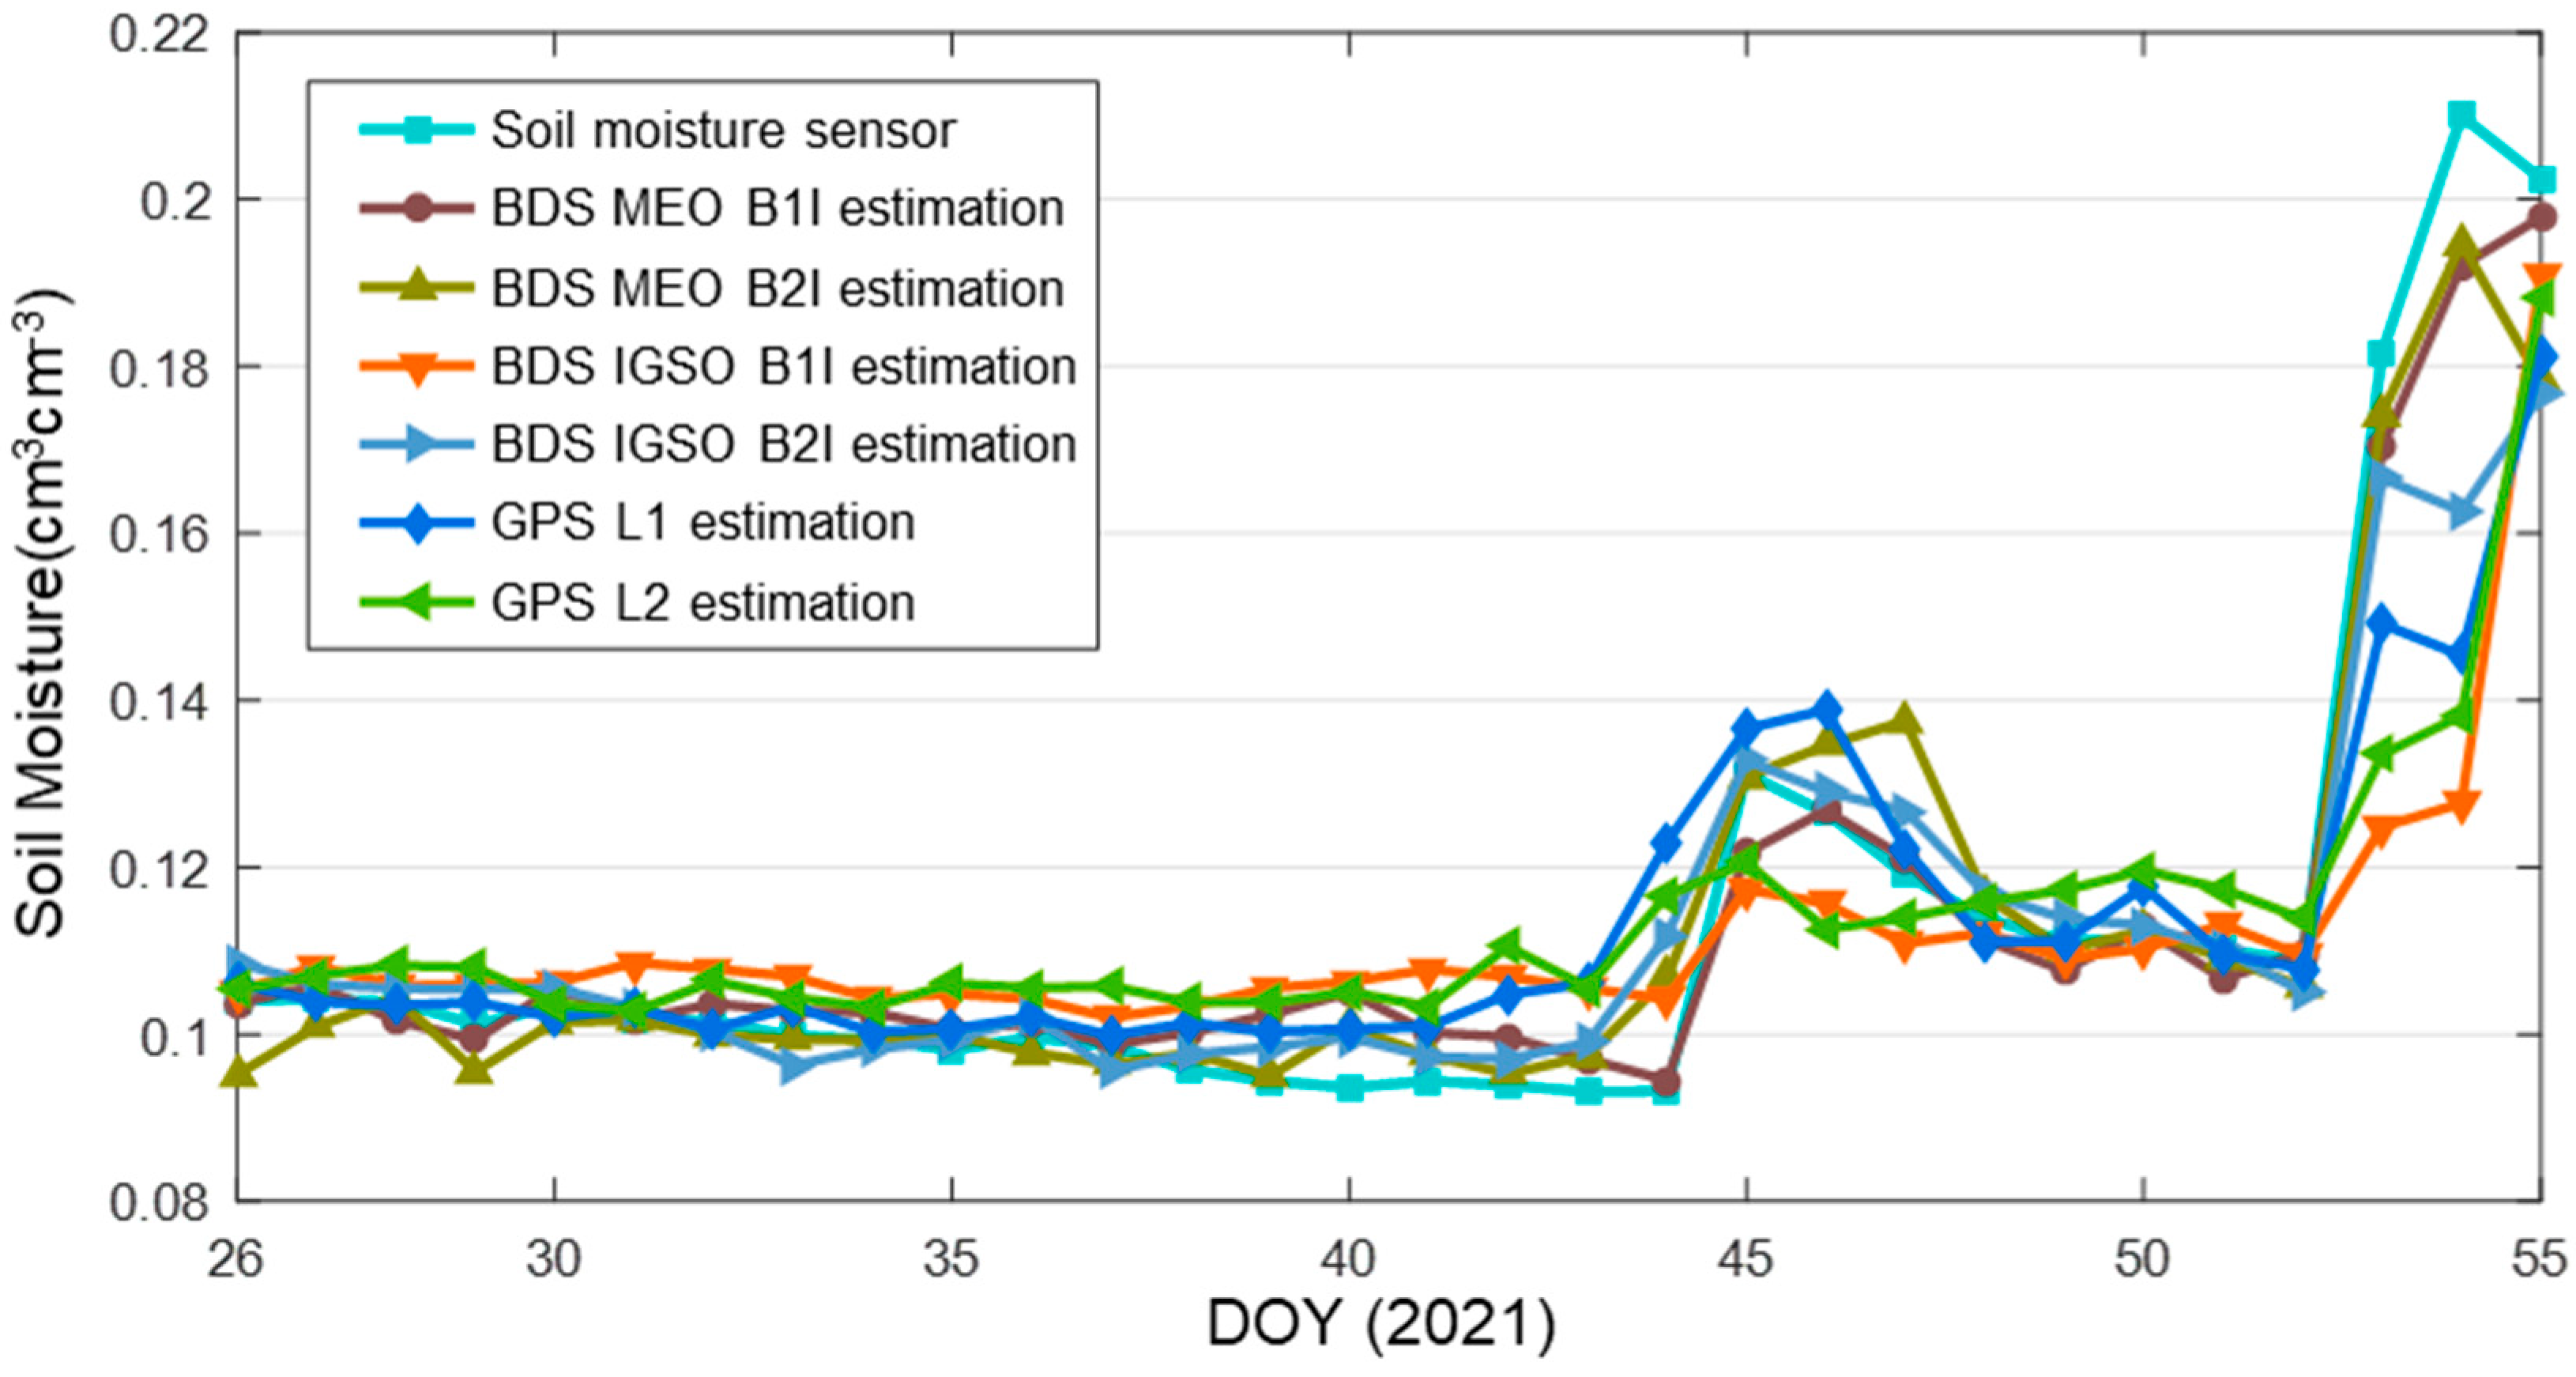
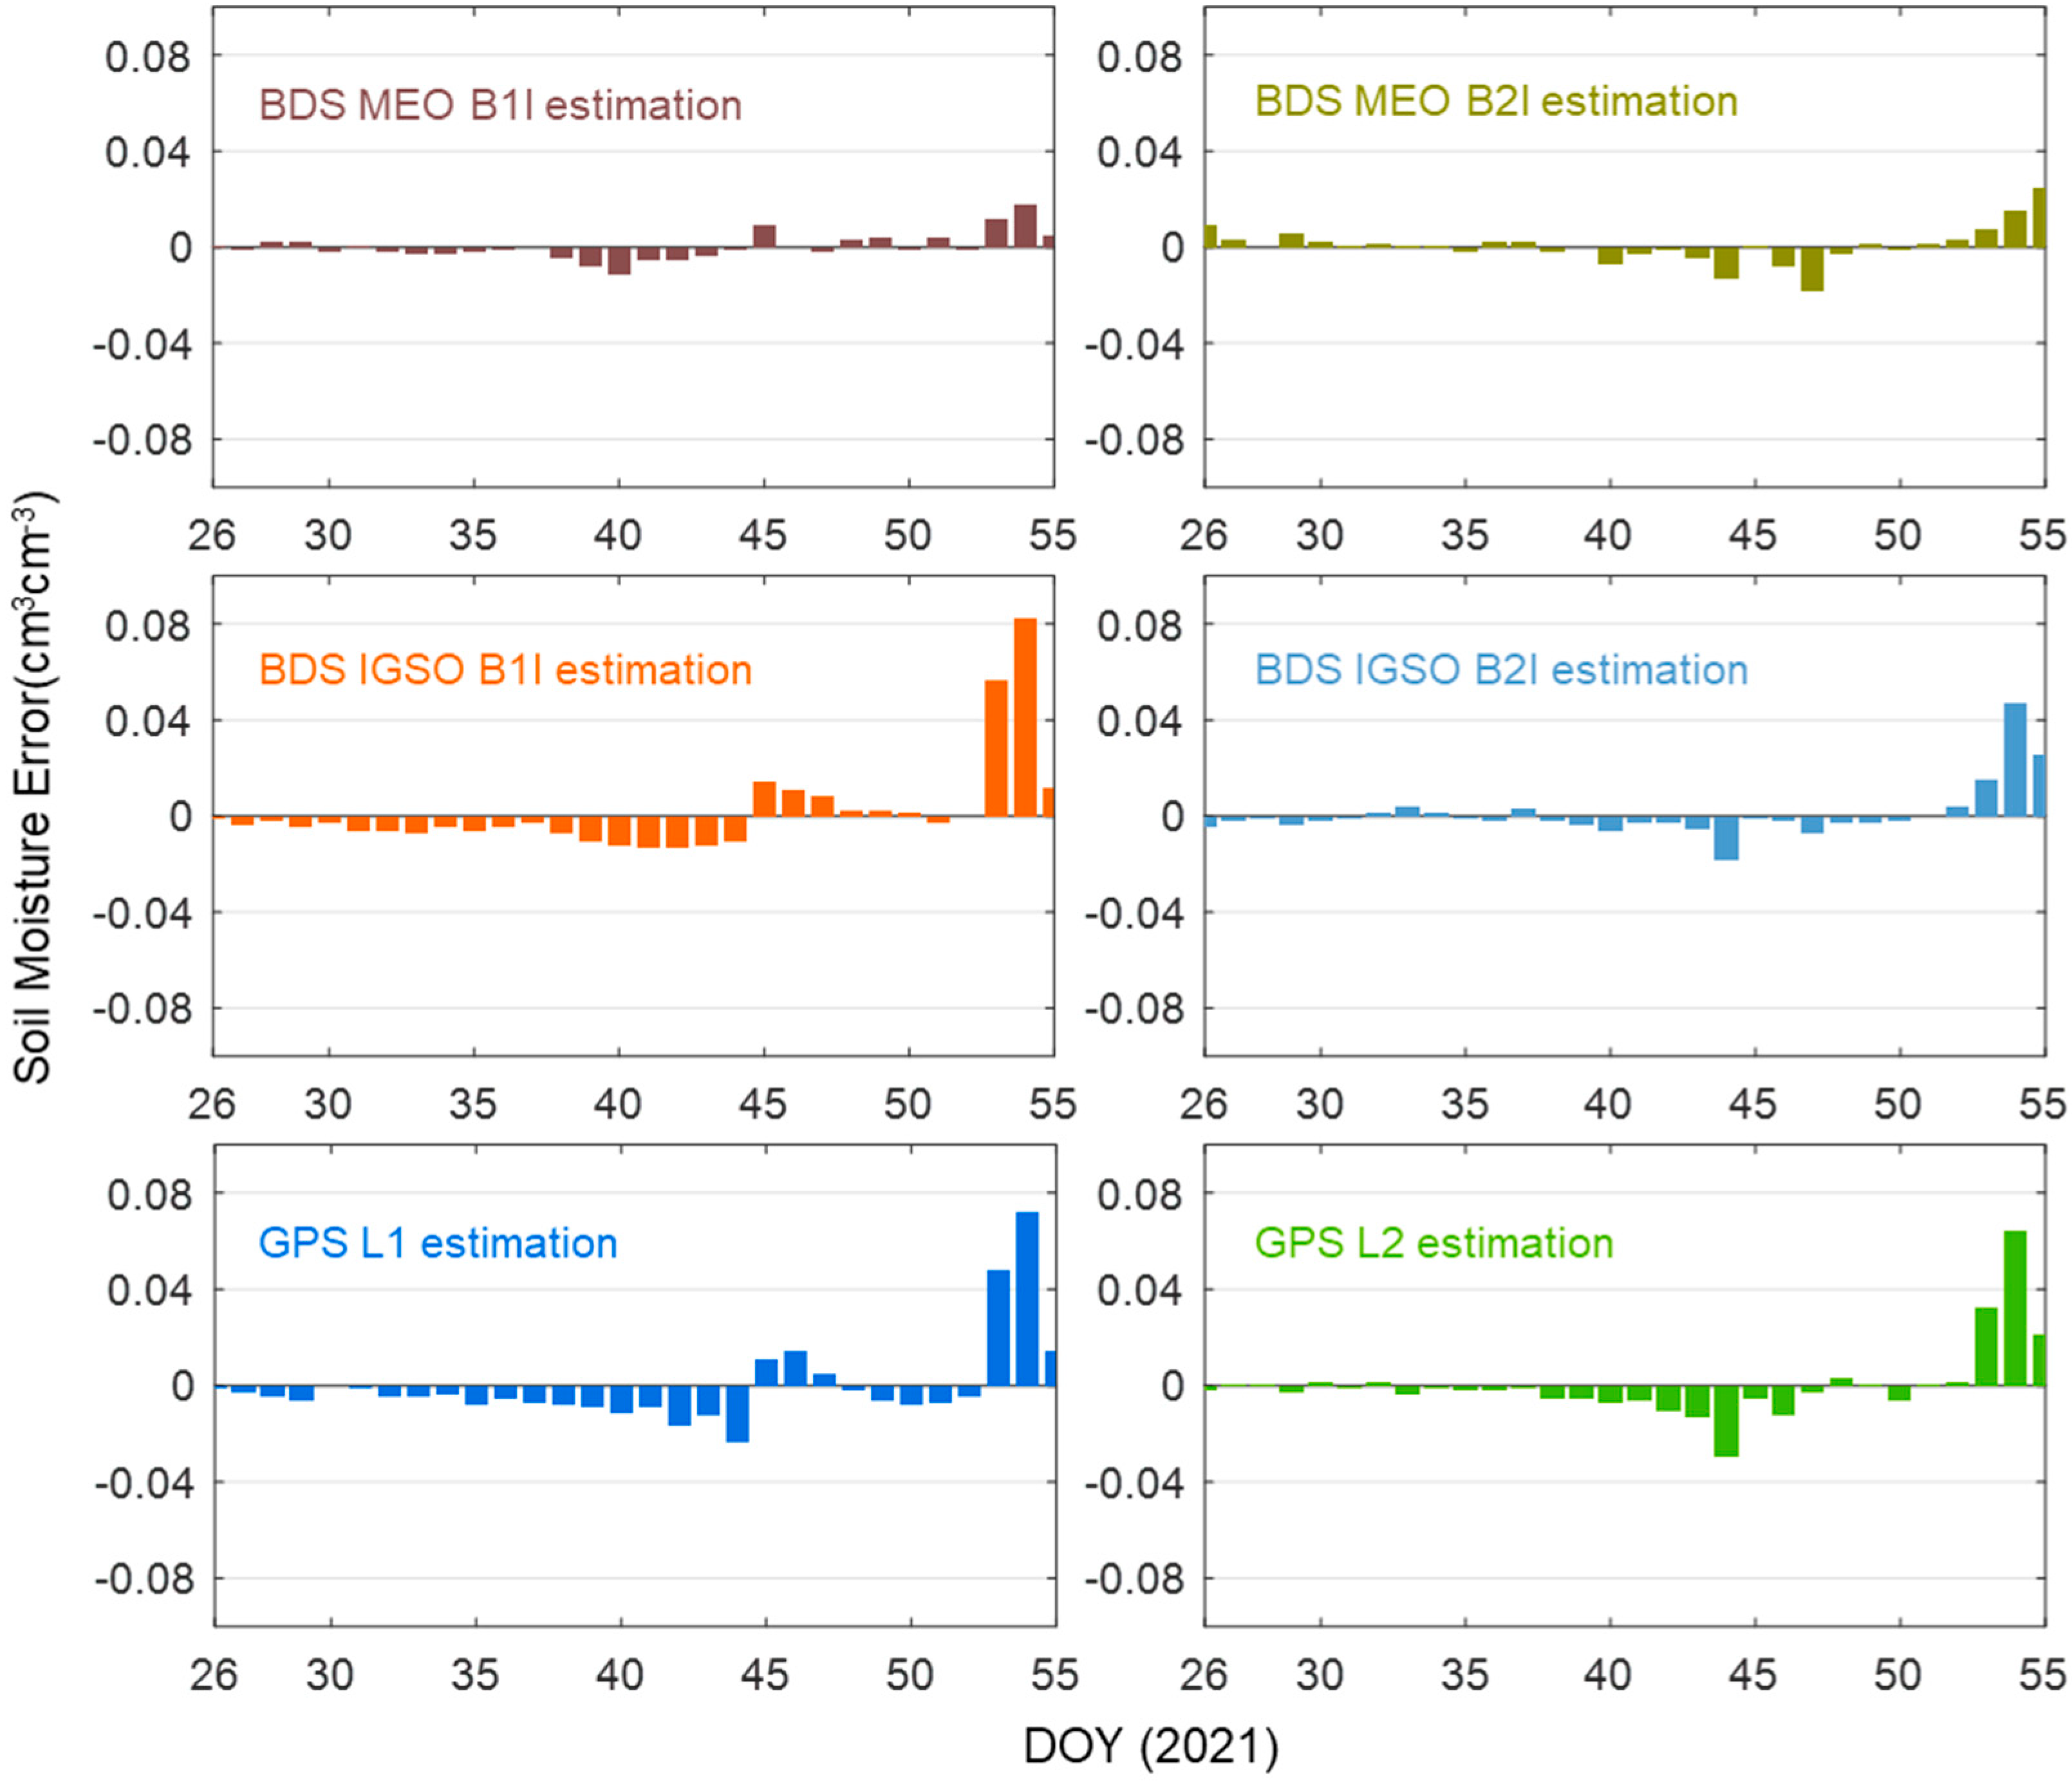
4.3. Comparison of Multi-Satellite Soil Moisture Estimations

For a comprehensive comparison, we also calculated the multi-satellite estimation results of GPS satellites based on the above theory. Figure 12 displays the multi-satellite soil moisture estimation results by BDS MEO and IGSO satellites and GPS satellites; Figure 13 displays the errors between the estimations and soil moisture. The six estimation results show good agreements with the soil moisture fluctuations. During the period of insignificant fluctuations in soil moisture (i.e., from DOY 26 to 43), the errors between the six estimations and soil moisture are all less than 0.08 cm3cm−3. However, not all estimations respond well to the dramatic changes of soil moisture. From DOY 52 to 54, the soil moisture increased from 0.11 to 0.21 cm3cm−3, while BDS IGSO B1I, IGSO B2I, GPS L1, and GPS L2 estimations only increased to about 0.13–0.16 cm3cm−3. The accuracy in terms of error statistics of the six estimations are displayed in Table 3.
Among the six estimations, the BDS MEO B1I results show almost perfect performance, and the estimation accuracy in terms of R is 0.9824, root mean square error (RMSE) is 0.0056 cm3cm−3, and mean absolute error (MAE) is 0.0040 cm3cm−3. The maximum error between the estimation and soil moisture is less than 0.02 cm3cm−3. The BDS IGSO B1I estimation performs the worst with the three estimation precision statistic values of 0.6389, 0.0198, and 0.0109 cm3cm−3, and the error with soil moisture is up to 0.08 cm3cm−3. Three of the BDS estimations are better than GPS (BDS MEO B1I, BDS MEO B2I, and BDS IGSO B2I).
For the BDS satellites, the RMSE and MAE of the BDS MEO estimations are less than the BDS IGSO estimations, i.e., 71.72 and 63.30% for B1I signal, and 32.14 and 21.31% for B2I signal, respectively. The BDS MEO satellites seem to be much more suitable for soil moisture retrieval than the BDS IGSO satellites. This comparison is somewhat unreasonable, because each BDS IGSO satellite track model contains 30 days of data for modeling in this experiment, while the BDS MEO model only contains 4 or 5 days for its satellite repeat period. On the basis of multi-satellite retrieval, the BDS MEO satellites achieve better performances as compared with the BDS IGSO satellites in this experiment.
For BDS IGSO and GPS satellites, although their orbit types are different, the satellite repeat periods are the same, which means that their retrieval models are similar. As shown in Table 3, the BDS IGSO B2I performs better than the BDS IGSO B2I and the GPS L2 performs better than the GPS L1. In previous studies, it has been shown that GPS L2 is more suitable for soil moisture retrieval than L1, which also achieved the same result in this experiment. The signal frequencies of L1 and L2 are 1575.42 and 1227.6 MHz, respectively, while B1I and B2I are 1561.098 and 1207.140 MHz, respectively. This means that the signal characteristics of L1 and B1I are similar, while L2 and B2I are closer, which is the possible reason that BDS IGSO and GPS get such results. However, the difference is not obvious for BDS MEO, the estimation results of the two frequency signals are very close to the soil moisture, and the result of B1I is a little better than B2I. We suggest that it is normal for an error to occur under such results.

5. Discussion and Conclusions

In the procedures of data processing, it should be noted that the orbital periods of GPS (GPS satellites all belong to the MEO satellites), BDS MEO, and BDS IGSO satellites are, respectively, about 12 h, 14 h, and 1 d. This means GPS and BDS IGSO satellites appear near the same locations in the sky every day, while BDS MEO satellites appear at different locations in the sky within seven days and repeat on the eighth day. Therefore, there are up to four available satellite tracks every day that can be used for soil moisture retrieval for GPS and BDS MEO satellites, and two available satellite tracks for BDS IGSO satellites. This means that for a single satellite, a GPS satellite has the fastest revisit speed and a BDS MEO satellite can detect the soil moisture in more directions. Although the orbit type of BDS IGSO satellites is different from that of GPS satellites, we still classify them into the same category (i.e., have the same retrieval model) and the model based on the satellite repeat period for BDS MEO satellites to weaken the impact of environmental differences needs to be established. We suggest that this is the biggest difference between BDS IGEO, MEO, and GPS satellites in retrieval methods.
In this experiment, we can see from Figure 11 that when soil moisture changes dramatically due to the rainfall, BDS IGSO and GPS satellites cannot respond well. The two satellites cannot effectively capture sudden rainfall events, due to the seepage speed of rain and soil heterogeneity. During the period that the soil moisture changes very little (e.g., from DOY 26 to 43), all the estimation results show great performance. It should be noted that all the conclusions in this study are obtained on bare soil, and may be different in other conditions. Because the proposed method considers the satellite responses to the environment in the same direction rather than the detection of a specific surface, we propose that this method is applicable to other surfaces such as vegetated soil, although its performance may vary. In addition, the BDS IGSO B1I and B2I signals have different responses to soil moisture, and similar conclusions can be obtained in GPS. The results indicate that low-frequency signals may be more sensitive to changes in soil moisture. The results also show that BDS MEO satellites are more sensitive to soil moisture variations as compared with GPS satellites. BDS has great potential to become a powerful supplement for a global soil moisture monitoring network and to provide a richer data source for GNSS-IR. Since BDS has three different orbit satellites, it is expected to achieve higher temporal and spatial resolution in soil moisture retrieval.
In this study, a multi-satellite soil moisture retrieval method for BDS MEO and IGSO satellites was proposed. This model is a fusion of different satellite track models. A 30-day observational experiment was used to verify this method and was compared with GPS satellites. The SNR observations of the BDS B1I and B2I signals were used in this study. The experimental results showed good correlations between the BDS IGSO and MEO estimation results and soil moisture fluctuations. The BDS IGSO and MEO satellites can both be used for soil moisture retrieval. The BDS MEO B1I estimation result had the best performance. For the BDS IGSO satellites, the B1I signal was more suitable for soil moisture retrieval as compared with the B2I signal. The correlation coefficient was increased by 19.84%, the RMSE value was decreased by 42.64%, and the MAE value was decreased by 43.93%. In addition, estimations of BDS MEO B1I, MEO B2I, and IGSO B2I performed better than the GPS L1 and L2 estimations. However, the method proposed in this study cannot be applied to BDS GEO satellites because its position relative to the site hardly changes. Future research should focus on soil moisture retrieval based on BDS GEO satellites.

Author Contributions

F.S. and M.S. conceived and designed the experiments; F.S. and Y.Z. performed the experiments, analyzed the data, and wrote the paper; X.C., Y.G. and H.W. helped in the discussion and revision. All authors have read and agreed to the published version of the manuscript.

Funding

This work was funded by the National Natural Science Foundation of China (no. 42077003 and no. 41904018), the Natural Science Foundation of Jiangsu Province (no. BK20201374 and no. BK20190714), the Key Laboratory of Surveying and Mapping Science and Geospatial Information Technology of Ministry of Natural Resources (202015), and the Jiangsu Agriculture Science and Technology Innovation Fund (CX (21) 3068). Thanks to the Outstanding Chinese and Foreign Youth Exchange Program (2019) of China Association for Science and Technology.

Institutional Review Board Statement

Not applicable.

Informed Consent Statement

Not applicable.

Data Availability Statement

All data included in this study are available upon request by contact with the corresponding author.

Acknowledgments

The authors gratefully acknowledge institute of soil science, Chinese academy of sciences for providing experimental site.

Conflicts of Interest

The authors declare no conflict of interest.

References

  1. Seneviratne, S.I.; Corti, T.; Davin, E.L.; Hirschi, M.; Jaeger, E.B.; Lehner, I.; Orlowsky, B.; Teuling, A.J. Investigating soil moisture–climate interactions in a changing climate: A review. Earth Sci. Rev. 2010, 99, 125–161. [Google Scholar] [CrossRef]
  2. Robock, A.; Vinnikov, K.Y.; Srinivasan, G.; Entin, J.K.; Namkhai, A. The Global Soil Moisture Data Bank. Bull. Am. Meteorol. Soc. 2000, 81, 1281–1300. [Google Scholar] [CrossRef] [Green Version]
  3. Dai, A.; Trenberth, K.E.; Qian, T. A Global Dataset of Palmer Drought Severity Index for 1870–2002: Relationship with Soil Moisture and Effects of Surface Warming. J. Hydrometeorol. 2004, 5, 1117–1130. [Google Scholar] [CrossRef]
  4. Kerr, Y.H.; Waldteufel, P.; Richaume, P.; Wigneron, J.P.; Mialon, A. The SMOS Soil Moisture Retrieval Algorithm. IEEE Trans. Geosci. Remote Sens. 2012, 50, 1384–1403. [Google Scholar] [CrossRef]
  5. Topp, G.C.; Davis, J.L. Measurement of Soil Water Content using Time-domain Reflectrometry (TDR): A Field Evaluation1. Soil Sci. Soc. Am. J. 1985, 49, 19–24. [Google Scholar] [CrossRef]
  6. Kerr, Y.H.; Waldteufel, P.; Wigneron, J.P.; Martinuzzi, J.A.M.J.; Font, J.; Berger, M. Soil Moisture Retrieval from Space: The Soil Moisture and Ocean Salinity (SMOS) Mission. IEEE Trans. Geosci. Remote Sens. 2001, 39, 1729–1735. [Google Scholar] [CrossRef]
  7. Entekhabi, D.; Njoku, E.; O’Neill, P.; Spencer, M.; Jackson, T.; Entin, J.; Im, E.; Kellogg, K. The Soil Moisture Active/Passive Mission (SMAP). Proc. IEEE Int. Geosci. Remote Sens. Symp. 2009, 50, 1384–1403. [Google Scholar] [CrossRef]
  8. Zavorotny, V.U.; Larson, K.M.; Braun, J.J.; Small, E.E.; Gutmann, E.D.; Bilich, A.L. A Physical Model for GPS Multipath Caused by Land Reflections: Toward Bare Soil Moisture Retrievals. IEEE J. Sel. Top. Appl. Earth Obs. Remote Sens. 2010, 3, 100–110. [Google Scholar] [CrossRef]
  9. Chew, C.C.; Small, E.E.; Larson, K.M.; Zavorotny, V.U. Effects of Near-Surface Soil Moisture on GPS SNR Data: Development of a Retrieval Algorithm for Soil Moisture. IEEE Trans. Geosci. Remote Sens. 2014, 52, 537–543. [Google Scholar] [CrossRef]
  10. Larson, K.M.; Gutmann, E.D.; Zavorotny, V.U.; Braun, J.J.; Williams, M.W.; Nievinski, F.G. Can we measure snow depth with GPS receivers? Geophys. Res. Lett. 2012, 36. [Google Scholar] [CrossRef] [Green Version]
  11. Ozeki, M.; Heki, K. GPS snow depth meter with geometry-free linear combinations of carrier phases. J. Geod. 2012, 86, 209–219. [Google Scholar] [CrossRef] [Green Version]
  12. Small, E.E.; Larson, K.M.; Braun, J.J. Sensing vegetation growth with reflected GPS signals. Geophys. Res. Lett 2010, 37. [Google Scholar] [CrossRef]
  13. Wan, W.; Larson, K.M.; Small, E.E.; Chew, C.C.; Braun, J.J. Using geodetic GPS receivers to measure vegetation water content. GPS Solut. 2015, 19, 237–248. [Google Scholar] [CrossRef]
  14. Roggenbuck, O.; Reinking, J.; Lambertus, T. Determination of Significant Wave Heights Using Damping Coefficients of Attenuated GNSS SNR Data from Static and Kinematic Observations. Remote Sens. 2019, 11, 409. [Google Scholar] [CrossRef] [Green Version]
  15. Entekhabi, D.; Njoku, E.G.; O’Neill, P.E.; Kellogg, K.H.; Crow, W.T.; Edelstein, W.N.; Entin, J.K.; Goodman, S.D.; Jackson, T.J.; Johnson, J. The soil moisture active passive (SMAP) mission. Proc. IEEE 2010, 98, 704–716. [Google Scholar] [CrossRef]
  16. Xu, J.; Logsdon, S.D.; Ma, X.; Horton, R.; Han, W.; Zhao, Y. Measurement of Soil Water Content with Dielectric Dispersion Frequency. Soil Sci. Soc. Am. J. 2014, 78, 1500–1506. [Google Scholar] [CrossRef] [Green Version]
  17. Larson, K.M.; Small, E.E.; Gutmann, E.D.; Bilich, A.L.; Braun, J.J.; Zavorotny, V.U. Use of GPS receivers as a soil moisture network for water cycle studies. Geophys. Res. Lett. 2008, 35, 851–854. [Google Scholar] [CrossRef] [Green Version]
  18. Larson, K.M.; Small, E.E.; Gutmann, E.D.; Bilich, A.L.; Axelrad, P.; Braun, J.J. Using GPS multipath to measure soil moisture fluctuations: Initial results. GPS Solut. 2008, 12, 173–177. [Google Scholar] [CrossRef]
  19. Chew, C.; Small, E.E.; Larson, K.M. An algorithm for soil moisture estimation using GPS-interferometric reflectometry for bare and vegetated soil. GPS Solut. 2016, 20, 525–537. [Google Scholar] [CrossRef]
  20. Small, E.E.; Larson, K.M.; Chew, C.C.; Dong, J.; Ochsner, T.E. Validation of GPS-IR Soil Moisture Retrievals: Comparison of Different Algorithms to Remove Vegetation Effects. IEEE J. Sel. Top. Appl. Earth Obs. Remote Sens. 2016, 9, 4759–4770. [Google Scholar] [CrossRef]
  21. Yang, T.; Wan, W.; Chen, X.; Chu, T.; Hong, Y. Using BDS SNR Observations to Measure Near-Surface Soil Moisture Fluctuations: Results From Low Vegetated Surface. IEEE Geosci. Remote Sens. Lett. 2017, 14, 1308–1312. [Google Scholar] [CrossRef]
  22. Ban, W.; Yu, K.; Zhang, X. GEO-Satellite-Based Reflectometry for Soil Moisture Estimation: Signal Modeling and Algorithm Development. IEEE Trans. Geosci. Remote Sens. 2017, 56, 1829–1838. [Google Scholar] [CrossRef]
  23. Yang, Y.; Yangyin, X.U.; Jinlong, L.I.; Yang, C. Progress and performance evaluation of BeiDou global navigation satellite system: Data analysis based on BDS-3 demonstration system. Sci. China Earth Sci. 2018, 61, 614–624. [Google Scholar] [CrossRef]
  24. Agnew, D.C.; Larson, K.M. Finding the repeat times of the GPS constellation. GPS Solut. 2007, 11, 71–76. [Google Scholar] [CrossRef]
  25. Yang, Y.; Jiang, J.; Su, M. Comparison of Satellite Repeat Shift Time for GPS, BDS, and Galileo Navigation Systems by Three Methods. Algorithms 2019, 12, 233. [Google Scholar] [CrossRef] [Green Version]
Figure 1. Phasor diagram between the in-phase (I) and quadrature (Q) channels.
Remotesensing 13 03967 g001
Figure 2. Typical multipath reflection geometry of GNSS-IR.
Remotesensing 13 03967 g002
Figure 3. Flowchart depicting the steps of BDS multi-satellite soil moisture retrieval.
Remotesensing 13 03967 g003
Figure 4. The experimental site. The red triangle is the location of the receiver. The area within the blue line is the experimental site. The yellow dot represents the location where the sensor is buried, and the orange-yellow dots represent the manual measurement points.
Remotesensing 13 03967 g004
Figure 5. Surrounding environment and experimental equipment.
Remotesensing 13 03967 g005
Figure 6. Manual measurement of soil moisture.
Remotesensing 13 03967 g006
Figure 7. Correlations between the normalized phase shift sequences and soil moisture for BDS IGSO (C06) and MEO (C12) satellites on B1I and B2I frequencies.
Remotesensing 13 03967 g007
Figure 8. Normalized phase shift sequences of all BDS IGSO satellite tracks and the phase shift average results: (upper) B1I results; (lower) B2I results.
Remotesensing 13 03967 g008
Figure 9. Normalized phase shift sequences of all BDS MEO satellite tracks and the phase shift average results: (upper) B1I results; (lower) B2I results.
Remotesensing 13 03967 g009
Figure 10. Correlations between single-satellite track second-order soil moisture estimations for BDS IGSO (C06) and MEO (C12) satellites on B1I and B2I frequencies.
Remotesensing 13 03967 g010
Figure 11. Satellite track soil moisture estimations by BDS IGSO and MEO satellites based on B1I and B2I signals: (a) BDS IGSO satellite track B1I estimations; (b) BDS IGSO B2I satellite track estimations; (c) BDS MEO B1I satellite track estimations; (d) BDS MEO B2I satellite track estimations. The color depth of the dot represents the correlation between the satellite track estimation that the dot belongs to and the soil moisture. The number of dots each day represents the number of satellite track estimations on the day.
Remotesensing 13 03967 g011
Figure 12. Multi-satellite soil moisture estimation results of BDS and GPS satellites.
Remotesensing 13 03967 g012
Figure 13. Errors between estimations and soil moisture.
Remotesensing 13 03967 g013
Table 1. Approximate satellite repeat periods of GPS and BDS satellites. (Here, the repeat period of a BDS IGSO satellite is 1 day due to its geosynchronous orbit.)
GNSS ConstellationOrbitApproximate Repeat Period
GPSMEO1 day
BDSMEO7 days
IGSO1 day
Table 2. Comparison between linear and second-order estimations.
EstimationCorrelation Coefficient (R)Root Mean Square Error (cm3cm−3)Mean Absolute Error (cm3cm−3)
Linear estimationC06 B1I0.72350.02100.0137
C06 B2I0.75850.01980.0129
C12 B1I0.97300.00790.0062
C12 B2I0.84730.01820.0145
Second-order estimationC06 B1I0.73830.02050.0147
C06 B2I0.81160.01770.0109
C12 B1I0.98050.00670.0055
C12 B2I0.87670.01650.0144
Table 3. Soil moisture estimation precision statistics.
EstimationCorrelation Coefficient (R)Root Mean Square Error (cm3cm−3)Mean Absolute Error (cm3cm−3)
BDS MEO B1I0.98240.00560.0040
BDS MEO B2I0.94900.00760.0048
BDS IGSO B1I0.63890.01980.0109
BDS IGSO B2I0.92920.01120.0061
GPS L10.73280.01810.0111
GPS L20.80100.01560.0083
Publisher’s Note: MDPI stays neutral with regard to jurisdictional claims in published maps and institutional affiliations.

