Abstract
Precipitable water vapor (PWV) plays a vital role in climate research, especially for Antarctica in which meteorological observations are insufficient due to the adverse climate and topography therein. Reanalysis data sets provide a great opportunity for Antarctic water vapor research. This study investigates the climatological PWV means, variability and trends over Antarctica from four reanalyses, including the fifth generation of European Centre for Medium-Range Weather Forecasts (ECMWF) Reanalysis (ERA5), the Second Modern-Era Retrospective analysis for Research and Applications (MERRA-2), Japanese 55-year Reanalysis (JRA-55) and National Centers for Environmental Prediction/Department of Energy (NCEP/DOE), in the period of 2001–2018 based on radiosonde and GNSS observations. PWV data from the ERA5, MERRA-2, JRA-55 and NCEP/DOE have been evaluated by radiosonde and GNSS observations, showing that ERA5 and MERRA-2 perform better than JRA-55 and NCEP/DOE with mean root mean square (RMS) errors below 1.2 mm. The climatological PWV mean distribution over Antarctica roughly shows a decreasing trend from west to east, with the highest content in summer and the lowest content in winter. The PWV variability is generally small over Antarctica, showing a seasonal dependence that is larger in the cold season and smaller in the warm season. PWV trends for all reanalyses at most Antarctic regions are insignificant and most reanalyses present overall drying trends from 2001 to 2018, except for ERA5 exhibiting a moistening trend. PWV trends also show seasonal and regional dependence. All reanalyses are generally consistent with radiosonde and GNSS observations in reproducing the PWV means (mean differences within 1.1 mm), variability (mean differences within 3%) and trends (mean differences within 6.4% decade−1) over Antarctica, except for NCEP/DOE showing spurious variability and trends in East Antarctica. Results can help us further understand these four reanalysis PWV products and promote climate research in Antarctica.
1. Introduction
Water vapor, as one of the major greenhouse gases in the atmosphere, accounts for about 60% of the natural greenhouse effect and plays a vital role in many atmospheric processes, such as global energy and hydrological cycle, global warming and climate change [1]. Following the nonlinear Clausius–Clapeyron equation, the water vapor is mainly controlled by temperature, a 1-K rise of temperature will increase about 7% water-holding capacity of the atmosphere if the relative humidity remains nearly constant, and the increase in water vapor will further induce a positive feedback in global warming [2,3]. This strong positive feedback has a profound influence on the global climate system and affects the development of extreme climate phenomena due to rapid variations of water vapor accompanied by large changes of the latent heat [4]. Antarctica, the continent with the highest average elevation around the world, is characterized by the coldest, driest, stormiest and windiest climate with scarce precipitation in the world. The annual mean precipitation of the Antarctic continent is 55 mm and there is almost no precipitation near the South Pole. In Antarctica, the spatiotemporal variability of atmospheric water vapor impacts the precipitation pattern and thus the rates of ice accumulation over the continental interior [5]. Therefore, the monitoring and investigating of atmospheric water vapor content and its variations are significant for a better understanding of global climate and weather processes, particularly in such a sensible region as Antarctica.
Precipitable water vapor (PWV) is one of the most widely used indicators for measuring the amount of atmospheric water vapor and an important parameter in numerical weather forecasting models [6,7,8,9]. It can be acquired through various techniques and generally can be divided into two categories. The first category is observations from multiple sensors including radiosondes, Global Navigation Satellite System (GNSS), weather stations and satellite remote sensing [10,11,12,13,14]. The PWV observations obtained from this category are measured by the sensors and have the advantage of high accuracy. Among them, ground-based GNSS can detect the signal zenith delay and further estimate the PWV with its long-term stability, weather independent and high temporal resolution compared to other PWV measurements such as radiosondes and satellite remote sensing [15,16,17]. However, since the sensors from radiosondes and satellites are of high cost and poor performance under harsh climate conditions, and since the observations are often sparsely distributed and incomplete, it is difficult to estimate accurate PWV variability and trend from the observational data. Another category of PWV data is the reanalysis data set that is produced by assimilating multiple sources of observations (such as radiosonde, ground-based weather station and satellite remote sensing) into a coherent data set based on the advanced data assimilation scheme and atmospheric numerical model [18,19]. Reanalysis data sets can provide complete and homogeneous atmospheric data over multiple decades with the advantages of multivariable outputs and global coverage. They thereby can be of great value for climate research and applications. In Antarctica, meteorological observations are sparse due to the inhospitable environment; thus, studies of Antarctic climate often rely upon the reanalysis of data sets. Although unified processing schemes and models are used in the reanalysis data, biases and inhomogeneities from the assimilated observations can still contaminate the reanalysis data sets, especially for Antarctica where observations used for data assimilation are scarce or contain errors. It is therefore possible that PWV variability and trend estimates derived from the reanalysis data sets may show spurious phenomenon, and this cannot be ignored.
Many studies have been conducted to investigate global or Antarctic PWV changes. Trenberth et al. [1] performed an analysis and evaluation of global PWV means, variability and trends for the National Centers for Environmental Prediction (NCEP) reanalyses 1 and 2, and for the 40-year European Centre for Medium-Range Weather Forecasts (ECMWF) reanalysis (ERA-40) from 1988 to 2001. The reanalyses showed reasonable results over land while major problems were found over the oceans. Suparta et al. [20,21,22] used GPS technology to analyze the Antarctic PWV variability and its response to some atmospheric events including solar activities and terrestrial winds. Chen and Liu [23] analyzed the global variability and trends in PWV using ERA-Interim, NCEP/DOE (Department of Energy), radiosonde, GPS and microwave satellite data, and found that the global PWV had an evident moistening trend while the Antarctic PWV showed a drying trend in ERA-Interim from 1992 to 2014. However, the result is debatable for Antarctica because of the shortage of observational data. Parracho et al. [24] also investigated the global means, variability and trends in PWV from ERA-Interim, the Second Modern-Era Retrospective analysis for Research and Applications (MERRA-2) and GNSS for the period 1980–2016, however large uncertainties in PWV variability and trends were still seen in both reanalyses over Antarctica. Ricaud et al. [25] investigated the time evolution of humidity and temperature above Antarctic Dome C using radiosondes, microwave radiometer and reanalyses. The investigations of global water vapor distribution and changes were performed in previous studies. However, most studies are limited in providing detailed water vapor distribution and changes for Antarctica. A comprehensive investigation of Antarctic water vapor has yet to be fully explored. Moreover, the reliability of the PWV derived from reanalyses also needs to be evaluated.
As the latest released reanalysis data set from ECMWF, ERA5 has the highest temporal resolution of 1 h and highest horizontal spatial resolution of 0.25° × 0.25° (lon. × lat.) with respect to other older reanalyses including MERRA-2, Japanese 55-year Reanalysis (JRA-55) and NCEP reanalysis. ERA5 benefits from many improvements, including assimilation of more recent observations and the adoption of more advanced data assimilation methods [26]. In this study, we first verify the ERA5, MERRA-2, JRA-55 and NCEP/DOE-derived PWV results with respect to radiosonde and GNSS observations. Then, once the reanalysis-derived PWV accuracy has been verified, a comprehensive investigation of the Antarctic PWV means, variability and trends for the period 2001–2018 are presented using reanalyses, GNSS and radiosonde data. Data and methods used in this paper are described in Section 2. Section 3 shows the evaluation of PWV estimations derived from reanalyses using radiosonde and GNSS observations. The means, variability and linear trends of PWV found in the reanalyses, radiosonde and GNSS data over Antarctica from 2001 to 2018 are carried out in Section 4. Section 5 discusses the results and concludes the paper.
2. Data and Methods
2.1. Four Reanalysis Products
Four global reanalysis products are used in this study, including ERA5, MERRA-2, JRA-55 and NCEP/DOE reanalysis. The basic information of these four reanalysis products is summarized in Table 1.

Table 1.
Summary of four reanalysis products used in this study.
ERA5 is the fifth generation ECMWF atmospheric reanalysis data set for the global climate and weather, covering the period from 1 January 1979 to present. The ERA5 reanalysis is the successor of ERA-Interim reanalysis and assimilates as many observations as possible in the upper air and near surface with the four-dimensional variational analysis (4D-Var) data assimilation scheme in the Cycle 41R2 model of the ECMWF’s Integrated Forecast System (IFS), which is expected to be extensively used in the future [26,27,28].
MERRA-2 is the latest global atmospheric reanalysis data set produced by NASA’s Global Modeling and Assimilation Office (GMAO) from 1980 to present. It uses an upgraded version of the Goddard Earth Observing System Model, Version 5 (GEOS-5) data assimilation system [29] and the Gridpoint Statistical Interpolation (GSI) analysis scheme [30,31], which replaces the original MERRA reanalysis data set.
JRA-55 is the second Japanese global atmospheric reanalysis project conducted by the Japan Meteorological Agency (JMA) for the period from 1958 onward. Compared to its predecessor JRA-25, JRA-55 employs a new data assimilation and prediction system (DA) which improves many deficiencies found in JRA-25. These improvements include implementing higher spatial resolution (TL319L60), a new radiation scheme in the forecast model, the 4D-Var assimilation scheme with Variational Bias Correction (VarBC) and introduction of greenhouse gases with time-varying concentrations [32,33].
The NCEP/DOE Reanalysis-2 is using a state-of-the-art analysis/forecast system to perform data assimilation using past data from 1979 up to present in the Atmospheric Model Intercomparison Project (AMIP-II) to correct several human processing errors and update parameters of physical processes in its predecessor, NCEP/NCAR (National Center for Atmospheric Research) reanalysis [34].
These four reanalysis data sets have adopted advanced numerical climate models and assimilation methods to combine multi-source observations which minimized bias, and it is expected that PWV variability and trend estimates are more realistic. In this study, these four reanalysis data over Antarctica (60–90°S area) for the period 2001−2018 are used.
2.2. PWV Retrieval from Radiosonde Profiles
Radiosonde stations can directly measure vertical meteorological parameters by a sounding balloon at 00:00 and 12:00 UTC every day at various heights, containing mainly temperature, pressure and relative humidity. The radiosonde-derived PWV can be calculated from an integral of the meteorological profiles as follows [35]:
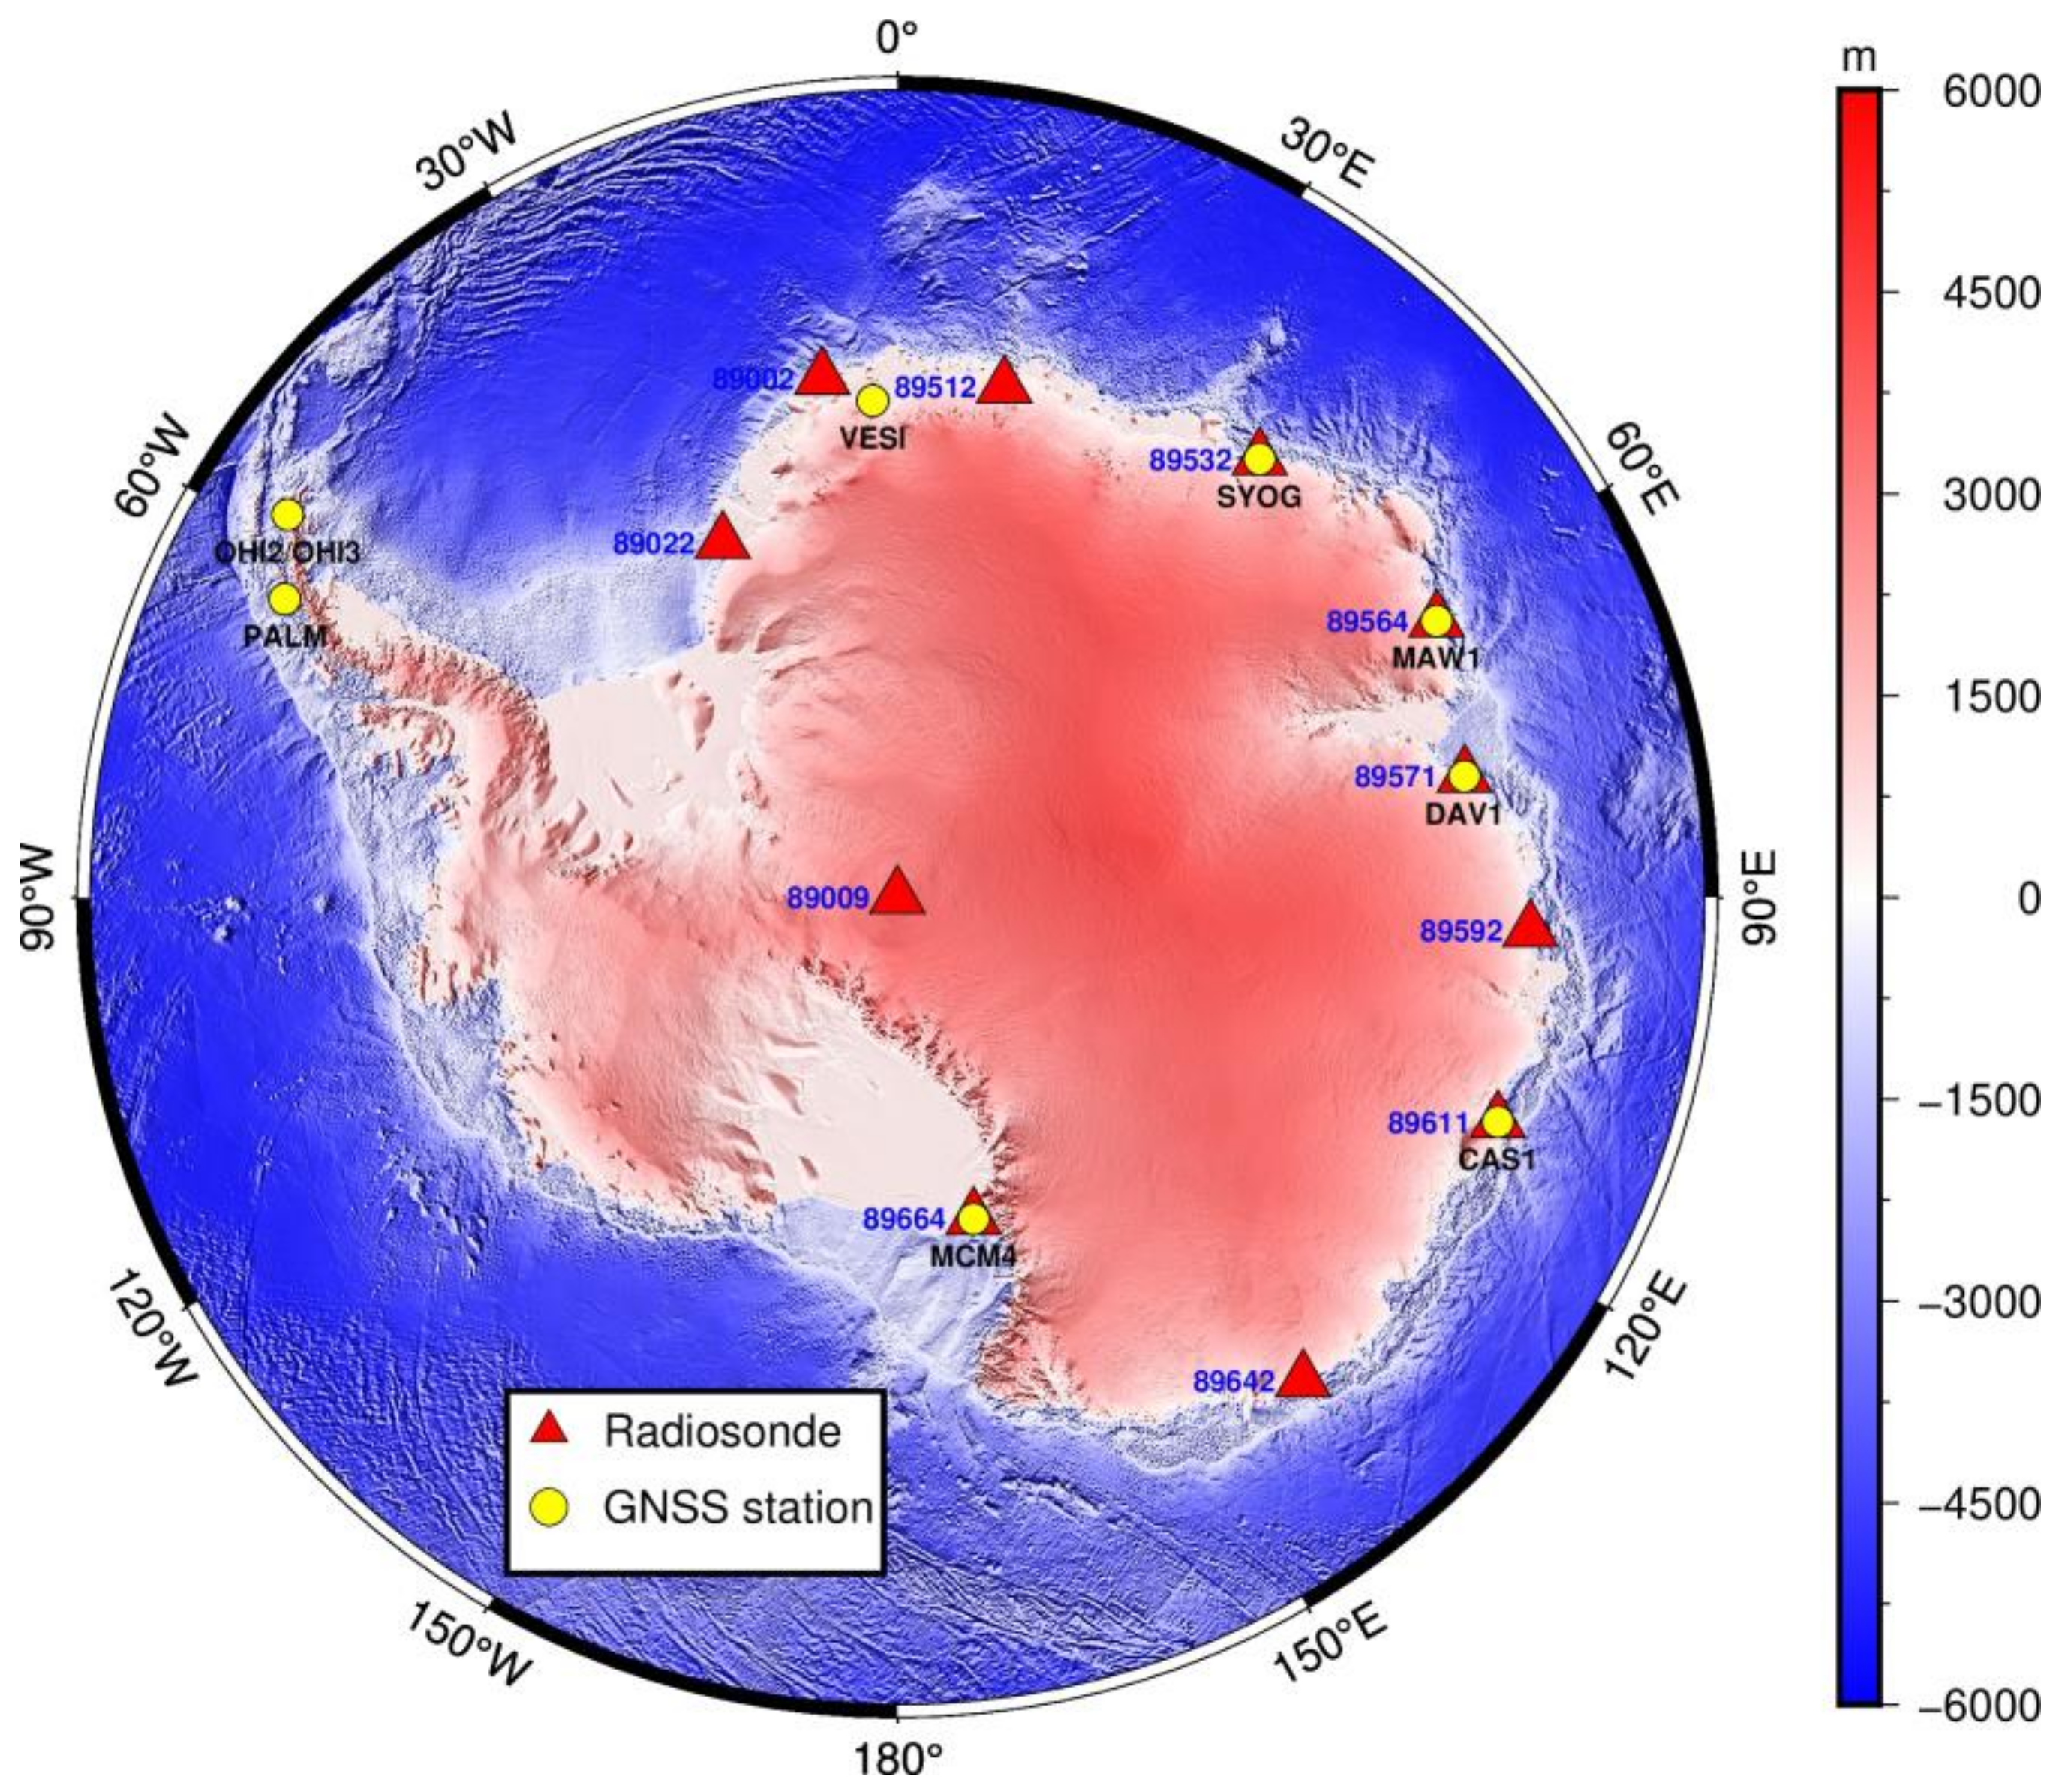
where P is the atmospheric pressure, Pi and Pi+1 are the pressure at the lower and upper layers, respectively (unit: Pa). q refers to the specific humidity (g∙kg−1), ρw denotes the liquid water density (g∙cm−3) and g is the acceleration of gravity (cm∙s−2). The accuracy of PWV estimations derived from radiosonde has been demonstrated to be high with the uncertainty of 5~8% based on different radiosonde types which constantly serve as a standard to confirm other PWV measurement results [11,12]. In this study, the PWV estimations derived from eleven radiosonde sites are considered to assess the reliability of the reanalysis and GNSS PWV results and to derive the Antarctic water vapor variability and trends. For the quality control of radiosonde-derived PWV time series at each station, estimations with deviation from the mean value of estimations outside five times the standard deviation are rejected [36]. The geographical distribution of the eleven radiosonde sites is shown in Figure 1 (red triangles).
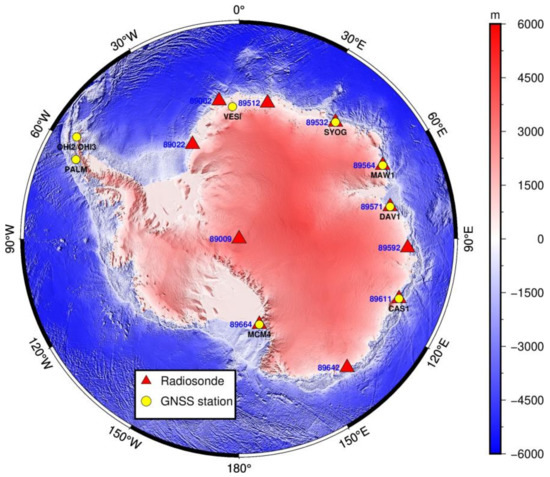
Figure 1.
Geographic distribution of the eleven radiosonde stations (red triangles, blue fonts) and nine GNSS stations (yellow circles, black fonts) in Antarctica.
2.3. PWV Retrieval from GNSS
The International GNSS Service (IGS) center is operating a worldwide GNSS network with more than 400 GNSS reference stations and provides regularly a 5 min sampling ZTD (zenith total delay) tropospheric product. The accuracy of IGS ZTD estimates has been proven to be better than 5 mm [37,38,39]. To ensure the reliability of the IGS ZTD estimates, the ZTD data are screened using a quality control scheme described by Bock et al. [40], and the abnormal observation data are removed. After screening, the ZTD data from nine GNSS stations over Antarctica for the period 2001–2018 (the selection retained those with the time series more than ten years) were validated to be used in this study. The 5 min ZTD data are averaged in 1-h bins. The geographical distribution of the nine GNSS stations is shown in Figure 1 (yellow circles).
The conversion of ZWD (zenith wet delay) to PWV is through the following formula [41]:
where Π is the water vapor conversion factor, a function of atmospheric weighted mean temperature (Tm); Rv denotes the specific vapor gas constant (461.495 J∙kg−1∙K−1); ρw refers to the density of liquid water (1 × 10³ kg/m3); k’2 and k3 are the atmospheric refractivity parameters given by Bevis et al. [42]; ZWD is obtained by subtracting the zenith hydrostatic delay (ZHD) from the ZTD and the ZHD (in m) is calculated by the Saastamoinen model [43]:
where φ represents the latitude of the GNSS station (unit: radians) and ho is the height of the GNSS station (unit: m); Ps is the surface pressure of the GNSS station (unit: hPa). In this study, Ps at GNSS site is obtained from ERA5 data through spatial interpolation of four surrounding grid points, and the detailed interpolation process is described in Section 2.4. Tm is directly obtained from the Global Grid Tm (GGTm) model proposed by Huang et al. [44]. The GGTm model considers the latitude and altitude variations in Tm estimates and shows better performance than the widely used GPT2w model [45] in Tm estimates, especially in the regions with large undulating terrain such as Antarctic areas [44]. Therefore, the GGTm model is used to obtain the Tm estimates for each GNSS station. It should be noted that negative GNSS-derived PWV results were removed for quality assurance. Negative GNSS-derived PWV values are due to a poor performance of the underlying ZHD models (Saastamoinen model) over Antarctica [46]. In Antarctica, the PWV contents are far smaller than in other parts of the world and the GNSS-derived PWV must be considered with great care even if they are positive. In this work, the quality of the PWV retrieval from GNSS is verified using radiosonde observations. Then, the GNSS-derived PWV is adopted as a reference value to validate the PWV results estimated from the reanalysis data and to derive the PWV variability and trends.
2.4. Spatial Adjustments for Meteorological Data
Since the GNSS data are referred on the geodetic height system, both radiosonde and reanalysis data adopt the geopotential height system, and it is crucial to unify the different height systems when two types of data are compared. In this study, we employed the scheme described in Wang et al. [47] to unify the different height systems. To adjust the reanalysis data to each station, we first identified the four surrounding grid points in horizontal. Then, a vertical adjustment is implemented to adjust the grid points to the height of the station. Finally, the grid points are interpolated bi-linearly to the location of the station. For the vertical adjustment, different meteorological parameters depend on different vertical adjustment methods. The vertical adjustment formula for pressure is as follows [48]:
where P and P0 are the surface pressure at GNSS station and grid point, respectively; h and h0 represent the height of the GNSS station and grid point, respectively. For the PWV vertical adjustment, an empirical equation derived by Leckner et al. [49] and Kouba [50] is widely used to adjust for the height difference:
where and represent the PWVs corresponding to the heights of h1 and h2 (unit: km), respectively; β denotes the empirical decay coefficient of −0.5 mm/km given by Kouba [50]. The advantage of this equation is that it can be applied directly to the PWV data without requiring any extra meteorological data. However, the β value given by Kouba is obtained from the average of the gridded—site-specific VMF1 (Vienna Mapping Function 1) differences of wet delay for IGS station KOKB [50]. Moreover, the β may have some seasonal variations due to the PWV seasonal changes. Therefore, the β value should be different in Antarctica and the parameter should be recalculated. In this work, we use the method proposed by Huang et al. [51] to develop a PWV vertical correction model for Antarctica using the PWV derived from ERA5 data.
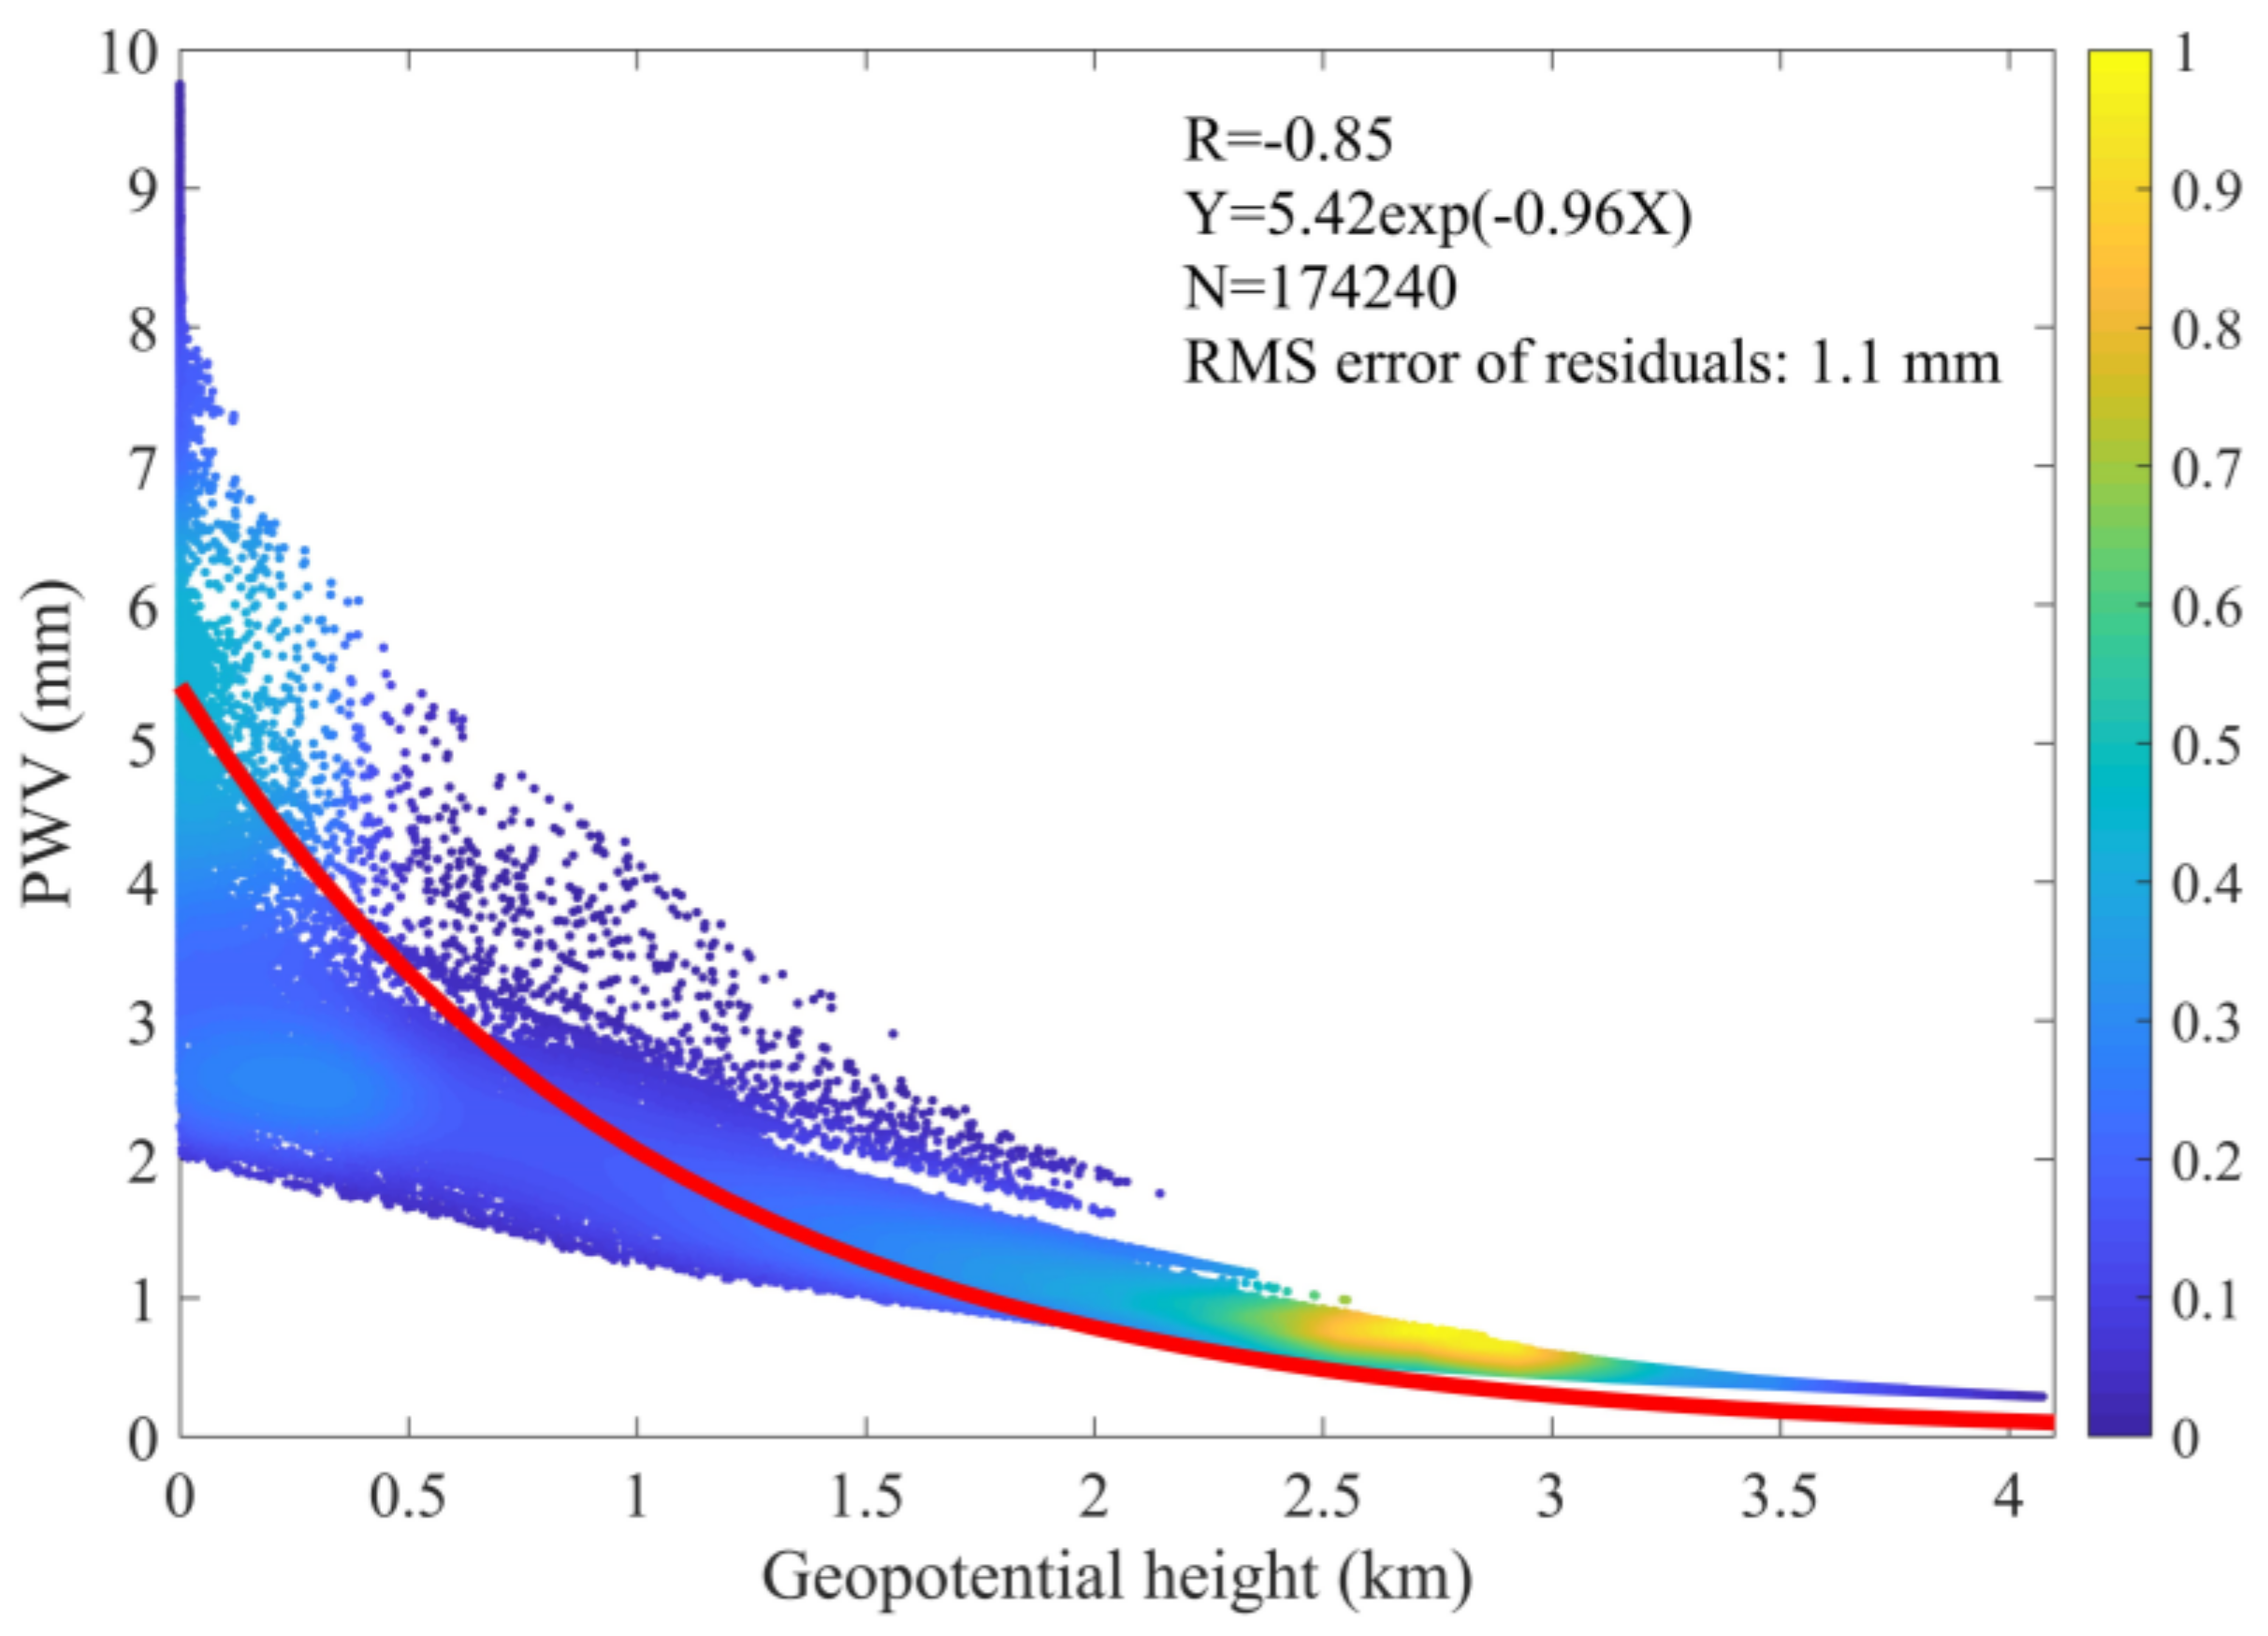
To investigate whether the PWV and its corresponding height would follow the exponential decay equation shown in Equation (5) in Antarctica, the daily ERA5 gridded PWV data in 2018 and corresponding gridded geopotential height data are used to carry out a regression analysis to explore the relationship between PWV and geopotential height over Antarctica. After experiments with MATLAB cftools, we found that the exponential equation could fit well the relation, and the regression analysis result is shown in Figure 2.
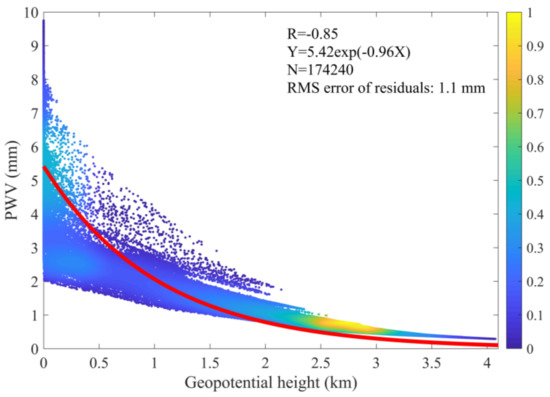
Figure 2.
Regression analysis between the PWV and geopotential height over Antarctica using ERA5 data in 2018 (color indicates the relative density of points).
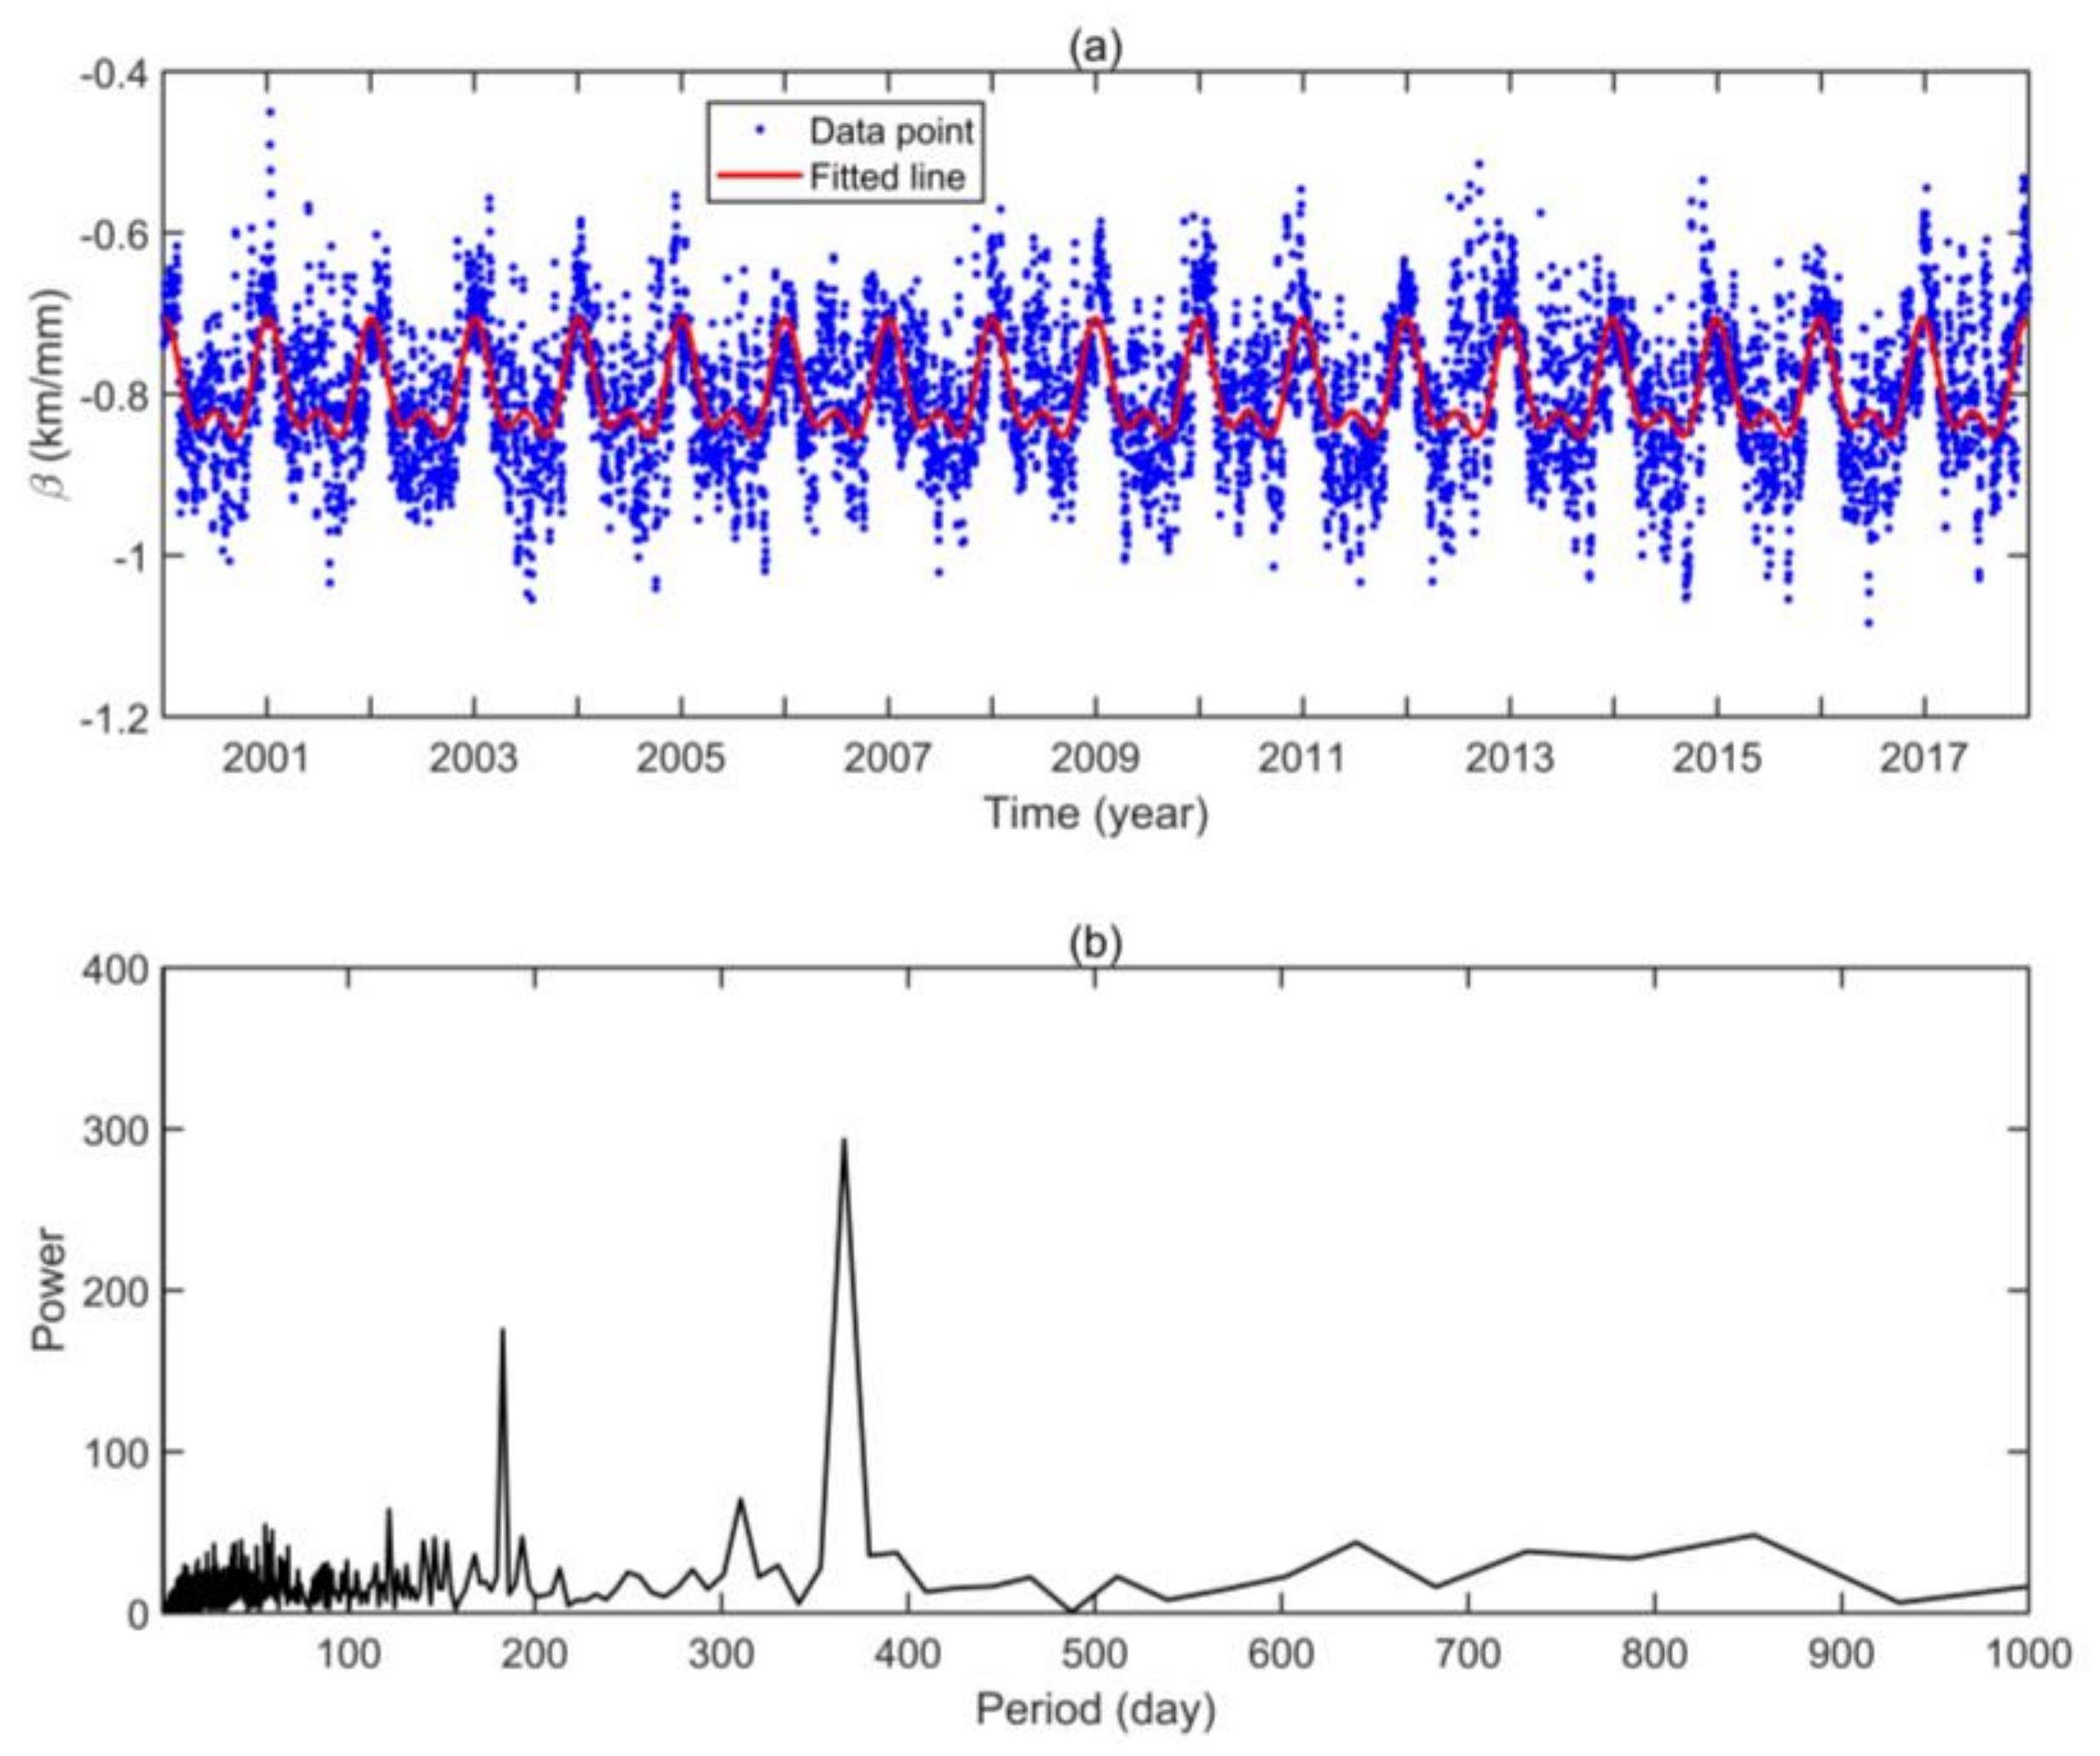
In Figure 2, the regression analysis shows that a significant exponential decay correlation between the PWV and the corresponding height with the correlation coefficient (R) of −0.85, and the exponential decay equation, can fit well PWV versus geopotential height with RMS error of 1.1 mm, indicating that PWV is highly related to elevation in Antarctica, and their relation can be determined as Equation (5). The daily β values are obtained using daily ERA5-derived PWV and the corresponding geopotential height data over Antarctica from 2001 to 2018, and the seasonal variations of the β are investigated. In addition, the fast Fourier transform (FFT) algorithm is performed to detect the characteristic periodicity of β. The results are shown in Figure 3.
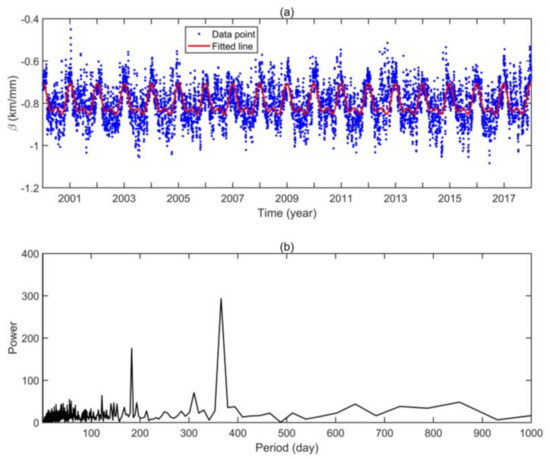
Figure 3.
(a) Seasonal variations in the β from 2001 to 2018 using the daily ERA5-derived PWV and geopotential height data over Antarctica, and (b) the results of periodicity detection for the β using the FFT algorithm.
As shown in Figure 3, β clearly shows a strong correlation with time and seasonal variations, therefore, β can be modeled as:
where DOY is the day of the year; β0 is the mean value of the β; (β1, β2) and (β3, β4) are the annual and semiannual periodicity coefficients of the β, respectively. These model coefficients can be estimated by applying the least squares method to the daily β from 2001 to 2018 based on Equation (6), and the model coefficient values of β0, β1, β2, β3 and β4 are −0.799, 0.058, 0.003, 0.035 and −0.003, respectively. When using this regional PWV vertical correction model for Antarctica, only the PWV, height, target height and DOY are required. The PWV values at the target height can be calculated using the model through Equations (5) and (6).
2.5. Method for Linear Trend Estimation
PWV linear trends in time were estimated using the Theil–Sen method [52]. The Theil–Sen method is a non-parametric method that estimates the trend by calculating the median of slopes of lines through all pairs of points in the time series. This method provides a more robust slope estimate than the least squares method since it is insensitive to extreme or outlier values, particularly for relatively small data sets, and it can also reduce the effects of autocorrelation in time series [53]. The Theil–Sen method is exploited to estimate the PWV trends are as:
where yj and yi are the monthly PWV anomaly values at time tj and ti (j > i), respectively. The monthly PWV anomalies are obtained by removing the monthly PWV climatology (mean value of monthly PWV over the whole period from 2001 to 2018) from the monthly PWV. To understand the PWV change intuitively, the percentage trend Ptrend (unit: % decade−1) is used in this work [54]:
where is the annual average PWV value. The statistical significance of trends is assessed using a modified Mann–Kendall trend test [55] with a 10% significance level.
In the analysis of the PWV time series, the daily PWV values are obtained by averaging hourly PWV data, the monthly PWV values are generated by averaging daily PWV values and then the annual PWV values are calculated by averaging the monthly PWV values. In addition, the seasonal PWV values are computed for December-January-February (DJF), March-April-May (MAM), June-July-August (JJA) and September-October-November (SON) by averaging the monthly PWV values in each season. To ensure that the computed PWV values can represent the monthly, seasonal and annual means, the monthly PWV is computed from the daily PWV when at least half of the expected monthly data (i.e., at least nearly 15 days of data) are available, the seasonal PWV is calculated from the monthly PWV if at least 2 months of data are available and the annual PWV is generated from the monthly PWV when at least 10 out of 12 months of data are available.
3. Assessment of PWV from Reanalyses by Radiosonde and GNSS Observations
The reliability of the reanalyses is required to be assessed before they are further applied to estimate PWV variability and trends. As mentioned above, radiosonde and GNSS techniques can measure the PWV content with high accuracy. Therefore, we carried out an evaluation to evaluate the ERA5, MERRA-2, JRA-55 and NCEP/DOE-derived PWV using radiosonde and GNSS observations. First, the PWV derived from GNSS observations were evaluated using collocated radiosonde stations. After verifying the GNSS PWV results with respect to radiosonde, the four reanalysis PWV products were evaluated using 18 years of concurrent estimates at radiosonde and GNSS stations. A quality control method [36] is implemented in each PWV comparison: PWV differences with deviation from the mean value larger than three times the standard deviation are rejected as gross errors.
3.1. Comparison of GNSS-Derived PWV with Radiosonde Observations
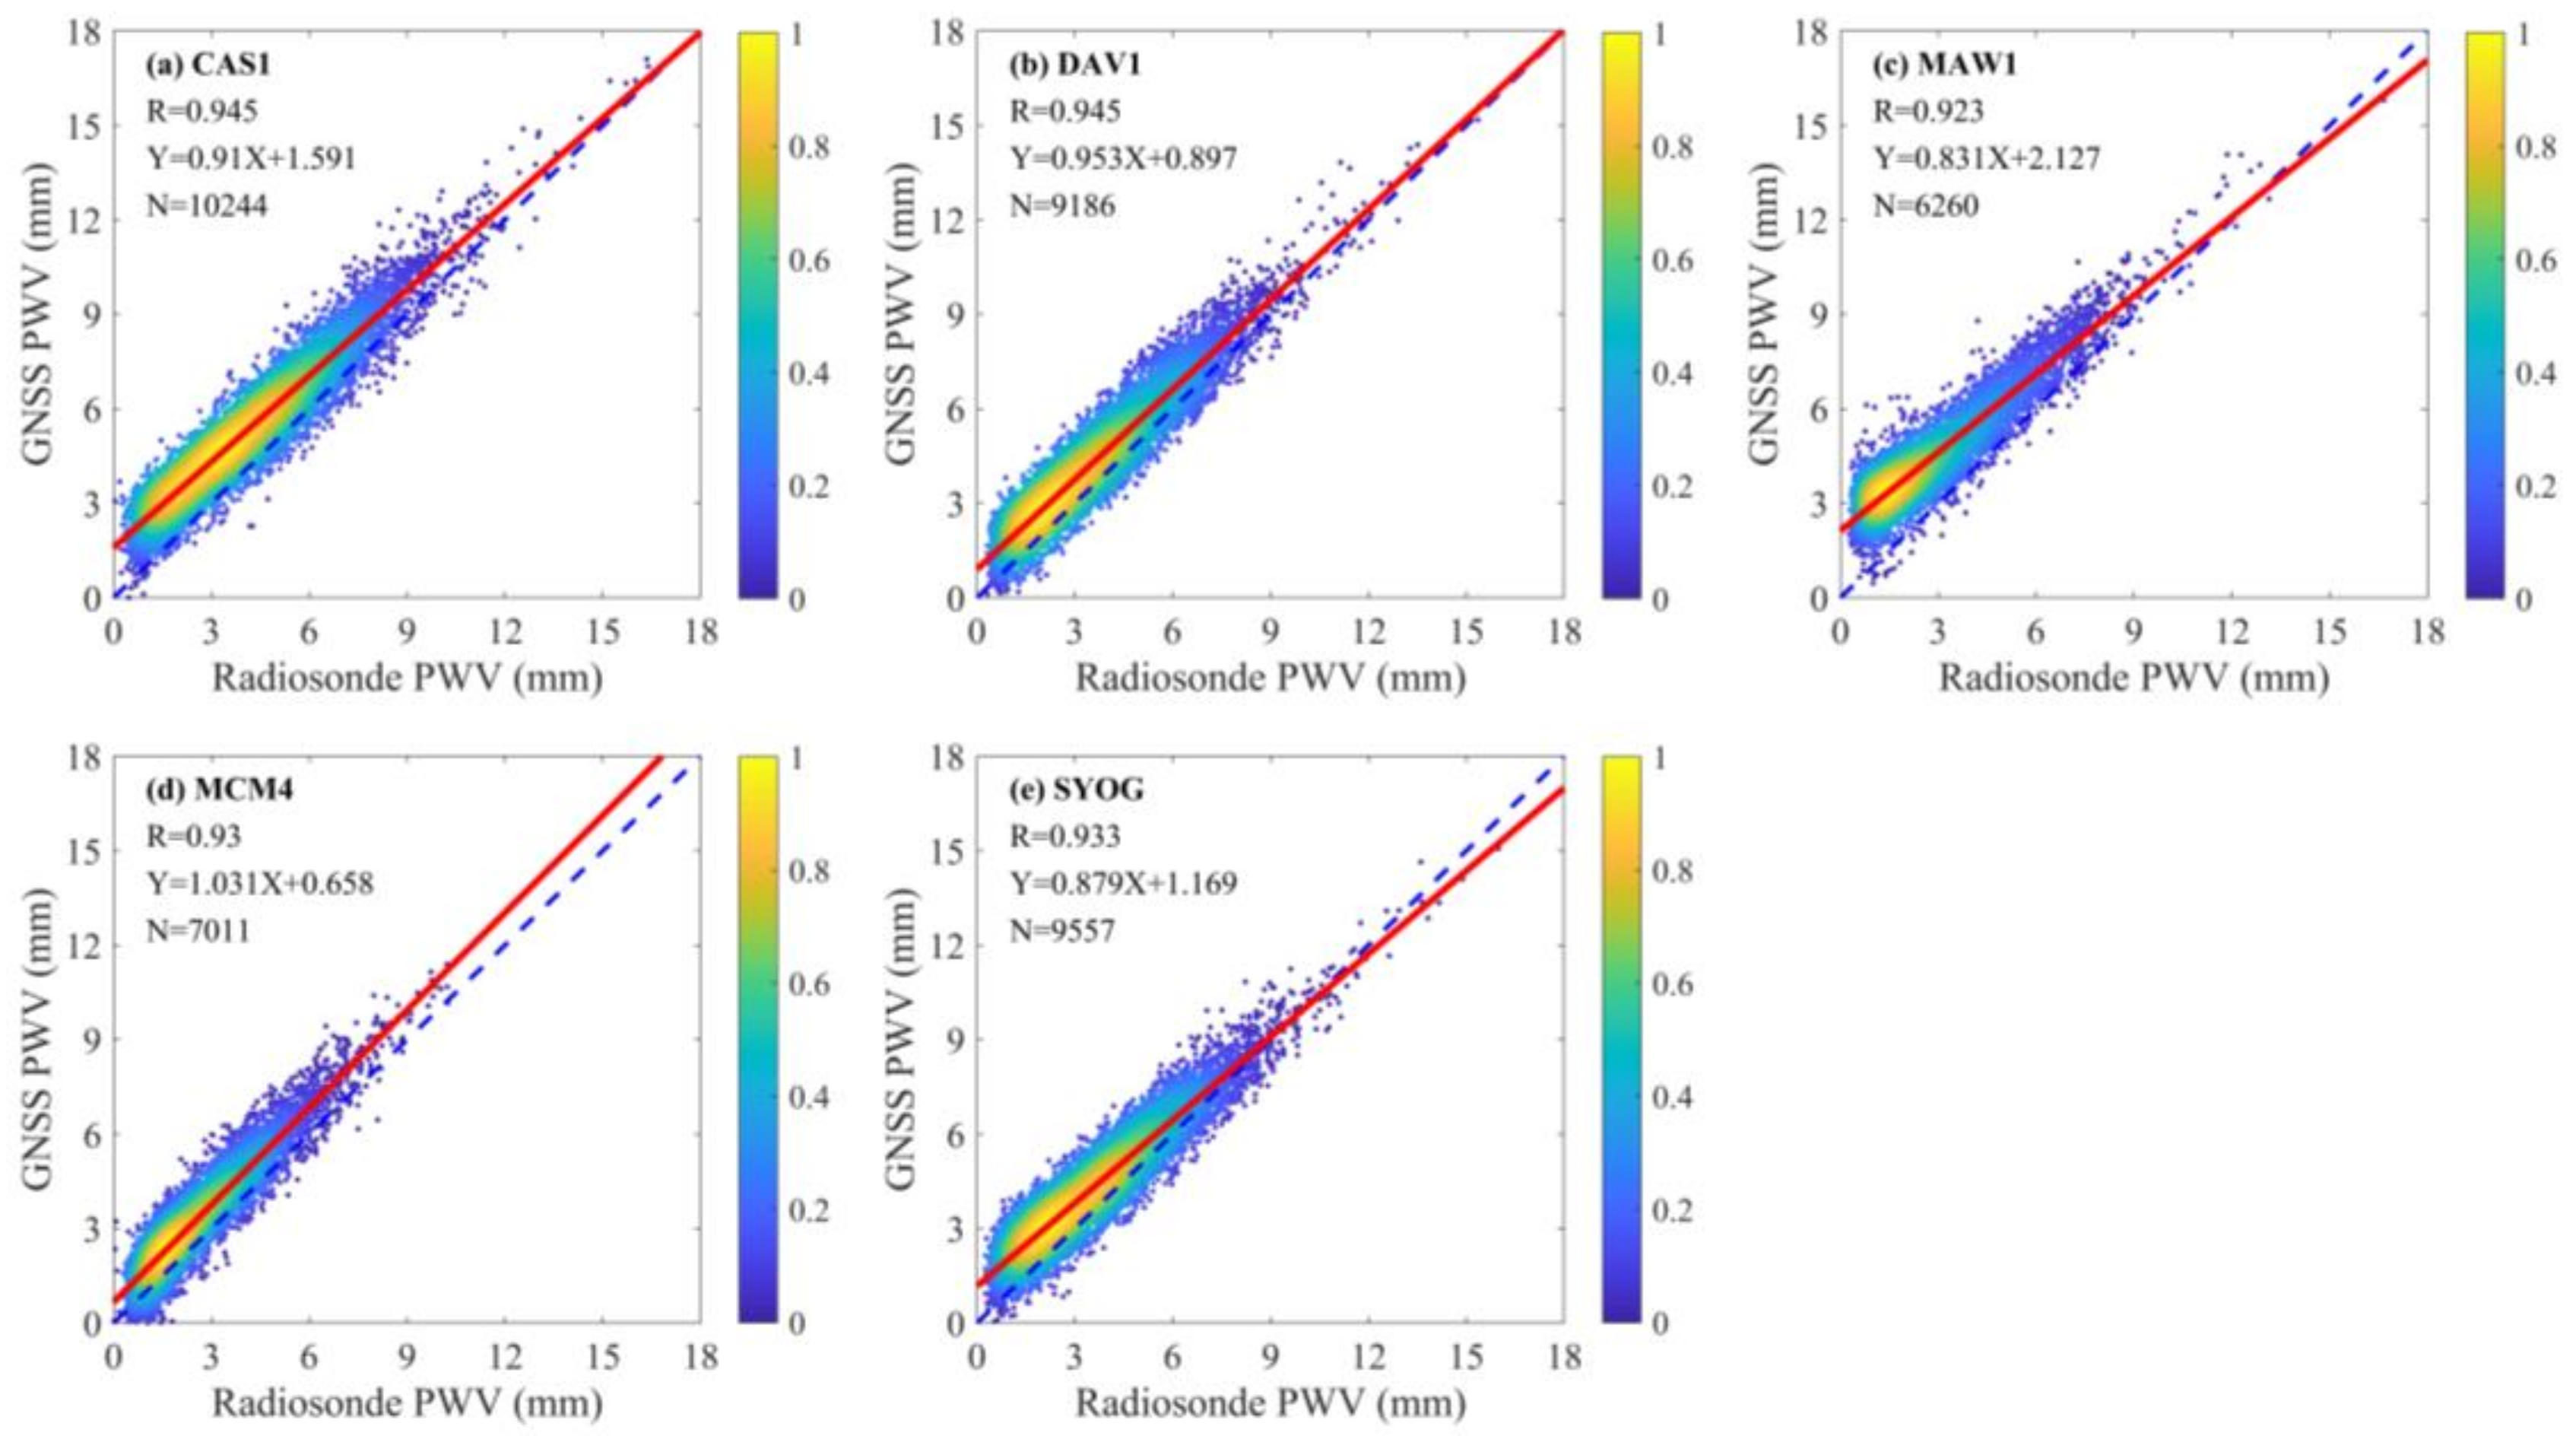
As independent measurements, radiosonde observations are constantly used as a standard to confirm the results of the GNSS-derived PWV [11]. The quality of the GNSS-derived PWV needs to be verified using radiosonde observations before using GNSS to assess the reanalysis data. To minimize the impacts caused by distance and height differences between the GNSS and radiosonde stations, five collocated sites were selected for the PWV comparison, and the distances and height differences between the GNSS and collocated radiosonde stations are all within 2 km and 100 m, respectively. Comparisons of GNSS-derived PWV with radiosonde-derived PWV at the five collocated sites during the period from 2001 to 2018 are shown in Figure 4, and statistical comparison results are shown in Table 2.
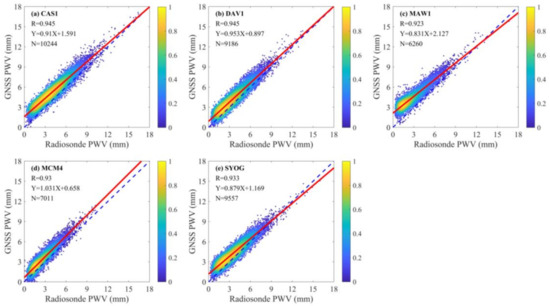
Figure 4.
Relative number density plots for PWV from radiosondes and GNSS at the five collocated sites during 2001–2018: (a) CAS1, (b) DAV1, (c) MAW1, (d) MCM4 and (e) SYOG. The color scale indicates the relative density of points.

Table 2.
Statistical results of the comparison between GNSS-derived PWV and radiosonde-derived PWV at the five collocated sites from 2001 to 2018.
According to Figure 4, the GNSS-derived PWV at all five stations show good agreement with the corresponding radiosonde estimates. Compared with the radiosonde-derived PWV, the GNSS PWV shows a strong correlation with the radiosonde PWV at the five collocated stations with a mean R value of 0.935, and all the R values are larger than 0.92. In Table 2, the mean biases between the radiosonde-derived and GNSS-derived PWV at the five collocated stations are all positive with the range of 0.72–1.54 mm, indicating that the GNSS-derived PWV is prone to slight overestimation in Antarctica. Unfortunately, the reason for the bias remains to be determined. Potential factors contributing to the bias may be the antenna phase center variation at GNSS stations, which directly impacts the GNSS PWV estimates [56], or uncertainty in radiosonde observations [57] or the position offsets between the radiosonde and GNSS stations [58]. In terms of RMS error, the overall mean RMS error at the five sites is 1.12 mm with the range of 0.94–1.68 mm, which shows high accuracy and is consistent with the findings of previous studies [12,15]. Therefore, the GNSS-derived PWV could be used as a reference to assess the PWV estimates derived from reanalyses.
3.2. Verification of Reanalysis-Derived PWV by Radiosonde and GNSS Observations
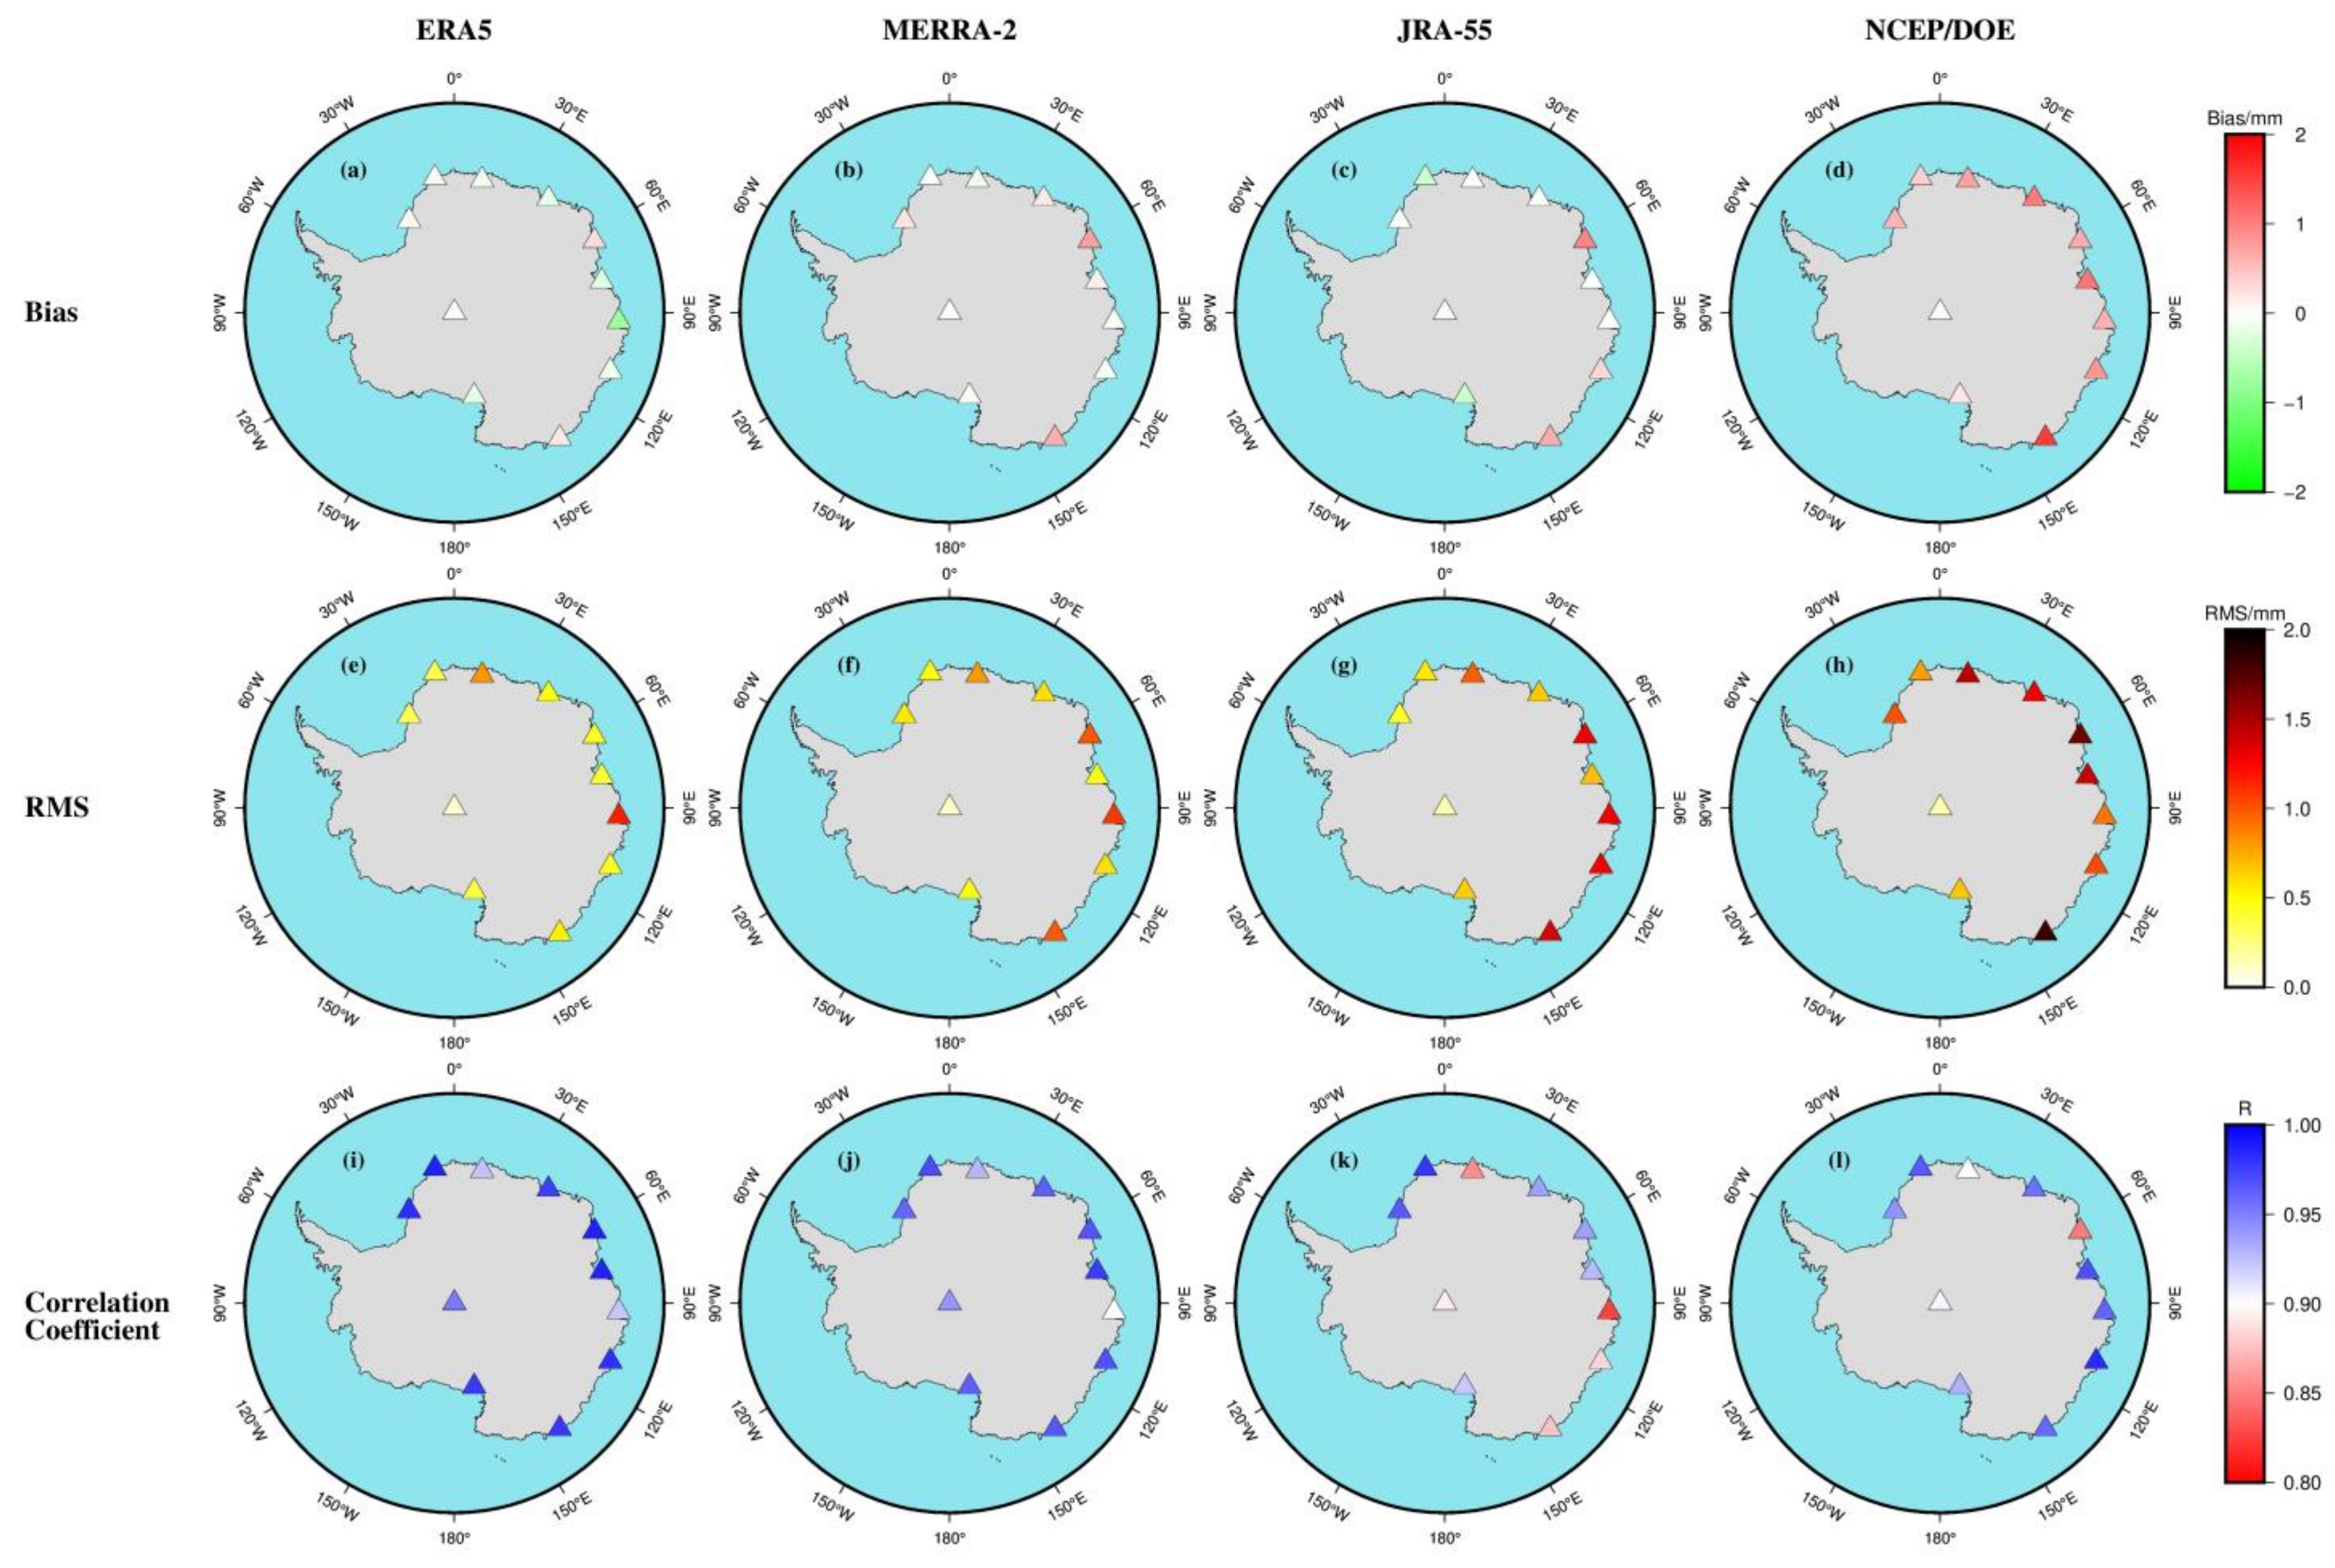
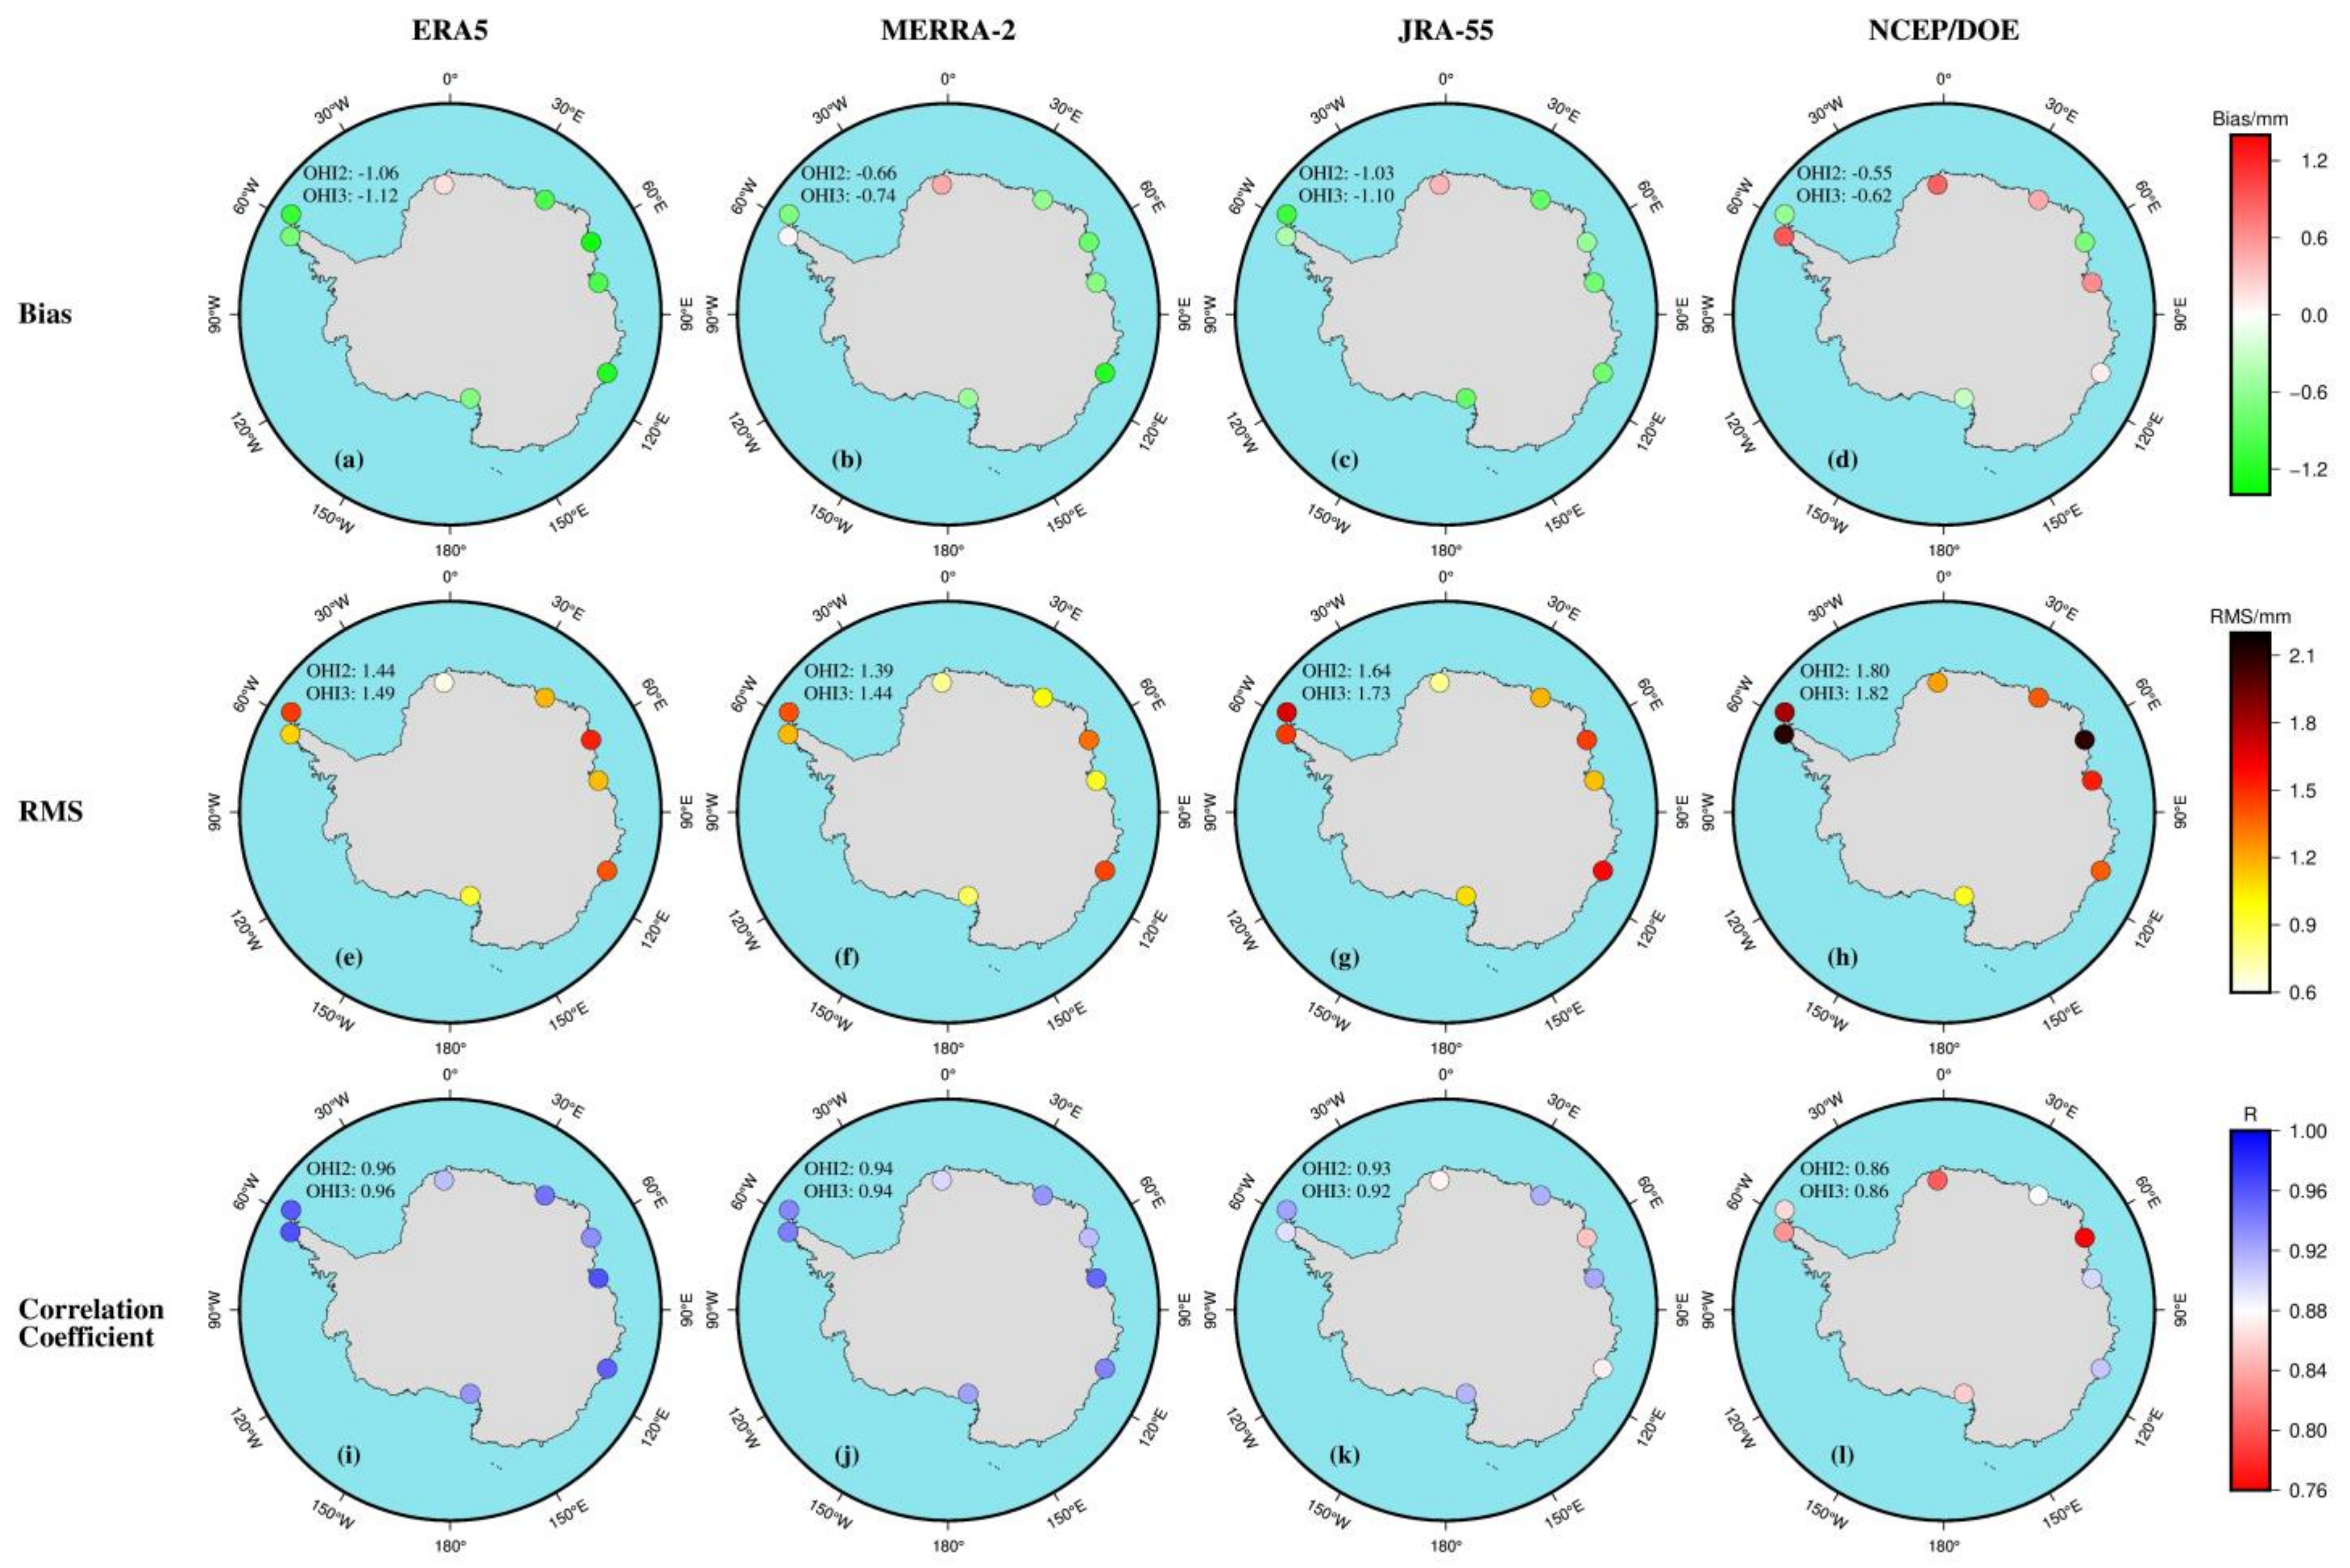
The accuracies of the four reanalysis-derived PWV are evaluated using concurrent PWV estimates from radiosonde and GNSS observations. Table 3 gives the bias, RMS, relative RMS and R of the differences between ERA5/MERRA-2/JRA-55/NCEP-derived PWVs and radiosonde/GNSS-measured PWVs during the period from 2001 to 2018. The spatial distributions of the bias, RMS and R of the four reanalysis products validated by radiosonde and GNSS stations are depicted in Figure 5 and Figure 6, respectively.

Table 3.
Statistical results of the assessment of PWV derived from four reanalyses by radiosonde- and GNSS-derived PWV from 2001 to 2018.
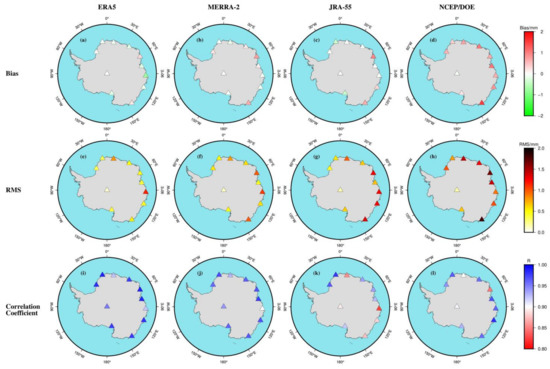
Figure 5.
Spatial distributions of the (top) bias, (middle) RMS and (bottom) correlation coefficient of the PWV between (a,e,i) ERA5 and radiosonde, (b,f,j) MERRA-2 and radiosonde, (c,g,k) JRA-55 and radiosonde and (d,h,l) NCEP/DOE and radiosonde in Antarctica from 2001 to 2018.
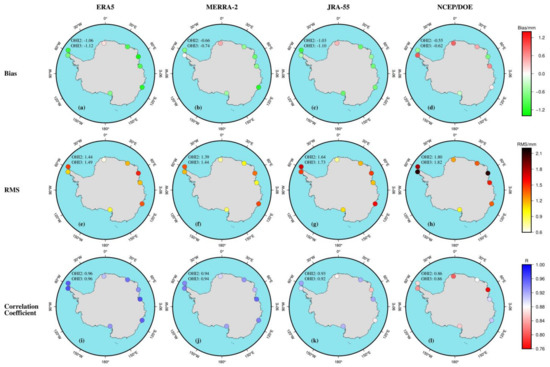
Figure 6.
Spatial distributions of the (top) bias, (middle) RMS and (bottom) correlation coefficient of the PWV between (a,e,i) ERA5 and GNSS, (b,f,j) MERRA-2 and GNSS, (c,g,k) JRA-55 and GNSS and (d,h,l) NCEP/DOE and GNSS in Antarctica from 2001 to 2018.
In the evaluation with respect to radiosonde, ERA5 gets the highest accuracy with respect to MERRA-2, JRA-55 and NCEP/DOE with mean bias, RMS, relative RMS and R values of −0.1 mm, 0.5 mm, 15.45% and 0.97, respectively. However, NCEP/DOE shows a worse accuracy than the other three reanalyses with mean bias, RMS, relative RMS and R values of 0.69 mm, 1.11 mm, 34.88% and 0.95, respectively. The R values between the reanalysis-derived PWV and radiosonde-derived PWV for eleven stations vary between 1 and 0.8, which indicates that the PWVs derived from reanalysis and radiosonde have strong correlations at these sites. As shown in Figure 5, compared with radiosonde, the R values of ERA5 and MERRA-2 are slightly higher than JRA-55 and NCEP/DOE among the radiosonde stations (see Figure 5i–l). Positive biases are observed in most sites except for ERA5, which are nearly 0 mm level. The RMS errors of the four reanalyses are all below 2 mm at all 11 radiosonde stations, and ERA5 shows a best performance with respect to other reanalyses, while NCEP/DOE performs the worst. All reanalyses seem to have low biases and RMS errors; however, NCEP/DOE has a larger relative RMS error of 34.88%. It is better to refer to relative RMS errors instead of considering biases and RMS errors only, especially in Antarctica where the PWV contents are very low. The sites with larger RMS errors in the four reanalyses are mainly located in coastal East Antarctica; the water vapor and its uncertainty are relatively large under the influence of the ocean.
In the evaluation with respect to GNSS, the PWV accuracies of ERA5 and MERRA-2 are higher than JRA-55 and NCEP/DOE among the four reanalyses in accordance with the mean RMS and relative RMS values (see Table 3). Nevertheless, the biases, RMS and relative RMS errors for all four reanalyses are larger than those with respect to radiosonde. The main reason is attributed to the fact that radiosonde observations are already assimilated to the reanalyses [26,51]. Therefore, it is normal to find a better agreement as radiosonde data were assimilated in reanalysis models. GNSS-observed PWV are independent of reanalysis models and constitute a robust validation data set. Compared with the GNSS estimates, the PWVs derived from four reanalyses show strong correlations with the GNSS-derived PWV at all nine sites with the R values ranging from 0.76 to 1. In Figure 6, all reanalyses show significant negative biases at most stations except for NCEP/DOE, indicating that the reanalysis-derived PWV is slightly lower than the GNSS-derived PWV in Antarctica. The RMS errors of the four reanalyses are all below 2.2 mm at all nine GNSS stations and the relative RMS errors are all below 36%. At most GNSS sites, NCEP/DOE has the poorest performance among the four reanalyses with higher RMS values, while the other three reanalyses show lower RMS values.
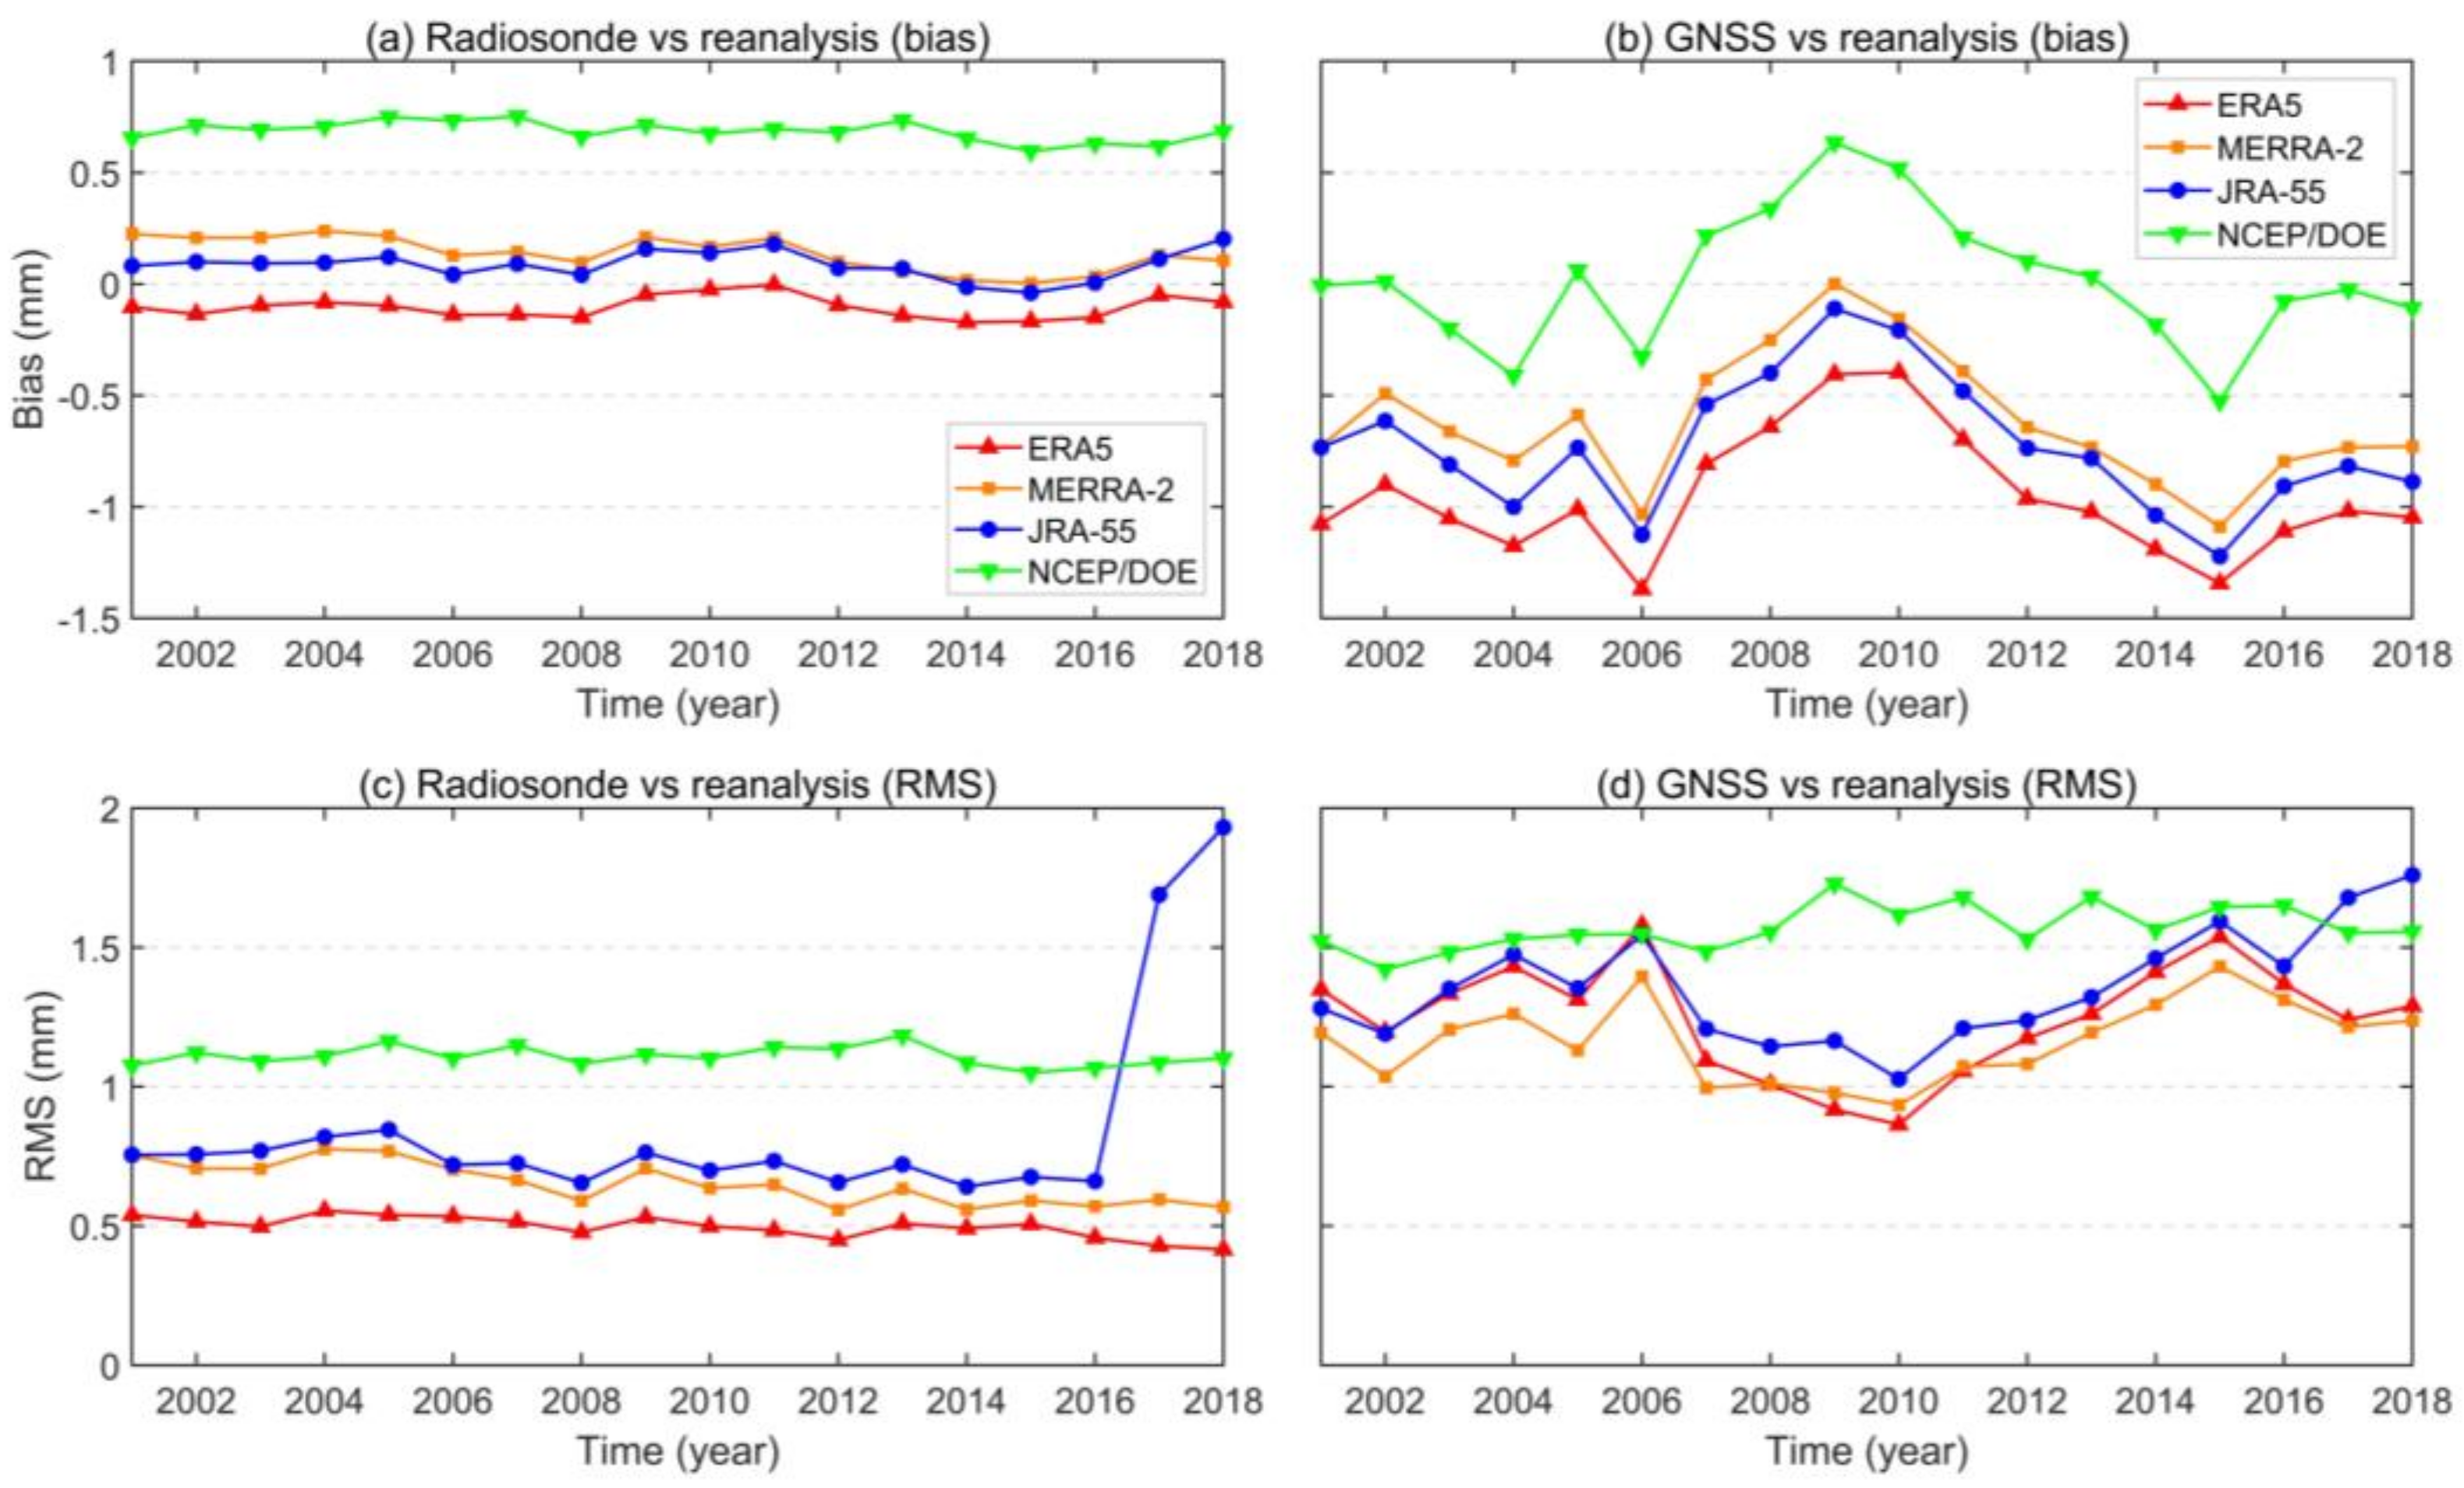
For an each-year comparison, Figure 7 presents the variations of bias and RMS error with year. In the comparison between radiosonde and reanalysis data, the biases and RMS errors of four reanalyses are small and steady without large fluctuations, except for JRA-55 which has a sudden increase in RMS errors from 2017 to 2018. The RMS errors of JRA-55 in 2017–2018 are nearly 1 mm larger than those of the other years, which are caused by the large differences between JRA-55 and radiosonde observations at several radiosonde stations. This issue in JRA-55 requires to be further investigated once more in situ observations are available in Antarctica. Compared with radiosonde, the biases and RMS errors have larger fluctuations in the comparison between GNSS and reanalysis data. Such issues may be caused by the changes in GNSS equipment (such as the receiver type, and the antenna brand and model) and the varying processing strategies (such as the software, and the mapping function and input parameter) in IGS ZTD product over time [59]. Even so, the fluctuations are not large, with RMS values fluctuating around 0.5 mm. It is noteworthy that the higher the spatial resolution of reanalyses is, the higher the accuracy of reanalyses is. This can be explicable by the fact that the better performance of the reanalysis models is attributed not only to the spatial resolution, but also to underlying better physical models and assimilation methods [24,51].
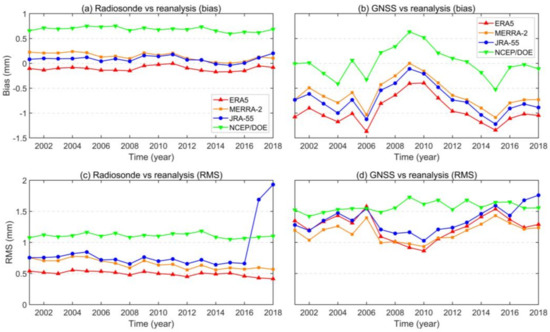
Figure 7.
The (a,b) biases and (c,d) RMS errors of PWV differences between (left) radiosonde and four reanalyses, and (right) GNSS and four reanalyses for each year from 2001 to 2018.
4. PWV Means, Variability and Trend
4.1. PWV Means and Variability
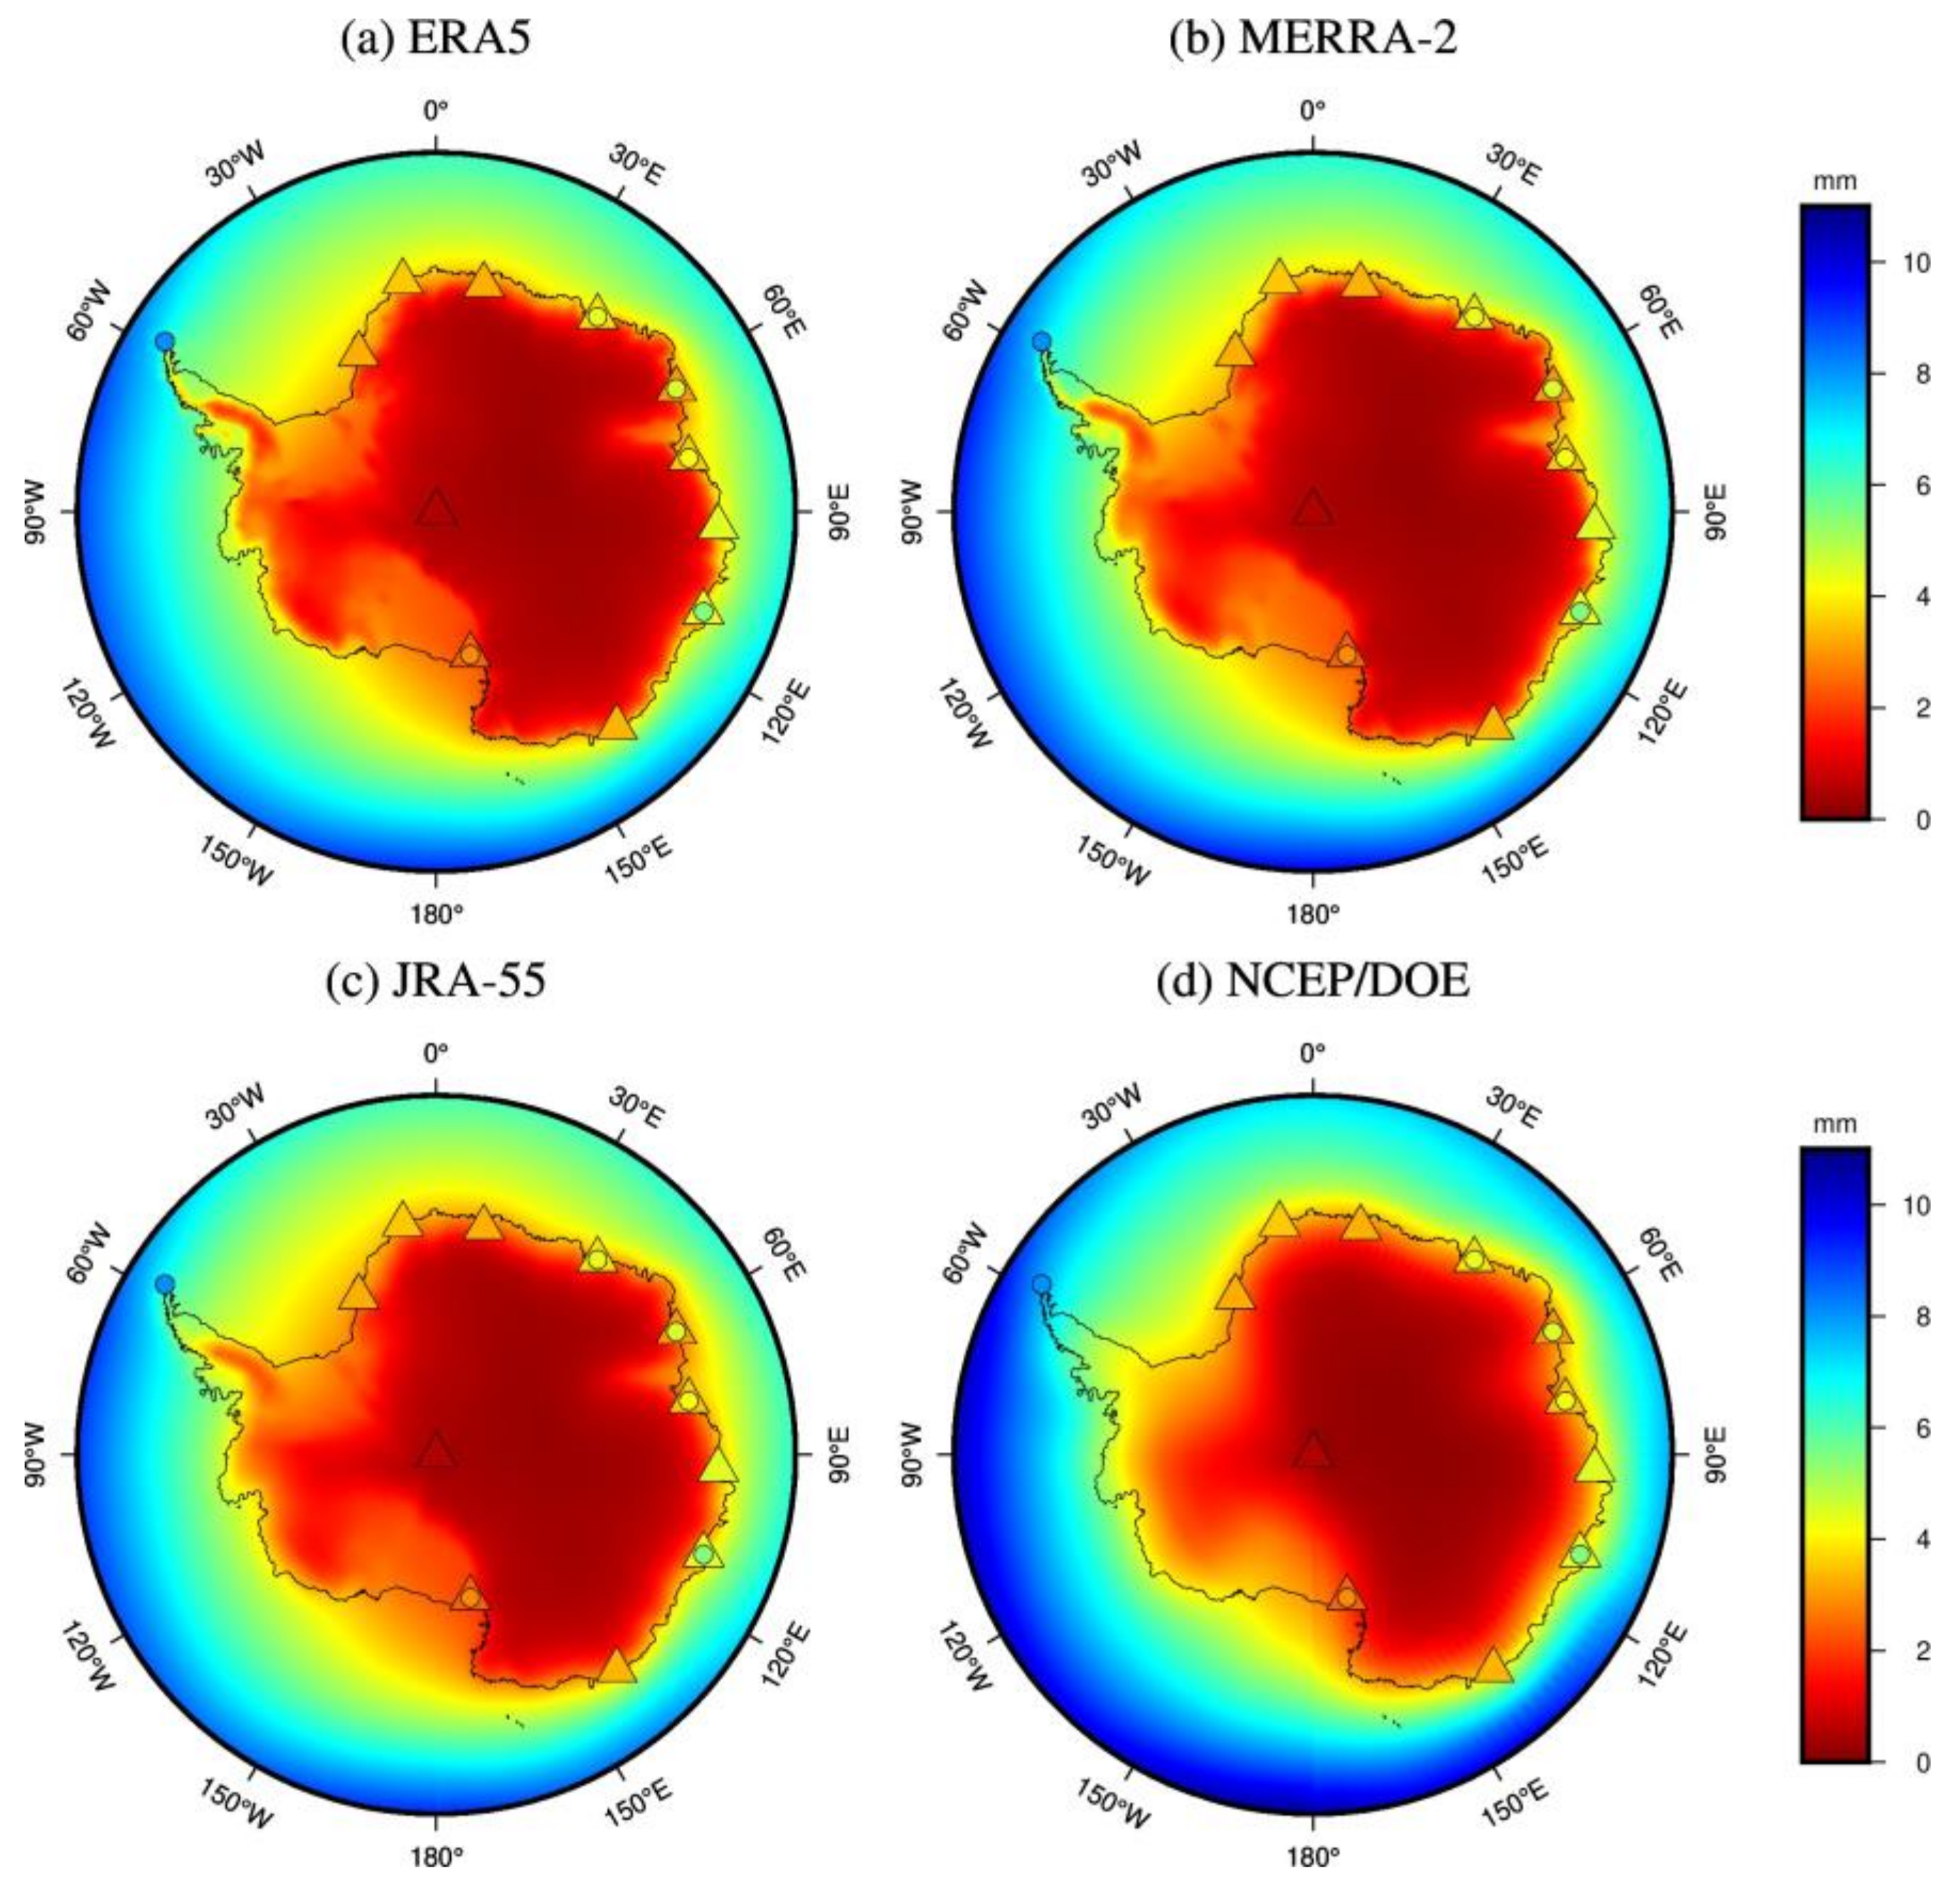
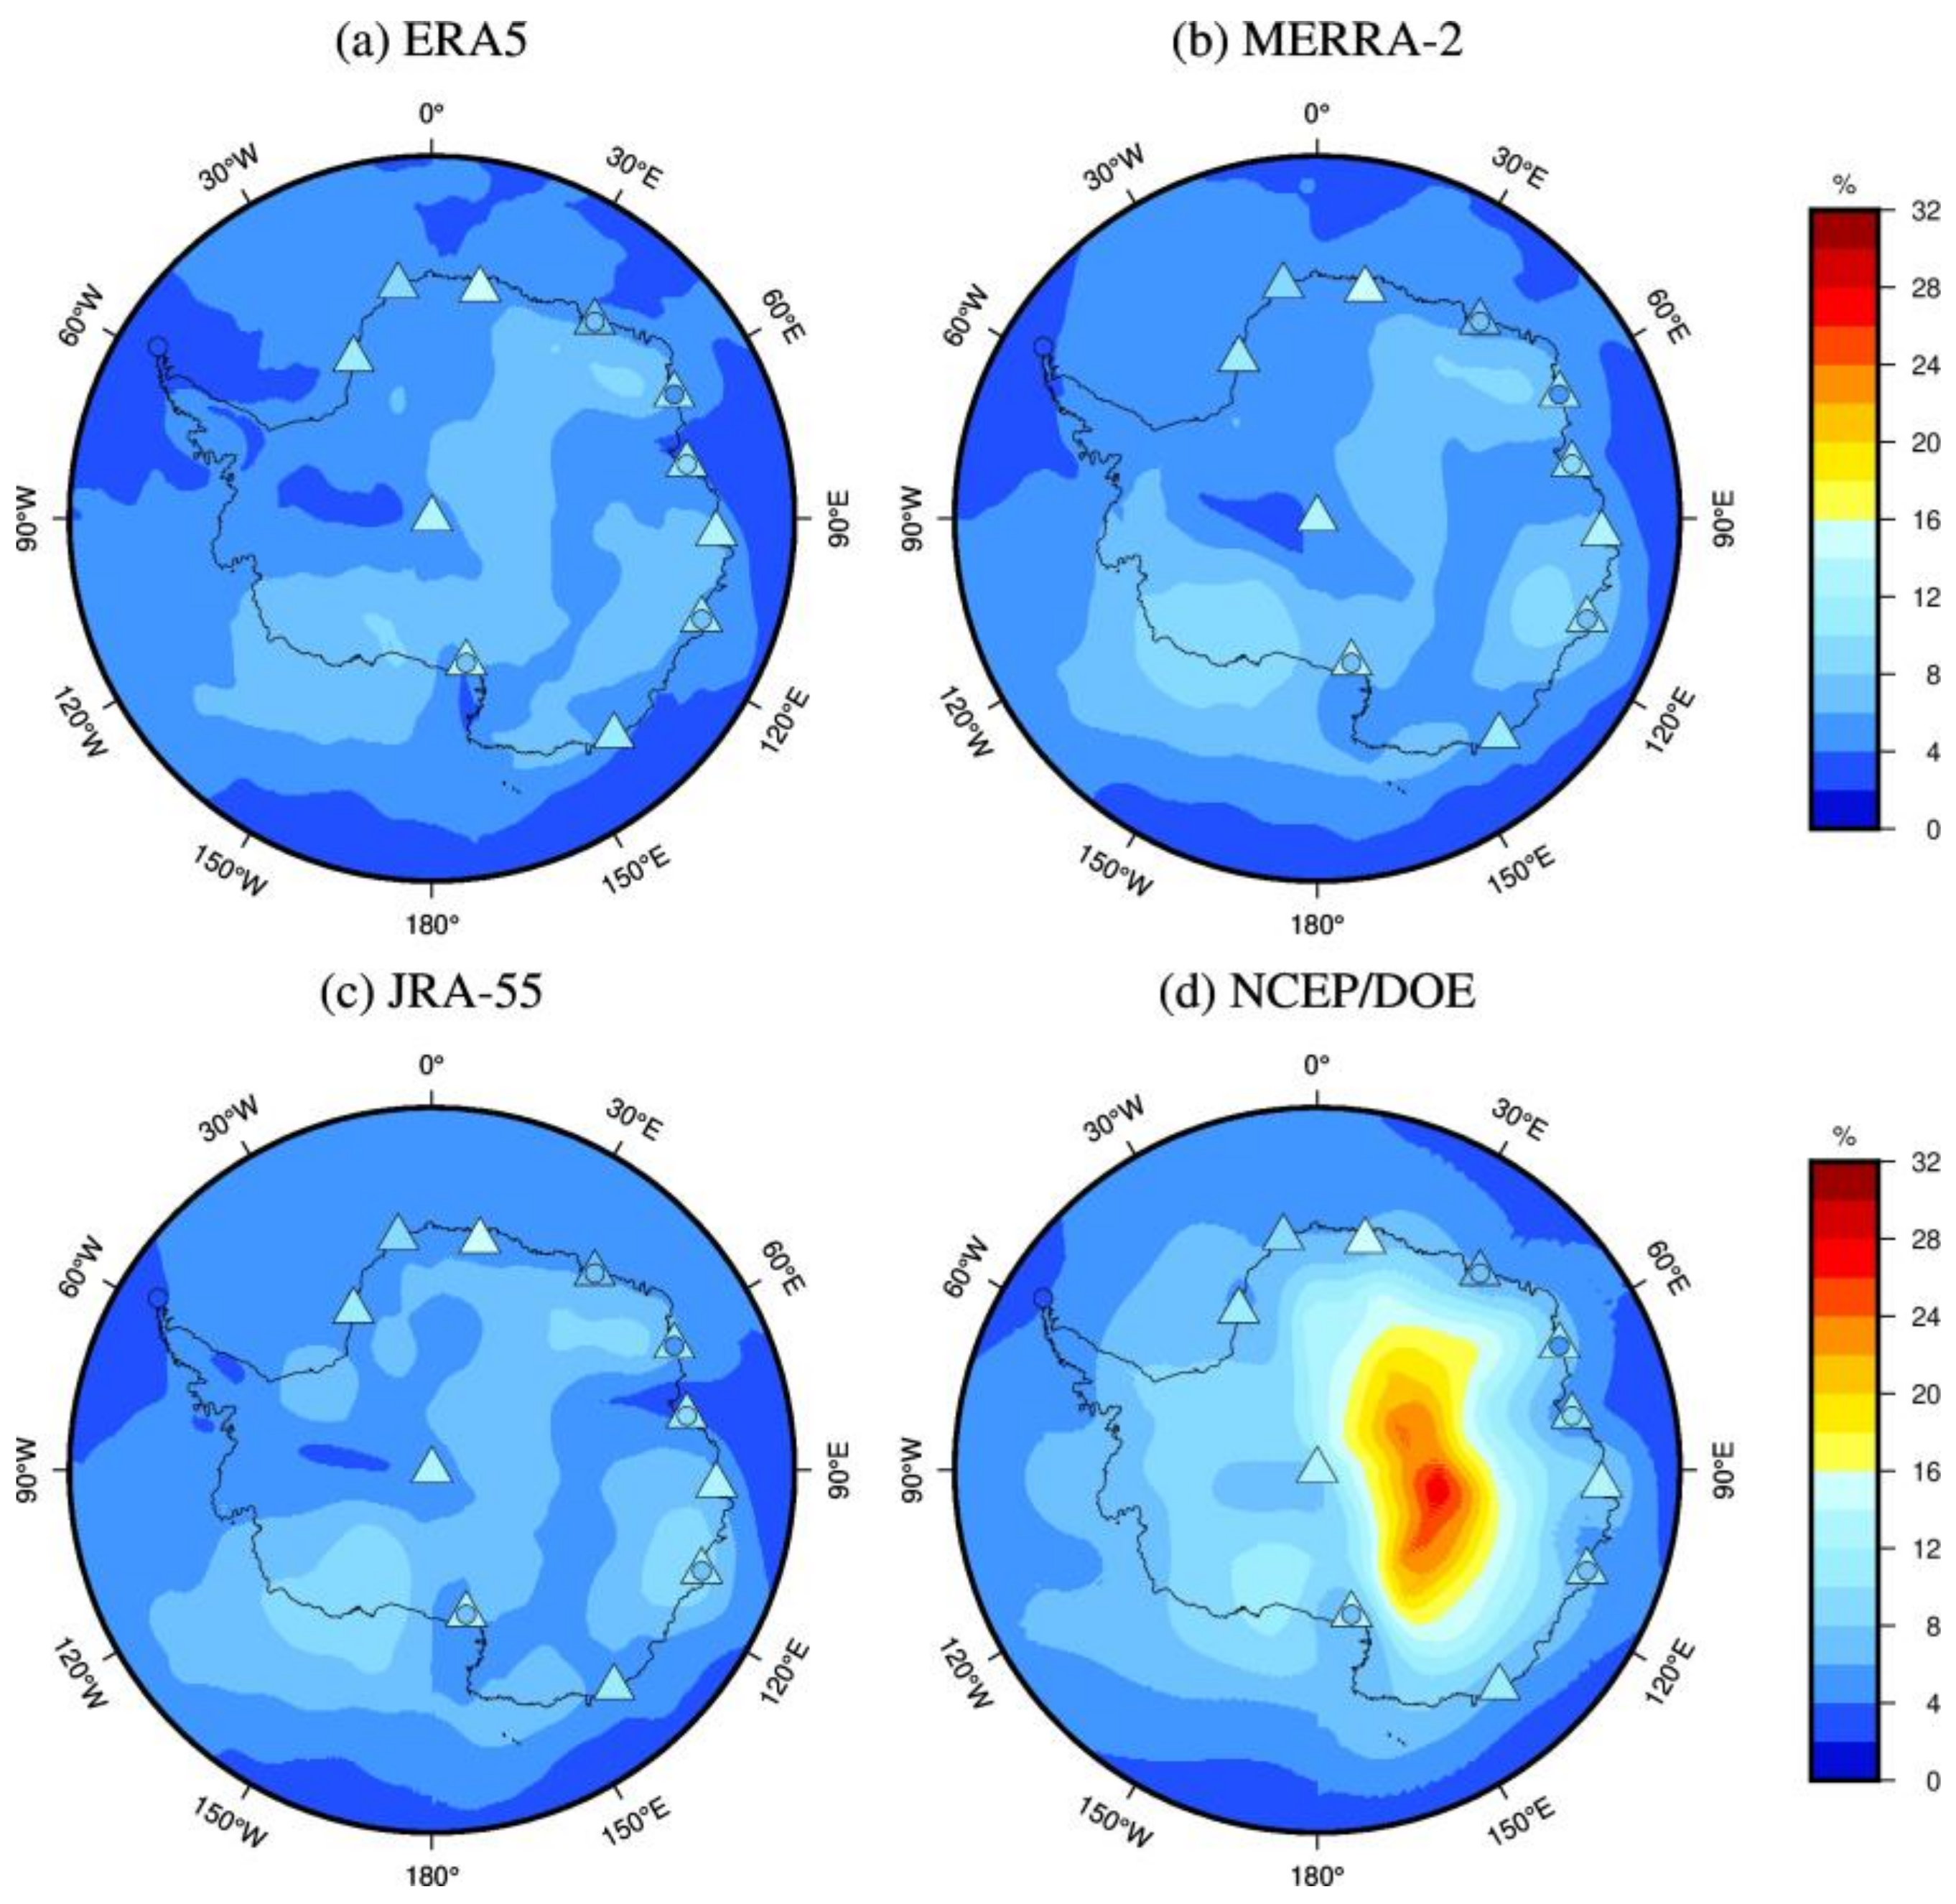
Figure 8 shows the spatial distribution of PWV means derived from ERA5, MERRA-2, JRA-55 and NCEP/DOE reanalysis in Antarctica from 2001 to 2018. The mean PWV derived from the eleven radiosonde and seven GNSS sites (the GNSS stations VESL and PALM are excluded because only ten years of data are available) are also presented for comparison. Their PWV interannual variability are also calculated (standard deviation of the PWV series divided by its mean) and presented in Figure 9. From Figure 8, the spatial distributions of PWV means derived from ERA5, MERRA-2, JRA-55 and NCEP/DOE reanalysis data sets are consistent with the radiosonde-derived and GNSS-derived PWV, and they reproduce the spatial variability well compared to the radiosonde and GNSS data. The PWV spatial distribution patterns reproduced by these four reanalyses are generally similar, but ERA5, MERRA-2 and JRA-55 show more details of PWV spatial distribution than NCEP/DOE due to their higher spatial resolution, including sharper gradients in PWV. For example, on the eastern and western flanks of Antarctica, in the regions of steep orography (for instance, along the Ellsworth Mountains, which are the highest mountain ranges in Antarctica), NCEP/DOE fails to reproduce these details. The annual mean PWV content varies in the range of 0–11 mm in Antarctica. Larger mean PWV content occurs in the ocean around Antarctica, whereas a lower average PWV content is observed in the Antarctic continent with a range of 0–7 mm. Particularly for the Eastern Antarctic Plateau, the mean PWV content is less than 4 mm due to the higher terrain and desert regions. Figure 9 shows that the PWV variability derived from ERA5, MERRA-2 and JRA-55 reanalysis has similar patterns except for some small discrepancies, and all agree well with the radiosonde and GNSS data. In Antarctica, the PWV keeps at a low level all year round and its interannual variability is small in most regions, less than 10%. Furthermore, the interannual variability of PWV generally shows slightly stronger over the land with respect to the ocean. However, compared with other reanalyses, NCEP/DOE is observed a huge discrepancy in East Antarctica, with very strong PWV variability (exceeding 16%), which is unrealistic.
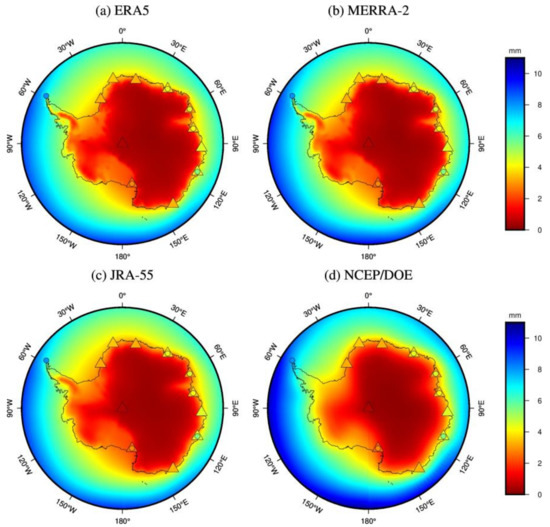
Figure 8.
Spatial distribution of PWV means over Antarctica for 2001 to 2018 derived from (a) ERA5, (b) MERRA-2, (c) JRA-55, (d) NCEP/DOE reanalysis (color shading), GNSS (color circles) and radiosonde (color triangles).
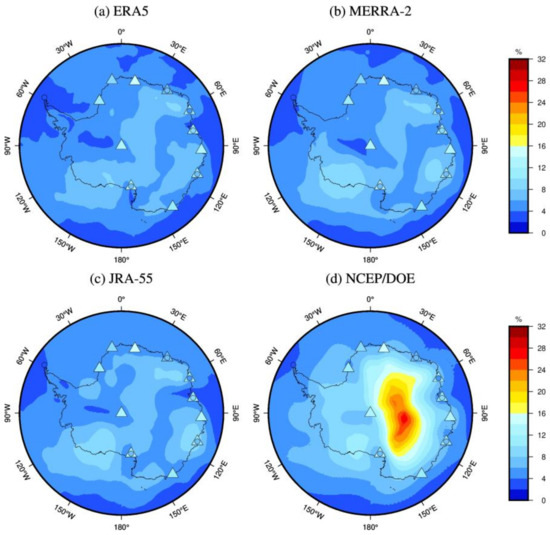
Figure 9.
PWV relative variability over Antarctica for 2001 to 2018 derived from (a) ERA5, (b) MERRA-2, (c) JRA-55, (d) NCEP/DOE reanalysis (color shading), GNSS (color circles) and radiosonde (color triangles).
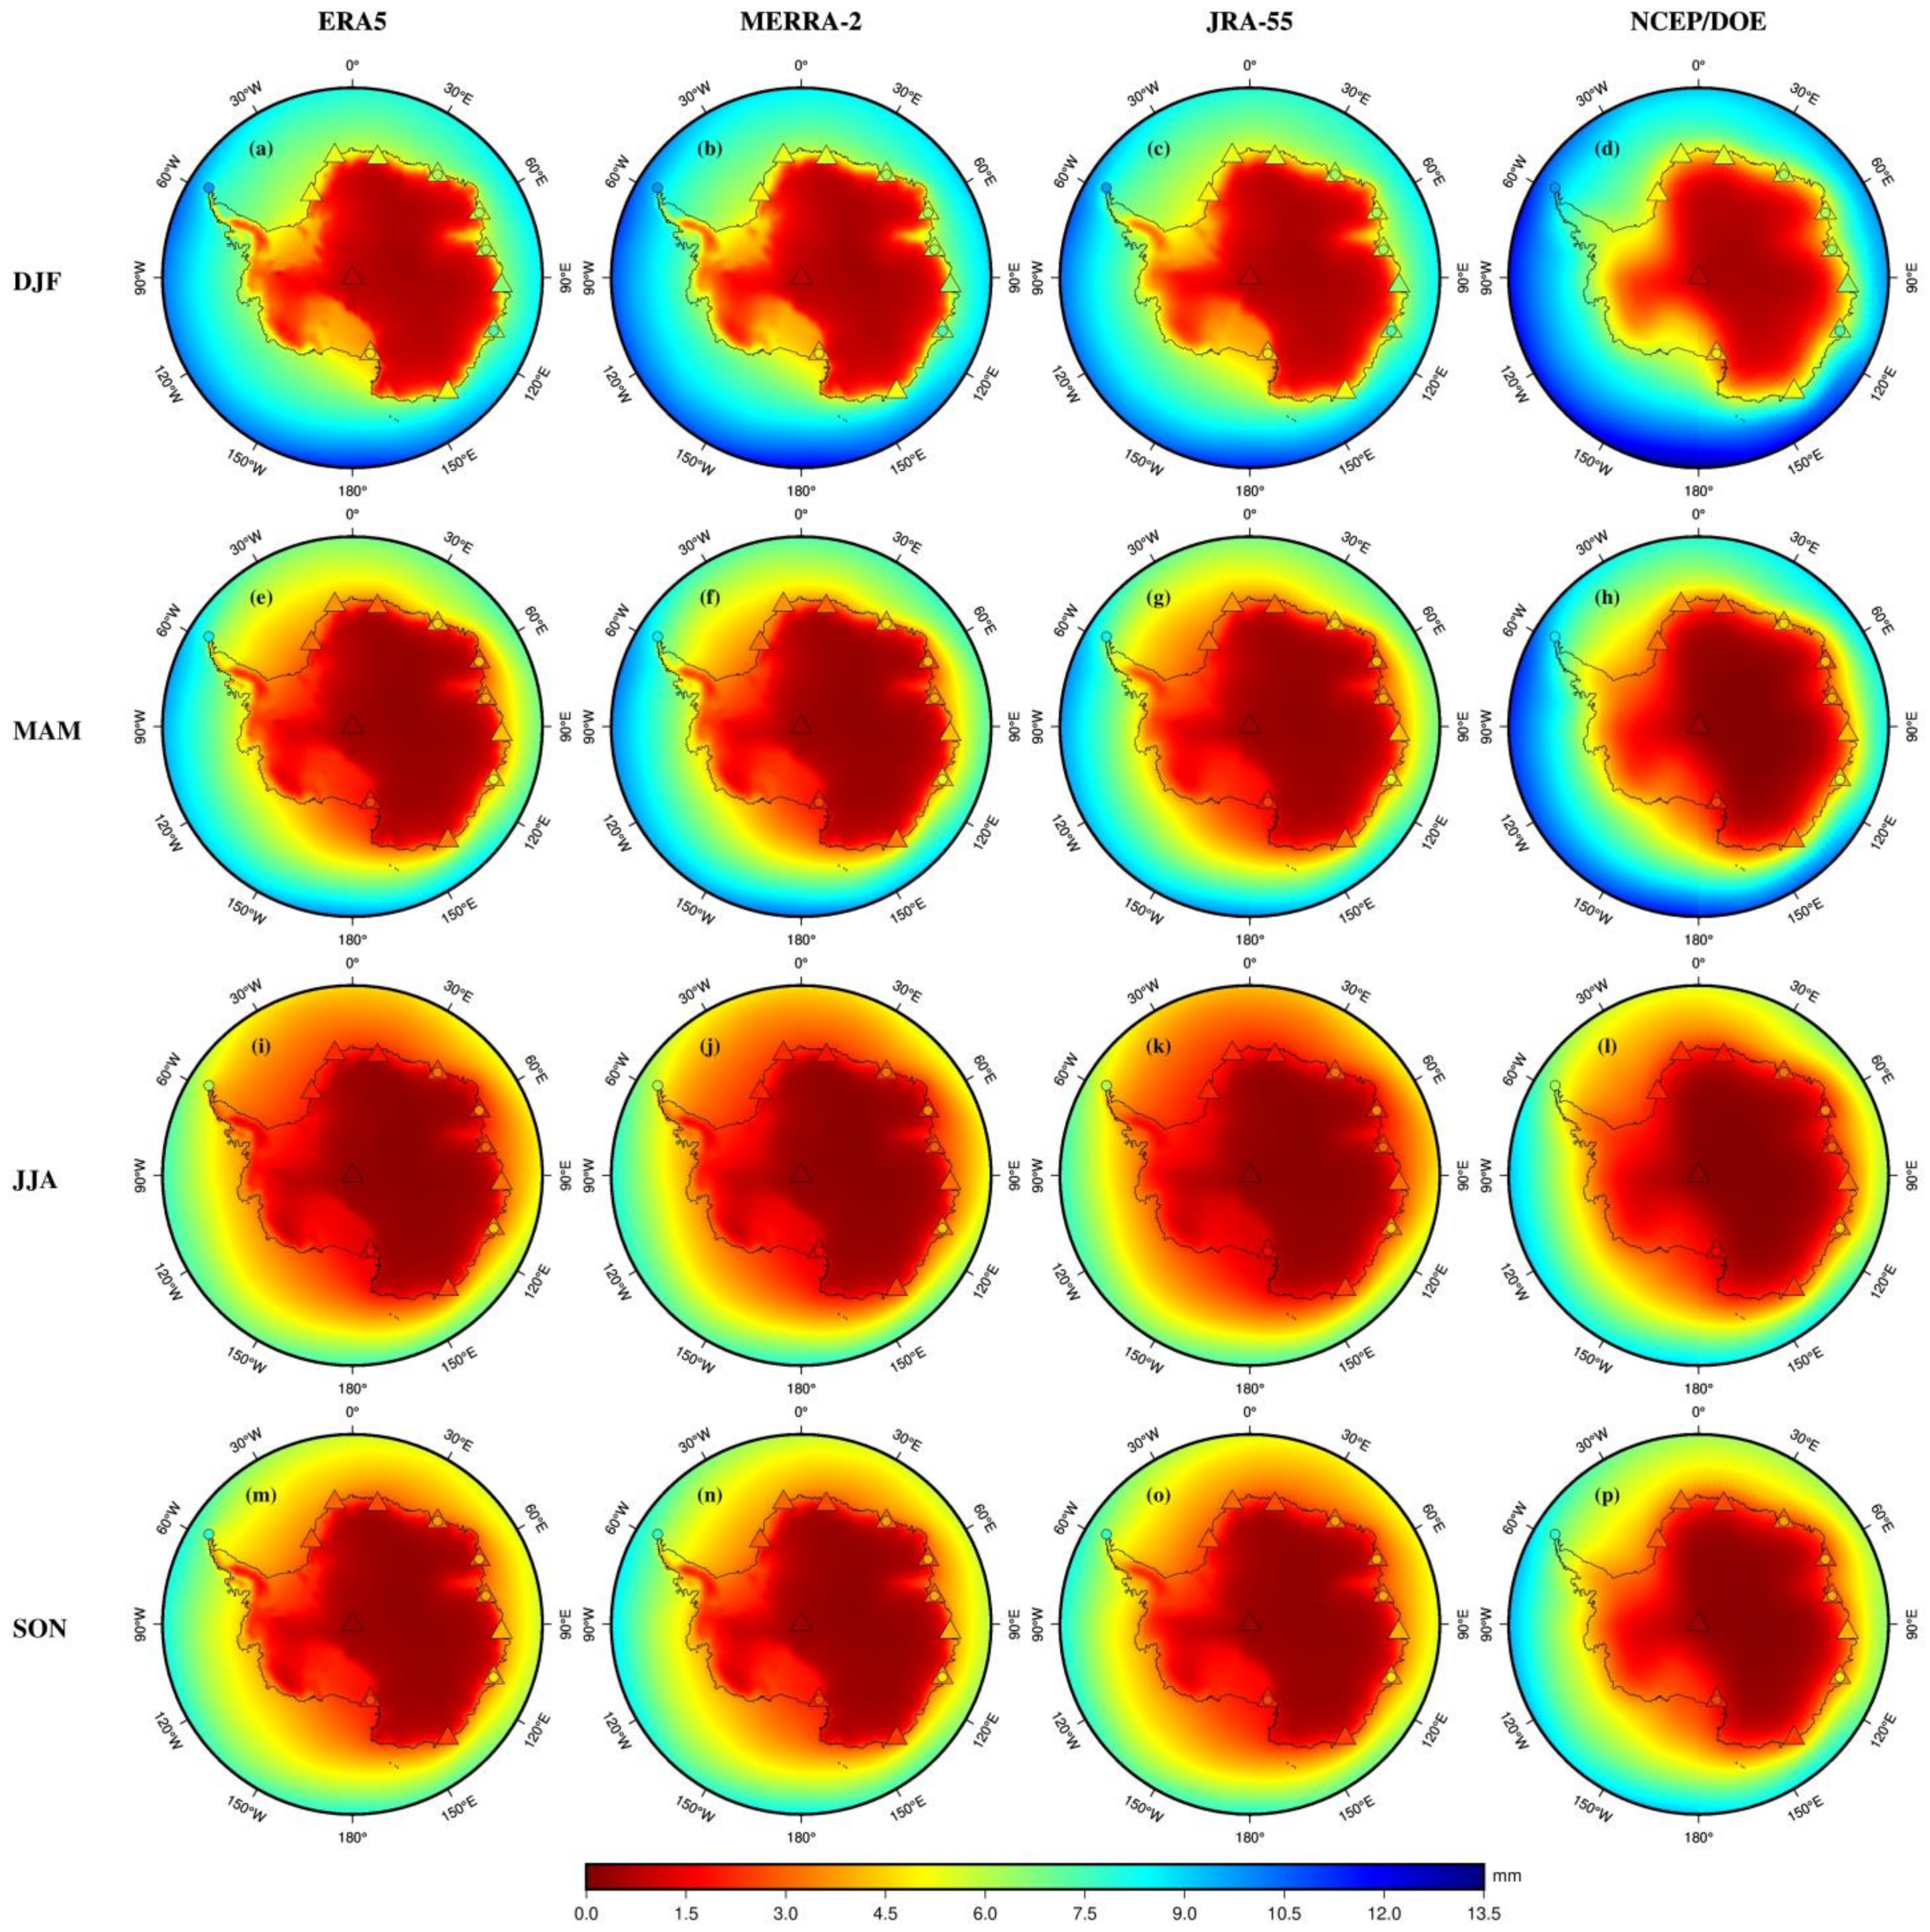
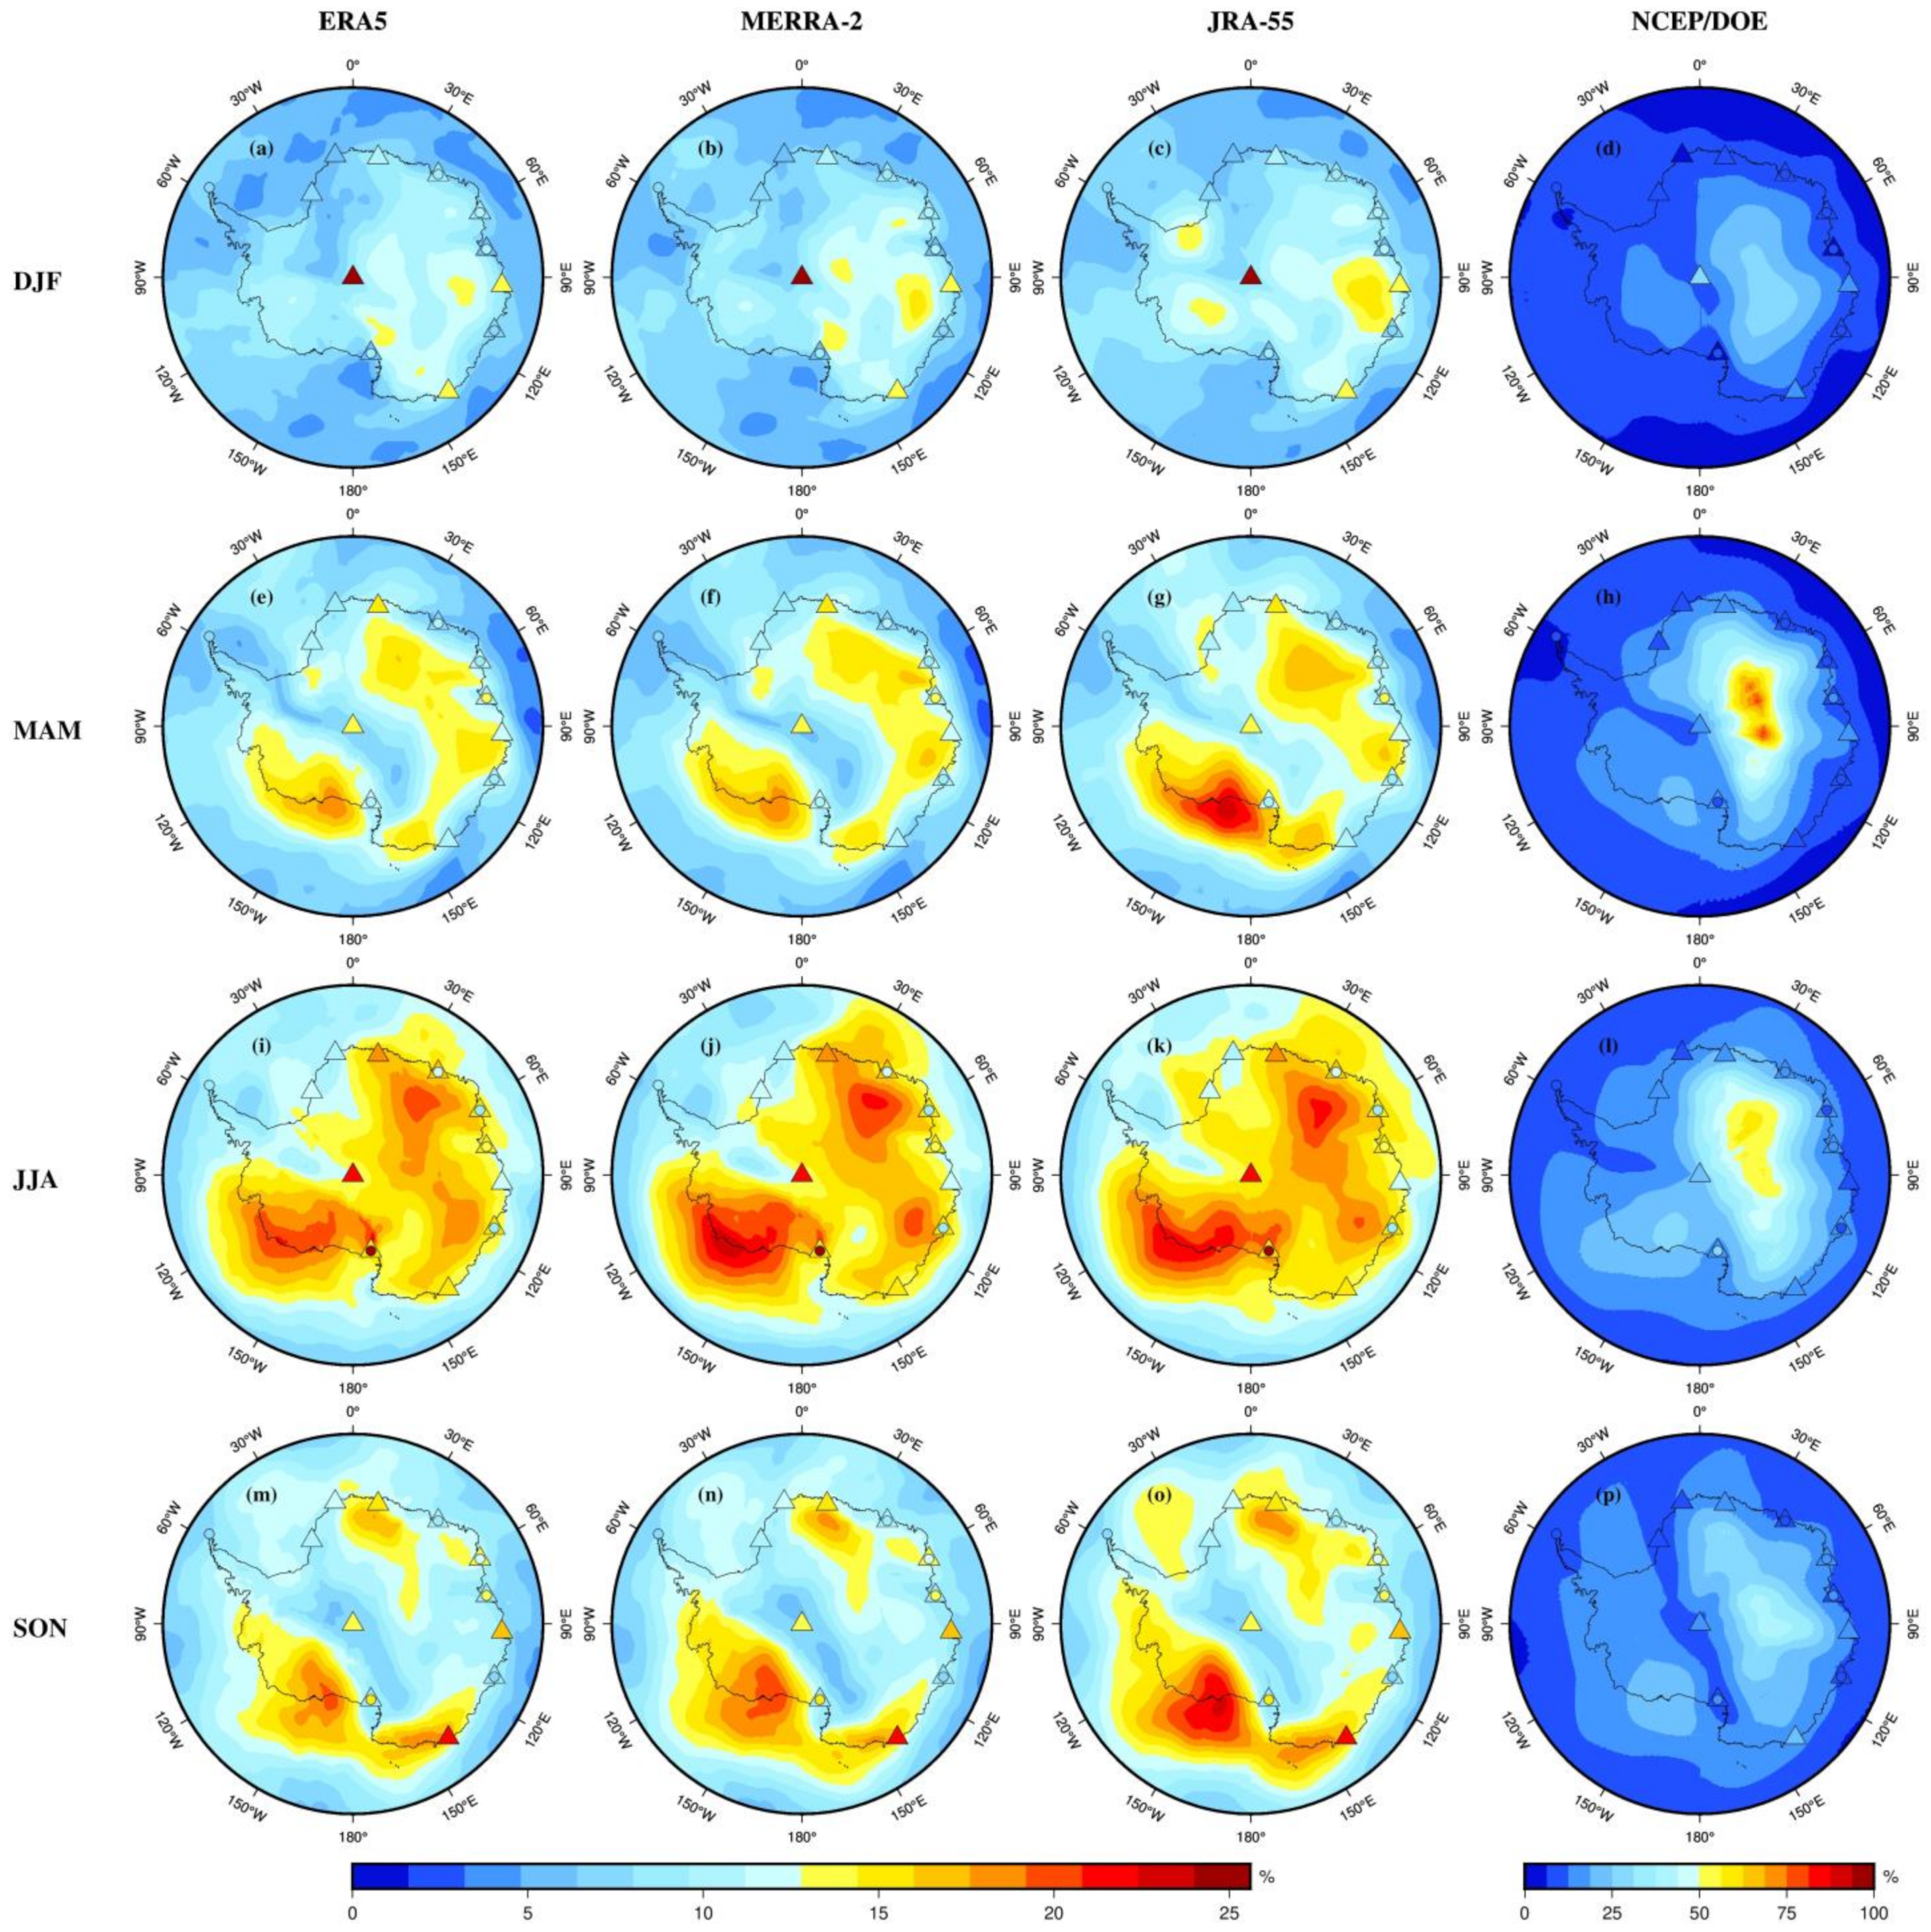
The spatial distributions of seasonal PWV means for the four seasons DJF, MAM, JJA and SON over Antarctica are shown in Figure 10, their corresponding PWV interannual variability are presented in Figure 11. Statistics of the mean absolute difference (MAD) between reanalyses and radiosonde/GNSS in seasonal PWV means and relative variability can be found in Table 4.
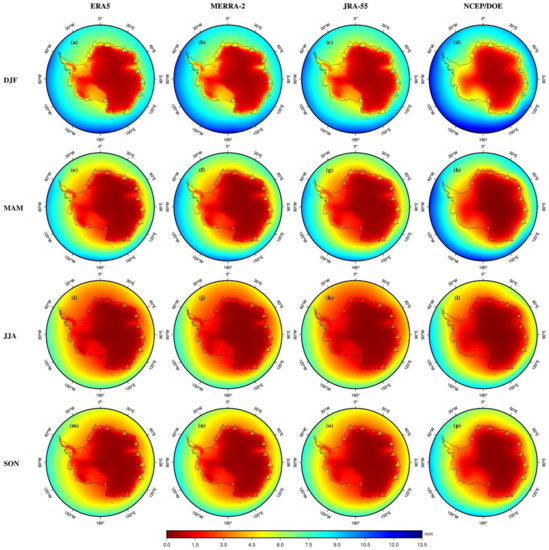
Figure 10.
Spatial distribution of PWV means over Antarctica derived from (a,e,i,m) ERA5, (b,f,j,n) MERRA-2, (c,g,k,o) JRA-55, (d,h,l,p) NCEP/DOE reanalysis (color shading), GNSS (color circles) and radiosonde (color triangles) for the four seasons from 2001 to 2018.
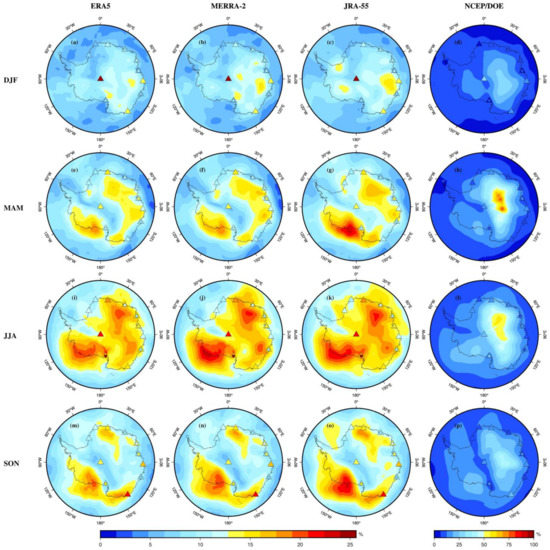
Figure 11.
PWV relative variability over Antarctica derived from (a,e,i,m) ERA5, (b,f,j,n) MERRA-2, (c,g,k,o) JRA-55, (d,h,l,p) NCEP/DOE reanalysis (color shading), GNSS (color circles) and radiosonde (color triangles) for the four seasons from 2001 to 2018.

Table 4.
Statistical results of the mean absolute differences in PWV mean and relative variability for the four seasons at the eleven radiosonde and seven GNSS stations over Antarctica.
For seasonal PWV means, all the reanalyses reasonably reproduce the mean PWV spatial distributions revealed by the radiosonde and GNSS observations as shown in Figure 10, with most of MAD values below 1 mm during the four seasons (see Table 4). In addition, the patterns of seasonal means between the four reanalyses are also generally similar. The mean PWV is 0−12 mm over Antarctica with small seasonal variations during the four seasons. In DJF (summer), the PWV content is higher than in other seasons, whereas it is lowest in JJA (winter). This phenomenon results from the fact that most Antarctic regions enjoy the polar day in summer and the round-the-clock sunlight increases the temperature and the water vapor pressure and accelerates the hydrological cycle and melting of surface snow and sea ice, causing an increase in water vapor. In winter, most Antarctic regions are in the polar night, and the low temperature decreases the surface evaporation and water vapor content [22]. In addition, the interseasonal variation of PWV content in East Antarctica is small. Larger PWV interseasonal variations are mainly reproduced in West Antarctica and the peripheral sea. This is mainly due to the extremely cold and dry atmosphere in East Antarctica, where the altitude is relatively high.
For the PWV interannual variability, it should be noted that outliers with negative PWV were removed from NCEP/DOE for quality assurance in the calculation of relative variability. Even so, compared with the other three reanalyses, NCEP/DOE has the largest average MAD in interannual variability (see Table 4). In addition, it also shows unrealistic PWV interannual variations in East Antarctica for the four seasons, especially for MAM, which even reached 96.92% (see Figure 11). The reason could be that few observations were available for assimilation in the NCEP/DOE model in Antarctica, and compared with other reanalyses, the satellite radiances are not assimilated in NCEP/DOE [34]. For the other three reanalyses, as shown in Figure 11, their spatial patterns are also generally similar over the four seasons except for a few small discrepancies. Strong PWV interannual variability can be found to occur mainly in JJA (winter), while relatively weak in DJF (summer). For the cold season, PWV is more sensitive to temperature changes than in the warm season since Antarctic climate is extreme cold and dry. In JJA, there are three high-value centers of more than 20% located over the Marie Byrd Land, Enderby Land and Wilkes Land in Antarctica. Among them, Marie Byrd Land has the strongest PWV interannual variability, which may be related to the West Antarctic mantle thermal anomaly beneath the Marie Byrd Land that is accelerating the glacier melting and water vapor changes [60]. These variations also reveal that more climatic events, such as sea level rise [22]. In DJF, the spatial distribution of the PWV relative variability is more uniform than in other seasons with values lower than 14%. Table 4 shows that ERA5 and MERRA-2 are in better agreement with radiosonde and GNSS in PWV variability than JRA-55 and NCEP/DOE over Antarctica, indicating that ERA5 and MERRA-2 are more realistic than other reanalyses and that the ERA5 model has the best performance with average MADs of 2.28% and 2.3% verified by radiosonde and GNSS observations, respectively. Nevertheless, a few sites show large differences compared to all reanalyses, e.g., radiosonde station 89009 and GNSS station MCM4 (see Figure 1). In general, most of the Antarctic regional features of PWV interannual variability derived from reanalyses are confirmed by radiosonde and GNSS observations. However, they are difficult to diagnose in site-sparse regions and sites with gross errors due to complex topography and the extremely cold climate in Antarctica. Such issues can be further confirmed by comparison with other PWV measurements from satellite products (such as MODIS or AIRS) or other collocated instruments (such as VLBI or DORIS) [61,62].
4.2. PWV Trends
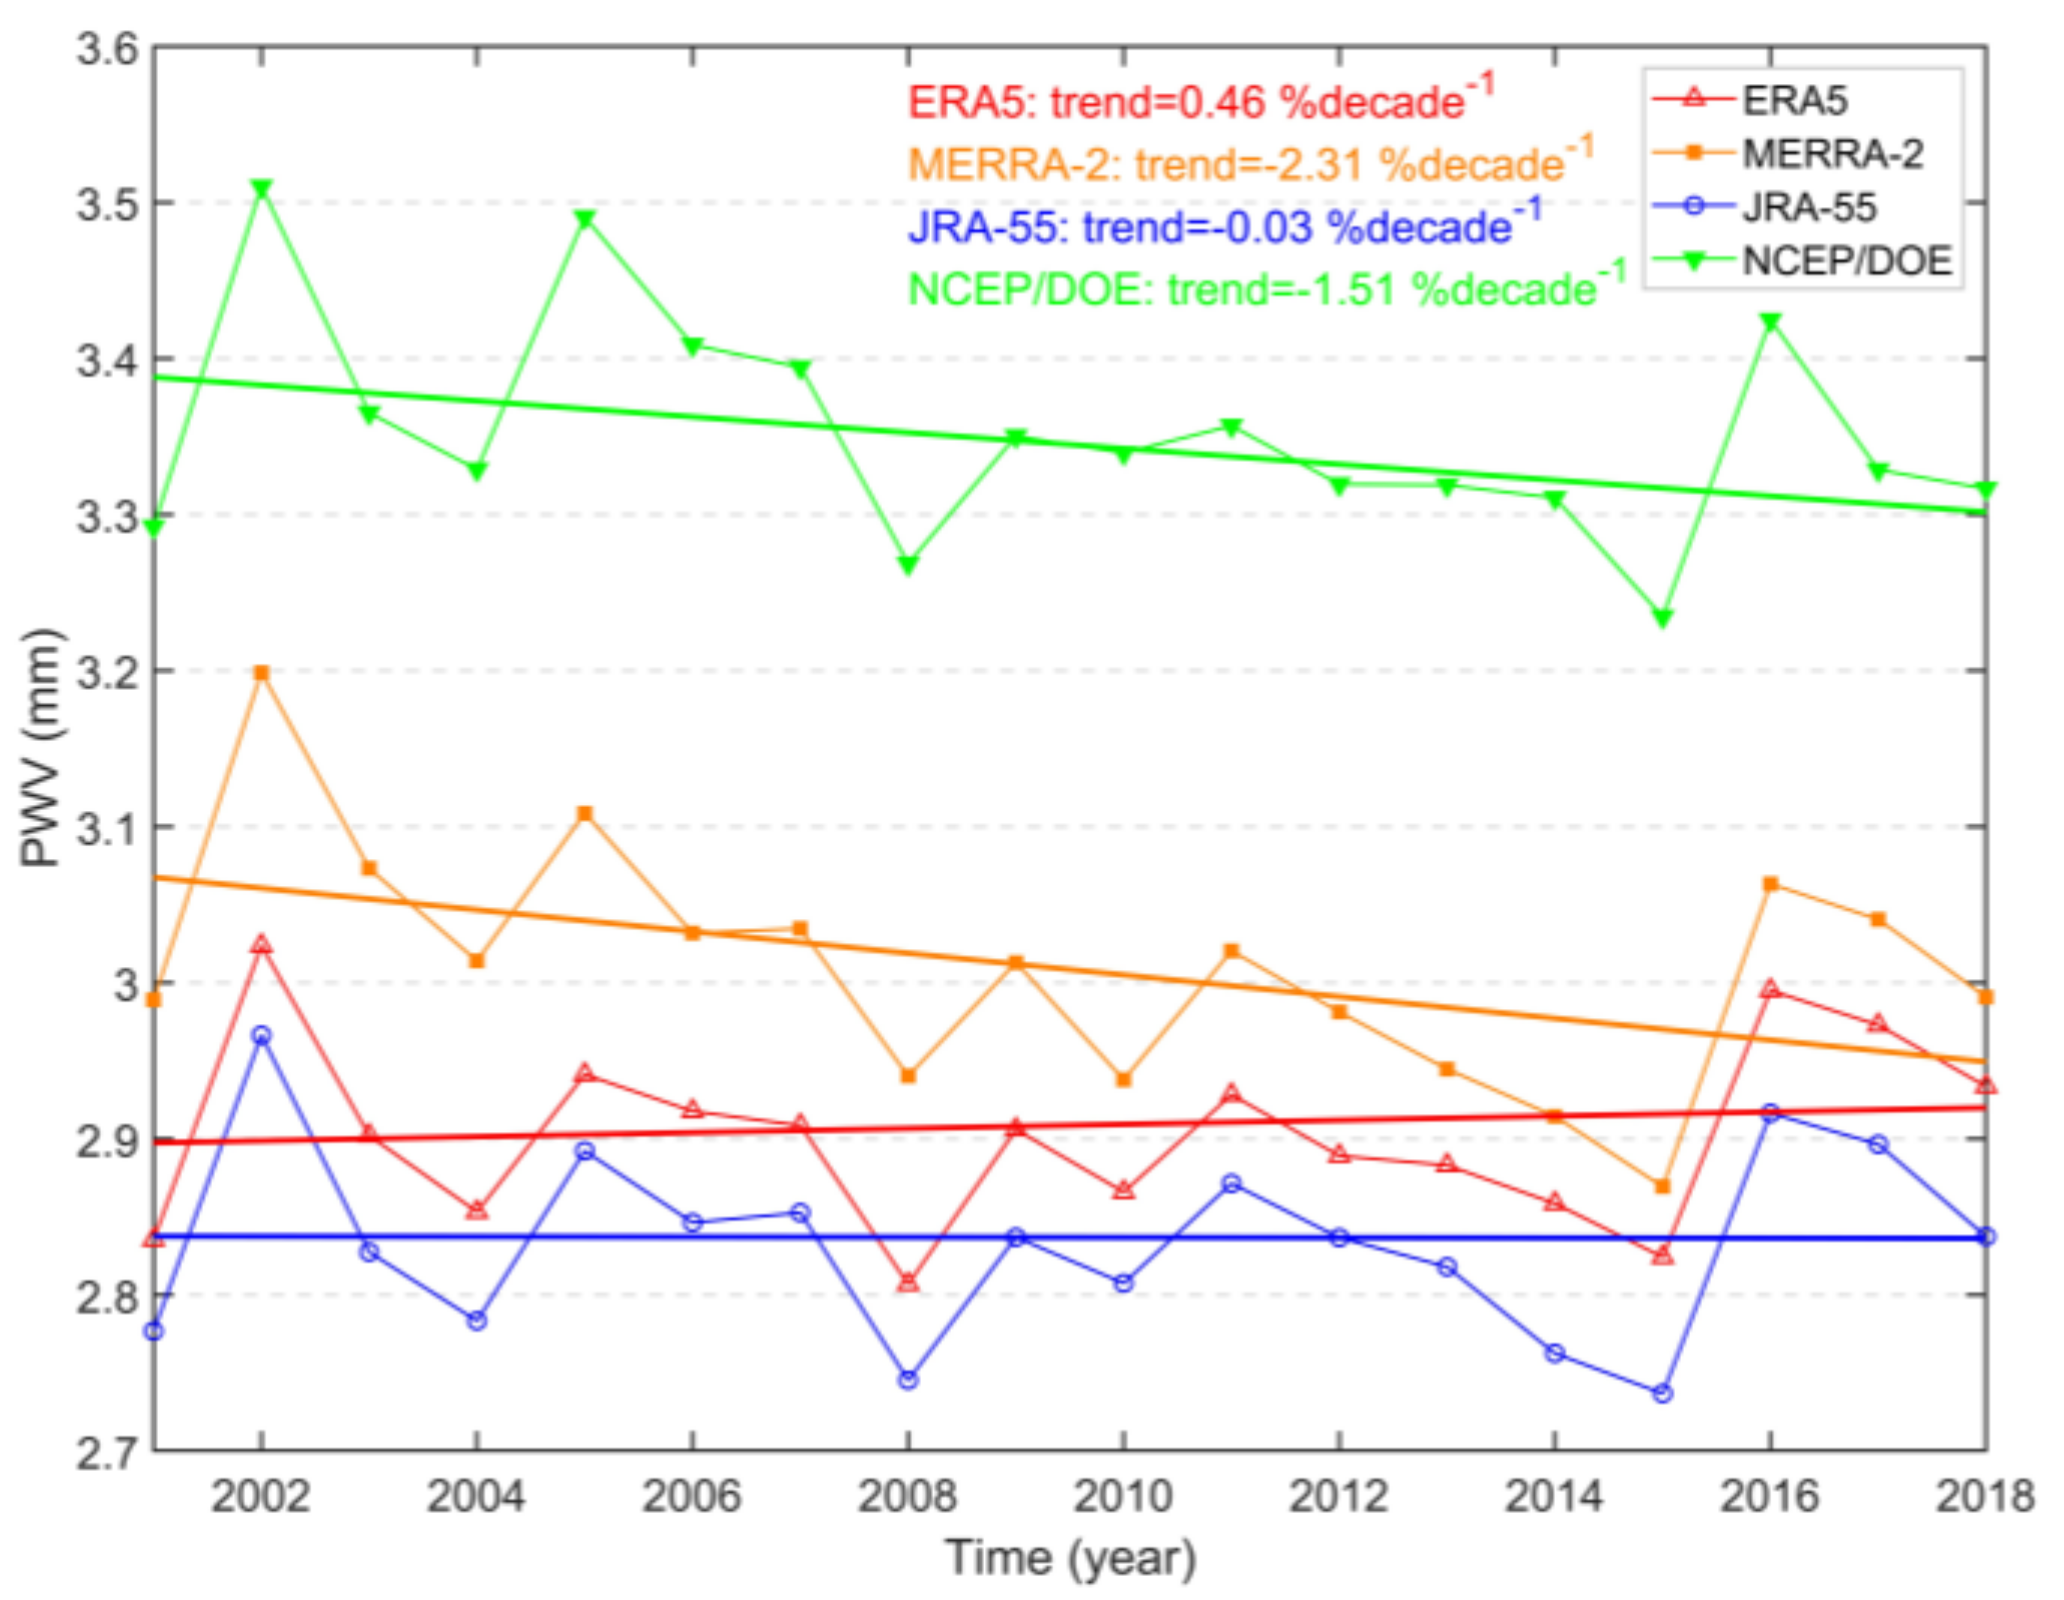
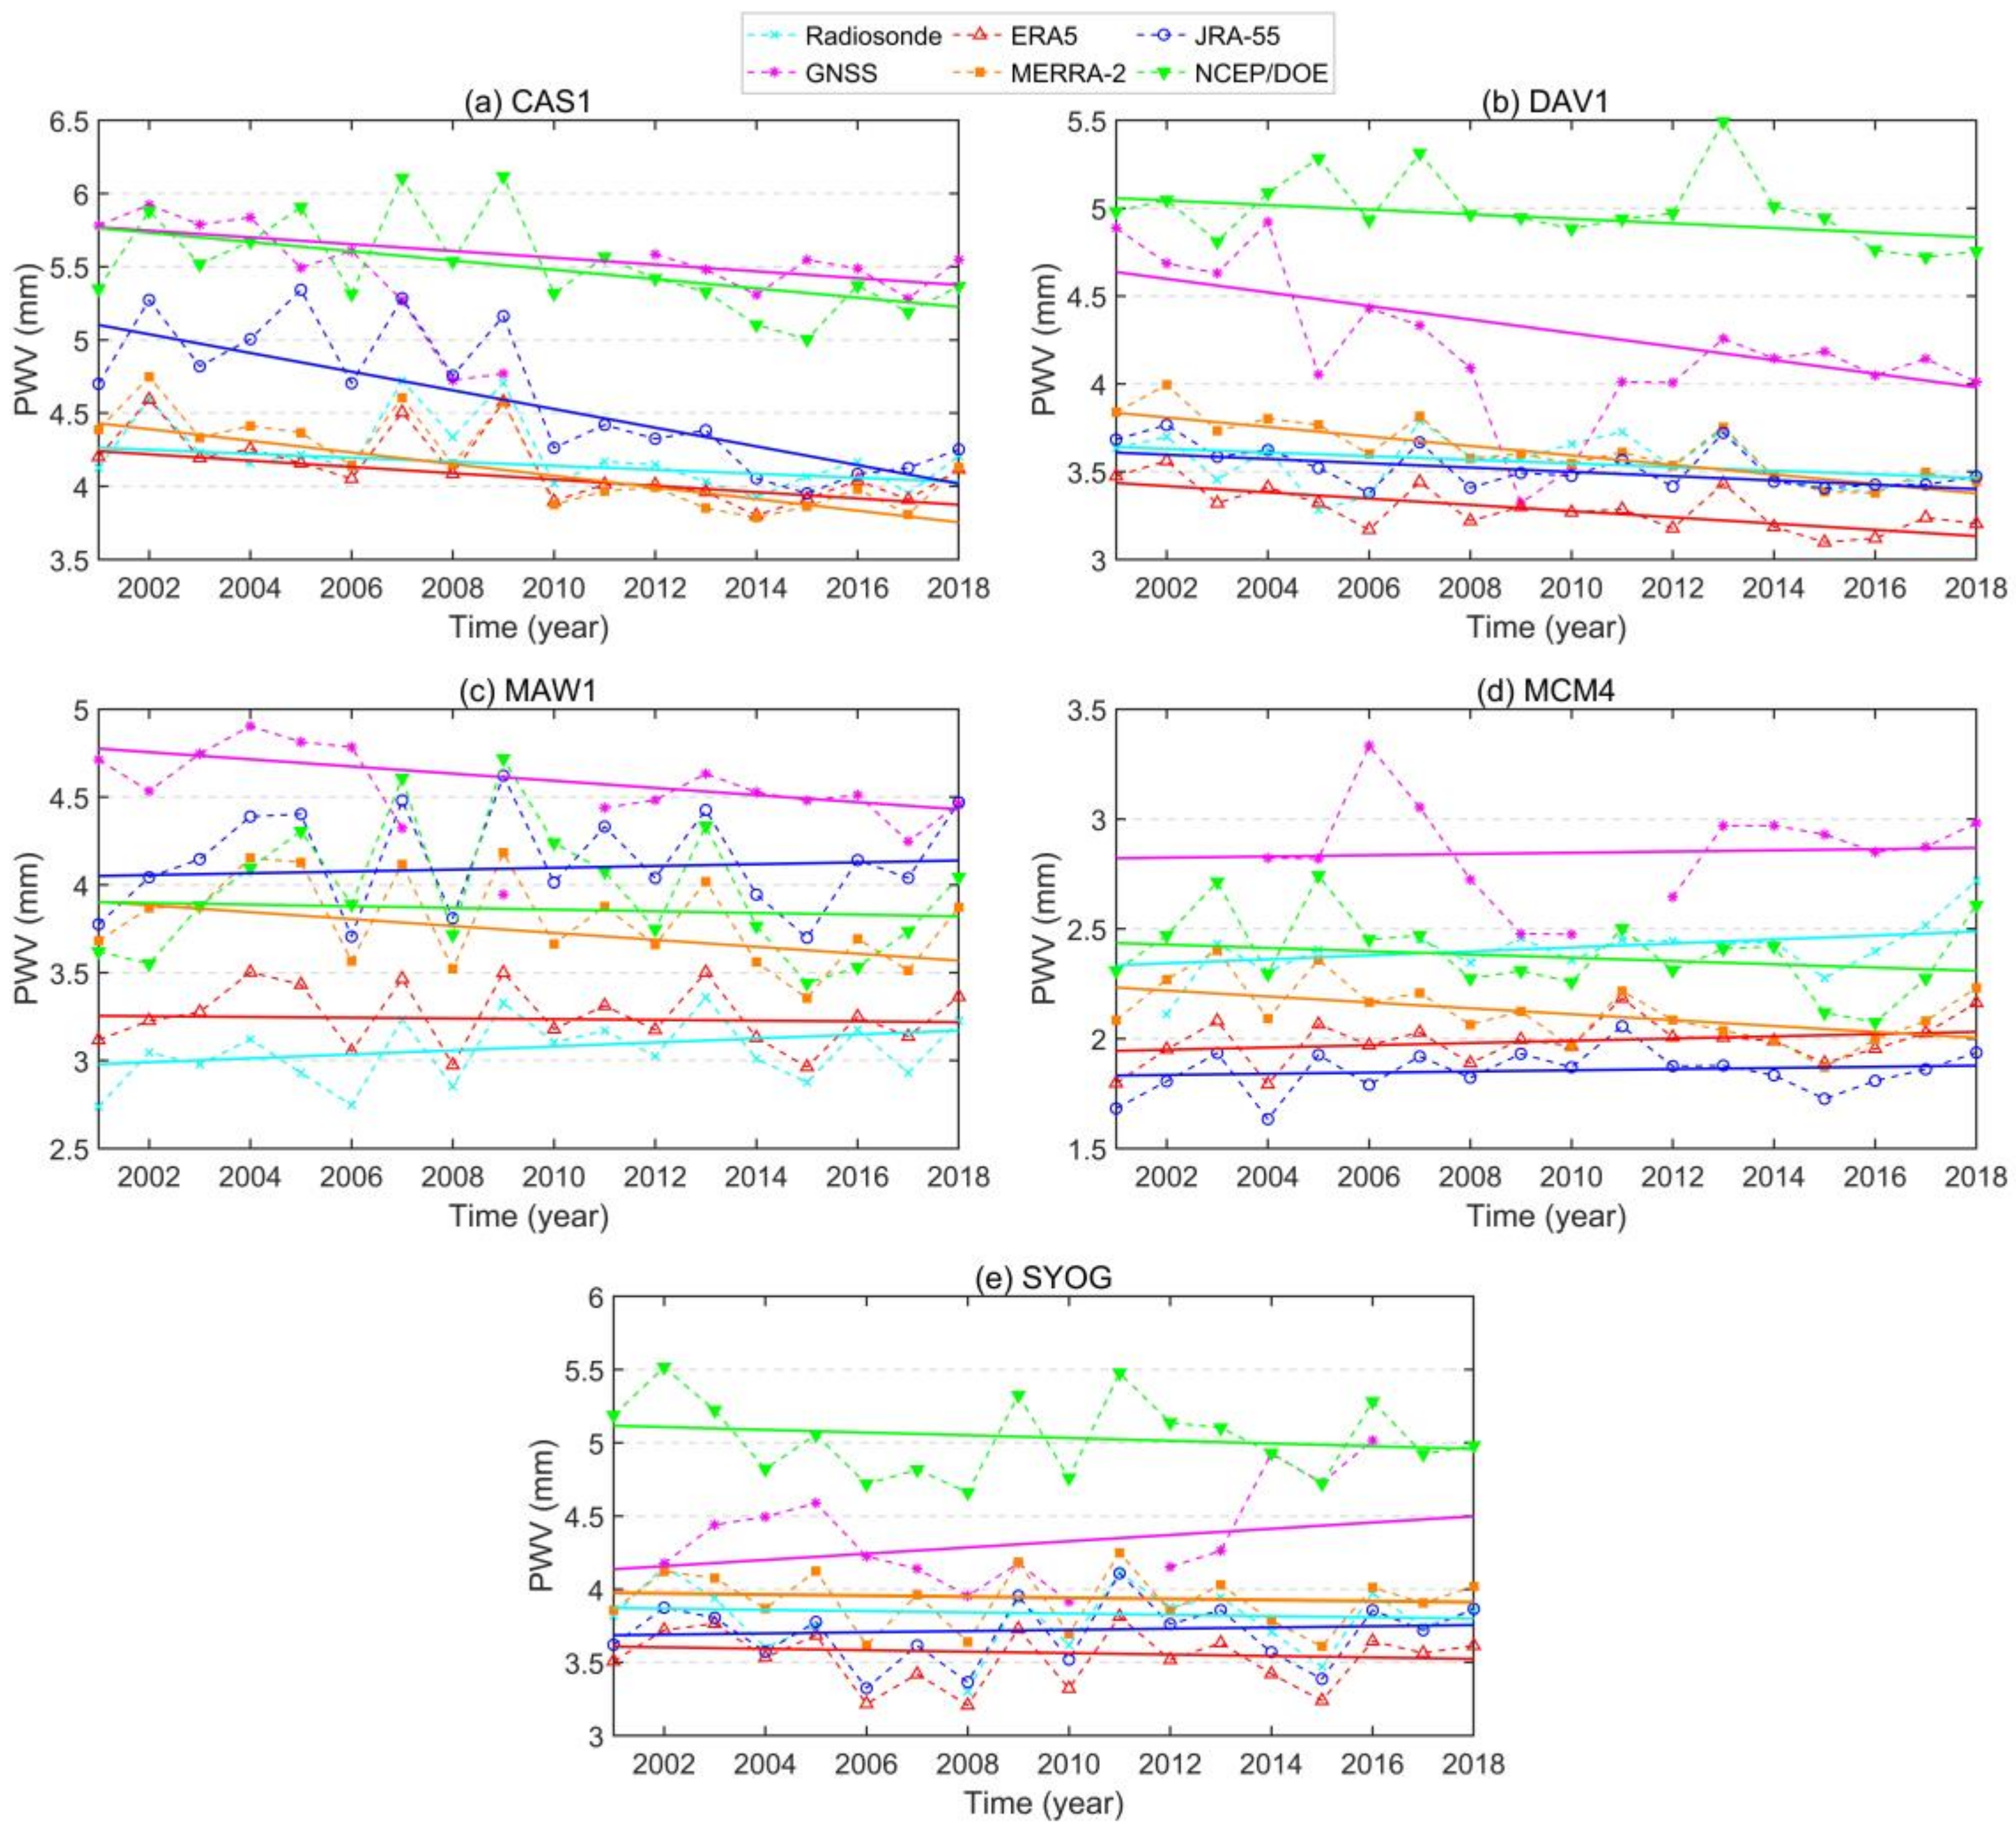
Figure 12 shows the time series of ERA5, MERRA-2, JRA-55 and NCEP/DOE annual PWV averaged over Antarctica from 2001–2018. In addition, the time series averaged from radiosonde, GNSS and the four reanalyses data at the five collocated sites (see Figure 1) are shown in Figure 13, and their relative PWV linear trends, expressed as percentages, are listed in Table 5.
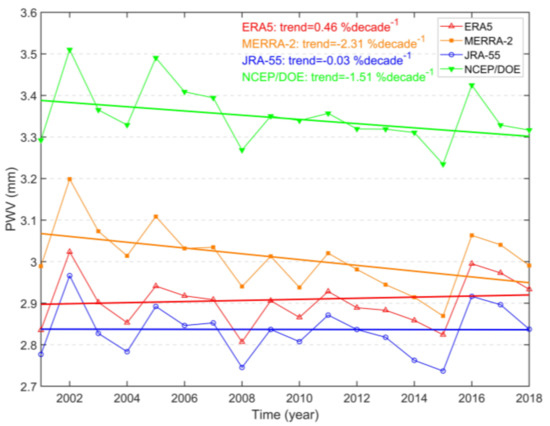
Figure 12.
PWV time series averaged from ERA5, MERRA-2, JRA-55 and NCEP/DOE over Antarctica during the period 2001–2018.
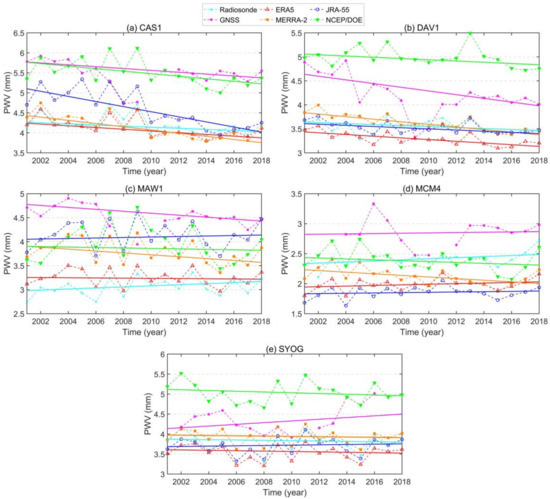
Figure 13.
PWV time series averaged from radiosonde, GNSS, ERA5, MERRA-2, JRA-55 and NCEP/DOE data at the five collocated sites during the period 2001–2018: (a) CAS1, (b) DAV1, (c) MAW1, (d) MCM4 and (e) SYOG.

Table 5.
Statistical results of relative PWV trends (in % decade−1) from radiosonde, GNSS, ERA5, MERRA-2, JRA-55 and NCEP/DOE data at the 5 collocated sites from 2001 to 2018. Significant trends are highlighted in bold values.
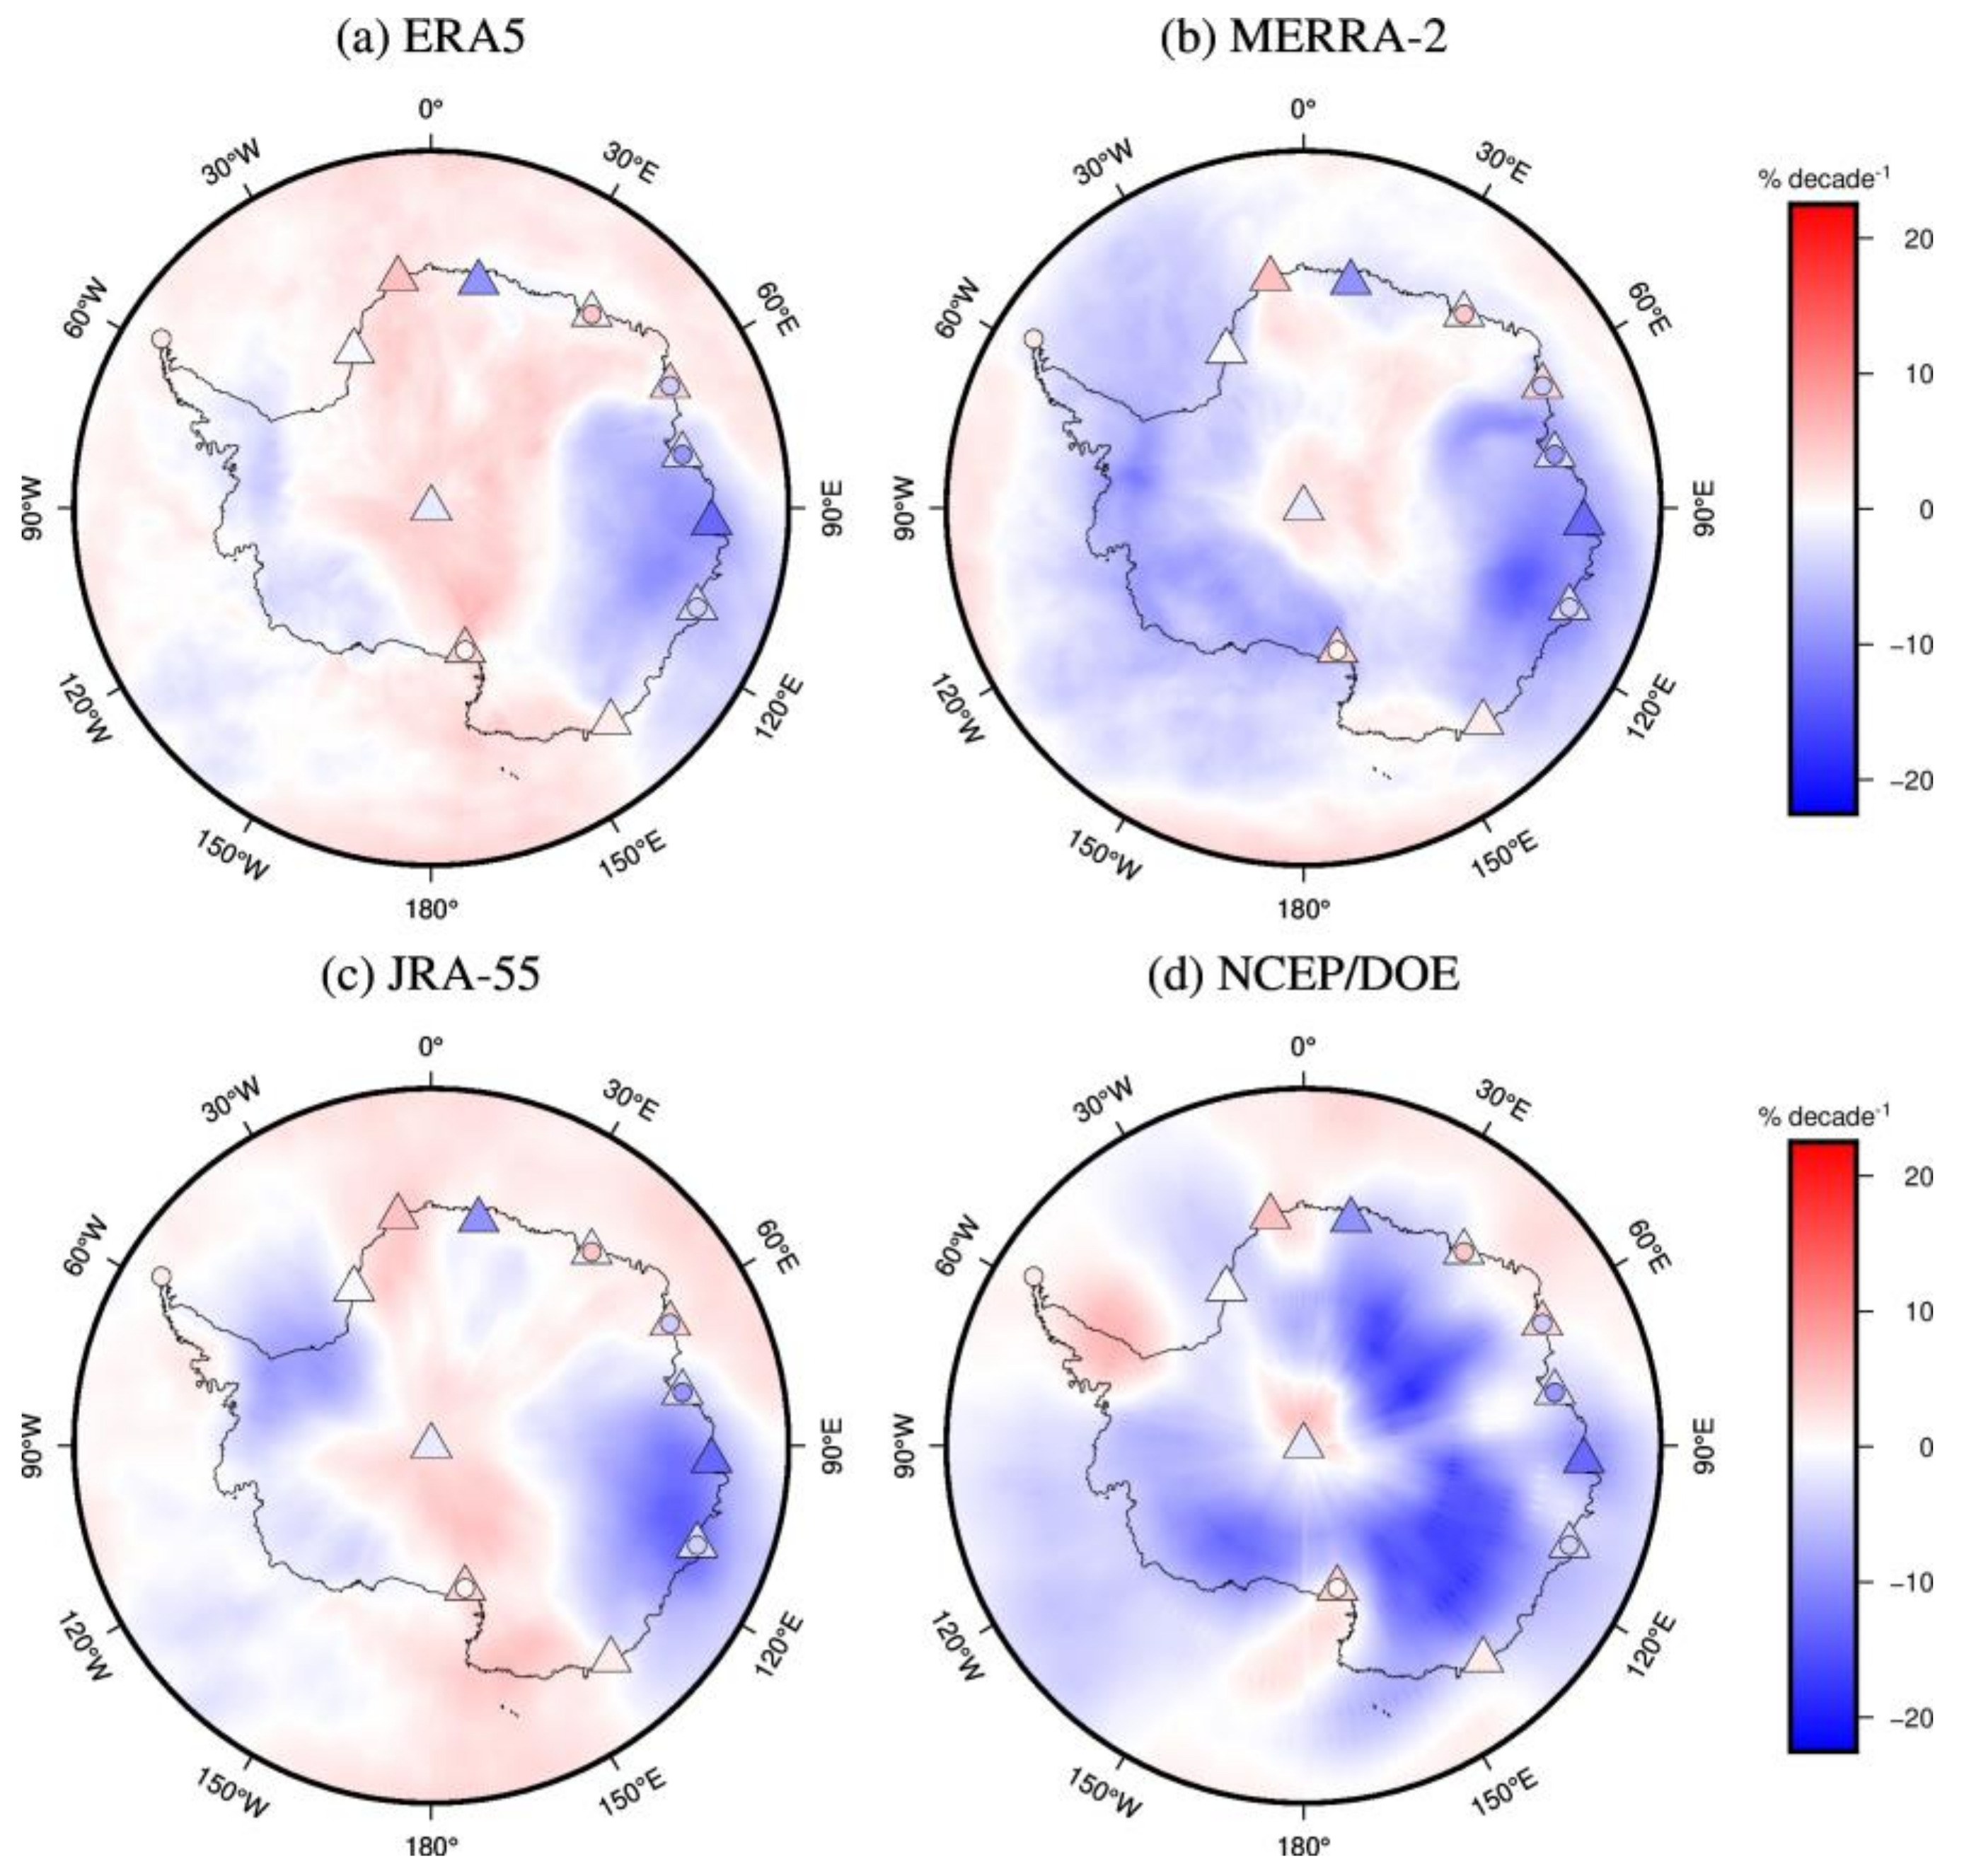
In Figure 12, most reanalyses show overall negative trends (drying) except ERA5 which shows an opposite (moistening) trend. The PWV trends estimated from ERA5, MERRA-2, JRA-55 and NCEP/DOE over the period 2001−2018 for Antarctica are 0.46% decade−1, −2.31% decade−1, −0.03% decade−1 and −1.51% decade−1, respectively, but are only statistically significant in MERRA-2 and NCEP/DOE. Such discrepancy may be caused by differences of surface–atmosphere processes, large-scale water vapor transport and data assimilation in the four reanalyses [24]. The PWV variations derived from the four reanalyses are basically the same, but NCEP/DOE annual PWV estimates are larger than the other three. The higher NCEP/DOE PWV estimates are attributed to a larger estimation over the ocean around Antarctica compared with other reanalyses (see Figure 8 and Figure 10). In the previous sections, NCEP/DOE has been shown to have a poorer performance compared with other PWV results; thus, the NCEP/DOE estimated trends are not as reliable as other trends from the three reanalyses. From Figure 13 and Table 5, significant drying trends are observed at stations CAS1 (−13.85~−4.25% decade−1) and DAV1 (−9.78~−2.62% decade−1) in both PWV data sets, except for radiosonde observations which are insignificant at all five collocated stations. For the other three stations, only GNSS data show a significant drying trend (−4.49% decade−1) at station MAW1, and only MERRA-2 exhibits a significant drying trend (−6.33% decade−1) at station MCM4. No significant drying or moistening trend is found at station SYOG in both PWV data sets. Higher annual PWV estimates are also found in NCEP/DOE and GNSS data compared with the other PWV data sets at several stations. Among the four reanalyses, ERA5 and MERRA-2 show a better consistency with radiosonde observations at all five collocated stations.
The spatial distributions of relative PWV linear trends for both reanalyses are shown in Figure 14. Figure 14 illustrates that increasing PWV trends are observed near the South Pole in both reanalyses, whereas downward trends are observed over the Wilkes Land and Ellsworth Land. Among the reanalyses, MERRA-2, JRA-55 and NCEP/DOE generally have overall negative trends in most Antarctic regions, while ERA5 generally shows an overall positive trend. Moreover, MERRA-2 and NCEP/DOE show stronger trends than ERA5 and JRA-55.
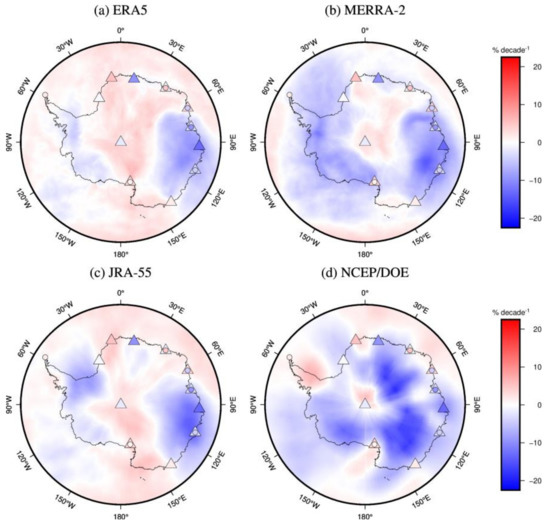
Figure 14.
Relative PWV trends over Antarctica for 2001 to 2018 derived from (a) ERA5, (b) MERRA-2, (c) JRA-55, (d) NCEP/DOE reanalysis (color shading), GNSS (color circles) and radiosonde (color triangles).
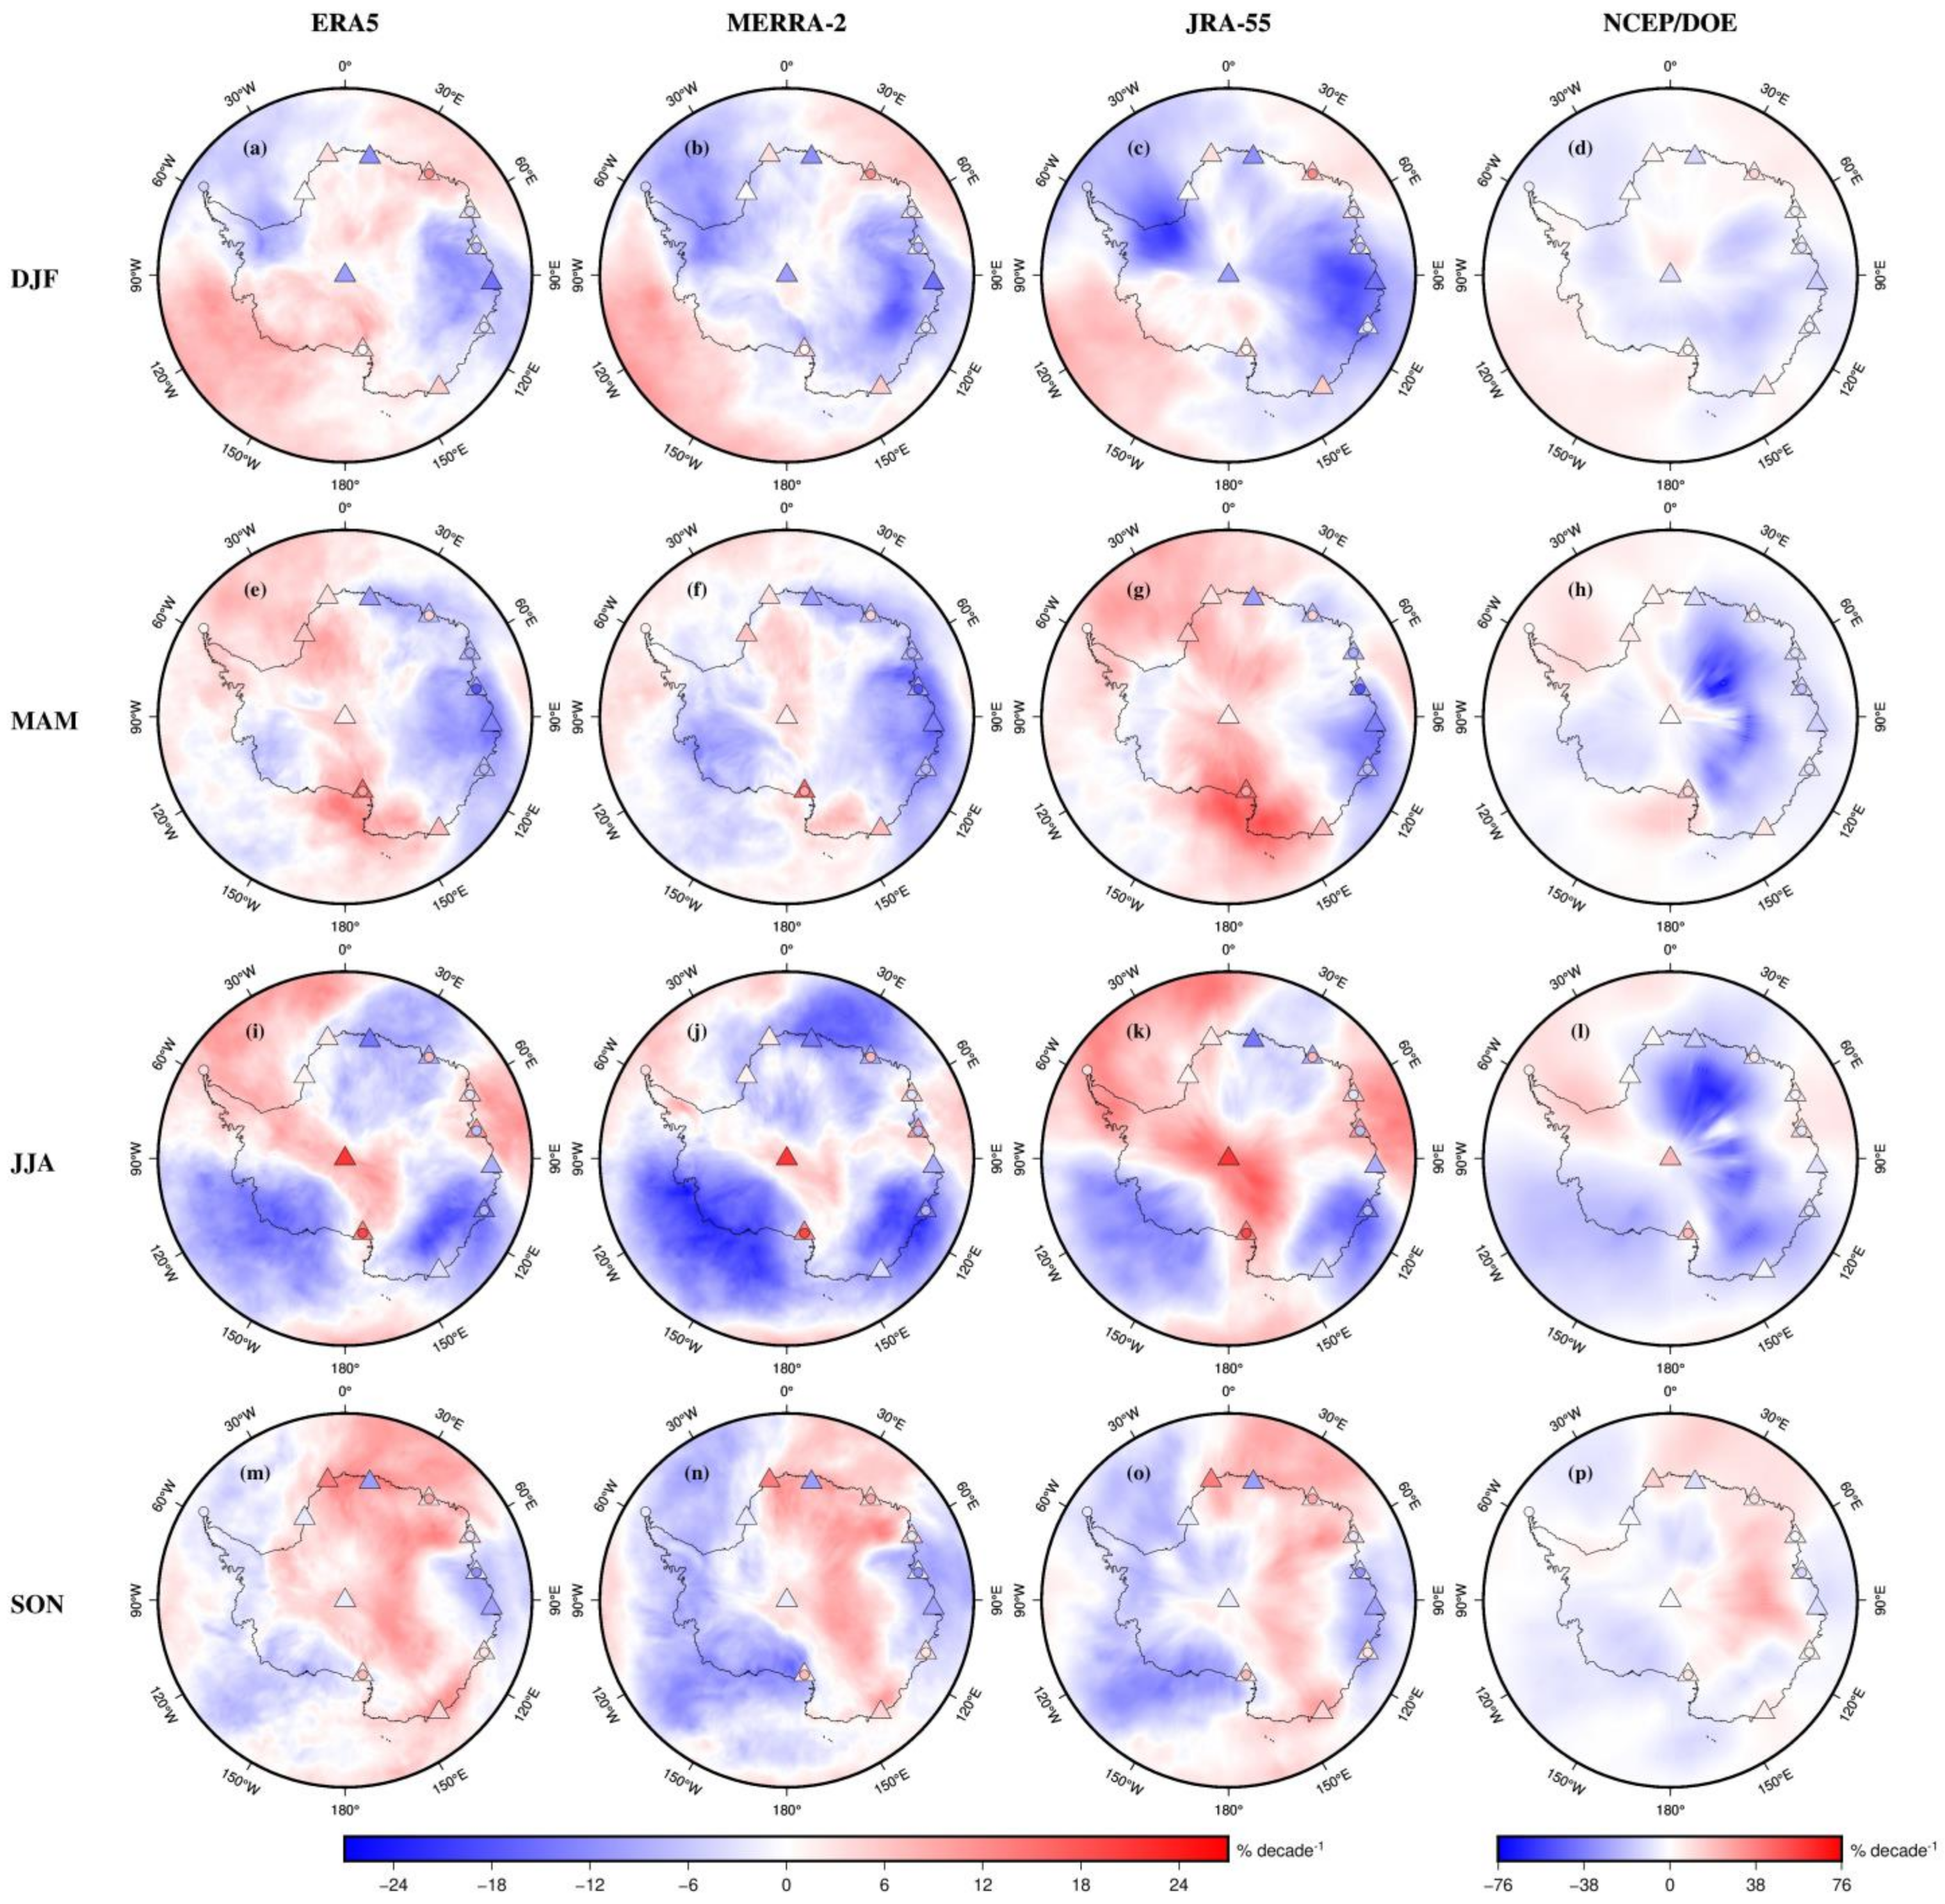
We further investigated the spatial distributions of seasonal PWV linear trends over Antarctica, and the results are shown in Figure 15. Statistics of the MAD between reanalyses and radiosonde/GNSS in PWV trends for the four seasons are listed in Table 6. As shown in Figure 15, the PWV trends depend upon the season and region location over Antarctica. For NCEP/DOE, it presents very strong drying trends in East Antarctica in MAM and JJA, with most values greater than −38% decade−1, even reaching its highest value of −75.55% decade−1 in JJA, which is unrealistic with respect to the other PWV data sets. For the other three reanalyses, in DJF, Wilkes Land and the area around the Weddell Sea significant drying trends are exhibited, and JRA-55 shows a more significant drying trend than ERA5 and MERRA-2. In MAM, drying trends are mainly found in Wilkes Land and Marie Byrd Land, whilst ERA5 and JRA-5 are insignificant in Marie Byrd Land. Moreover, moistening trends are identified in Ross Ice Shelf only for EAR5 and JRA-55. In JJA, significant drying trends are observed in Dronning Maud Land, Wilkes Land and Marie Byrd Land for all three reanalyses, and MERRA-2 presents more significant drying trends than ERA5 and JRA-5. In contrast, the Antarctic Peninsula shows general moistening trends in JJA for all three reanalyses. In SON, drying trends are mainly found in West Antarctica, whilst moistening trends mainly occur over the East Antarctic Plateau.
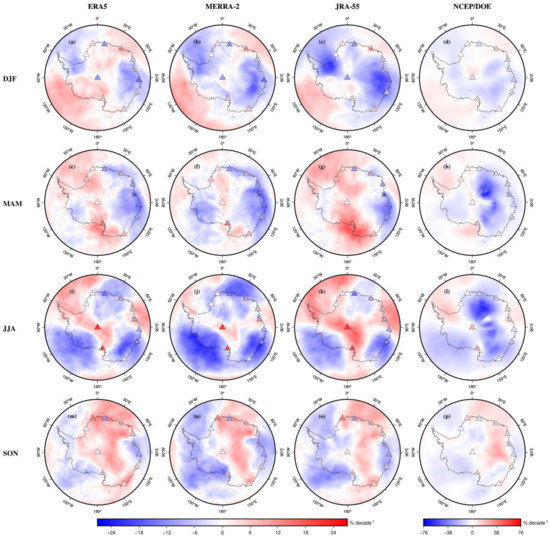
Figure 15.
Seasonal relative PWV trends over Antarctica derived from (a,e,i,m) ERA5, (b,f,j,n) MERRA-2, (c,g,k,o) JRA-55, (d,h,l,p) NCEP/DOE reanalysis (color shading), GNSS (color circles) and radiosonde (color triangles) for the four seasons from 2001 to 2018.

Table 6.
Statistical results of the mean absolute differences in relative PWV trends (in % decade−1) for the four seasons at the eleven radiosonde and seven GNSS stations over Antarctica.
Table 6 confirms that the PWV trends estimated from ERA5 and MERRA-2 generally agree better with radiosonde and GNSS than JRA-55 and NCEP/DOE over Antarctica. In addition, ERA5 performs best with average MADs of 1.94% decade−1 and 4.68% decade−1 verified by radiosonde and GNSS, respectively, whereas NCEP/DOE performs worst with average MADs of 2.69% decade−1 and 6.17% decade−1, respectively. Compared with radiosonde, the MADs of all four reanalyses for relative PWV trends are largest in DJF (summer), with values of 2.63%, 3.05%, 3.09% and 3.43% per decade for ERA5, MERRA-2, JRA-55 and NCEP/DOE, respectively. When compared with GNSS, the largest MADs are detected in JJA (winter): 8.31%, 8.49%, 9.11% and 9.59% per decade for ERA5, MERRA-2, JRA-55 and NCEP/DOE, respectively, which are about three times larger than those of radiosonde data. Such a seasonal discrepancy between radiosonde and GNSS may be related to how the performance of different equipment varies in different seasons, or changes in equipment. Moreover, the artificial errors of pressure provided by ERA5 introduced in GNSS PWV retrieval are relatively large in winter because of the poorer accuracy of pressure in winter with respect to summer for ERA5 [36].
It is important to point out that the PWV trends estimated from the four reanalyses and other PWV measurements are not always statistically significant and have a high uncertainty over Antarctica in most periods and regions, especially for NCEP/DOE, which has the poorest performance. In addition, only the linear PVW trends are estimated and compared in this work. The actual PWV trends are not simply linear, and they can vary dramatically in different periods and areas, thus estimations and comparisons in this section may not be valid for other different areas or different periods.
5. Discussion and Conclusions
Currently, since the accuracy of atmospheric reanalysis data sets has been improved significantly, they play a more important role in both climate and weather study. In this study, the PWV means, variability and trends over Antarctica in four reanalyses (ERA5, MERRA-2, JRA-55 and NCEP/DOE) are investigated using radiosonde and GNSS observations covering 18 years from 2001–2018.
PWV estimations derived from ERA5, MERRA-2, JRA-55 and NCEP/DOE have been evaluated by radiosonde and GNSS observations over Antarctica. The assessment results show that ERA5 and MERRA-5 present a better performance than JRA-55 and NCEP/DOE. Among the four reanalyses, ERA5 shows the best comprehensive performance whereas NCEP/DOE performs the worst. For the comparison with radiosonde, the mean RMS errors of ERA5, MERRA-2, JRA-55 and NCEP/DOE are 0.5 mm, 0.65 mm, 0.85 mm and 1.11 mm, respectively. Regarding the comparison with GNSS, ERA5, MERRA-2, JRA-55 and NCEP/DOE have mean RMS errors of 1.2 mm, 1.15 mm, 1.34 mm and 1.59 mm, respectively. The main reason for the better performance of ERA5 and MERRA-2 comes certainly from improvements in spatial resolution and data assimilation methods.
The annual and seasonal distributions in PWV means reproduced from the four reanalysis data sets both perform fairly well over Antarctica, and they are all consistent with the radiosonde and GNSS observations with mean differences less than 1.1 mm. The PWV contents over Antarctic continent are very low and less than surrounding areas, showing a decreasing trend from west to east. The highest PWV content appears in summer whilst the lowest content is observed in winter. More details and features in spatial distribution of PWV means are reproduced well by ERA5, MERRA-2 and JRA-5, while NCEP/DOE is not recommended due to its lower spatial resolution and artefacts. In terms of the PWV interannual variability, the annual PWV relative variability over Antarctica is small with values smaller 10%. The seasonal variability is strongest in the cold season and relatively weak in the warm season. All reanalyses depict interannual variability well over Antarctica with mean differences smaller than 3%, except for NCEP/DOE which shows spurious variability in East Antarctica. PWV trends for all reanalyses in most Antarctic regions in the period 2001–2018 are insignificant tested by the Mann–Kendall method with a 10% significance level, and most reanalyses show overall drying trends in annual averages except for ERA5, which exhibits a moistening trend of 0.46% decade−1. PWV trends also vary with season and region over Antarctica. Most reanalyses generally agree with radiosonde and GNSS in PWV trends over Antarctica with mean differences smaller 6.4% decade−1, except for NCEP/DOE which also generates spurious trends in East Antarctica. Overall, the performances of ERA5 and MERRA-2 are the best among these reanalyses, and ERA5 performs slightly better than MERRA-2. In conclusion, NCEP/DOE is not recommended for use in Antarctica.
The results drawn from this work provide a complete investigation of the water vapor climatology over Antarctica for the last 18 years, thanks to the rapid development of global reanalysis data sets, especially for the new reanalysis ERA5. It also gives the reader an understanding of the reliability of PWV derived from the four reanalysis data sets over Antarctica. However, decadal variability and trends in PWV are not indicative of the long-term atmospheric climate change since several studies [1,24,25] suggested that a longer time series (nearly three decades) may be needed to acquire full stable patterns of trends. In addition, due to the fact that few observations are available, PWV variability and trends in Antarctica still suffer from large uncertainties and more in situ observations are needed for further investigation.
Author Contributions
Conceptualization, Z.M., Z.Z. and L.H. (Liangke Huang); methodology, Z.M., Z.Z. and L.H. (Liangke Huang); software, Z.M.; validation, Z.M., Z.Z. and L.H. (Liangke Huang); formal analysis, Z.M., Z.Z. and L.H. (Liangke Huang); investigation, Z.Z., L.H. (Ling Huang) and L.Z.; resources, L.H. (Liangke Huang), L.L., C.R. and H.H.; data curation, Z.M. and L.H. (Liangke Huang); writing—original draft preparation, Z.M.; writing—review and editing, L.H. (Liangke Huang) and Z.Z.; supervision, L.H. (Liangke Huang), L.L., Z.Z. and H.H.; project administration, L.H. (Liangke Huang) and L.L.; funding acquisition, L.H. (Liangke Huang) and L.L. All authors have read and agreed to the published version of the manuscript.
Funding
This research was funded by the National Natural Foundation of China (grant numbers: 41864002 and 41704027), Guangxi Natural Science Foundation of China (grant numbers: 2018GXNSFAA281182; 2018GXNSFAA281279; 2020GXNSFBA159033 and 2020GXNSFBA297145), Guangxi Science and Technology Base and Talent Project (grant number: AD19245060), the Guangxi Key Laboratory of Spatial Information and Geomatics (grant number: 19-050-11-24), Innovation Project of Guangxi Graduate Education (grant number: YCSW202109) and the “Ba Gui Scholars” program of the provincial government of Guangxi.
Institutional Review Board Statement
Not applicable.
Informed Consent Statement
Not applicable.
Data Availability Statement
Radiosonde data were available from the University of Wyoming (http://www.weather.uwyo.edu/upperair/sounding.html, accessed on 3 March 2021) and the GNSS data were obtained from the IGS (https://cddis.nasa.gov/archive/gnss/products/troposphere/zpd/, accessed on 3 March 2021). The reanalysis data sets, namely, ERA5, MERRA-2, JRA-55 and NCEP/DOE, are provided by ECMWF (https://cds.climate.copernicus.eu/cdsapp#!/dataset/reanalysis-era5-single-levels?tab=form, accessed on 3 March 2021), NASA (https://goldsmr4.gesdisc.eosdis.nasa.gov/data/MERRA2/, accessed on 3 March 2021), JMA (https://jra.kishou.go.jp/index.html, accessed on 6 April 2021) and the National Oceanic and Atmospheric Administration (NOAA, https://psl.noaa.gov/data/gridded/data.ncep.reanalysis2.html, accessed on 6 April 2021), respectively.
Acknowledgments
The authors would like to thank the ECMWF, NASA, IGS, NOAA, JMA and the University of Wyoming for providing the relevant data.
Conflicts of Interest
The authors declare no conflict of interest.
References
- Trenberth, K.E.; Fasullo, J.; Smith, L. Trends and variability in column-integrated atmospheric water vapor. Clim. Dyn. 2005, 24, 741–758. [Google Scholar] [CrossRef]
- Schneider, T.; O’Gorman, P.A.; Levine, X.J. Water vapor and the dynamics of climate changes. Rev. Geophys. 2010, 48, RG3001. [Google Scholar] [CrossRef] [Green Version]
- Held, I.M.; Soden, B.J. Robust responses of the hydrological cycle to global warming. J. Clim. 2006, 19, 5686–5699. [Google Scholar] [CrossRef]
- Allan, R.P.; Soden, B.J. Atmospheric warming and the amplification of precipitation extremes. Science 2008, 321, 1481–1484. [Google Scholar] [CrossRef] [PubMed] [Green Version]
- Connolley, W.M.; King, J.C. Atmospheric water vapor transport to Antarctica, inferred from radiosondes. Q. J. R. Meteorol. Soc. 1993, 119, 325–342. [Google Scholar] [CrossRef]
- King, M.D.; Kaufman, Y.J.; Menzel, W.P.; Tanré, D. Remote sensing of cloud, aerosol, and water vapor properties from the moderate resolution imaging spectrometer (MODIS). IEEE Trans. Geosci. Remote Sens. 1992, 30, 2–27. [Google Scholar] [CrossRef] [Green Version]
- Sharifi, M.A.; Azadi, M.; Khaniani, A.S. Numerical simulation of rainfall with assimilation of conventional and GPS observations over north of Iran. Ann. Geophys. 2016, 59, 0322. [Google Scholar]
- Rohm, W.; Guzikowski, J.; Wilgan, K.; Kryza, M. 4DVAR assimilation of GNSS zenith path delays and precipitable water into a numerical weather prediction model WRF. Atmos. Meas. Tech. 2019, 12, 345–361. [Google Scholar] [CrossRef] [Green Version]
- Xiong, Z.; Sang, J.; Sun, X.; Zhang, B.; Li, J. Comparisons of performance using data assimilation and data fusion approaches in acquiring precipitable water vapor: A case study of a Western United States of America area. Water 2020, 12, 2943. [Google Scholar] [CrossRef]
- Dai, A. Recent climatology, variability, and trends in global surface humidity. J. Clim. 2006, 19, 3589–3606. [Google Scholar] [CrossRef] [Green Version]
- Niell, A.E.; Coster, A.J.; Solheim, F.S.; Mendes, V.B.; Toor, P.C.; Langley, R.B.; Upham, C.A. Comparison of measurements of atmospheric wet delay by radiosonde, water vapor radiometer, GPS, and VLBI. J. Atmos. Ocean. Technol. 2001, 18, 830–850. [Google Scholar] [CrossRef] [Green Version]
- Gui, K.; Che, H.; Chen, Q.; Zeng, Z.; Liu, H.; Wang, Y.; Zheng, Y.; Sun, T.; Liao, T.; Wang, H.; et al. Evaluation of radiosonde, MODIS-NIR-Clear, and AERONET precipitable water vapor using IGS ground-based GPS measurements over China. Atmos. Res. 2017, 197, 461–473. [Google Scholar] [CrossRef]
- Zeng, Z.; Mao, F.; Wang, Z.; Guo, J.; Gui, K.; An, J.; YIM, S.H.L.; Yang, Y.; Zhang, B.; Hu, J. Preliminary evaluation of the atmospheric infrared sounder water vapor over China against high-resolution radiosonde measurements. J. Geophys. Res. Atmos. 2019, 124, 3871–3888. [Google Scholar] [CrossRef]
- Huang, L.; Peng, H.; Liu, L.; Xiong, S.; Xie, S.; Chen, J.; Li, J.; He, H. GNSS precipitable water vapor retrieval with the aid of NWM data for China. Earth Space Sci. 2021, 8, e2020EA001550. [Google Scholar] [CrossRef]
- Huang, L.; Mo, Z.; Xie, S.; Liu, L.; Chen, J.; Kang, C.; Wang, S. Spatiotemporal characteristics of GNSS-derived precipitable water vapor during heavy rainfall events in Guilin, China. Satell. Navig. 2021, 2, 13. [Google Scholar] [CrossRef]
- Zhang, B.; Teunissen, P.J.G.; Odijk, D. A novel un-differenced PPP-RTK concept. J. Navig. 2011, 64, S180–S191. [Google Scholar] [CrossRef] [Green Version]
- Zhang, B.; Chen, Y.; Yuan, Y. PPP-RTK based on undifferenced and uncombined observations: Theoretical and practical aspects. J. Geod. 2018, 93, 1011–1024. [Google Scholar] [CrossRef]
- Trenberth, K.E.; Smith, L. The mass of the atmosphere: A constraint on global analyses. J. Clim. 2005, 18, 864–875. [Google Scholar] [CrossRef]
- Dessler, A.E.; Davis, S.M. Trends in tropospheric humidity from reanalysis systems. J. Geophys. Res. 2010, 115, D19127. [Google Scholar] [CrossRef]
- Suparta, W.; Rashid, Z.A.A.; Ali, M.A.M.; Yatim, B.; Fraser, G.J. Observations of Antarctic precipitable water vapor and its response to the solar activity based on GPS sensing. J. Atmos. Sol.-Terr. Phys. 2008, 70, 1419–1447. [Google Scholar] [CrossRef]
- Suparta, W.; Ali, M.A.M.; Yatim, B.; Fraser, G.J. Analysis of GPS-sensed atmospheric water vapour variability and its response to the terrestrial winds over Antarctica. Phys. Chem. Earth Parts A/B/C 2009, 34, 72–87. [Google Scholar] [CrossRef]
- Suparta, W. Using a global positioning system to estimate precipitable water vapor in Antarctica. Polar Geo. 2010, 33, 63–79. [Google Scholar] [CrossRef]
- Chen, B.; Liu, Z. Global water vapor variability and trend from the latest 36 year (1979 to 2014) data of ECMWF and NCEP reanalyses, radiosonde, GPS, and microwave satellite. J. Geophys. Res. Atmos. 2016, 121, 11442–11462. [Google Scholar] [CrossRef]
- Parracho, A.C.; Bock, O.; Bastin, S. Global IWV trends and variability in atmospheric reanalyses and GPS observations. Atmos. Chem. Phys. 2018, 18, 16213–16237. [Google Scholar] [CrossRef] [Green Version]
- Ricaud, P.; Grigioni, P.; Roehrig, R.; Durand, P.; Veron, D.E. Trends in atmospheric humidity and temperature above Dome C, Antarctica evaluated from observations and reanalyses. Atmosphere 2020, 11, 836. [Google Scholar] [CrossRef]
- Wang, S.; Xu, T.; Nie, W.; Jiang, C.; Yang, Y.; Fang, Z.; Li, M.; Zhang, Z. Evaluation of precipitable water vapor from five reanalysis products with ground-based GNSS observations. Remote Sens. 2020, 12, 1817. [Google Scholar] [CrossRef]
- Zhao, Q.; Yang, P.; Yao, W.; Yao, Y. Hourly PWV dataset derived from GNSS observations in China. Sensors 2019, 20, 231. [Google Scholar] [CrossRef] [Green Version]
- Yuan, P.; Hunegnaw, A.; Alshawaf, F.; Awange, J.; Klos, A.; Teferle, F.N.; Kutterer, H. Feasibility of ERA5 integrated water vapor trends for climate change analysis in continental Europe: An evaluation with GPS (1994–2019) by considering statistical significance. Remote Sens. Environ. 2021, 260, 112416. [Google Scholar] [CrossRef]
- Molod, A.; Takacs, L.; Suarez, M.; Bacmeister, J. Development of the GEOS-5 atmospheric general circulation model: Evolution from MERRA to MERRA2. Geosci. Model Dev. 2015, 8, 1339–1356. [Google Scholar] [CrossRef] [Green Version]
- Kleist, D.T.; Parrish, D.F.; Derber, J.C.; Treadon, R.; Errico, R.M.; Yang, R. Improving incremental balance in the GSI 3DVAR analysis system. Mon. Weather Rev. 2009, 137, 1046–1060. [Google Scholar] [CrossRef]
- Wu, W.-S.; Purser, R.J.; Parrish, D.F. Three-dimensional variational analysis with spatially inhomogeneous covariances. Mon. Weather Rev. 2002, 130, 2905–2916. [Google Scholar] [CrossRef] [Green Version]
- Kobayashi, S.; Ota, Y.; Harada, Y.; Ebita, A.; Moriya, M.; Onoda, H.; Onogi, K.; Kamahori, H.; Kobayashi, C.; Endo, H. The JRA-55 reanalysis: General specifications and basic characteristics. J. Meteorol. Soc. Jpn. 2015, 93, 5–48. [Google Scholar] [CrossRef] [Green Version]
- Harada, Y.; Kamahori, H.; Kobayashi, C.; Endo, H.; Kobayashi, S.; Ota, Y.; Onoda, H.; Onogi, K.; Miyaoka, K.; Takahashi, K. The JRA-55 Reanalysis: Representation of atmospheric circulation and climate variability. J. Meteorol. Soc. Jpn. 2016, 94, 269–302. [Google Scholar] [CrossRef] [Green Version]
- Kanamitsu, M.; Ebisuzaki, W.; Woollen, J.; Yang, S.-K.; Hnilo, J.; Fiorino, M.; Potter, G. Ncep–doe amip-ii reanalysis (r-2). Bull. Am. Meteorol. Soc. 2002, 83, 1631–1644. [Google Scholar] [CrossRef]
- Gui, K.; Che, H.; Chen, Q.; Zeng, Z.; Zheng, Y.; Long, Q.; Sun, T.; Liu, X.; Wang, Y.; Liao, T.; et al. Water vapor variation and the effect of aerosols in China. Atmos. Environ. 2017, 165, 322–335. [Google Scholar] [CrossRef]
- Zhang, W.; Zhang, H.; Liang, H.; Lou, Y.; Cai, Y.; Cao, Y.; Zhou, Y.; Liu, W. On the suitability of ERA5 in hourly GPS precipitable water vapor retrieval over China. J. Geod. 2019, 93, 1897–1909. [Google Scholar] [CrossRef]
- Byun, S.; Bar-Sever, Y. A new type of troposphere zenith path delay product of the international GNSS service. J. Geod. 2009, 83, 367–373. [Google Scholar] [CrossRef] [Green Version]
- Huang, L.; Liu, L.; Chen, H.; Jiang, W. An improved atmospheric weighted mean temperature model and its impact on GNSS precipitable water vapor estimates for China. GPS Solut. 2019, 23, 51. [Google Scholar] [CrossRef]
- Guo, L.; Huang, L.; Li, J.; Liu, L.; Huang, L.; Fu, B.; Xie, S.; He, H.; Ren, C. A comprehensive evaluation of key tropospheric parameters from ERA5 and MERRA-2 reanalysis products using radiosonde data and GNSS measurements. Remote Sens. 2021, 13, 3008. [Google Scholar] [CrossRef]
- Bock, O.; Bosser, P.; Pacione, R.; Nuret, M.; Fourrié, N.; Parracho, A. A high-quality reprocessed ground-based GPS dataset for atmospheric process studies, radiosonde and model evaluation, and reanalysis of HyMeX Special Observing Period. Q. J. R. Meteorol. Soc. 2016, 142, 56–71. [Google Scholar] [CrossRef]
- Askne, J.; Nordius, H. Estimation of tropospheric delay for microwaves from surface weather data. Radio Sci. 1987, 22, 379–386. [Google Scholar] [CrossRef]
- Bevis, M.; Businger, S.; Chiswell, S.; Herring, T.A.; Anthes, R.A.; Rocken, C.; Ware, R.H. GPS Meteorology: Mapping zenith wet delays onto precipitable water. J. Appl. Meteorol. 1994, 33, 379–386. [Google Scholar] [CrossRef]
- Saastamoinen, J. Atmospheric correction for the troposphere and stratosphere in radio ranging satellites. Use Artif. Satell. Geod. 1972, 15, 247–251. [Google Scholar]
- Huang, L.; Jiang, W.; Liu, L.; Chen, H.; Ye, S. A new global grid model for the determination of atmospheric weighted mean temperature in GPS precipitable water vapor. J. Geod. 2019, 93, 159–176. [Google Scholar] [CrossRef]
- Böhm, J.; Moller, G.; Schindelegger, M.; Pain, G.; Weber, R. Development of an improved empirical model for slant delays in the troposphere (GPT2w). GPS Solut. 2015, 19, 433–441. [Google Scholar] [CrossRef] [Green Version]
- Feng, P.; Li, F.; Yan, J.; Zhang, F.; Barriot, J.-P. Assessment of the accuracy of the Saastamoinen model and VMF1/VMF3 mapping functions with respect to ray-tracing from radiosonde data in the framework of GNSS meteorology. Remote Sens. 2020, 12, 3337. [Google Scholar] [CrossRef]
- Wang, X.; Zhang, K.; Wu, S.; Fan, S.; Cheng, Y. Water vapor-weighted mean temperature and its impact on the determination of precipitable water vapor and its linear trend. J. Geophys. Res. Atmos. 2016, 121, 833–852. [Google Scholar] [CrossRef]
- Böehm, J.; Heinkelmann, R.; Schuh, H. Short note: A global model of pressure and temperature for geodetic applications. J. Geod. 2007, 81, 679–683. [Google Scholar] [CrossRef]
- Leckner, B. The spectral distribution of solar radiation at the earth’s surface—Elements of a model. Sol. Energy 1978, 20, 143–150. [Google Scholar] [CrossRef]
- KOUBA, J. Implementation and testing of the gridded Vienna Mapping Function 1 (VMF1). J. Geod. 2008, 82, 193–205. [Google Scholar] [CrossRef]
- Huang, L.; Mo, Z.; Liu, L.; Zeng, Z.; Chen, J.; Xiong, S.; He, H. Evaluation of hourly PWV products derived from ERA5 and MERRA-2 over the Tibetan Plateau using ground-based GNSS observations by two enhanced models. Earth Space Sci. 2021, 8, e2020EA001516. [Google Scholar] [CrossRef]
- Sen, P.K. Estimates of the regression coefficient based on Kendall’s tau. J. Am. Stat. Assoc. 1968, 63, 1379–1389. [Google Scholar] [CrossRef]
- Zhang, W.; Lou, Y.; Huang, J.; Zheng, F.; Cao, Y.; Liang, H.; Shi, C.; Liu, J. Multiscale variations of precipitable water over China based on 1999–2015 ground-based GPS observations and evaluations of reanalysis products. J. Clim. 2018, 31, 945–962. [Google Scholar] [CrossRef]
- Zhai, P.; Eskridge, R.E. Atmospheric water vapor over China. J. Clim. 1997, 10, 2643–2652. [Google Scholar] [CrossRef]
- Hamed, K.H.; Rao, A.R. A modified Mann-Kendall trend test for autocorrelated data. J. Hydrol. 1998, 204, 182–196. [Google Scholar] [CrossRef]
- Vázquez B, G.E.; Grejner-Brzezinska, D.A. GPS-PWV estimation and validation with radiosonde data and numerical weather prediction model in Antarctica. GPS Solut. 2013, 17, 29–39. [Google Scholar] [CrossRef]
- Zhang, W.; Lou, Y.; Haase, J.S.; Zhang, R.; Zheng, G.; Huang, J.; Shi, C.; Liu, J. The use of ground-based GPS precipitable water measurements over China to assess radiosonde and ERA-Interim moisture trends and errors from 1999 to 2015. J. Clim. 2017, 30, 7643–7667. [Google Scholar] [CrossRef]
- Jiang, P.; Ye, S.; Chen, D.; Liu, Y.; Xia, P. Retrieving precipitable water vapor data using GPS zenith delays and global reanalysis data in China. Remote Sens. 2016, 8, 389. [Google Scholar] [CrossRef] [Green Version]
- Thomas, I.D.; King, M.A.; Clarke, P.J.; Penna, N.T. Precipitable water vapor estimates from homogeneously reprocessed GPS data: An intertechnique comparison in Antarctica. J. Geophys. Res. 2011, 116, D04107. [Google Scholar] [CrossRef] [Green Version]
- Lloyd, A.J.; Wiens, D.A.; Nyblade, A.A.; Anandakrishnan, S.; Aster, R.C.; Huerta, A.D.; Wilson, T.J.; Dalziel, I.W.D.; Shore, P.J.; Zhao, D. A seismic transect across West Antarctica: Evidence for mantle thermal anomalies beneath the Bentley Subglacial Trench and the Marie Byrd Land Dome. J. Geophys. Res. Solid Earth 2015, 120, 8439–8460. [Google Scholar] [CrossRef]
- Bock, O.; Willis, P.; Wang, J.; Mears, C. A highquality, homogenized, global, long-term (1993–2008) DORIS precipitable water data set for climate monitoring and model verification. J. Geophys. Res. Atmos. 2014, 119, 7209–7230. [Google Scholar] [CrossRef]
- Ning, T.; Wickert, J.; Deng, Z.; Heise, S.; Dick, G.; Vey, S.; Schöne, T. Homogenized time series of the atmospheric water vapour content obtained from the GNSS reprocessed data. J. Clim. 2016, 29, 2443–2456. [Google Scholar] [CrossRef]
Publisher’s Note: MDPI stays neutral with regard to jurisdictional claims in published maps and institutional affiliations. |
© 2021 by the authors. Licensee MDPI, Basel, Switzerland. This article is an open access article distributed under the terms and conditions of the Creative Commons Attribution (CC BY) license (https://creativecommons.org/licenses/by/4.0/).

