Abstract
In recent years, the interpretation of SAR images has been significantly improved with the development of deep learning technology, and using conditional generative adversarial nets (CGANs) for SAR-to-optical transformation, also known as image translation, has become popular. Most of the existing image translation methods based on conditional generative adversarial nets are modified based on CycleGAN and pix2pix, focusing on style transformation in practice. In addition, SAR images and optical images are characterized by heterogeneous features and large spectral differences, leading to problems such as incomplete image details and spectral distortion in the heterogeneous transformation of SAR images in urban or semiurban areas and with complex terrain. Aiming to solve the problems of SAR-to-optical transformation, Serial GANs, a feature-preserving heterogeneous remote sensing image transformation model, is proposed in this paper for the first time. This model uses the Serial Despeckling GAN and Colorization GAN to complete the SAR-to-optical transformation. Despeckling GAN transforms the SAR images into optical gray images, retaining the texture details and semantic information. Colorization GAN transforms the optical gray images obtained in the first step into optical color images and keeps the structural features unchanged. The model proposed in this paper provides a new idea for heterogeneous image transformation. Through decoupling network design, structural detail information and spectral information are relatively independent in the process of heterogeneous transformation, thereby enhancing the detail information of the generated optical images and reducing its spectral distortion. Using SEN-2 satellite images as the reference, this paper compares the degree of similarity between the images generated by different models and the reference, and the results revealed that the proposed model has obvious advantages in feature reconstruction and the economical volume of the parameters. It also showed that Serial GANs have great potential in decoupling image transformation.
1. Introduction
In recent years, there have been more and more applications of remote sensing images in environmental monitoring, disaster prevention, intensive farming, and homeland security. In practice, optical images are widely used due to their high spectral resolution and easy interpretation. The disadvantage is that they are sensitive to meteorological conditions, especially clouds and haze, which severely limits their use for observation and monitoring of ground targets [1]. In contrast, synthetic aperture radar (SAR) sensors can overcome adverse meteorological conditions by creating images using a longer wavelength of radio waves to obtain all-day and all-weather continuous observations. Although SAR images have significant advantages over optical images, their application is still limited by the difficulty of SAR image interpretation. First, because synthetic aperture radar is a side range-measuring instrument, the imaging effect is affected by the distance between the target and the antenna, which can lead to geometric distortion in SAR images [2]. Therefore, compared with optical images, it is more difficult for human eyes to understand the details of SAR images. Secondly, synthetic aperture imaging is a coherent imaging method in which the radio waves in the radar beam are aligned in space and time. While this consistency provides many advantages (required by the synthetic aperture process to work), it also leads to a phenomenon called speckle, which reduces the quality of SAR images and makes image interpretation more challenging [3]. Therefore, it is difficult to distinguish structural information directly from SAR images, which may not necessarily become easier with the increase in spatial resolution [4]. Considering the above two points, how to effectively use and interpret the target and scene information in SAR images has become an important issue that users of SAR data need to pay attention to. Under the condition of reasonable use of SAR image amplitude information, if the SAR image can be converted into a near-optical representation that is easy to recognize by human eyes, this will create new opportunities for SAR image interpretation.
Deep learning is a powerful tool for the interpretation of SAR images. Some scholars have reconstructed clear images by learning hidden nonlinear relations [5,6,7,8,9,10]. This type of method uses a residual learning strategy to overcome speckle noise by learning the mapping between the speckle image and the corresponding speckle-free reconstruction so that it can be further analyzed and explained. Although this mapping learning may be an ill-posed problem, it also provides a useful reference for SAR image interpretation.
In addition to convolutional neural networks, image translation methods in the field of natural images and human images provide other ideas for SAR-to-optical image transformation, such as through conditional generative adversarial networks (CGANs) [11,12,13,14]. This type of method separates the style and semantic information in image transformation, so it can transform from the SAR image domain to the optical image domain, and also ensures the transformed images have the prior structural information of the SAR images and the spectral information of optical images. In previous studies, CGANs were first applied to the translation tasks of text to text [15], text to image [16], and image to image [17,18], and are suitable for generating unknown sequences (text/image/video frames) from known conditional sequences (text/image/video frames). In recent literature, the applications of CGANs in image processing were mostly in image modification. This includes single image super-resolution [17], interactive image generation [18], image editing [19], image-to-image translation [11], etc. CGANs have been used in SAR-to-optical transformation in recent years. In the literature [20,21,22], different improved SAR-to-optical transformation models based on CycleGAN and pix2pix have been proposed. The general idea of these models is to improve the model structure and loss function, but they are not designed specifically for the differences of imaging principle between SAR images and optical images, so they do not have universal applicability.
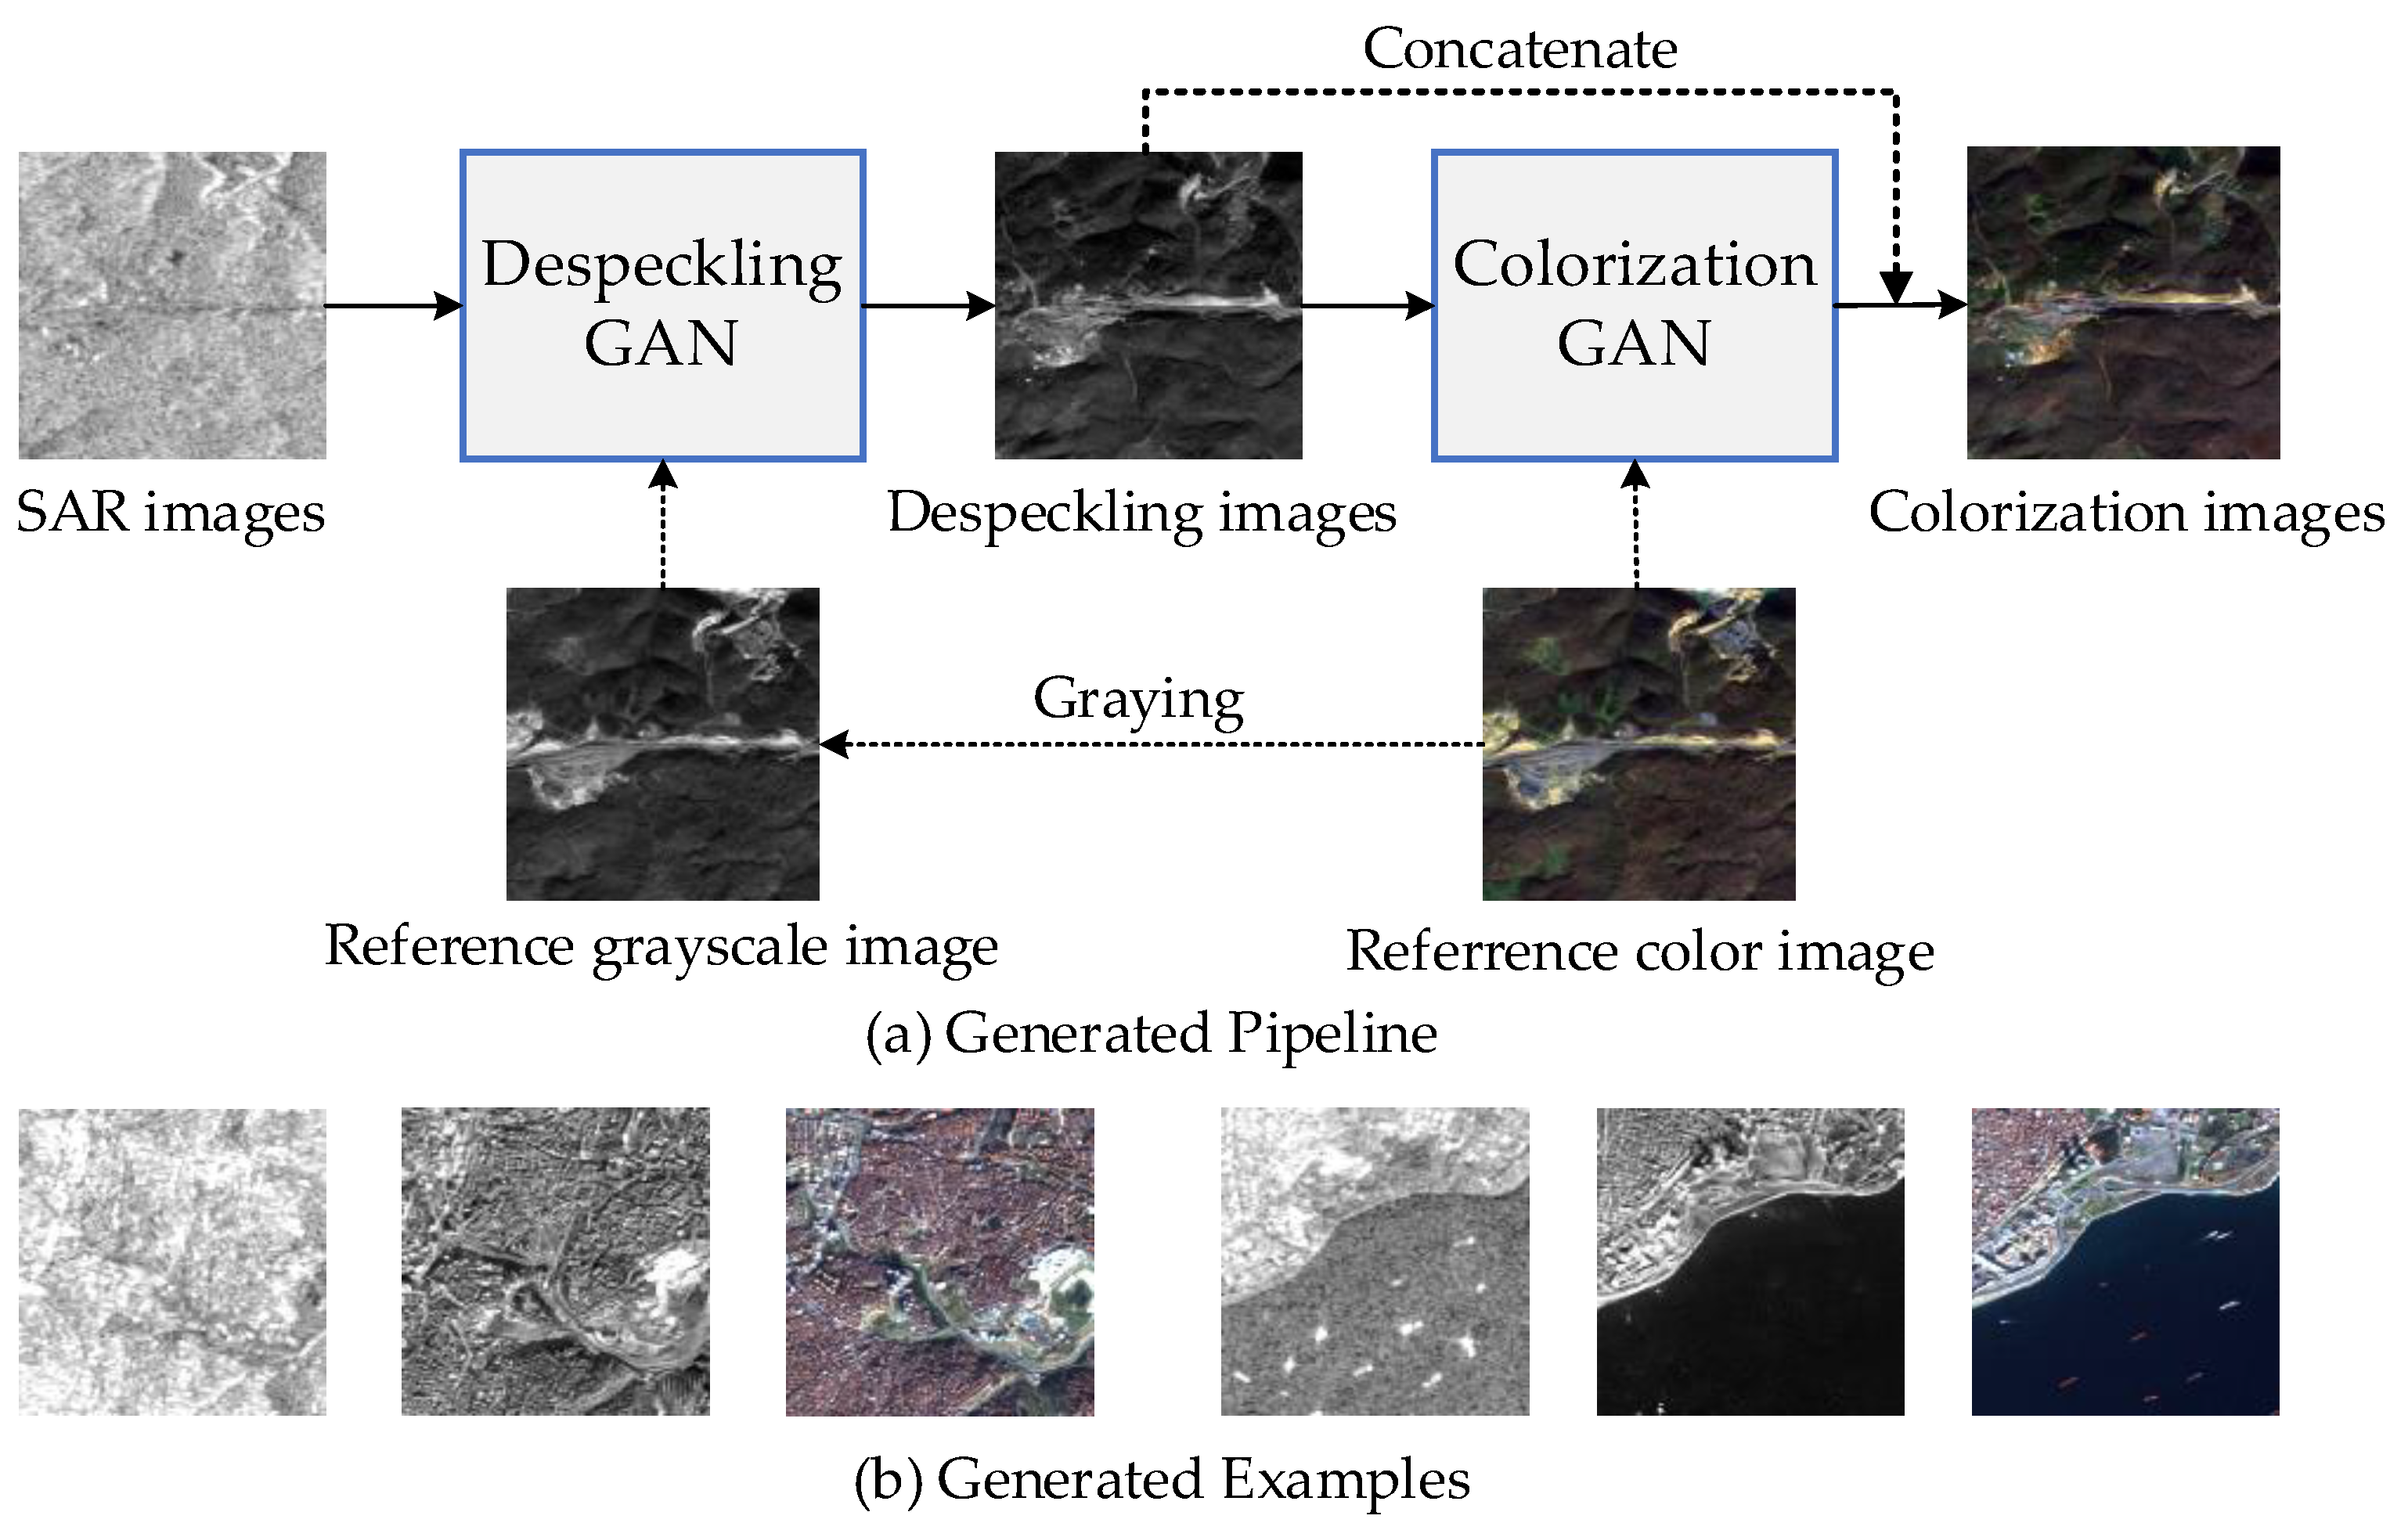
In order to solve the problem of heterogeneous image transformation in principle, as shown in Figure 1a, we decomposed the SAR-to-optical transformation task into two steps: the first step was to implement the transformation from the SAR image domain to optical grayscale image domain through the Despeckling GAN. In this step, we aimed to suppress the speckle effect of SAR images and reconstruct the semantic structural information and texture details of SAR images. In the second step, we transformed the optical grayscale images obtained in the first step into optical color images through the Colorization GAN. The two subtasks are relatively independent and have low coupling, which can reduce the semantic distortion and spectral distortion in the process of direct SAR-to-optical transformation.

Figure 1.
(a) Overview of our method: the SAR image affected by speckling is the input, and the Despeckling GAN generates a corresponding optical grayscale image as output. The optical grayscale image is then sent as input to the second generator network Colorization GAN, and the output is an optical color image. (b) Examples of generating optical grayscale images and optical color images through the Serial GANs.
The main contributions of this paper are as follows.
- Unlike the existing methods of direct image translation, this paper proposes a feature-preserving SAR-to-optical transformation model, which decouples the SAR-to-optical transformation task into SAR-to-gray transformation and gray-to-color transformation. This design effectively reduces the difficulty of the original task, enhancing the feature details of the generated optical color images and reducing spectral distortion.
- In this paper, Despeckling GAN is proposed to transform SAR images into optical grayscale images, and its generator is improved on the basis of the U-net [11]. In the processing, Despeckling GAN guides SAR images to generate optical grayscale images based on the texture details of SAR images by gradient maps, thus enhancing the semantic and feature information of transformed images [23].
- In this paper, Colorization GAN is proposed for despeckled grayscale image colorization. Its generator adopts a convolutional self-coding structure. We establish short-skip connections in different levels and long-skip connections between the same level of encoding and decoding. This structure design enables different levels of image information to flow in the network structure, to generate more realistic images with hue information.
The rest of this paper is structured as follows. Section 2 introduces the materials involved in this paper. Section 3 introduces the method in detail, including the network structure and the loss function. In Section 4, the experimental results are given, which are discussed and evaluated based on indexes. Section 5 shows the discussion of this paper. The last part of the paper (Section 6) gives the conclusions and prospects for future work.
2. Materials
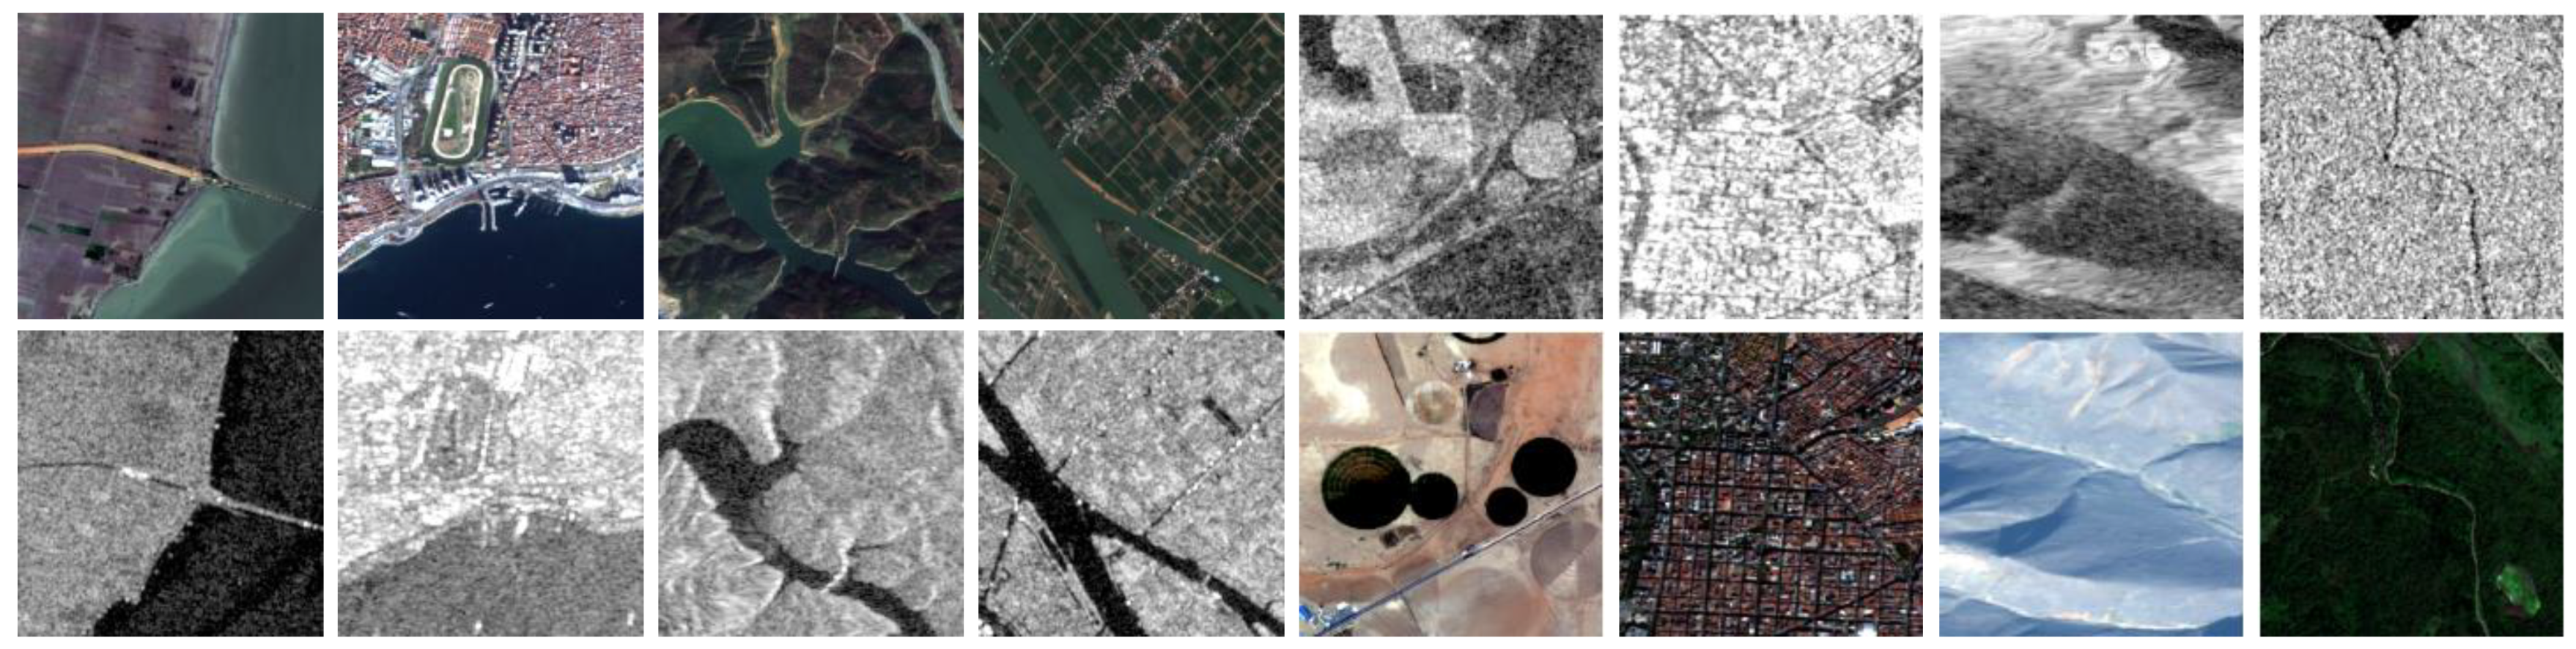
Due to the lack of a large number of paired SAR and optical image datasets, deep learning-based SAR-to-optical translation research has mainly followed the idea of the CycleGAN [12] model; that is, unpaired image transformation. With the decrease in the cost of remote sensing images, a new idea has been presented to solve the cross-modal transformation, by using an image transformation method based on the Generative Adversarial Network. In the literature [24], Schmitt et al. published the SEN1-2 dataset to promote SAR and optical image fusion in deep learning research. The SEN1-2 dataset is a traditional remote sensing image dataset obtained by the SAR and optical sensors of the Sentinel-1 and Sentinel-2 satellites. As part of the Copernicus Project of the European Space Agency (ESA), Sentinel satellites are used for remote sensing tasks in the fields of climate, ocean, and land detection. The mission is being carried out jointly by six satellites with different observation applications. Sentinel-1 and Sentinel-2 provide the two most conventional SAR and optical images respectively, so they have been widely studied in the field of remote sensing image processing. Sentinel-1 is equipped with a C-band SAR sensor, which enables it to obtain high-positioning-accuracy SAR images regardless of weather conditions [25]. In its unique SAR imaging mode, the nominal resolution of Sentinel-1 is not less than 5 m, while providing dual-polarization capability and a very short equatorial access time (about 1 week) [26]. In the SEN1-2 dataset, Sentinel-1 images were collected in the interference wide (IW) swath mode, and the result obtained is the ground-range-detected (GRD) products. These images contain the backscatter coefficient in dB scale for every pixel spacing of 5 m in azimuth and 20 m in range. In order to simplify the operation, the dataset pays more attention to the VV polarization data and ignores the data of VH polarization. Sentinel-2 consists of two polar-orbiting satellites in the same orbit, with a phase difference of 180 degrees [27]. For the Sentinel-2 part of the dataset SEN1-2, the researchers used red, green, and blue channels (i.e., Bands 4, 3, and 2) to generate realistic RGB grid images. Because cloud occlusion will affect the final effect, the cloud coverage of the Sentinel-2 image in the dataset is less than or equal to 1%. SEN1-2 is composed of 282,384 pairs of related image patches, which come from all over the world and all weathers and seasons. It is the first large, open dataset of this kind and has significant advantages for learning a cross-modal mapping from SAR images to optical images. With the aid of the SEN1-2 dataset, we were able to build a new model that is different from the previous methods, the Serial GANs model proposed in this paper. Figure 2 shows some examples of image pairs in SEN1-2.

Figure 2.
Some example patch pairs from the SEN1-2 dataset. Top row: Sentinel-1 SAR image patches; bottom row: Sentinel-2 RGB image patches.
3. Method
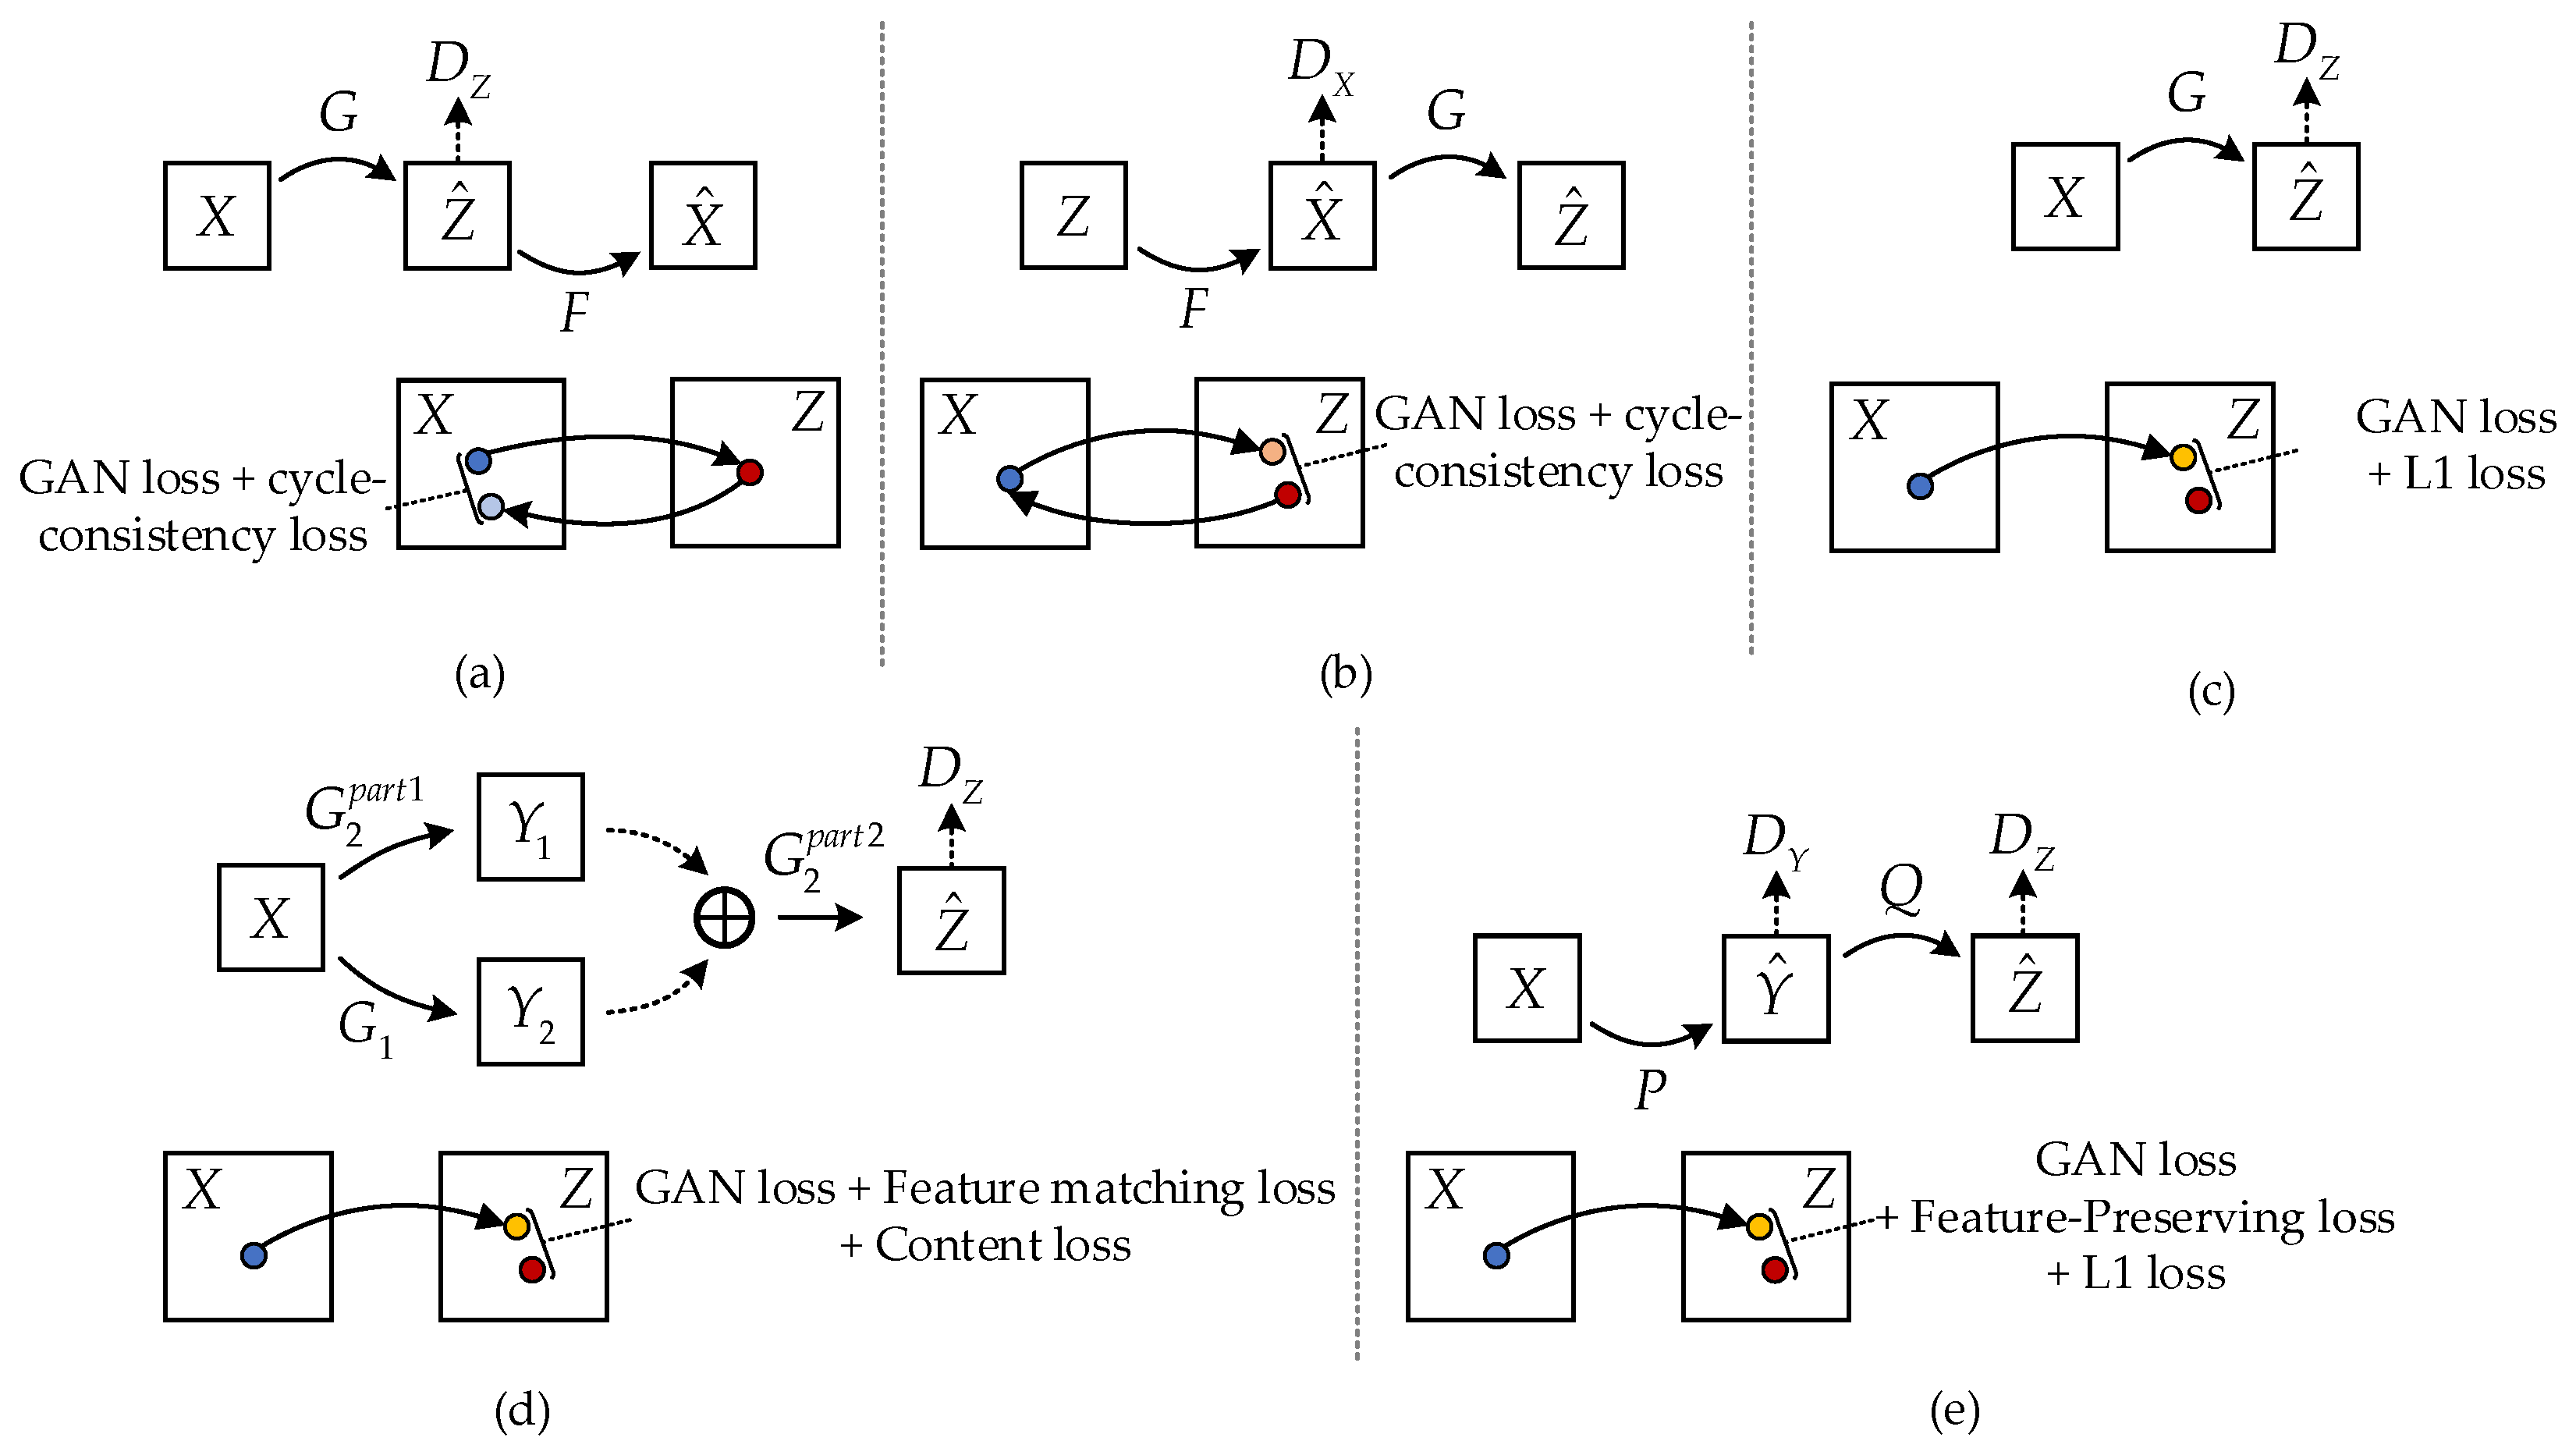
The heterogeneous transformation from SAR images to optical images is an ill-posed problem. The transformation results are often not ideal due to speckle noise, SAR image resolution, and other factors. Inspired by the ideas of pix2pix, CycleGAN and pix2pixHD, as shown in Figure 3a–d, this paper attempted to introduce optical grayscale images as the intermediate transformation domain . The transformation task from the SAR image domain to the optical color image domain was completed in two steps by two generators ( and ) and two discriminators ( and ) as shown in Figure 3e. First, the generator completes the mapping: , in which the SAR image is transformed into the optical grayscale image, and the corresponding discriminator is used to promote the transformation of the SAR image in the source domain to the optical grayscale image in the domain , which is difficult to distinguish from the real optical grayscale image. Then, the generator completes the mapping: , in which the optical grayscale image is transformed to the optical color image, and the corresponding discriminator is used to promote the transformation of the optical grayscale image in the intermediate domain to the optical color image in the domain , which is difficult to distinguish from the optical color image. In this way, the original transformation process from the SAR image to the optical color image is divided into two steps, reducing the semantic distortion and feature loss in the process of direct transformation from the SAR image to the optical color image.
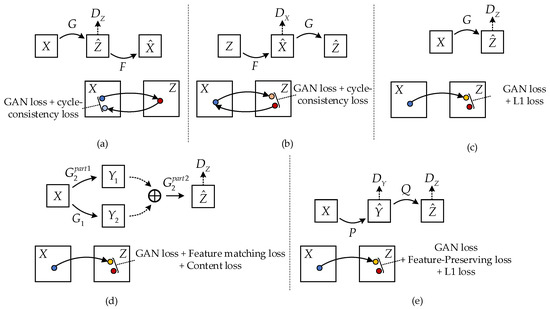
Figure 3.
Overview of different methods. (a,b) CycleGAN. It is essentially two mirror-symmetric GANs, which share two generators G and F with discriminators and respectively, and it uses GAN loss and cycle-consistency loss; (c) pix2pix, which directly transforms the image from the X domain to the Z domain, using GAN loss and L1 loss; (d) pix2pixHD. Different from pix2pix, it has two generators, and , and its loss functions are GAN loss, Feature-matching loss, and Content loss; (e) the method proposed in this paper. It uses the intermediate state y as the transition, and its loss functions are GAN loss, Feature-preserving loss, and L1 loss.
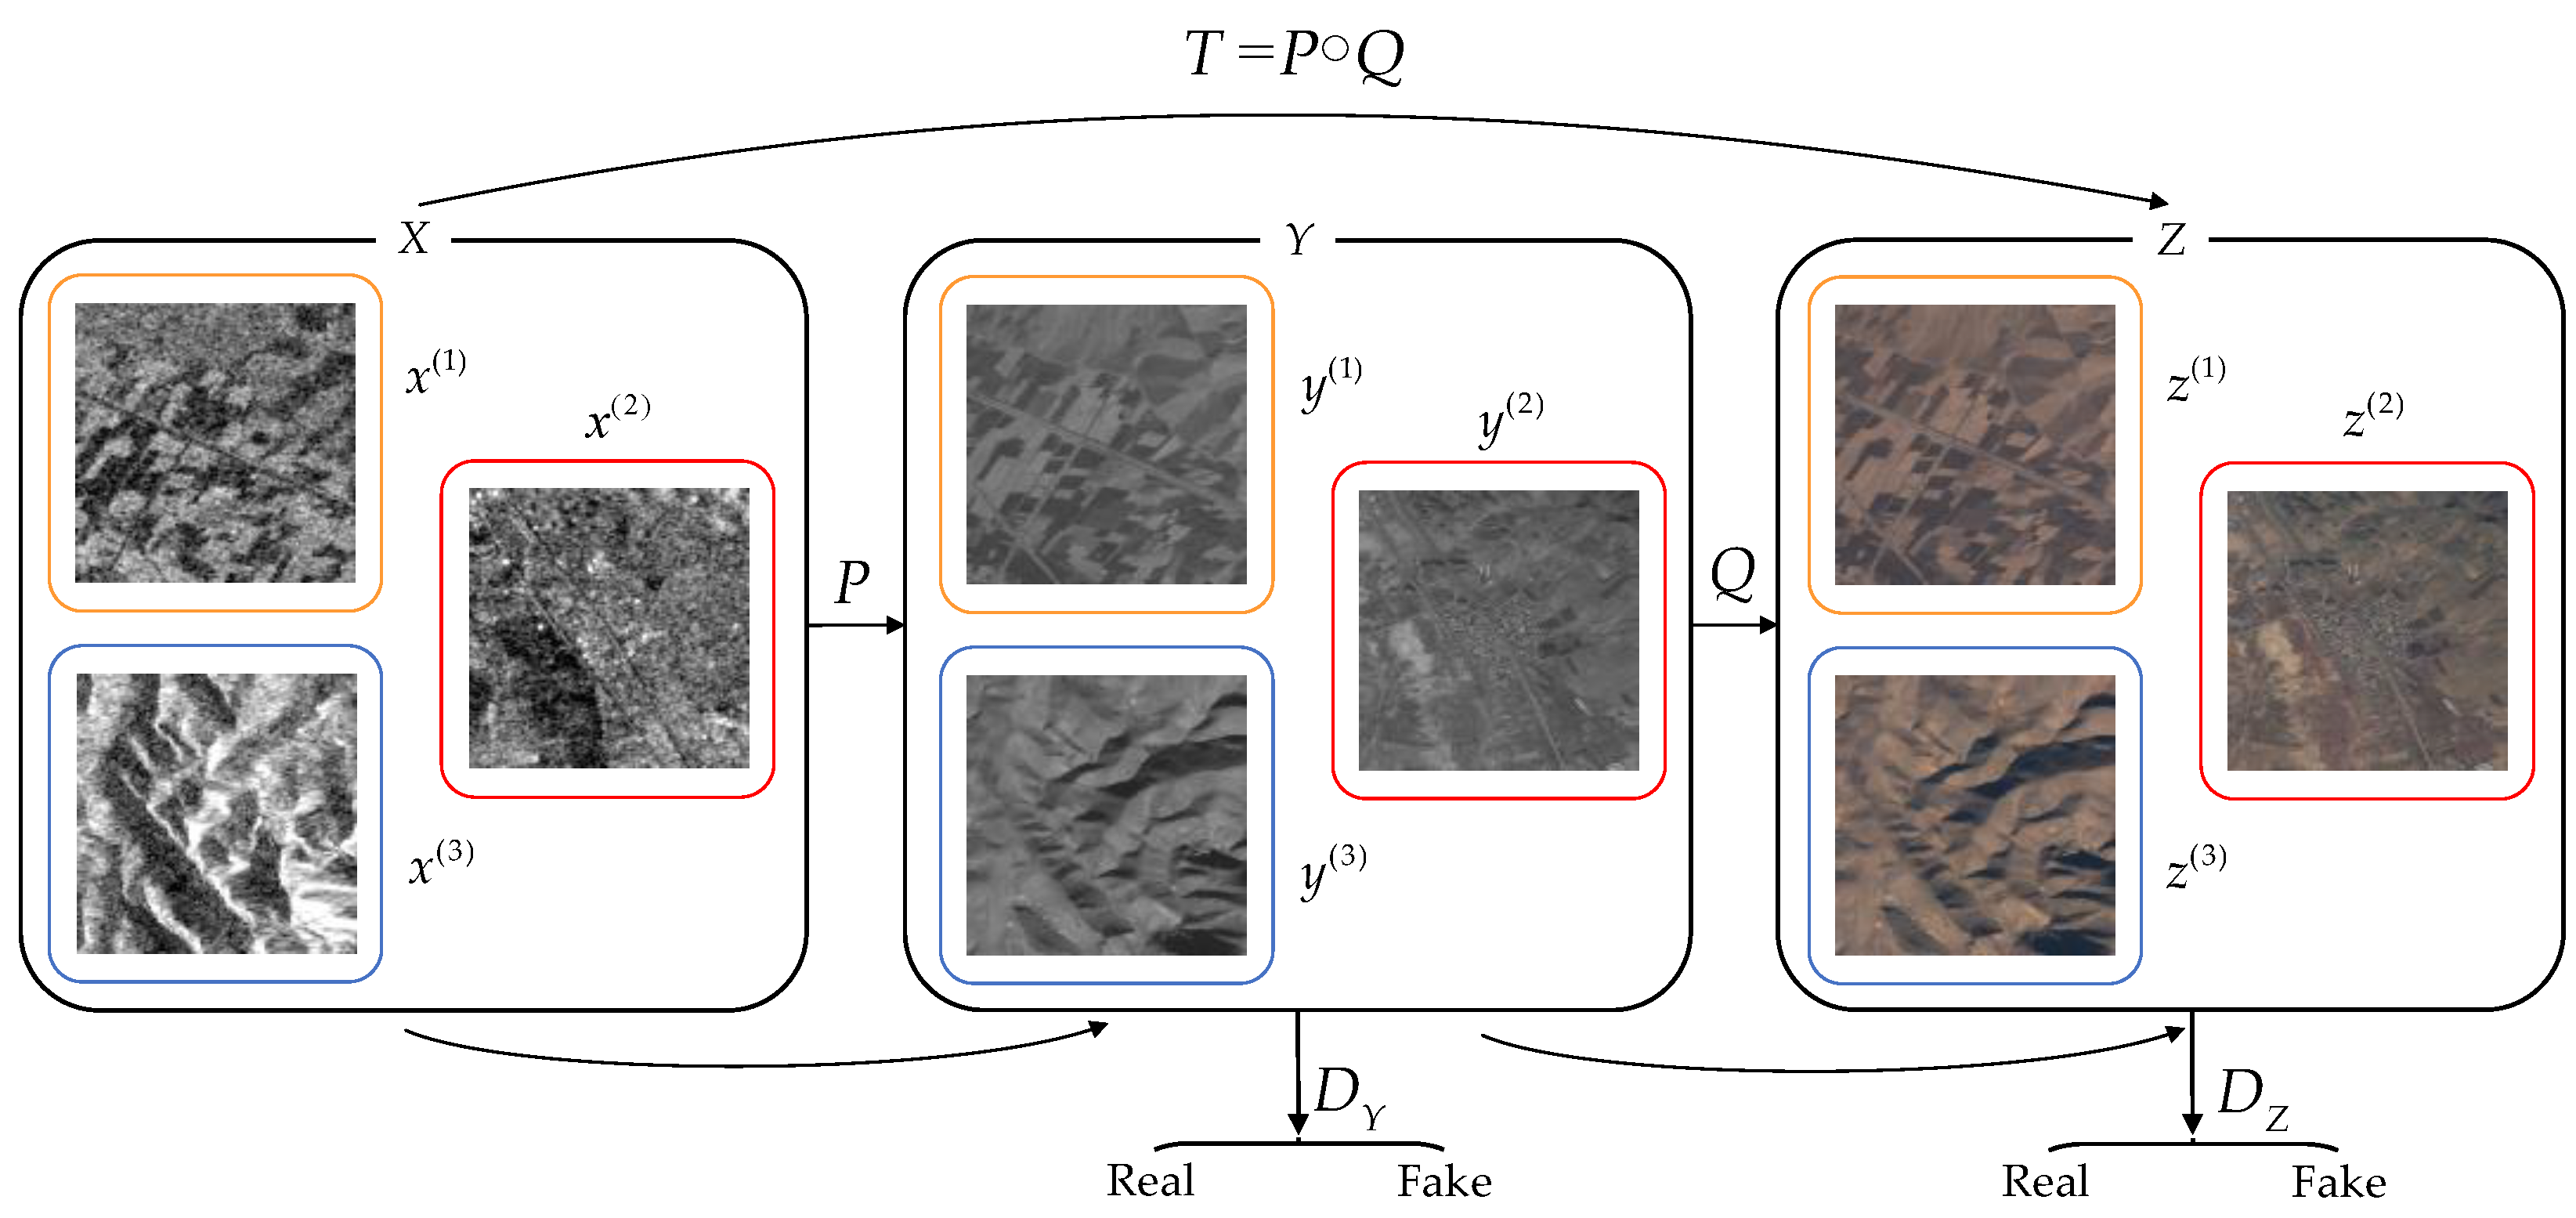
As shown in Figure 4, the transformation from SAR images to optical images can be defined as the mapping transformation , from the source domain to the target domain . Suppose that is a random sample taken from the SAR image domain , and its distribution function is , and the random sample mapped to the optical grayscale image domain is . The final task of the network proposed in this paper is , in which the final distribution function is generated from our network.
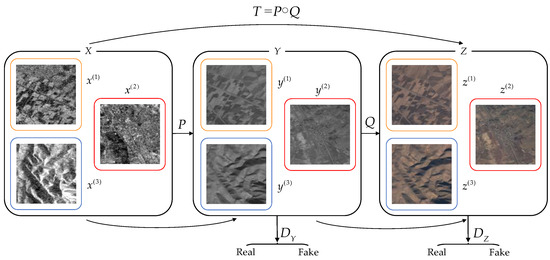
Figure 4.
A feature-preserving heterogeneous remote sensing image transformation model is proposed in this paper. Let X, Y, and Z denote the SAR image domain, intermediate optical grayscale image domain, and optical color image domain, respectively, and , and denote the dataset samples of the corresponding image domain (, denotes the total sample number of the data set).
3.1. Despeckling GAN
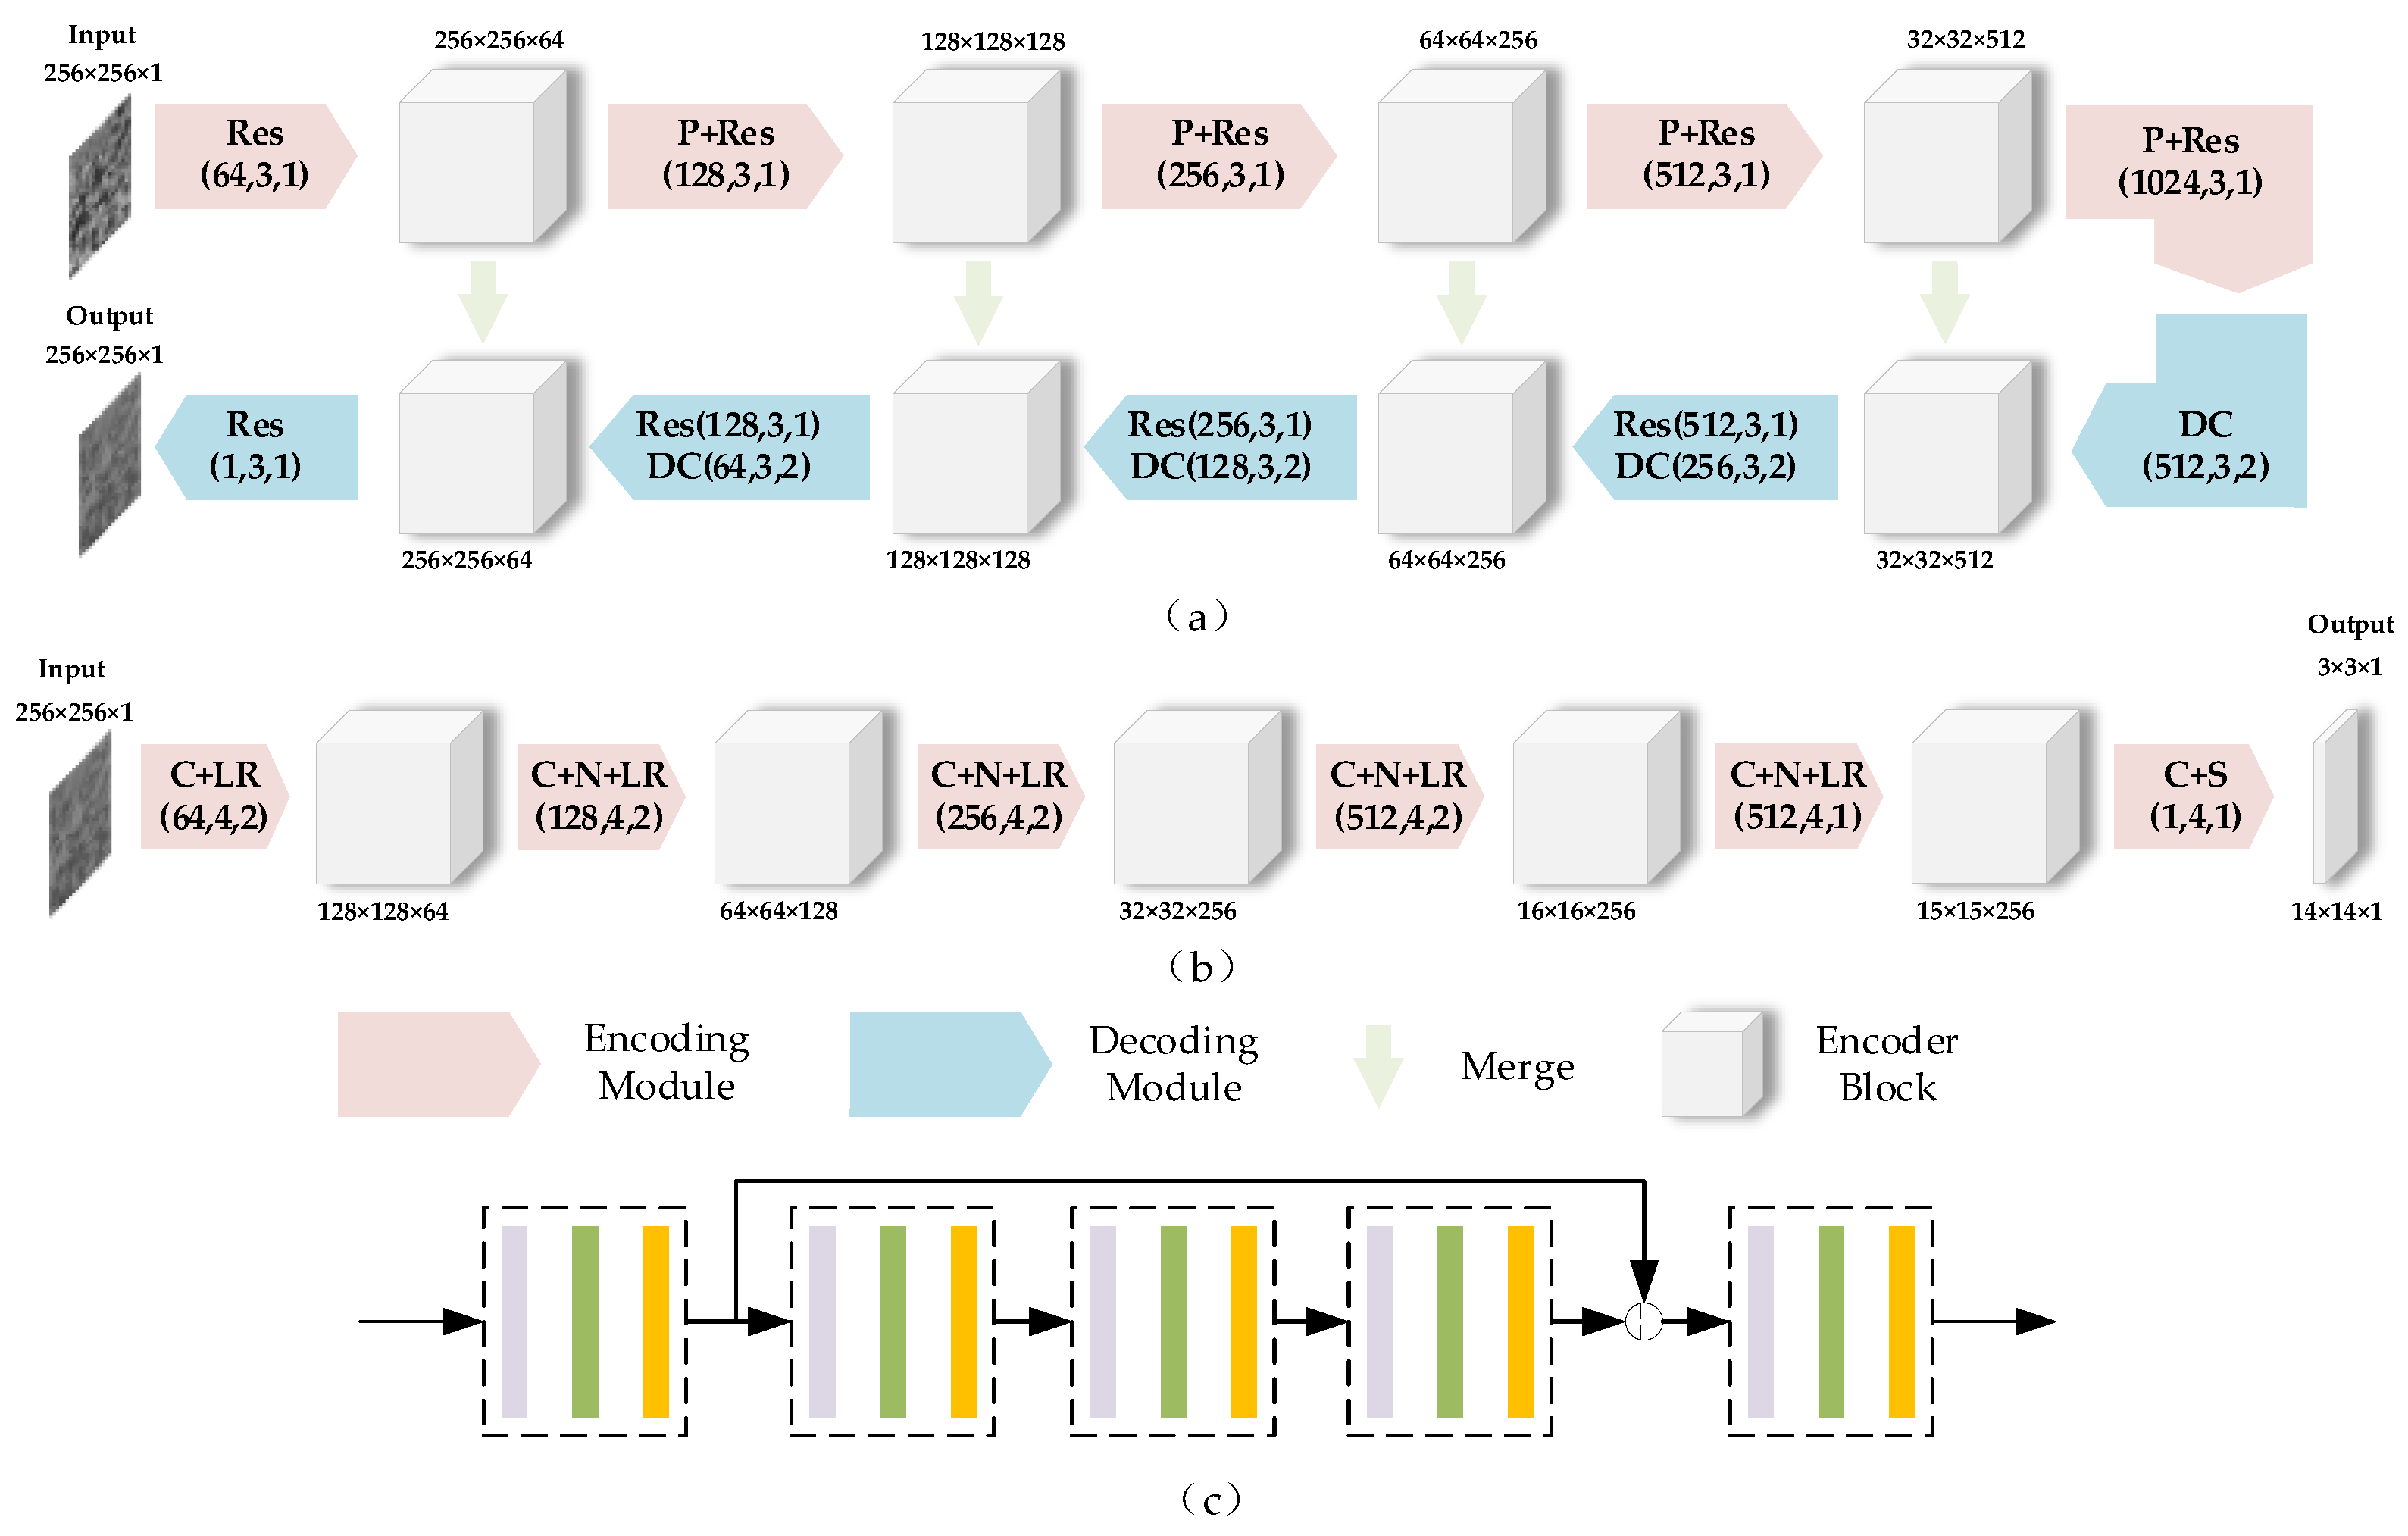
Generator : As shown in Figure 5a, this paper used an improved U-net as the generator of Despeckling GAN. The input SAR image was encoded and decoded to output the optical grayscale image. A structure similar to the convolutional self-encoding network enables the generation network to better predict the optical grayscale image corresponding to the SAR image. The encoding and decoding process of the generator works on multiple levels to ensure that the overall contour and local details of the original SAR image are extracted on multi-scales. In the decoding process, the network upsamples the feature map of the previous level to the next level through deconvolution and adds the feature map of the same level in the encoding process through a long-skip connection to get an average merge (Merge). In U-net, this process is completed by concatenation. At the same time, skip connections are also used in each residual block, which has the advantage of overcoming the gradient disappearance problem of the network during training.

Figure 5.
Architecture of the Despeckling GAN. (a) Generator (top). (b) Discriminator (bottom). (c) The detail of the Res. (The purple, green, and orange blocks in the dotted box correspond to the convolutional layer, the batch normalization layer, and the ReLU or Leaky ReLU layer, respectively). The numbers in brackets refer to the number of filters, filter size, and stride, respectively. The numbers above or below the encoder blocks and images indicate the input and output size of each module. Acronyms in the encoding and decoding modules are as follows: Res: Residual block with three convolutional layers and one skip connection, P: Maxpooling, DC: Deconvolution, C: Convolution, N: Batch Normalization, LR: Leaky ReLU, S: Sigmoid, Merge: Sum to average.
Discriminator : As shown in Figure 5b, PatchGAN, which is commonly used in GAN, was used as the discriminator. The process of heterogeneous image transformation includes the transformation of the content part and feature detail part. The content part refers to the similarity in content between the generated image and the original image, and the feature detail part refers to the similarity in features between the generated image and the target image. With PatchGAN, feature details can be maintained [11].
The loss function of the Despeckling GAN generator includes CGAN loss, loss, and feature-preserving loss. Based on the premise of the existing paired training data, this paper used the CGAN loss function to improve the performance of the generator. Through supervised training, the generator learns the mapping from to , and this makes the discriminator judge true. The network structure of the discriminator has the function of distinguishing fake images from real images. Therefore, the CGAN loss from to is:
In the reconstruction loss design, the loss is used to minimize the difference between the optical gray image and the generated image.
In the best state , the output of the network should be similar to the optical gray image . In order to preserve the feature details of SAR images, this paper proposed a gradient-guided feature-preserving loss [28]. If denotes the operation to calculate the image gradient map, the loss of feature-preserving is:
For images , is as follows:
Specifically, the operation can be easily implemented by convolution with a fixed convolution kernel.
Therefore, the total training loss of the Despeckling GAN is:
where and are weighted values.
3.2. Colorization GAN
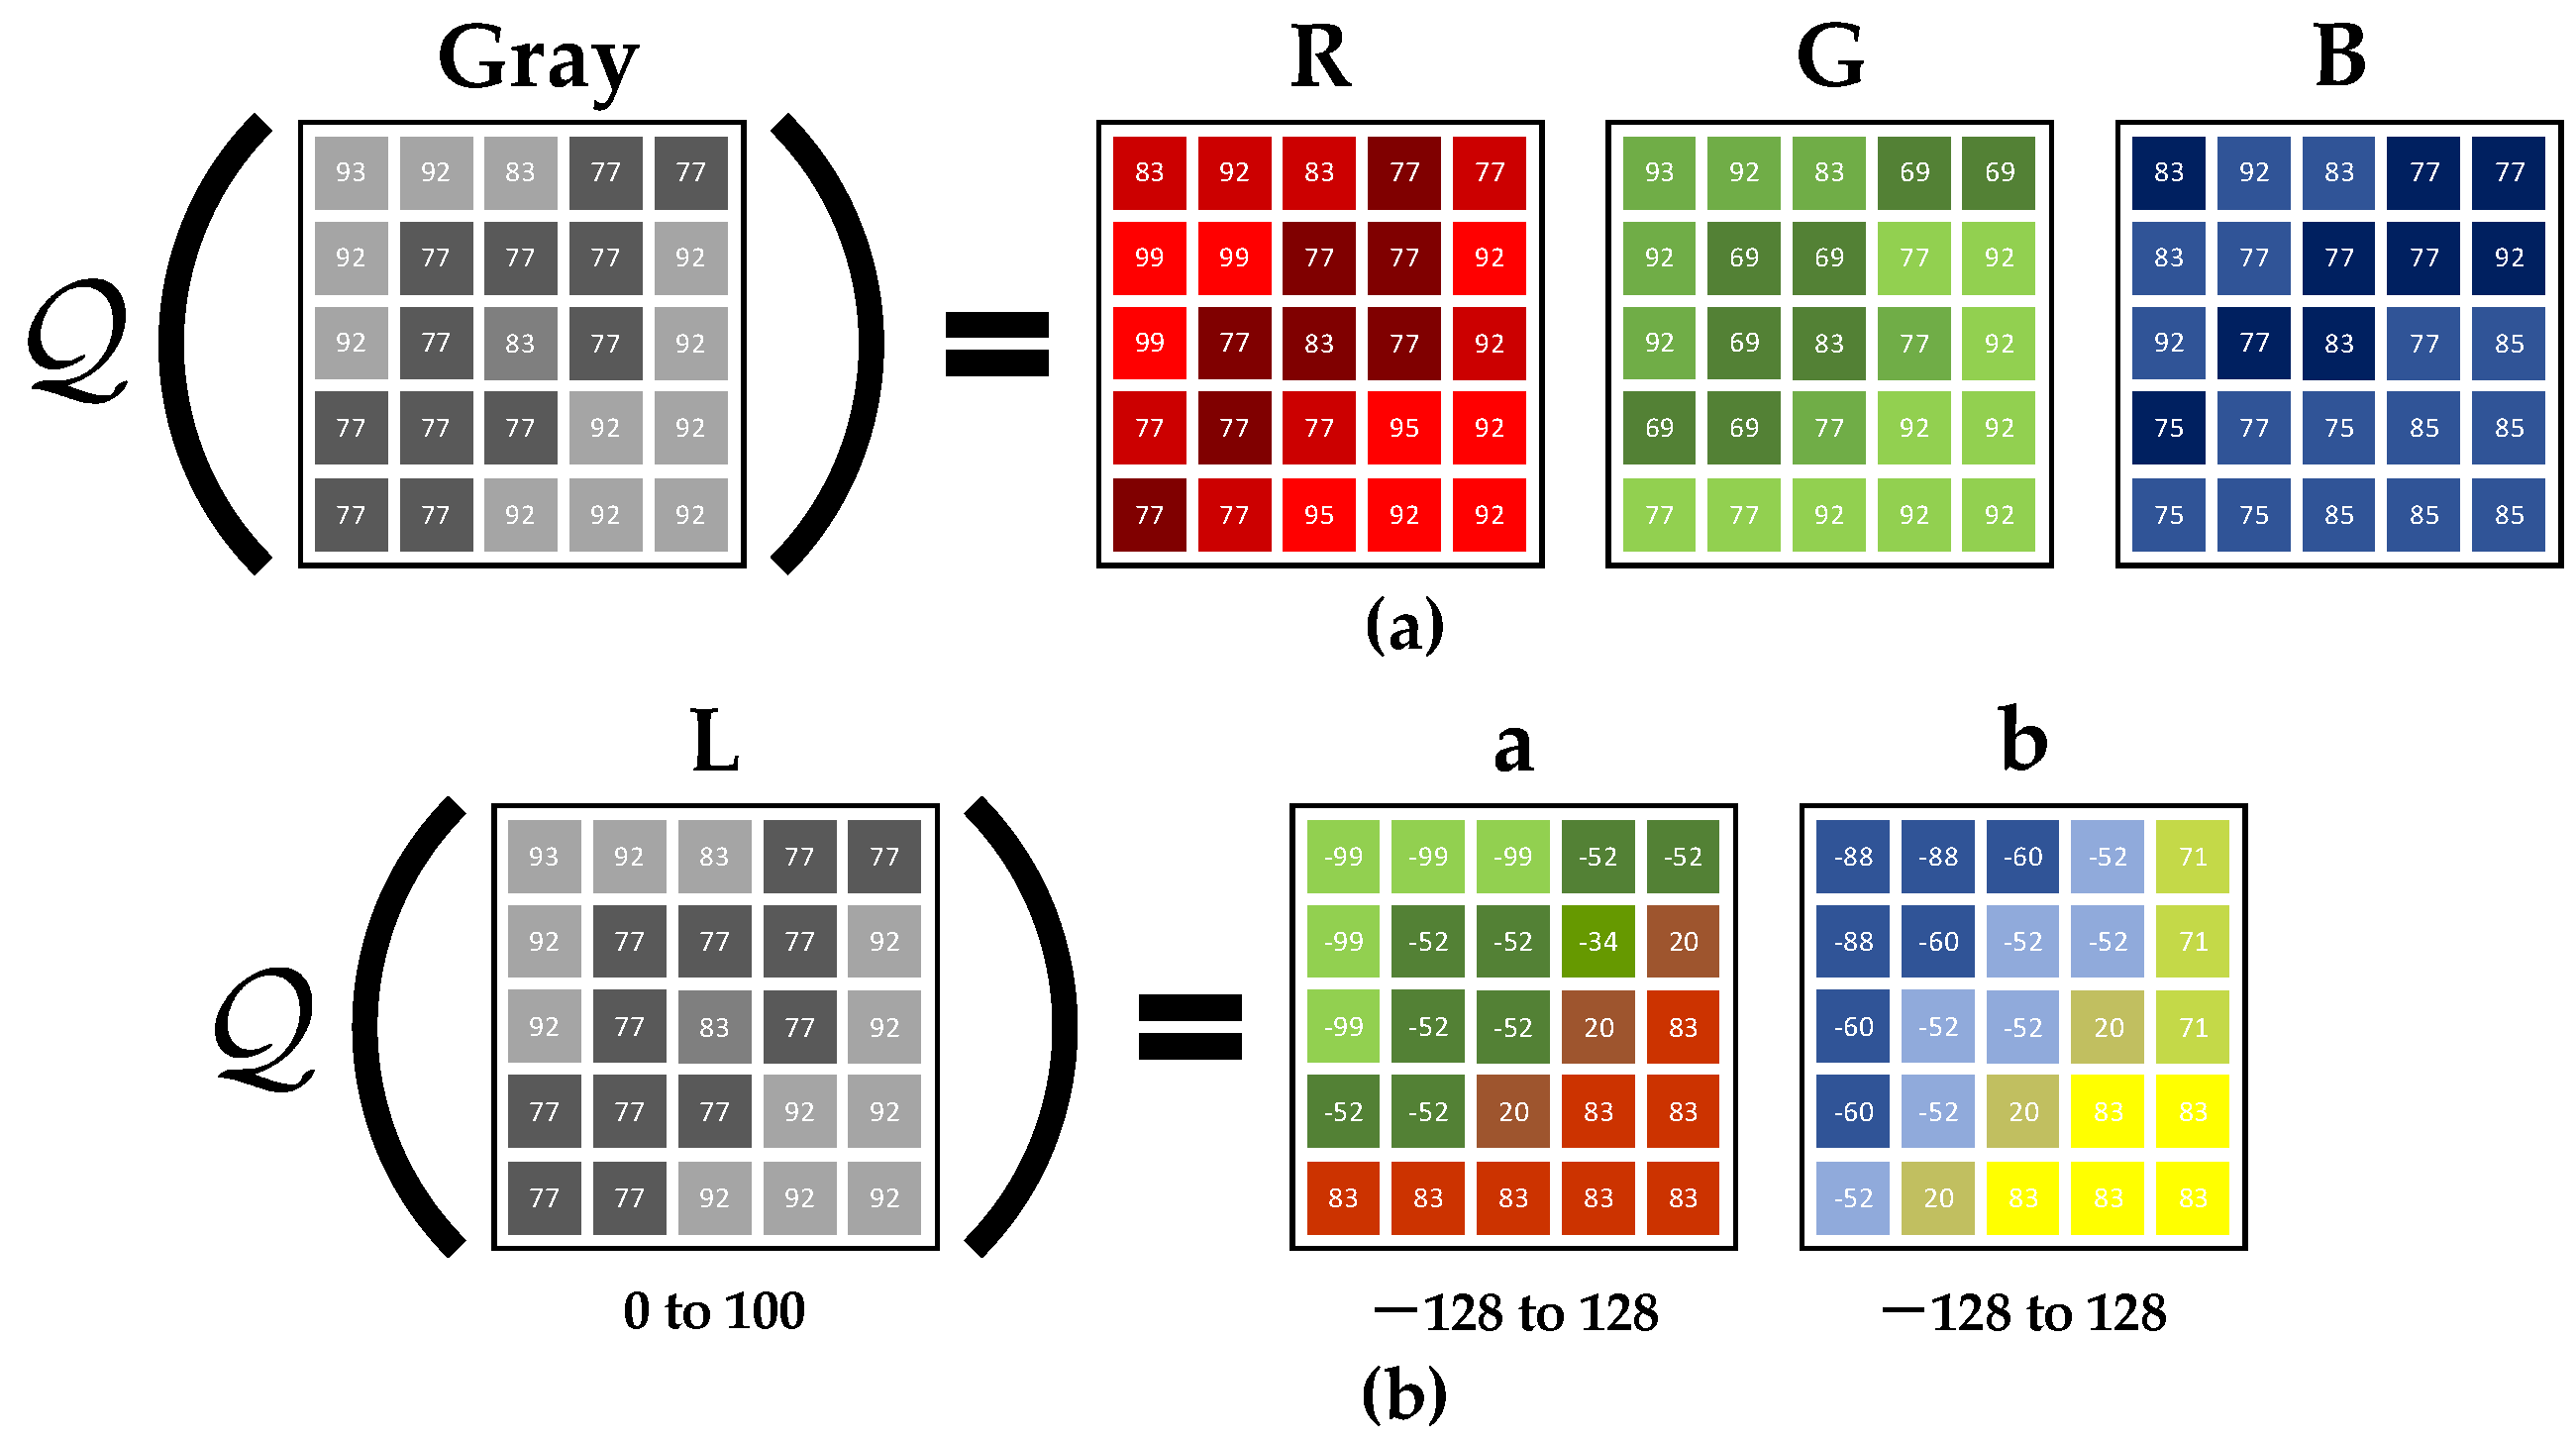
Colorization GAN completed the transformation from optical gray images to optical color images. Its principle comes from [29], which proved that, compared with Figure 6a, the colorization result of Figure 6b was better, so the latter was adopted in this paper. When a single channel gray image is input, the model learns the mapping from the input gray channel to the corresponding space color channels , where, and represent the height and width respectively. Then, the RGB image is obtained by synthesizing and . The advantage of this method is that it can reduce the ill-posed problem, such that the colorization result is closer to the real image.

Figure 6.
The principle of image colorization. (a) The direct mapping from the gray space to the RGB color space; (b) the hue Lab mapped from the gray space to the Lab color space.
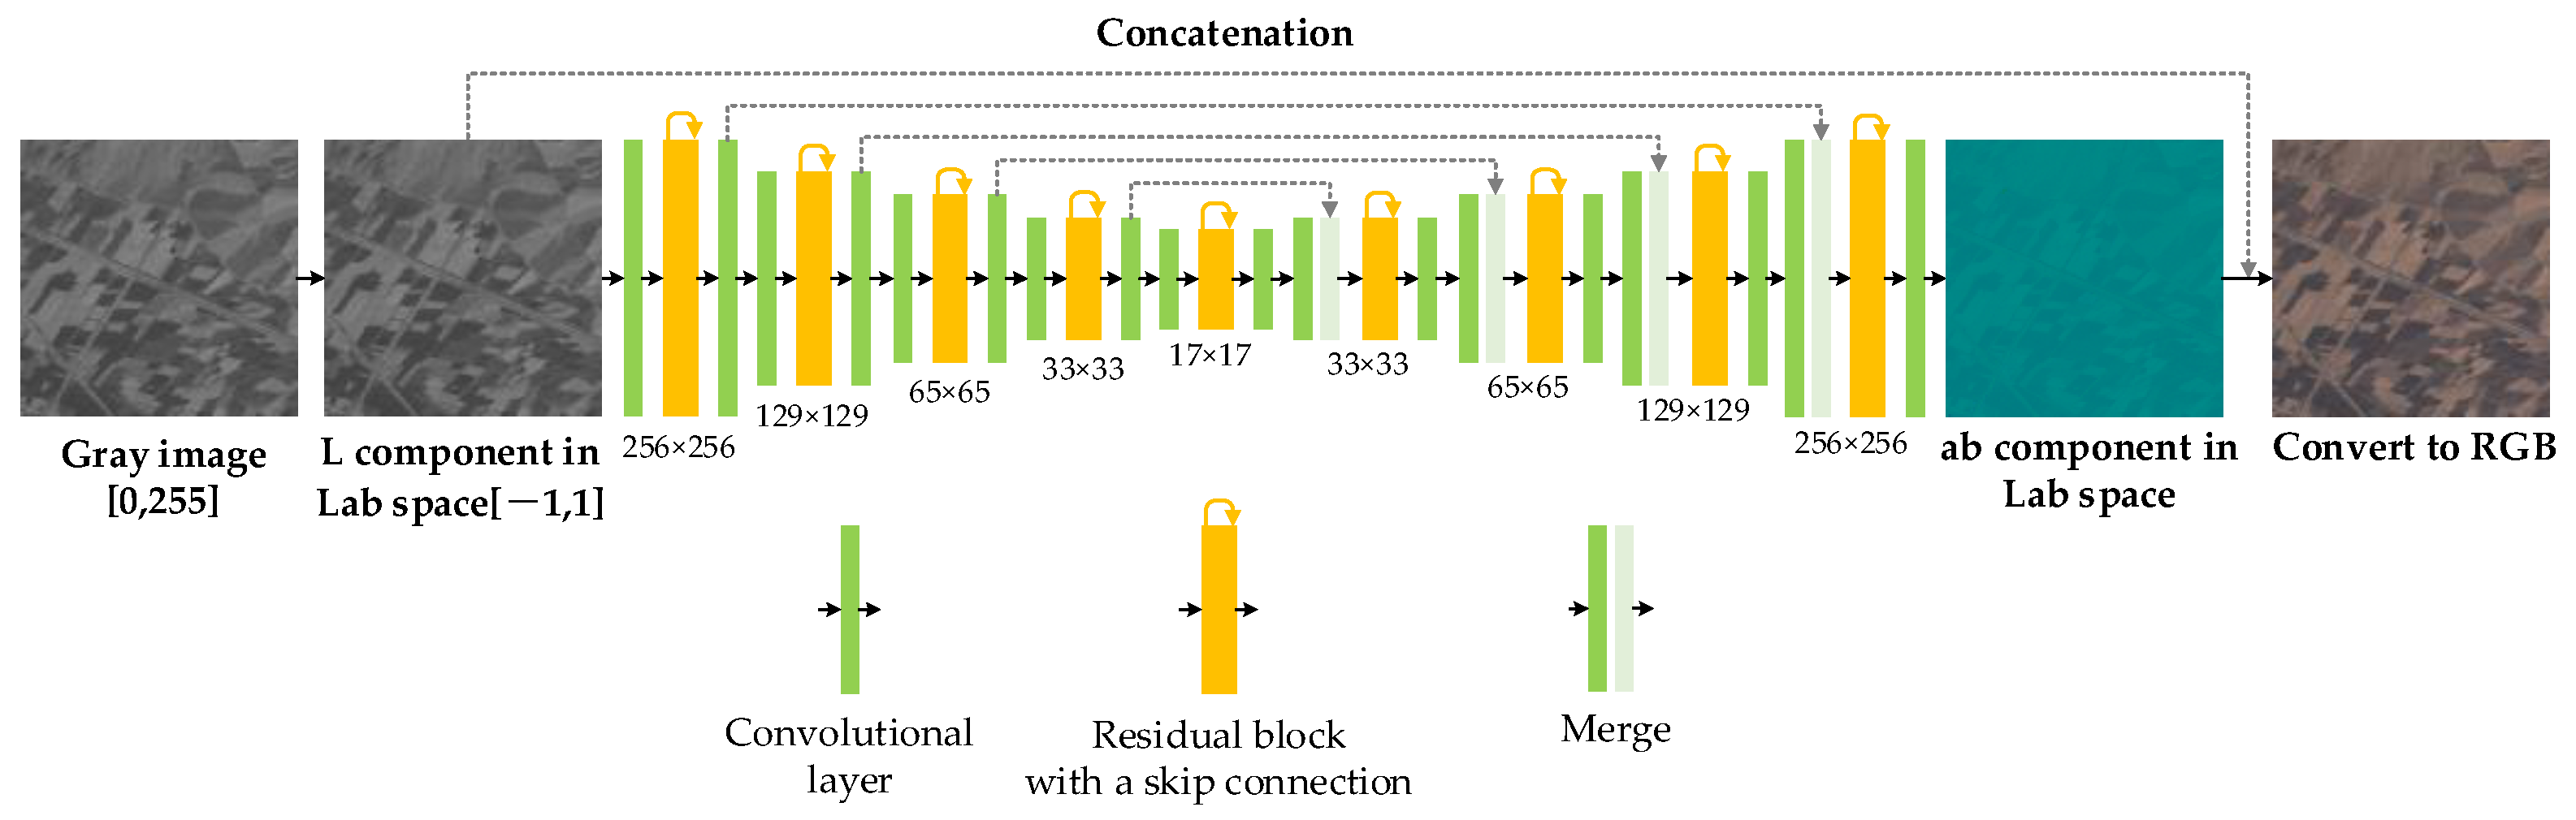
As shown in Figure 7, the generator of the Colorization GAN uses a convolutional self-coding structure, which establishes short-skip connections within different levels and long connections between the same levels of encoding and decoding. This kind of structure design enables different levels of image information to flow in the network so that the hue information of the generated image is more real and full. The discriminator of the Colorization GAN is PatchGAN [11]. Recent studies have shown that adversarial loss helps to make colorization more vivid [29,30,31], and this paper also followed this idea. During training, we input the reference optical color image and the generated image one by one into the discriminator; the discriminator output was 0 (fake) or 1 (real). According to the previous methods, the loss of the discriminator is the sigmoid cross-entropy.
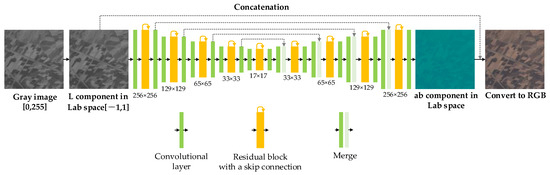
Figure 7.
The network structure of the Colorization GAN generator. The gray image of the input model is first transformed into the L channel in the Lab color space and then trained to map to the AB channels through the network. The obtained hue is spliced with the gray image to get the Lab color image. Finally, the Lab image is transformed into an RGB image. The green block represents the convolutional layer, the yellow block represents the residual block, and the green and light-green blocks represent the average by merge.
Among them, the adversarial loss is expressed as follows:
In order to make the generated color distribution closer to the color distribution of the reference image, we defined the loss in the space, which is expressed as follows:
Therefore, the total loss function of the Colorization GAN model is as follows:
where is a weighted value.
4. Experiments and Results
As the SEN1-2 dataset covers the whole world and contains 282,384 pairs of SAR and optical color images across four seasons, some of which are overlapped, in order to facilitate the training, the original dataset was randomly sampled according to the stratified sampling method. The dataset was divided into the training dataset, validation dataset, and test dataset, and their respective proportions were about 6:2:2. The experiment of the proposed method was carried out on the computing platform of two 11G GPU GeForce RTX 2080Ti and i9900k CPUs using PyTorch. The input size of the images was 256 × 256, and the batch size was set to 10. In the experimental simulation, 200 epochs were set in the GAN training and optimized by the Adam optimizer. The sum of parameters was set to 0.5 and 0.999, respectively. The initial learning rate of the experiment was set to 0.0002. The first 100 epochs remained unchanged and then decreased to 0 according to the linear decreasing strategy.
Considering that season and landscape will affect the training results of the model, we selected image pairs of different seasons and landscapes and followed the principle of equilibrium [32]. As shown in Table 1, the number of SAR and optical image pairs in four seasons is approximately the same, and the number of image pairs of different landscapes in each season is also approximately the same.

Table 1.
Number of different types of images selected in our dataset.
4.1. Experiment 1
In order to verify the effectiveness of the proposed method, four groups of experiments were designed using the same dataset and different conditions. The four groups of experiments were carried out according to the single variable principle. In Group 1, the unimproved generators and were used, and the loss function included loss and reconstruction loss. In Group 2, the improved generators and were used, and the loss function included loss and reconstruction loss. In Group 3, the unimproved generators and were used, and the loss function included loss, reconstruction loss, and feature-preserving loss. In Group 4, the improved generators and were used, and the loss function included reconstruction loss, reconstruction loss, and feature-preserving loss. The relationship between the four groups of experiments is shown in Table 2.
Table 2.
Grouping experiments under different conditions.
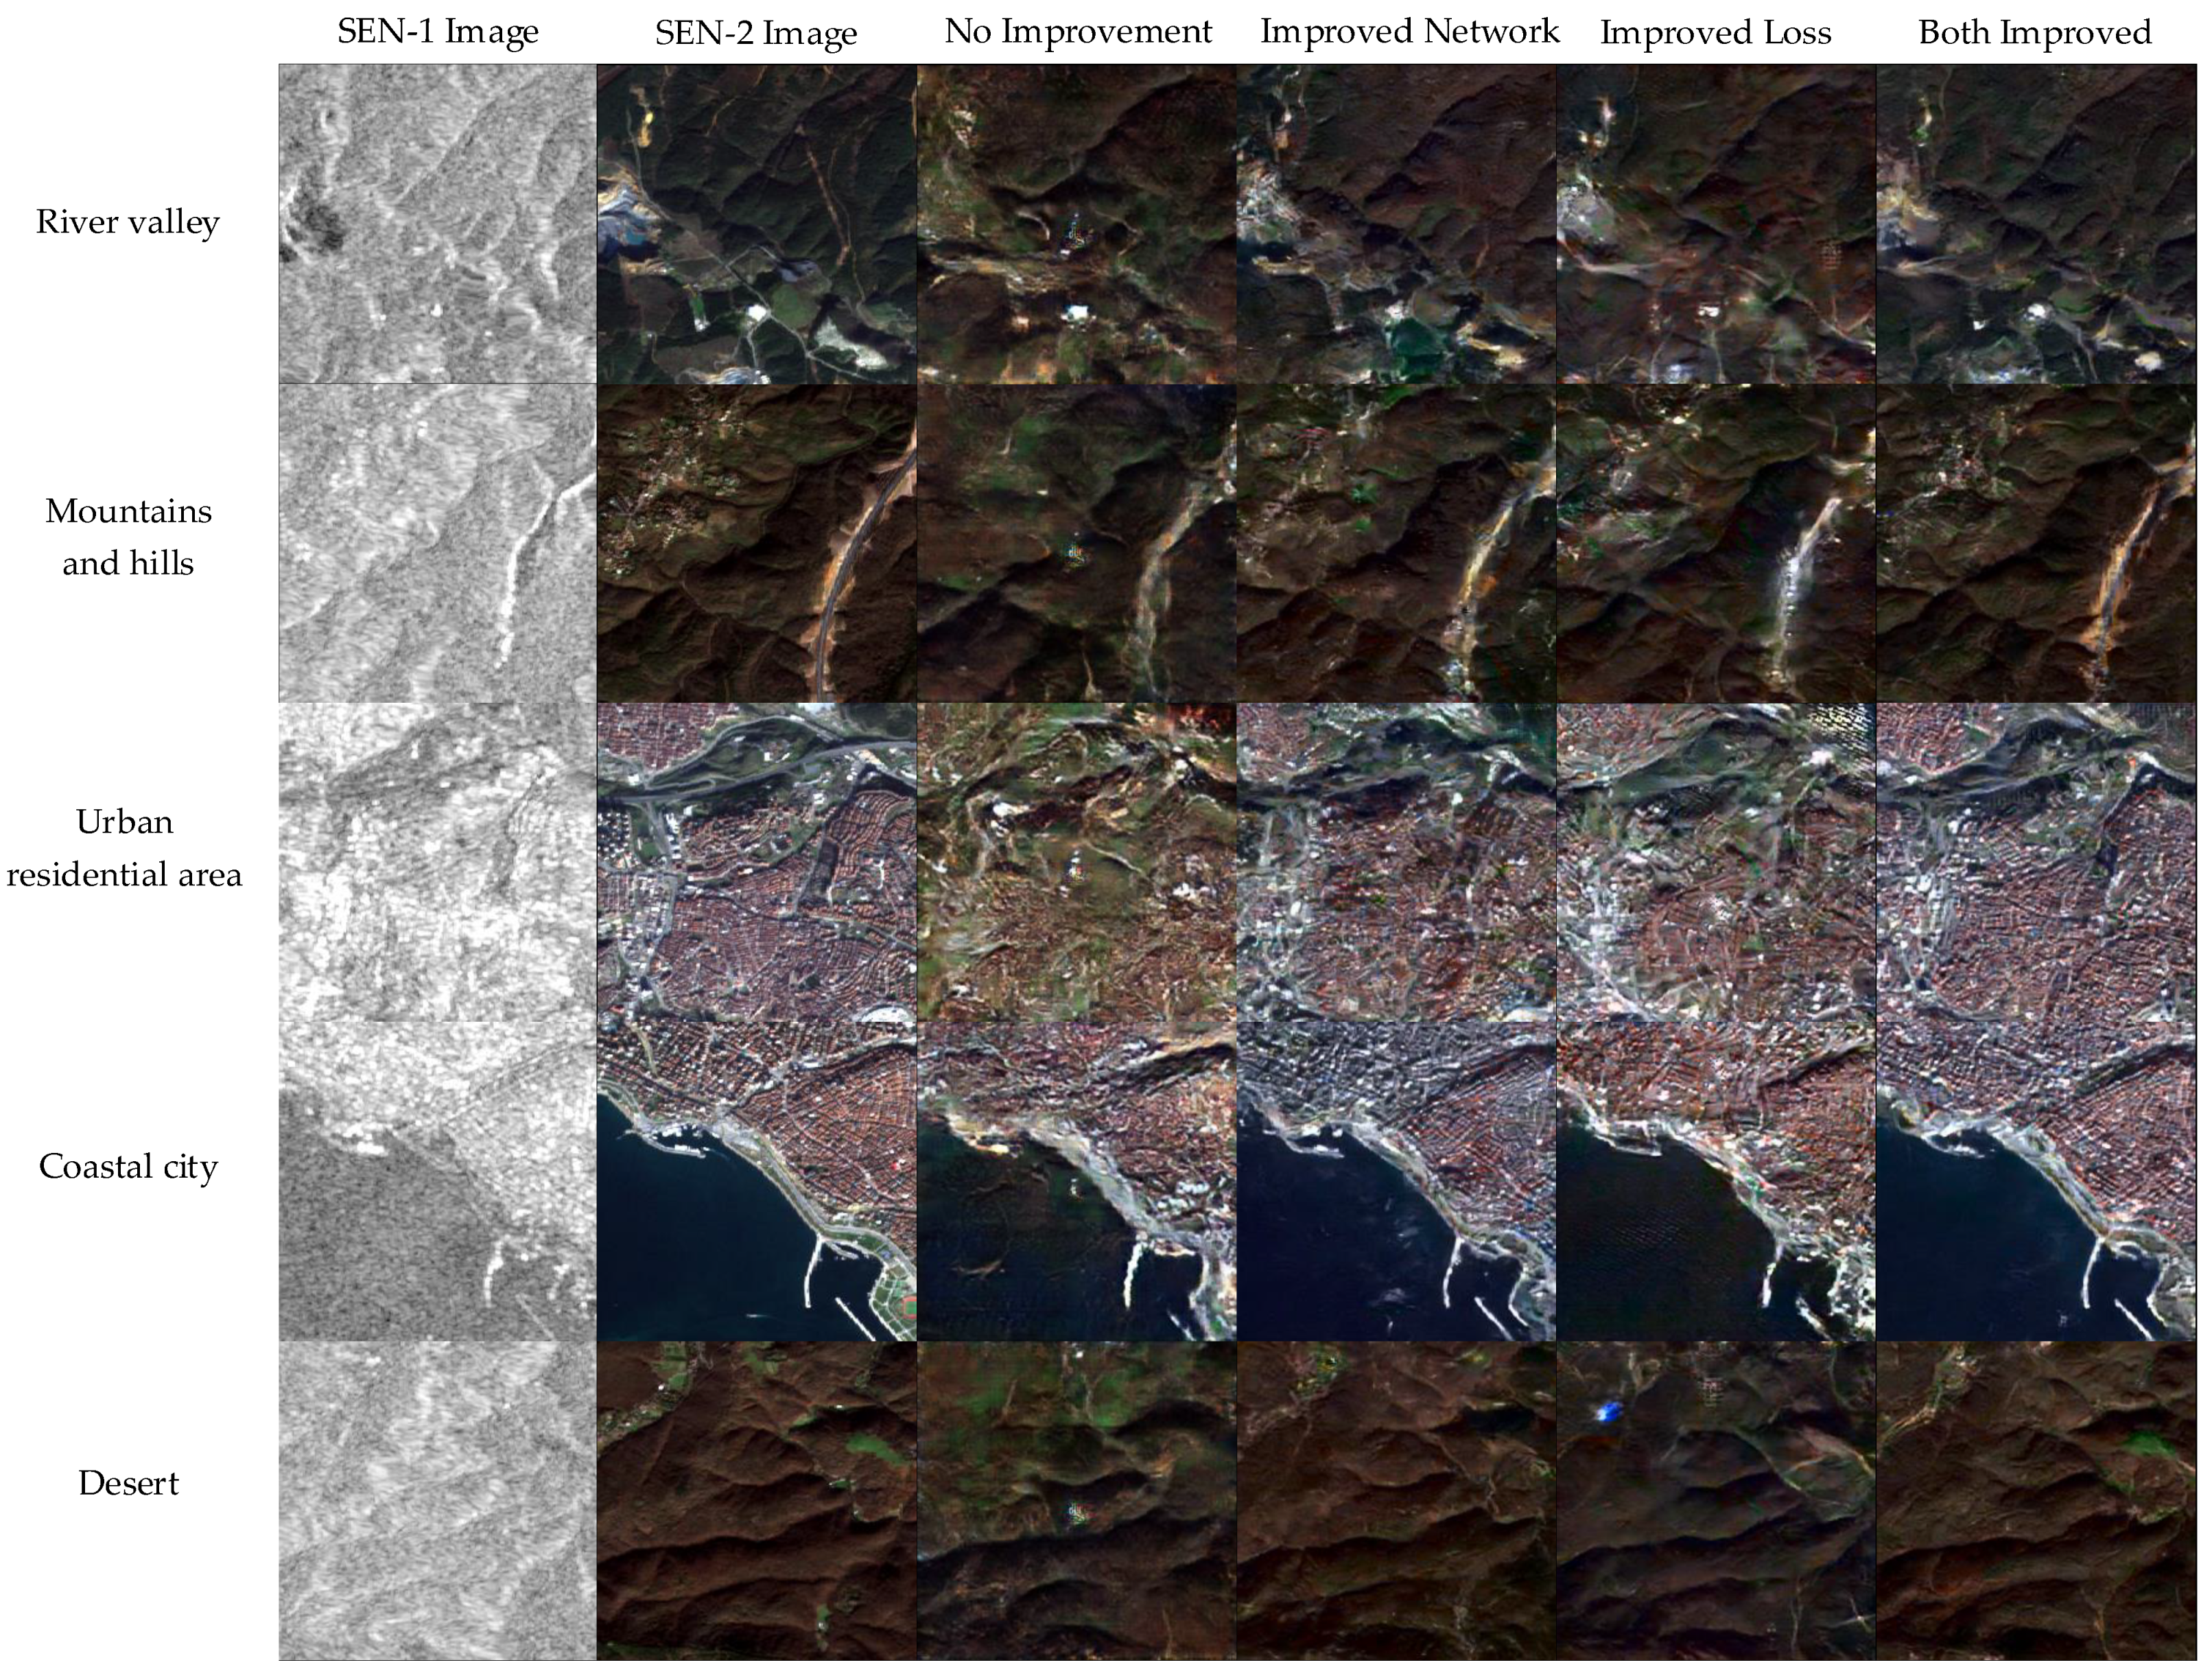
As shown in Figure 8, the first column shows the SAR images collected by the SEN-1 satellite. The second column shows the SAR images collected by the SEN-2 satellite. The third, fourth, fifth, and sixth columns show the experimental results of Group 1, Group 2, Group 3, and Group 4, respectively. Through visual comparative analysis, it can be seen that improving the network structure and loss function can improve the quality of SAR-to-optical transformation, especially by enhancing the feature detail information of the generated image. It can map the SAR image to the optical color image to the maximum extent and help the interpretation of the SAR image.
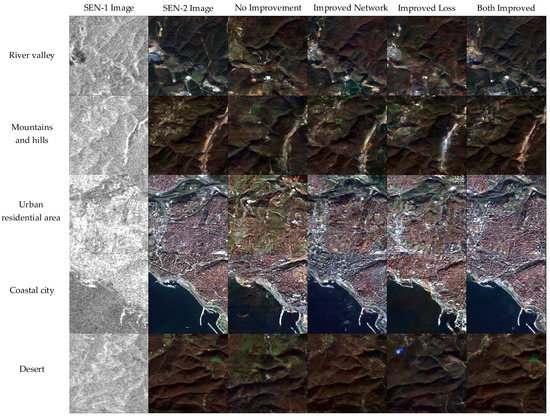
Figure 8.
Results produced under different conditions. From top to bottom, the images are remote sensing images of five kinds of landscape: river valley, mountains and hills, urban residential area, seashore, and desert. From left to right: SEN-1 images, SEN-2 images, images generated by Group 1, images generated by Group 2, images generated by Group 3, images generated by Group 4.
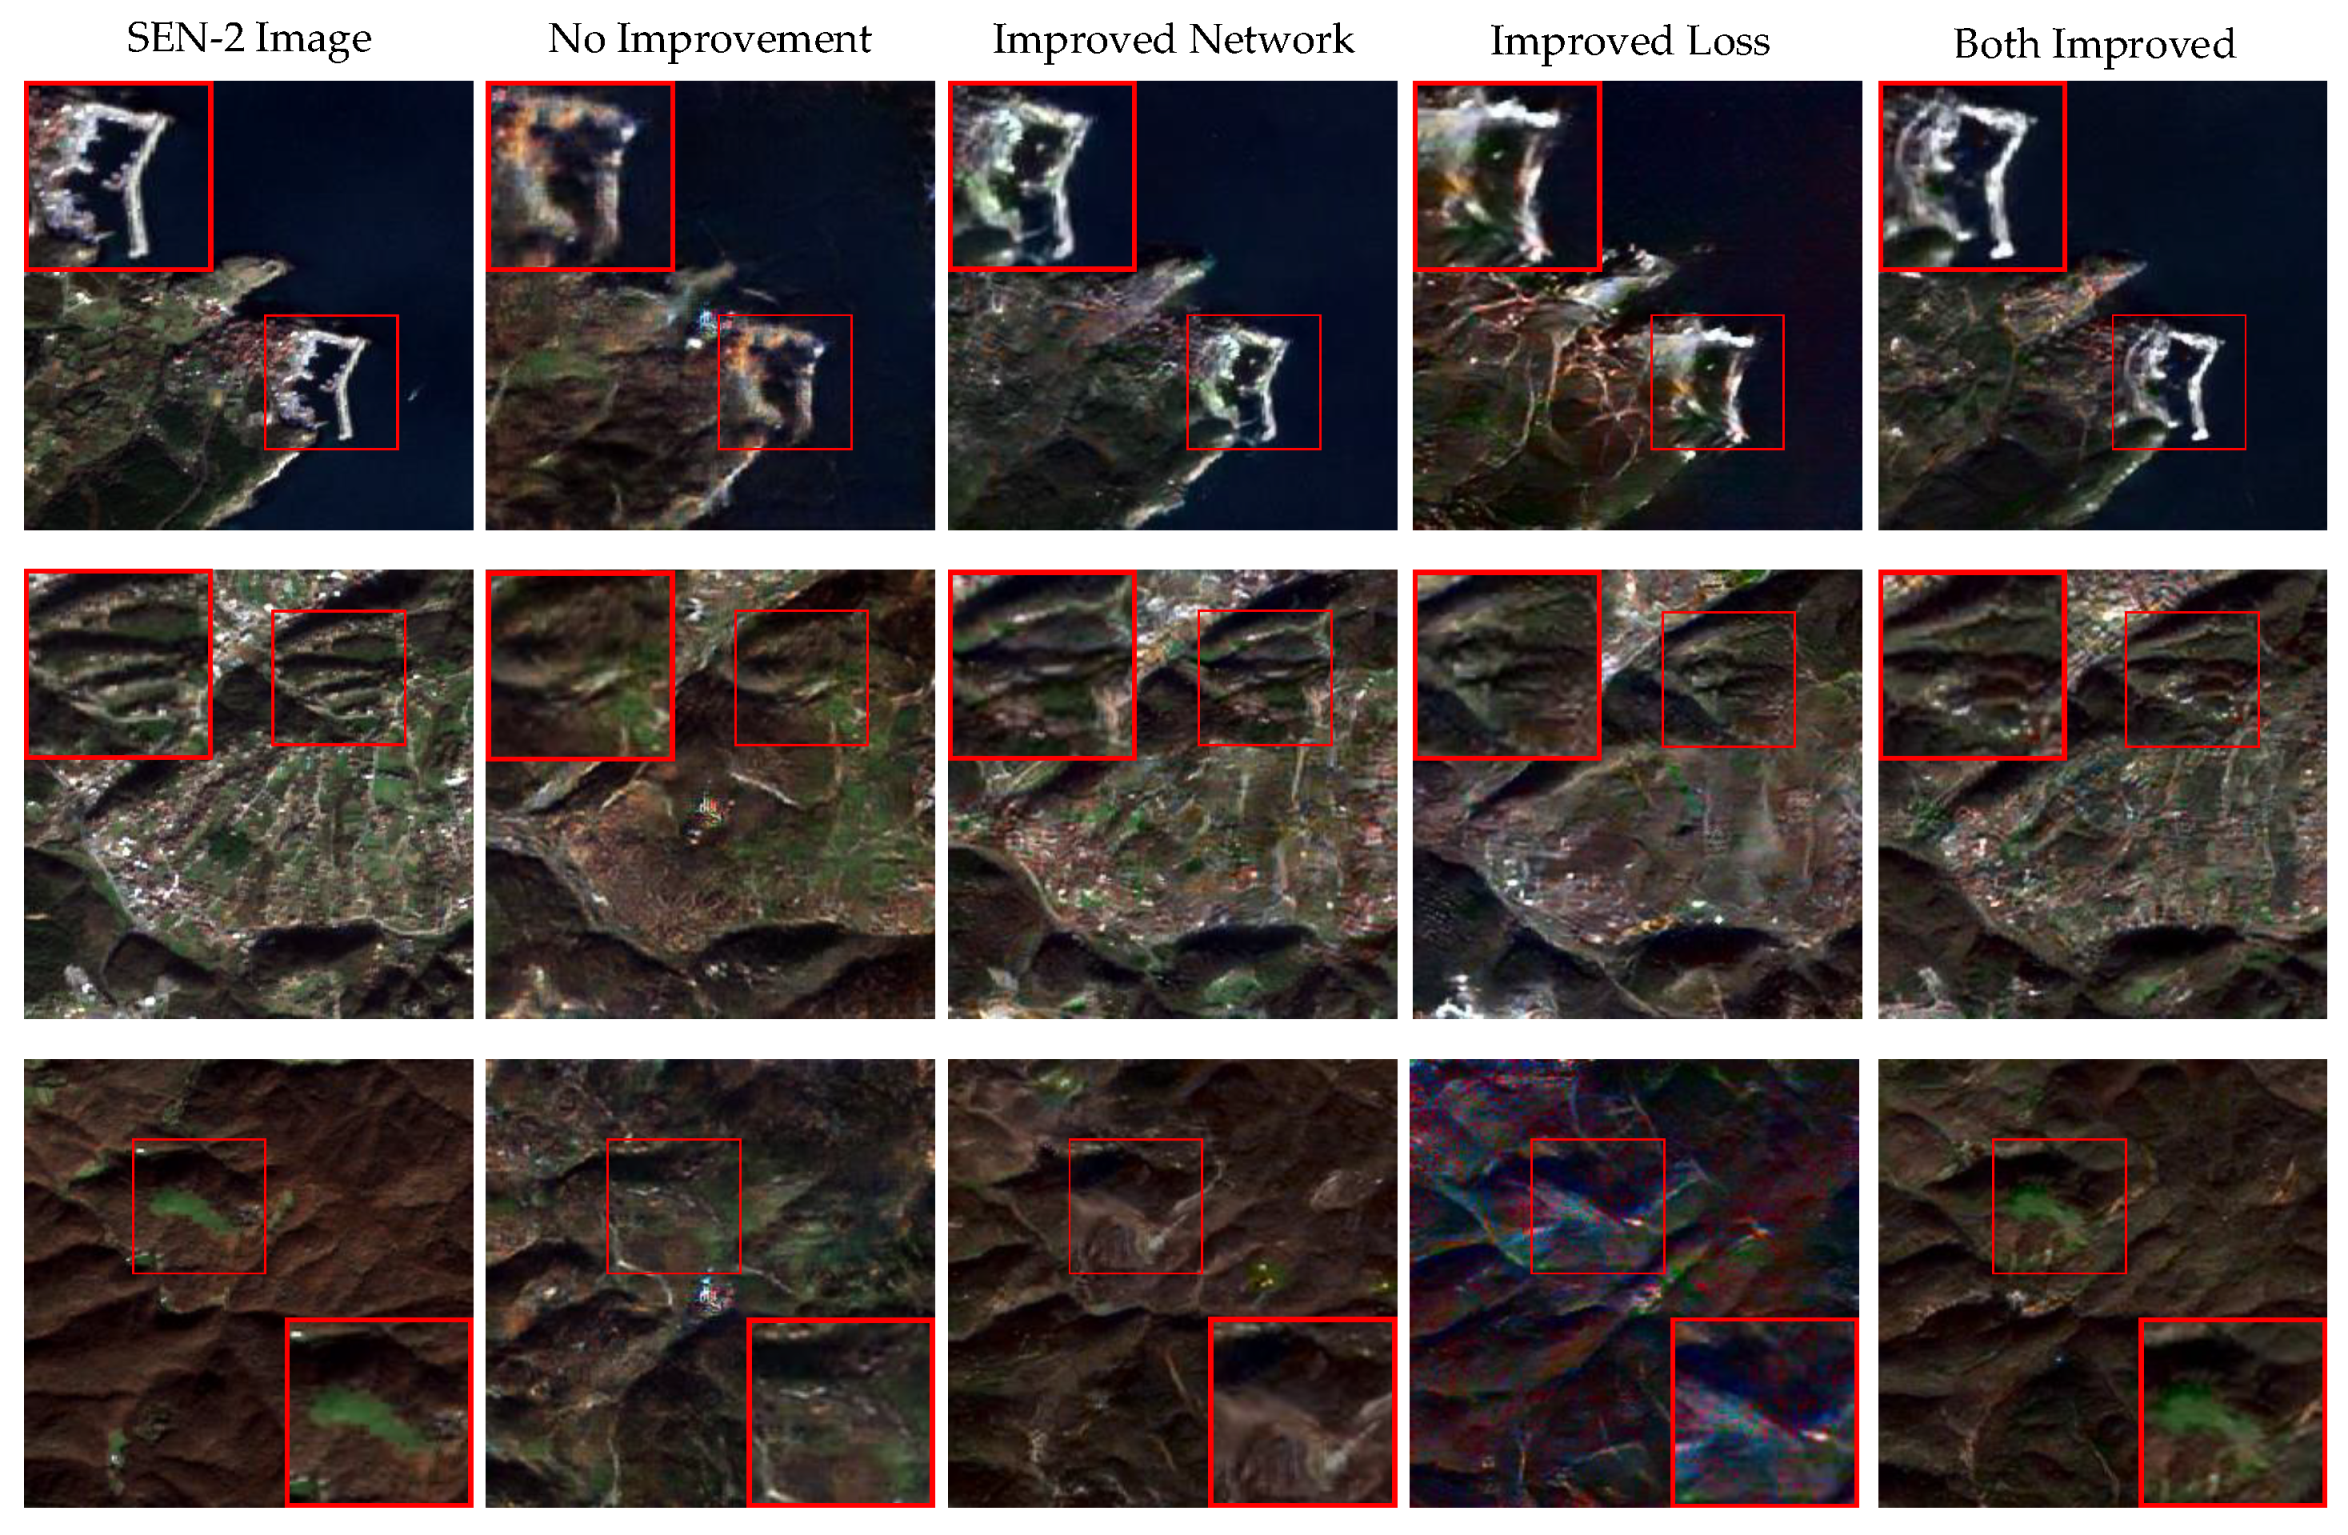
In order to compare the detailed information of the generated images, Figure 9 shows the detailed comparison between the SEN-2 images and the four groups of experimental results. According to the subjective evaluation criteria, the results of improving the model and loss function at the same time are closer to the SEN-2 images. Only improving the loss function can improve the details of the generated images, but its effect is inferior to that of improving the model. The detailed comparison of the four groups of experimental results once again proves that the improvement measures proposed in this paper are effective. By comparing the two situations of improving model and improving loss function, it can be found that improving model contributes more to the results.
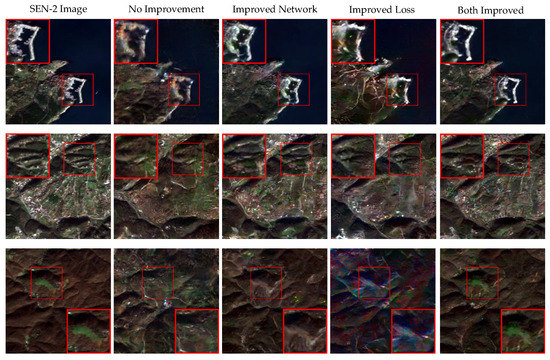
Figure 9.
Detailed comparison of Experiment 1. We selected the generated results in three scenarios for detailed comparison with the SEN-2 reference image. The improvement measures proposed in this paper had an obvious effect on improving the quality of the generated images. From left to right: SEN-2 images, images generated by Group 1, images generated by Group 2, images generated by Group 3, and images generated by Group 4.
In order to quantify the effectiveness of the method, the final transformation effect (IQA) was measured by calculating the structural similarity (SSIM) [33,34], and the feature similarity (FSIM) [35]. Both indexes were calculated between the generated image and the corresponding SEN-2 image . Assuming that the generated image is , and the corresponding SEN-2 image is , the SSIM calculation formula is as follows:
Among them:
, , and in the equation represent the brightness comparison, contrast comparison, and structural comparison, respectively. and represent the mean of and , and represent the standard deviation of and , represents the covariance of and , and , and are constant constants (so that the parent of the equation is not zero). In actually, = = = 1, , SSIM is represented as:
Another index, the FSIM, is a feature similarity evaluation index, which uses phase consistency (phase consistency (PC)) and gradient features (gradient magnitude (GM)), as follows:
Which:
, , and represent the phase consistent (PC) similarity, gradient feature (GM) similarity, and PC-GM fusion similarity, respectively.
The similarity indicators of the four experimental schemes were calculated as Table 3. By comparing the results of the second, third, and first rows of the table, it can be seen that after improving the generator structure and loss function, both SSIM- and FSIM-generating images had been significantly improved, and the combined use of improved generators and loss functions obtained better results than improving the generator structure or loss functions alone.
Table 3.
The model generated result indicators under different improvement measures. The number in bold indicates the optimal value under the corresponding index.
4.2. Experiment 2
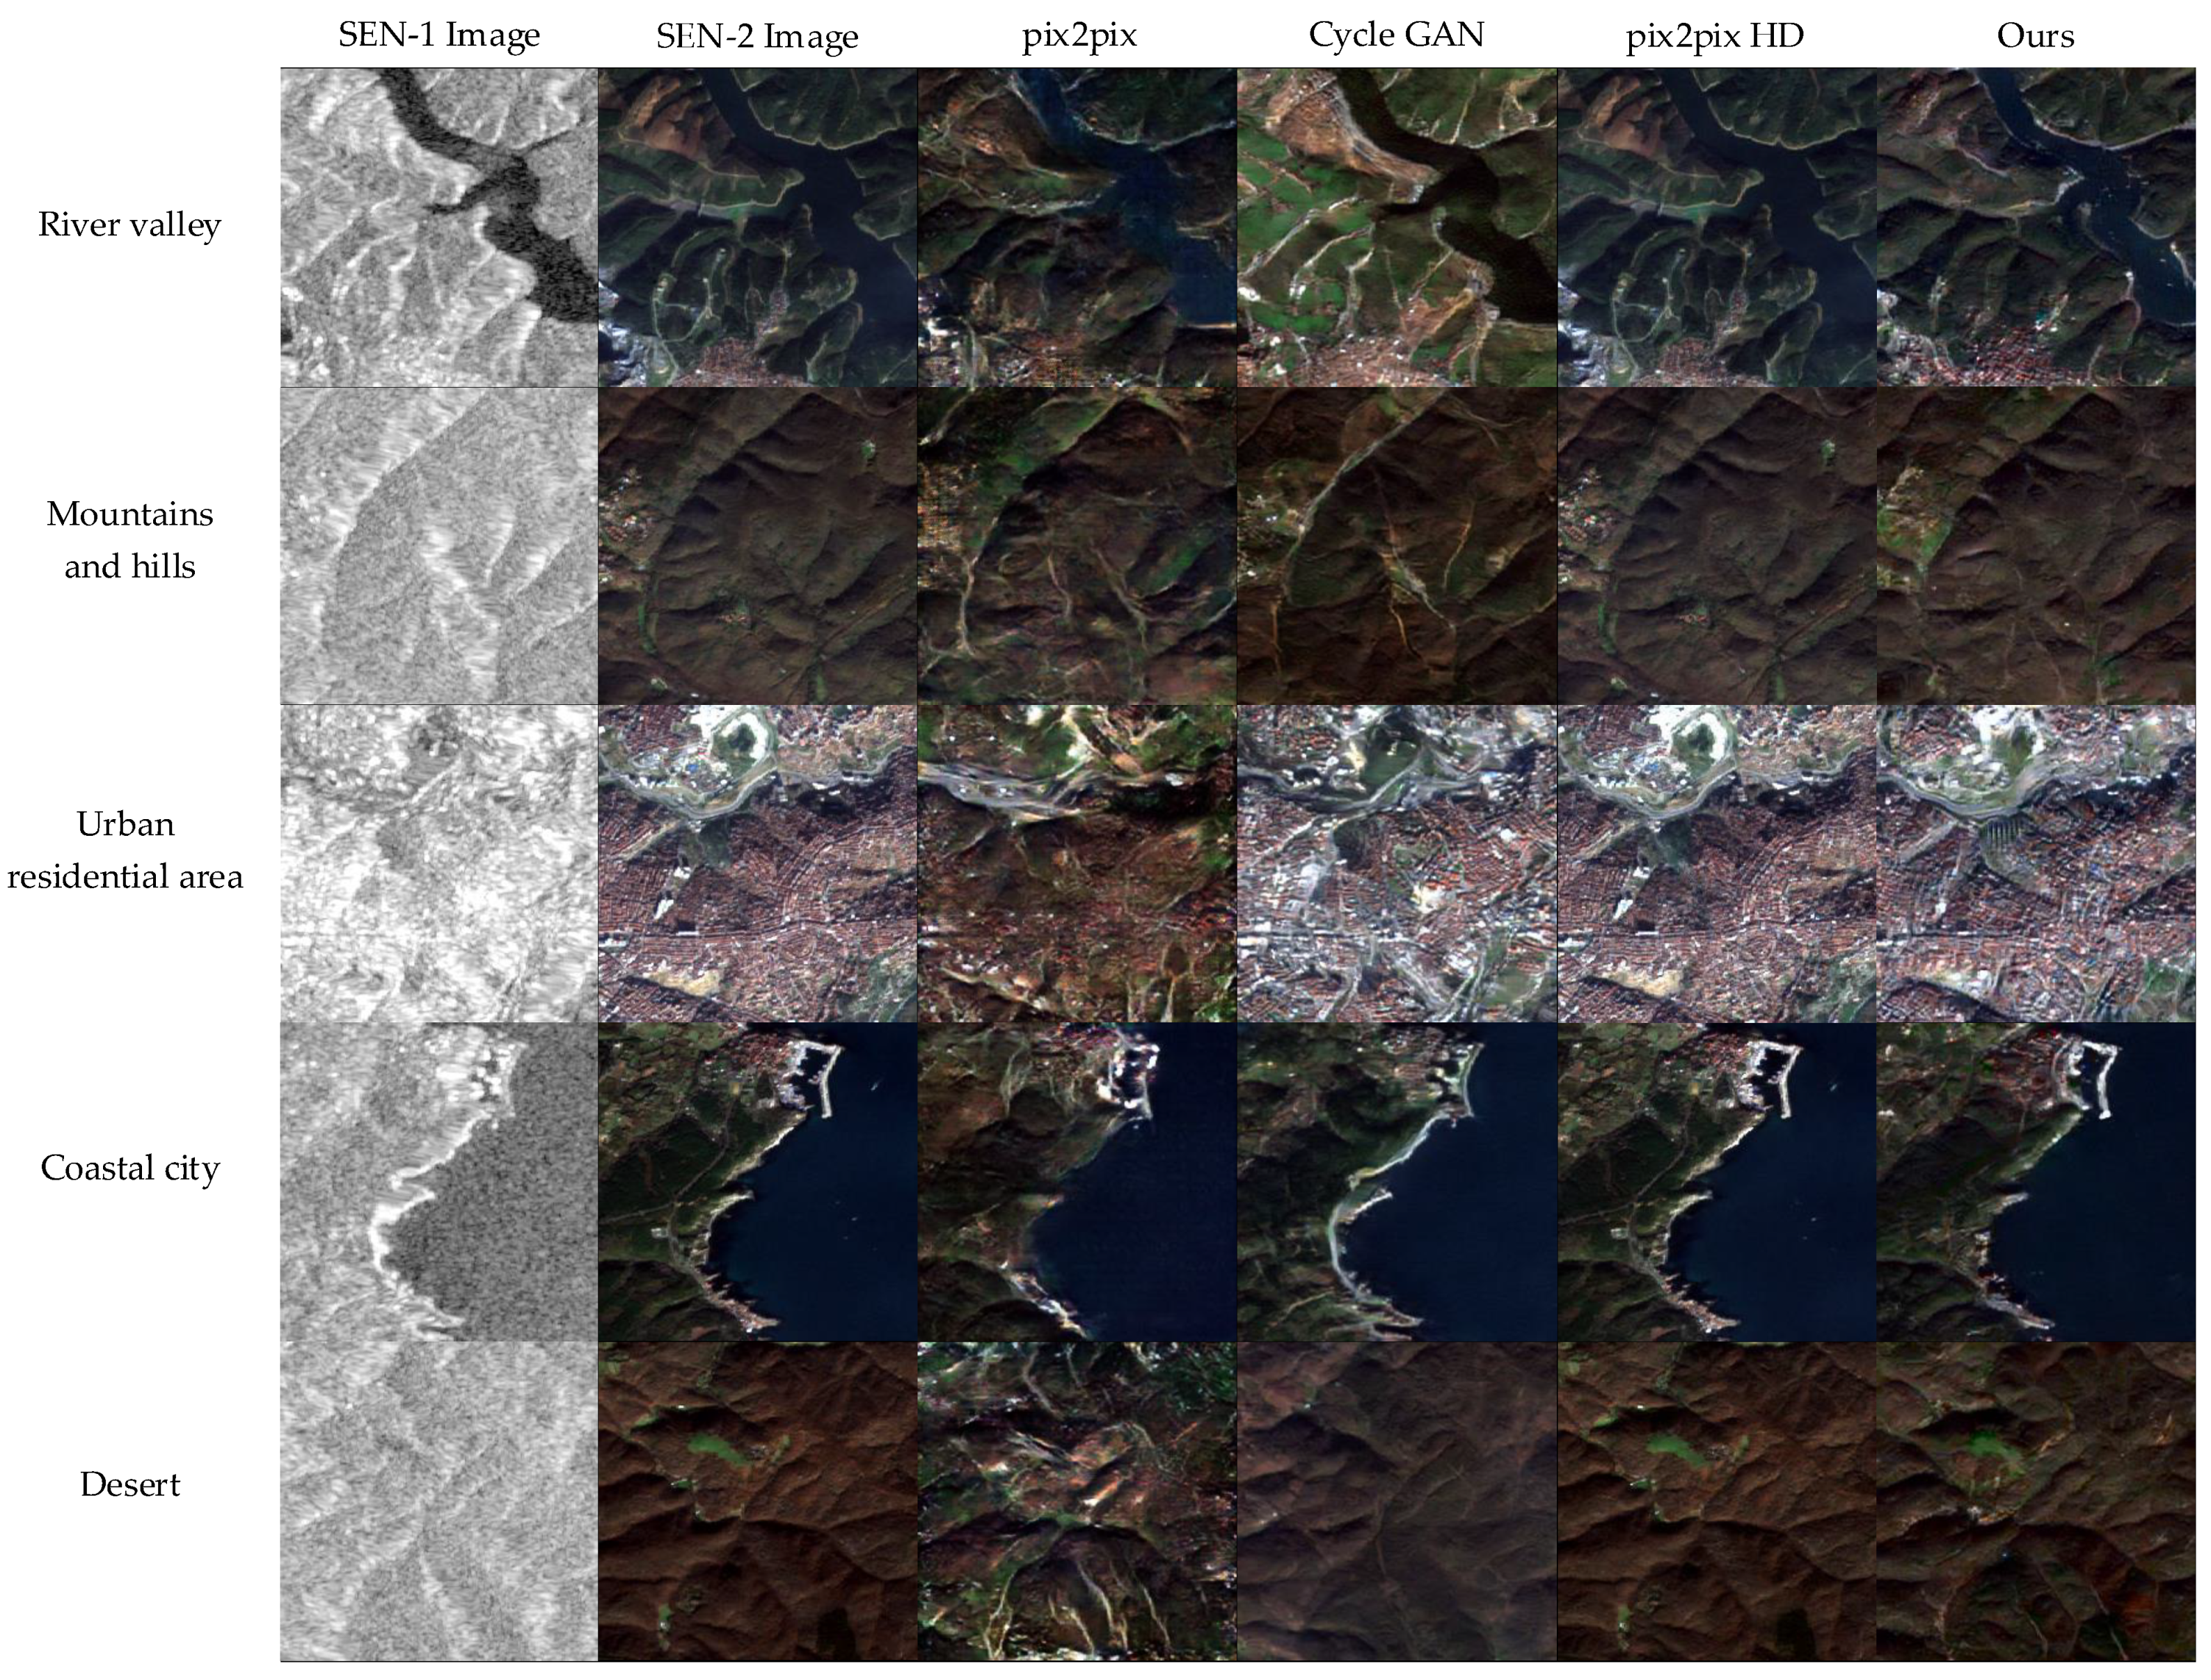
In order to verify the performance of the proposed method in preserving the SAR image features, the proposed algorithm was compared with pix2pix, CycleGAN, and pix2pixHD, respectively. During training, the Serial GANs train the generator and the discriminator first, and then the training generator and the discriminator , respectively, with 200 epochs. In Figure 10, the first column shows the SAR images collected by the SEN-1 satellite, the second column shows the optical color images collected by the SEN-2 satellite, and the third, fourth, and fifth columns show the experimental results of pix2pix, CycleGAN, and pix2pixHD, respectively. According to the results, the proposed method can significantly preserve the details of SAR images in the process of heterogeneous transformation, with results as good as pix2pixHD. What is more, the volume of parameters of the model proposed in this paper was significantly lower than in the pix2pixHD model.
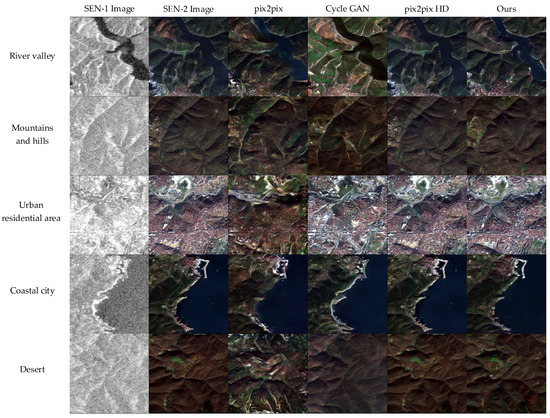
Figure 10.
Comparison of the results generated by four different heterogeneous transformation models. From the top to the bottom: the remote sensing images of the river valley, mountains and hills, urban residential area, coastal city and desert. From left to right: SEN-1 images, SEN-2 images, images generated by pix2pix, images generated by CycleGAN, images generated by pix2pixHD, and the images generated by our model.
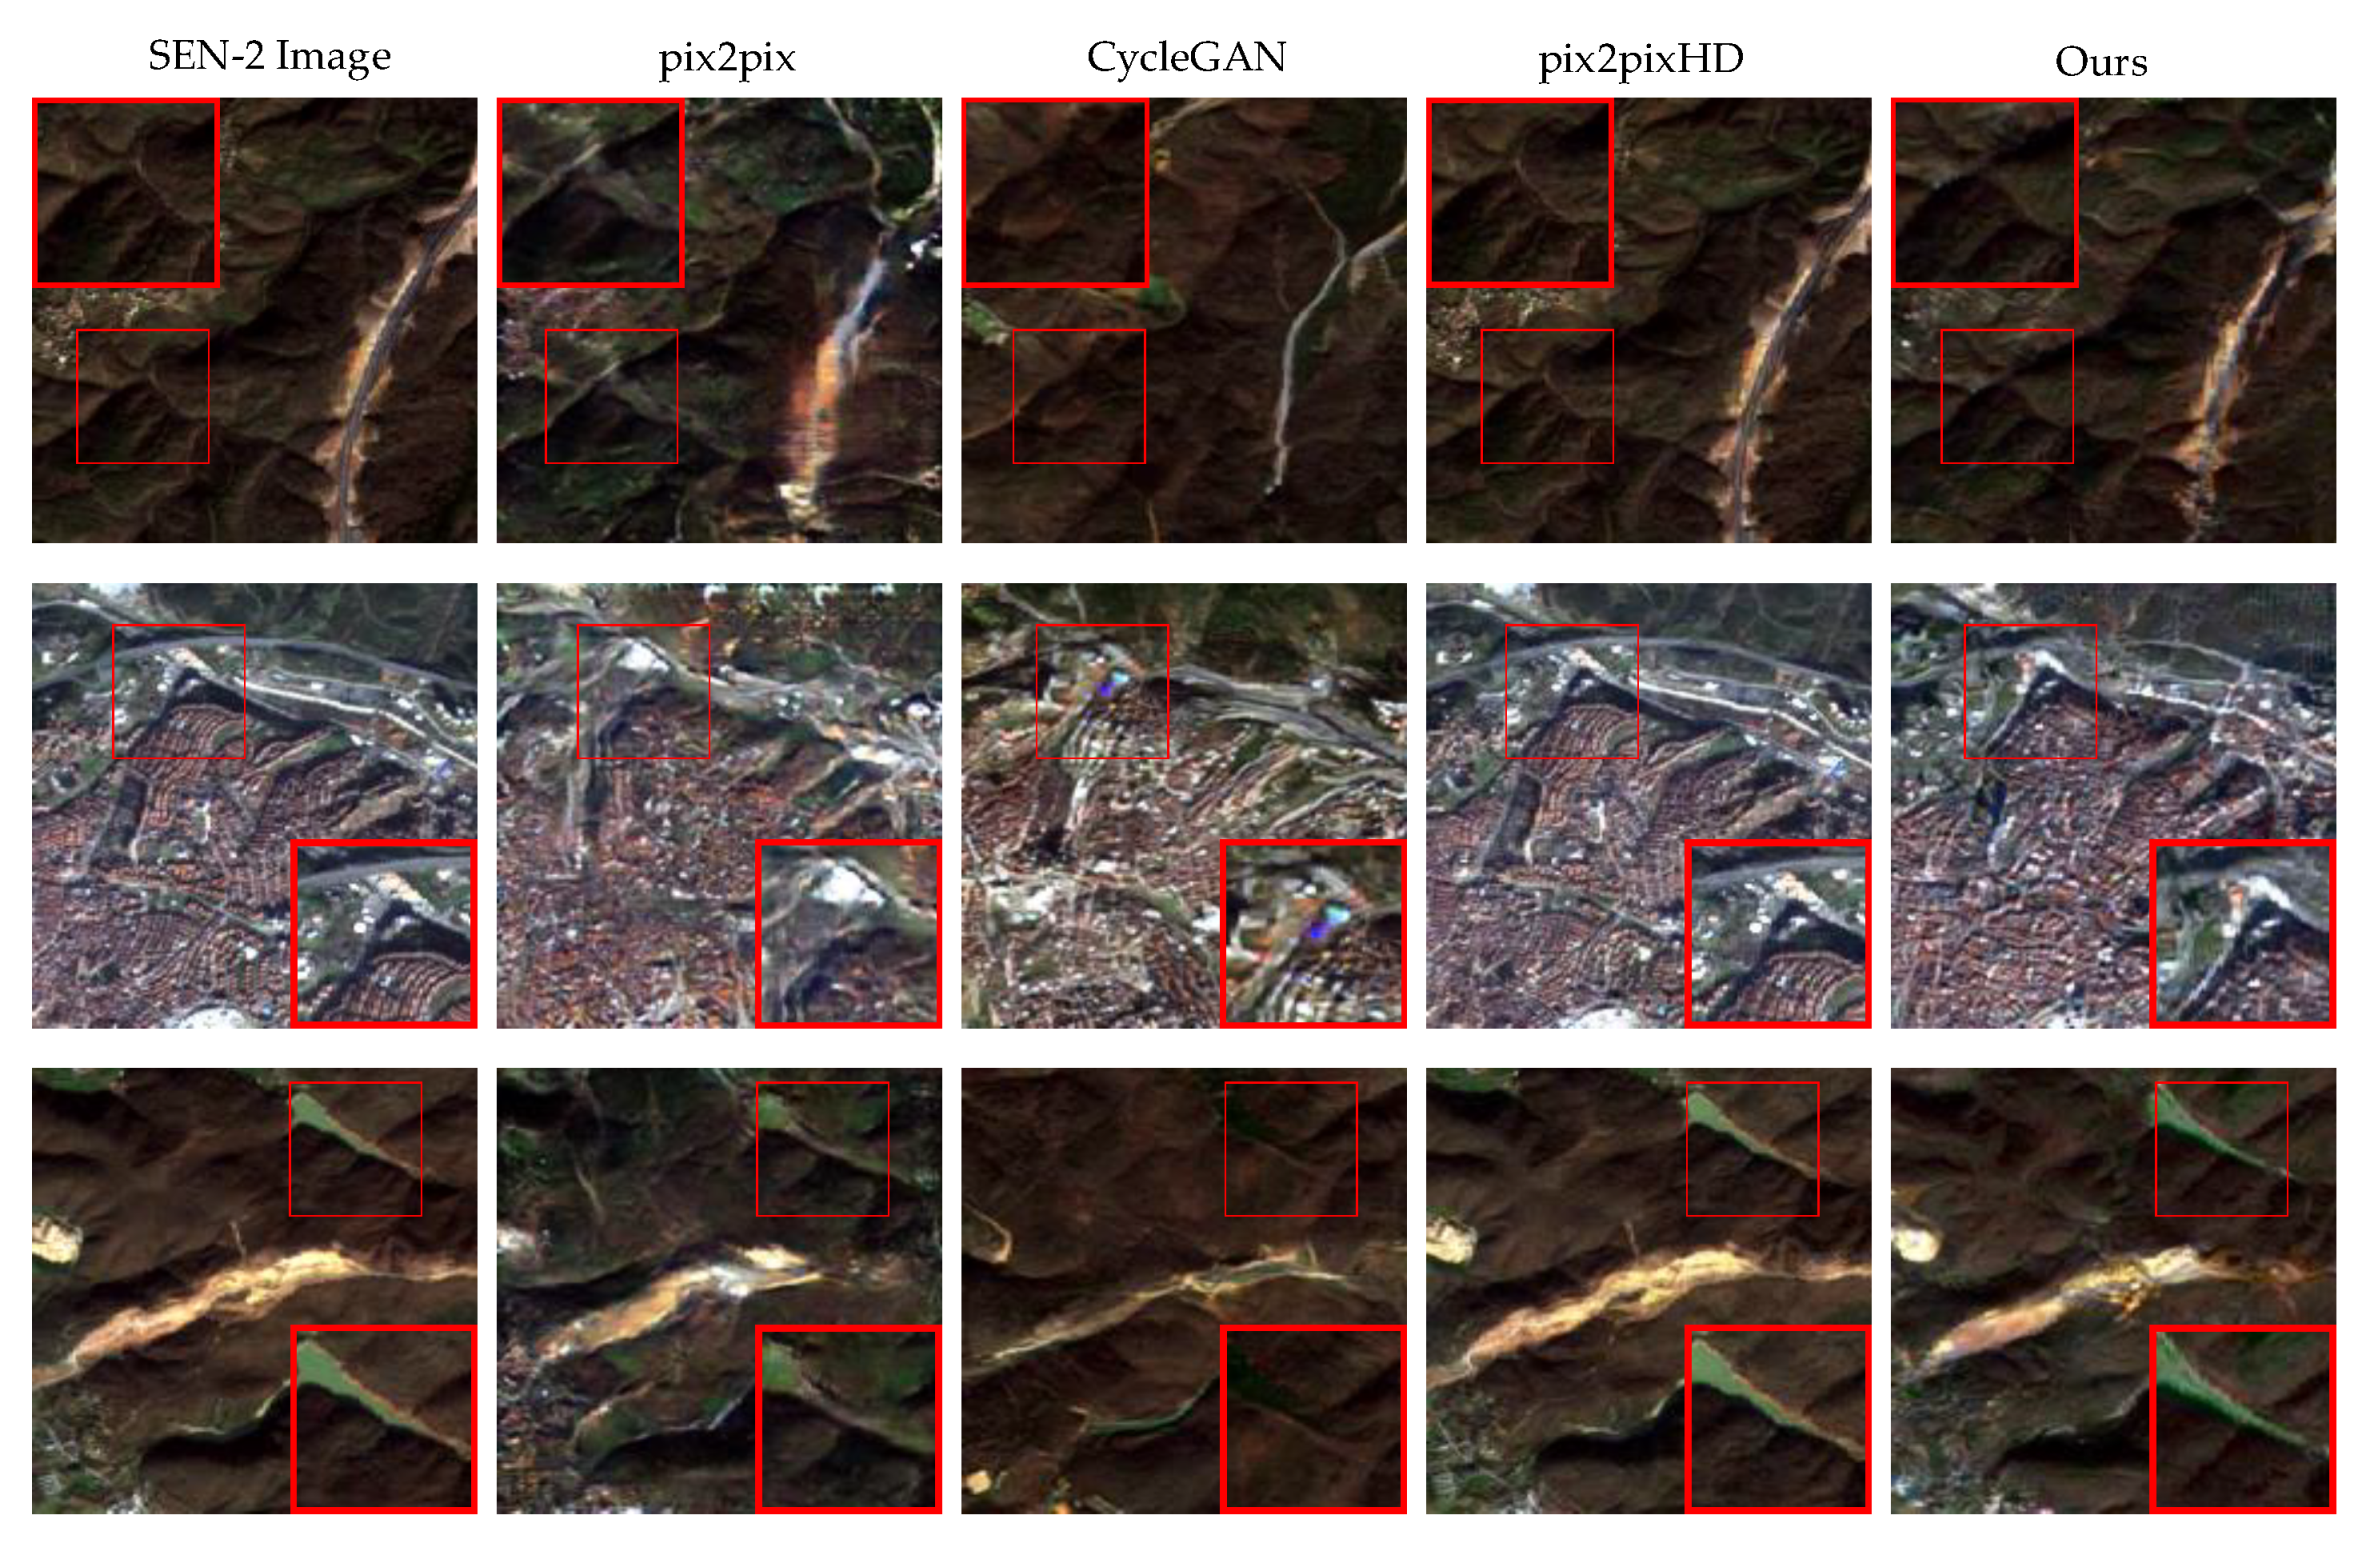
In order to compare the details of the images generated by different models, Figure 11 shows the details of the results generated by the proposed method compared with the four methods of pix2pix, CycleGAN and pix2pixHD. According to the subjective evaluation criteria, the results of the proposed method and pix2pixHD are closer to the Sentinel satellite image. The generation results of pix2pix and CycleGAN are inferior to the first two methods. Although the results of the proposed method and pix2pixHD are not significantly different, the subsequent comparison will show that the proposed method is superior to pix2pixHD.
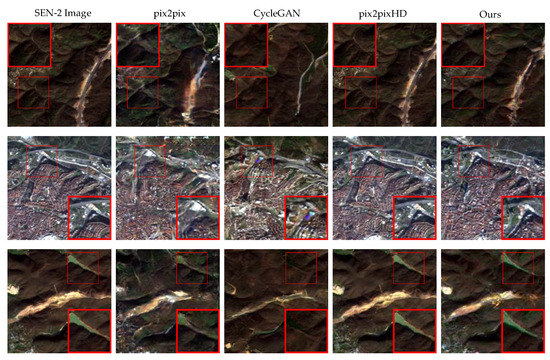
Figure 11.
Detailed comparison of Experiment 2. We selected the generated results of different models in three scenarios to compare the details with the SEN-2 reference images. Compared with other image translation models, the proposed model has obvious advantages in improving the generation performance. From left to right: SEN-2 images, images generated by pix2pix, images generated by CycleGAN, images generated by pix2pixHD, and the images generated by our model.
In order to quantitatively measure the advantages of the method, four image quality evaluation indexes (IQA), including PSNR, SSIM, FSIM, and MSE, were selected to quantitatively evaluate the method. As shown in Table 4, it can be seen from the data that the proposed model achieved the best in PSNR, SSIM, and MSE, and the second-best in FSIM.
Table 4.
Comparison of the indexes between the images generated by four methods and the SEN-2 images. The number in bold indicates the optimal value under the corresponding index.
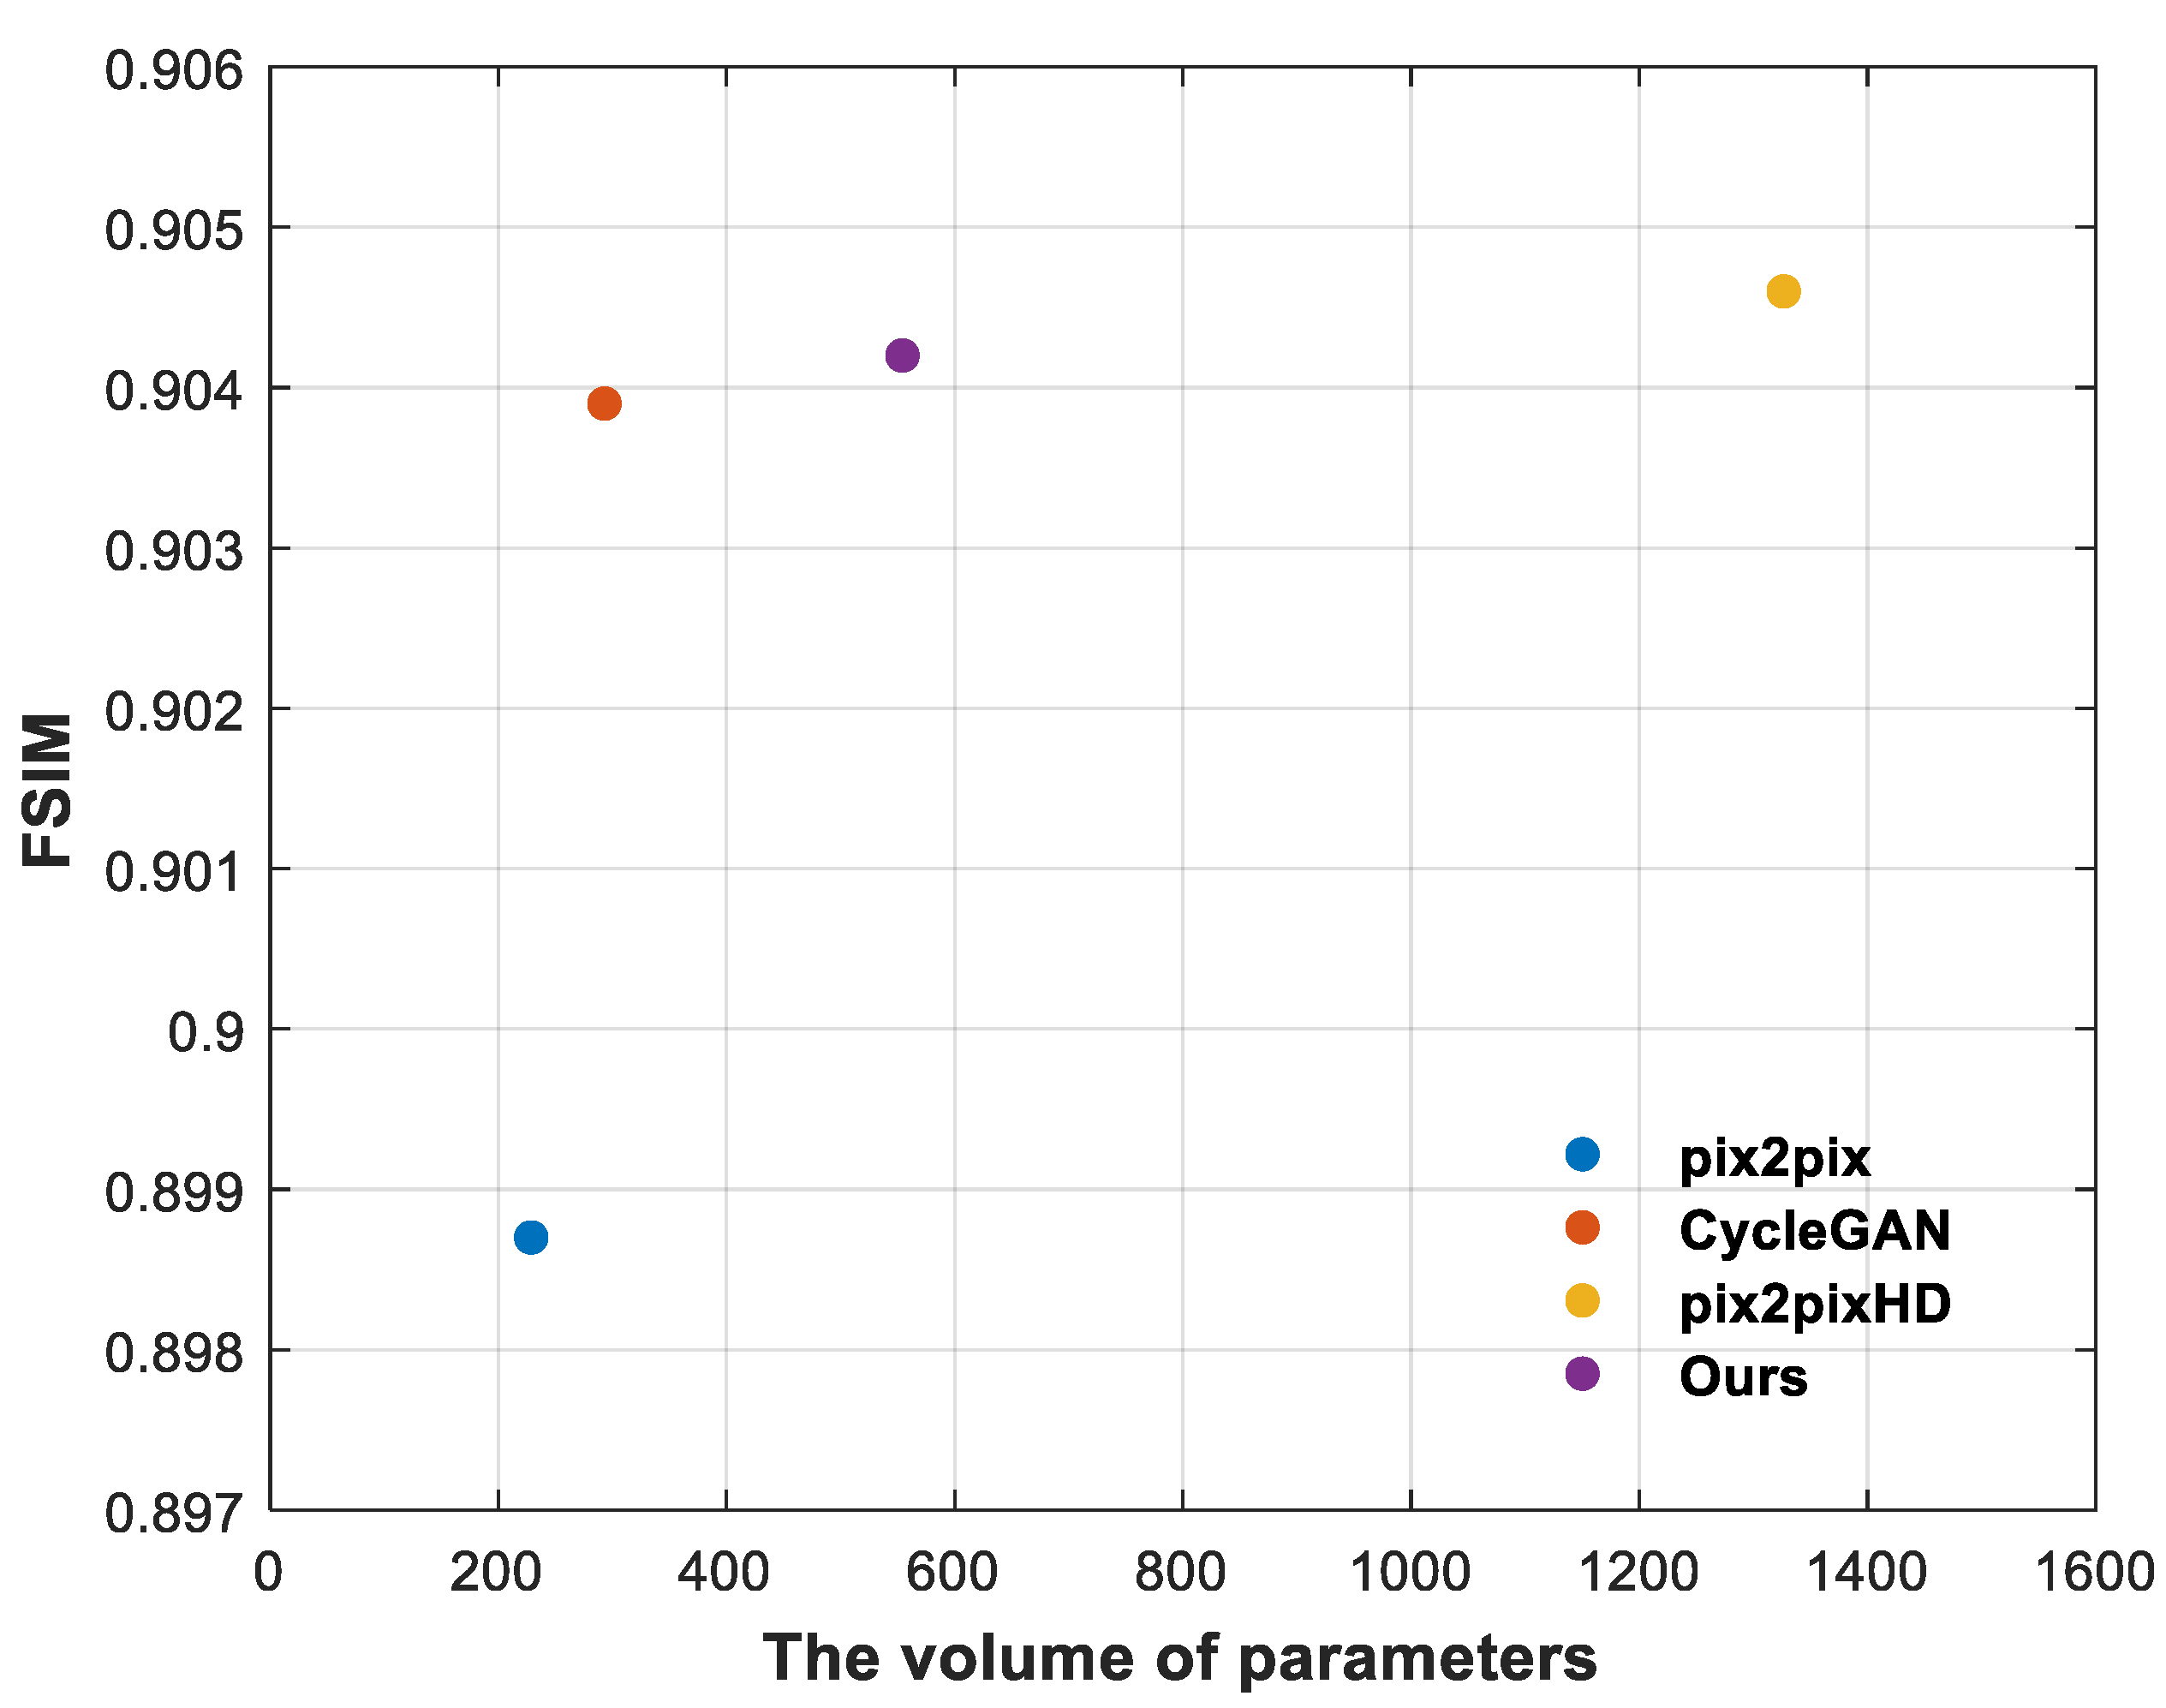
The above experimental results show the effectiveness of the proposed method and the superiority to pix2pix and CycleGAN from both qualitative and quantitative aspects. In order to further illustrate that our method is better than pix2pixHD, we draw a performance comparison diagram reflecting the model size and FSIM value. As shown in Figure 12, although the FSIM value of our method is 0.0004 lower than that of pix2pixHD, the model size of our method is about half of that of pix2pixHD, so the advantage of our method is more obvious.
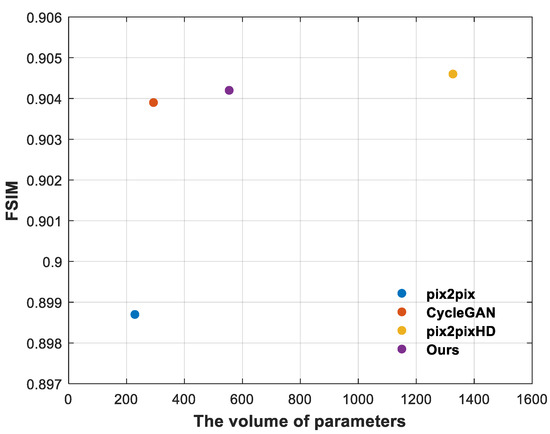
Figure 12.
Comparison of the results generated by our method and SOTA methods. The ordinate of the graph represents the normalized FSIM value, and the abscissa represents the parameter size (Mbyte) of the model. The comparison of the four methods is represented by a scatter diagram. The closer the scatter points are to the y-axis +∞, the better the overall cost performance of the model.
5. Discussion
The existing SAR-to-optical method is a one-step transformation method; that is, it directly transforms SAR images into optical RGB images. However, spectral and texture distortions inevitably occur, reducing the accuracy and reliability of the final transformation result. Moreover, the direct use of CycleGAN and pix2pix in SAR-to-optical transformation only reconstructs the original image at the pixel level, without restoring the spectrum and texture. Such results may not be suitable for further image interpretation. Inspired by image restoration and enhancement technology, a Serial GAN image transformation method is proposed here and used for SAR-to-optical tasks.
Based on SEN 1-2 SAR and optical image datasets, the effectiveness of the proposed method was verified through ablation experiments. Through qualitative and quantitative analysis with several SOTA image transformation methods, the superiority of the proposed method was verified. The image transformation method we proposed uses SAR images as prior information to restore and reconstruct SAR images based on the gradient contour and spectrum. The advantage of this is avoiding the mixing distortion caused by directly transforming the SAR image into an optical image, and the final transformation result has better texture detail and an improved spectral appearance. At the same time, our method does not simply involve learning the SAR-optical mapping but restores and reconstructs the SAR image from both the texture information and the spectral information so that it has an interpretation advantage similar to that of the optical image. Note that our proposed method was better than CycleGAN and pix2pix in the index of the transformation results, and some indexes were better than pix2pixHD. From an indicator point of view, this difference was small. However, from intuitive observation, the method proposed in this paper was significantly better than CycleGAN and pix2pix. The reason for this is that our method is not a simple transformation but the reconstruction of SAR images, which restores SAR images from the perspective of image theory. In comparison with the SOTA model pix2pixHD, the proposed method has no obvious advantage in the test value, but the parameter size of the model is about half that of pix2pixHD, which means that our method has more advantages in application. However, the proposed method also has some potential limitations. First, although we considered different seasons and different land types (urban, rural, semi-urban, and coastal areas) in the training data, supervised learning inevitably depends on the data. For different SAR image resolutions and speckle conditions, the results of the transformations will be different. In addition, because supervised learning requires a large number of training samples, the training effect of the model may not be ideal for a dataset with a small sample size. Therefore, problems arising from transfer learning, weakly supervised learning, and cross-modal technology will need to be solved in the future.
6. Conclusions and Prospects
To address the problem of feature loss and distortion in SAR-to-optical tasks, this paper proposed a feature-preserving heterogeneous image transformation model using Serial GANs to maintain the consistency of heterogeneous features, and reduce the distortion caused by heterogeneous transformation. An improved U-net structure was adopted in the model, which was used for SAR image Despeckling GAN, and then the image was colored by Colorization GAN to complete the transformation from a SAR image to an optical color image, which effectively alleviated the uncertainty of transformation results caused by information asymmetry between heterogeneous images. In addition, the end-to-end model architecture also enabled the trained model to be directly used for SAR-to-optical image transformation. At the same time, this paper introduced the feature-preserving loss, which enhanced the feature details of the generated image by constraining the gradient map. Through intuitive and objective comparison, the improved model effectively enhanced the detail of the generated image. In our view, Serial GANs have great potential in other heterogeneous image transformations.
Furthermore, they can provide a common framework for SAR image and photoelectric image transformation. In the future, we will consider incorporating multisource heterogeneous images into a Multiple GANs hybrid model to provide support for the cross-modal interpretation of multisource heterogeneous remote sensing images.
Author Contributions
Conceptualization, Y.L.; Data curation, D.T. and G.L.; Formal analysis, D.T.; Funding acquisition, Y.L. and Y.H.; Investigation, Y.L. and G.L.; Methodology, D.T., G.L. and S.S.; Project administration, L.Y. and Y.H.; Resources, L.Y.; Software, L.Y. and S.S.; Validation, S.S.; Visualization, S.S.; Writing—original draft, D.T.; Writing—review & editing, Y.H. All authors have read and agreed to the published version of the manuscript.
Funding
This research was supported by the National Natural Science Foundation of China, Grant Numbers 91538201, 62022092, and 62171453.
Institutional Review Board Statement
Not applicable.
Informed Consent Statement
Not applicable.
Data Availability Statement
The SEN1-2 dataset was used in this study (accessed 19 July 2021), which is accessible from https://mediatum.ub.tum.de/1436631. It is a dataset consisting of 282,384 pairs of corresponding synthetic aperture radar and optical image patches, acquired by the Sentinel-1 and Sentinel-2 remote sensing satellites, respectively. It is shared under the open access license CC- BY.
Acknowledgments
The authors sincerely appreciate that academic editors and reviewers give their helpful comments and constructive suggestions.
Conflicts of Interest
The authors declare that there are no conflicts of interest regarding the publication of this paper.
References
- Scarpa, G.; Gargiulo, M.; Mazza, A.; Gaetano, R. A CNN-based fusion method for feature extraction from sentinel data. Remote Sens. 2018, 10, 236. [Google Scholar] [CrossRef] [Green Version]
- Auer, S.; Hinz, S.; Bamler, R. Ray-Tracing Simulation Techniques for Understanding High-Resolution SAR Images. IEEE Trans. Geosci. Remote Sens. 2010, 48, 1445–1456. [Google Scholar] [CrossRef] [Green Version]
- Argenti, F.; Lapini, A.; Bianchi, T.; Alparone, L. A Tutorial on Speckle Reduction in Synthetic Aperture Radar Images. IEEE Geosci. Remote Sens. Mag. 2013, 1, 6–35. [Google Scholar] [CrossRef] [Green Version]
- Reyes, M.F.; Auer, S.; Merkle, N.; Henry, C.; Schmitt, M. SAR-to-optical image translation based on conditional generative adversarial networks-optimization, opportunities and limits. Remote Sens. 2019, 11, 2067. [Google Scholar] [CrossRef] [Green Version]
- Wang, P.; Zhang, H.; Patel, V.M. SAR Image Despeckling Using a Convolutional Neural Network. IEEE Signal Process. Lett. 2017, 24, 1763–1767. [Google Scholar] [CrossRef] [Green Version]
- Lattari, F.; Leon, B.G.; Asaro, F.; Rucci, A.; Prati, C.; Matteucci, M. Deep learning for SAR image despeckling. Remote Sens. 2019, 11, 1532. [Google Scholar] [CrossRef] [Green Version]
- Dalsasso, E.; Yang, X.; Denis, L.; Tupin, F.; Yang, W. SAR Image Despeckling by Deep Neural Networks: From a pre-trained model to an end-to-end training strategy. Remote Sens. 2020, 12, 2636. [Google Scholar] [CrossRef]
- Zhang, K.; Zuo, W.; Chen, Y.; Meng, D.; Zhang, L. Beyond a gaussian denoiser: Residual learning of deep cnn for image denoising. IEEE Trans. Image Process. 2017, 26, 3142–3155. [Google Scholar] [CrossRef] [Green Version]
- Chierchia, G.; Cozzolino, D.; Poggi, G.; Verdoliva, L. SAR image despeckling through convolutional neural networks. In Proceedings of the 2017 IEEE International Geoscience and Remote Sensing Symposium (IGARSS), Fort Worth, TX, USA, 23–28 July 2017; pp. 5438–5441. [Google Scholar]
- Qiang, Z.; Yuan, Q.; Jie, L.; Zhen, Y.; Zhang, L. Learning a Dilated Residual Network for SAR Image Despeckling. Remote Sens. 2018, 10, 196. [Google Scholar]
- Isola, P.; Zhu, J.Y.; Zhou, T.; Efros, A.A. Image-to-image translation with conditional adversarial networks. In Proceedings of the 2017 IEEE Conference on Computer Vision and Pattern Recognition (CVPR), Honolulu, HI, USA, 21–26 July 2017; pp. 5967–5976. [Google Scholar] [CrossRef] [Green Version]
- Zhu, J.-Y.; Park, T.; Isola, P.; Efros, A.A. Unpaired Image-to-Image Translation using Cycle-Consistent Adversarial Networks In Proceedings of the 2017 IEEE International Conference on Computer Vision (ICCV), Venice, Italy, 22–29 October 2017; Volume 2242–2251.
- Wang, T.-C.; Liu, M.-Y.; Zhu, J.-Y.; Tao, A.; Kautz, J.; Catanzaro, B. High-Resolution Image Synthesis and Semantic Manipulation with Conditional GANs. In Proceedings of the IEEE Conference on Computer Vision and Pattern Recognition, Salt Lake City, UT, USA, 18–23 June 2018; pp. 8798–8807. [Google Scholar]
- Choi, Y.; Choi, M.; Kim, M.; Ha, J.W.; Kim, S.; Choo, J. StarGAN: Unified Generative Adversarial Networks for Multi-domain Image-to-Image Translation. In Proceedings of the IEEE Computer Society Conference on Computer Vision and Pattern Recognition, Salt Lake City, UT, USA, 18–23 June 2018. [Google Scholar]
- Li, J.; Monroe, W.; Shi, T.; Jean, S.; Ritter, A.; Jurafsky, D. Adversarial learning for neural dialogue generation. In Proceedings of the EMNLP 2017—Conference on Empirical Methods in Natural Language Processing, Copenhagen, Denmark, 7–11 September 2017. [Google Scholar]
- Reed, S.; Akata, Z.; Yan, X.; Logeswaran, L.; Schiele, B.; Lee, H. Generative adversarial text to image synthesis. In Proceedings of the 33rd International Conference on Machine Learning (ICML-2016), New York, NY, USA, 19–24 June 2016; pp. 1681–1690. [Google Scholar]
- Denton, E.; Szlam, A.; Fergus, R. Deep Generative Image Models using a Laplacian Pyramid of Adversarial Networks. arXiv 2015, arXiv:1506.05751. [Google Scholar]
- Mathieu, M.; Couprie, C.; LeCun, Y. Deep multi-scale video prediction beyond mean square error. In Proceedings of the 4th International Conference on Learning Representations, ICLR 2016, San Juan, Puerto Rico, 2–4 May 2016; pp. 1–14. [Google Scholar]
- Ledig, C.; Theis, L.; Huszár, F.; Caballero, J.; Cunningham, A.; Acosta, A.; Aitken, A.; Tejani, A.; Totz, J.; Wang, Z.; et al. Photo-realistic single image super-resolution using a generative adversarial network. In Proceedings of the 30th IEEE Conference on Computer Vision and Pattern Recognition (CVPR), Honolulu, HI, USA, 21–26 July 2016; p. 2017. [Google Scholar]
- Zhu, J.-Y.; Krähenbühl, P.; Shechtman, E.; Efros, A.A. Generative Visual Manipulation on the Natural Image Manifold. In Proceedings of the European Conference on Computer Vision (ECCV), Amsterdam, The Netherlands, 11–14 October 2016. [Google Scholar]
- Brock, A.; Lim, T.; Ritchie, J.M.; Weston, N. Neural photo editing with introspective adversarial networks. In Proceedings of the 5th International Conference on Learning Representations, Toulon, France, 24–26 April 2017. [Google Scholar]
- Fu, S.; Xu, F.; Jin, Y.Q. Translating sar to optical images for assisted interpretation. arXiv 2019, arXiv:1901.03749. [Google Scholar]
- Wang, L.; Xu, X.; Yu, Y.; Yang, R.; Gui, R.; Xu, Z.; Pu, F. SAR-to-optical image translation using supervised cycle-consistent adversarial networks. IEEE Access 2019, 7, 129136–129149. [Google Scholar] [CrossRef]
- Zhang, J.; Zhou, J.; Lu, X. Feature-guided SAR-to-optical image translation. IEEE Access 2020, 8, 70925–70937. [Google Scholar] [CrossRef]
- Ma, C.; Rao, Y.; Cheng, Y.; Chen, C.; Lu, J.; Zhou, J. Structure-Preserving Super Resolution With Gradient Guidance. In Proceedings of the 2020 IEEE/CVF Conference on Computer Vision and Pattern Recognition (CVPR) 2020, Seattle, WA, USA, 16–18 June 2020; pp. 7766–7775. [Google Scholar] [CrossRef]
- Schmitt, M.; Hughes, L.H.; Zhu, X.X. The SEN1-2 dataset for deep learning in SAR-optical data fusion. ISPRS Ann. Photogramm. Remote Sens. Spat. Inf. Sci. 2018, 4, 141–146. [Google Scholar] [CrossRef] [Green Version]
- Torres, R.; Snoeij, P.; Geudtner, D.; Bibby, D.; Davidson, M.; Attema, E.; Potin, P.; Rommen, B.; Floury, N.; Brown, M.; et al. GMES Sentinel-1 mission. Remote Sens. Environ. 2012, 120, 9–24. [Google Scholar] [CrossRef]
- Zhang, T.; Zhang, X. Injection of Traditional Hand-Crafted Features into Modern CNN-Based Models for SAR Ship Classification: What, Why, Where, and How. Remote Sens. 2021, 13, 2091. [Google Scholar] [CrossRef]
- Schubert, A.; Small, D.; Miranda, N.; Geudtner, D.; Meier, E. Sentinel-1A product geolocation accuracy: Commissioning phase results. Remote Sens. 2015, 7, 9431–9449. [Google Scholar] [CrossRef] [Green Version]
- Drusch, M.; Del Bello, U.; Carlier, S.; Colin, O.; Fernandez, V.; Gascon, F.; Hoersch, B.; Isola, C.; Laberinti, P.; Martimort, P.; et al. Sentinel-2: ESA’s optical high-resolution mission for GMES operational services. Remote Sens. Environ. 2012, 120, 25–36. [Google Scholar] [CrossRef]
- Zhang, R.; Isola, P.; Efros, A.A. Colorful image colorization. In Proceedings of the European Conference on Computer Vision (ECCV), Amsterdam, The Netherlands, 11–14 October 2016; pp. 649–666. [Google Scholar]
- Zhang, T.; Zhang, X.; Shi, J.; Wei, S.; Wang, J.; Li, J.; Su, H.; Zhou, Y. Balance scene learning mechanism for offshore and inshore ship detection in SAR images. IEEE Geosci. Remote Sens. Lett. 2020. [Google Scholar] [CrossRef]
- Sangkloy, P.; Lu, J.; Fang, C.; Yu, F.; Hays, J. Scribbler: Controlling Deep Image Synthesis with Sketch and Color. In Proceedings of the IEEE Conference on Computer Vision and Pattern Recognition (CVPR), Honolulu, HI, USA, 21–26 July 2017. [Google Scholar]
- Wang, Z.; Bovik, A.C.; Sheikh, H.R.; Simoncelli, E.P. Image quality assessment: From error visibility to structural similarity. IEEE Trans. Image Process. 2004, 13, 600–612. [Google Scholar] [CrossRef] [Green Version]
- Zhang, L.; Zhang, L.; Mou, X.; Zhang, D. FSIM: A Feature Similarity Index for Image Quality Assessment. IEEE Trans. Image Process. 2011, 20, 2378–2386. [Google Scholar] [CrossRef] [PubMed] [Green Version]
Publisher’s Note: MDPI stays neutral with regard to jurisdictional claims in published maps and institutional affiliations. |
© 2021 by the authors. Licensee MDPI, Basel, Switzerland. This article is an open access article distributed under the terms and conditions of the Creative Commons Attribution (CC BY) license (https://creativecommons.org/licenses/by/4.0/).