Article

PolSAR Ship Detection with Optimal Polarimetric Rotation Domain Features and SVM

State Key Laboratory of Complex Electromagnetic Environment Effects on Electronics and Information System, National University of Defense Technology, Changsha 410073, China
*
Author to whom correspondence should be addressed.
Remote Sens. 2021, 13(19), 3932; https://doi.org/10.3390/rs13193932
Submission received: 10 September 2021 / Revised: 26 September 2021 / Accepted: 27 September 2021 / Published: 30 September 2021
(This article belongs to the Special Issue Emerging Techniques and Applications of Polarimetric SAR (PolSAR))

Abstract

:
Polarimetric synthetic aperture radar (PolSAR) can obtain fully polarimetric information, which provides chances to better understand target scattering mechanisms. Ship detection is an important application of PolSAR and a number of scattering mechanism-based ship detection approaches have been established. However, the backscattering of manmade targets including ships is sensitive to the relative geometry between target orientation and radar line of sight, which makes ship detection still challenging. This work aims at mitigating this issue by target scattering diversity mining and utilization in polarimetric rotation domain with the interpretation tools of polarimetric coherence and correlation pattern techniques. The core idea is to find an optimal combination of polarimetric rotation domain features which shows the best potential to discriminate ship target and sea clutter pixel candidates. With the Relief method, six polarimetric rotation domain features derived from the polarimetric coherence and correlation patterns are selected. Then, a novel ship detection method is developed thereafter with these optimal features and the support vector machine (SVM) classifier. The underlying physics is that ship detection is equivalent to ship and sea clutter classification after the ocean and land partition. Four kinds of spaceborne PolSAR datasets from Radarsat-2 and GF-3 are used for comparison experiments. The superiority of the proposed detection methodology is clearly demonstrated. The proposed method achieves the highest figure of merit (FoM) of 99.26% and 100% for two Radarsat-2 datasets, and of 95.45% and 99.96% for two GF-3 datasets. Specially, the proposed method shows better performance to detect inshore dense ships and reserve the ship structure.

1. Introduction

Ship detection is one of the most important applications of synthetic aperture radar (SAR) images. With the development of radar technology and the implementation of polarimetric synthetic aperture radar (PolSAR) system, ship detection in PolSAR image receives plenty of research [1,2,3]. Compared with SAR, PolSAR can provide a complete polarization scattering matrix of the target and fully polarimetric information. Currently, many ship detection schemes have been established.
The constant false alarm rate (CFAR) detection is the most common method for ship target detection in PolSAR images [4,5,6]. Because ship target has strong scattering echo compared with sea clutter, the CFAR detection method can achieve better detection effect when the target prior information is unknown. A variety of statistical models are used to model sea clutter in CFAR detection, including Gamma distribution, generalized Gaussian distribution, K distribution, and Weibull distribution [7]. In addition, the polarimetric whitening filter (PWF) [8], the reflection symmetry-based filter (RSF) [9], and the polarimetric notch filter (PNF) [10] are also proposed to enhance the contrast between the target and sea clutter.
Considering the different polarimetric scattering characteristics of ship and sea clutter, a lot of scattering mechanism-based ship detection schemes have been developed [11,12,13]. Polarimetric target decomposition is one of the important tools for PolSAR image interpretation [14,15]. The polarimetric parameters obtained by decomposition can be used to distinguish potential targets from their local clutter. Ringrose et al. [11] first applied Cameron decomposition to ship target detection. Touzi et al. [12] applied the Cloude–Pottier decomposition to detect ships and achieved good ship detection results through polarization entropy, eigenvalue, and alpha angle. Sugimoto et al. [13] utilized the decomposition of the four-component model proposed by Yamaguchi for ship target detection. The advantage of these algorithms lies in the simplicity of interpretation and calculation. In addition, based on the difference of reflection symmetry between ship and sea clutter, a polarimetric SAR ship detection method with the correlation of co-polarization and cross-polarization channels is proposed [16]. Furthermore, based on the similarity test of the polarimetric coherence matrix, the saliency feature that can effectively distinguish ship and sea clutter can be extracted. In this vein, a saliency detector for PolSAR ship detection is proposed [17].
Apart from the above-mentioned methods, many successful techniques in the field of optical image processing such as the superpixel method are also applied to ship target detection in PolSAR images and have achieved good results [18,19]. The superpixel method can segment ship target and sea clutter into different superpixels and select pure background pixels. Besides, there are many hyperspectral image processing algorithms that can be applied if one formulates the ship detection as a hyperspectral image processing problem [20,21]. With the development and application of machine learning theories and methods, the support vector machine (SVM) classifier [22,23,24] and deep learning detector [25,26,27] driven by data samples are used for ship target detection, which obtains good detection performance.
The backscattering of manmade targets, including ships, is sensitive to the relative geometry between target orientation and radar line of sight, which can affect the performance of ship detection. However, rich information is also contained within this target scattering diversity [28]. Recently, the uniform polarimetric matrix rotation theory [28], polarimetric coherence, and correlation pattern techniques [29,30] were developed to explore the hidden information in the polarimetric rotation domain. These techniques have achieved many successful applications [30,31,32]. This work focuses on the hidden feature exploration of polarimetric coherence and correlation pattern and the optimal combination of these features for ship detection. In addition, ship detection is equivalent to ship and sea clutter classification after the ocean and land partition. Therefore, a novel PolSAR ship detection scheme is established with the optimal polarimetric rotation domain features and the SVM classifier.
This paper is organized as follows: Section 2 introduces and demonstrates the polarimetric coherence and correlation pattern techniques. Section 3 describes the proposed ship detection method. Section 4 quantitatively analyses the detection results with different PolSAR datasets and demonstrates the performance of the proposed method. Finally, discussion and conclusions are given in Section 5 and Section 6.

2. Polarimetric Rotation Domain Investigation

2.1. Polarimetric Matrix

For polarimetric imaging radar, on a horizontal and vertical polarization basis, the polarimetric scattering matrix is represented as:
S = S HH S HV S VH S VV
where S VH is the backscattered coefficient from horizontal polarization transmission and vertical polarization reception. Other terms are similarly defined.
By rotating the polarimetric scattering matrix around the radar line of sight, the polarimetric scattering matrix in the rotation domain can be obtained [29]:
S θ = cos θ sin θ sin θ cos θ S HH S HV S VH S VV cos θ sin θ sin θ cos θ
where θ is the rotation angle, and θ π , π .
With the reciprocity condition, the polarimetric coherency matrix of the target can be expressed as:
T = k p k p H = T 11 T 12 T 13 T 21 T 22 T 23 T 31 T 32 T 33
where k p is the Pauli vector, k p H is the conjugate transpose of k p , indicates sample average.

2.2. Polarimetric Coherence Pattern

The coherence values between different polarization channels in polarimetric imaging radar data contain rich target information [33]. Based on the polarimetric matrix rotation processing, for arbitrary two polarization channels s 1 and s 2 , the polarimetric coherence pattern [29] can be written as:
γ 1 - 2 ( θ ) = s 1 ( θ ) s 2 * ( θ ) s 1 ( θ ) 2 s 2 ( θ ) 2
where s 2 * is the conjugate of s 2 . The value of γ 1 - 2 ( θ ) is within 0 , 1 .
The visualization pattern in the polarimetric rotation domain can be obtained by representing the polarimetric coherence pattern in polar coordinates with the rotation angle θ .
Then, 10 polarimetric features are derived to characterize the polarimetric coherence pattern, including the original coherence γ - org = γ 1 - 2 ( 0 ) , the standard deviation of coherence γ - std = std { γ 1 - 2 ( θ ) } , the coherence contrast γ - contrast = γ - max γ - min , the coherence anisotropy γ - A = ( γ - max γ - min ) / ( γ - max + γ - min ) , the mean value of coherence γ - mean = mean { γ 1 - 2 ( θ ) } , the maximum coherence γ - max = max { γ 1 - 2 ( θ ) } , the minimum coherence γ - min = min { γ 1 - 2 ( θ ) } , the maximum rotation angle θ γ max = argmax { γ 1 - 2 ( θ ) } , the minimum rotation angle θ γ min = argmin { γ 1 - 2 ( θ ) } , and the coherence beamwidth γ - bw 0 . 95 (angle range less than 0.95 × γ - max ).
Based on the lexicographic vector k L = S HH 2 S HV S VV T and the Pauli vector k p = 1 / 2 S HH + S VV S HH S VV   2 S HV T , six kinds of typical polarimetric coherence patterns can be obtained, including γ HH - VV θ , γ HH - HV θ , γ VV - HV θ , γ ( HH + VV ) - ( HH - VV ) θ , γ ( HH + VV ) - ( HV ) θ and γ ( HH - VV ) - ( HV ) θ .
The following rotation domain equivalence can be verified:
γ HH - VV θ = γ VV - HV θ + π / 2
γ ( HH + VV ) ( HH - VV ) θ = γ ( HH + VV ) - ( HV ) θ + π / 4
Therefore, there are four kinds of independent polarimetric coherence patterns, including γ HH - VV θ , γ HH - HV θ , γ ( HH + VV ) - ( HH - VV ) θ and γ ( HH - VV ) - ( HV ) θ , which are considered thereinafter.

2.3. Polarimetric Correlation Pattern

The correlation values of the two polarization channels also contain potential information [9]. Based on the polarimetric coherence pattern, Cui et al. [30] proposed the polarimetric correlation pattern for ship detection, which achieved good ship detection results. For arbitrary two polarization channels s 1 and s 2 , the polarimetric correlation pattern can be written as:
γ ^ 1 - 2 ( θ ) = s 1 ( θ ) s 2 * ( θ )
where, s 2 * is the conjugate of s 2 . The value of γ ^ 1 - 2 ( θ ) is within 0 , .
Similar to polarimetric coherence pattern, the original correlation γ ^ - org , the standard deviation of correlation γ ^ - std , the correlation contrast γ ^ - contrast , the correlation anisotropy γ ^ - A , the mean value of correlation γ ^ - mean , the maximum correlation γ ^ - max , the minimum correlation γ ^ - min , the maximum rotation angle θ γ ^ max , the minimum rotation angle θ γ ^ min and the correlation beamwidth γ ^ - bw 0 . 95 are derived accordingly.

2.4. Demonstration and Investigation

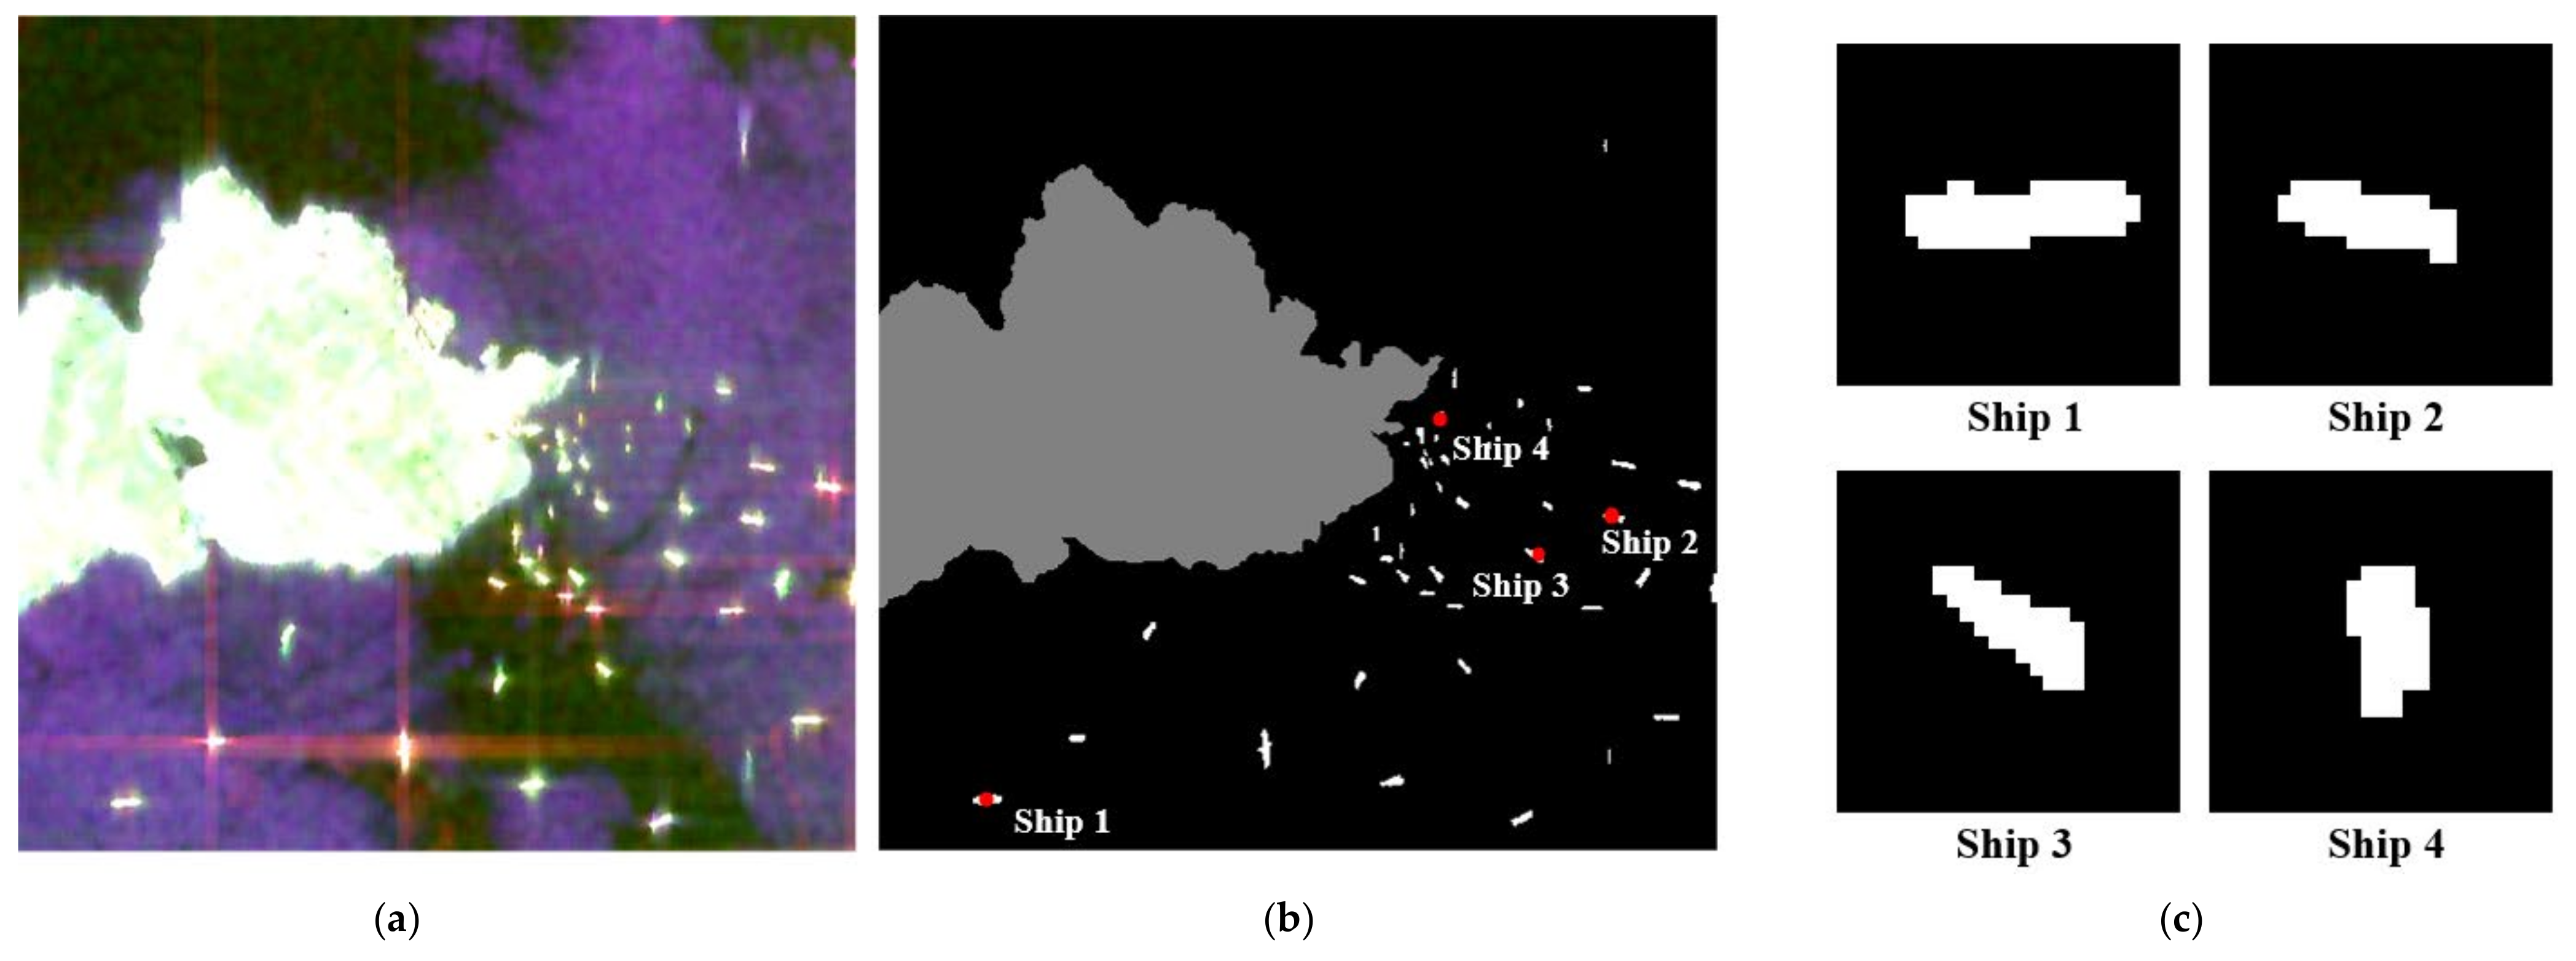
PolSAR datasets from Radarsat-2 and GF-3 covering the Hong Kong area, China, are utilized for polarimetric coherence and correlation patterns demonstration and investigation, shown in Figure 1 and Figure 2. Two areas contain various types of ships. The ground-truth images are annotated by experts combined with professional knowledge, shown in Figure 1b and Figure 2b. Four ship slices with different orientations are selected from the two datasets, respectively, shown in Figure 1c and Figure 2c. The sizes of slices are all 25 × 25 (pixel × pixel). Note that the area marked with green rectangle contains a large number of inshore dense ship targets, which is challenging for ship detection. In this work, this area is chosen for further ship detection validation.
The polarimetric coherence pattern and polarimetric correlation pattern of each pixel are calculated. The polarimetric coherence pattern γ HH - VV θ as an example is utilized for investigation, shown in Figure 3. With the ground-truth, the ship target areas are marked with red and the sea clutter areas are marked with blue. For middle and low sea state, the sea clutter is surface-scattering dominant. The ship target is double-bounce scattering dominant, which also includes surface-scattering, helix-scattering, and mixture scattering mechanisms. The difference of the scattering mechanism between the sea clutter and the ship target leads to different variation trend of their polarimetric coherence and correlation values in rotation domain. The polarimetric coherence pattern γ HH - VV θ of sea clutter is close to a circle, which indicates the roll-invariant property. The polarimetric coherence pattern γ HH - VV θ of ship target shows a multi-lobe shape, which exhibits obvious scattering directivity effect. The polarimetric coherence patterns γ HH - VV θ of sea clutter and ship pixels are significantly different. Similar phenomenon can also be observed from other kinds of polarimetric coherence and correlation patterns. Therefore, the polarimetric coherence and correlation pattern have the potential to distinguish ship target from sea clutter. In this vein, the key lies in how to find an optimal polarimetric rotation domain feature set, which will be investigated in the following section.

3. Methods

3.1. Polarimetric Rotation Domain Feature Selection

Ten polarimetric features can be derived from each polarimetric coherence pattern and polarimetric correlation pattern. Among them, polarimetric coherence pattern features such as θ γ min , θ γ max and γ - bw 0 . 95 , and polarimetric correlation pattern features such as θ γ ^ min , θ γ ^ max and γ ^ - bw 0 . 95 represent the statistical characteristics of angles in the rotation domain. The other features represent the statistical properties of the polarimetric coherence and correlation values in rotation domain. These two kinds of features have different dimensions, so they cannot be compared quantitatively and uniformly. Therefore, only seven polarimetric rotation domain features, which represent the value variation, are considered in this work.
Therefore, totally 28 polarimetric rotation domain features from polarimetric coherence patterns, including γ HH - VV θ , γ HH - HV θ , γ ( HH + VV ) - ( HH - VV ) θ and γ ( HH - VV ) - ( HV ) θ , and 28 features from polarimetric correlation patterns including γ ^ HH - VV θ , γ ^ HH - HV θ , γ ^ ( HH + VV ) - ( HH - VV ) θ and γ ^ ( HH - VV ) - ( HV ) θ are used for further study. Besides, the scattering power SPAN and T diagonal elements such as T 11 , T 22 and T 33 are also analyzed.
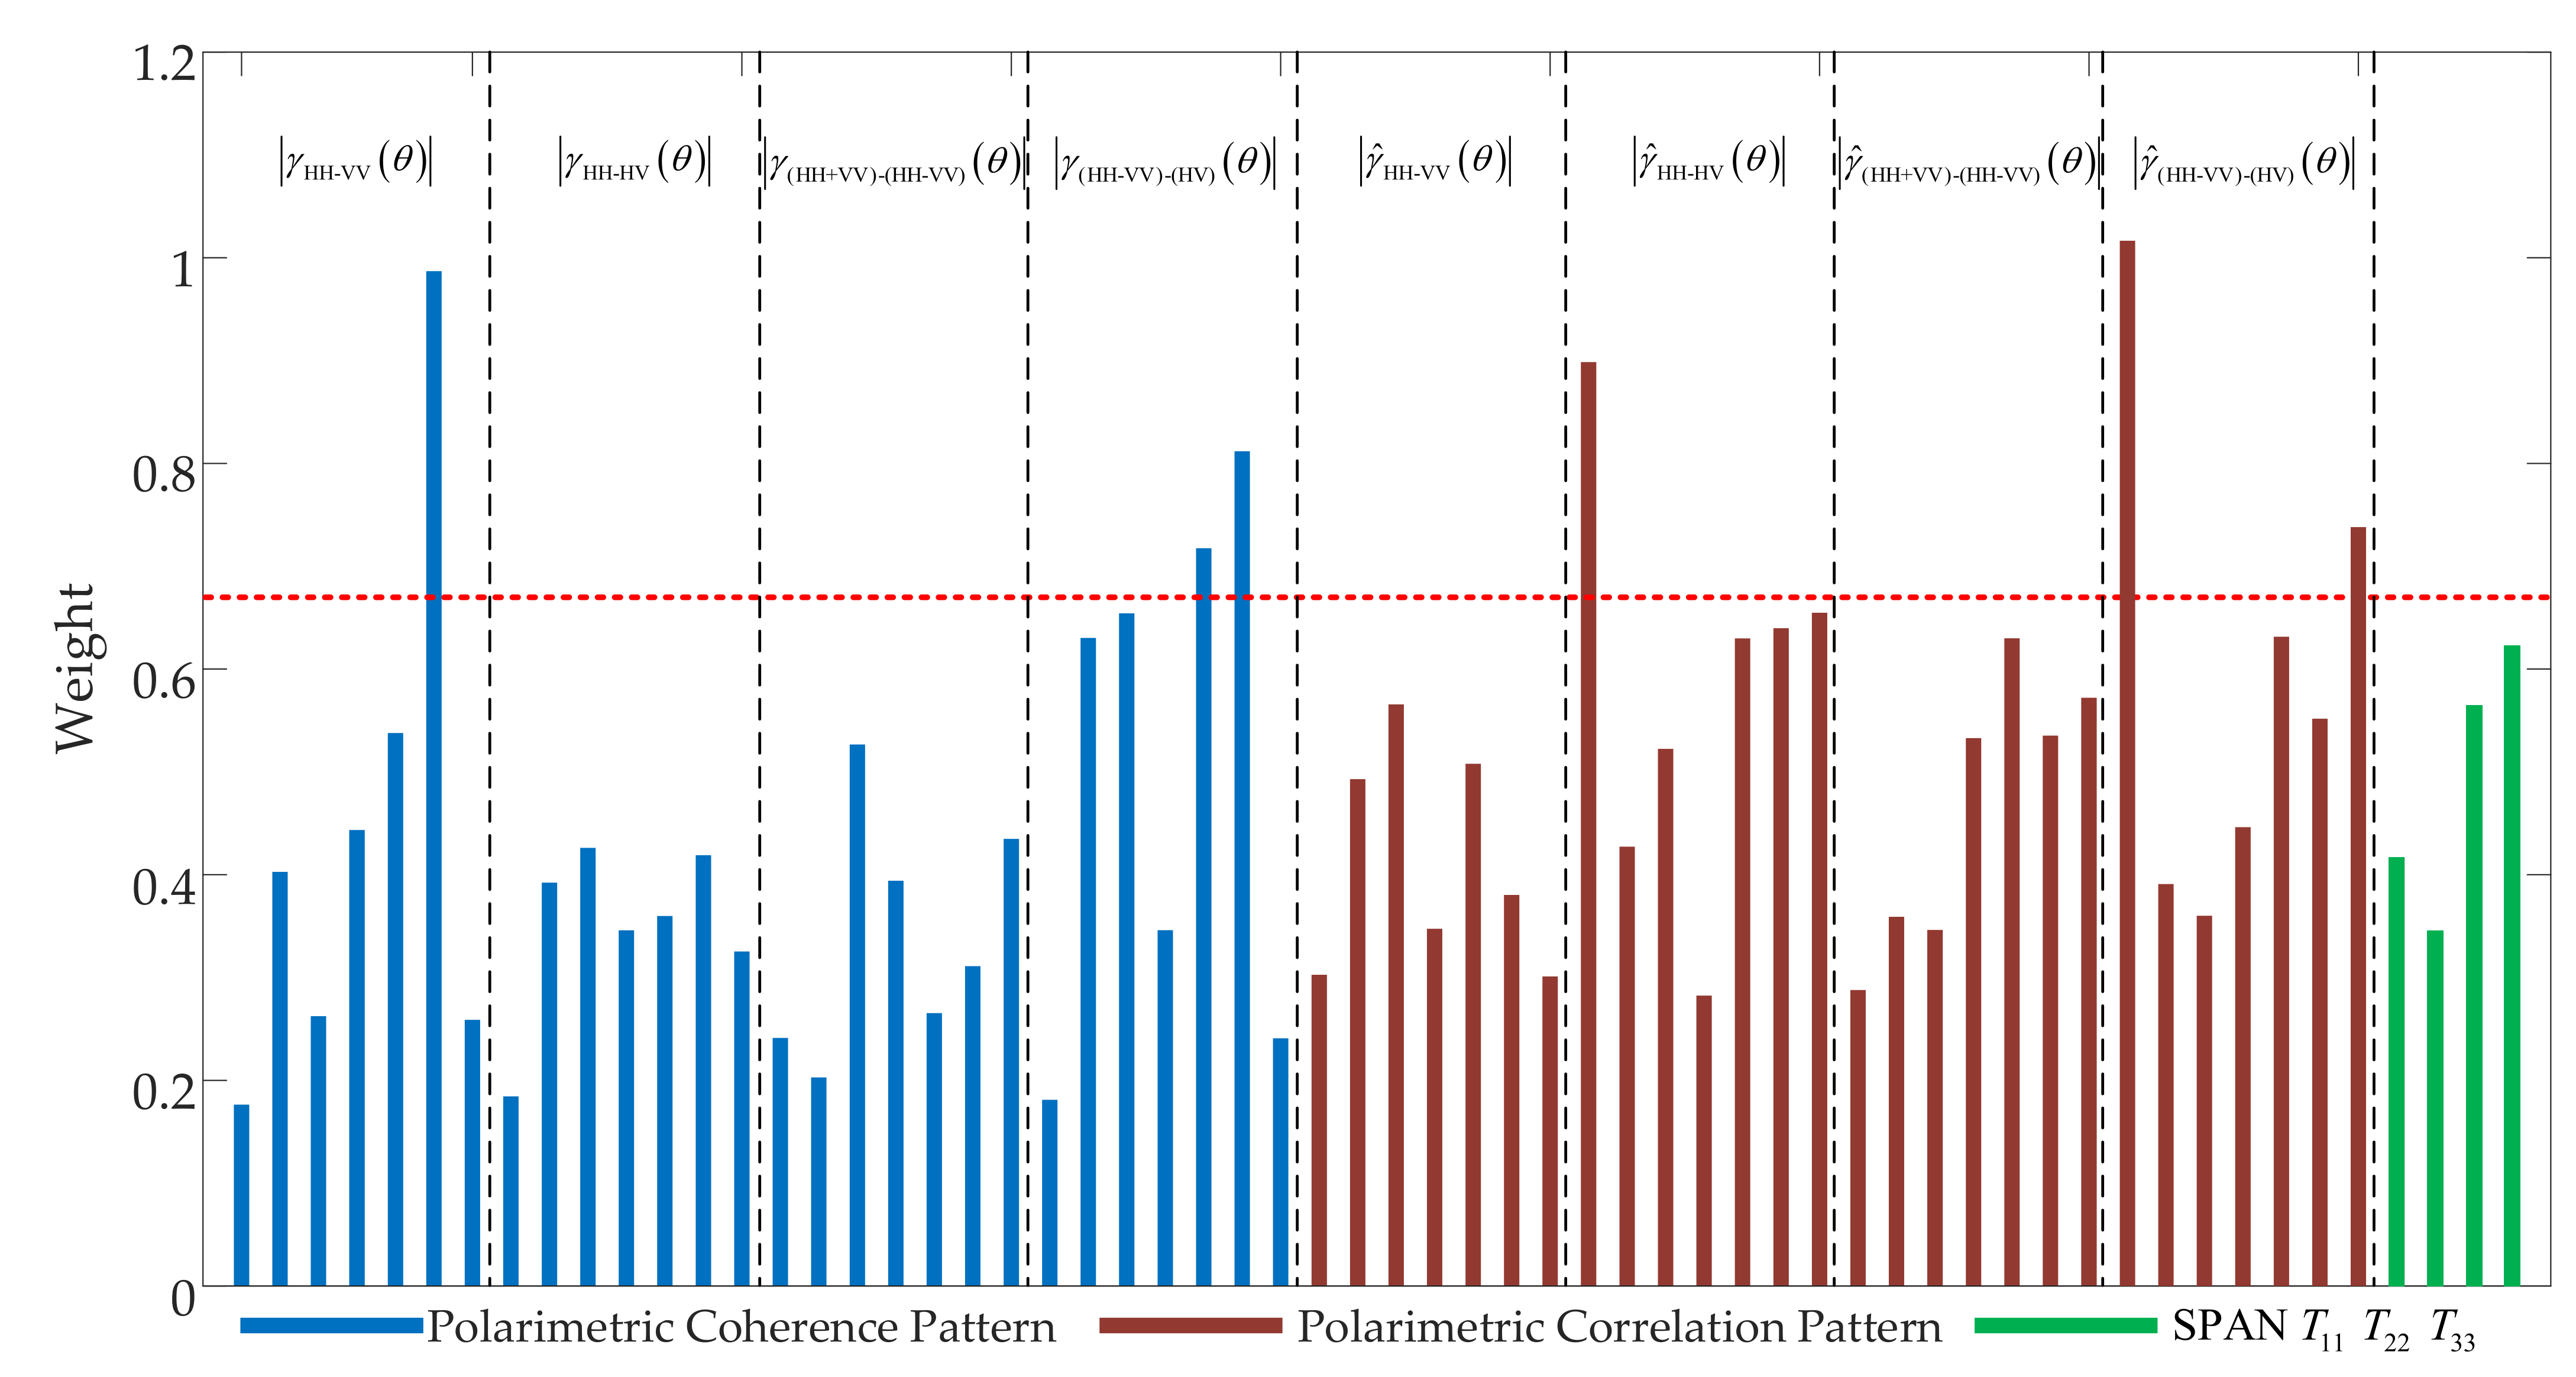
Normally, these polarimetric features can contain redundant information, and each polarimetric feature has different classification power. Therefore, a scheme for optimal features selection is proposed. The relief method [34] is a feature weight calculation algorithm, which can estimate the weight of each feature based on its ability to classify between different categories of samples. The larger the weight value, the stronger the feature classification ability is. Following this rationale, the weight of each feature is calculated. Totally 3000 ship pixels and 3000 sea clutter pixels are randomly selected from Radarsat-2 dataset for weight estimation. Figure 4 shows the weight of 56 polarimetric rotation domain features and traditional features. Each column represents a polarimetric feature. It can be seen that different polarimetric features have different abilities to distinguish ship clutter from sea clutter. Especially, the weight values of polarimetric coherence features γ HH - VV θ max , γ ( HH - VV ) - ( HV ) θ max and γ ( HH - VV ) - ( HV ) θ mean , and polarimetric correlation features γ ^ ( HH - VV ) - ( HV ) θ org , γ ^ HH - HV θ org and γ ^ ( HH - VV ) - ( HV ) θ min are higher than those of other features, which are 0.98, 0.81, 0.71, 1.01, 0.89, and 0.73, respectively. In this case, these six polarimetric rotation domain features have the best potential to discriminate ship target and sea clutter, which can be used for ship detection.
In order to prove the robustness of the selected feature, similar experiments are performed on the GF-3 PolSAR dataset. Similarly, 3000 ship pixels and 3000 sea clutter pixels are randomly selected from the GF-3 dataset for weight estimation. Figure 5 shows the weight of 56 polarimetric rotation domain features and traditional features. It can be seen that the weight of the polarimetric coherence features, including γ HH - VV θ max , γ ( HH - VV ) - ( HV ) θ max and γ ( HH - VV ) - ( HV ) θ mean , and polarimetric correlation features including γ ^ ( HH - VV ) - ( HV ) θ org , γ ^ HH - HV θ org and γ ^ ( HH - VV ) - ( HV ) θ min are also the highest, which are 0.83, 0.78, 0.72, 0.97, 0.92, and 0.82, respectively. Therefore, these six optimal polarimetric rotation domain features are selected to construct a feature vector for PolSAR ship detection:
v = [ γ HH - VV θ max   γ ( HH - VV ) - ( HV ) θ max   γ ( HH - VV ) - ( HV ) θ mean γ ^ ( HH - VV ) - ( HV ) θ org   γ ^ HH - HV θ org   γ ^ ( HH - VV ) - ( HV ) θ min ]

3.2. Ship Detection Scheme

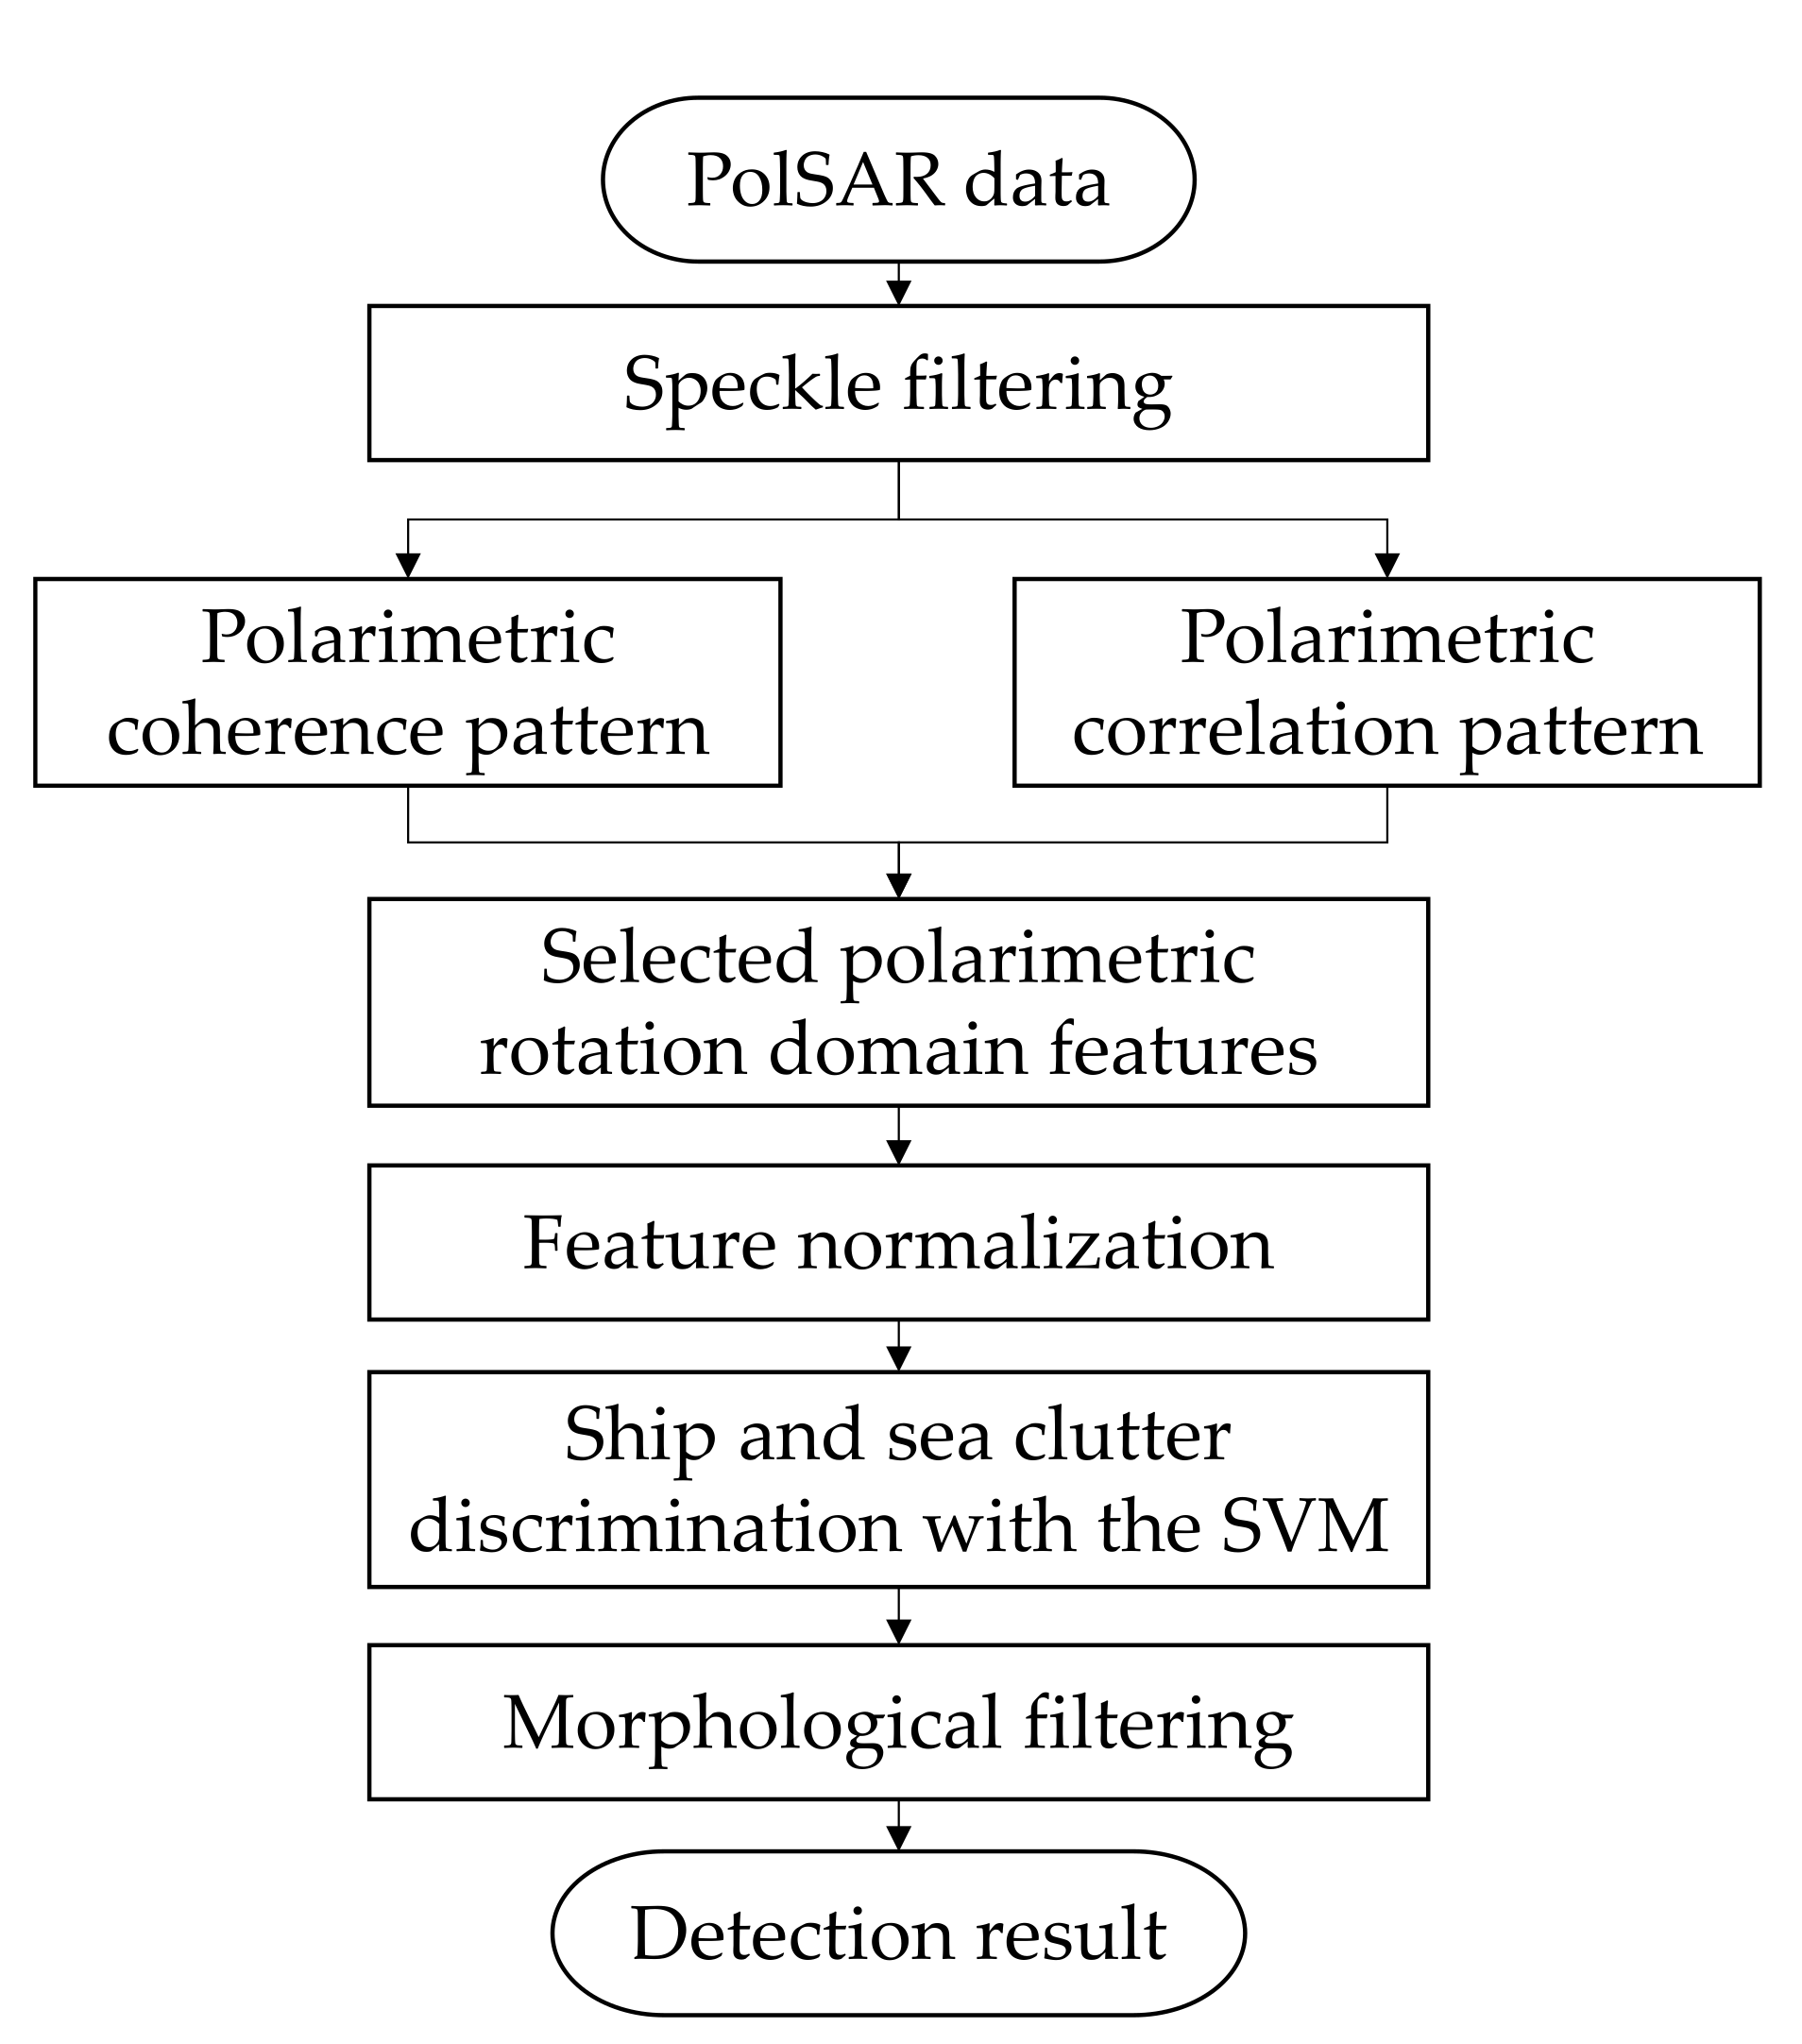
With the Relief method, six optimal polarimetric rotation domain features are selected. It is known that ship detection is equivalent to ship and sea clutter classification after the ocean and land partition. SVM is a kind of common classifier based on the structural risk minimization principle, which can reduce the generalization error upper bound and has good generalization ability [35]. In this work, a novel ship detection scheme is established with the optimal polarimetric rotation domain features and the SVM classifier. The flowchart of the proposed ship detection scheme is shown in Figure 6. Firstly, based on the PolSAR data after speckle filtering, the coherence values and the correlation values between polarization channels are extended to the polarimetric rotation domain, and four independent polarimetric coherence and correlation patterns are constructed. Secondly, six optimal polarimetric rotation domain features from the polarimetric coherence and correlation patterns with high weight are selected, and these polarimetric features are normalized, respectively. Lastly, the ship candidates are available with the SVM classifier. Morphological processing is carried out and the final result of PolSAR ship detection can be obtained.

4. Experimental Results

The spaceborne PolSAR datasets from Radarsat-2 and GF-3 are used to verify the performance of the proposed method. The SO-CFAR method [6] and superpixel method [18] are selected for comparison. In addition, in order to verify the advantages of the optimal polarimetric rotation domain features, T diagonal elements ( T 11 , T 22 and T 33 ) and three polarimetric correlation features ( γ ^ ( HH - VV ) - ( HV ) θ min , γ ^ ( HH - VV ) - ( HV ) θ org and γ ^ HH - HV θ org ) with high target-to-clutter ratio (TCR) [30] are also used for comparison. These methods are named SO-CFAR, SP, T3 + SVM, and PCP + SVM in the following, respectively.

4.1. Data Description

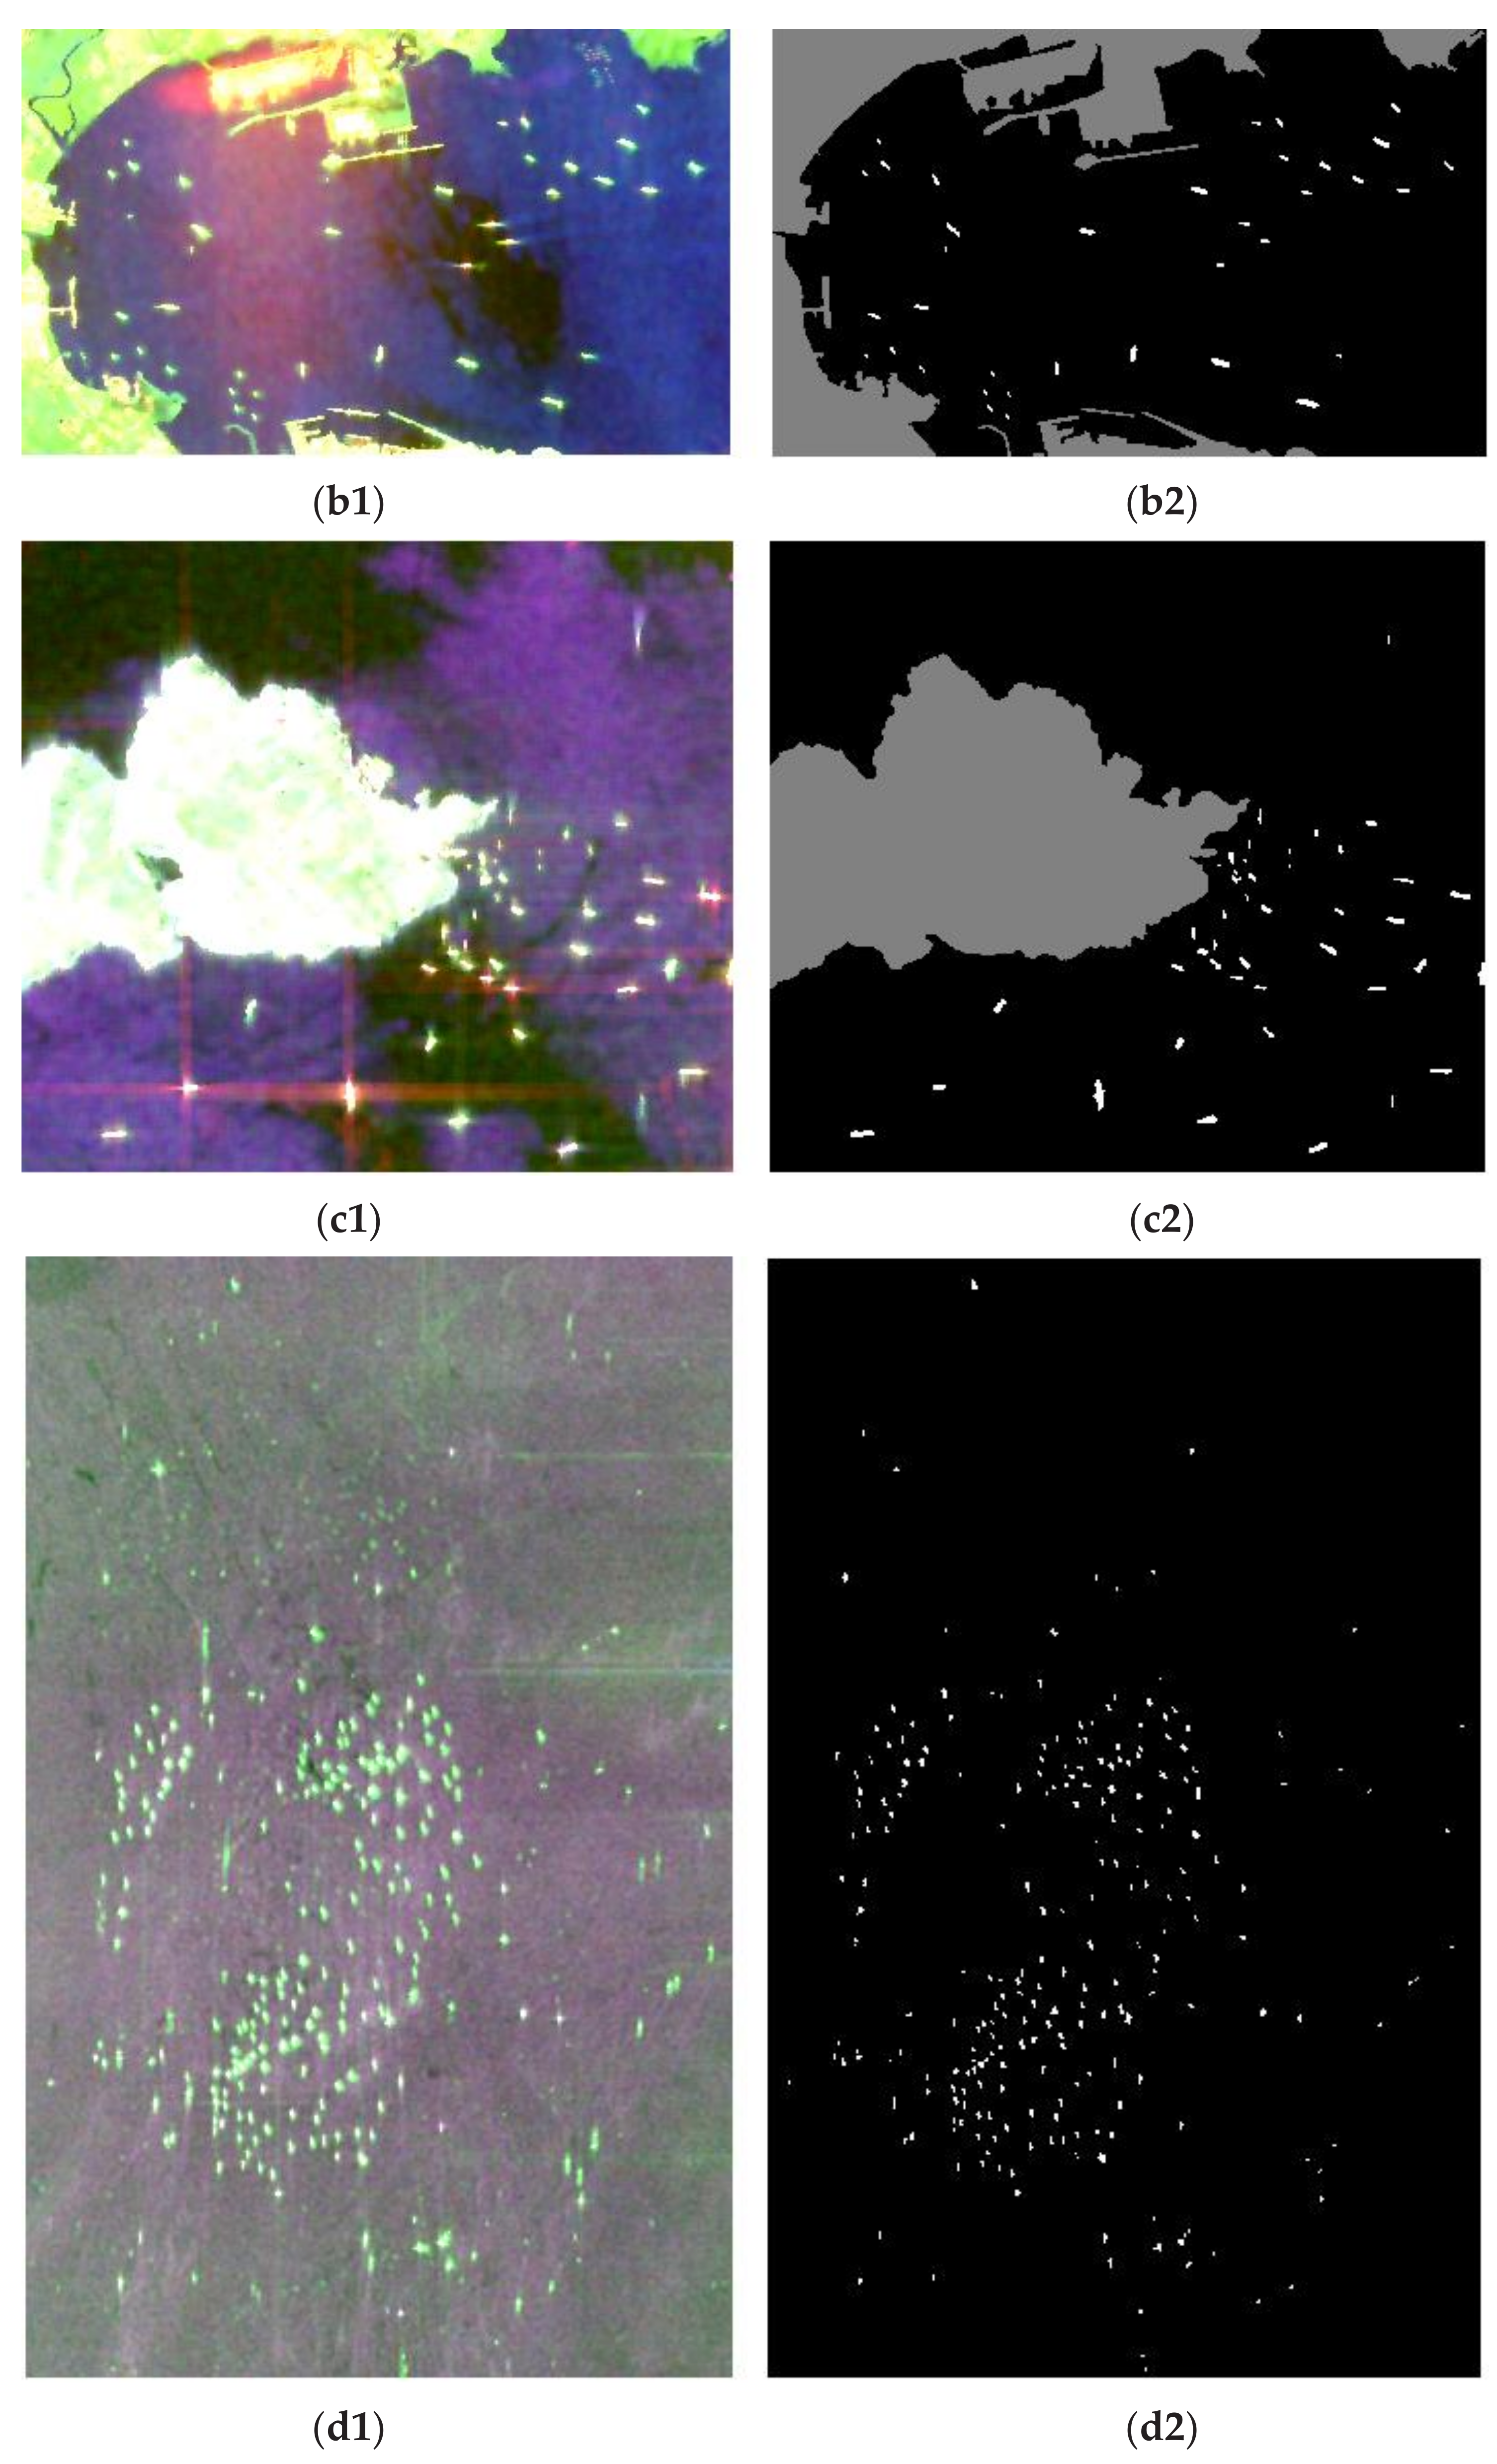
Totally four kinds of spaceborne PolSAR datasets from Radarsat-2 and GF-3 are used to validate the ship detection performances. The data information in detail including imaging area, acquisition date, data size, resolution, and ship number is shown in Table 1. Figure 7 shows these PolSAR datasets. The Pauli RGB images are shown in Figure 7(a1–d1) and the ground-truth images are shown in Figure 7(a2–d2). The ground-truth images are annotated by experts combined with professional knowledge, where white represents the ship target pixel, black represents the sea clutter pixel, and gray represents the land pixel. The SimiTest method [36] is adopted for speckle filtering.

4.2. Results Comparison

The figure of merit (FoM) is defined to quantitatively evaluate the detection performance of different methods, as:
FoM = F C ( F C + F FA + F M )
where F C indicates the number of correct detections, F FA indicates the number of false alarms, and F M indicates the number of missed detections.
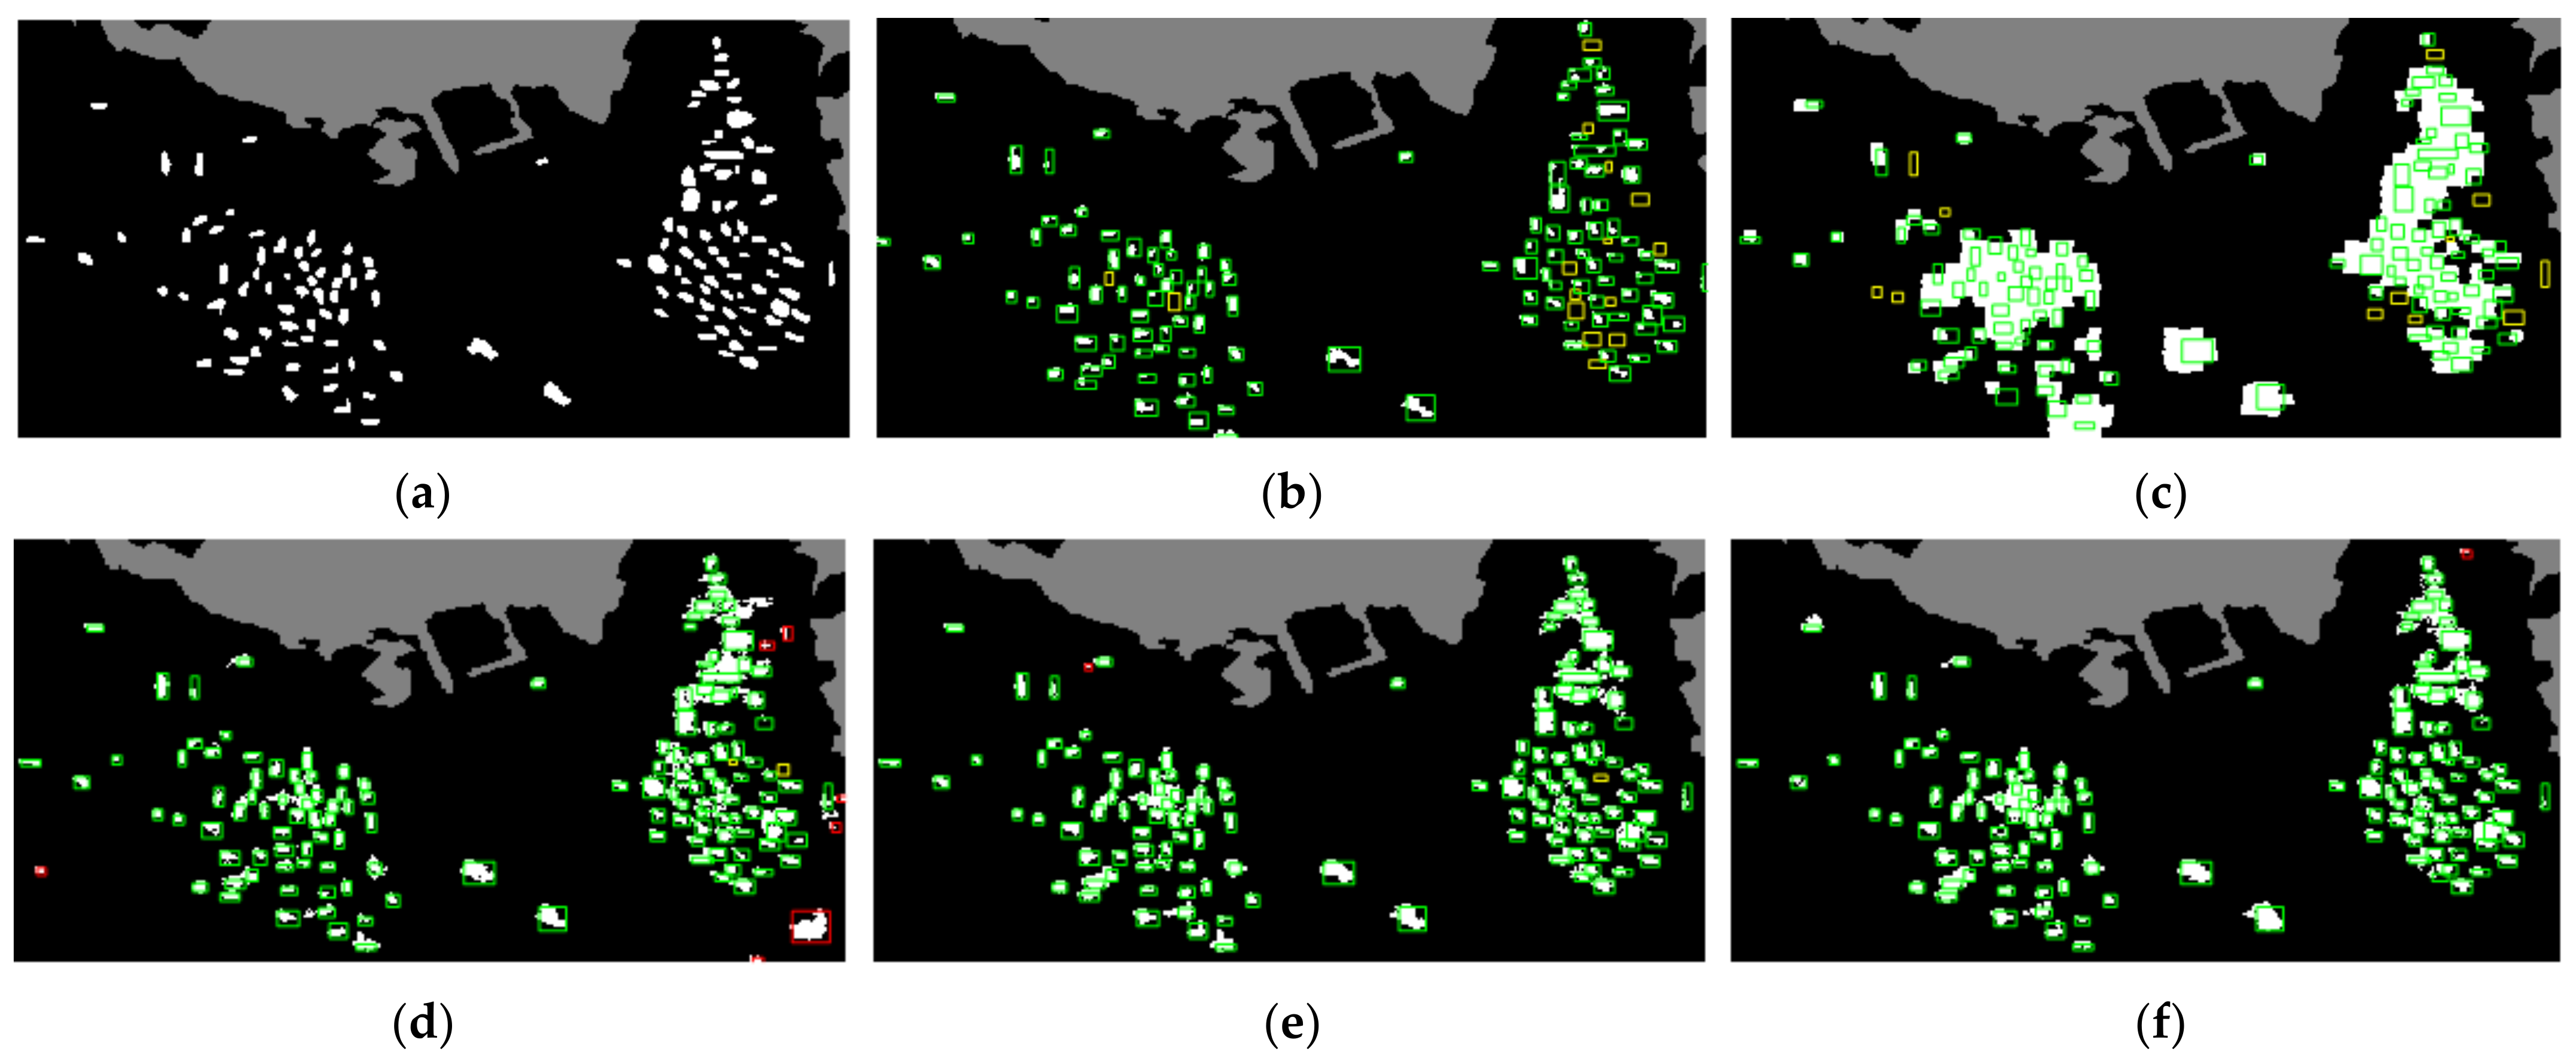
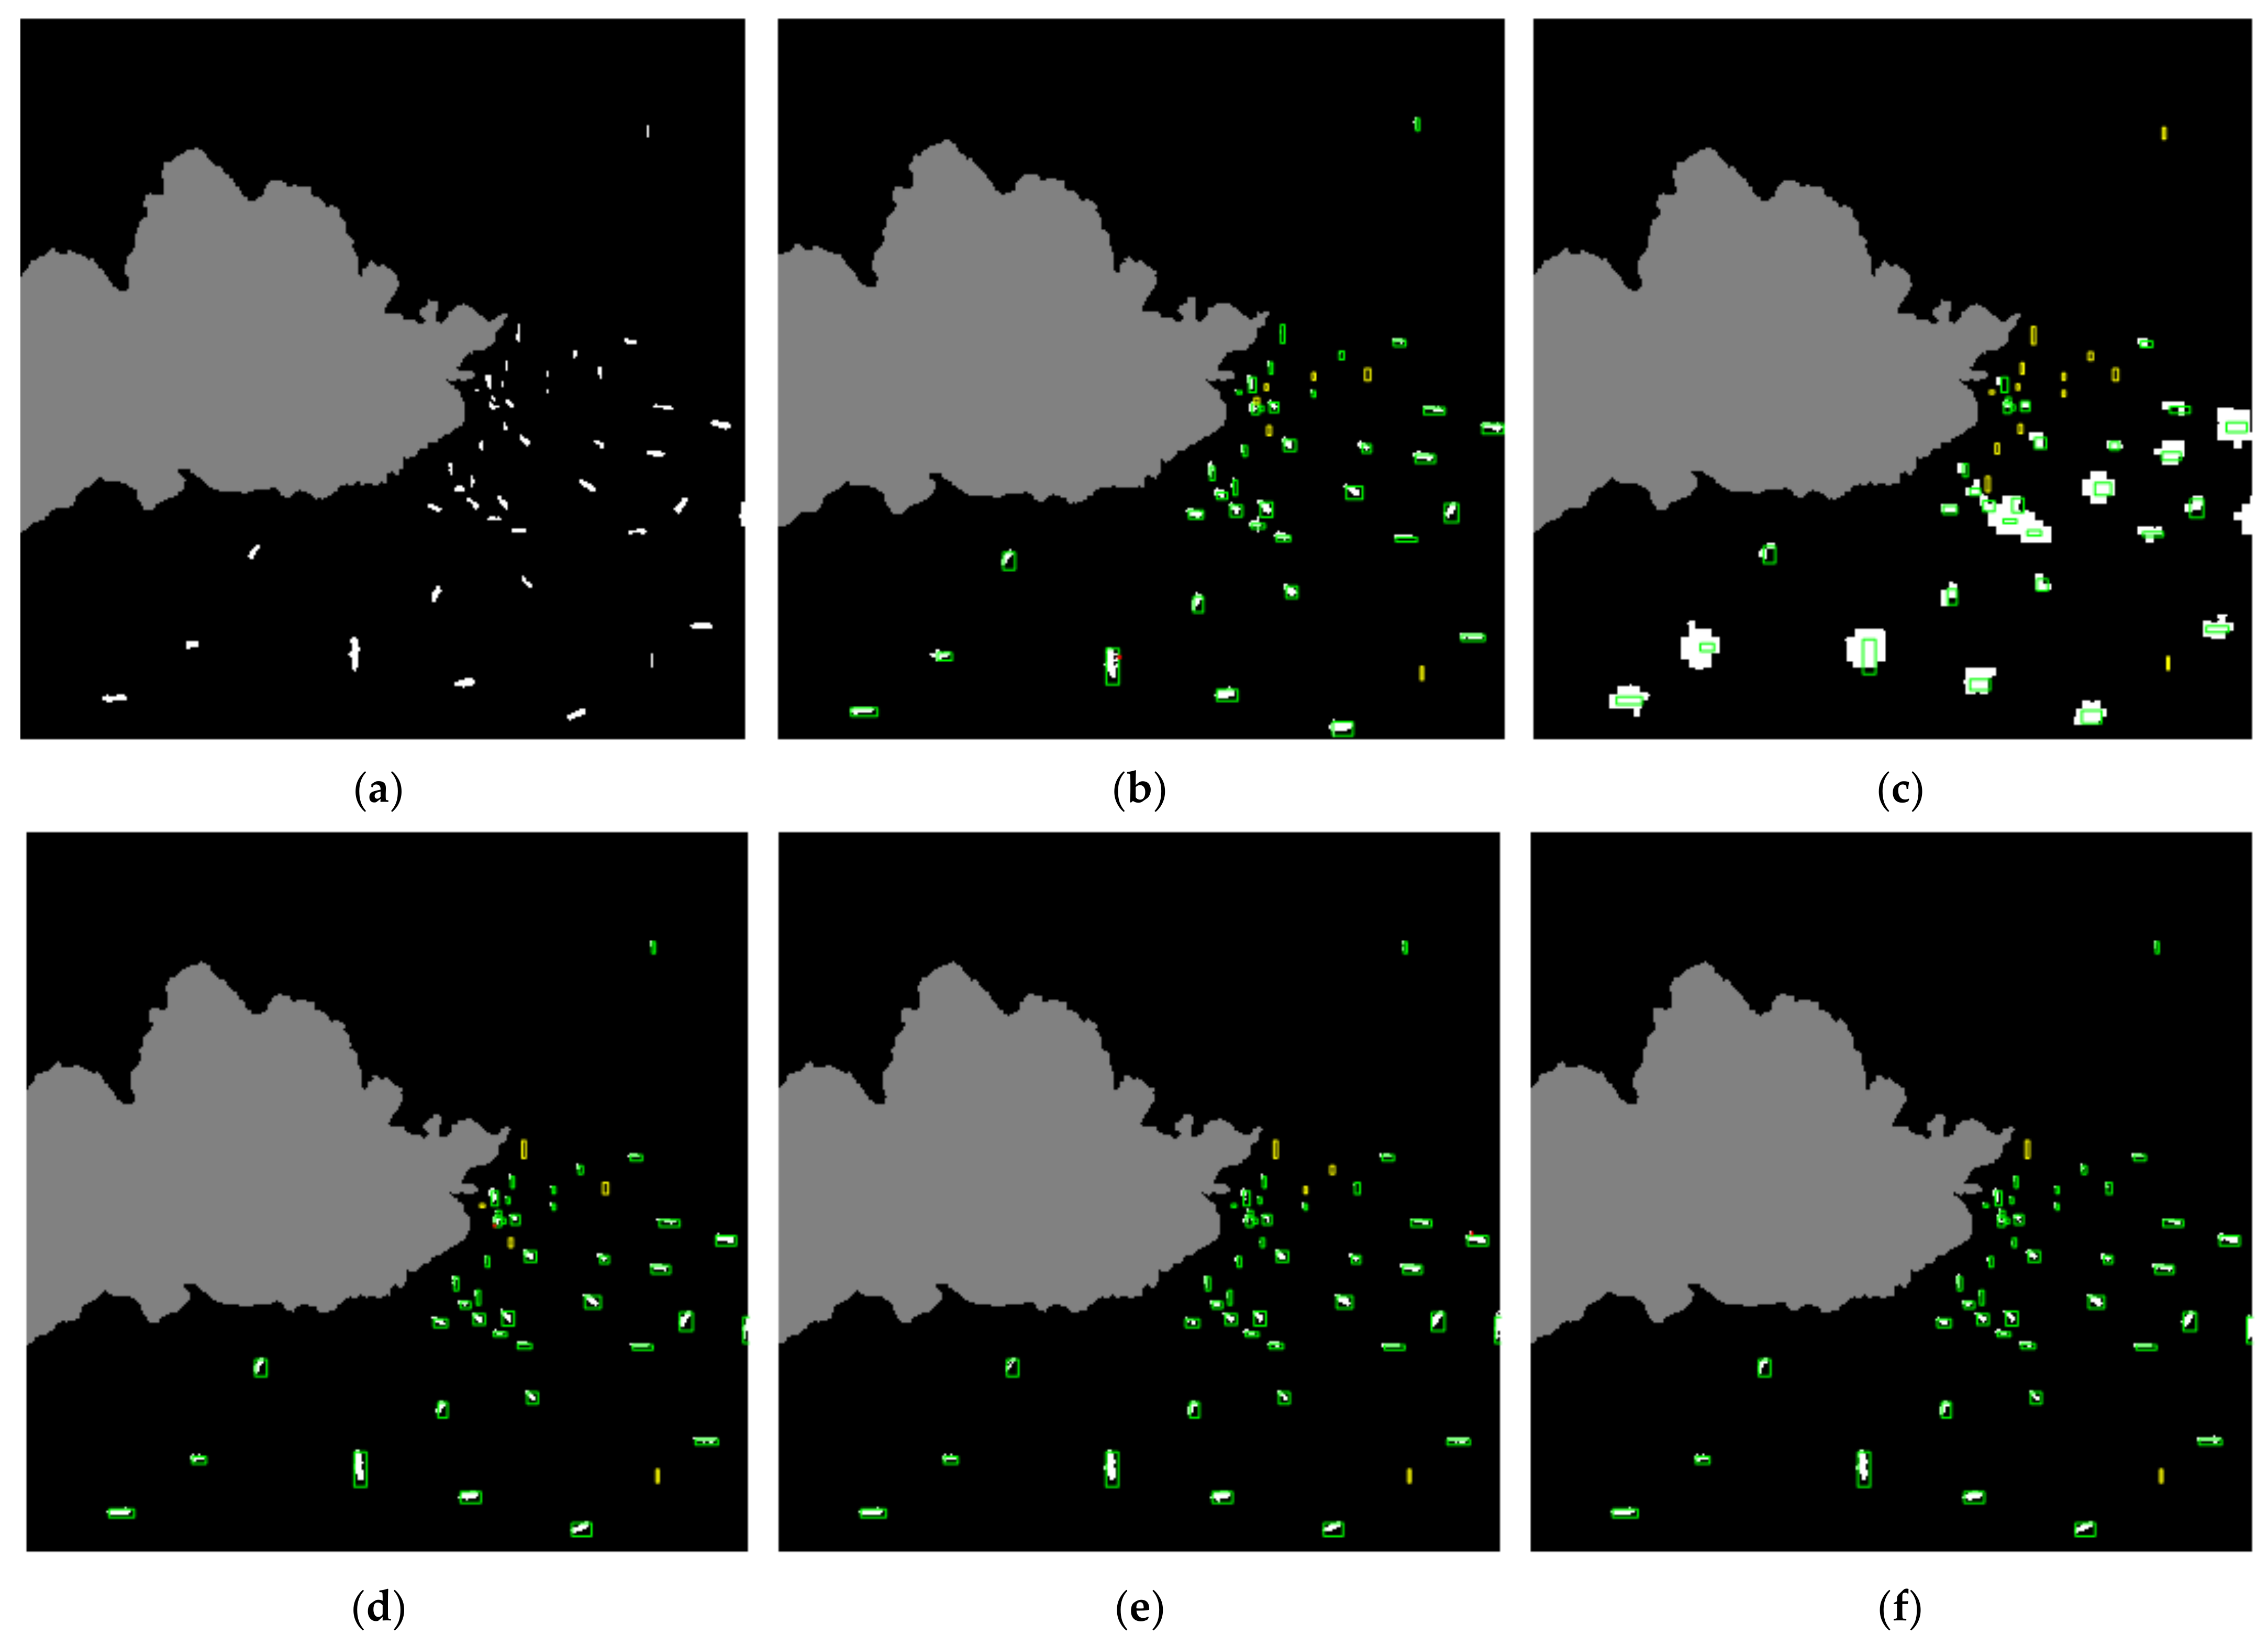
In the experiment, a fixed training set size is used to train the learning machine. 3000 ship pixels and 3000 sea clutter pixels are randomly selected from GF-3 area I as the training set. In the test stage, four kinds of PolSAR datasets are classified and the detection is implemented. Besides, this work is based on the pixel-level detection method, and there can be false alarms caused by independent connected regions in the detection results. These false alarms can come from strong points in the sea clutter region and strong scattering region around the ship target. In the target-level evaluation system, this false alarm can seriously affect the evaluation of detection performance. Therefore, the morphological filtering is used to eliminate the false alarms in small isolated areas. Note that the morphological filtering is used for all methods. According to the number of minimum ship target pixels, less than 10, 30, 15, and 50 pixels are deleted in Radarsat-2 area I, Radarsat-2 area II, GF-3 area I, and GF-3 area II, respectively. The detection results are shown in Figure 8, Figure 9, Figure 10 and Figure 11, where correct detection is marked by a green rectangle, missed detection by a yellow rectangle, and false alarm by a red rectangle. Quantitative results comparison is summarized in Table 2.
For Radarsat-2 area I, the traditional SO-CFAR method is affected by multi-target interference in dense areas, which results in a lot of missed detections, as shown in Figure 8b. The SO-CFAR method has 15 missed detections with FoM of 88.89%. The SP method can protect the whole structure of the target and avoid missed detections caused by structural fracture. However, there is a large number of target aliasing in the dense area, which makes it impossible to distinguish ship targets effectively, as shown in Figure 8c. The SP method produces 12 missed detections with FoM of 91.11%. Compared with the above two methods, the SVM-based methods greatly reduce missed detections. The T3 + SVM method has 2 missed detections, and the PCP + SVM method has 1 missed detection. However, the SVM-based methods also produce some false alarms. The detection result of the proposed method is shown in Figure 8f, which has zero missed detection and 1 false alarm with FoM of 99.26%. Overall, the proposed method is better than the performance of the T3 + SVM method and the PCP + SVM method, and far better than the SO-CFAR method and the SP method.
For the Radarsat-2 area II, the SO-CFAR method and the SP method produce 2 and 3 missed detections, respectively. The SVM-based methods do not have missed detections. However, the T3 + SVM method produces 16 false alarms, and its FoM is only 69.23%, which is the lowest among all methods. The PCP + SVM method produces 1 false alarm with FoM of 97.30%. The detection result of the proposed method is shown in Figure 9f. This proposed method effectively suppresses the false alarms in the detection results of the T3 + SVM and the PCP + SVM methods. The FoM of the proposed method is the highest among all methods, reaching 100%.
In GF-3 area I, the SP method has the most missed detections with the lowest FoM among all methods. Most of the missed detection areas are small ship targets, and the detection results of the SP method have the phenomenon of target mixing. The SO-CFAR method produces 6 missed detections and 1 false alarm, and its FoM is 84.09%. Compared with the SO-CFAR and the SP methods, the FoM of the SVM-based methods is more than 85%. Among them, the T3 + SVM method produces 5 missed detections with FoM of 86.67%. The PCP + SVM method produces 3 missed detections with FoM of 88.89%. Specially, the detection result of the proposed method has only 2 missed detections, which achieves the best detection performance.
For the GF-3 area II, due to the low contrast of ship and sea clutter, the traditional SO-CFAR method produces 60 missed detections with FoM of 75.21%, shown in Figure 11b. Similar to Radarsat-2 area I, the SP method produces the target aliasing in detection results, shown in Figure 11c. There are 22 missed detections in the SP method. Compared with the SO-CFAR method, the performance of the SP method is significantly improved with FoM of 90.91%. The SVM-based method greatly reduces missed detections, while producing few false alarms. The T3 + SVM method has 9 missed detections and 2 false alarms with FoM of 95.49%. The PCP + SVM method has 5 missed detections and 1 false alarm with FoM of 97.53%. The detection result of the proposed method has only 2 missed detections and 3 false alarms with the highest FoM of 97.96%, which further verifies the performance advantages of the proposed method.
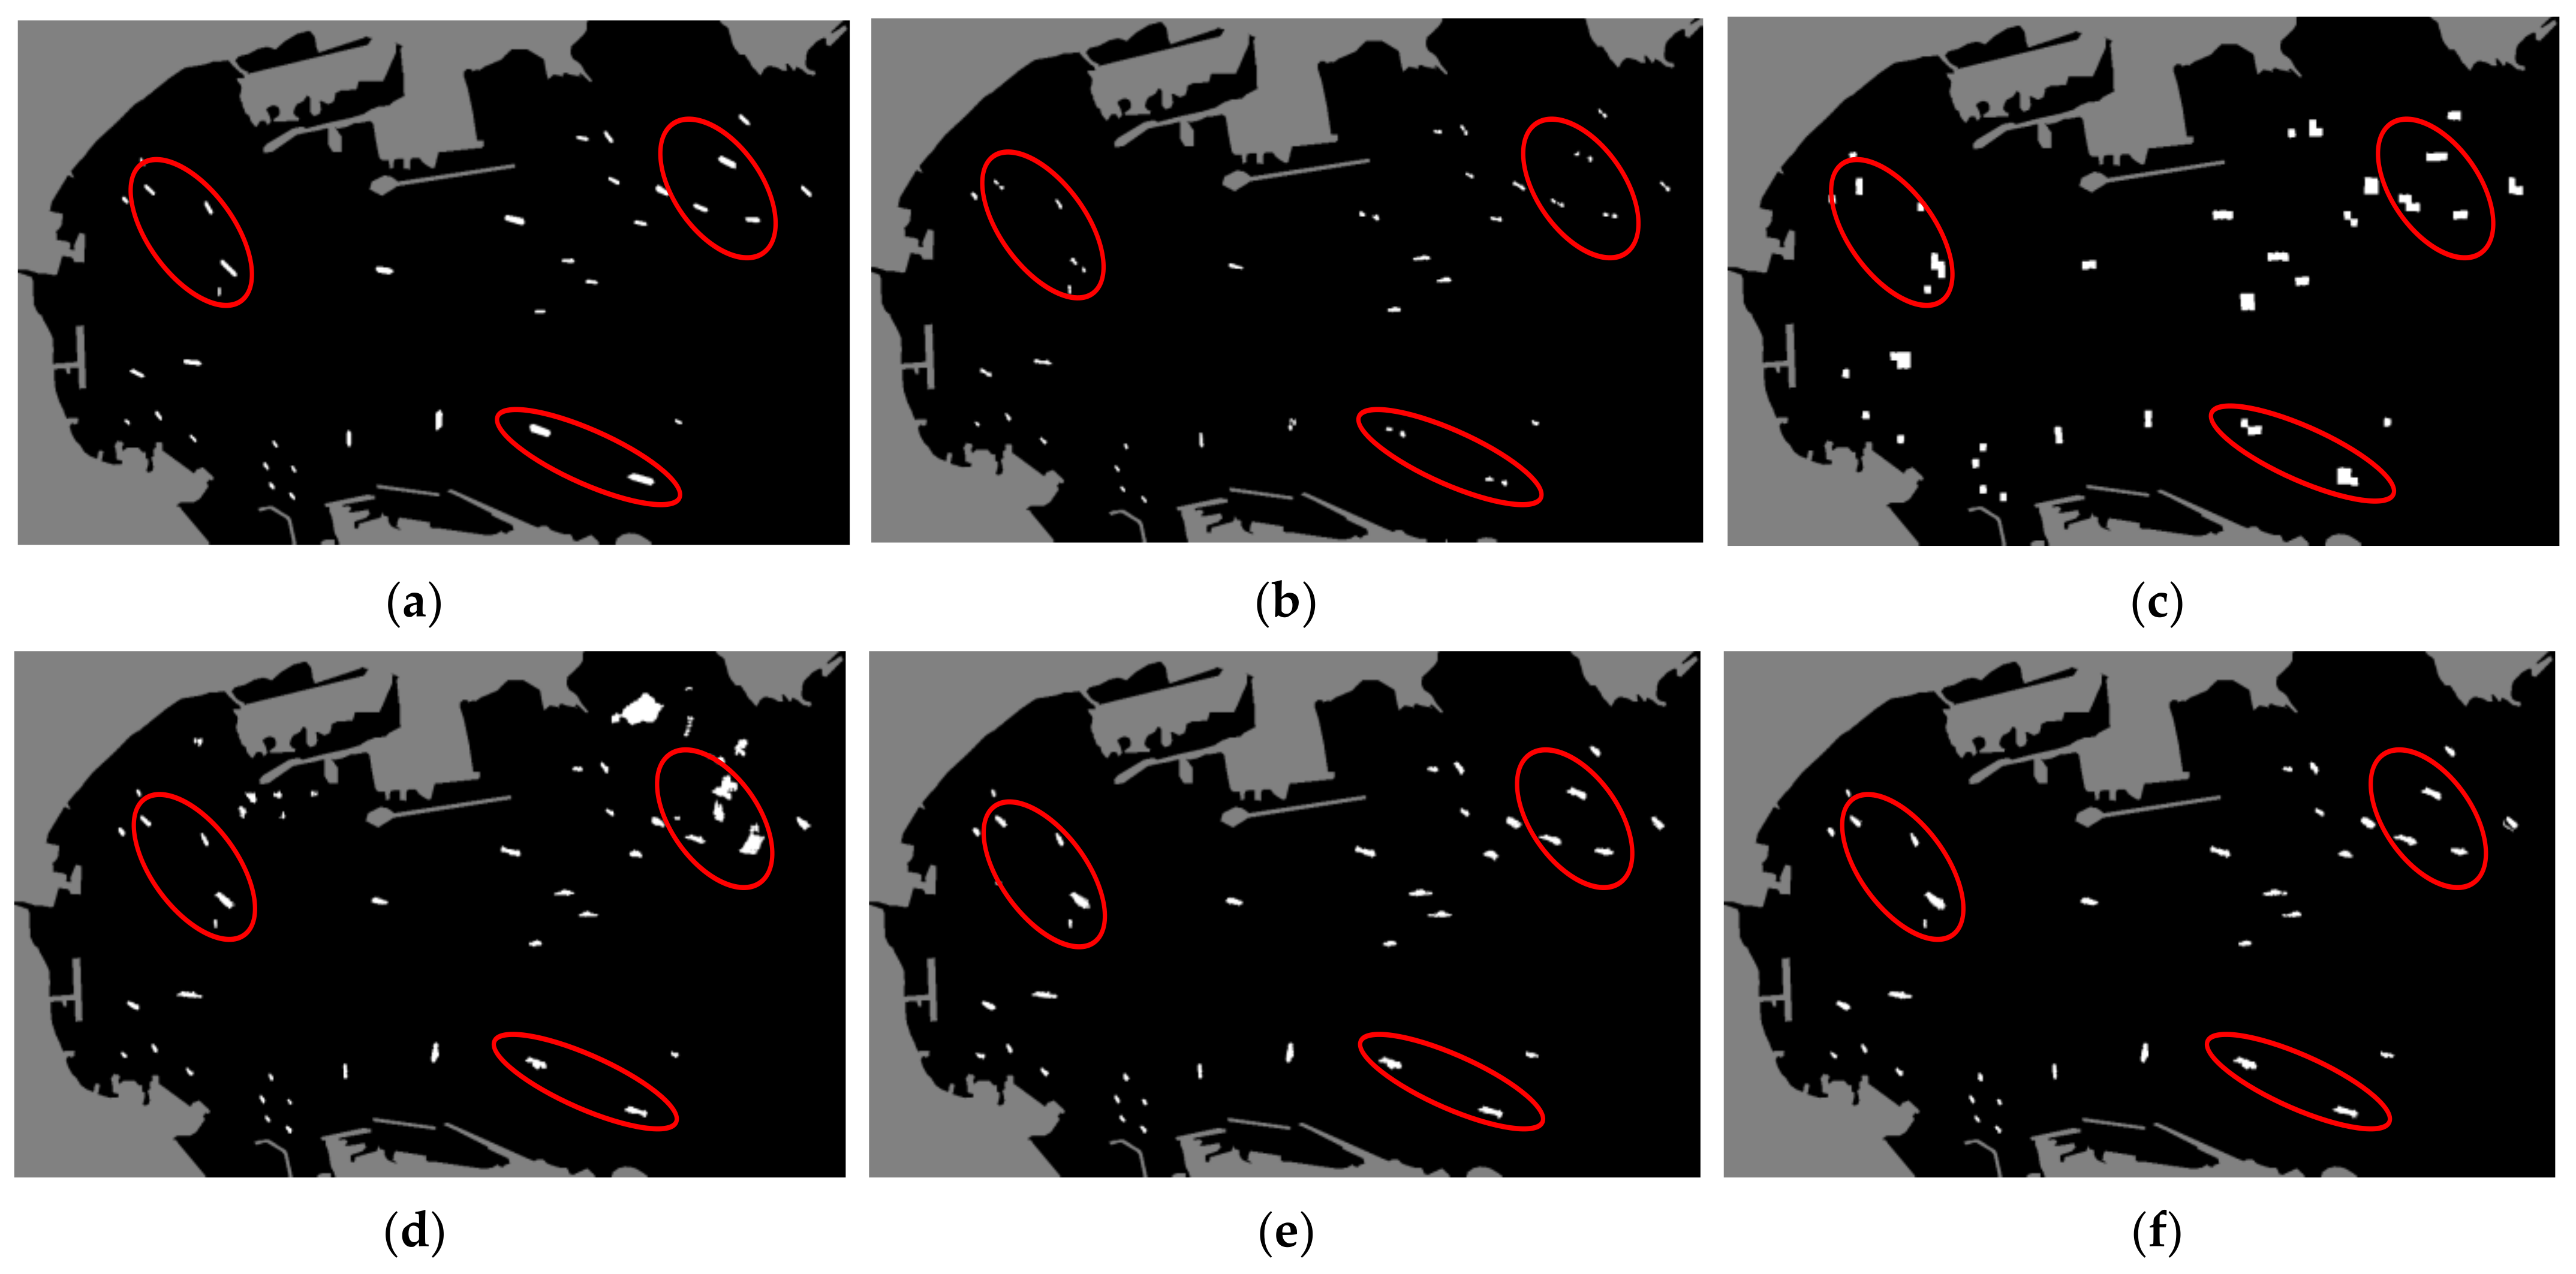
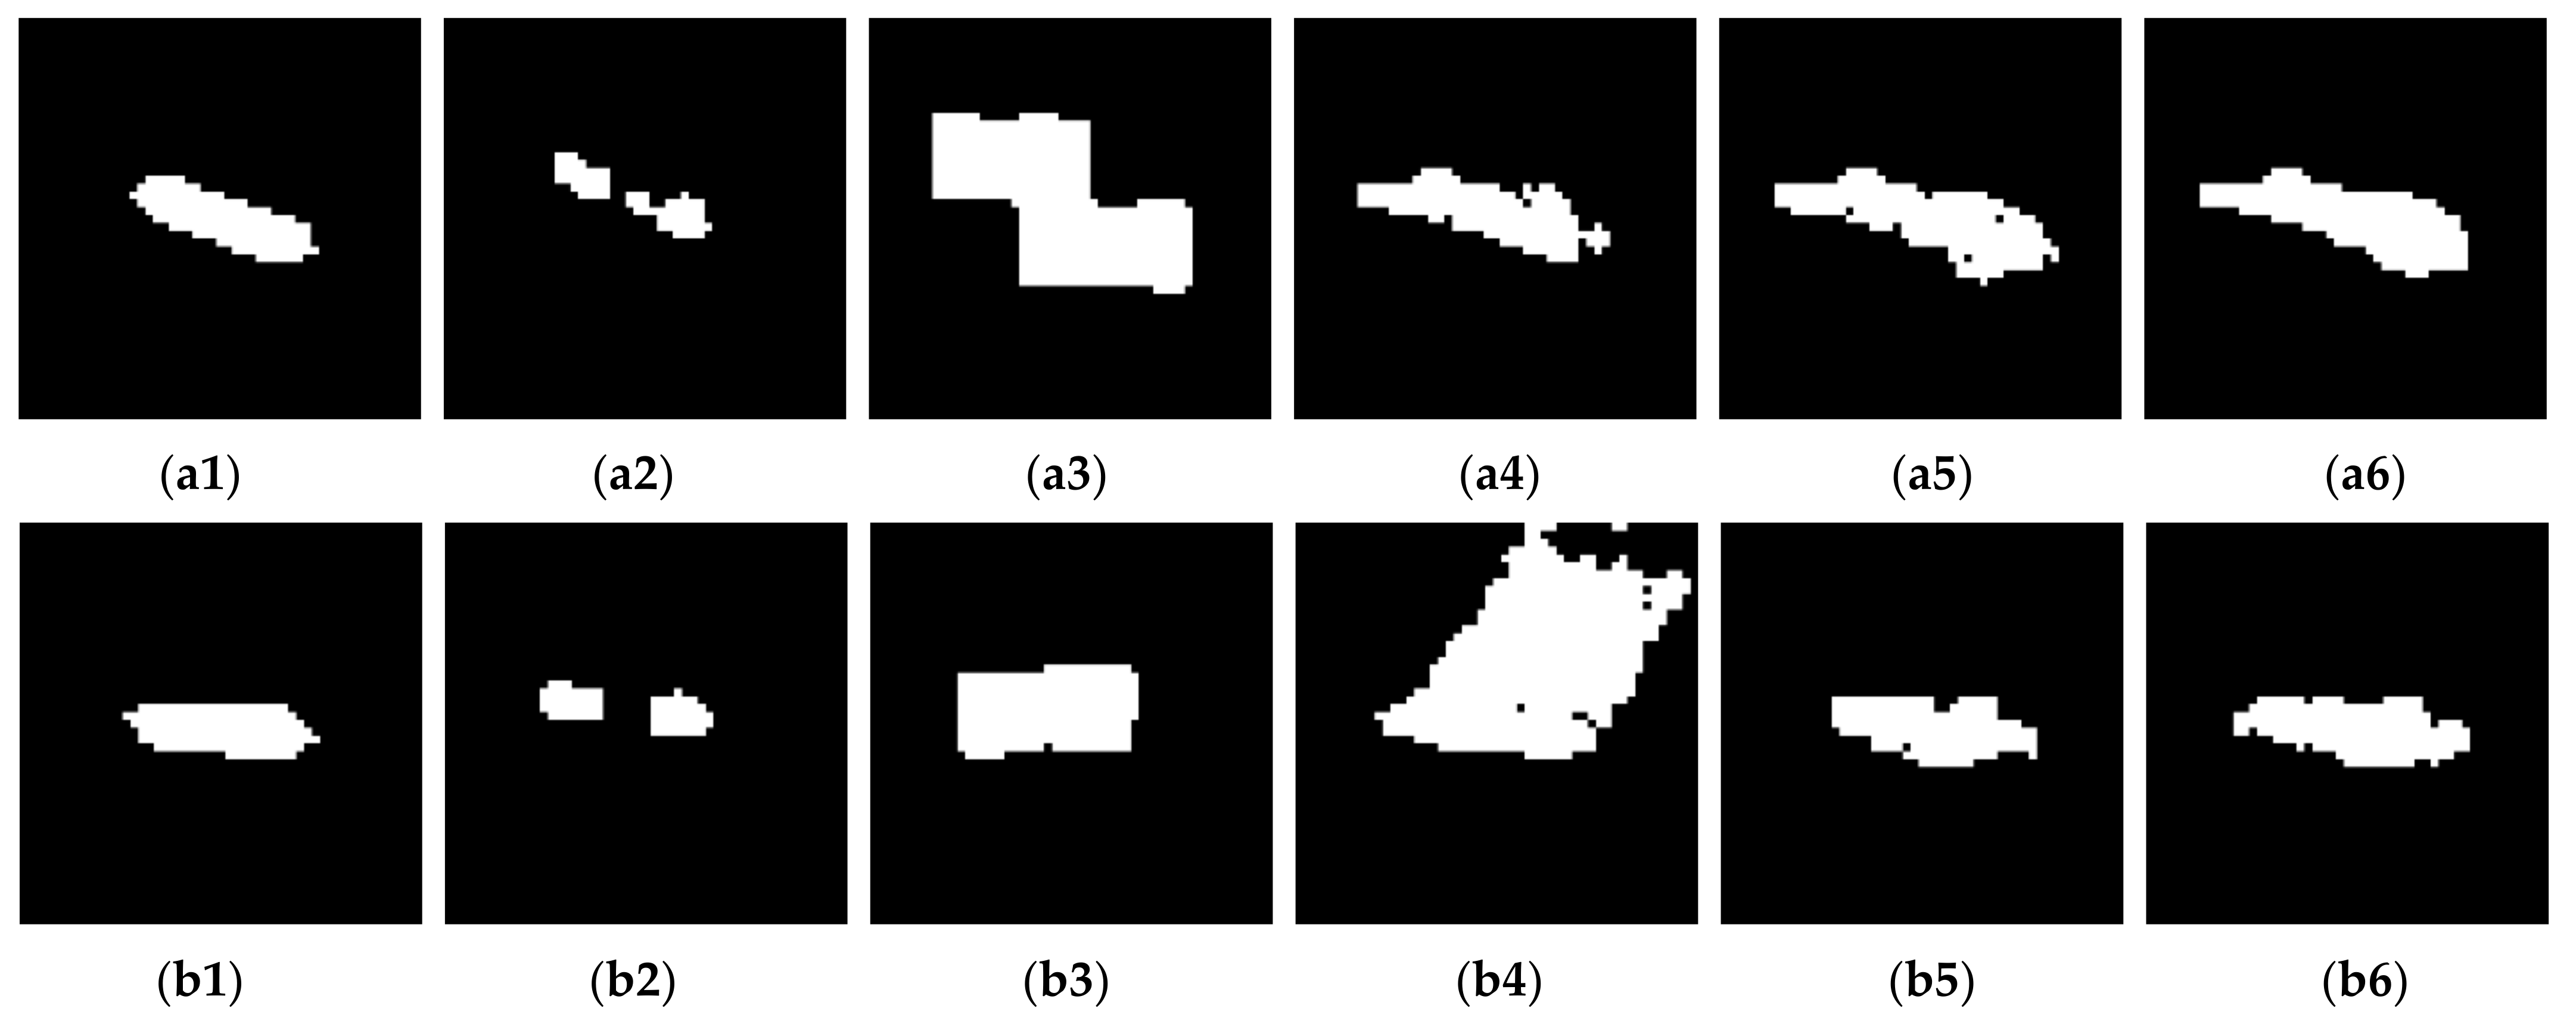
The proposed method has good detection performance in the target-level evaluation system by the above comparative experiment. In addition, the proposed method also has good effects in pixel-level systems. Ship detection results from Radarsat-2 area II are illustrated as an example, which is shown in Figure 12. The main differences between each method have been marked with red ellipses. Due to the influence of the target sidelobe and sea clutter, the SO-CAFAR method has fracture phenomenon and the SP method inflates the target structure. On the contrary, the SVM-based methods can detect ship target correctly both in target-level and pixel-level. To analyze the performance of the SVM-based methods, the detection results of six ship targets are selected from Radarsat-2 area II, shown in Figure 13. The T3 + SVM method is affected by the pixels around the target, which produces false alarms, shown in Figure 13(b4,c4). For the PCP + SVM method, some pixels in the interior and edge of the ships are classified as sea clutter, shown in Figure 13(a5–b5). Compared with the ground-truth images and comparison methods, the proposed method can accurately detect ship target pixels, which provides the basis for subsequent geometric feature extraction and ship recognition.
Comparison of the SO-CFAR method, SP method, and SVM-based method with other polarimetric features clearly demonstrates the superiority of the proposed detection methodology. The proposed method has the best detection performance, especially for inshore dense ship discrimination, which benefits from the optimal combination of polarimetric rotation domain features. Compared with the T3 and correlation parameters, the optimal polarimetric rotation domain features have better robustness, and the proposed detection methodology is suitable for cross-domain PolSAR images.

5. Discussion

To verify the robustness of the proposed method, the experiments are repeated using different training sets. Since Radarsat-2 area I is an inshore dense ship area and crosstalk exists between the ship and sea clutter, it is not considered the training set. The same number of training sets (3000 ship pixels and 3000 sea clutter pixels) are selected from GF-3 area II and Radarsat-2 area II. In the test stage, four kinds of PolSAR datasets are classified and the detection is implemented. Quantitative results’ comparison with the GF-3 area II and Radarsat-2 area II training sets are shown in Table 3 and Table 4, respectively.
When the training set is GF-3 area II, the performance of the T3 + SVM method and the PCP + SVM method decrease significantly. The T3 + SVM method and PCP + SVM method produce a lot of false alarms for the Radarsat-2 area. The proposed method, especially, still maintains good detection performance with FoM of 98.56%, 94.74, 97.73, and 98.78 in Radarsat-2 area I, Radarsat-2 area II, GF-3 area I, and GF-3 area II, respectively.
Similar results are observed when the training set is the Radarsat-2 area II. The T3 + SVM method and the PCP + SVM method produce a lot of missed detections for GF-3 area I with FoM of 66.67% and 68.18%, and for GF-3 area II with FoM of 81.13% and 85.54%, respectively. The detection results of the proposed method have the highest FoM of 95.45% and 94.24%, which achieves the best detection performance. This shows that the optimal combination of polarimetric rotation domain features has better robustness compared with the T3 and the correlation parameters. The superiority of the proposed method is further verified.
Although the proposed method has obvious advantages and better robustness compared with the comparison methods, future work is still needed to enhance the detection performance. The core idea of this work is to mine the scattering diversity of the target. Thus, the optimal feature set is selected within polarimetric rotation domain features, T3 elements and SPAN. Other features derived from polarimetric target decomposition [11,12,13] are not considered in this work. Proper combination of the above-mentioned features may further promote detection performance, which will be explored in another work. Moreover, the SVM classifier is adopted in this work, which has demonstrated the effectiveness of the selected optimal feature set. Recently, deep-learning-based ship detectors, which have more robustness, have been receiving great attention [25,26,27]. In this vein, rotation domain features could also derive deep-learning-based ship detectors to achieve even better performance.

6. Conclusions

A novel PolSAR ship detection scheme with optimal combination of polarimetric rotation domain features and SVM is established. The hidden information between arbitrary two polarization channels in rotation domain is explored by the interpretation tools of polarimetric coherence and correlation pattern techniques. The optimal polarimetric rotation domain features, which have strong ability to distinguish between ship and sea clutter, are selected by the Relief method. The detection results are available by the SVM classifier based on the selected polarimetric features. Comparison studies with four kinds of spaceborne PolSAR datasets from Radarsat-2 and GF-3 clearly demonstrate the superiority of the proposed detection method. The FoM index reaches 99.26%, 100%, 95.45%, and 99.96%, respectively. Future work will focus on ship detection with low TCR and exploration of polarimetric rotation domain features for other PolSAR applications.

Author Contributions

H.L., S.C. and X.C. provided ideas; H.L. validated the idea and established the algorithm; H.L., X.C. and S.C. designed the experiment; X.C. analyzed the results of the experiment; H.L. and X.C. wrote the paper. All authors have read and agreed to the published version of the manuscript.

Funding

This research was funded in part by the National Natural Science Foundation of China (62122091 and 61771480), the Natural Science Foundation of Hunan Province (2020JJ2034), and the Science and Technology Planning Project of Hunan Province (2019RS2025).

Institutional Review Board Statement

Not applicable.

Informed Consent Statement

Not applicable.

Data Availability Statement

Not applicable.

Acknowledgments

The authors would like to thank the First Institute of Oceanography, Qingdao, China, for providing the GF-3 datasets. The authors would also like to thank the editors and anonymous reviewers for their constructive suggestions, which greatly contributed to improving this paper.

Conflicts of Interest

The authors declare no conflict of interest.

References

  1. Zhang, T.; Ji, J.; Li, X.; Yu, W.; Xiong, H. Ship Detection From PolSAR Imagery Using the Complete Polarimetric Covariance Difference Matrix. IEEE Trans. Geosci. Remote Sens. 2019, 57, 2824–2839. [Google Scholar] [CrossRef]
  2. Xi, Y.; Lang, H.; Tao, Y.; Huang, L.; Pei, Z. Four-Component Model-Based Decomposition for Ship Targets Using PolSAR Data. Remote Sens. 2017, 9, 621. [Google Scholar] [CrossRef] [Green Version]
  3. Zhang, T.; Yang, Z.; Xiong, H. PolSAR Ship Detection Based on the Polarimetric Covariance Difference Matrix. IEEE J. Sel. Top. Appl. Earth Obs. Remote Sens. 2017, 10, 3348–3359. [Google Scholar] [CrossRef]
  4. Schwegmann, C.P.; Kleynhans, W.; Salmon, B.P. Manifold Adaptation for Constant False Alarm Rate Ship Detection in South African Oceans. IEEE J. Sel. Top. Appl. Earth Obs. Remote Sens. 2015, 8, 3329–3337. [Google Scholar] [CrossRef] [Green Version]
  5. Gao, G.; Liu, L.; Zhao, L.; Shi, G.; Kuang, G. An Adaptive and Fast CFAR Algorithm Based on Automatic Censoring for Target Detection in High-Resolution SAR Images. IEEE Trans. Geosci. Remote Sens. 2009, 47, 1685–1697. [Google Scholar] [CrossRef]
  6. Trunk, G.V. Range Resolution of Targets Using Automatic Detectors. IEEE Trans. Aerosp. Electron. Syst. 1978, AES-14, 750–755. [Google Scholar] [CrossRef]
  7. Nicolas, J.-M.; Anfinsen, S. Introduction to Second Kind Statistics: Application of Log-Moments and Log-Cumulants to Analysis of Radar Images. Traitement du Signal 2002, 3. [Google Scholar]
  8. Novak, L.M.; Burl, M.C.; Irving, W.W. Optimal polarimetric processing for enhanced target detection. IEEE Trans. Aerosp. Electron. Syst. 1993, 29, 234–244. [Google Scholar] [CrossRef]
  9. Velotto, D.; Nunziata, F.; Migliaccio, M.; Lehner, S. Dual-Polarimetric TerraSAR-X SAR Data for Target at Sea Observation. IEEE Geosci. Remote Sens. Lett. 2013, 10, 1114–1118. [Google Scholar] [CrossRef]
  10. Marino, A. A Notch Filter for Ship Detection With Polarimetric SAR Data. IEEE J. Sel. Top. Appl. Earth Obs. Remote Sens. 2013, 6, 1219–1232. [Google Scholar] [CrossRef] [Green Version]
  11. Ringrose, R.; Harris, N. Ship Detection Using Polarimetric SAR Data. European Space Agency Esa Sp 2000, 450, 687. [Google Scholar]
  12. Touzi, R.; Charbonneau, F.; Hawkins, R.K.; Murnaghan, K.; Kavoun, X. Ship-sea contrast optimization when using polarimetric SARs. In Proceedings of the IEEE 2001 International Geoscience and Remote Sensing Symposium, Sydney, NSW, Australia, 9–13 July 2001; pp. 426–428. [Google Scholar]
  13. Sugimoto, M.; Ouchi, K.; Nakamura, Y. On the novel use of model-based decomposition in SAR polarimetry for target detection on the sea. Remote Sens. Lett. 2013, 4, 843–852. [Google Scholar] [CrossRef]
  14. Chen, S.; Wang, X.; Xiao, S.; Sato, M. Target Scattering Mechanism in Polarimetric Synthetic Aperture Radar: Interpretation and Application; Springer: Singapore, 2018. [Google Scholar]
  15. Lee, J.S.; Pottier, E. Polarimetric Radar Imaging: From Basics to Applications; CRC Press: Boca Raton, FL, USA, 2009. [Google Scholar]
  16. Nunziata, F.; Migliaccio, M.; Brown, C.E. Reflection Symmetry for Polarimetric Observation of Man-Made Metallic Targets at Sea. IEEE J. Ocean. Eng. 2012, 37, 384–394. [Google Scholar] [CrossRef]
  17. Cui, X.; Su, Y.; Chen, S. A Saliency Detector for Polarimetric SAR Ship Detection Using Similarity Test. IEEE J. Sel. Top. Appl. Earth Obs. Remote Sens. 2019, 12, 3423–3433. [Google Scholar] [CrossRef]
  18. Zhai, L.; Li, Y.; Su, Y. Inshore Ship Detection via Saliency and Context Information in High-Resolution SAR Images. IEEE Geosci. Remote Sens. Lett. 2016, 13, 1870–1874. [Google Scholar] [CrossRef]
  19. Li, T.; Liu, Z.; Xie, R.; Ran, L. An Improved Superpixel-Level CFAR Detection Method for Ship Targets in High-Resolution SAR Images. IEEE J. Sel. Top. Appl. Earth Obs. Remote Sens. 2018, 11, 184–194. [Google Scholar] [CrossRef]
  20. Zhang, Y.; Du, B.; Zhang, L.; Wang, S. A Low-Rank and Sparse Matrix Decomposition-Based Mahalanobis Distance Method for Hyperspectral Anomaly Detection. IEEE Trans. Geosci. Remote Sens. 2016, 54, 1376–1389. [Google Scholar] [CrossRef]
  21. Qu, Y.; Guo, R.; Wang, W.; Qi, H.; Ayhan, B.; Kwan, C.; Vance, S. Anomaly detection in hyperspectral images through spectral unmixing and low rank decomposition. In Proceedings of the 2016 IEEE International Geoscience and Remote Sensing Symposium (IGARSS), Beijing, China, 10–15 July 2016; pp. 1855–1858. [Google Scholar]
  22. He, J.; Wang, Y.; Liu, H.; Wang, N.; Wang, J. A Novel Automatic PolSAR Ship Detection Method Based on Superpixel-Level Local Information Measurement. IEEE Geosci. Remote Sens. Lett. 2018, 15, 384–388. [Google Scholar] [CrossRef]
  23. Xing, X.; Ji, K.; Zou, H.; Sun, J. Feature selection and weighted SVM classifier-based ship detection in PolSAR imagery. Int. J. Remote Sens. 2013, 34, 7925–7944. [Google Scholar] [CrossRef]
  24. Zou, B.; Qiu, Y.; Zhang, L. Ship Detection Using PolSAR Images Based on Simulated Annealing by Fuzzy Matching. IEEE Geosci. Remote Sens. Lett. 2021, 1–5. [Google Scholar] [CrossRef]
  25. Cui, Z.; Li, Q.; Cao, Z.; Liu, N. Dense Attention Pyramid Networks for Multi-Scale Ship Detection in SAR Images. IEEE Trans. Geosci. Remote Sens. 2019, 57, 8983–8997. [Google Scholar] [CrossRef]
  26. Lin, Z.; Ji, K.; Leng, X.; Kuang, G. Squeeze and Excitation Rank Faster R-CNN for Ship Detection in SAR Images. IEEE Geosci. Remote Sens. Lett. 2019, 16, 751–755. [Google Scholar] [CrossRef]
  27. Wei, S.; Su, H.; Ming, J.; Wang, C.; Yan, M.; Kumar, D.; Shi, J.; Zhang, X. Precise and Robust Ship Detection for High-Resolution SAR Imagery Based on HR-SDNet. Remote Sens. 2020, 12, 167. [Google Scholar] [CrossRef] [Green Version]
  28. Chen, S.; Wang, X.; Sato, M. Uniform polarimetric matrix rotation theory and its applications. IEEE Trans. Geosci. Remote Sens. 2014, 52, 4756–4770. [Google Scholar] [CrossRef]
  29. Chen, S. Polarimetric Coherence Pattern: A Visualization and Characterization Tool for PolSAR Data Investigation. IEEE Trans. Geosci. Remote Sens. 2018, 56, 286–297. [Google Scholar] [CrossRef]
  30. Cui, X.C.; Tao, C.S.; Su, Y.; Chen, S.W. PolSAR Ship Detection Based on Polarimetric Correlation Pattern. IEEE Geosci. Remote Sens. Lett. 2021, 18, 471–475. [Google Scholar] [CrossRef]
  31. Chen, S.; Wang, X.; Xiao, S. Urban Damage Level Mapping Based on Co-Polarization Coherence Pattern Using Multitemporal Polarimetric SAR Data. IEEE J. Sel. Top. Appl. Earth Obs. Remote Sens. 2018, 11, 2657–2667. [Google Scholar] [CrossRef]
  32. Chen, S.; Tao, C. PolSAR Image Classification Using Polarimetric-Feature-Driven Deep Convolutional Neural Network. IEEE Geosci. Remote Sens. Lett. 2018, 15, 627–631. [Google Scholar] [CrossRef]
  33. Touzi, R.; Lopes, A.; Bruniquel, J.; Vachon, P.W. Coherence estimation for SAR imagery. IEEE Trans. Geosci. Remote Sens. 1999, 37, 135–149. [Google Scholar] [CrossRef] [Green Version]
  34. Kononenko, I. Estimating attributes: Analysis and extensions of RELIEF. In Proceedings of the European Conference on Machine Learning, Catania, Italy, 6–8 April 2021; Springer: Berlin/Heidelberg, Germany, 1994; pp. 171–182. [Google Scholar]
  35. Chang, C.C.; Lin, C.J. LIBSVM: A library for support vector machines. ACM Trans. Intell. Syst. Technol. 2007, 2, 1–27. [Google Scholar] [CrossRef]
  36. Chen, S.; Wang, X.; Sato, M. PolInSAR Complex Coherence Estimation Based on Covariance Matrix Similarity Test. IEEE Trans. Geosci. Remote Sens. 2012, 50, 4699–4710. [Google Scholar] [CrossRef]
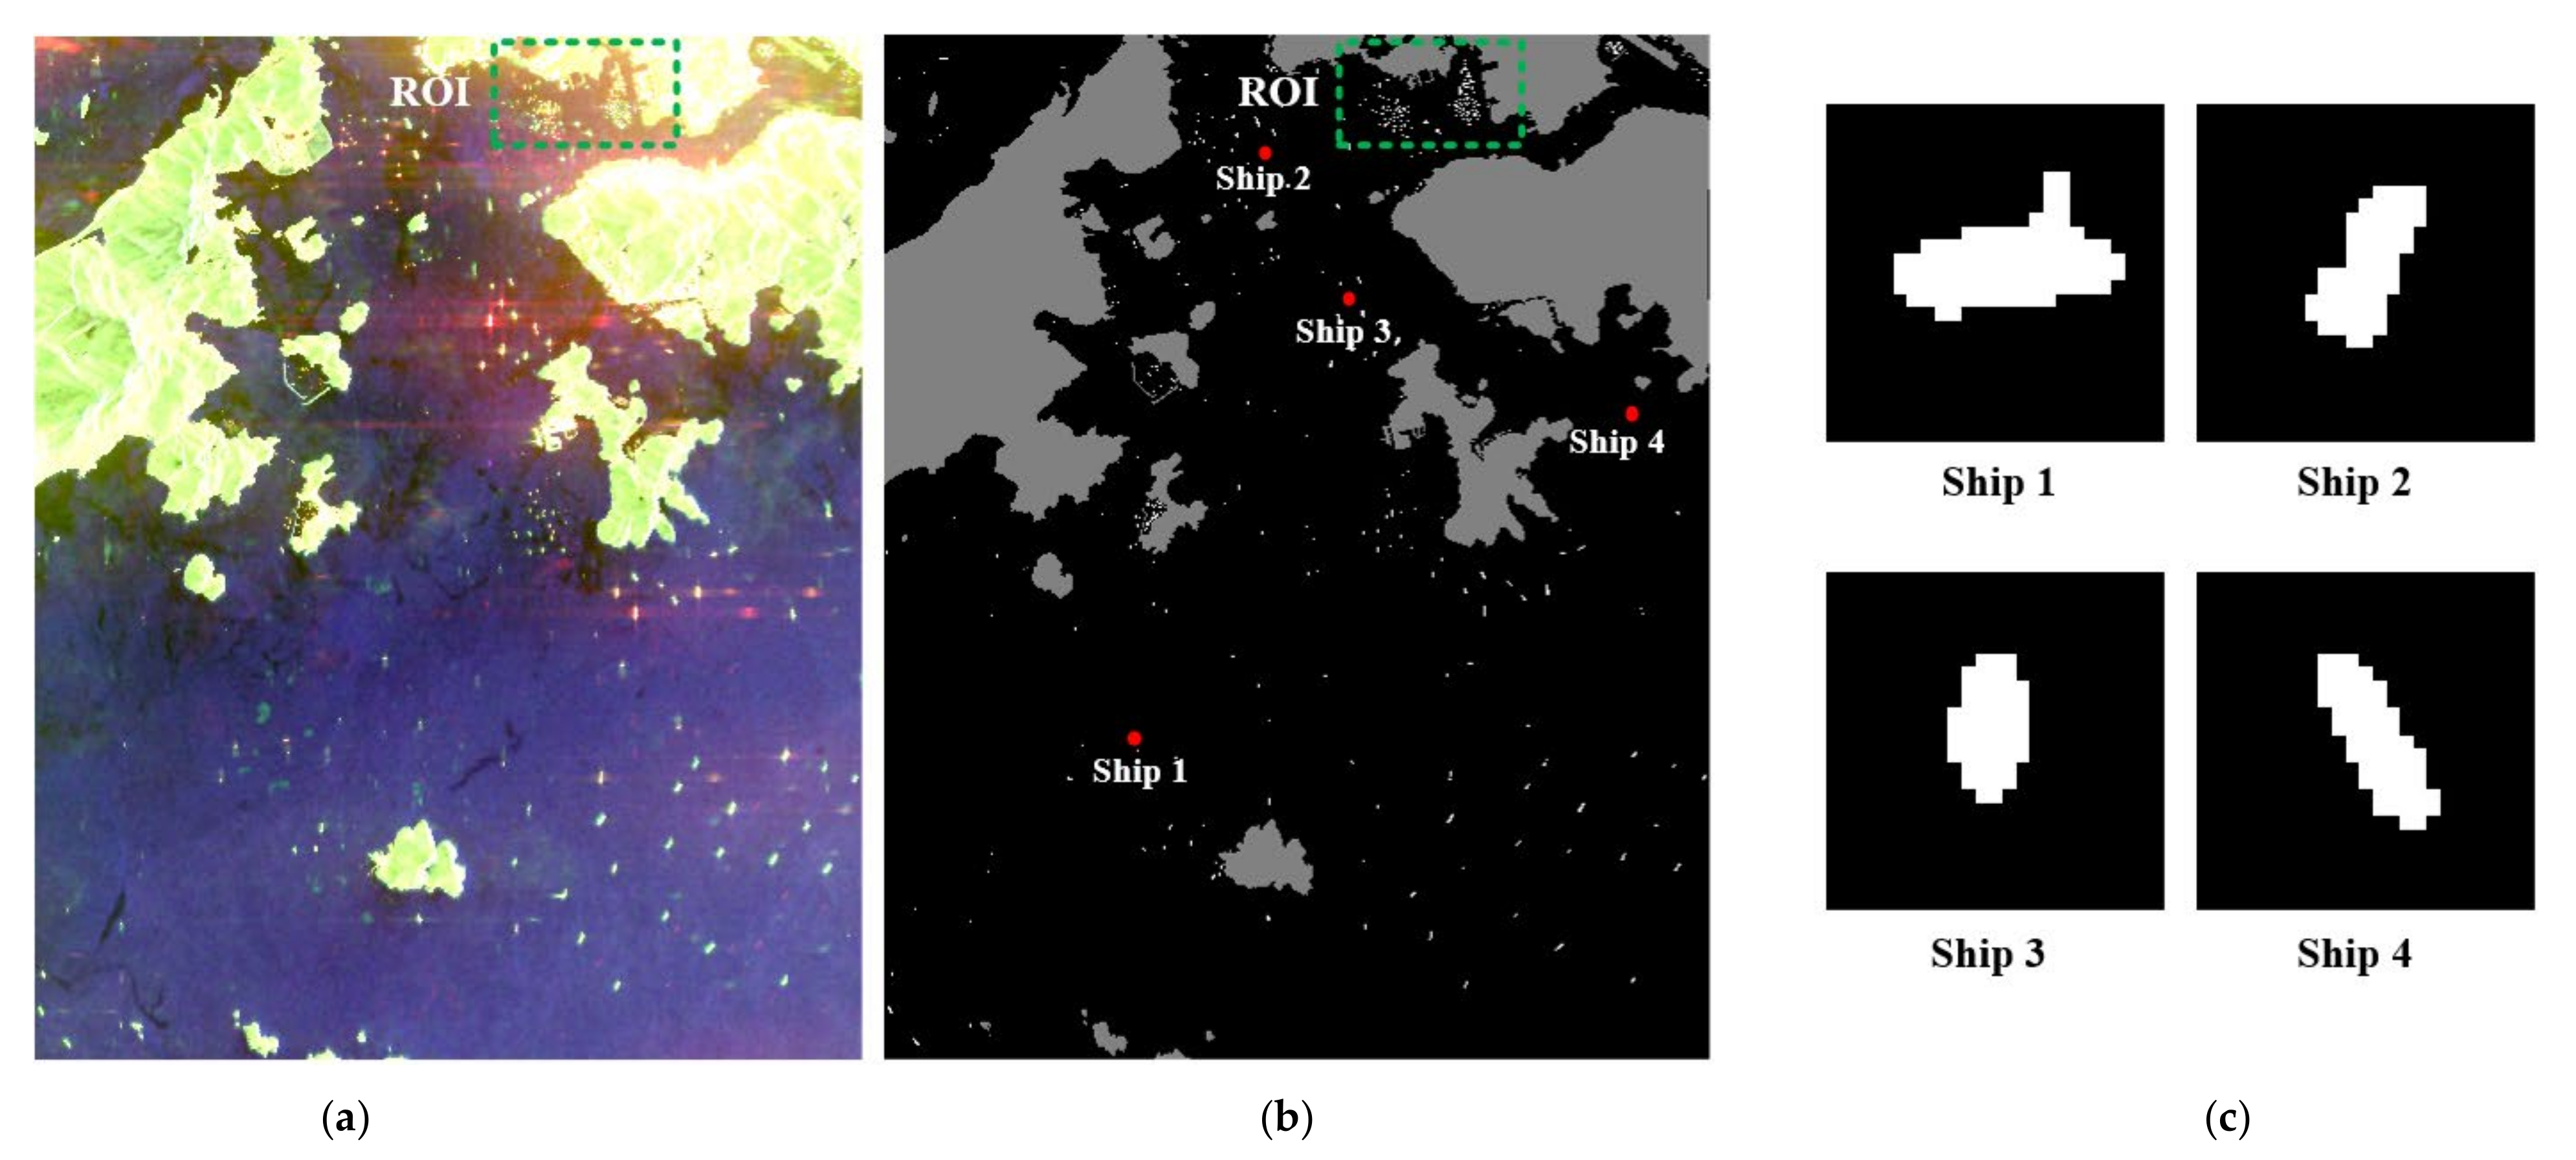
Figure 1. Radarsat-2 PolSAR dataset. (a) Pauli RGB image. (b) Ground-truth image. (c) Ground-truth images of selected ship slices.
Remotesensing 13 03932 g001
Figure 2. GF-3 PolSAR dataset. (a) Pauli RGB image. (b) Ground-truth image. (c) Ground-truth images of selected ship slices.
Remotesensing 13 03932 g002
Figure 3. The polarimetric coherence patterns γ HH - VV θ of ship slices from (a1–a4) Radarsat-2 PolSAR dataset, (b1–b4) GF-3 PolSAR dataset.
Remotesensing 13 03932 g003aRemotesensing 13 03932 g003b
Figure 4. The weight of each feature from Radarsat-2 PolSAR dataset. From left to right are the weight of the original value, the standard deviation value, the contrast value, the anisotropy value, the mean value, the maximum value, and the minimum value in each group, respectively.
Remotesensing 13 03932 g004
Figure 5. The weight of each feature from the GF-3 PolSAR dataset. From left to right are the weight of the original value, the standard deviation value, the contrast value, the anisotropy value, the mean value, the maximum value, and the minimum value in each group, respectively.
Remotesensing 13 03932 g005
Figure 6. Flowchart of the proposed ship detection scheme.
Remotesensing 13 03932 g006
Figure 7. Experimental datasets. (a1,a2) Radarsat-2 area I data. (b1,b2) Radarsat-2 area II data. (c1,c2) GF-3 area I data. (d1,d2) GF-3 area II data. The numbers 1 and 2 indicate the Pauli RGB images and ground-truth images, respectively.
Remotesensing 13 03932 g007aRemotesensing 13 03932 g007b
Figure 8. Detection results from Radarsat-2 area I. (a) Ground-truth image. (b) SO-CFAR. (c) SP. (d) T3 + SVM. (e) PCP + SVM. (f) Proposed method. (Green: correct detection, yellow: missed detection, red: false alarm).
Remotesensing 13 03932 g008
Figure 9. Detection results from Radarsat-2 area II. (a) Ground-truth image. (b) SO-CFAR. (c) SP. (d) T3 + SVM. (e) PCP + SVM. (f) Proposed method. (Green: correct detection, yellow: missed detection, red: false alarm).
Remotesensing 13 03932 g009
Figure 10. Detection results from GF-3 area I. (a) Ground-truth image. (b) SO-CFAR. (c) SP. (d) T3 + SVM. (e) PCP + SVM. (f) Proposed method. (Green: correct detection, yellow: missed detection, red: false alarm).
Remotesensing 13 03932 g010
Figure 11. Detection results from GF-3 area II. (a) Ground-truth image. (b) SO-CFAR. (c) SP. (d) T3 + SVM. (e) PCP + SVM. (f) Proposed method. (Green: correct detection, yellow: missed detection, red: false alarm).
Remotesensing 13 03932 g011
Figure 12. Detection results from Radarsat-2 area II. (a) The ground-truth images. (b) SO-CFAR. (c) SP. (d) T3 + SVM. (e) PCP + SVM. (f) Proposed method.
Remotesensing 13 03932 g012
Figure 13. Detection results of ship targets. (a1f1) Ground-truth images. (a2f2) SO-CFAR. (a3f3) SP. (a4f4) T3 + SVM. (a5f5) PCP + SVM. (a6f6) Proposed method.
Remotesensing 13 03932 g013aRemotesensing 13 03932 g013b
Table 1. Experimental data information.
SensorImaging AreaAcquisition DateSize
(range × azimth)
Resolution
(range × azimth)
Ship Number
Radarsat-2Hong Kong16 December 2008500 pixels × 300 pixels12 m × 8 m135
Radarsat-2Strait of Gibraltar1 January 2016700 pixels × 1300 pixels12 m × 8 m36
GF-3Hong Kong30 March 20171000 pixels × 1000 pixels8 m × 8 m44
GF-3Hong Kong15 March 20173450 pixels × 2150 pixels8 m × 8 m242
Table 2. Quantitative results comparison with GF-3 area I training set.
DataMethod N C N M N FA FoMDataMethod N C N M N FA FoM
Radarsat-2 area ISO-CAFAR12015088.89%Radarsat-2 area IISO-CAFAR342094.44%
SP12312091.11%SP333091.67%
T3 + SVM1332793.66%T3 + SVM3601669.23%
PCP + SVM1341197.53%PCP + SVM360197.30%
Proposed1350199.26%Proposed3600100%
GF-3
area I
SO-CAFAR376184.09%GF-3
area II
SO-CAFAR18260075.21%
SP3113070.45%SP22022090.91%
T3 + SVM395186.67%T3 + SVM2339295.49%
PCP + SVM404188.89%PCP + SVM2375197.53%
Proposed422095.45%Proposed2402397.96%
Table 3. Quantitative results’ comparison with the GF-3 area II training set.
DataMethod F C F M F FA FoMDataMethod F C F M F FA FoM
Radarsat-2
area I
T3 + SVM65703937.36%Radarsat-2
area II
T3 + SVM3601669.23%
PCP + SVM1341496.40%PCP + SVM3601472.00%
Proposed1350298.56%Proposed360294.74%
GF-3
area I
T3 + SVM440295.65%GF-3
area II
SO-CAFAR24201295.28%
PCP + SVM431195.56%SP24204085.82%
Proposed431097.73%Proposed2420398.78%
Table 4. Quantitative results’ comparison with the Radarsat-2 area II training set.
DataMethod F C F M F FA FoMDataMethod F C F M F FA FoM
Radarsat-2
area I
T3 + SVM1305791.55%Radarsat-2
area II
T3 + SVM360587.80%
PCP + SVM1323097.78%PCP + SVM360197.30%
Proposed1341099.26%Proposed3600100%
GF-3
area I
T3 + SVM3014166.67%GF-3
area II
T3 + SVM20240181.13%
PCP + SVM3014068.18%PCP + SVM20735085.54%
Proposed422095.45%Proposed22913194.24%
Publisher’s Note: MDPI stays neutral with regard to jurisdictional claims in published maps and institutional affiliations.