1. Introduction
In recent years, analysis of remote sensing images is playing an increasingly important role in land-cover/land-use (LC/LU) assessments such as urban planning [
1], building damage assessments [
2], hydro-logical information observation [
3] and soil quality monitoring [
4], etc. For example, an integrated model using morphometric assessment, remote sensing, GIS and SWAT model was envisaged and applied to analyze Kaddam river basin in Telangana state, India [
5]. Along with morphometric results to categorize critical watersheds, this model was applied to compute mean annual water and sediment yield from 1997 to 2012 and conservation structures were proposed accordingly. In terms of urbanization assessment, by analysis of Landsat data of the northeast subtropical region of Vietnam [
6], the urbanization rate of this country increased rapidly by almost 46% in ten years. However, the land-use map provided by the government was updated every five years. The transformation of land cover and land use is so fast that it is nearly impossible for the government to make land-use plans and management activities in real time. Without taking the accuracy of the maps into consideration, it also costs much time and money to produce land use maps manually even with satellite images.
Information extracted by LC/LU assessments can be used for resource investigation, environmental indicator monitoring and urbanization estimation. Machine learning methods, especially deep learning methods, have a strong ability to extract features from remote sensing images. In terms of environmental indicator monitoring, machine learning algorithms such as Support Vector Machine (SVM) have been used to assess the percentage of agricultural land contaminated by plastic [
7]. For detection of buildings, a semi-supervised deep learning method based on edge detection network D-LinkNet has been designed to understand the distribution of the buildings [
8], which is useful for urban planning, change monitoring and population estimation.
Among the methods above, pixel classification or segmentation is one of the most common ways to extract land-cover information [
9]. Pixel-based (PB) classification and Object-based (OB) classification are two main analysis approaches in this field. In Duro et al. [
10], two approaches were compared by using three machine learning algorithms (SVM, Random Forests and Decision Tree) for classifying broad land-cover fields over agricultural landscapes. Experiments show that no statistical difference between PB and OB classifications was found. While PB classification is widely used in optical satellite imagery segmentation [
11,
12], OB classification has more advantages in detection [
13,
14]. For instance, an object-based classification method using NDVI (normalized difference vegetation index) values was proposed to implement broadleaf deciduous forests (BDF) classification mapping [
15], and this method has achieved acceptable accuracy (79%) in multi-resolution SAR (Synthetic Aperture Radar) image segmentation. Additionally, an unsupervised object-based method was proposed to improve the segmentation of high spatial resolution (30 cm) color infrared images of residential area [
16].
Recently, pixel-based classification with deep learning methods, especially convolutional neural network (CNN), has been a research hotspot in the classification of remote sensing images owing to its versatility, robustness and high accuracy [
17,
18,
19]. A U-Shape CNN (U-Net) based on a deep residual learning framework [
20] was proposed for segmentation of large-scale mapping of date palm trees. Compared with U-Net with VGG16 backbone, PSPNet and DeeplabV3+, the proposed CNN outperforms other FCNs (Fully Convolutional Networks) in validation and testing datasets. But for the U-shaped network of encoding and decoding, the number of sub-network layers usually needs to be very deep to extract strong semantic features. There will be a semantic gap between the shallow network and the deep network, making the network difficult to train. A dense skip connections network named DAU-Net [
21] was proposed by performing dense skip connections between nested convolution modules to reduce the semantic gap between the codec sub-networks in U-shape network and was employed in water segmentation. However, only high-level semantic features cannot accurately locate the target object, and low-level features have greater resolution, so it is very important to fuse low-level features. A Multi-Resolution Supervision Network (MrsSeg) [
22] was proposed for Desert Segmentation, which takes the segmentation results of each scale as an independent optimization task and uses a multi-level fusion decoder to aggregate and merge the features based on the adaptive weighted loss function. A Multi-Level Feature Aggregation Network (MFANet) [
23] further uses a Channel Feature Compression (CFC) module to extract deeper features and filter redundant channel information, whose high-level features provide guidance information for low-level features, for semantic segmentation of Land Cover. Generally, the scales of different land covers in remote sensing images vary greatly, and their features also have large variances. Therefore, for multi-classification problems, it is easy to confuse an object with other similar object in different images. A feature decoupling CNN named CGFDN [
24] was proposed to take advantage of the co-occurrence relations between different classes of objects in the scene by encoding the co-occurrence relations with the guidance of label information to enhance the discriminative ability of the convolutional feature. Another major problem is that many remote sensing image datasets are labeled in the object level rather than in the pixel level. The rectangular labeling box results in incomplete object regions and missing boundary information. A weakly supervised network named SPMF-Net [
25] was proposed for locating the building region. The network uses a bottom-up approach to extract detail features and combines them with the superpixel pooling layer module, in accordance with the characteristics of the remote sensing images, to exhibit the boundary of the building.
In addition to the methods introduced above, deep learning methods using attention mechanisms have become very popular in recent years. The attention mechanism is an effective method that imitates the human vision to help feature extraction which is able to regularize the flow of features in the network. A MAP-Net [
26] was proposed for multiscale building footprint boundary extraction. In this network features extracted from each path were independent with fixed scales, and an attention module which can adaptively squeeze multiscale features extracted from the multipath network is used to fuse multiscale features at the end of the encoder. Seong et al. [
27] proposed a csAG-HRNet by applying HRNet-v2 in combination with channel and spatial attention gates. In this network, a channel attention gate assigns weights in accordance with the importance of each channel, and a spatial attention gate assigns weights in accordance with the importance of each pixel position for the entire channel. Li et al. [
28] proposed a Multi-Attention Network (MANet) for semantic segmentation of fine-resolution remote sensing images which uses multiple efficient attention modules including kernel attention and channel attention. Both two attention modules are used to decode feature maps from backbone layers to generate precise prediction map. Niu et al. [
29] proposed a Hybrid Multiple Attention Network (HMANet) for dense prediction tasks in the field of remote sensing, which adaptively captures global contextual information from the perspective of space, channel, and category. In particular, a Class channel attention module, a class augmented attention module and a region shuffle attention module are used process the feature maps from backbone network.
Among methods above, most methods are used only for segmentation of a single kind of target and it is not very convincing to verify the outstanding performance of the proposed model since the experiments are on a simple binary classification problem. For some methods used for multi-class segmentation, although the proposed network can improve performance, the difference in performance factors, especially mIoU, between the proposed model and other models is relatively small. For example, CGFDN [
24] only exceeds other models by 0.1% and 0.2% in mIou on POTSDAM dataset and VAIHINGEN dataset respectively. Besides, for all the methods introduced above, they all made great contributions for the decoder part of the network by designing more complex structure using modules like attention module or fusion module, but few of them advanced the encoder part of the network. Encoder may play a more important role for the segmentation and limit the upper performance of the network because the decoder process the feature maps from the encoder. Moreover, the common attention module, such as channel and spatial attention gates in csAG-HRNet [
27], vision transformer attention in MANet [
28], will greatly increase the computational complexity and increase the difficulty of training. According to the above analysis, compared with the deep learning methods above, the main contributions and works of this paper are as follows:
- (i)
A novel deep learning network framework–Dual Encoder with Attention Network (DEANet) was proposed for LC segmentation of remote sensing imagery. For the encoder, a dual-branch structure encoder with area attention was designed for securing stronger encoding ability. For the decoder, a pyramid partial decoder (PPD) with receptive filed block (RFB) was developed based on the parallel partial decoder to make fuller use of multi-scale feature maps from the encoder. Besides, an edge attention module was integrated into the framework for auxiliarily improving the segmentation effect of class edges;
- (ii)
A new loss function and a special training strategy were designed for DEANet. The Union subtract Intersection (UsI) loss that represents the region-based aware loss was proposed to replace the Intersection over Union (IoU) loss to improve the training stationarity and accelerate the training process in multi-class segmentation. The total loss contained both UsI loss and Cross Entropy (CE) loss. Moreover, both two losses were weighted to balance losses for different classes and emphasize difficult pixels. Then, a multi-stage training strategy was proposed to help achieve better training results;
- (iii)
The performance of our framework was strictly verified through the task of multi-class segmentation on three public datasets (LandCover.ai, DSTL and DeepGlobe). A detailed introduction to the setup of the experiments was given. The effectiveness of each proposed module in our framework was verified by an ablation study, and the superiority of our method was verified by comparing it with some state-of-the-art methods (DeepLabV3+, EncNet, PSPNet, etc.)
The remainder of This paper is organized as follows. The proposed method is described in
Section 2.
Section 3 presents the experiments and results. Finally,
Section 4 and
Section 5 provide the discussion and the conclusion respectively.
2. Methodology
In this section, firstly, the structure of DEANet is described. Then, a detailed introduction to each part of the framework is given. For the last part, the introduction to the lost function and a training strategy is presented.
2.1. Proposed Framework
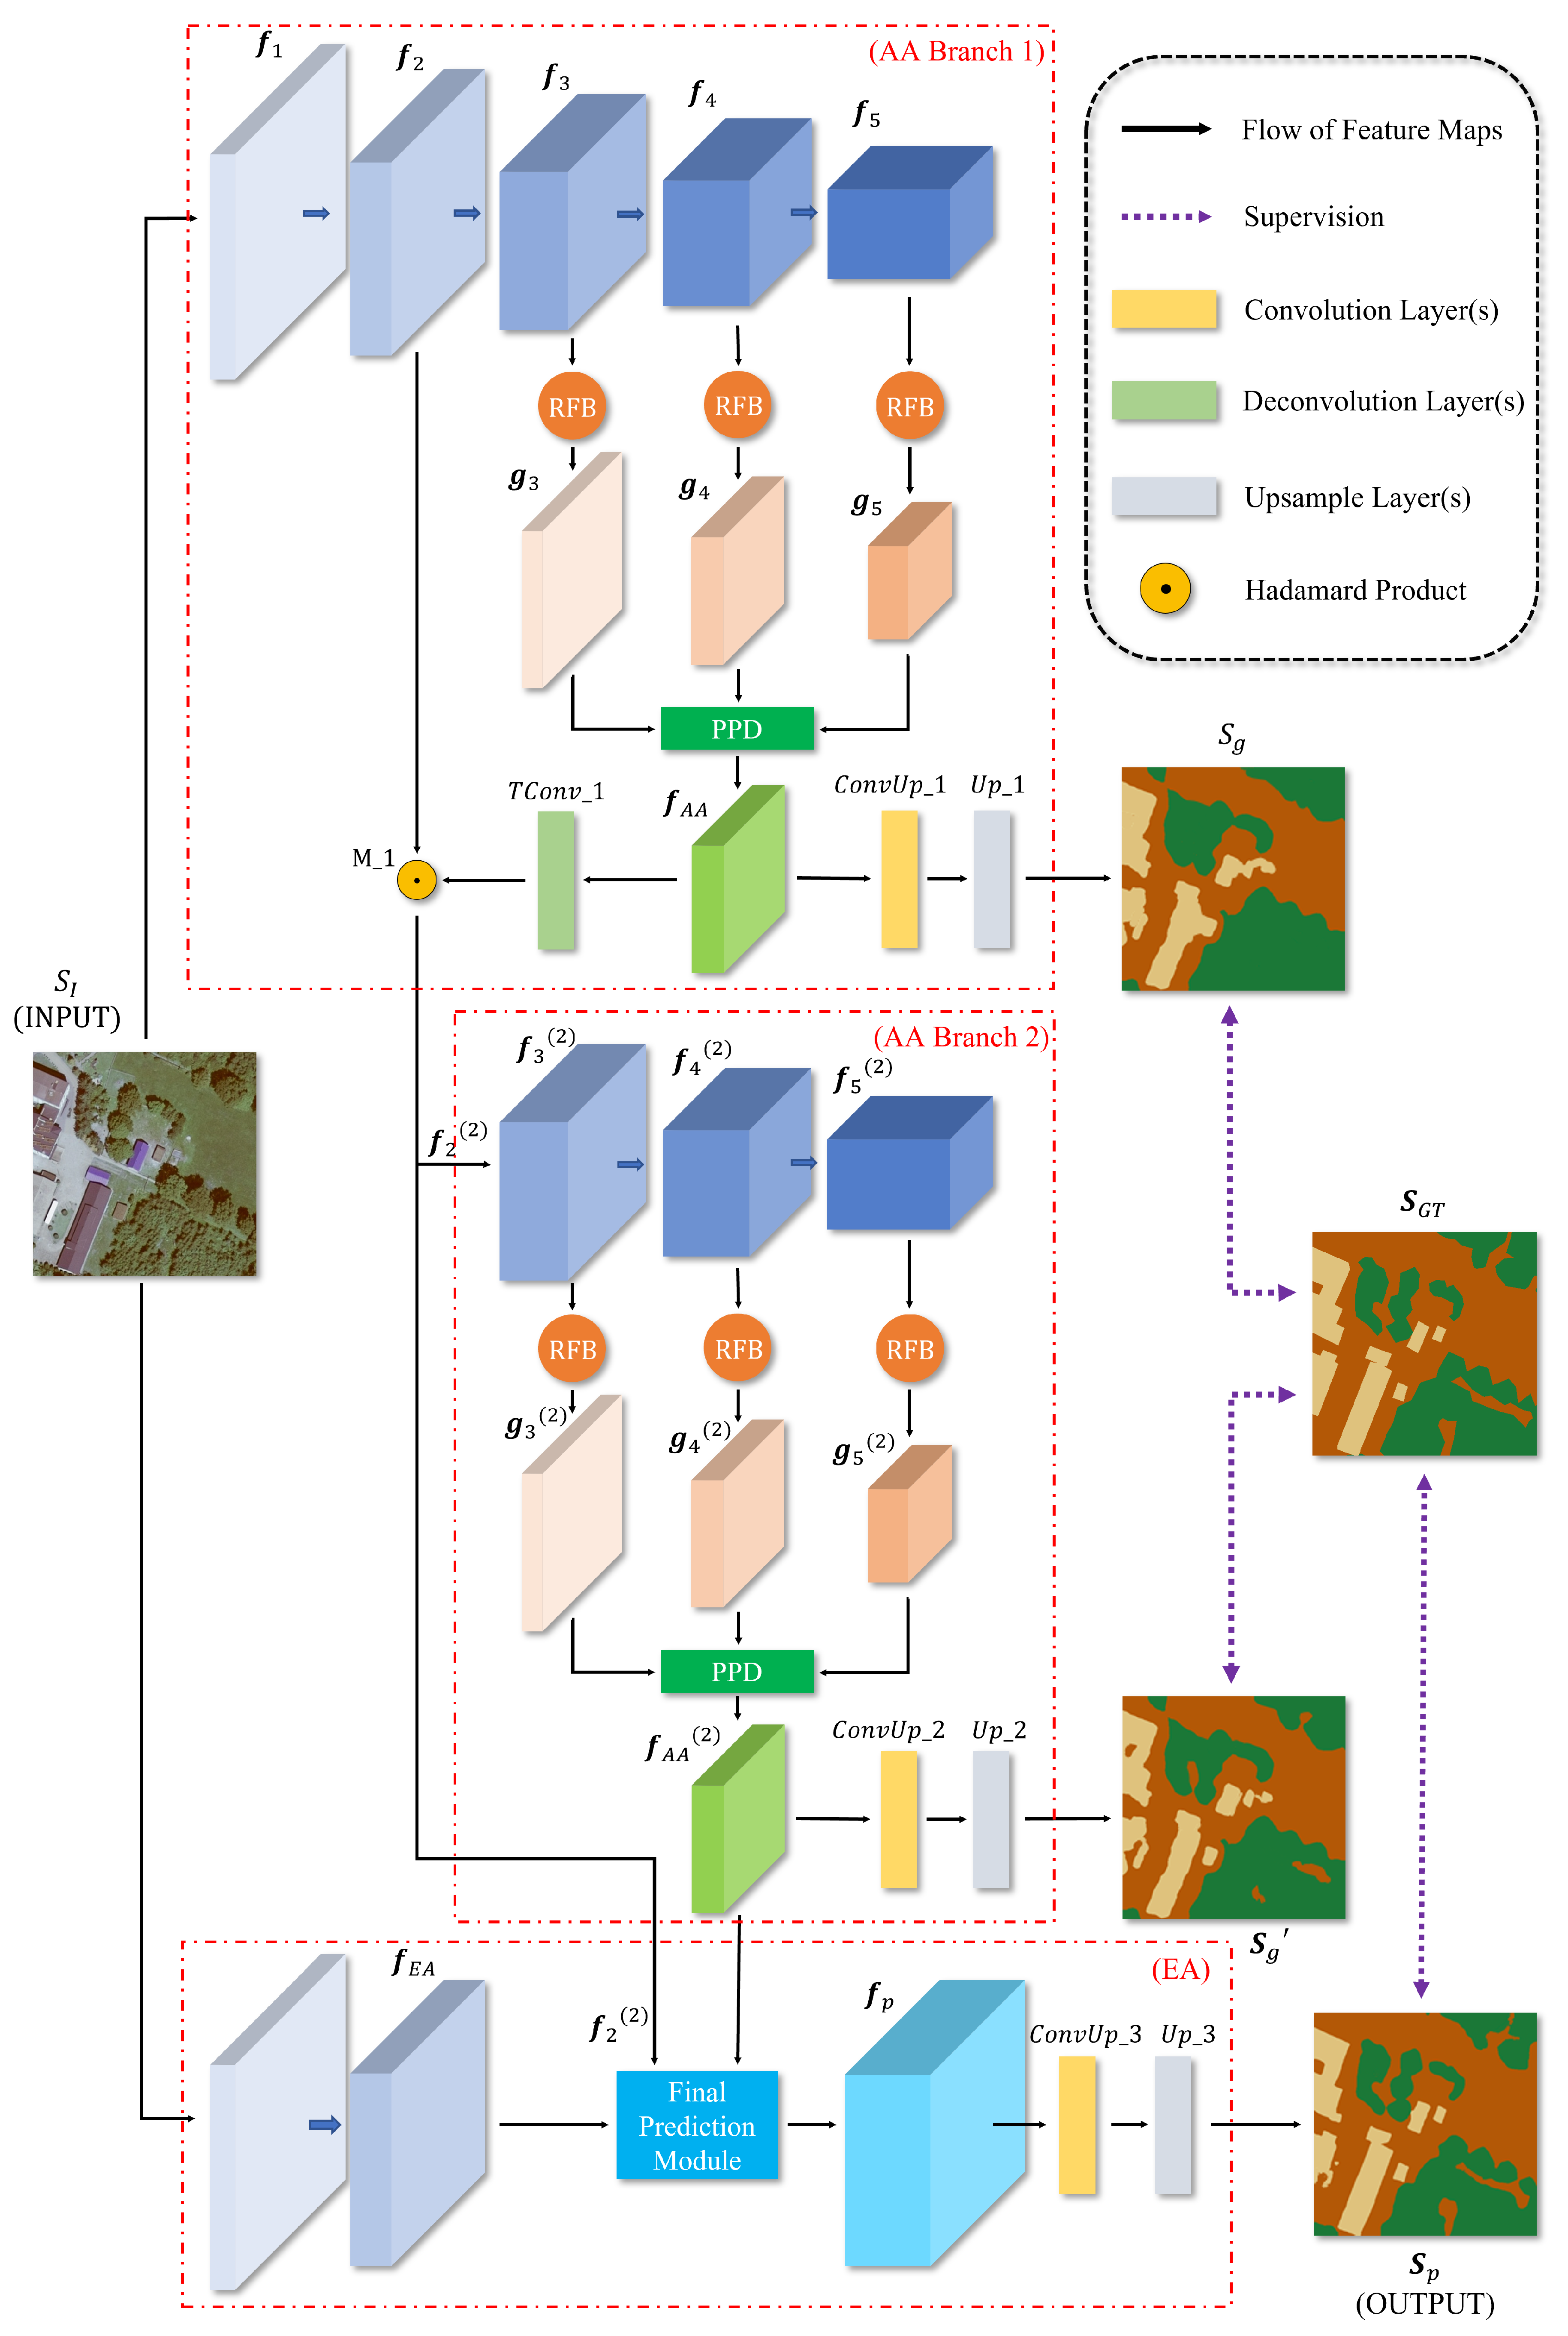
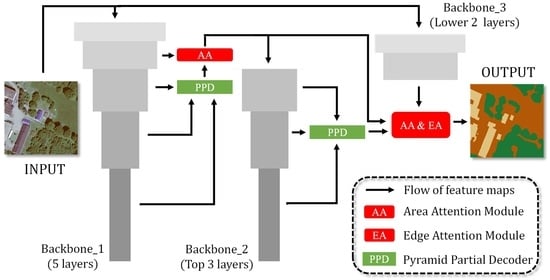
The framework of the network is shown in
Figure 1. Raw images are brought into the backbone network firstly. The backbone network can be VGGNet, ResNet or any other encoder whose structure is organized in a pyramid fashion. From lower layer to higher layer,
represents the feature map extracted from the each layer. Feature maps from the top three layers
are brought into the decoder. Before feature maps
enter the decoder, receptive filed block (RFB) is employed to reduce the channels of these feature maps and meanwhile improve the global perspective for each feature. The generated feature maps are denoted as
. A partial decoder is used for aggregating
to generate a feature map
which is able to express the segmentation information roughly. Then
is utilized as area attention to help re-encode features from the backbone network. Feature map from the second layer of the original backbone network
combined with
together generates a new feature map
that possesses area attention. (
Note: The labeling symbols of all the feature maps in the second branch adopt superscript.) Then
is put into another independent backbone network with only the top three layers, and this backbone network re-encodes features and generates feature maps
which are more accuracy than the origin feature maps
. Afterwards, the same manipulates are operated on
as on
, and the outputs of RFBs and partial decoder are
and
respectively. The
and
are supervised by the ground truth after they are reshaped to the same shape as the ground truth. An edge attention module is used to help improve the performance for the segmentation on edge areas. The third backbone network with only two lower layers is used to extract the edge information, and the extracted feature map
along with
and
produces the final segmentation image. The detailed layer information and feature maps size are captured in
Table 1.
In next part, the detailed structure of each module in this framework will be introduced.
2.2. Pyramid Partial Decoder
Wu et al. [
31] proposed a Cascaded Partial Decoder (CPD), which uses a partial decoder to aggregate features from different layers, and employed it in the field of object detection. According to it, Fan et al. [
32] proposed a simplified parallel partial decoder to aggregate features from three high layers for Covid-19 infection area segmentation. They all point out that higher layer features contain more vital semantic information while lower layer features are abundant of basic information like edge information. Smaller contribution for the detection is made by lower layer features, but more calculation resources would be consumed for their high resolution; therefore only the top three layers features are applied for aggregation.
In parallel partial decoder, only feature maps with different sizes but the same number of channels can be put into it for its characteristic of parallel. However, in pyramid fashion encoders, feature maps of smaller sizes own more channels to avoid losing too much information. Force feature maps from different layers to reshape to the same number of channels may generate underexpressed features, especially when those features are the outputs of RFBs that may dilute information.
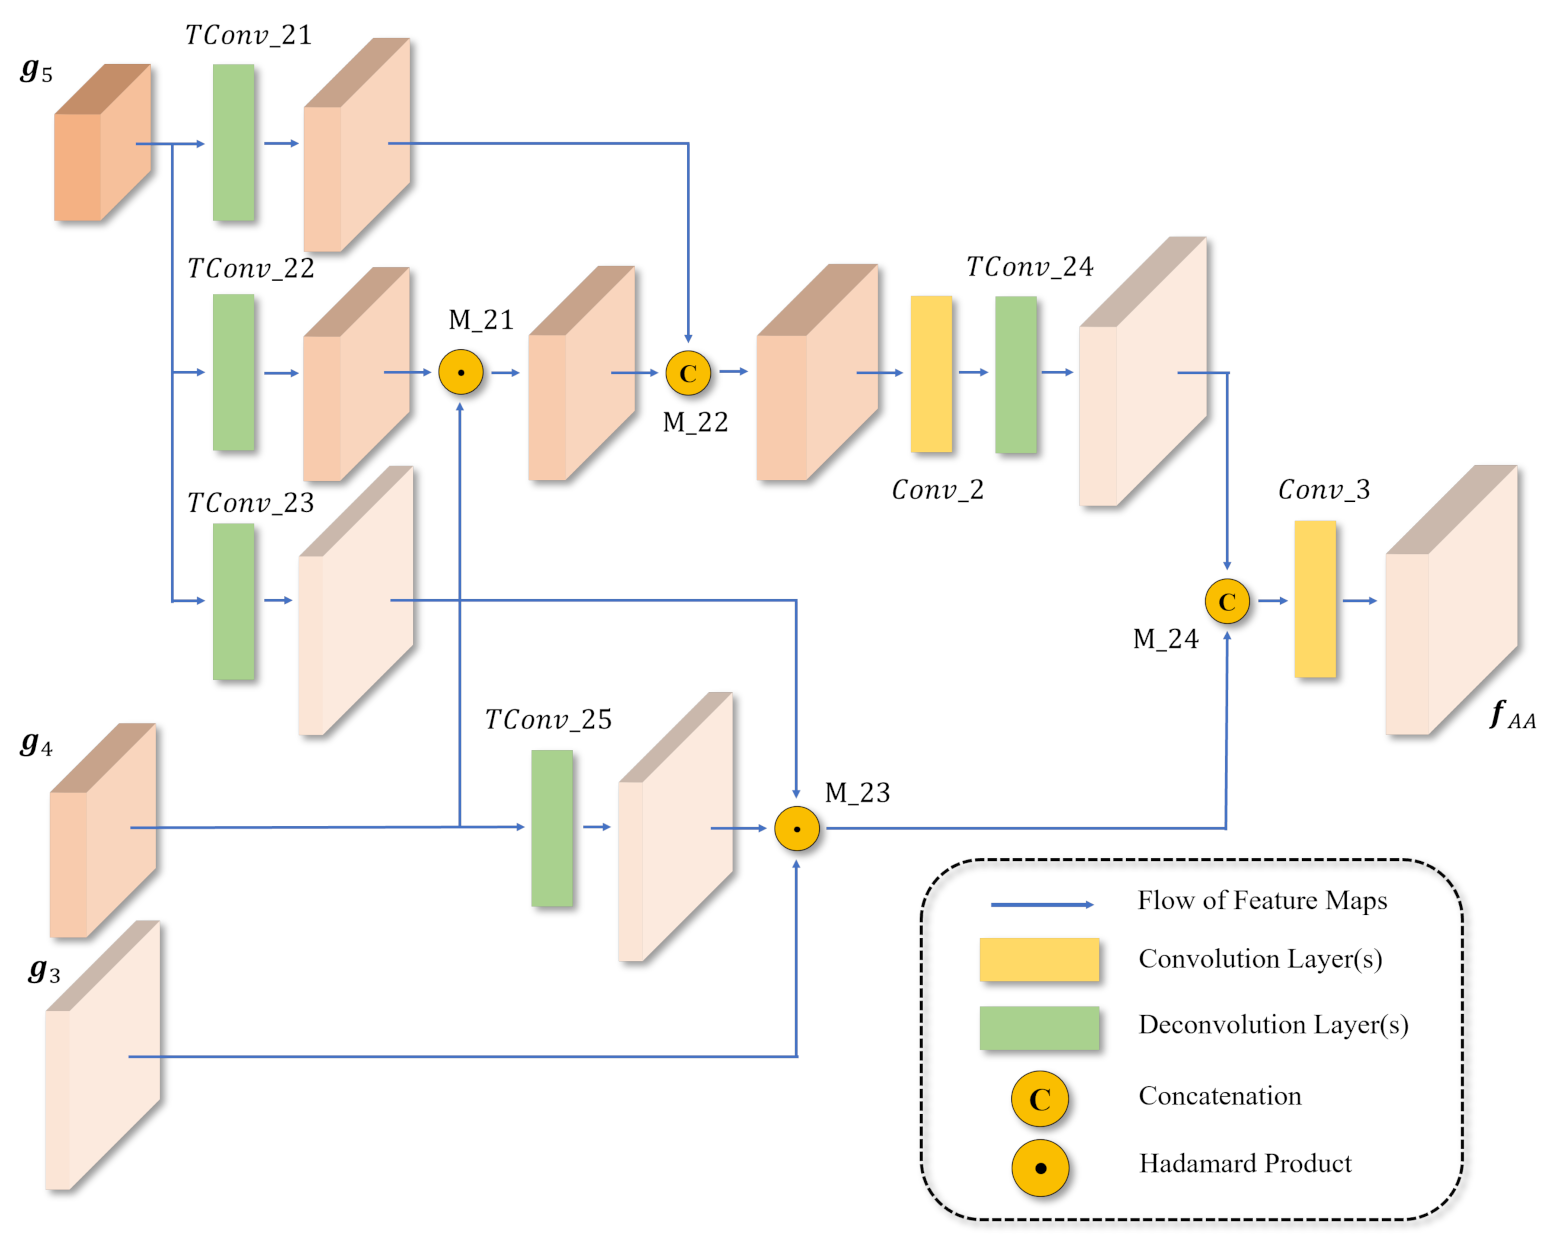
Thus we proposed an improved partial decoder—Pyramid Partial Decoder (PPD) to carry out the aggregation. Its structure is shown in
Figure 2. Transpose convolution is used to replace the upsample and convolution in the original method. The formula is defined as follows (Equation (
1)):
where
is transpose convolution (including batch-normalization) which converts input feature maps to those of c times of number of channels and s times of size.
is 3 × 3 convolution (including batch-normalization) that could keep the same data shape.
is concatenation between two input data and ⊙ is hadamard product.
Pyramid partial decoder receives feature maps
whose shapes are different from each other and generates the feature map
that is of the
times of channel number and the same size of
. The rough information for segmentation is contained in
, and it is seen to be area attention for segmentation guidance. The detailed layer information and feature maps size in
Figure 2 are captured in
Table 2.
Besides, receptive filed block (RFB) [
30] is used to preprocess the feature maps that are put into the decoder. In contrast to the ordinary convolution, RFB brings in a pyramid structure so that it could enlarge the feeling horizon in origin images for each feature and reduce the feature map size at the same time. Its superiority in performance over that of traditional convolution has been proved.
2.3. Area Attention and Two Branches
Some works [
33,
34,
35] have shown that the encoder plays a more important role in the encoder-decoder network, and usually, the structure of the encoder determines the upper limit of the model performance. Many advanced network frameworks have done lots of work in improving the structure of the decoder; however, few works have been done in advancing the encoder performance. In this paper, we propose a novel two-branch encoder structure with area attention to boost the encoding effect.
Figure 1 shows the structure. Another branch of the backbone is built for re-encoding the feature maps.
Firstly, the output of the second lower layer of the original branch
combined with the aggregated feature map
is put into the second branch. The combination method employs the equation below (Equation (
2)):
We treat
as a guidance to build an area attention. This kind of method is inspired by PraNet [
36], which uses feature maps from higher layers as a guidance to extract more accurate features from lower layer feature maps through a set of reverse attention modules. Similarly, the output feature map from the first branch is able to locate different land-cover areas roughly because it has been supervised by the ground truth and is relatively accurate. The hadamard product between
and
uses the guidance to generate a new feature map
whose features are more sparse than
. Specifically, for the features in one channel, some features are enhanced, and other features are suppressed, so the entire feature channel becomes sparse. Moreover, because the guidance feature map has the ability to express spatial features, the sparsity in the generated feature map is spatially distributed. Intuitively, this phenomenon is very similar to a kind of concentration, where attention is concentrated from the entire image to areas where certain features are enhanced. This is why we named this operation ‘Area Attention mechanism’. Obviously, the sparser feature map has stronger expressive ability, and it is easier to extract more interpretable features, thereby improving the predictive ability of the network. This kind of attention is different from general visual attention, such as spatial and channel attention or transformer attention which can capture long-range dependencies in deep networks, because it is more intuitive, strongly explainable and easily operable.
The output is put into another independent backbone network, which shares the same style of the origin backbone network but with different parameters, and only the top three layers are employed. New feature maps which may contain better semantic information are generated by this new branch. Then these feature maps go through the RFBs, and then the reduced feature maps are generated. Another pyramid partial decoder is applied to aggregate these reduced features maps to form another area attention feature map . Both and need being convoluted to single-channel feature maps with 1 × 1 convolution kernel and then upsampling to and which represent the rough predictions. The and are supervised by the ground truth, and the cost function will be introduced below.
2.4. Edge Attention
Papers [
37,
38] point out that edge information could help the segmentation since useful constraints could be provided. We hope to introduce a set of edge features and use a method similar to the Area Attention mechanism to enhance the network’s ability to predict class edges. Inf-Net [
32] makes features from the lower layer supervised with the edge graph extracted from the ground truth image to advance the segmentation performance. However, we found it in experiments that few improvements would be brought because though a little prior knowledge is employed by the extraction, no substantial new information is introduced to the network.
Inspired by this method, a feature-representation transfer learning method is proposed to construct the edge attention module. To import independent edge information to the network, features should be supervised with the general edge graph instead of the ground truth edge graph. However, it is hard to achieve for the lack of effective edge samples. In this situation, transfer learning is a potent measure. Backbone networks pre-trained with ImageNet are able to extract robust semantic features, so we adopt the strategy of parameter sharing that using the lower layer of the backbone network to extract edge features directly. A backbone network of two lower layers with fixed pre-trained parameters is applied to extract edge features
, as shown in
Figure 1.
2.5. Final Prediction
Area attention feature map
, edge attention feature map
and basic feature map
are merged to generate the final prediction.
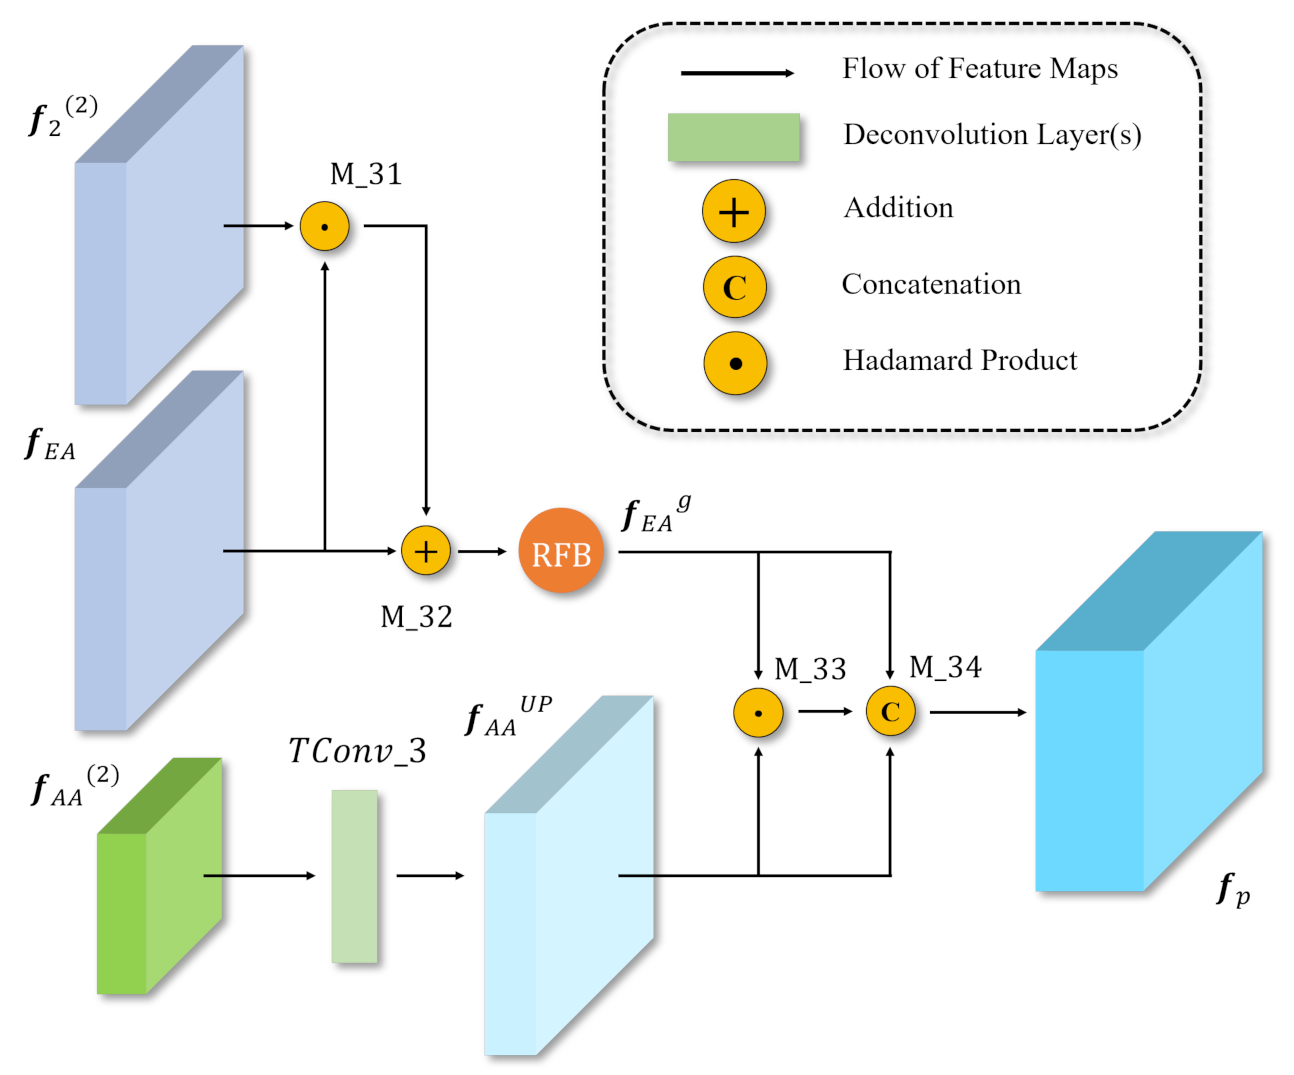
Figure 3 shows the final prediction module (FPM) structure, and the merge formulation is shown below (Equation (
3)):
where
represents the upsample manipulation and
represents that the feature maps go through RFB. Firstly, a global feature map with edge information is formed by merging feature map
and edge attention feature map
, and then RFB is employed to reduce the scale of the produced feature map. Then area Attention feature map
needs expanding the resolution using transpose convolution. Next, the
,
,
are concatenated. Finally, the final prediction
is generated by double-convoluting the concatenation output. The detailed layer information and feature maps size in
Figure 3 are captured in
Table 3.
2.6. Cost Function and Training Strategy
We design a cost function as equation below (Equation (
4)):
where
represents the pixel position aware loss and
represents the region-based aware loss. Compared with the traditional CE loss, both classes-balancing weight and nodus-attentive weight are included in
, and its equation is shown below (Equation (
5)):
where
represents the class index,
N represents the number of classes,
represent the coordinates of each pixel,
represent the possibility of pixel
belonging to class
c and the label of pixel
respectively.
represents the balancing weight of class
c, and when number of pixels belonging to class
c is small, their weights would be increased linearly by it.
is nodus-atttentive weight which shares the same definition in paper [
39], and the difficult pixel could be emphasized by increasing the weight of it using
.
Considering the common region-based losses are not reliable in multi-class segmentation, we proposed a simple new region-based loss—Weighted Union subtract Intersection Loss
, whose equation is shown below (Equation (
6)):
In multi-class segmentation, some classes in one image may not exist, or their pixel number is tiny. In IoU loss, this may lead to its denominator changes rapidly and result in loss instability. Besides, the loss gradient is small in the early training stage and keeps increasing along with the training, which is not beneficial for the training. In contrast, the UsI loss only pays attention to the absolute residual, and the fractional structure is discarded. The stationarity is increased and the convergence is accelerated resulting from the linearity of the UsI loss. However, because of the abandonment of the relative error, the UsI is much more sensitive to the class scale, and tiny contributions for the loss would be made by classes of a small number of pixels. Therefore class balancing weight is essential for the UsI loss. In addition, nodus-attentive weight is also introduced to the UsI loss, and the definitions of these two kinds of weights are the same as those in .
In this framework, three outputs need being supervised, and all of them employ the loss function introduced above. The total loss is shown below (Equation (
7)):
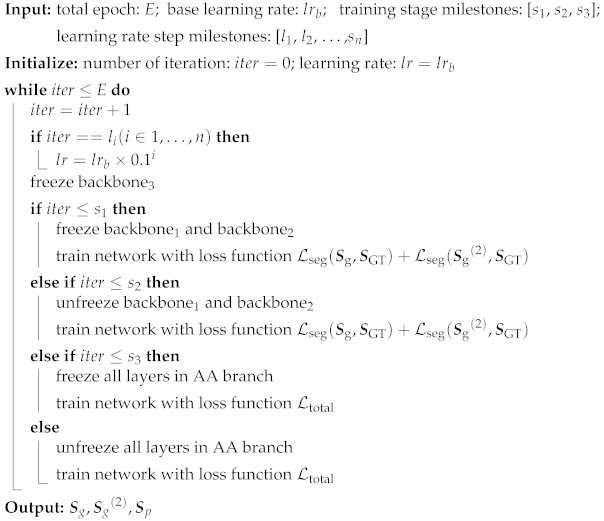
To help achieve a better prediction performance, a suitable training strategy should be considered. The whole framework could be divided into two parts, the area attention part and the edge attention part. Through experiments, better performance could be achieved by training two parts respectively because the area attention part may not be trained perfectly if both two parts are trained together. However, two branches in the area attention part should not be trained respectively. If the first branch is trained alone, it would be over-fitted quickly and the next branch would be difficult to be trained so that a longer time would be consumed. In addition, pre-trained backbone networks would be used to boost the performance. Many experiments have shown that freezing the pre-trained backbone network and training others alone, then unfreezing it and training all together would be more effective. The learning rate should be adjusted during different training stages, so a multi-step learning rate adjusting strategy is used here. Above all, the training strategy algorithm is captured in Algorithm 1.
| Algorithm 1: Training Strategy. |
![Remotesensing 13 03900 i001]() |
3. Experiments and Results
In this section, the experiments and their results are introduced. Firstly, the setup of the experiments is described, including datasets, evaluating metrics and training details. Next, the ablation study on the architecture is given. Finally, our model are compared with some state-of-the-art methods.
3.1. Experiments Settings
3.1.1. Datasets
To test the superiority and universality of our method, experiments were performed on three datasets, including LandCover.ai [
40], DSTL [
41] and DeepGlobe [
42].
The LandCover.ai (Land Cover from Aerial Imagery) dataset is a dataset for automatic mapping land covers from aerial images. The pictures in this dataset were taken in Poland, Central Europe, and all of them have three spectral bands-RGB. Among them, 33 orthophotos have the resolution of 9000 × 9500 pixels with 25 cm realistic resolution for each pixel, and 8 orthophotos have the resolution of 4200 × 4700 pixels with 50 cm realistic resolution for each pixel. The total coverage area of all images is up to 216.27 . For landcover classes, the surface is divided into three classes including ‘building’, ‘woodland’ and ’water’; however, some areas are not classified actually.
When using this dataset, we added another class —‘other’ to announce the unclassified areas. The guidance on dividing the dataset into a training set, a testing set and a verification set has been provided. Following this instruction, 7470 training images, 1602 verification images and 1602 testing images were generated, and all the images had the resolution of 512 × 512 pixels.
DSTL dataset provides 25 satellite images in both 3-band and 16-band formats. Images are taken by sensor WorldView 3. The 3-band images are RGB. The 16-band images contain spectral information by capturing wider wavelength channels. This multi-band imagery is taken from the multispectral (400 nm–1040 nm) and short-wave infrared (SWIR) (1195 nm–2365 nm) range. The sensor resolution is at least 31 cm for all the bands. 10 objects types are included in this dataset: ‘buliding’, ‘manmade structures’, ‘road’, ‘track’, ‘trees’, ‘crops’, ‘waterway’, ‘standing water’, ‘vehicle large’, ‘vehicle small’, and some areas are not labelled.
When using this dataset, another class—‘other’ was announced for areas that are not labeled. In this experiment, only 3-band images (RGB) were used for segmentation. In all 25 images, two images ‘’ and ‘’ that are very closed to the other 2 images were abandoned. Each image was divided into small images with a resolution of 256 × 256 pixels. All the small images were grouped into a training set, a testing set and a verification set with the probability of 2:1:1. As a result, 1530 training images, 884 testing images and 918 verification images were generated for the experiments. In addition, all the images needed pre-processing. All bands of RGB needed dividing by 2047 to be normalized to 0–1, then blue and green bands needed dividing by 1.3 and 1.1 separately to balance the color.
DeepGlobe contains 803 satellite images with a resolution of 2448 × 2448 pixels, and each pixel has a 50 cm realistic resolution. All images own three spectral bands (RGB). Each satellite image is paired with a mask image for land-cover annotation. The mask is an RGB image with 7 classes of labels: ‘urban’, ‘agriculture’, ‘rangeland’, ‘forest’, ‘water’, ‘barren’ and ’unknown’.
In this experiment, each image was compressed to the half-size and then divided into sub-images with a resolution of 512 × 512 pixels. All the sub-images were grouped into a training set, a testing set and a verification set with the probability of 2:1:1. Therefore, 1569 training images, 839 testing images and 804 verification images were generated for the experiments.
3.1.2. Metrics
In this paper, five metrics are used to evaluate the performance of the models, and they are overall accuracy (OA), mean precision (mP), mean intersection over union (mIoU), mean recall (mReCall) and mean F-1 score (mF1). OA, mP, mReCall and mF1 are pixel position aware metrics, and mIoU is a region-based metric which is more in line with human visual evaluation. Their calculation formulas are as follows ((Equation (
8)–(
12)):
where
,
,
and
are the number of true positive pixels, true negative pixels, false positive pixels and false negative pixels in class
c respectively.
N is the number of classes.
3.1.3. Training Details
For all datasets, images were normalized by subtracting the mean value of each channel, and no other data augmentation transformation was performed. In our experiments, all networks were trained using the optimizer of stochastic gradient descent (SGD) with a momentum of 0.9 and a weight decay of 0.0005. A Gradient clipping of 0.5 was used to limit the gradient. The basic learning rate was set to 0.01, and a warm-up strategy was employed with the factor of 3/10 and the iteration of 10 at the beginning of the training. For the backbone network, the Res2Net50 [
43] network with pre-trained weight on ImageNet dataset was used. Other hyperparameters including batchsize, learning rate milestones, training stage milestones and total epoch varied as the network changed.
Our experiments were conducted on Ubuntu 16.04 platform. An RTX2080s 8G graphics card was used for training the model.
3.2. Ablation Study
3.2.1. Ablation Study on Architecture
In detail, four experiments were designed to evaluate the performance of pyramid partial decoder (PPD) module, receptive field block (RFB), two-branch structure with area attention module and edge attention module separately. Experiments were performed on all three datasets.
A detailed introduction to the four experiments is given. In experiment 1, only one branch of backbone was in use, and a parallel partial decoder was used to aggregate the feature maps from RFBs. Then the output of partial decoder was convoluted and upsampled to the shape of the input image, and it was seen to be the final prediction of this model. In experiment 2, on the basis of experiment 1, the parallel partial decoder was replaced by the pyramid partial decoder, and the RFBs were replaced by several single convolution layers. The final prediction was the same as that in experiment 1. In experiment 3, in comparison with experiments 1 and 2, both pyramid partial decoder and RFBs were employed, and the final prediction was still the same. In experiment 4, two branches of the backbone with area attention module were in use, pyramid partial decoder and RFBs were also employed, and only edge attention module was abandoned. The final prediction was from the output of the pyramid partial decoder in branch 2 after it was reshaped to the same shape of the input. In the comparison of experiment 1 and experiment 3, the effectiveness of the pyramid partial decoder could be evaluated; between experiment 2 and experiment 3, the effectiveness of the RFB could be tested; between experiment 3 and experiment 4, the performance of the two-branch structure encoder with area attention could be examined; between experiment 4 and the experiment on the whole framework, the capability of edge attention module could be inspected.
For training hyperparameters, different networks were trained with different hyperparameters, and all of them are shown in
Table 4.
The quantitative results of the experiments on the three datasets are shown in
Table 5, where the red color and blue color stress the best and the second-best performance. The line chart of the results is in shown in
Figure 4. In qualitative results, it can be seen that each part of the proposed framework could bring improvement in performance to a certain extent. From experiment 1 to experiment 3, from experiment 2 to experiment 3, from experiment 3 to experiment 4 and from experiment 4 to the experiment on the whole framework, almost all the metrics on all datasets got improved. It can be clearly seen from the line chart that mIoU and OA (bold red and blue lines in the line chart), which are regarded as the most representative and commonly used indicators in evaluating the performance of semantic segmentation, have been improved in all comparative experiments. Accordingly, the effectiveness of the Pyramid Partial Decoder, RFBs, two-branch with area attention structure encoder and edge attention module was verified respectively. Our whole framework achieved the best performance on the metrics of OA, mP, mIoU and mF1 on all datasets, and on mReCall metric achieved the best performance on one dataset and the second-best performance on the other two datasets. Besides, from the degree of performance improvement, it could be inferred that the actual improvement of indicators may exceed the improvement brought by modules themselves, and the joint training could promote the performance as well.
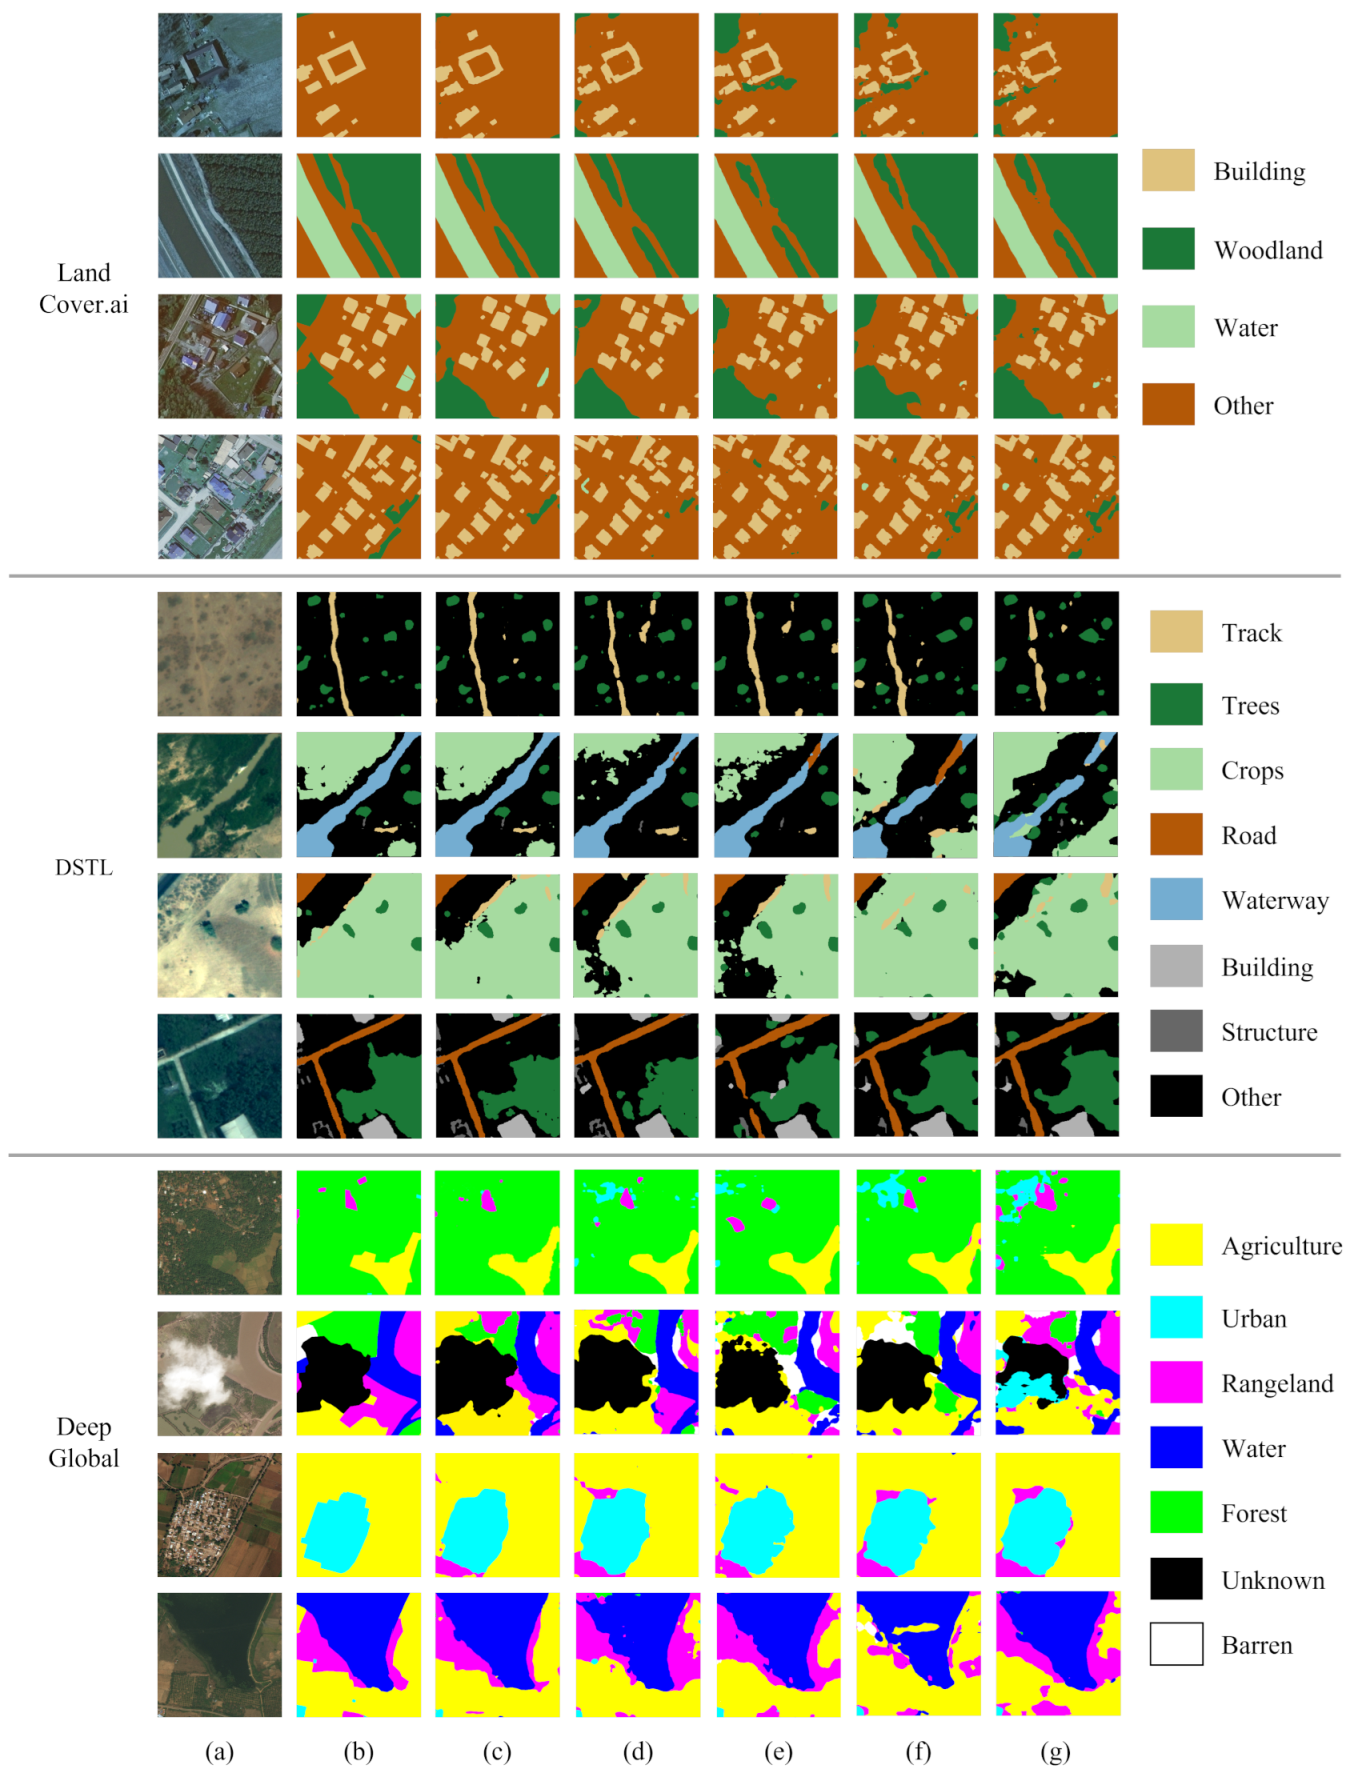
Moreover, the visible results are shown in
Figure 5, where each row represents a sample in testing sets of different datasets, and each column represents the raw image or the ground truth or the result of each model. In visible results, it is apparent that, from right to left, the prediction images are more similar to the ground truth. Area attention could bring great improvement at the segmentation performance on the blocky areas, and edge attention could achieve more precise expression on edge details. Sum up the two kinds of results, it could be concluded that each module in the proposed framework could effectively advance the segmentation performance alone, and the model containing all these modules could achieve the best segmentation performance.
3.2.2. Ablation Study on Training Strategy and Loss Function
A group of experiments are carried out to verify the effectiveness of Training Strategy and Loss Function. For Training Strategy, two comparative experiments are set up. One is to divide the entire training phase into two stages. The first stage freezes the backbone network and only trains the decoder part, and the second stage combines the two parts for joint training; another experiment directly trains the entire network jointly without dividing the training process into stages. Compared with the training hyperparameters in
Table 4, the training hyperparameters used in this comparative experiment only remove the corresponding training stage milestones. The quantitative results are shown in
Table 6, where the red color and blue color stress the best and the second-best performance.
For the loss function, we set the BCE loss as a comparative experiment to verify the effect of the proposed UsI loss. The loss functions used are all weighted. The training hyperparameters and training strategies are the same as those in
Table 4. The quantitative results are shown in
Table 7.
Regarding the training strategy, the four-stage training strategy we proposed obtained the best results on all the datasets on all the main indicators (mIoU and OA, and also get the best or close to the best results on other indicators), and consumed the shortest time on training the network. The metric results obtained by the two-stage training strategy rank second, and the training time is longer. The non-staged experiment had the worst results and the longest training time. Thus we can draw the conclusion that the four-stage training strategy we proposed can effectively improve the training performance and shorten the training time.
Regarding the loss function, the loss we proposed obtained the best results on all the datasets on metrics of mIoU, OA, mReCall and mF1, and got very close results on mP. Thus, the experimental results prove that the new region-based loss function can improve the main metrics including the region-based metric mIoU.
3.3. Comparing with the State-of-the-Art
In order to verify the superiority of the proposed model, the model will be compared with other state-of-the-art methods. Seven models were selected as the comparison in the experiments and they are UNet [
44], DeepLabV3+ [
45], DeepLabV3 [
46], PSPNet [
47], PSANet [
48], GCNet [
49], EncNet [
50]. For UNet, PSPNet, DeepLabV3+ and EncNet, the same backbone network and lost function were used as our model, and the two-stage training strategy with a multi-step learning rate policy was employed. For others, the resnet50 backbone network and the CE loss were used, and only one stage training strategy with a poly learning rate policy whose power was 0.9 was employed. In addition, we tested the 101-layer resnet for the three models EncNet, DeepLabV3, and DeepLabV3+ to test the results with similar model parameters. In summary, training hyperparameters for each state-of-the-art model are shown in
Table 8.
The quantitative results of the experiments on all datasets are shown in
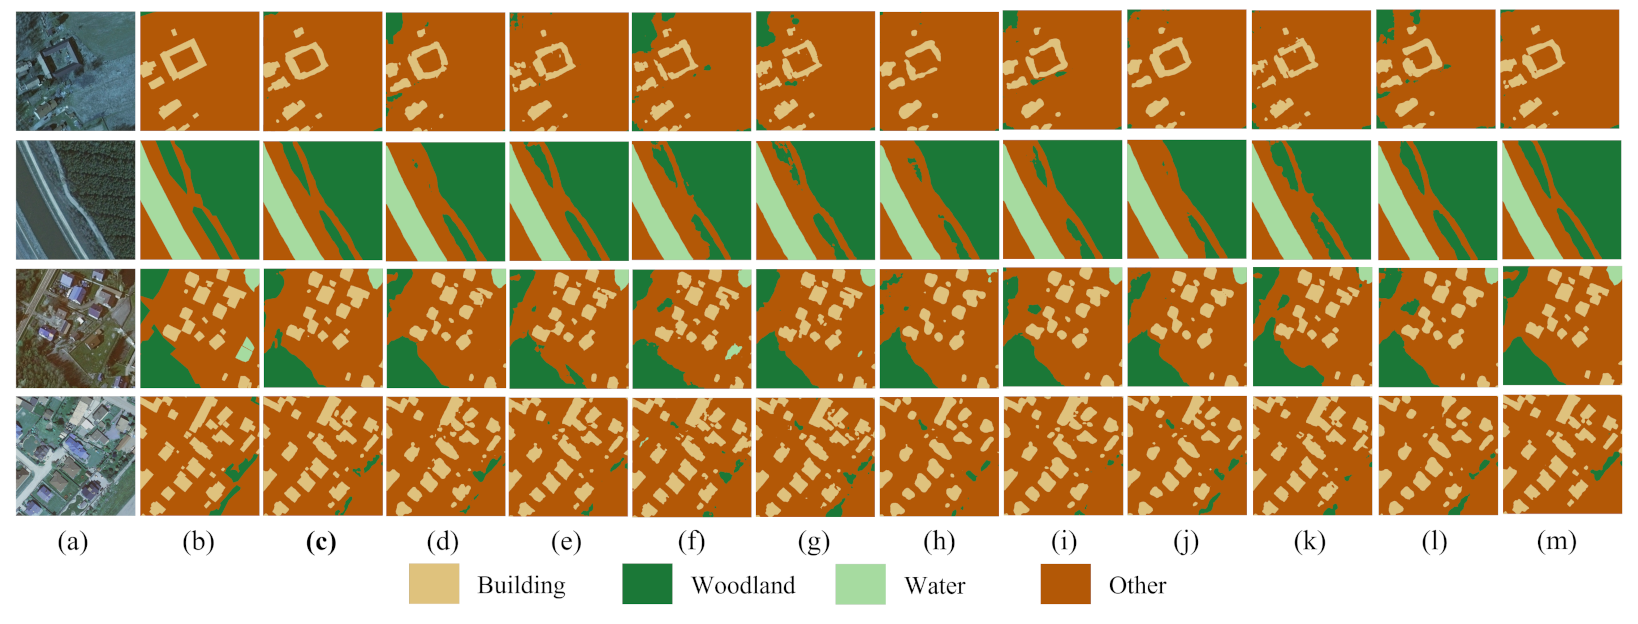
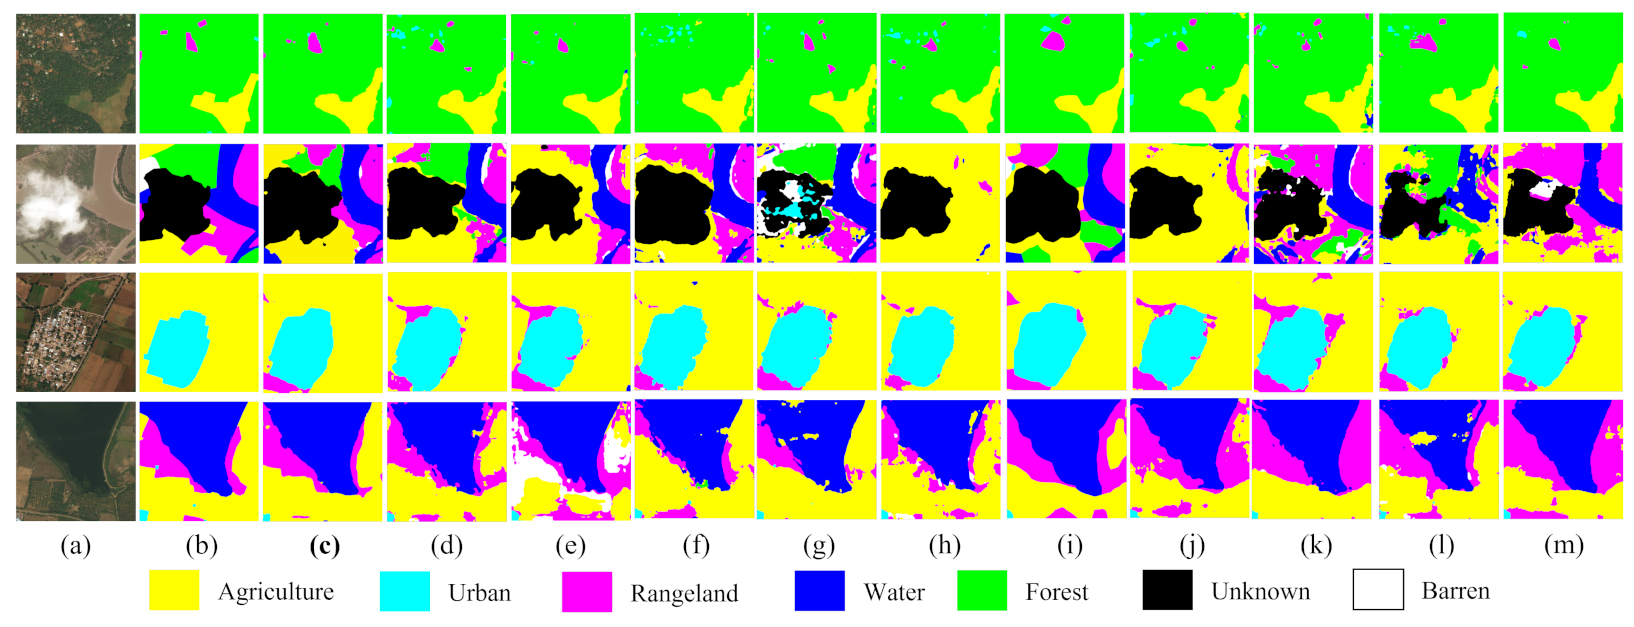
Table 9, and the size of model parameters, training time and inference speed are also inculded. And the visible results of three datasets are shown in
Figure 6,
Figure 7 and
Figure 8 separately, where each row represents the prediction result of a sample in the testing set.
It can be seen from quantitative results that our model achieved the best performance or the second-best performance on almost all the metrics. On the most important metric mIoU, our model achieved the best performance compared to all other models. To be specific, on the LandCover.ai dataset, our model surpasses the second-best model (EncNet *) by 0.91%; on the DeepGlobe dataset, it exceeds the second-best model PSPNet (Res2Net50) by 2.35%; and on DSTL dataset, it surpasses the second-best model EncNet (Res2Net101) by 1.96%. In OA metric, our model also achieved the best scores on the LandCover.ai and DeepGlobe datasets, and it is only slightly lower than EncNet (Res2Net101) on the DSTL dataset. Our model also achieved the best or close to the best results on other metrics. It can be seen that our model has significantly improved the segmentation effect of multi-class satellite images.
Another conclusion worth mentioning is that the improvement of the segmentation performance brought by our model is not only due to the increase in the number of parameters, but also due to the superiority of the model structure. This conclusion can be drawn by comparing the segmentation effects of models with similar size of model parameters (about 60 M), including PSANet, EncNet (Res2Net101), DeepLabV3 (ResNet101) and DeepLabV3+ (Res2Net101). Compared with these models, our model has similar (even better for some models on some datasets) parameter sizes, training time and inference speed, but our model can obtain higher performance metrics. Compared with the larger model UNet (Res2Net50), this conclusion can also be verified. The reason why we did not test the PSPNet (ResNet101) with similar parameter size (66.26M) here is that although the model is similar in size and the segmentation effect is relatively good, the training time is too long and the inference speed is too slow. In other words, when our model uses a 50-layer resnet backbone network, it can achieve better results over other state-of-the-art methods which use a 101-layer resnet backbone network.
From the perspective of visible results, for most of the examples of all three datasets given, the prediction results of our model are closer to the ground truth compared to other state-of-the-art models; and for other examples given, our model also achieved the prediction results of a similar level as other best model. Sum up the quantitative and visible results, it can be concluded that the method proposed in this paper is a new state-of-the-art method for segmentation of remote sensing images.
4. Discussion
In this paper, we proposed a brand new deep learning framework—DEANet to segment the different land covers of remote sensing images, and our method achieved the state-of-the-art performance on the three public datasets. During experiments, some phenomena are worth discussing.
In our method, a parallel partial decoder is replaced by a pyramid partial decoder. Compared with the parallel partial decoder, a cascaded style is adopted by the pyramid partial decoder, giving greater weight to the feature maps of the lower layers to enhance the decoder’s ability to decode detailed areas. However, through experiments, we found that sometimes parallel partial decoder may achieve greater performance than pyramid partial decoder when the decoder block is used alone (no RFBs and area attention structure), especially when the segmentation task is relatively simple (for instance, only two kinds of land covers are contained). This phenomenon is caused by overfitting. More parameters are brought to the model by pyramid partial decoder, resulting in that while the expressive ability of the model is improved, the risk of overfitting is also increased. However, in our model, pyramid partial decoder is still employed because when it only becomes one part of the model, the risk of overfitting would be eliminated. Through experiments, we found that using pyramid partial decoder together in the whole model would achieve better performance than parallel partial decoder, suggesting that joint training would help the decoder to fit more appropriately.
RFBs are employed in our model to reduce the scale of the feature maps and enhance the receptive field. Besides RFB, another block PSP (Pyramid Scene Parsing) module was tested as well. What is different from RFB is that PSP module utilizes global average pooling to downsample feature maps and generate feature maps with multi-scale receptive fields. The generated feature maps of different scales are not independent of each other because prior knowledge is introduced to make them have a relatively stronger connection. Through experiments, we found that using PSP module instead of RFB could improve the performance of the model in a high probability, but the effectiveness is not significant. In addition, PSP module consumes more computing power than RFB, and our purpose of using RFB is to simplify the model. Based on the above considerations, RFB instead of PSP module is applied to our final model.
In pyramid partial decoder, a cascaded style of three levels is employed. We tried a four-level pyramid partial decoder to test the effect of the number of layers of the decoder on the performance of the model. The four-layer pyramid partial decoder takes the features from the lower layer into account so that more details on the spatial scale could be completed. Through experiments, the above analysis is confirmed, but the actual improvement effect is not distinguished. We think the reason is that the segmented images are all high-resolution images so that the resolution of the feature maps from the third layer is sufficient enough to distinguish the boundaries. So some experiments on one low-resolution dataset were performed, and the results verified our point of view. A major disadvantage of the four-layer decoder is that it costs almost twice as much computing power as the three-layer decoder. Based on the above analysis, segmentation on high-resolution images only needs to use a three-layer decoder, but on low-resolution images could consider using a four-layer decoder. In addition, we also tested the impact of the upsampling strategy on the experimental results. In the original parallel partial decoder, a convolution plus interpolation strategy was used, while we used transposed convolution in pyramid partial decoder. We tested the pyramid partial decoder using the convolution plus interpolation strategy, and its results is slightly lower than ours. This seems to indicate that the upsampling strategy has an insignificant effect on the experimental results.
The selection of the training hyperparameters is essential. In cost function, , is an important parameter to balance the pixel position aware loss and the region-based aware loss, and in all experiments, we set it 3. UsI loss is higher in the early stage of training and smaller in the later stage than CE loss. To prevent UsI loss from losing its effect in the later stage of training, should be set to an appropriate value to make UsI loss reach the same scale as CE loss. For different datasets, should be set separately. As for the optimizer, the SGD optimizer is employed in all experiments. The SGD optimizer is more helpful in reducing the degree of overfitting than the ADAM optimizer, but it is not easy for training in the early stage, especially on complex training sets. In experiments, for the DSTL dataset, if the SGD optimizer was used, the loss would not drop quickly at the beginning of training, and this resulted in numerous training produced different results. Using the ADAM optimizer could reduce the probability of this situation. Therefore, for complex datasets, choosing the ADAM optimizer at the early stage of training and changing it to the SGD optimizer at the later stage is a suitable method for training. Training milestones usually determine whether the training is successful. The learning rate should be set appropriately. A learning rate that is too high will cause the loss to be difficult to drop or even divergent, while a learning rate that is too small will cause the training to fail to proceed. In addition, the choice of learning rate varies with different datasets and different training stages, and usually a large number of experiments are required to determine the optimal learning rate milestones. Note that when switching training phases, a lower learning rate must be set to prevent divergence. In each training stage, training does not need to stop until the loss cannot drop. That’s because a perfectly trained part is not helpful for the overall training or even has a counterproductive effect. So, a set of well-judged training stage milestones is essential as well.
5. Conclusions
In this paper, we proposed a new method for segmenting remote sensing images. Firstly, a new deep learning framework–DEANet was introduced. A pyramid partial decoder was proposed according to the parallel partial decoder, whose structure is organized in a cascaded fashion. More weight can be given to feature maps from the lower layer to strengthen the spatial expression ability of the decoder, using a pyramid partial decoder. RFBs were used to preprocess the feature maps that enter the decoder to reduce the scale of the feature maps and enhance the receptive field at the same time. A kind of two-branch structure with area attention encoder was proposed to improve the performance of the model from the perspective of the encoder. Stronger encoding ability could be secured by backbone network with area attention than original backbone network. The third partial backbone network with fixed pre-trained parameters was introduced as an edge attention module to enhance the detail expression ability of the model. Secondly, a new loss function, composed of the weighted CE loss and weighted UsI loss, was proposed. The UsI loss represents the region-based aware loss, which replaces the IoU loss to boost the training stationarity and speed. The weighted UsI loss and weighted CE loss can both balance losses for different classes and pay more attention to difficult pixels. Thirdly, a detailed training strategy was introduced for obtaining better training results.
In experiments, we performed our model on three public datasets: LandCover.ai, DSTL and DeepGlobe. Firstly, we introduced the setup of our experiments in detail. Then, the results of ablation experiments were introduced to verify the function of each part in the proposed framework. At last, several advanced models were set to be compared with our model, and experiments results showed that our model achieved the state-of-the-art performance on the three datasets.
The method proposed in this paper provides a new choice for multi-class segmentation on remote sensing images. However, the performance of the method still cannot reach the level of manual segmentation, especially when there are too many kinds of land covers. Some land covers owning similar visual performance are very hard to be distinguished. The accuracy of the training set labels will also have a great impact on the results. In this method, three backbone networks are introduced. Though the performance has been improved, more computing power is consumed. How to integrate the area attention module into a single backbone network is a research direction. Whether some small ready-made edge extraction networks or some traditional edge extraction algorithms can replace the edge attention module in this method to achieve better performance or faster speed is a research direction as well. Besides, parameter tuning is a complex work in this method; therefore, more complete parameter tuning experience or some parameter self-tuning methods are worth studying.
