Article

Assessment of a Gauge-Radar-Satellite Merged Hourly Precipitation Product for Accurately Monitoring the Characteristics of the Super-Strong Meiyu Precipitation over the Yangtze River Basin in 2020

National Meteorological Information Center, Beijing 100081, China
*
Author to whom correspondence should be addressed.
Remote Sens. 2021, 13(19), 3850; https://doi.org/10.3390/rs13193850
Submission received: 24 August 2021 / Revised: 22 September 2021 / Accepted: 22 September 2021 / Published: 26 September 2021

Abstract

:
The recently developed gauge-radar-satellite merged hourly precipitation dataset (CMPAS-NRT) offers broad applications in scientific research and operations, such as intelligent grid forecasting, meteorological disaster monitoring and warning, and numerical model testing and evaluation. In this paper, we take a super-long Meiyu precipitation process experienced in the Yangtze River basin in the summer of 2020 as the research object, and evaluate the monitoring capability of the CMPAS-NRT for the process from multiple perspectives, such as error indicators, precipitation characteristics, and daily variability in different rainfall areas, using dense surface rain-gauge observation data as a reference. The results show that the error indicators for CMPAS-NRT are in good agreement with the gauge observations. The CMPAS-NRT can accurately reflect the evolution of precipitation during the whole rainy season, and can accurately capture the spatial distribution of rainbands, but there is an underestimation of extreme precipitation. At the same time, the CMPAS-NRT product features the phenomenon of overestimation of precipitation at the level of light rain. In terms of daily variation of precipitation, the precipitation amount, frequency, and intensity are basically consistent with the observations, except that there is a lag in the peak frequency of precipitation, and the frequency of precipitation at night is less than observed, and the intensity of precipitation is higher than observed. Overall, the CMPAS-NRT product can successfully reflect the precipitation characteristics of this super-heavy Meiyu precipitation event, and has a high potential hydrological utilization value. However, further improvement of the precipitation algorithm is needed to solve the problems of overestimation of light rainfall and underestimation of extreme precipitation in order to provide more accurate hourly precipitation monitoring dataset.

Graphical Abstract

1. Introduction

Meiyu is a climatic phenomenon in the middle and lower reaches of the Yangtze River basin in China, Taiwan, south-central Japan, and southern Korea, in which continuous rains occur in June and July, and is a product of the transition from spring to summer in the East Asian atmospheric circulation during the northward advance of the East Asian summer winds, characterized by the appearance of a quasi-stationary cloud band extending from southern Japan to southern China [1,2,3]. The cloud belts aloft are closely linked to quasi-stationary fronts (i.e., Meiyu fronts) at the surface [4] and are mainly maintained by a combination of warm and humid air masses from the Pacific Ocean and cold air masses from the Arctic. The Meiyu period is one of the three major periods of intense precipitation in the Chinese region, and although the duration of the Meiyu period is not long, the intense precipitation caused by the Meiyu front accounts for a significant portion of the total precipitation in central China, in some years even exceeding 50% of the total annual precipitation over the Yangtze River Plain [5,6]. During the Meiyu period, the strong rain-bands formed along the Meiyu front often lead to extreme flooding events in densely populated urban areas in eastern China [7]. Therefore, more reliable high-resolution gridded precipitation products are needed to better understand the characteristics, formation mechanisms, and maintenance mechanisms of persistent heavy rainfall, to further improve the forecasting of precipitation during the Meiyu period, and to reduce the damage caused by flooding.
High-resolution, high-quality precipitation dataset can play an important role in monitoring extreme precipitation events. The commonly used precipitation observation data are (1) rain gauge observations, which can provide accurate point rainfall data, but there are no rainfall stations to observe in the ocean, uninhabited areas, and areas with complex topography, so its spatial representativeness is deficient [8,9]; (2) satellite estimation, which has wide spatial coverage but relatively poor precision [10,11]; (3) radar quantitative precipitation estimation (QPE), which has very high spatial and temporal resolution, but whose spatial coverage is restricted by the availability of the operational radar network [12,13]. How to effectively combine the advantages of different sources of precipitation information and develop multi-source precipitation merged technology has become the mainstream trend in the development of high-quality precipitation products internationally in recent decades [14,15,16,17]. Successfully merged precipitation data are generally of better quality than its individual input data sources [18].
Precipitation merged analysis technology began in the 1990s, in order to combine the advantages of high temporal and spatial resolution of infrared detection precipitation and high accuracy of passive microwave precipitation, researchers made a multi-satellite integrated precipitation product, and use ground observations to revise the systematic deviation of satellite precipitation to form the final merged precipitation product. Initially, due to the small number of satellites, satellite precipitation products such as GPCP (Global Precipitation Climatology Project) [19], CMAP (Climate Prediction Centre (CPC) Merged Analysis of Precipitation) [20] had low temporal and spatial resolution. With the development of satellite remote sensing detection technology, satellite data deviation revision techniques such as probability density function (PDF) have been developed, and merged techniques such as Optimal Interpolation (OI) and Kalman Filter (KF) have been maturely and widely applied in the field of precipitation merging. The temporal and spatial resolutions of satellite integrated and merged precipitation products have been significantly improved. For example, the resolution of TMPA [17], CMORPH [21], and GSMaP [22] is no less than 3 h and 0.25⁰ which provides the possibility of global large-scale precipitation monitoring. At the same time, in order to give full play to the advantages of radar estimation of precipitation, KF, OI, and distance inverse weighting (IDW) [23] have been used in the Stage IV system of the National Centers for Environmental Prediction (NCEP) and the MRMS (Multi-Radar Multi-Sensor) system of the National Severe Storms Laboratory (NSSL) [24].
In recent years, with the rise of new technologies such as machine learning and deep learning, extensive experiments have been carried out in the field of precipitation merging. The machine learning-based precipitation ensemble technique (MLPET) combines daily soil moisture, terrain elevation, and atmospheric variables (temperature and humidity) with multiple global precipitation datasets (from satellite and reanalysis products) to statistically generate ensembles of precipitation fields [25,26]. Ling et al. [27] proposed a novel double machine learning (DML) approach developed based on the classification and regression models of the ML algorithms to merge multiple SPPs and gauge observations. Yagmur et al. [28] has developed an error model that is the nonparametric machine learning tree-based quantile regression forest (QRF). All validations showed that the error model-based corrections can significantly reduce both the mean relative error and the random component of PMW products.
National Meteorological Information Centre of China (NMIC) developed gauge-radar-satellite merged hourly precipitation product, at fine spatial-temporal resolutions of 1 km, covering the whole of China [29,30,31,32]. In the process of precipitation merged product development, after introducing the two-step merged method [33] of “PDF + OI” obtained by the Climate Prediction Center (CPC) of the National Oceanic and Atmospheric Administration (NOAA), Pan et al. [34,35] further improved and optimized the method, and proposed the China region precipitation merged technique of “PDF + Bayesian model averaging (BMA) + OI”, which can provide real-time hourly merged precipitation products (CMPAS-NRT) at the 0.01 degree lat./lon. grid box. With high spatial and temporal resolution and stable quality, the CMPAS-NRT product has been widely used in scientific research such as intelligent grid forecasting, meteorological disaster warning monitoring, and numerical model evaluation [36,37]. As the merged technology [35] uses the international mainstream method of precipitation real-time merged operation, which has been extensively demonstrated for many years, the advantage of this method over the current emerging machine learning and deep learning is its reliability and stability. At present, the shortcomings of the merged technology are that it still needs to be enhanced for optimization in site sparse areas and complex terrain. Moreover, with further research, there is a need to efficiently merge more radar multi-level detection data, multi-channel satellite remote sensing, etc. For massive observation data, traditional merged methods may not be applicable, and new methods such as machine learning methods and neural networks can be tried to be introduced [36].
The operational application of merged precipitation products is beneficial toward improving the capabilities in storm water monitoring [38]. Moreover, conducting application assessments of merged precipitation products is important for timely and accurate understanding of product quality [39,40]. Since the Yangtze River basin often experiences concentrated and heavy precipitation processes during the rainy season, which cause basin-wide flooding, it is extremely important to analyze the applicability of CMPAS-NRT in this region. The primary concern when evaluating precipitation products is where the precipitation mainly occurs, how long it lasts, and how much precipitation occurs at any given time scale, and these attributes can be checked against conventional rain gauge observations as true values [41]. However, on the other hand, when using ground-based rain gauge measurements as reference data for testing precipitation products, their limited spatial representativeness often results in uncertainty in the assessment results [42,43]. Nevertheless, standardized surface precipitation observations remain the only source to directly obtain true precipitation values [44,45]. A set of nonlinear error functions of spatial and temporal scales versus the number of rain gauge observations in a grid has also been developed by attempting to estimate the effect of the error on the assessment results caused by using rain gauges to test a gridded precipitation product, and this error function can also be used to estimate the minimum number of rain gauges required in each grid to meet a predefined error level when carrying out the assessment [46].
In the summer of 2020, the Yangtze River basin in China experienced a super-long Meiyu season. The entry of the Meiyu was early and its exit was late, so the precipitation is abnormally high during the Meiyu period [47]. As a result of this extreme event, huge casualties and economic losses were caused. The merged precipitation estimation product (CMPAS-NRT) produced has been operating in real time for many years and has been used in a number of operational scientific research efforts [29,36]. However, no one has yet systematically analyzed the ability of CMPAS-NRT product to monitor this extreme precipitation event. Previous validations of CMPAS-NRT have mostly focused on the whole Chinese region and some complex topographic areas, while the evaluation of specific precipitation processes is less frequent, and the research methods used are mostly statistical indicators such as root mean square error and correlation coefficient. This paper introduces analysis methods such as daily variation characteristics, precipitation modal decomposition, and JPDF in addition to the methods based on previous studies, which can be used to analyze the monitoring capability of CMPAS-NRT products for specific extreme precipitation processes in a comprehensive manner from multiple perspectives. It can provide a basis for future applications of the product in the Yangtze River basin. The components of this paper are as follows: Section 2 introduces the study area along with the data and methods used in the study; Section 3 presents the results from assessing the ability of CMPAS-NRT to depict the 2020 super-heavy Meiyu rainfall event, including an analysis of the precipitation characteristics and the portrayal of the daily variability; and Section 4 discusses and summarizes the study’s key findings.

2. Data and Methods

2.1. Study Area

The Meiyu precipitation in China is mainly distributed in the Yangtze River basin. Using correlation methods, REOF (rotated empirical orthogonal function) analysis and other methods, it has been found that the large-value area of the rotational component in China’s Yangtze River region is mainly located to the north of 28°N, and the consistency of precipitation within 28°–34°N and east of 133°E during the Meiyu precipitation period is good [48]. The coverage of the Meiyu monitoring area is 28°–34°N and 110°–122.5°E. Figure 1 is the Köppen-Geiger climate map, which shows that the climatic characteristics of the Meiyu monitoring area are warm temperature, fully humid and hot summer. From Figure 2b, it can be seen that the location of the rainy belt in the first half of June 2020 was southward, the center of heavy precipitation was mainly located in Jiangnan to northern South China, the rain belt started to lift northward rapidly from 9 June, and was pushed to the area from the Yangtze River to the southern Huanghuai basin from 10 to 16 June, corresponding to the beginning of the Meiyu period in the Yangtze River basin. The main rain belt then fell back to the middle and lower reaches of the Yangtze River region, and for a long time remained stable, during which a small north-south oscillation of the rain belt resulted in a wide north-south span of the rain belt. Around 10 July, the rain belt again moved north, marking the end of the Meiyu precipitation in Jiangnan. In late July, the precipitation intensity in the Yangtze River basin weakened significantly, bringing the end of the Meiyu precipitation period to this region. The heavy precipitation processes that occurred during the entire rainy season were located within the Meiyu monitoring area (28°–34°N). The present study therefore focuses on analyzing the quality of CMPAS-NRT in this area.

2.2. Data

2.2.1. CMPAS-NRT Precipitation Product

CMPAS is a China Multi-source Precipitation Analysis System that was developed by the National Meteorological Information Center of the CMA (China Meteorological Administration). The system uses probability density function (PDF), optimum interpolation method (OI), and Bayesian model averaging method (BMA), combined with high-density gauge precipitation observations, high-resolution weather radar quantitative precipitation estimation (QPE), and satellite-based precipitation estimates, to generate gauge-radar-satellite merged hourly precipitation product. Specifically, the PDF technique was used to revise the systematic errors of the radar and satellite precipitation first, and then the BMA (Bayesian model averaging) method was used to fuse the radar and satellite precipitation to form the optimal initial field. Finally, the OI method was used to incorporate ground-based observation data [33,40]. When using the PDF method to match and revise, the sample spatiotemporal matching window is appropriately adjusted according to the characteristic of strong localization of radar precipitation deviation [34,35]. Shen Y et al. [31] and Pan Y et al. [35] have provide a schematic diagram to understand the merged algorithm. CMPAS products include real-time (RT) precipitation products and near-real-time (NRT) precipitation products, with a 20-min time lag for RT precipitation products and a 24-h time lag for NRT precipitation products. Currently, the gauge-radar-satellite merged hourly precipitation products of the CMPAS system play an active role in operations such as intelligent grid forecasting, meteorological disaster warning, operational monitoring and product inspection, and inspection and evaluation of GRAPES (Global/Regional Assimilation and Prediction System) [36]. The latitude and longitude grid resolution of the CMPAS-NRT precipitation product is 0.01° × 0.01°, and the time resolution is 1 h. The data were obtained from the CMA Data Service Centre. The CMPAS-NRT precipitation product was used in this study.

2.2.2. Gauge Observation Data

Rain gauge observations are considered to be the most accurate precipitation data source and play a key role in quantitative studies of surface precipitation [49]. To evaluate the accuracy of the CMPAS-NRT product, we obtained hourly precipitation data from about 13,000 automatic meteorological stations for June to July 2020 in the Meiyu monitoring area. Figure 2a shows the spatial distribution of the stations and the surface topography, which reveals that station observations are very dense throughout the Meiyu monitoring area and that the topography of the area is relatively flat, and most of the areas are dominated by plains and hills. The spatial representativeness of the station observations is good. Precipitation data from gauges are subject to strict operational quality controls [50], including boundary value checks, temporal consistency checks, and spatial consistency checks, with a minimum detectable precipitation of 0.1 mm/h. It is worth mentioning that when precipitation estimation product is made in real time to more accurately monitor precipitation processes, all available rain gauge observations within China are merged, so gauges are not separated in estimation and verification data. Since gauges in the study area are sufficiently dense, the separation of the observations has little impact on the validation of the precipitation estimation products, and larger sample size can help reduce the uncertainty of the assessment results and improve the validity of the results.

2.3. Methods

2.3.1. Processing of Gauge Data

In this study, the precipitation data from each grid pixel of the CMPAS-NRT product is compared with the corresponding surface rain-gauge observation. Only grid pixels with at least one station are selected for evaluation [51]. For the pixel containing only a single rain-gauge observation, that rain gauge is used to represent the observed precipitation for that pixel; and for the pixel with two or more rain-gauges, the areal-average precipitation is the arithmetic average of all rain-gauges located within that pixel. For the processed rain-gauge grid observations, a pixel by pixel check for missing data is performed. If the proportion of missing data in the hourly data series of a grid pixel exceeded 10%, the pixel is excluded. The final number of grid pixels that participated in the evaluation is 12,037. For a 1 × 1 km grid pixel, when a pixel contains at least one rain gauge, it can basically ignore the assessment bias arising from the spatial representativeness of the stations and other issues, and the assessment results are scientific and reasonable [46].

2.3.2. Assessment Indicators

To better quantify the performance of the CMPAS-NRT product, several statistical metrics were used, including mean error (ME), relative deviation (rBIAS), mean absolute error (MAE), root-mean-square error (RMSE), correlation coefficient (CORR) [52], and Kling-Gupta efficiency (KGE) [53]. The calculations of these indicators are as follows:
ME = 1 n i = 1 n ( y i x i ) ,
MAE = 1 n i = 1 n | y i x i | ,
rBIAS = i = 1 n ( y i x i ) / i = 1 n x i ,
RMSE = i = 1 n ( y i x i ) 2 n ,
CORR = i = 1 n ( y i y ¯ ) ( x i x ¯ ) i = 1 n ( y i y ¯ ) 2 i = 1 n ( x i x ¯ ) 2 ,
KGE = 1 ( r 1 ) 2 + ( β 1 ) 2 + ( γ 1 ) 2
where n is the total number of samples, and y and x subscales represent CMPAS-NRT precipitation product samples and observed precipitation samples, respectively. rBIAS is dimensionless and was used to measure the deviation of precipitation products from rain-gauge observations. When multiplied by 100, rBIAS expresses the degree of overestimation or underestimation as a percentage. CORR was used to quantify the correlation between precipitation products and rain-gauge observations. KGE is an objective performance metric combining correlation, bias, and variability. The bias is the ratio of estimated and observed means, and the variability is the ratio of the estimated and observed coefficients of variation.
In practical applications, the ability of precipitation products to capture rainfall events also needs to be considered. This study also utilized the hit rate (or probability of detection, POD), false-alarm rate (FAR), frequency bias index (FBI), and Threat Score (TS)—statistical metrics that are widely used to analyze the agreement of observed rainfall events with those estimated using precipitation products [54]. Among them, a higher POD indicated a lower probability of a precipitation event being missed, a lower FAR indicated a lower probability of a precipitation event being misforecast, FBI indicated whether the CMPAS-NRT product tended to underestimate (FBI < 1) or overestimate (FBI > 1) precipitation events, and the TS provided a composite performance of the CMPAS-NRT product. Overall, perfect agreement between observations and the CMPAS-NRT product would be demonstrated if FBI = 1, FAR = 0, POD = 1, and TS = 1. The formulae for each evaluation index are as follows:
POD = H H + M ,
FAR = F H + F ,
FBI = H + F H + M ,
TS = H H + F + M ,
where H (Hits) is the frequency of simultaneous rain observed by the precipitation product and rain gauge; F (False Alarm) is the frequency of rain observed by the precipitation product without rain; and M (Misses) is the frequency of rain observed by the precipitation product without rain. Five different precipitation threshold ranges were defined to distinguish the combined performances of the CMPAS-NRT products under different rain intensity conditions—specifically, light rain (0.1–2 mm/h), moderate rain (2–5 mm/h), heavy rain (5–10 mm/h), rainstorm (10–20 mm/h), and heavy rainstorm (>20 mm/h).

2.3.3. Regional Division

It was necessary to carry out a detailed spatial assessment of the CMPAS-NRT product. For this purpose, the Meiyu monitoring area was divided into four main sub-regions (R1-R4). The rules for the zoning were as follows: first, all observation grid cells were ranked from smallest to largest according to their accumulated precipitation during the Meiyu period of 2020. The stations were, then simply grouped according to their ranking, with region R1 being those stations included in the first quartile (Q1 to Q25) after the ranking process, R2 being those stations included in the second quartile of the ranking (Q25 to Q50), R3 being those stations in Q50 to Q75, and R4 being those stations in Q75 to Q100. Figure 3 shows the spatial distribution of these four sub-regions in comparison with the difference in the average accumulated precipitation in the four sub-regions. According to the classification, R1 represents the area with the least precipitation (the “less-rainfall area”) in the whole Meiyu monitoring area, while R4 is the area with the most precipitation (the “more-rainfall area”).

3. Results

3.1. Evaluation of CMPAS-NRT Products

Boxplots of the CMPAS-NRT products for the evaluation indicators in different regions during the rainy season of 2020 are given in Figure 4, and the overall evaluation results for each region are given in Table 1. For the Meiyu monitoring area, the ME indicators are uniformly distributed around the value of 0, mainly concentrated between −0.1 and 0.1 mm/h, and the CMPAS-NRT product is basically consistent with the ground observation results. The overall MEs for regions R1 to R4 are 0.0339 mm/h, 0.0076 mm/h, −0.0013 mm/h, and −0.034 mm/h, respectively, and it can be seen that the deviations in regions R2 and R3 are the smallest and closer to the value of 0. The deviations of precipitation in regions R1 and R4 are larger, with obvious positive and negative deviations respectively, and since the amount of precipitation in R4 is also the largest, the fluctuation range of deviation is also the most obvious. The rBIAS results are similar to the ME results, since the value of precipitation in R1 is significantly smaller than that in R4, but the difference in the ME values between the two is not significant. Therefore, the fluctuation range of rBIAS in R1 is the largest, reflecting the obvious overestimation of precipitation. The CMPAS-NRT product is derived from the merging of ground, radar, and satellite precipitation products, so will itself be affected by the radar and satellite precipitation estimation errors. Since the radar- and satellite-inversion precipitation are obtained by the inversion of the observed airborne cloud and rain particle information, some of the estimated precipitation may evaporate before reaching the ground, resulting in partial overestimation of precipitation at small rainfall magnitudes [55].
The RMSE for the whole Meiyu monitoring area is 0.903 mm/h, and the values followed the order R4 > R3 > R2 > R1, with the largest RMSE of 1.165 mm/h in region R4 with the highest rainfall. The CORRs for R2, R3, and R4 are basically the same overall, all at around 0.92, while the overall CORR for region R1 is slightly lower, at 0.86. The performances of the POD, FAR, FBI, and TS indicators in each region are similar to CORR, with R2, R3, and R4 being slightly better than R1. It shows that the CMPAS-NRT product captures precipitation events with better agreement with observations in the regions with higher rainfall, while in the region with less rainfall, R1, a relatively low hit rate with a relatively high false alarm rate occurs, indicating that more cases of false precipitation occur in this region.
We also analyzed the spatial distribution of each indicator for the whole rainy season (Figure 5). Combined with the regional division in Figure 3, there is a certain correlation in the spatial distribution characteristics of the various indicators. ME and rBIAS can respectively indicate the magnitude of the precipitation deviation and the ratio of the precipitation deviation to the average precipitation, Figure 5a,b points out that the regions where CMPAS-NRT underestimates precipitation more obviously are mainly in southern Anhui and northern Jiangxi Province, which belong to the R4 sub-region. The large values of RMSE are concentrated in the southwestern part of Anhui in the R4 subregion, which are larger than 2 mm/h. The CORRs in this subregion are also slightly lower than those in the R1 subregion. The spatial distributions of POD, FAR, FBI, and TS are basically the same, reflecting that the ability to capture precipitation processes is better in Hubei, southern Henan, and southern Jiangsu than in Anhui, northern Hunan, northern Jiangxi, and eastern Zhejiang Province. Table 1 and Figure 6 show that the spatial distribution form of KGE indicators are similar to the correlation coefficient, which is 0.888 for the overall Meiyu monitoring area, with R1 area less than 0.8 and R2~R4 area around 0.9.

3.2. Analysis of the Spatial and Temporal Distribution Characteristics of Precipitation

The scatterplot in Figure 7 is based on the cumulative precipitation for each pixel of the CMPAS-NRT product and ground observations, and a linear fit is also applied (red line), with the black dashed line indicating the line where the comparison between observations and the product is 1:1. The results show that the CMPAS-NRT product can better estimate the sum of precipitation during the rainy season, and the accumulated precipitation is largely uniformly distributed around the 1:1 line. The average cumulative precipitation of the whole Meiyu monitoring area measured by the rain-gauge observations is 666.792 mm, and the result of the CMPAS-NRT product is 668.879 mm, which differs from the rain-gauge data by 0.31%. The slope of the linear fit of the scatter points is 0.836, which is slightly lower than 1.00, and the position of the intersection of the linear fit line with the 1:1 line is 750 mm, indicating that there is a systematic overestimation of precipitation for grid points with accumulated precipitation below 750 mm for the CMPAS-NRT product during the Meiyu period, while underestimation is more obvious for grid points with accumulated precipitation above 750 mm.
To investigate the ability of the CMPAS-NRT product to capture the temporal variability of the precipitation process, we plotted the time series of area-mean precipitation (Figure 8b), and the time series of precipitation for some representative significant grid points (Figure 8(c1–c5)). Overall, the CMPAS-NRT product can accurately capture the temporal variation of the precipitation process during the Meiyu period, which is basically consistent with the temporal evolution of precipitation reflected by rain gauges. However, some differences may exist in localized areas. Points 1, 2, and 3 in Figure 8a are the grid cells where the CMPAS-NRT product exhibits high uncertainty (calculated RMSE exceeds 2.5 mm/h). Figure 8(c1–c3), corresponding to Points 1, 2, and 3, compare the time series of precipitation observations and estimates, and show that the CMPAS-NRT product can differ somewhat from the observations in the magnitude of precipitation, and the precipitation extremes can occur at slightly different times. For example, on the Point 1, the observed rainfall extremes at 08:00 18 July are 70.4 mm/h, while the CMPAS-NRT product shows the rainfall at this point to be only 26.59 mm/h. Points 4 and 5 in Figure 8a are the grid points with the highest cumulative precipitation and the highest hourly rainfall during the entire rainy season, respectively, and the CMPAS-NRT product is in good agreement with the observations at most times (Figure 8(c4,c5)). In this respect, the poor reproduction of the extremes of stronger precipitation at a single point by the CMPAS-NRT product is not only related to the spatial representativeness of the grid and station observations, but also to the existence of an upper limit on the sensitivity of the satellite sensor to the remote sensing of precipitation [56]. Such as, IMERG precipitation estimation product is produced with the GPM retrieval algorithms using observations from the dual-frequency channels of the DPR and the high-frequency channels of the GMI. The upper limit of rain rate that can be observed by DPR is 110 mm/h. The upper limit of rain rate that can be observed by GMI is 60 mm/h. So, the precipitation estimate from satellite sensors has an upper bound due to sensor sensitivity [56].
We applied the empirical orthogonal function (EOF), which is a common method for studying the spatial and temporal variability of precipitation characteristics in East Asia [57], to compare the spatial and temporal patterns of day-by-day precipitation variability in the Meiyu monitoring area (see Hannachi et al. [58] for more details on the EOF analysis method). Figure 9 shows the main spatial modal distribution patterns of the day-by-day precipitation analysis obtained from the observations and CMPAS-NRT products, respectively. The cumulative variance contribution of the first six eigenvectors of the observation reaches 59.97%, while the corresponding CMPAS-NRT product is 60.895%. It shows that CMPAS-NRT can accurately capture the spatial distribution characteristics of precipitation in each mode. The observation given in mode 1 reflects that the rainband is mainly located in the area south of the Yangtze River, and the northern part of the Meiyu monitoring area has low precipitation—the typical “southern flood and northern drought” pattern. Combined with Figure 2b, the precipitation pattern mainly corresponds to the first half of June, the transition period from the pre-flood period to the Meiyu in southern China, when the southward rainband has not yet shown significant northward lift. The spatial distribution of the CMPAS-NRT products in Mode 1 is basically consistent with the observations, except that the intensity of the precipitation is weak. The spatial pattern of precipitation and the intensity of rainfall in Mode 2 are highly consistent with each other; the northward lift of the rainfall band is stable along the Yangtze River at this time; and the influence of precipitation is large. In mode 3, the CMPAS-NRT product reflects the precipitation in the southeastern region of Hubei more obviously, and the corresponding Meiyu period is mainly in mid and late July, when the Meiyu rains in the Jiangnan region have ended and the precipitation is mainly concentrated in the northward region of the Yangtze River due to the northward lift of the rainband again. For the time coefficient principal component, its sign determines the direction of each mode, with a positive sign (+) indicating the same direction as the mode and a negative sign (−) indicating the opposite direction from the mode. The degree of modal typicality depends on the magnitude of the absolute value of its time coefficient, and the CMPAS-NRT product and observation are also basically consistent in their performance in this regard.

3.3. Performance of CMPAS-NRT Products under Different Hourly Rainfall Thresholds

Figure 10 reflects that the variation of various indicators with the precipitation threshold is consistent in different regions. ME is greater than 0 in all regions at the light rainfall magnitude level, indicating that CMPAS-NRT overestimates precipitation at this level. With the gradual increase in rain intensity, ME decreases more rapidly, and the underestimation of precipitation by CMPAS-NRT becomes more obvious. In R4, the heavy rainstorm magnitude ME is −5.9 mm/h. The rBIAS shows a more obvious bias than the ME in the small rainfall magnitude, which can reach a 20% overestimation in each subregion, and reflects an underestimation of about 20% in the large rainfall magnitude. The RMSE gradually increases with the increase in the precipitation threshold from 0.8 mm/h to 10.4 mm/h. The performance of the MAE indicator is basically the same as the RMSE, but on a smaller scale. The POD of light rainfall is the highest, which can reach 0.9, and decreases with the increase in rain intensity. The lowest FAR for light rainfall magnitudes and the highest FAR precipitation segments occur at moderate to rainstorm magnitudes, and the largest FAR can reach above 0.35 in the R1 region, indicating that more false precipitation estimates occur in this region, and the misreporting of precipitation mainly occurs above heavy rainfall magnitudes. The FBI can be maintained around the value of 1 for all precipitation thresholds, indicating that the deviations of CMPAS-NRT are in acceptable range. The TSs are also in general agreement with the FAR.
Figure 11 presents the precipitation occurrence at different precipitation thresholds. As shown in the Figure 11, the CMPAS-NRT product has more occurrences of non-precipitation hours compared to the ground-based observations, indicating the presence of some precipitation under-reporting. On average, the non-precipitation periods account for 81% of the total in the entire rainfall monitoring area in the observations, compared to 82.5% in the CMPAS-NRT product. CMPAS-NRT tends to overestimate the dry periods in the more-rainy areas (R2-R4). For the hourly rainfall statistics, CMPAS-NRT underestimates the frequency of occurrence of both the light rainfall magnitude and the heavy rainstorm magnitude, while it overestimates the moderate to heavy rainfall magnitude, and the CMPAS-NRT product largely agrees with observations at the rainstorm magnitude.
Figure 12, on the other hand, gives the contribution of precipitation to total precipitation for different precipitation thresholds. CMPAS-NRT overestimates the precipitation contribution at the light and moderate rainfall magnitudes, while it underestimates the precipitation contribution at the rainstorm and heavy rainstorm magnitudes, and both largely coincide at the heavy rainfall magnitudes. When the precipitation threshold is in the range of 0.1 to 2 mm/h, the CMPAS-NRT product obtains an average of 17.5% of the total precipitation for this threshold, which agrees well with the observed results (15.5%). In the rainy area (R2–R4), the contribution of light rainfall to the total precipitation is small (mainly concentrated between 10% and 20%), while for the less-rainy zone R1, this contribution can reach 30%. When the precipitation threshold is in the range of 2–5 mm/h, the difference in the precipitation contribution is decreasing from R2-R4 compared to R1. By the time of 5–10 mm/h, the distribution of the precipitation contribution rate in each sub-region is basically the same, and the precipitation contribution rate of this magnitude is higher in the rainy area as the rain intensity increases to the rainstorm and heavy rainstorm magnitude.
Overall, it is shown that the CMPAS-NRT product is generally reasonable in its measurability of precipitation occurrence and precipitation amount, and remains largely consistent with observations. The CMPAS-NRT product is able to accurately identify heavy rainfall events, but is relatively weak in capturing light- and heavy-rainstorm rain events, and thus needs further improvement. Prakash et al. [59] also provided an analysis in which they compared TMPA-3B42 data with observations on days with weak and heavy precipitation rates, and noted that TMPA-3B42 performs poorly in correctly detecting weak and heavy precipitation events.

3.4. Performance of CMPAS-NRT Products in Reproducing the Daily Variation of Precipitation

Studying the daily variation of precipitation can help to understand the physical mechanisms of weather and climate evolution [60] and provide a more rational approach for the parametric validation of weather forecasts and climate models [61]. To examine the reliability of the daily variation characteristics of precipitation reflected in the CMPAS-NRT product, in addition to analyzing the daily variation characteristics of the error indicators of the precipitation product, it is necessary to further understand the daily variation of the precipitation amount, frequency, and intensity. Figure 13 shows a comparative analysis of the daily variation of the different evaluation indicators of the CMPAS-NRT products. Except for rBIAS, which basically remains stable from 0 to 23 h, all other indicators show obvious daily variation patterns. r2 and r3 remain near the value of 0 from 0 to 23 h, while r1 and r4 have larger daily average deviations of 13% and −7%, respectively. The RMSE shows a uniform pattern in terms of daily variation in each region. It starts to increase after 02:00 Beijing time, with a small decrease at 12:00, and reaches a peak of 1.35 mm/h at 17:00. The CORR of R1 is smaller than all other regions and remains stable at about 0.86, while R2-R4 are basically stable at about 0.93 throughout the day, with the lowest value appearing after noon. The CMPAS-NRT product has a better hit rate in precipitation monitoring during the day than at night, with a fluctuation range of 0.75–0.85. The FAR is as low as 0.1 at 08:00 and as high as 0.19 at 15:00. Moreover, the FAR is relatively higher in R1, reaching 0.24. The daily variation pattern of the TS is basically the same as that of POD, and the fluctuation range of each region is 0.61–0.78.
For the daily variation of precipitation (Figure 14), the ground-based observations and the CMPAS-NRT product maintain a high agreement in terms of the values and daily variation patterns in all regions, except for a small overestimation in the R1 sub-region and a small underestimation in the R4 sub-region. There is some variation in the frequency of precipitation. The CMPAS-NRT product gives a delayed lag in the occurrence of peak precipitation frequency compared to the observation, and the CMPAS-NRT product shows an underestimation of precipitation frequency in all regions at night. After noon, the CMPAS-NRT product monitors the peak frequency of precipitation occurrence for the day, and there is a brief overestimation. The CMPAS-NRT product clearly overestimates the intensity of precipitation at night, while the intensity of precipitation is better estimated during the day. In terms of each sub-region, there is an underestimation of precipitation intensity in the afternoon during the day in R4, a significant overestimation of precipitation during the night in R1 to R3, and a higher intensity of precipitation in the more-rainy regions than in the less-rainy regions. This finding is also consistent with the results of the IMERG product analyzed by Li et al. [62], and the specific reason may be related to the different types of precipitation clouds that dominate during the day and night, and the general difference in the sensor’s ability to detect them [63]. The CMPAS-NRT product’s incorporation of satellite data is therefore also influenced by this factor.
We further calculated the joint probability density distribution function (JPDF) of precipitation intensity and daily variation [64]. For the whole region (Figure 15), the rain gauges show an obvious diurnal variation for the different rain intensity classes, i.e., daytime precipitation is significantly more than nighttime precipitation. There are also differences in the peak precipitation times for different rain intensity classes, with the peak precipitation occurring further ahead as the rain intensity increases. The peak time of precipitation for light rain is generally concentrated in the afternoon, the peak time of precipitation for medium rain appears at 12:00 noon, while the peak time of precipitation for heavy rain to heavy rainstorm appears at 08:00~10:00 am. The two classes of heavy rain and rainstorm contribute the most to the total precipitation, while the contribution of light and heavy rainstorm to the total precipitation is relatively small. The CMPAS-NRT product shows the same pattern, but the peak precipitation is maintained longer for moderate to heavy rainfall, and the peak of light rainfall in the late afternoon is significantly overestimated. For each sub-region, there are significant differences in the timing of precipitation peaks and the intensity level of precipitation that contributes most to the total precipitation. The timing of peak precipitation occurrence in the less-rainy zone R1 is mainly concentrated between late afternoon and evening, and the type of rainfall intensity that has the greatest impact on the total precipitation is small to heavy rainfall, with the least contribution from heavy-rainstorm rain. For the rainy zone R4, the largest contribution to the total precipitation has changed to the rain intensity of the rainstorm class. The CMPAS-NRT product basically overestimates light to heavy rainfall throughout the day in almost all areas and underestimates heavy rain to heavy-rainstorm rain in all areas—a feature that is most evident in rainy area R4, while the difference is more pronounced in the late afternoon for the less-rainy area R1.

4. Discussion

CMPAS-NRT, a high-resolution gauge-radar-satellite merged precipitation product, has a wide range of applications in scientific and operational work. In this study, we took a super-long Meiyu precipitation process experienced in the Yangtze River basin in the summer of 2020 as the research object and evaluated the descriptive capability of the CMPAS-NRT product for the process from multiple perspectives, such as error indicators, precipitation characteristics, and daily variability in different rainfall areas, using dense surface rain-gauge observational data as a reference.
Overall, the statistical error indicators for the CMPAS-NRT product in this region are, respectively, 0.902 mm/h (RMSE), 0.913 (CORR), and 0.888 (KGE). Shen et al. [31] pointed out that RMSE of the summer merged precipitation product in the southern region of China in 2015 is 2.155 mm/h with a correlation coefficient of 0.939, and RMSE in the central China region is 1.934 with a correlation coefficient of 0.872. Since the test period and the validation region are not exactly the same, but it shows that the results of this study are basically consistent with Shen Yan’s conclusions. Overestimation of small rainfall magnitudes and underestimation of large rainfall magnitudes are also found for the CMPAS-NRT product in this study. In this respect, the poor reproduction of the extremes of stronger precipitation at a single point by the CMPAS-NRT product is related to the existence of an upper limit on the sensitivity of the satellite sensor to the remote sensing of precipitation [56]. The performance of daily variation of precipitation in the CMPAS-NRT product is basically consistent with the observation, with precipitation concentrated in the early morning to morning, except that the frequency of precipitation at night is slightly lower than the observation, and the intensity of precipitation is slightly higher than the observation. The performance of daily variation of IMERG precipitation product in the Yangtze River basin region studied by Li et al. [62] shows a similar phenomenon. Shuai et al. [65] evaluated the ability of Multi-Satellite Precipitation Products in Capturing the Characteristics of Extreme Climate Events over the Yangtze River Basin, China. Yifan et al. [66] evaluated the GPM IMERG v5 and TRMM 3B42v7 Precipitation Products in the Yangtze RiverBasin, China, which on the precipitation classification test have a similar pattern to the findings in this study.
Wan-Ru et al. [67,68] studied the IMERG precipitation products at multiple spatial and temporal scales and statistically analyzed the seasonal variation of precipitation product quality. Yagmur et al. [69,70,71] examined the satellite precipitation products under various complex terrains. The shortcoming of this study is that the CMPAS-NRT products have not been analyzed at multiple spatial and temporal scales and for complex terrain.
High spatial and temporal resolution, high quality precipitation estimation products are important for simulation and forecasting of catastrophic flash floods. Christos et al. [72] developed a novel nowcasting system, combining a data assimilation system (LAPS), a large amount of observed data, including XPOL radar precipitation measurements, CHAOS, and the WRF-Hydro model. The update of the simulations with assimilated radar data improved the initial precipitation description and led to an improved simulation of the evolution of the phenomenon. George et al. [73] aim to conduct a hydrometeorological analysis of a flash flood event that took place in the sub-urban area of Mandra, western Attica, Greece, using remote-sensing observations and the CHAOS modeling system that includes the WRF-ARW and the WRF-Hydro. The results also demonstrate the potential advantages of high-resolution observations from X-band dual-polarization radar in precipitation simulations. In the future, we will also further develop the application of CMPAS-NRT products in flash flood simulation and early warning work.

5. Summary and Conclusions

The evaluation was carried out on an hour-by-hour precipitation basis, and four sub-regions were delineated according to the differences in total precipitation, with the following main findings:
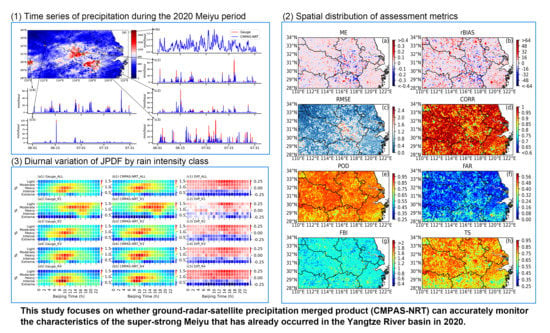
  • The precipitation errors exhibited by the CMPAS-NRT product are within reasonable limits through comparison with ground-based rain gauges. In the Meiyu monitoring area, the CMPAS-NRT product scores 0.0015 mm/h, 0.34%, 0.902 mm/h and 0.913, and 0.815, 0.152, 0.961, 0.711, and 0.888, for each error indicator (ME, rBIAS, RMSE and CORR, and POD, FAR, FBI, TS and KGE, respectively). The CMPAS-NRT product suffers from overestimation of precipitation in the less-rainy zone as well as underestimation of precipitation in the more-rainy zone. The CMPAS-NRT product has a high agreement with observations in terms of its ability to capture precipitation events in the moderate and heavy rainfall areas, while a relatively low hit rate with a relatively high FAR occurring in the less-rainy area.
  • The CMPAS-NRT product shows comparable performance in the measurement of accumulated precipitation with rain-gauge observations, and the estimated total precipitation during the Meiyu period is in general agreement with the rain gauge observations. The CMPAS-NRT product can accurately reflect the evolution of precipitation throughout the Meiyu period, but in localized areas there is an underestimation of extreme precipitation extremes, and there is a lag in the time when precipitation extremes occur in some periods.
  • In capturing the spatial and temporal patterns of precipitation, the CMPAS-NRT products and observations are basically consistent in their spatial distribution patterns of the rainbands, which also reflects the climatic characteristics of the continuous northward lift of the rainbands during the Meiyu period; however, there are some differences in the intensity of precipitation in the expressed rainbands, and the precipitation magnitude in the southern region is underestimated in mode 1.
  • The performance of the CMPAS-NRT product varies significantly at different hourly rainfall thresholds. There is an overestimation of precipitation at the light rainfall magnitude, with an overestimation of up to 20%, a consistency with observations at the medium rainfall magnitude, and an underestimation of precipitation at the heavy rain to heavy rainstorm magnitude, with an underestimation of up to about 20%. The hit rate decreases as the rain intensity increases, and the FAR is somewhat higher at the rainstorm magnitude. Meanwhile, the CMPAS-NRT product has basically reasonable measurability of precipitation occurrence and precipitation amount, and can maintain high agreement with observations, but is relatively weak in capturing light and heavy rainstorm rain events, which needs further improvement.
  • The performance of the CMPAS-NRT product in terms of the daily variation of precipitation is generally consistent with the observations, including the daily variation patterns of precipitation amount, precipitation frequency, and precipitation intensity. The CMPAS-NRT product has a certain delay in the peak of precipitation frequency compared with the rain-gauge observation, and there is an underestimation of precipitation frequency at night, but the CMPAS-NRT product has an overestimation of precipitation intensity at night. The RMSE peaks in the afternoon and is lowest at midnight; CORR is basically stable at around 0.93; POD is higher during the day than at night; and FAR is lowest at 08:00. The CMPAS-NRT product essentially overestimates light to heavy rainfall throughout the day for almost all areas, while underestimating rainstorm to heavy-rainstorm rain for all areas.
Our study is a comprehensive evaluation of the error characteristics of the CMPAS-NRT product in the Meiyu monitoring area, as well as the daily variation and other patterns. However, more in-depth work is needed in the future in order to gain a deeper understanding of the underlying causes of errors. From the results, the performance of the CMPAS-NRT product for precipitation monitoring during the whole period of Meiyu precipitation is basically consistent with the ground-based rain-gauge observations, thus indicating the potential hydrological utilization of the CMPAS-NRT product. However, the quality of the CMPAS-NRT product could be further improved, including addressing issues such as overestimation of light rainfall and underestimation of extreme precipitation, to provide a more accurate hourly precipitation monitoring product, which would have a positive effect on urban areas where heavy rainfall and flooding are frequent.

Author Contributions

Z.P., C.S. conceived and designed the experiments; Z.P. performed the experiments, analyzed the data and wrote the original version; J.G., Y.P. and B.X. polished the document. All authors have read and agreed to the published version of the manuscript.

Funding

This research was funded by the National Key Research and Development Program of China (Grant No. 2018YFC1506604) and Youth Science and Technology Foundation of National Meteorological Information Center (Grant No. NMICQJ9-202101).

Acknowledgments

We thank the provider of CMPAS-NRT precipitation product and Gauge observation data.

Conflicts of Interest

The authors declare no conflict of interest.

References

  1. Ninomiya, K.; Kurihara, K. Forecast Experiment of a Long-lived Meso-α-scale Convective System in Baiu Frontal Zone. J. Meteorol. Soc. Jpn. 1987, 65, 885–899. [Google Scholar] [CrossRef] [Green Version]
  2. Tao, S.-Y.; Ding, Y.-H. Observational Evidence of the Influence of the Qinghai-Xizang (Tibet) Plateau on the Occurrence of Heavy Rain and Severe Convective Storms in China. Bull. Am. Meteorol. Soc. 1981, 62, 23–30. [Google Scholar] [CrossRef]
  3. Ding, Y.H.; Chan, J. The East Asian summer monsoon: An overview. Meteorol. Atmos. Phys. 2005, 89, 117–142. [Google Scholar]
  4. Hsu, W.-R.; Sun, W.-Y. A Numerical Study of a Low-level Jet and Its Accompanying Secondary Circulation in a Mei-Yu System. Mon. Weather. Rev. 1994, 122, 324–340. [Google Scholar] [CrossRef] [Green Version]
  5. Ding, Y. Summer Monsoon Rainfalls in China. J. Meteorol. Soc. Jpn. 1992, 70, 373–396. [Google Scholar] [CrossRef] [Green Version]
  6. Zhang, Q.; Xu, C.-Y.; Zhang, Z.; Chen, Y.D.; Liu, C.-L.; Lin, H. Spatial and temporal variability of precipitation maxima during 1960–2005 in the Yangtze River basin and possible association with large-scale circulation. J. Hydrol. 2008, 353, 215–227. [Google Scholar] [CrossRef]
  7. Li, H.; Hu, Y.; Zhou, Z.; Peng, J.; Xu, X. Characteristic Features of the Evolution of a Meiyu Frontal Rainstorm with Doppler Radar Data Assimilation. Adv. Meteorol. 2018, 2018, 9802360. [Google Scholar] [CrossRef] [Green Version]
  8. Morrissey, M.L.; Maliekal, J.A.; Greene, J.S.; Wang, J. The Uncertainty of Simple Spatial Averages Using Rain Gauge Networks. Water Resour. Res. 1995, 31, 2011–2017. [Google Scholar] [CrossRef]
  9. Xie, P.; Chen, M.; Yang, S.; Yatagai, A.; Hayasaka, T.; Fukushima, Y.; Liu, C. A Gauge-Based Analysis of Daily Precipitation over East Asia. J. Hydrometeorol. 2007, 8, 607–626. [Google Scholar] [CrossRef]
  10. Hong, Y.; Gochis, D.; Cheng, J.; Hsu, K.-L.; Sorooshian, S. Evaluation of PERSIANN-CCS Rainfall Measurement Using the NAME Event Rain Gauge Network. J. Hydrometeorol. 2007, 8, 469–482. [Google Scholar] [CrossRef] [Green Version]
  11. Tian, Y.; Peters-Lidard, C.; Eylander, J.B.; Joyce, R.J.; Huffman, G.; Adler, R.F.; Hsu, K.-L.; Turk, F.J.; Garcia, M.; Zeng, J. Component analysis of errors in satellite-based precipitation estimates. J. Geophys. Res. Space Phys. 2009, 114. [Google Scholar] [CrossRef] [Green Version]
  12. Vasiloff, S.V.; Seo, D.-J.; Howard, K.W.; Zhang, J.; Kitzmiller, D.H.; Mullusky, M.G.; Krajewski, W.F.; Brandes, E.A.; Rabin, R.M.; Berkowitz, D.S.; et al. Improving QPE and Very Short Term QPF: An Initiative for a Community-Wide Integrated Approach. Bull. Am. Meteorol. Soc. 2007, 88, 1899–1911. [Google Scholar] [CrossRef] [Green Version]
  13. Maddox, R.A.; Zhang, J.; Gourley, J.J.; Howard, K.W. Weather Radar Coverage over the Contiguous United States. Weather. Forecast. 2002, 17, 927–934. [Google Scholar] [CrossRef]
  14. Ebert, E.E.; Janowiak, J.E.; Kidd, C. Comparison of Near-Real-Time Precipitation Estimates from Satellite Observations and Numerical Models. Bull. Am. Meteorol. Soc. 2007, 88, 47–64. [Google Scholar] [CrossRef] [Green Version]
  15. Seo, D.-J. Real-time estimation of rainfall fields using radar rainfall and rain gage data. J. Hydrol. 1998, 208, 37–52. [Google Scholar] [CrossRef]
  16. Hong, Y.; Hsu, K.L.; Sorooshian, S.; Gao, X. Precipitation Estimation from Remotely Sensed Imagery Using an Artificial Neural Network Cloud Classification System. J. Appl. Meteorol. 2004, 43, 1834–1853. [Google Scholar] [CrossRef] [Green Version]
  17. Bowman, K.P.; Hong, Y.; Stocker, E.F.; Wol, D.B. The TRMM multi-satellite precipitation analysis: Quasi-global, multi-year, combined sensor precipitation estimates at fine scales. J. Hydrometeorol. 2007, 8, 28–55. [Google Scholar]
  18. Yu, J.; Li, X.-F.; Lewis, E.; Blenkinsop, S.; Fowler, H.J. UKGrsHP: A UK high-resolution gauge–radar–satellite merged hourly precipitation analysis dataset. Clim. Dyn. 2020, 54, 2919–2940. [Google Scholar] [CrossRef] [Green Version]
  19. Huffman, G.J.; Adler, R.F.; Arkin, P.; Chang, A.; Ferraro, R.; Gruber, A.; Janowiak, J.; McNab, A.; Rudolf, B.; Schneider, U. The Global Precipitation Climatology Project (GPCP) combined precipitation dataset. Bull. Am. Meteorol. Soc. 1997, 78, 6–20. [Google Scholar] [CrossRef]
  20. Xie, P.; Arkin, P.A. Global precipitation: A 17-year monthly analysis based on gauge observations, satellite estimates, and numerical model outputs. Bull. Am. Meteorol. Soc. 1997, 78, 2539–2558. [Google Scholar] [CrossRef]
  21. Joyce, R.J.; Janowiak, J.E.; Arkin, P.A.; Xie, P. CMORPH: A Method that Produces Global Precipitation Estimates from Passive Microwave and Infrared Data at High Spatial and Temporal Resolution. J. Hydrometeorol. 2004, 5, 287–296. [Google Scholar] [CrossRef]
  22. Ushio, T.; Sasashige, K.; Kubota, T.; Shige, S.; Okamoto, K.I.; Aonashi, K.; Inoue, T.; Takahashi, N.; Iguchi, T.; Kachi, M.; et al. A Kalman Filter Approach to the Global Satellite Mapping of Precipitation (GSMaP) from Combined Passive Microwave and Infrared Radiometric Data. J. Meteorol. Soc. Jpn. 2009, 87, 137–151. [Google Scholar] [CrossRef] [Green Version]
  23. Seo, D.J.; Breidenbach, J.P. Real-Time Correction of Spatially Nonuniform Bias in Radar Rainfall Data Using Rain Gauge Measurements. J. Hydrometeorol. 2002, 3, 93–111. [Google Scholar] [CrossRef] [Green Version]
  24. Zhang, J.; Howard, K.W.; Langston, C.; Kaney, B.; Qi, Y.; Tang, L.; Grams, H.; Wang, Y.; Cocks, S.; Martinaitis, S.M.; et al. Multi-Radar Multi-Sensor (MRMS) Quantitative Precipitation Estimation: Initial Operating Capabilities. Bull. Am. Meteorol. Soc. 2016, 97, 621–638. [Google Scholar] [CrossRef]
  25. Bhuiyan, M.A.E.; Nikolopoulos, E.I.; Anagnostou, E.N.; Quintana-Seguí, P.; Barella-Ortiz, A. A nonparametric statistical technique for combining global precipitation datasets: Development and hydrological evaluation over the Iberian Peninsula. Hydrol. Earth Syst. Sci. 2018, 22, 1371–1389. [Google Scholar] [CrossRef] [Green Version]
  26. Ehsan Bhuiyan, M.A.; Nikolopoulos, E.I.; Anagnostou, E.N. Machine learning–based blending of satellite and reanalysis precipitation datasets: A multiregional tropical complex terrain evaluation. J. Hydrometeorol. 2019, 20, 2147–2161. [Google Scholar] [CrossRef]
  27. Zhang, L.; Li, X.; Zheng, D.; Zhang, K.; Ma, Q.; Zhao, Y.; Ge, Y. Merging multiple satellite-based precipitation products and gauge observations using a novel double machine learning approach. J. Hydrol. 2021, 594, 125969. [Google Scholar] [CrossRef]
  28. Derin, Y.; Bhuiyan, A.E.; Anagnostou, E.; Kalogiros, J.; Anagnostou, M.N. Modeling Level 2 Passive Microwave Precipitation Retrieval Error Over Complex Terrain Using a Nonparametric Statistical Technique. In IEEE Transactions on Geoscience and Remote Sensing (Early Access); IEEE: New York, NY, USA, 2021; pp. 1–12. [Google Scholar] [CrossRef]
  29. Shi, C.X.; Pan, Y.; Gu, J.X.; Xu, B.; Han, S.; Zhu, Z.; Zhang, L.; Sun, S.; Jiang, Z.W. A review of multi-source meteorological data fusion products. Acta Meteorol. Sin. 2019, 77, 774–783. [Google Scholar]
  30. Shen, Y.; Zhao, P.; Pan, Y.; Yu, J. A high spatiotemporal gauge-satellite merged precipitation analysis over China. J. Geophys. Res. Atmos. 2014, 119, 3063–3075. [Google Scholar] [CrossRef]
  31. Shen, Y.; Hong, Z.; Pan, Y.; Yu, J.; Maguire, L. China’s 1 km Merged Gauge, Radar and Satellite Experimental Precipitation Dataset. Remote Sens. 2018, 10, 264. [Google Scholar] [CrossRef] [Green Version]
  32. Shen, Y.; Pan, Y.; Yu, J.J.; Zhao, P.; Zhou, Z.J. Quality assessment of hourly merged precipitation product over China. Trans. Atmos. Sci. 2013, 36, 37–46. [Google Scholar]
  33. Pan, Y.; Shen, Y.; Yu, J.J.; Zhao, P. Analysis of the combined gauge-satellite hourly precipitation over China based on the OI technique. Acta Meteorol. Sin. 2012, 70, 1381–1389. [Google Scholar]
  34. Pan, Y.; Shen, Y.; Yu, J.; Xiong, A. An experiment of high-resolution gauge-radar-satellite combined precipitation retrieval based on the Bayesian merging method. Acta Meteorol. Sin. 2015, 73, 177–186. [Google Scholar]
  35. Pan, Y.; Gu, J.; Yu, J.; Shen, Y.; Shi, C.; Zhou, Z. Test of merging methods for multi-source observed precipitation products at high resolution over China. Acta Meteorol. Sin. 2018, 76, 755–766. [Google Scholar]
  36. Pan, Y.; Gu, J.X.; Xu, B. Advances in multi-source precipitation merging research. Adv. Meteorol. Sci. Technol. 2018, 8, 143–152. [Google Scholar]
  37. Bai, L.; Wen, Y.; Shi, C.; Yang, Y.; Zhang, F.; Wu, J.; Gu, J.; Pan, Y.; Sun, S.; Meng, J. Which Precipitation Product Works Best in the Qinghai-Tibet Plateau, Multi-Source Blended Data, Global/Regional Reanalysis Data, or Satellite Retrieved Precipitation Data? Remote Sens. 2020, 12, 683. [Google Scholar] [CrossRef] [Green Version]
  38. Kitzmiller, D.; Miller, D.A.; Fulton, R.; Ding, F. Radar and Multisensor Precipitation Estimation Techniques in National Weather Service Hydrologic Operations. J. Hydrol. Eng. 2013, 18, 133–142. [Google Scholar] [CrossRef]
  39. Shen, Y.; Xiong, A.; Wang, Y.; Xie, P. Performance of high-resolution satellite precipitation products over China. J. Geophys. Res. Space Phys. 2010, 115, 1–17. [Google Scholar] [CrossRef]
  40. Shen, Y.; Xiong, A.; Hong, Y.; Yu, J.; Pan, Y.; Chen, Z.; Saharia, M. Uncertainty analysis of five satellite-based precipitation products and evaluation of three optimally merged multi-algorithm products over the Tibetan Plateau. Int. J. Remote Sens. 2014, 35, 6843–6858. [Google Scholar] [CrossRef]
  41. Sharifi, E.; Steinacker, R.; Saghafian, B. Assessment of GPM-IMERG and other precipitation products against gauge data under different topographic and climatic conditions in Iran: Preliminary results. Remote Sens. 2016, 8, 135. [Google Scholar] [CrossRef] [Green Version]
  42. Dezfuli, A.K.; Ichoku, C.M.; Huffman, G.J.; Mohr, K.I.; Selker, J.S.; Van De Giesen, N.; Hochreutener, R.; Annor, F.O. Validation of IMERG precipitation in Africa. J. Hydrometeorol. 2017, 18, 2817–2825. [Google Scholar] [CrossRef]
  43. Hakuba, M.Z.; Folini, D.; Sanchez-Lorenzo, A.; Wild, M. Spatial representativeness of ground-based solar radiation measurements-Extension to the full Meteosat disk. J. Geophys. Res. Atmos. 2014, 119, 11760–11771. [Google Scholar] [CrossRef]
  44. Wang, K.; Augustine, J.; Dickinson, R.E. Critical assessment of surface incident solar radiation observations collected by SURFRAD, USCRN and AmeriFlux networks from 1995 to 2011. J. Geophys. Res. Space Phys. 2012, 117, 1–8. [Google Scholar] [CrossRef] [Green Version]
  45. Zhang, Y.; Long, C.N.; Rossow, W.B.; Dutton, E.G. Exploiting diurnal variations to evaluate the ISCCP-FD flux calculations and radiative-flux-analysis-processed surface observations from BSRN, ARM, and SURFRAD. J. Geophys. Res. Space Phys. 2010, 115, 38–58. [Google Scholar] [CrossRef] [Green Version]
  46. Tang, G.; Behrangi, A.; Long, D.; Li, C.; Hong, Y. Accounting for spatiotemporal errors of gauges: A critical step to evaluate gridded precipitation products. J. Hydrol. 2018, 559, 294–306. [Google Scholar] [CrossRef] [Green Version]
  47. Ding, Y.; Liu, Y.; Hu, Z.-Z. The Record-breaking Meiyu in 2020 and Associated Atmospheric Circulation and Tropical SST Anomalies. Adv. Atmos. Sci. 2021, 11, 1–14. [Google Scholar] [CrossRef]
  48. Huang, Q.L.; Wang, L.J.; Li, Y.; He, J.H. Determination of the onset and ending of regional Meiyu over Yangtze-Huaihe River Valley and its characteristics. J. Trop. Meteorol. 2012, 28, 749–756. [Google Scholar]
  49. Li, N.; Tang, G.; Zhao, P.; Hong, Y.; Gou, Y.; Yang, K. Statistical assessment and hydrological utility of the latest multi-satellite precipitation analysis IMERG in Ganjiang River basin. Atmos. Res. 2017, 183, 212–223. [Google Scholar] [CrossRef]
  50. Ren, Z.H.; Zhao, P.; Zhang, Q.; Zhang, Z.F.; Cao, L.J.; Yang, Y.R.; Zou, F.L.; Zhao, Y.F.; Zhao, H.M.; Chen, Z. Quality control procedures for hourly precipitation data from automatic weather stations in China. Meteorol. Mon. 2010, 36, 123–132. [Google Scholar]
  51. Guo, H.; Chen, S.; Bao, A.; Hu, J.; Gebregiorgis, A.S.; Xue, X.; Zhang, X. Inter-Comparison of High-Resolution Satellite Precipitation Products over Central Asia. Remote Sens. 2015, 7, 7181–7211. [Google Scholar] [CrossRef] [Green Version]
  52. Tan, M.L.; Santo, H. Comparison of GPM IMERG, TMPA 3B42 and PERSIANN-CDR satellite precipitation products over Malaysia. Atmos. Res. 2018, 202, 63–76. [Google Scholar] [CrossRef]
  53. Beck, H.E.; Pan, M.; Roy, T.; Weedon, G.P.; Pappenberger, F.; van Dijk, A.I.J.M.; Huffman, G.J.; Adler, R.F.; Wood, E.F. Daily evaluation of 26 precipitation datasets using Stage-IV gauge-radar data for the CONUS. Hydrol. Earth Syst. Sci. 2019, 23, 207–224. [Google Scholar] [CrossRef] [Green Version]
  54. Wang, W.; Lu, H.; Zhao, T.; Jiang, L.; Shi, J. Evaluation and comparison of daily rainfall from latest GPM and TRMM products over the Mekong River Basin. IEEE J. Sel. Top. Appl. Earth Obs. Remote Sens. 2017, 10, 2540–2549. [Google Scholar] [CrossRef]
  55. Rozante, J.R.; Cavalcanti, I.F.A. Regional Eta model experiments: SALLJEX and MCS development. J. Geophys. Res. Space Phys. 2008, 113, 1–20. [Google Scholar] [CrossRef] [Green Version]
  56. Skofronick-Jackson, G.; Petersen, W.A.; Berg, W.; Kidd, C.; Stocker, E.F.; Kirschbaum, D.; Kakar, R.; Braun, S.A.; Huffman, G.; Iguchi, T.; et al. The Global Precipitation Measurement (GPM) Mission for Science and Society. Bull. Am. Meteorol. Soc. 2017, 98, 1679–1695. [Google Scholar] [CrossRef]
  57. Huang, W.-R.; Wang, S.-Y.S. Future changes in propagating and non-propagating diurnal rainfall over East Asia. Clim. Dyn. 2017, 49, 375–389. [Google Scholar] [CrossRef] [Green Version]
  58. Hannachi, A.; Jolliffe, I.T.; Stephenson, D.B. Empirical orthogonal functions and related techniques in atmospheric science: A review. Int. J. Clim. 2007, 27, 1119–1152. [Google Scholar] [CrossRef]
  59. Prakash, S.; Gairola, R.M. Validation of TRMM-3B42 precipitation product over the tropical Indian Ocean using rain gauge data from the RAMA buoy array. Theor. Appl. Clim. 2014, 115, 451–460. [Google Scholar] [CrossRef]
  60. Yu, R.; Li, J.; Chen, H.; Yuan, W. Progress in studies of the precipitation diurnal variation over contiguous China. J. Meteorol. Res. 2014, 28, 877–902. [Google Scholar] [CrossRef]
  61. Zhang, Y.; Chen, H. Comparing CAM5 and Superparameterized CAM5 Simulations of Summer Precipitation Characteristics over Continental East Asia: Mean State, Frequency–Intensity Relationship, Diurnal Cycle, and Influencing Factors. J. Clim. 2016, 29, 1067–1089. [Google Scholar] [CrossRef]
  62. Li, R.; Wang, K.; Qi, D. Validating the Integrated Multisatellite Retrievals for Global Precipitation Measurement in Terms of Diurnal Variability with Hourly Gauge Observations Collected at 50,000 Stations in China. J. Geophys. Res. Atmos. 2018, 123, 423–442. [Google Scholar] [CrossRef]
  63. Kummerow, C.; Hong, Y.; Olson, W.S.; Yang, S.; Adler, R.F.; Mccollum, J.; Ferraro, R.; Petty, G.; Shin, D.-B.; Wilheit, T.T. The Evolution of the Goddard Profiling Algorithm (GPROF) for Rainfall Estimation from Passive Microwave Sensors. J. Appl. Meteorol. 2001, 40, 1801–1820. [Google Scholar] [CrossRef]
  64. Lee, H.; Waliser, D.E.; Ferraro, R.; Iguchi, T.; Tian, B.; Loikith, P.C.; Wright, D.B.; Peters-Lidard, C.D. Evaluating hourly rainfall characteristics over the U.S. Great Plains in dynamically downscaled climate model simulations using NASA-Unified WRF. J. Geophys. Res. Atmos. 2017, 122, 7371–7384. [Google Scholar] [CrossRef]
  65. Xiao, S.; Xia, J.; Zou, L. Evaluation of multi-satellite precipitation products and their ability in capturing the characteristics of extreme climate events over the Yangtze River Basin, China. Water 2020, 12, 1179. [Google Scholar] [CrossRef] [Green Version]
  66. Wu, Y.; Zhang, Z.; Huang, Y.; Jin, Q.; Chen, X.; Chang, J. Evaluation of the GPM IMERG v5 and TRMM 3B42 v7 Precipitation Products in the Yangtze River Basin, China. Water 2019, 11, 1459. [Google Scholar] [CrossRef] [Green Version]
  67. Huang, W.R.; Chang, Y.H.; Liu, P.Y. Assessment of IMERG precipitation over Taiwan at multiple timescales-ScienceDirect. Atmos. Res. 2018, 214, 239–249. [Google Scholar] [CrossRef]
  68. Huang, W.-R.; Liu, P.-Y.; Chang, Y.-H.; Liu, C.-Y. Evaluation and Application of Satellite Precipitation Products in Studying the Summer Precipitation Variations over Taiwan. Remote Sens. 2020, 12, 347. [Google Scholar] [CrossRef] [Green Version]
  69. Derin, Y.; Anagnostou, E.; Berne, A.; Borga, M.; Boudevillain, B.; Buytaert, W.; Chang, C.H.; Chen, H.; Delrieu, G.; Hsu, Y.C.; et al. Evaluation of GPM-era global satellite precipitation products over multiple complex terrain regions. Remote Sens. 2019, 11, 2936. [Google Scholar] [CrossRef] [Green Version]
  70. Derin, Y.; Anagnostou, E.; Berne, A.; Borga, M.; Boudevillain, B.; Buytaert, W.; Chang, C.H.; Delrieu, G.; Hong, Y.; Hsu, Y.C.; et al. Multiregional satellite precipitation products evaluation over complex terrain. J. Hydrometeorol. 2016, 17, 1817–1836. [Google Scholar] [CrossRef]
  71. Derin, Y.; Yilmaz, K.K. Evaluation of multiple satellite-based precipitation products over complex topography. J. Hydrometeorol. 2014, 15, 1498–1516. [Google Scholar] [CrossRef] [Green Version]
  72. Spyrou, C.; Varlas, G.; Pappa, A.; Mentzafou, A.; Katsafados, P.; Papadopoulos, A.; Anagnostou, M.N.; Kalogiros, J. Implementation of a Nowcasting Hydrometeorological System for Studying Flash Flood Events: The Case of Mandra, Greece. Remote Sens. 2020, 12, 2784. [Google Scholar] [CrossRef]
  73. Varlas, G.; Anagnostou, M.N.; Spyrou, C.; Papadopoulos, A.; Kalogiros, J.; Mentzafou, A.; Michaelides, S.; Baltas, E.; Karymbalis, E.; Katsafados, P. A multi-platform hydrometeorological analysis of the flash flood event of 15 November 2017 in Attica, Greece. Remote Sens. 2019, 11, 45. [Google Scholar] [CrossRef] [Green Version]
Figure 1. The Köppen-Geiger climate map. The area circled in red is the Meiyu monitoring area of this study.
Remotesensing 13 03850 g001
Figure 2. (a) Spatial distribution of surface rainfall observation stations in the Meiyu monitoring area (28°–34°N, 110°–122.5°E) and topographic features, in which the red dots denote the rain gauges of automatic weather stations and the filled parts indicate the topographic height (blue line is the main river). (b) Time-latitude profile of daily precipitation averaged along 110°–122.5°E during the 2020 Meiyu precipitation period (1 June–31 July), in which the red dashed line represents the north-south boundary of the Meiyu monitoring area.
Remotesensing 13 03850 g002
Figure 3. (a) Spatial distribution of four sub-regions within the Meiyu monitoring area. (b) Comparison of the differences in the average accumulated precipitation of the four sub-regions during the Meiyu precipitation period in 2020.
Remotesensing 13 03850 g003
Figure 4. Comparative boxplots of the CMPAS–NRT product for different assessment metrics (including each sub–region and the whole region) in the rain monitoring area during the 2020 Meiyu period, in which the red line in the box indicates the median, the plus sign indicates the mean, and the horizontal lines in each boxplot sub–table indicate the 10th, 25th, 75th, and 90th percentiles of that assessment metric. Panels (ah) respectively represent the ME, rBIAS, RMSE, CORR, POD, FAR, FBI, and TS.
Remotesensing 13 03850 g004
Figure 5. Spatial distributions of different assessment metrics of the CMPAS-NRT product in the Meiyu monitoring area during the 2020 Meiyu period. Panels (ah) respectively represent the ME, rBIAS, RMSE, CORR, POD, FAR, FBI, and TS.
Remotesensing 13 03850 g005
Figure 6. (a) Spatial distributions of KGE metric of the CMPAS-NRT product in the Meiyu monitoring area during the 2020 Meiyu period. (b) Boxplots of the CMPAS-NRT product for KGE metric in the rain monitoring area.
Remotesensing 13 03850 g006
Figure 7. Scatterplot of cumulative rainfall observed by surface rain gauges compared to the CMPAS-NRT product in the Meiyu monitoring area during the 2020 Meiyu precipitation period, and their linear regression distribution fits (red straight lines).
Remotesensing 13 03850 g007
Figure 8. Spatial distribution of accumulated precipitation in the RMSE during the rainy season of 2020 (a), hourly time series of average precipitation in the area of rain-gauge observations (red) and CMPAS-NRT products (blue) in the RMSE (b), and hourly time series of precipitation for selected grid cells (c1c5), where (c1c3) are three grid points with RMSE greater than 2.5 mm/h, (c4) is the grid point with the largest cumulative precipitation, and (c5) is the grid point with the largest hourly precipitation.
Remotesensing 13 03850 g008
Figure 9. Analysis of empirical orthogonal function (EOF) modalities of daily precipitation between rain-gauge observations and CMPAS-NRT products in the Meiyu monitoring area during the 2020 Meiyu precipitation period, where (a1a3) are the first, second, and third normalized spatial modes obtained from rain-gauge observations, respectively, the percentages (%) on the plots are the variance contributions of each mode, and (a4) shows the time coefficients corresponding to each of their modes (blue line is the main river). Panels (b1b4) are the results obtained by CMPAS.
Remotesensing 13 03850 g009
Figure 10. Statistics of the evaluation results of the CMPAS–NRT product under different hourly precipitation threshold intervals (including each sub–region and the whole region) in the Meiyu monitoring area during the 2020 rainy season. Panels (ah) respectively represent the ME, rBIAS, RMSE, CORR, POD, FAR, FBI, and TS.
Remotesensing 13 03850 g010
Figure 11. Relative contribution of precipitation occurrence times recorded by surface rain-gauge observations (red) and CMPAS-NRT products (blue) to the total precipitation occurrence times (including each sub-region and the whole region) during the whole rainy period in 2020 at different hourly precipitation threshold intervals. Panels (af) respectively represent hourly precipitation thresholds of 0, 0.1–2 mm/h, 2–5 mm/h, 5–10 mm/h, 10–20 mm/h, and >20 mm/h.
Remotesensing 13 03850 g011
Figure 12. Relative contribution of precipitation occurring in different hourly precipitation threshold intervals to the total precipitation (including each subregion and the whole region) for the whole rainy period in 2020 from surface rain-gauge observations (red) and CMPAS-NRT products (blue). Panels (ae) respectively represent the hourly precipitation thresholds of 0.1–2 mm/h, 2–5 mm/h, 5–10 mm/h, 10–20 mm/h, and >20 mm/h.
Remotesensing 13 03850 g012
Figure 13. Comparative analysis of the daily variation of different assessment metrics of the CMPAS-NRT product in the Meiyu monitoring area (including each sub-region and the whole area) during the Meiyu period in 2020. The gray shaded area is at night (20:00–08:00 BJT). Panels (af) respectively represent the rBIAS, RMSE, CORR, POD, FAR, and TS.
Remotesensing 13 03850 g013
Figure 14. Comparative analysis of the daily variation in precipitation (mm/h), precipitation frequency (%), and precipitation intensity (mm/h) between surface rain-gauge observations (Gauge, red) and the CMPAS-NRT product (blue) in the rainfall monitoring area (including each sub-region and the whole area) during the 2020 Meiyu period, with the gray shaded area at night (20:00–08:00 Beijing time). Panels (a1a5) are the precipitation amounts, (b1b5) are the precipitation frequencies, and (c1c5) are the precipitation intensities.
Remotesensing 13 03850 g014
Figure 15. Comparative analysis of the daily variation of the joint probability density function (JPDF) between surface rain-gauge observations (Gauge, (a1a5)) and CMPAS-NRT products ((b1b5)) by rain intensity class during the 2020 monsoon period, and their difference (Diff = CMPAS − Gauge; (c1c5)).
Remotesensing 13 03850 g015
Table 1. Statistical values for the comparison between the gauge data and CMPAS-NRT product. The units of ME and RMSE are mm/h; the unit of rBIAS is %.
MErBIASRMSECORRPODFARFBITSKGE
ALL0.00150.340.9020.9130.8150.1520.9610.7110.888
R10.033913.490.7450.8640.7920.2081.0020.6550.784
R20.00762.000.7540.9190.8120.1430.9490.7150.895
R3−0.0013−0.2590.8790.9240.8220.1350.9510.7290.903
R4−0.0340−4.8501.1650.9160.8260.1340.9540.7320.887
Publisher’s Note: MDPI stays neutral with regard to jurisdictional claims in published maps and institutional affiliations.

