Article

Spatiotemporal Patterns of Pasture Quality Based on NDVI Time-Series in Mediterranean Montado Ecosystem

1
MED—Mediterranean Institute for Agriculture, Environment and Development, Instituto de Investigação e Formação Avançada, Universidade de Évora, Pólo da Mitra, Ap. 94, 7006-554 Évora, Portugal
2
AgroInsider Lda. (spin-off da Universidade de Évora), 7005-841 Évora, Portugal
3
MARETEC—Marine, Environment and Technology Centre, LARSyS, Instituto Superior Teécnico, Universidade de Lisboa, Av. Rovisco Pais, 1, 1049-001 Lisboa, Portugal
*
Author to whom correspondence should be addressed.
Remote Sens. 2021, 13(19), 3820; https://doi.org/10.3390/rs13193820
Submission received: 4 August 2021 / Revised: 14 September 2021 / Accepted: 18 September 2021 / Published: 24 September 2021
(This article belongs to the Special Issue Remote Sensing of Agro-Ecosystems)

Abstract

:
The evolution of dryland pasture quality is closely related to the seasonal and inter-annual variability characteristic of the Mediterranean climate. This variability introduces great unpredictability in the dynamic management of animal grazing. The aim of this study is to evaluate the potential of two complementary tools (satellite images, Sentinel-2 and proximal optical sensor, OptRx) for the calculation of the normalized difference vegetation index (NDVI), to monitor in a timely manner indicators of pasture quality (moisture content, crude protein, and neutral detergent fiber). In two consecutive years (2018/2019 and 2019/2020) these tools were evaluated in six fields representative of dryland pastures in the Alentejo region, in Portugal. The results show a significant correlation between pasture quality degradation index (PQDI) and NDVI measured by remote sensing (R2 = 0.82) and measured by proximal optical sensor (R2 = 0.83). These technological tools can potentially make an important contribution to decision making and to the management of livestock production. The complementarity of these two approaches makes it possible to overcome the limitations of satellite images that result (i) from the interference of clouds (which occurs frequently throughout the pasture vegetative cycle) and (ii) from the interference of tree canopy, an important layer of the Montado ecosystem. This work opens perspectives to explore new solutions in the field of Precision Agriculture technologies based on spectral reflectance to respond to the challenges of economic and environmental sustainability of extensive livestock production systems.

1. Introduction

About one-third of the earth’s terrestrial surface and 70% of the global agricultural area is covered by grassland ecosystems [1], making them one of the most common land use types worldwide [2,3]. Apart from providing forage for livestock production [2,4], grasslands fulfil several functions and ecosystem services related to soil quality (carbon sequestration and controlling erosion and wildfires), hydrological balance, and climate change [4,5], which make them essential [1]. In addition to preserving biodiversity and supporting ecological processes (such as carbon storage, water purification, or erosion control) grasslands are vital for global food security [2], since they provide an important setting for agricultural activities such as livestock production [3].
In Southern Portugal Montado agroforestry landscapes predominate. These are of high biodiversity value and include different strata of vegetation, where sparsely distributed trees coexist with dryland pastures and different animal species in various grazing regimes [6]. The evolution of the quality of these pastures is closely related to the seasonal and inter-annual variability that is characteristic of the Mediterranean climate [7]. This variability introduces great unpredictability in the livestock grazing dynamics and management [7]. The estimation of stocking rates depends not only on the assessment of the available pasture biomass but also on its quality [2,8]. According to Lugassi et al. [8], the quality of the plants consumed by livestock in pastures is an important factor for their productivity. The timely knowledge of pasture quality is, therefore, vital for correct evaluation of the animal feed demand [9] and, consequently, for the establishment of sustainable agriculture [5].
The potential nutritive value of pastures is assessed by indicators such as crude protein (CP) or cell-wall components, for example the neutral detergent fiber (NDF) [8,9]. According to Barnetson et al. [10], adequate presence of CP and NDF in livestock’s diet is essential for its maintenance, growth, lactation, and reproduction. Timely and accurate information about pasture quality indicators can contribute to sustainable livestock grazing through improved matching of stocking rates (animals’ demand) to pasture resources (available feed) [8,10]. The most widely accepted method for assessing these indicators is chemical analysis which, although accurate, is both time-consuming and expensive [8,11,12]. The reference measurement method for CP and NDF determinations consists of the cutting and drying of pasture samples to get the actual dry biomass per area unit, followed by specific laboratory analysis [12]. This procedure, carried out at a fine scale and based on field measurements [13], was developed for researchers and although these data are very informative, the whole process of collecting samples and processing them is laborious, destructive, expensive, and not routinely used by farmers [3]. Moreover, the limited number of samples that can be effectively processed in reference methods, based on sampling design distributions and intensity, reduces the possibility of assessing the spatial variability of pastoral resources [12,13]. Therefore, an alternative approach for detailed spatial and temporal pasture monitoring is proposed based on innovative tools, such as remote sensing (data from satellite and airborne platforms) and proximal sensing (field-specific sensors) [2,3], contributing to establish sustainable grassland management systems [5].
While the potential of remote sensing (RS) based classification and mapping of grassland quality has been long recognized, only a limited number of studies have been done using this approach [2]. In the last decade interest in data-intensive monitoring of croplands and forests has been spiking due to the availability of free RS data from various satellite missions, such as Landsat, Sentinel, and others. RS provides large scale spatio-temporal grassland detection, monitoring, and prediction [2], enabling rapid assessment of biomass over vast areas at a low cost [14]. This is a promising tool for estimating field-scale forage quality, when compared with traditional methods, which usually do not provide equally detailed information [9].
Recent advances and development of new sensors with higher spatial and temporal resolutions have provided unprecedented opportunities to map biomass in livestock farms. RS platforms are increasingly recognized as essential tools for planners and decision makers [2]. Green vegetation can be monitored continuously using its spectral reflectance properties acquired by remote optical sensors [1]. For satellite-based precision agriculture, the spatial resolution, revisit frequency, and number of spectral bands are the key factors to the acquisition of a dense time series for consistent monitoring at a farm or paddock scale [2]. The Sentinel-2A and 2B satellites (S2) launched by European Space Agency in 2015 and 2017, respectively, provide a freely downloadable global coverage of the Earth’s land surface every 5 days with two satellites, with four visible to near-infrared bands at a 10 m spatial resolution and six bands at 20 m covering the red edge and shortwave infrared wavelengths [14]. According to Chen et al. [14], the great potential of S2 imagery for improving pasture assessment and monitoring is due to its good combination of temporal frequency (sufficient to monitor the continuously changing landscape resulting from animal rotations) and spatial resolution (adequate for capturing the variations between typical-sized paddocks). Several studies identify the Normalized Difference Vegetation Index (NDVI), obtained through optical sensors, as the best predictor of grassland ecosystem attributes [1,3,14,15], providing spatial and temporal grassland patterns [1]. It is calculated as a normalized difference between near infrared (NIR; 0.7–1.1 µm) and red (0.6–0.7 µm) spectral wavelengths [3].
The specific characteristics of the Montado ecosystem, where sparsely distributed trees prevent the satellite images from capturing the vegetation that is close to the soil (pasture) under tree canopy, associated with the high incidence of cloudy days during the autumn, winter, and spring seasons, justify the interest in complementary systems based, for example, on proximal sensors, PS [16]. Active optical sensors (AOS), such as “OptRx” and others, combined with a global navigation satellite system receiver (GNSS) provide spatialized data. However, the data collection process is time consuming and the sampling pattern requires some planning in order to capture the spatial variability of pasture parameters [12]. The combination of the advantages of each of RS and PS for monitoring the quality of pasture was studied by this research team [16]; however, it was restricted to a small area (of about 2.3 ha). The purpose of the current work is to extend the study to several fields that are representative of the size, biodiversity, and geodiversity of pastures in the Alentejo region of Portugal.
The aim of the present study is to evaluate the potential of two complementary tools (satellite images, Sentinel-2, and proximal optical sensor, OptRx) to monitor in a timely manner indicators of pasture quality (pasture moisture content, crude protein, and neutral detergent fiber) using NDVI.

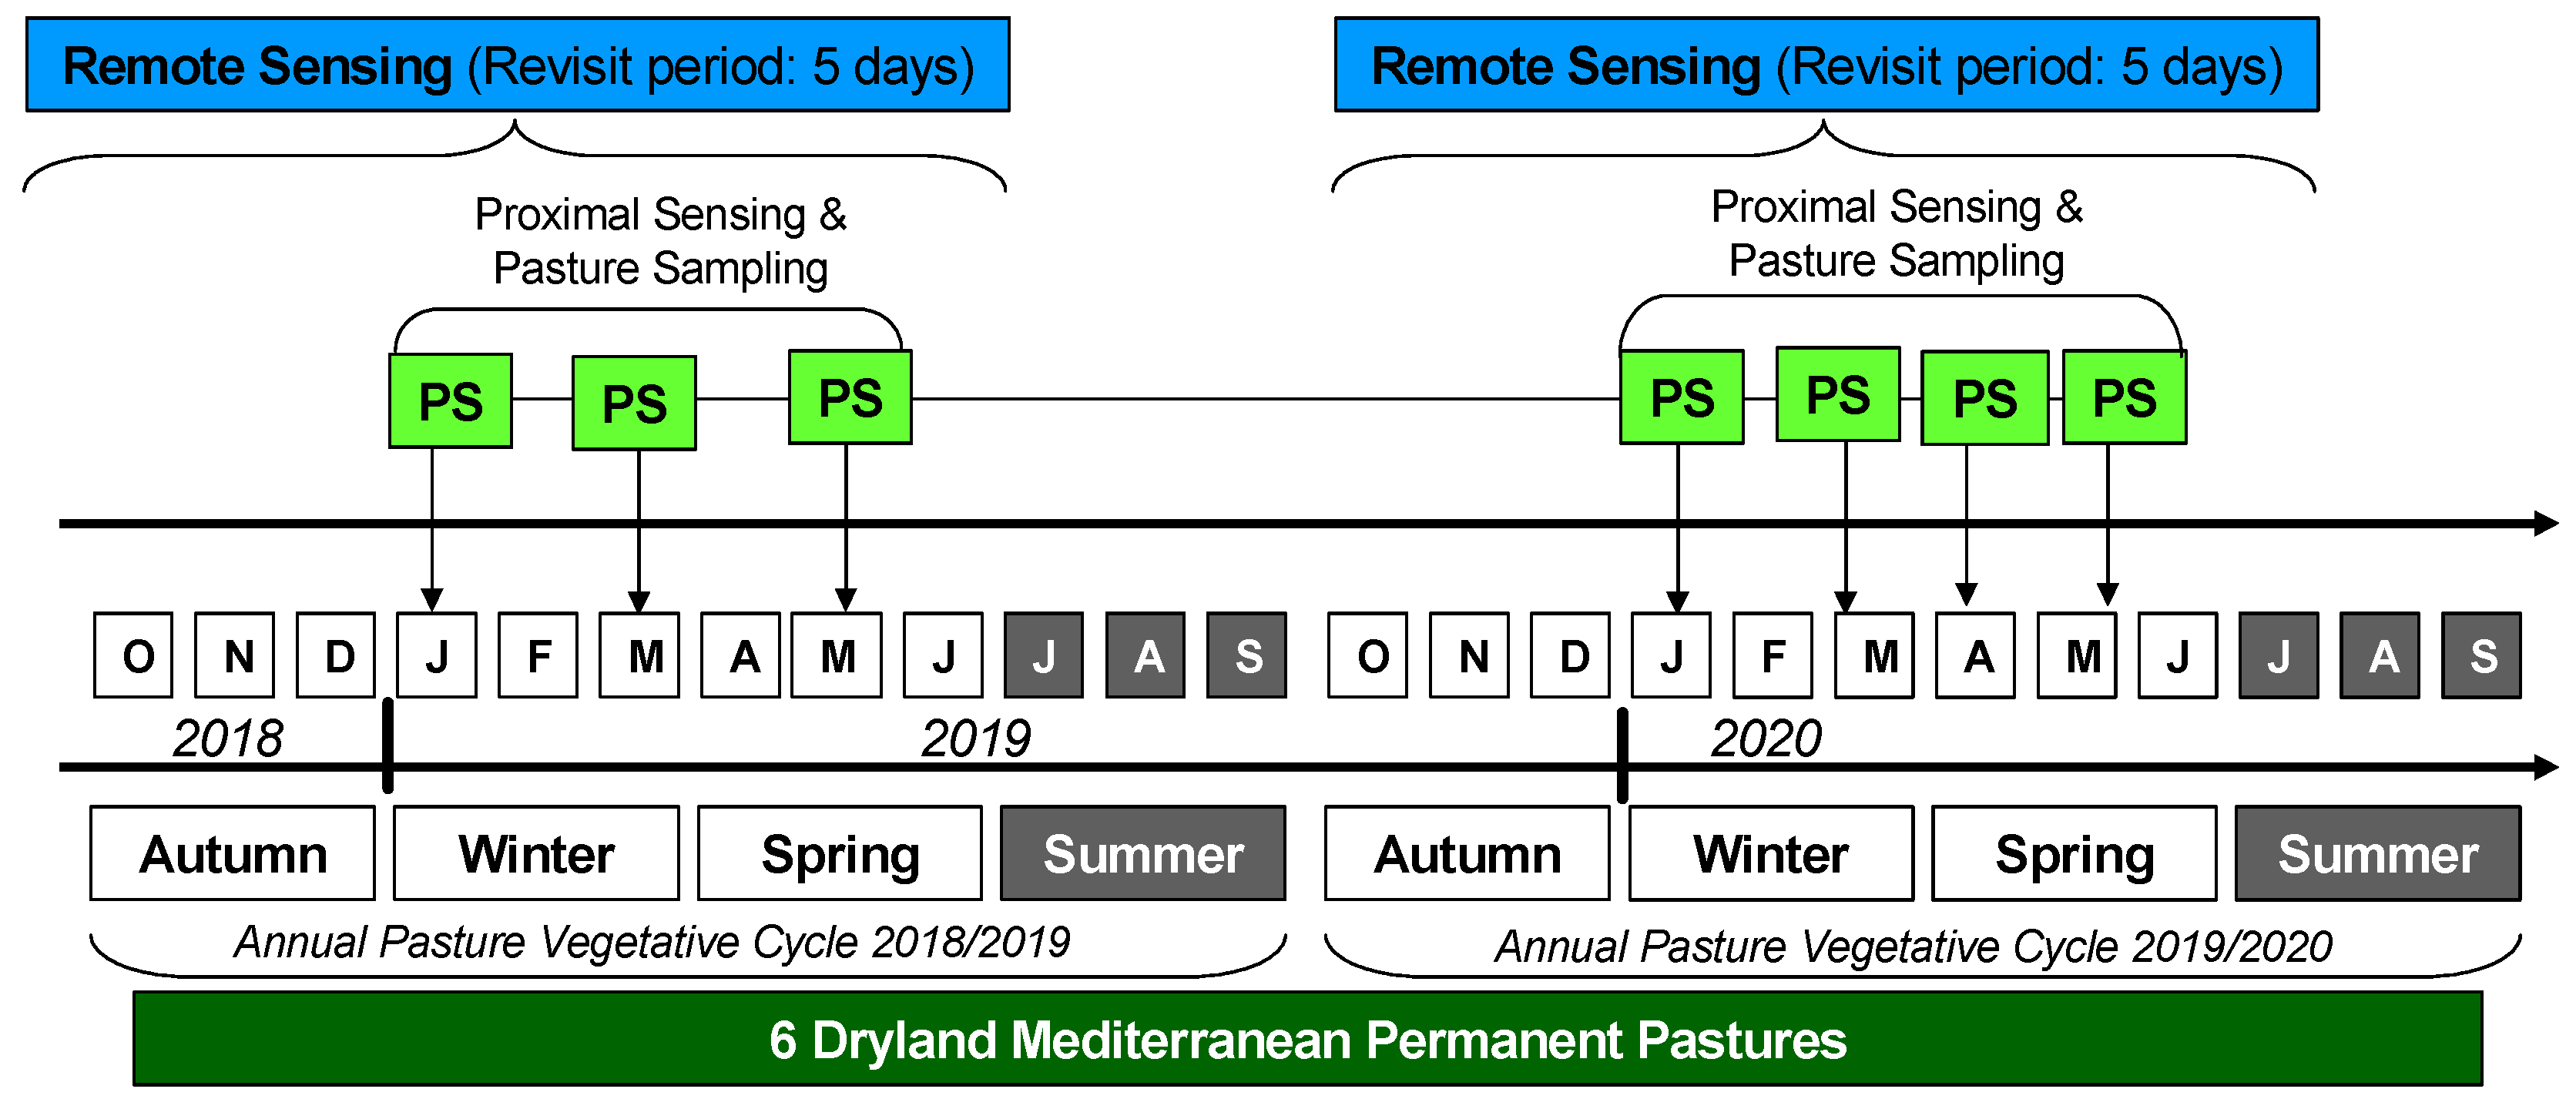
2. Materials and Methods
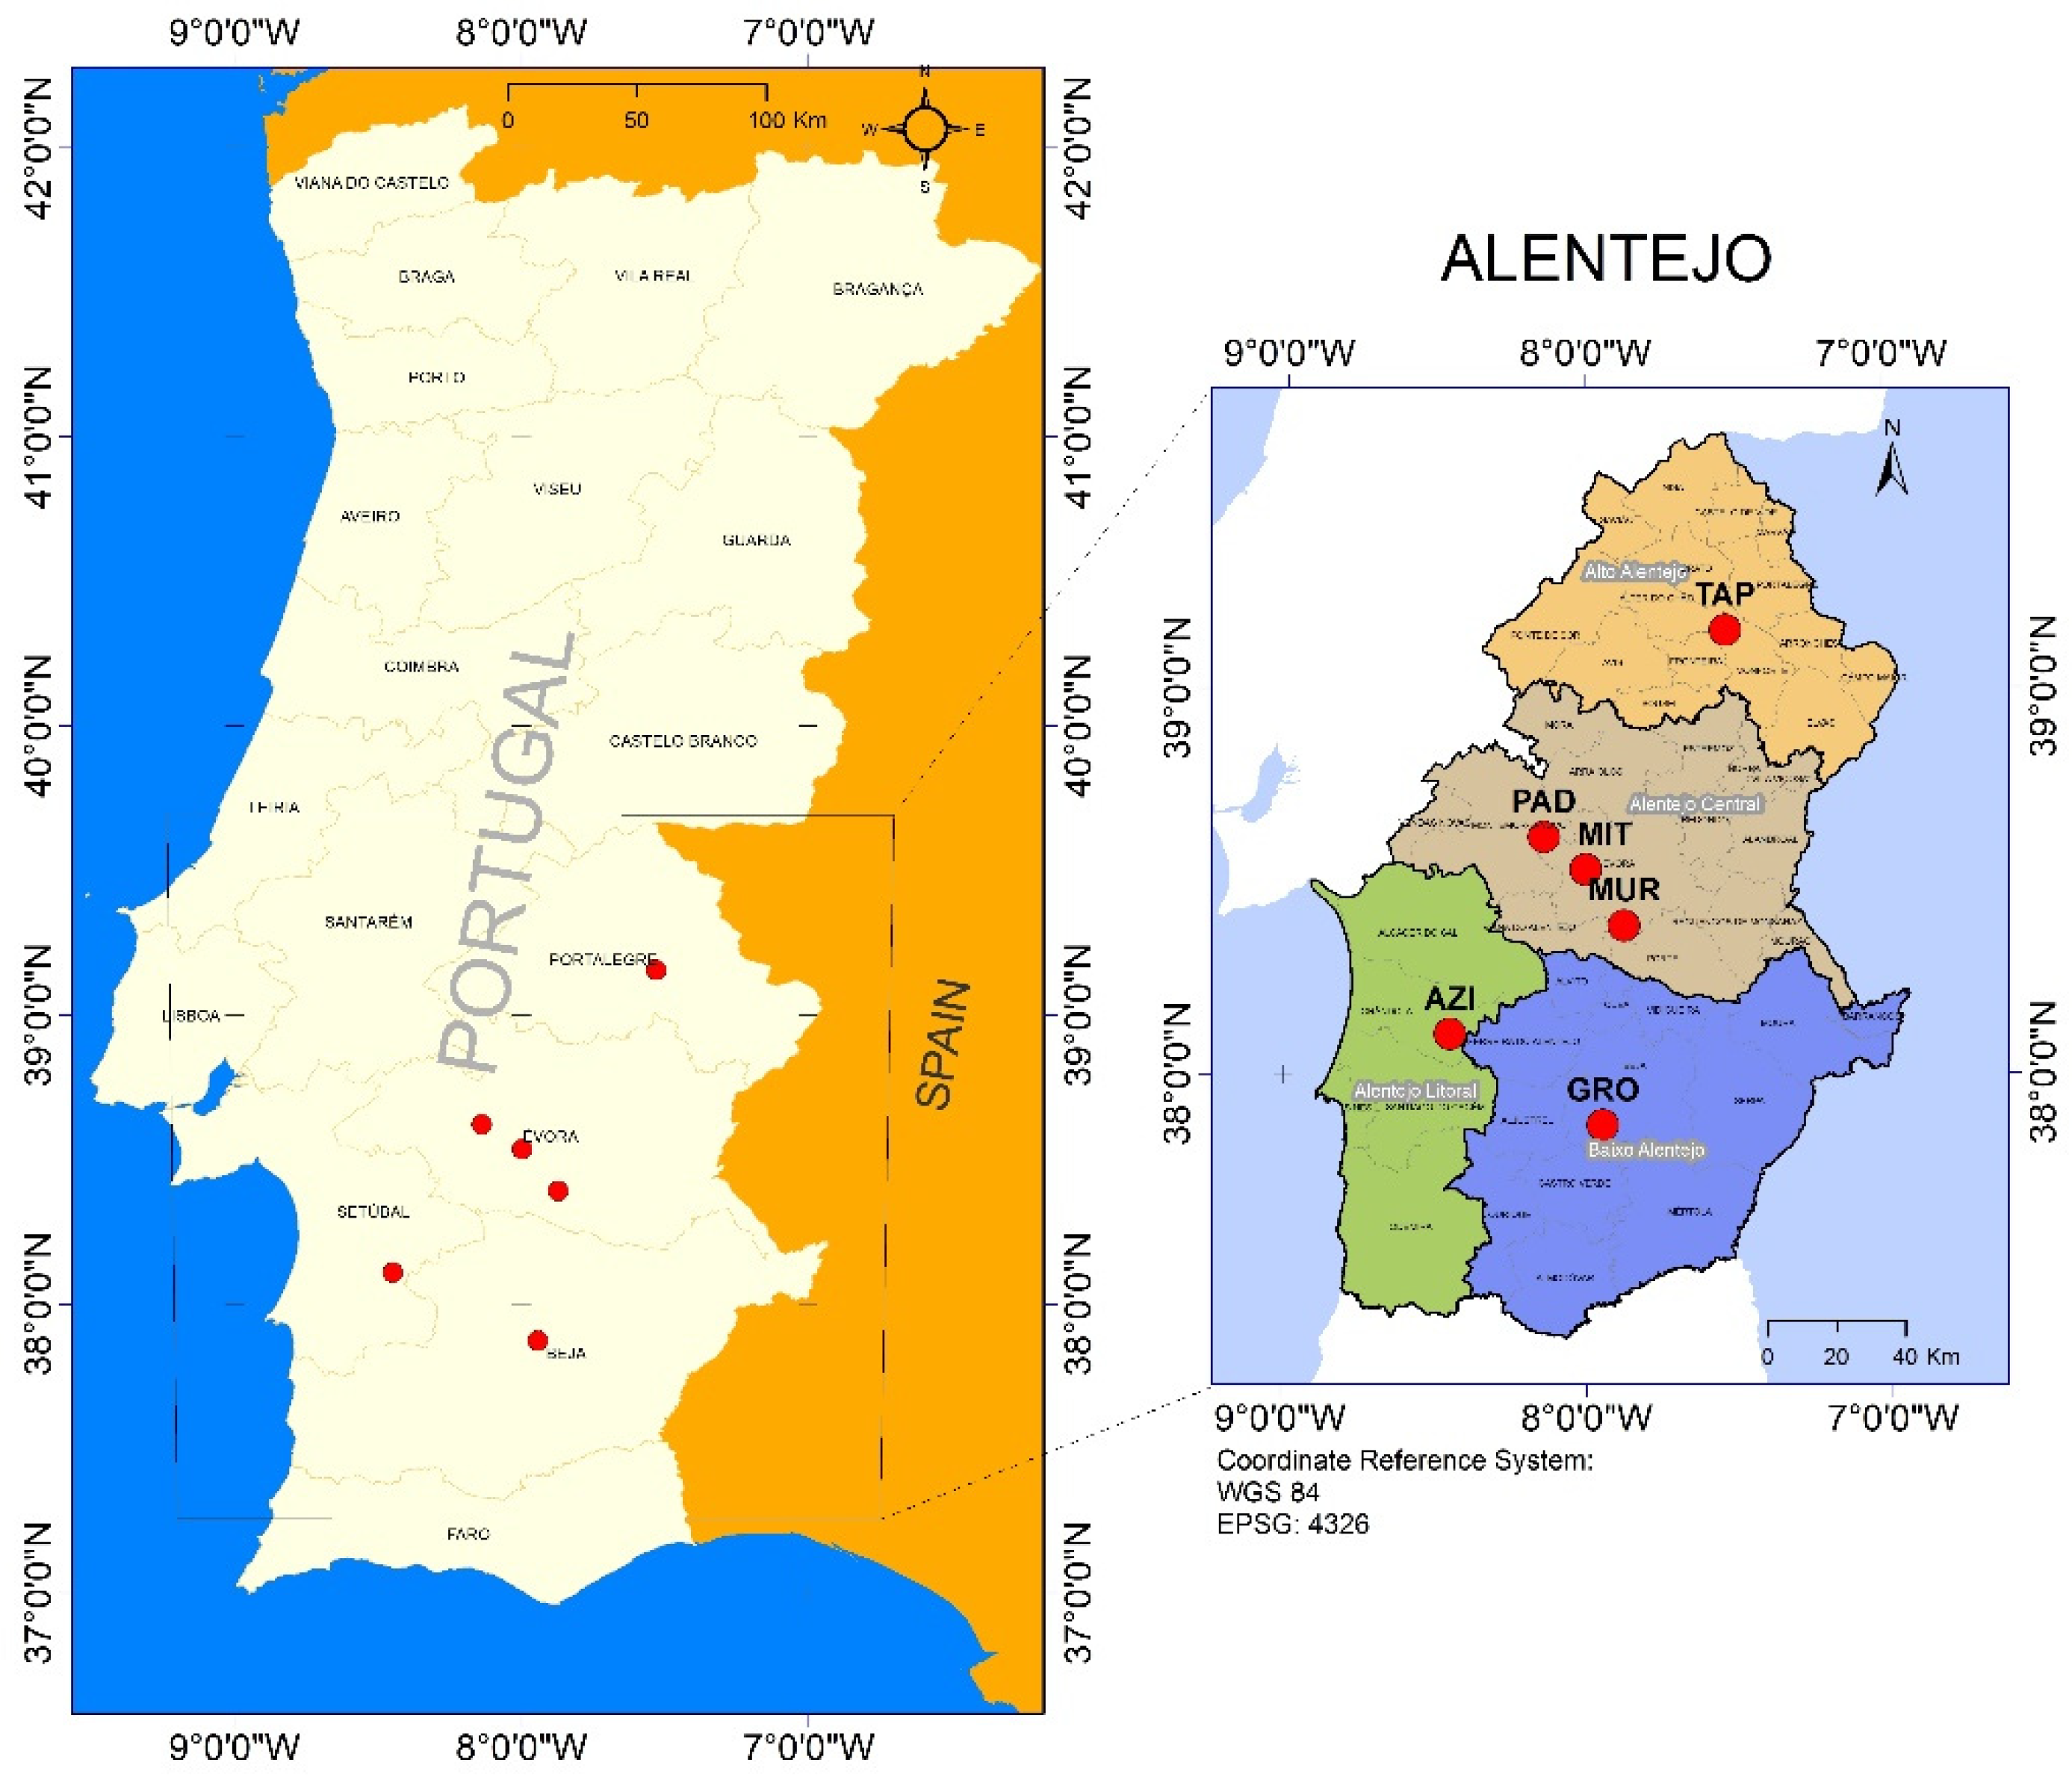
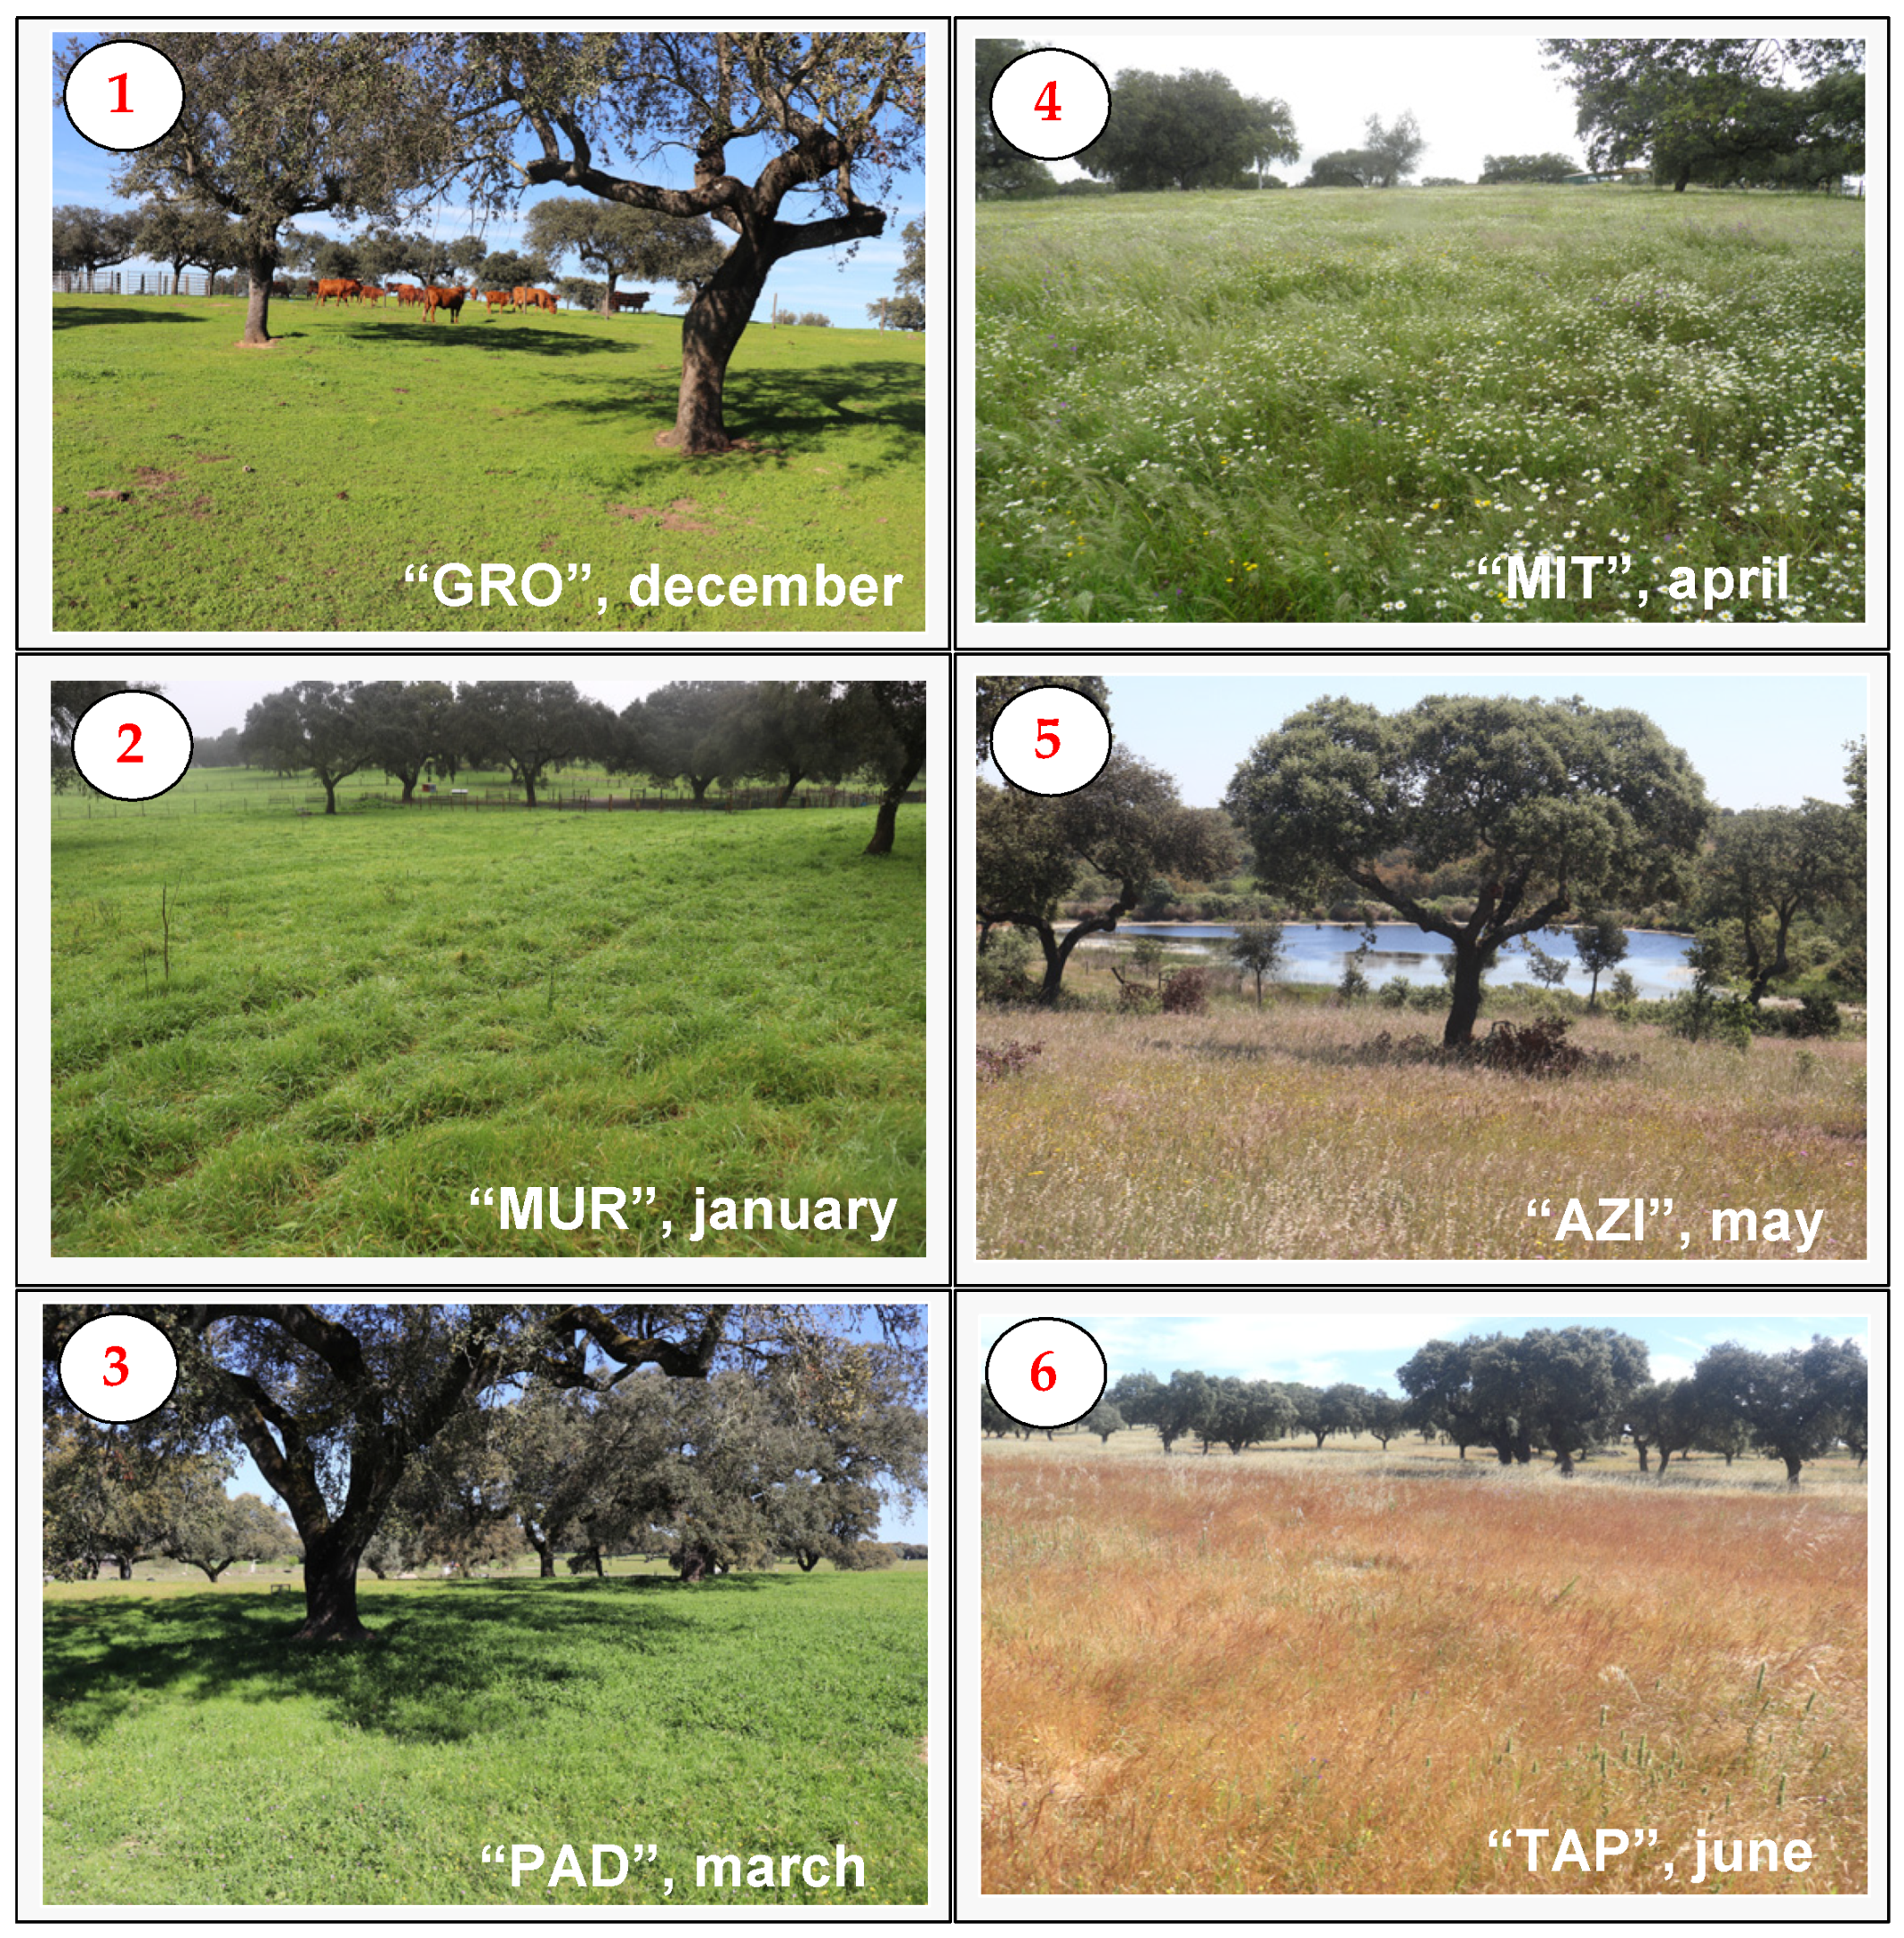
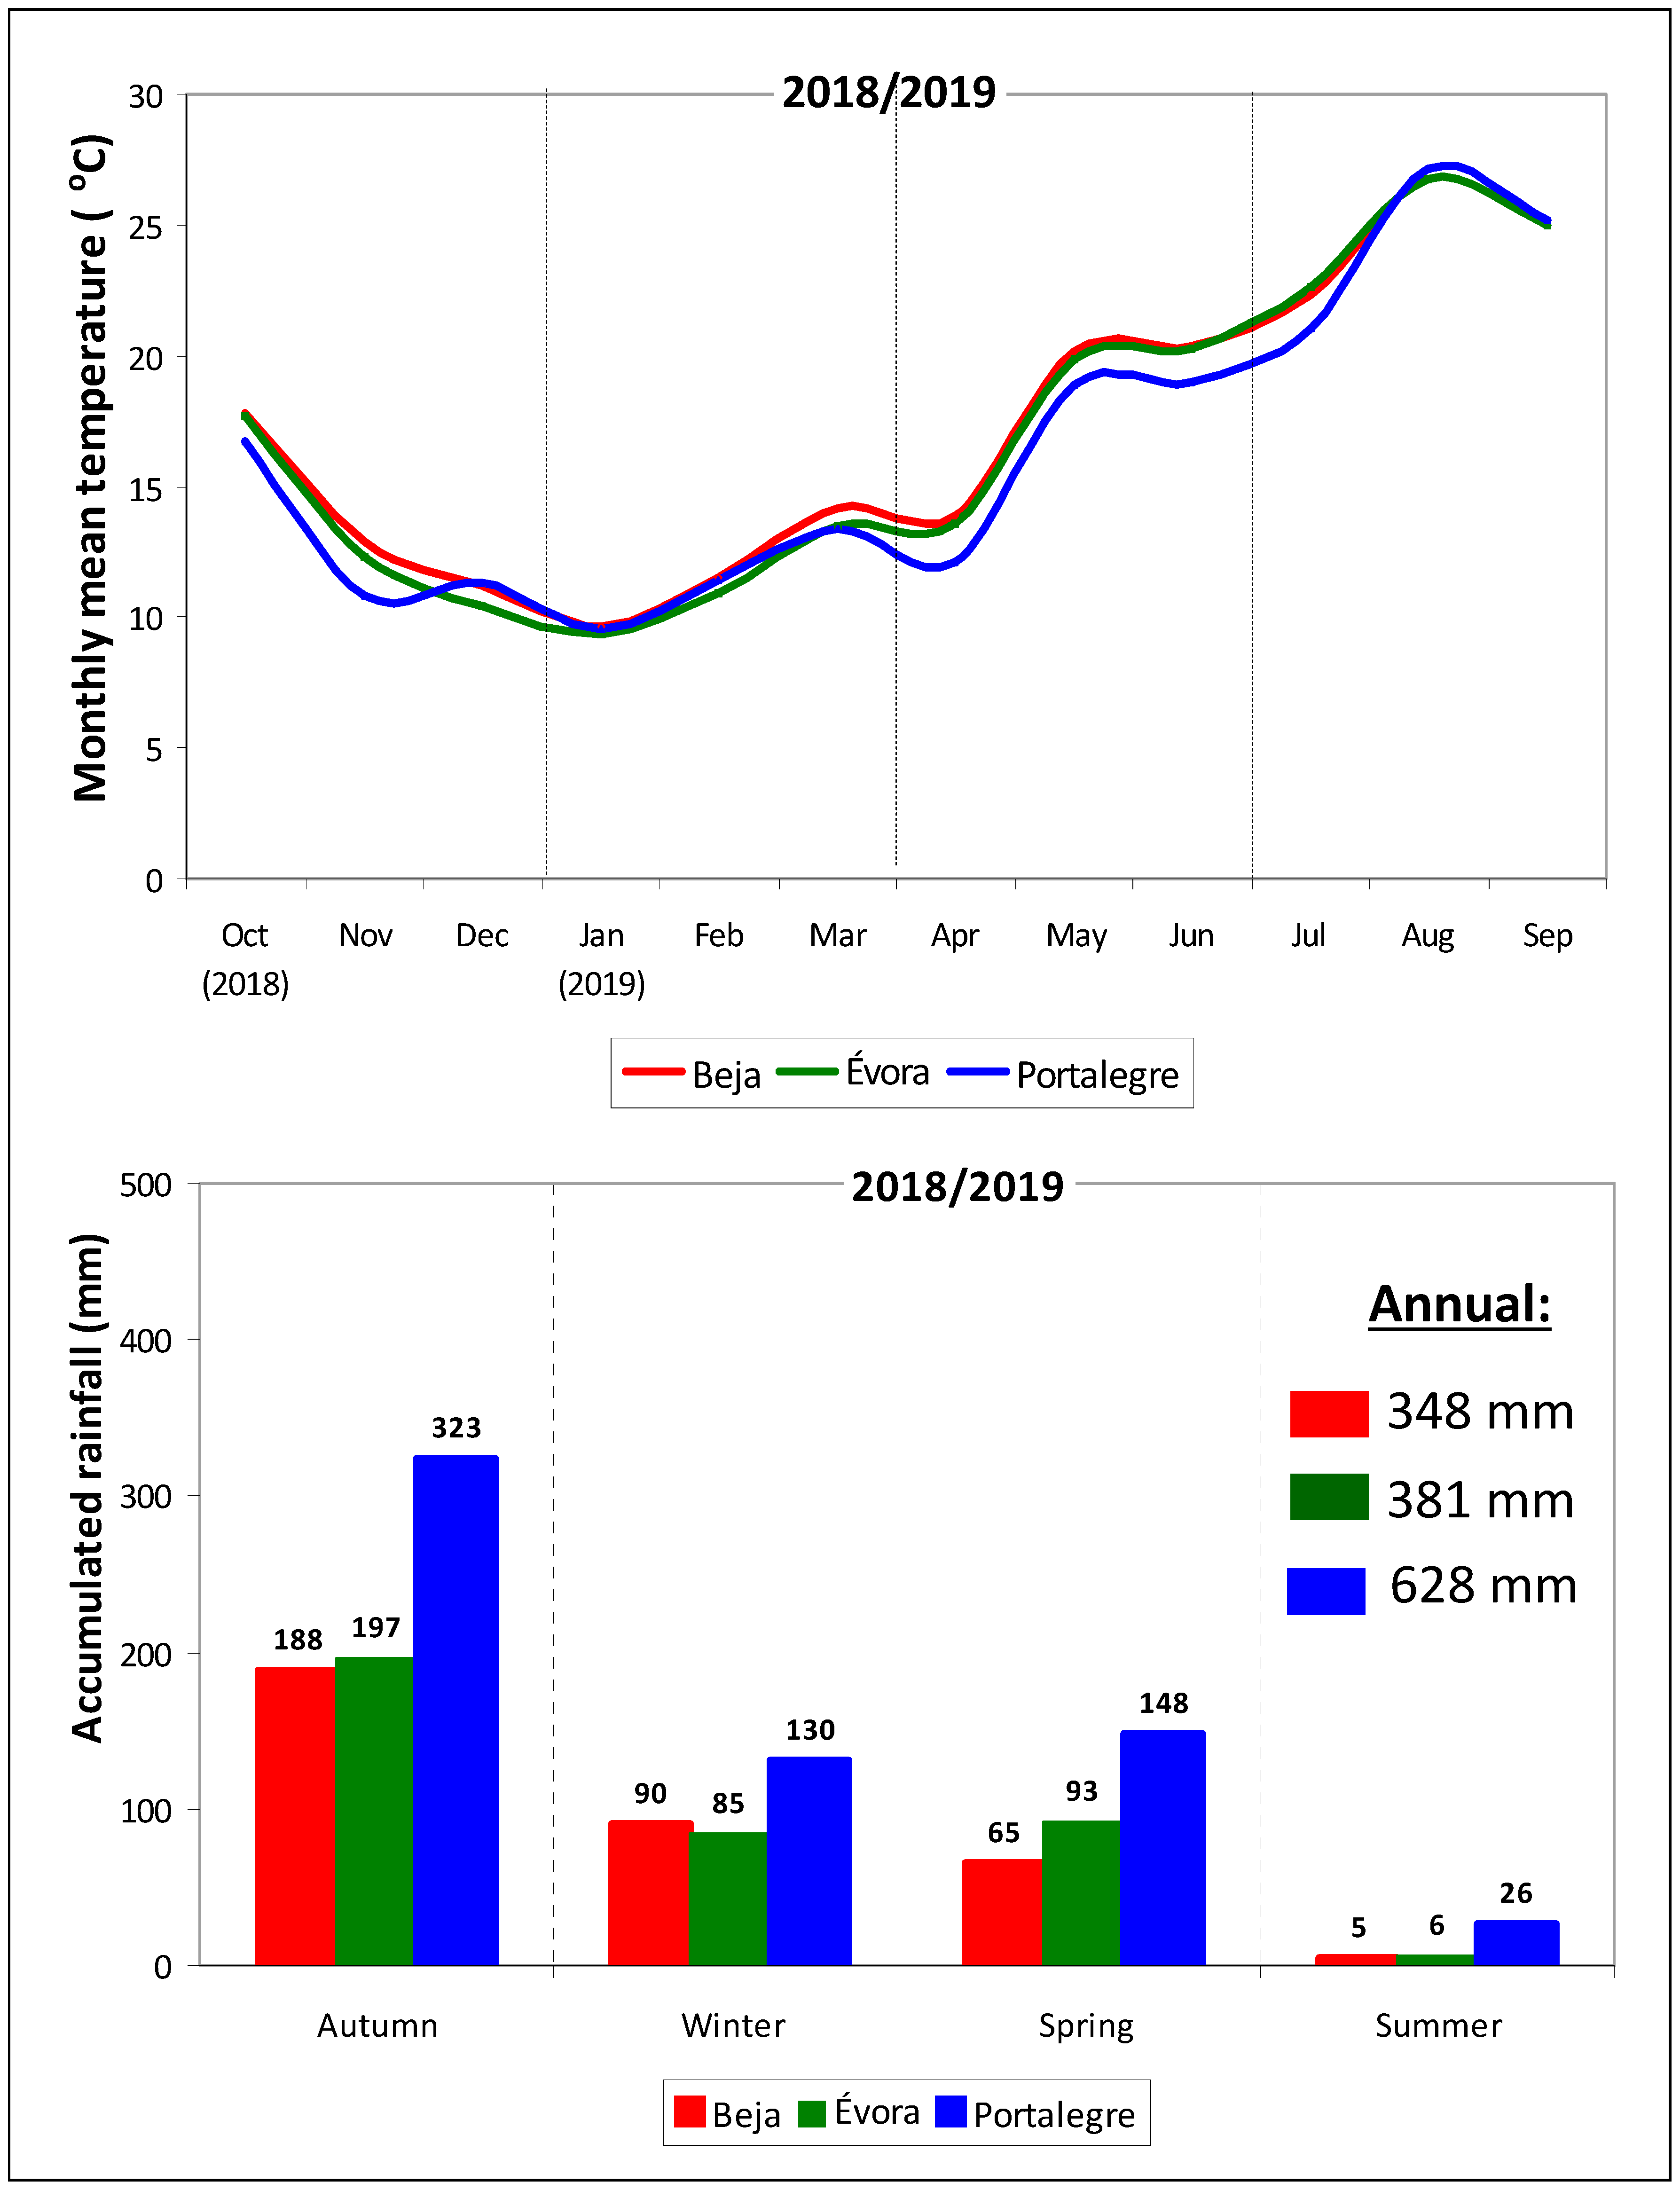
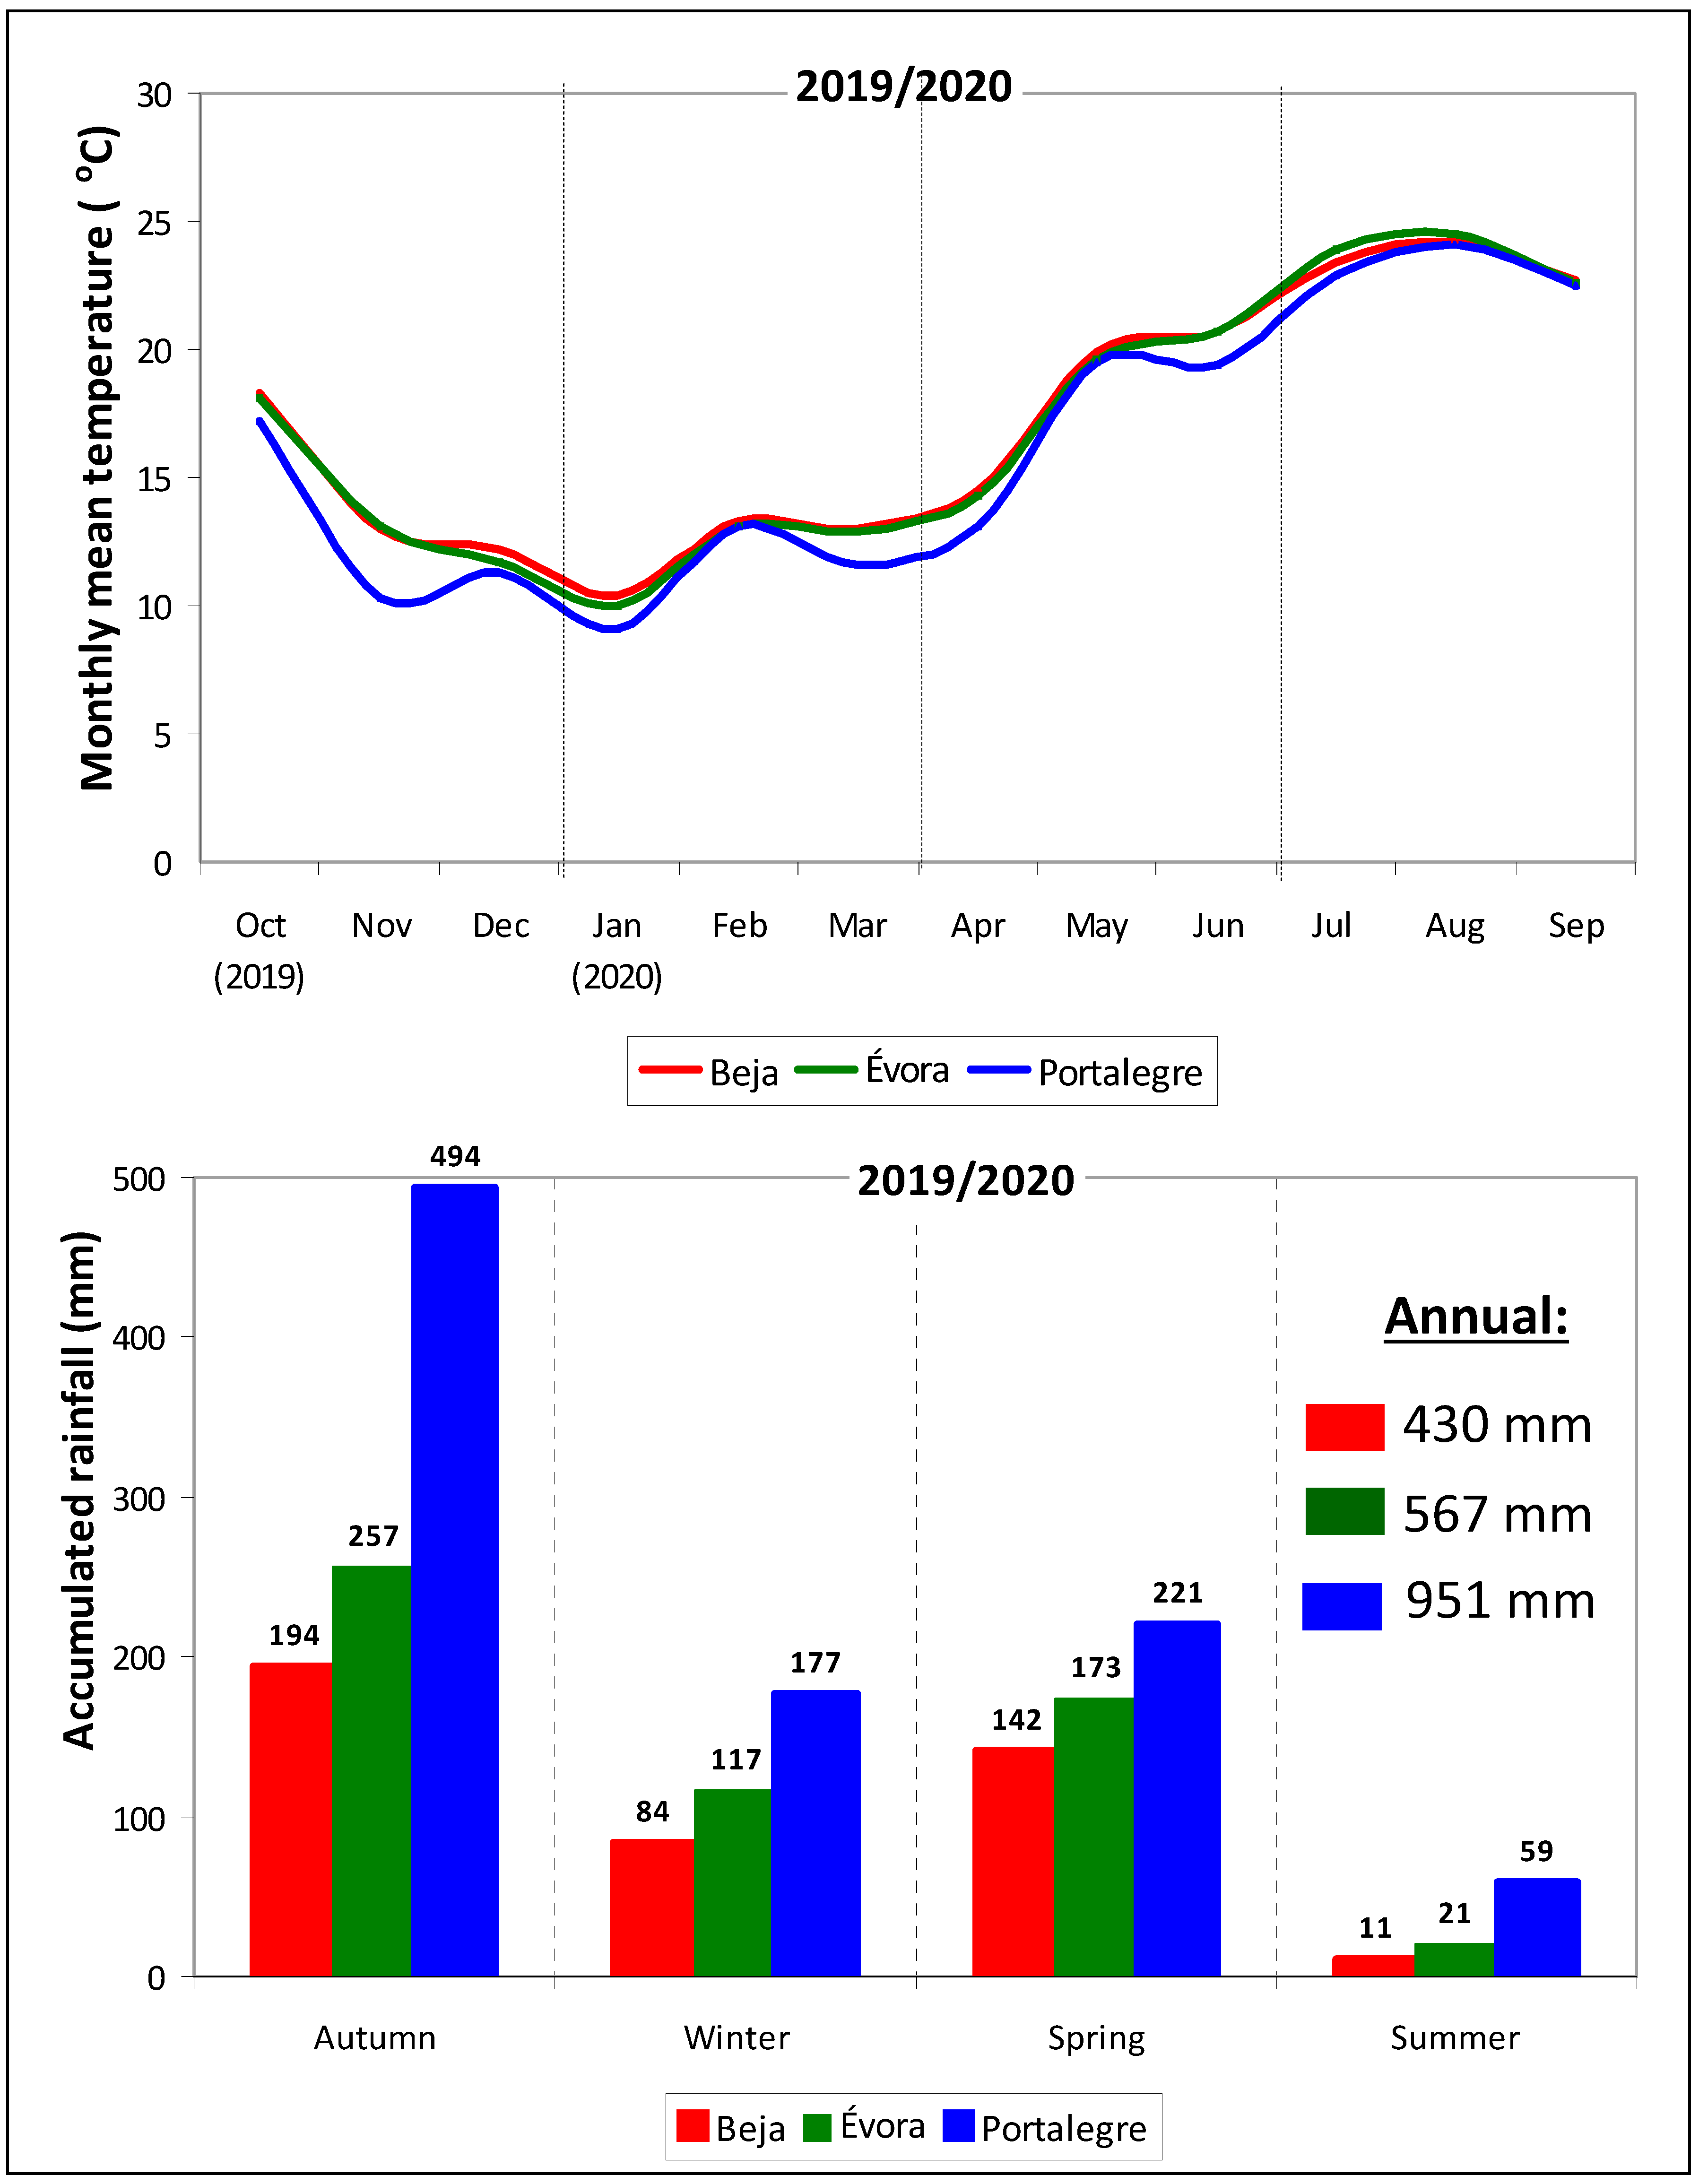
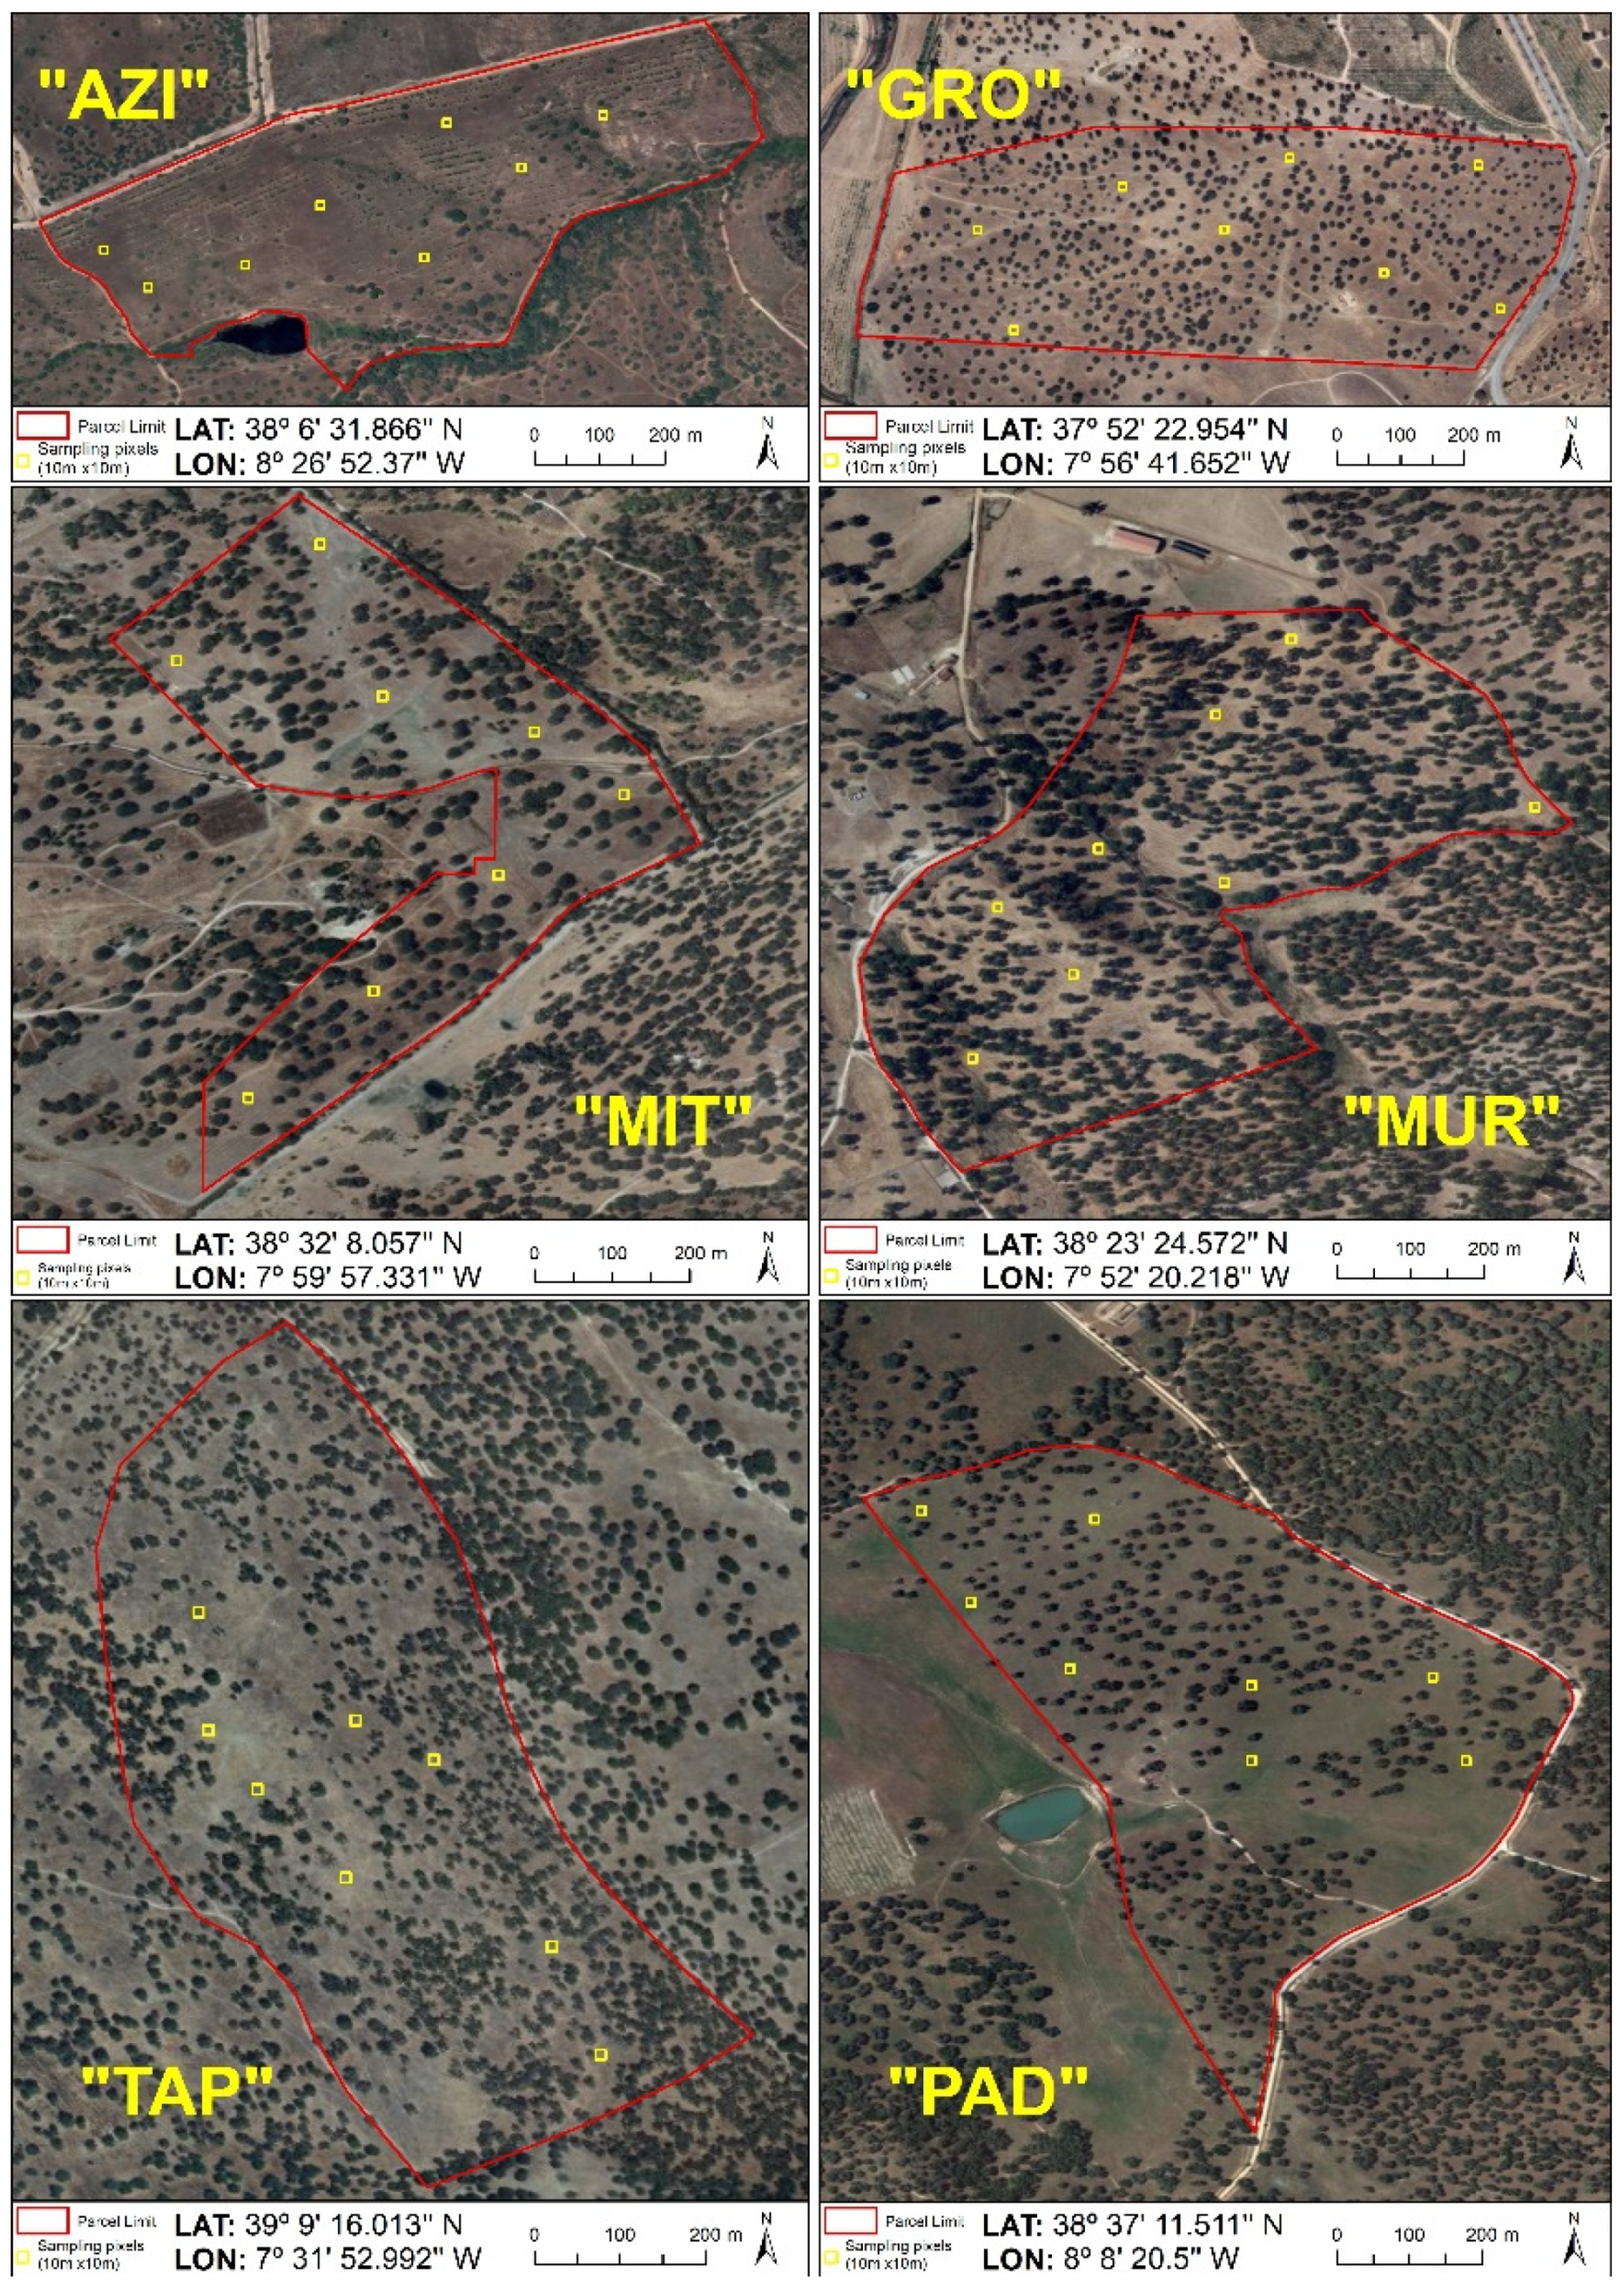
Figure 1 shows a schematic representation of the methodology used in this study.

2.1. Study Area

This study was performed throughout the vegetative cycles (autumn, winter, and spring) of 2018/2019 and 2019/2020, at six dryland Mediterranean permanent pastures, located in Alentejo, in the southern region of Portugal (Figure 2). These bio-diverse pastures (composed of grasses, legumes, and other species) are integrated in a Montado ecosystem (Figure 3), with variable tree density, predominantly Holm oak and Cork oak, and grazed by sheep or cow in a rotational or permanent system [7].
Two of these parcels are located in the district of Beja (“AZI” and “GRO”), three in the district of Évora (“MIT”, “MUR” and “PAD”) and one in the district of Portalegre (“TAP”). The average thermo-pluviometric data of these three districts for the two years of the experiment (2018/2019 and 2019/2020) are presented in Figure 4 and Figure 5, respectively. A temperature and precipitation gradient is evident: the areas located to the north have a lower monthly temperature and a higher accumulated rainfall than the areas located further south.

2.2. Data

The data used in this study were collected from satellite remote sensing images, optical proximal sensing, and pasture field samples.

2.2.1. Satellite Remote Sensing Data

Sentinel-2 optical images (freely available from the European Space Agency, ESA), were used. In each farm, multi-temporal satellite data (time-series surface reflectance data) from 21 September 2018 to 20 June 2019 and from 21 September 2019 to 20 June 2020 (Figure 1) were extracted in eight “10 m × 10 m” pixels without trees in each farm (Figure 6). This basic unit area is the minimum grid, the spatial resolution in the ground of each image pixel, consequence of spatial resolution of Sentinel-2 bands.
For this work, Sentinel-2 atmospherically corrected imagery was downloaded from Copernicus data hub. Band 8 (B8; NIR; 10 m spatial resolution; 842 nm) and band 4 (B4; RED; 10 m spatial resolution; 665 nm), were used to calculate the NDVI satellite vegetation index (NDVIRS; Equation (1)) and to rebuild historical NDVI trends (NDVI time-series). The two aforementioned bands can sense through different depths of vegetation canopies: band 8 can “see” through roughly eight leaf layers, while the band 4 sees only one leaf layer or less because of the strong chlorophyll absorption. A preliminary processing was carried out on these records to remove outliers due to the presence of clouds. Only the images without clouds were used in the analysis.
NDV I RS = B 8 B 4 B 8 + B 4

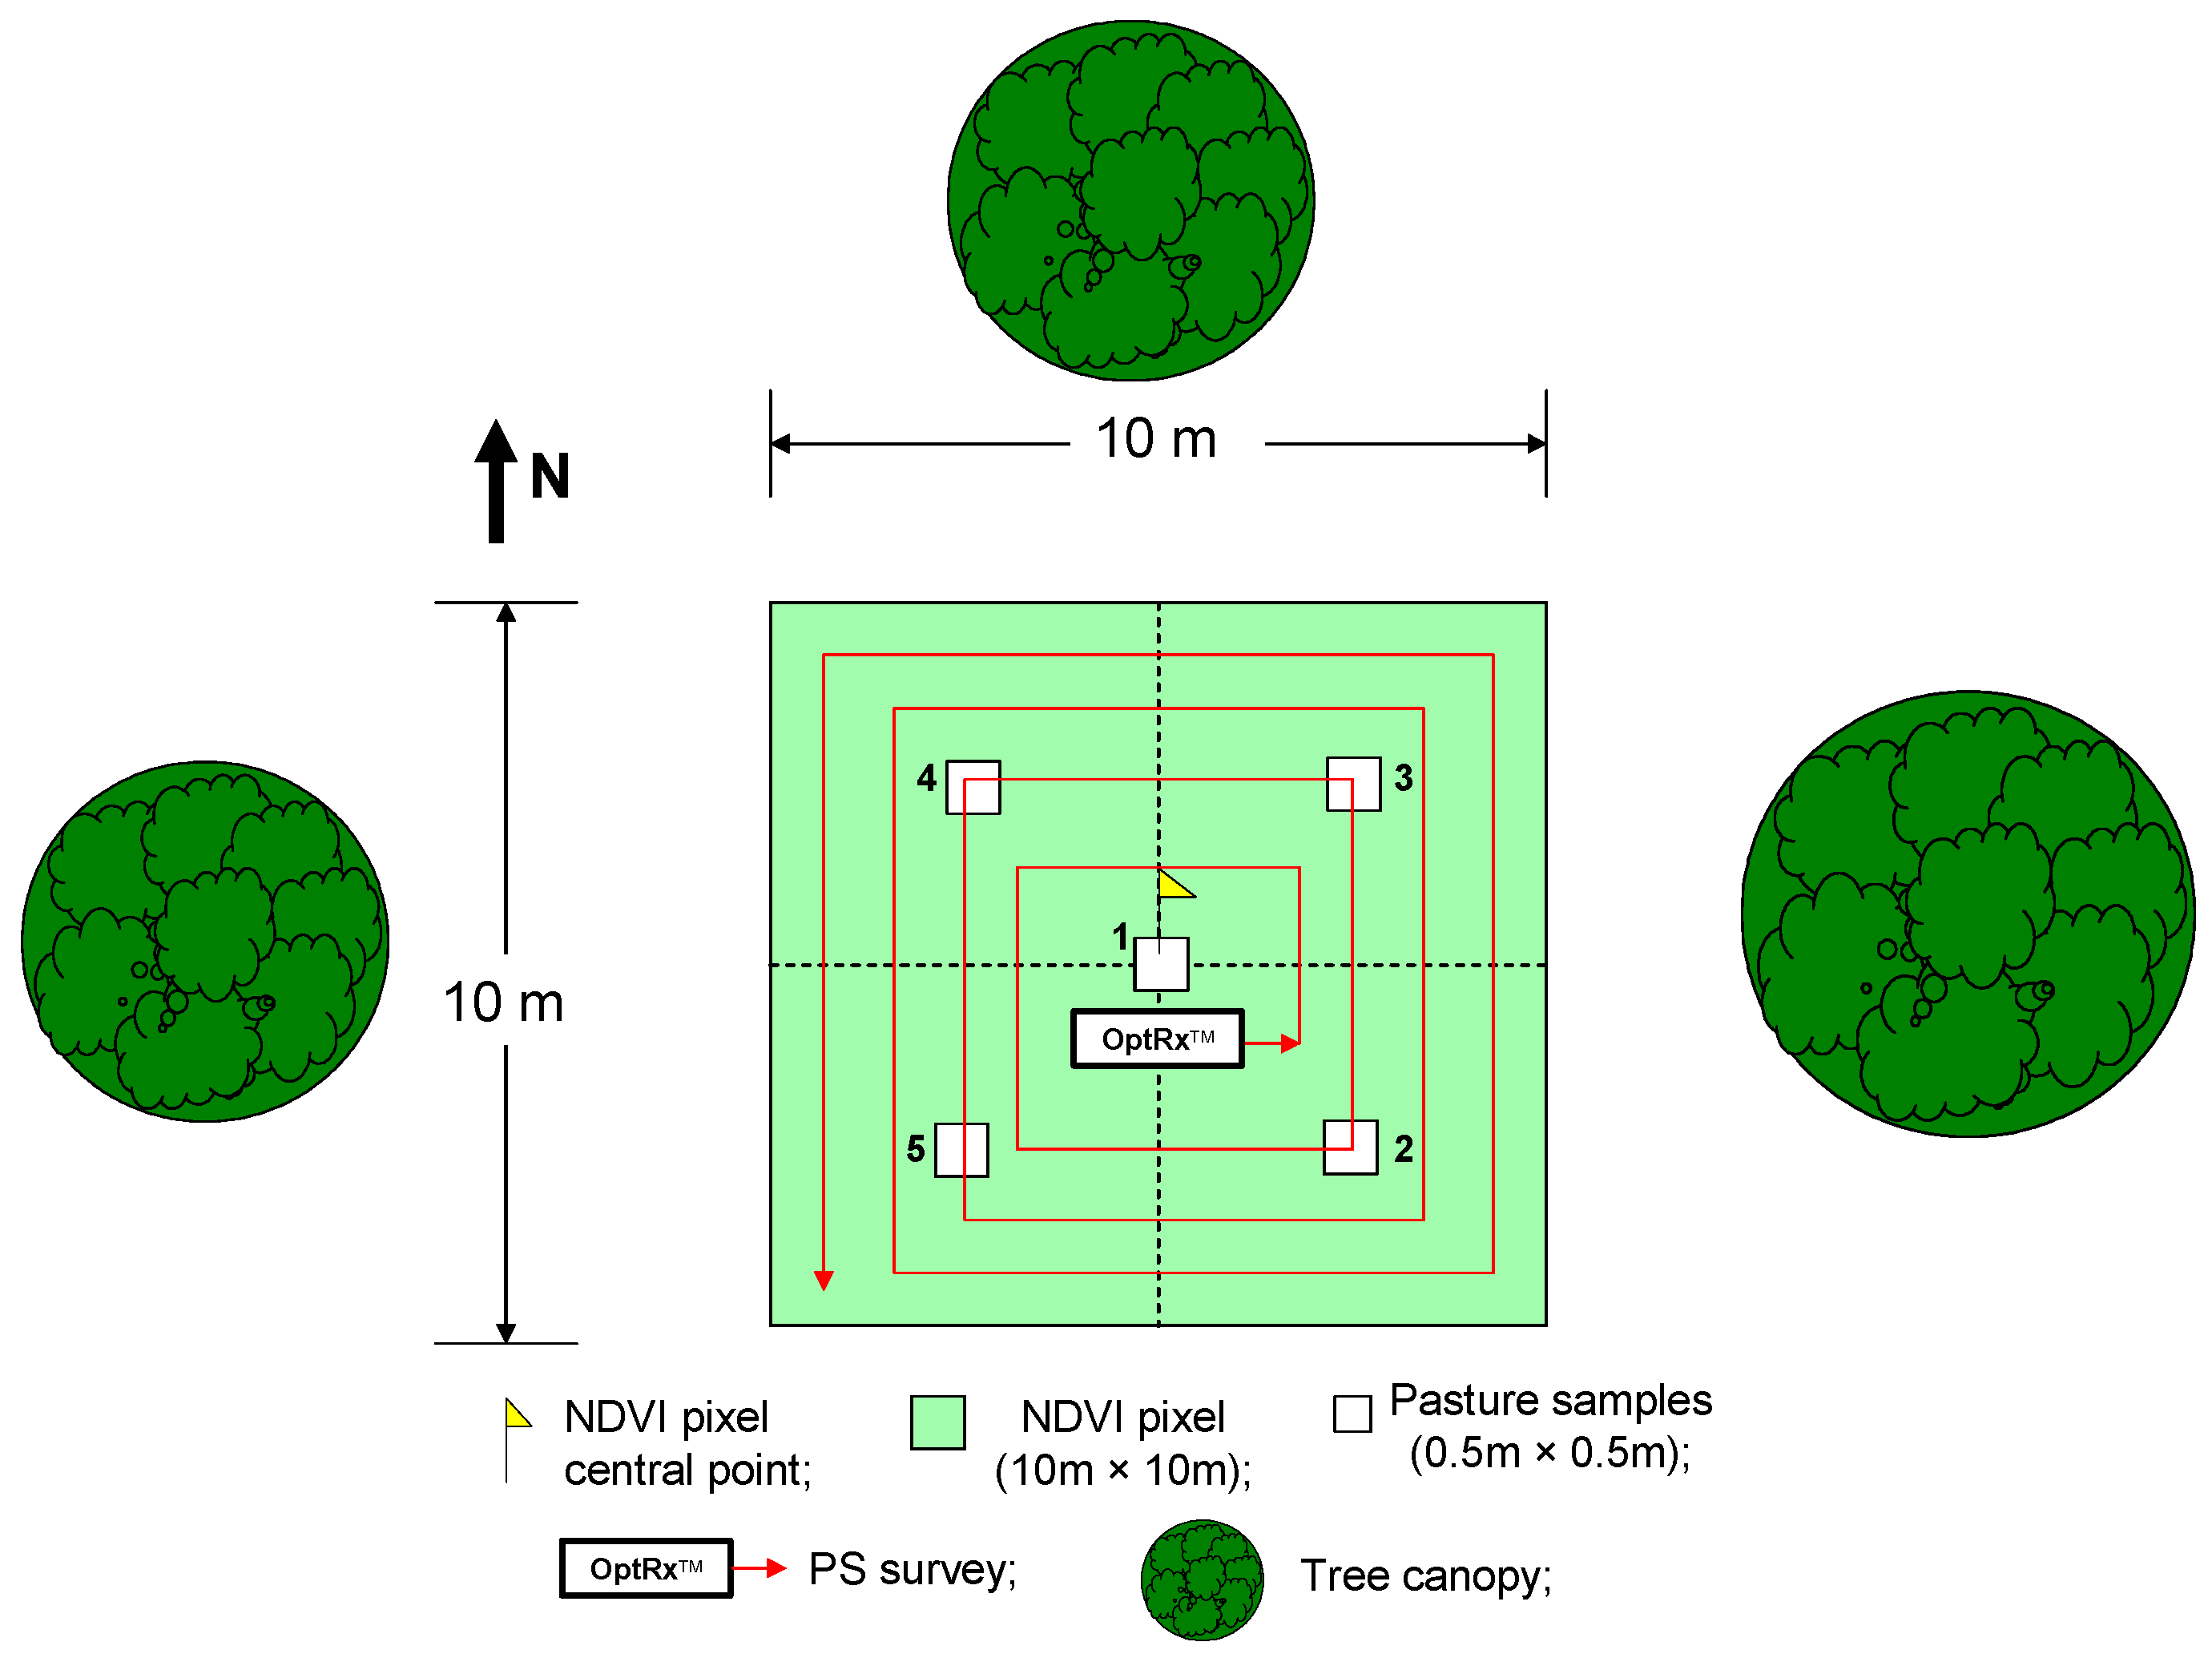
2.2.2. Proximal Sensing Data

The sampling with the proximal active optical sensor (AOS, OptRx, Ag Leader, Ames, IA, USA) was performed at three different times through the growth cycle 2018/2019, i.e., between January (day of the year, DOY 24) and May 2019 (DOY 140), and in four different times through the growth cycle 2019/2020, i.e., between January (DOY 20) and June 2020 (DOY 152). The sensor (equipped with a small portable battery as the power source) was placed 0.5 m above the pasture, and provided simultaneous measurement of three visible and infrared bands. With two of these spectral bands, red (670 nm) and near infrared (NIR, 775 nm), NDVIPS was calculated. The AOS operator walked each sampling area (sampling pixel “10 m × 10 m”; Figure 7) for a five-minute period, which allows the collection of approximately 300 records of NDVI.

2.2.3. Pasture Samples

After taking measurement with the proximal sensor at each date, location, and sampling area (“10 m × 10 m”), electric shears were used to collect five pasture subsamples in a “0.5 m × 0.5 m” area (defined with a metal quadrat), one in the central point of the pixel area, and one in each of its four quadrants (Figure 7). These five subsamples were inserted into a numbered plastic bag to constitute a composite sample and subjected to reference laboratory analysis.
Once in the laboratory, the pasture samples were weighed to obtain the fresh mass, then dried in an oven (72 h at 65 °C) and weighed again to establish the dry matter and pasture moisture content (PMC wet basis, in %). Next, these samples were ground using a Perten instrument mill equipped with a 1 mm sieve. The dehydrated samples were analyzed in order to determine the reference values of crude protein (CP, in % on a dry weight basis) and neutral detergent fiber (NDF, in % on a dry weight basis) using conventional methods of wet chemistry according to the Association of Official Analytical Chemists [17]: (i) nitrogen content was analyzed using the Kjeldhal method, i.e., a colorimetric determination in an autoanalyzer (Bran + Luebbe) with a factor of conversion to CP of 6.25 (method no. G-188-97 Rev 2, Bran + Luebbe, Analyser Division, Norderstedt, Germany); (ii) the NDF content was analyzed according to the Goering and Van Soest [18] method in a Fiberted digester (Foss Tecator AB, Hoganas, Sweden).
A pasture quality degradation index (PQDI, in %) was then calculated based on the above mentioned three parameters (PMC, CP, and NDF; Equation (2)).
PQDI = NDF PMC × CP × 100

2.3. Statistical Analysis
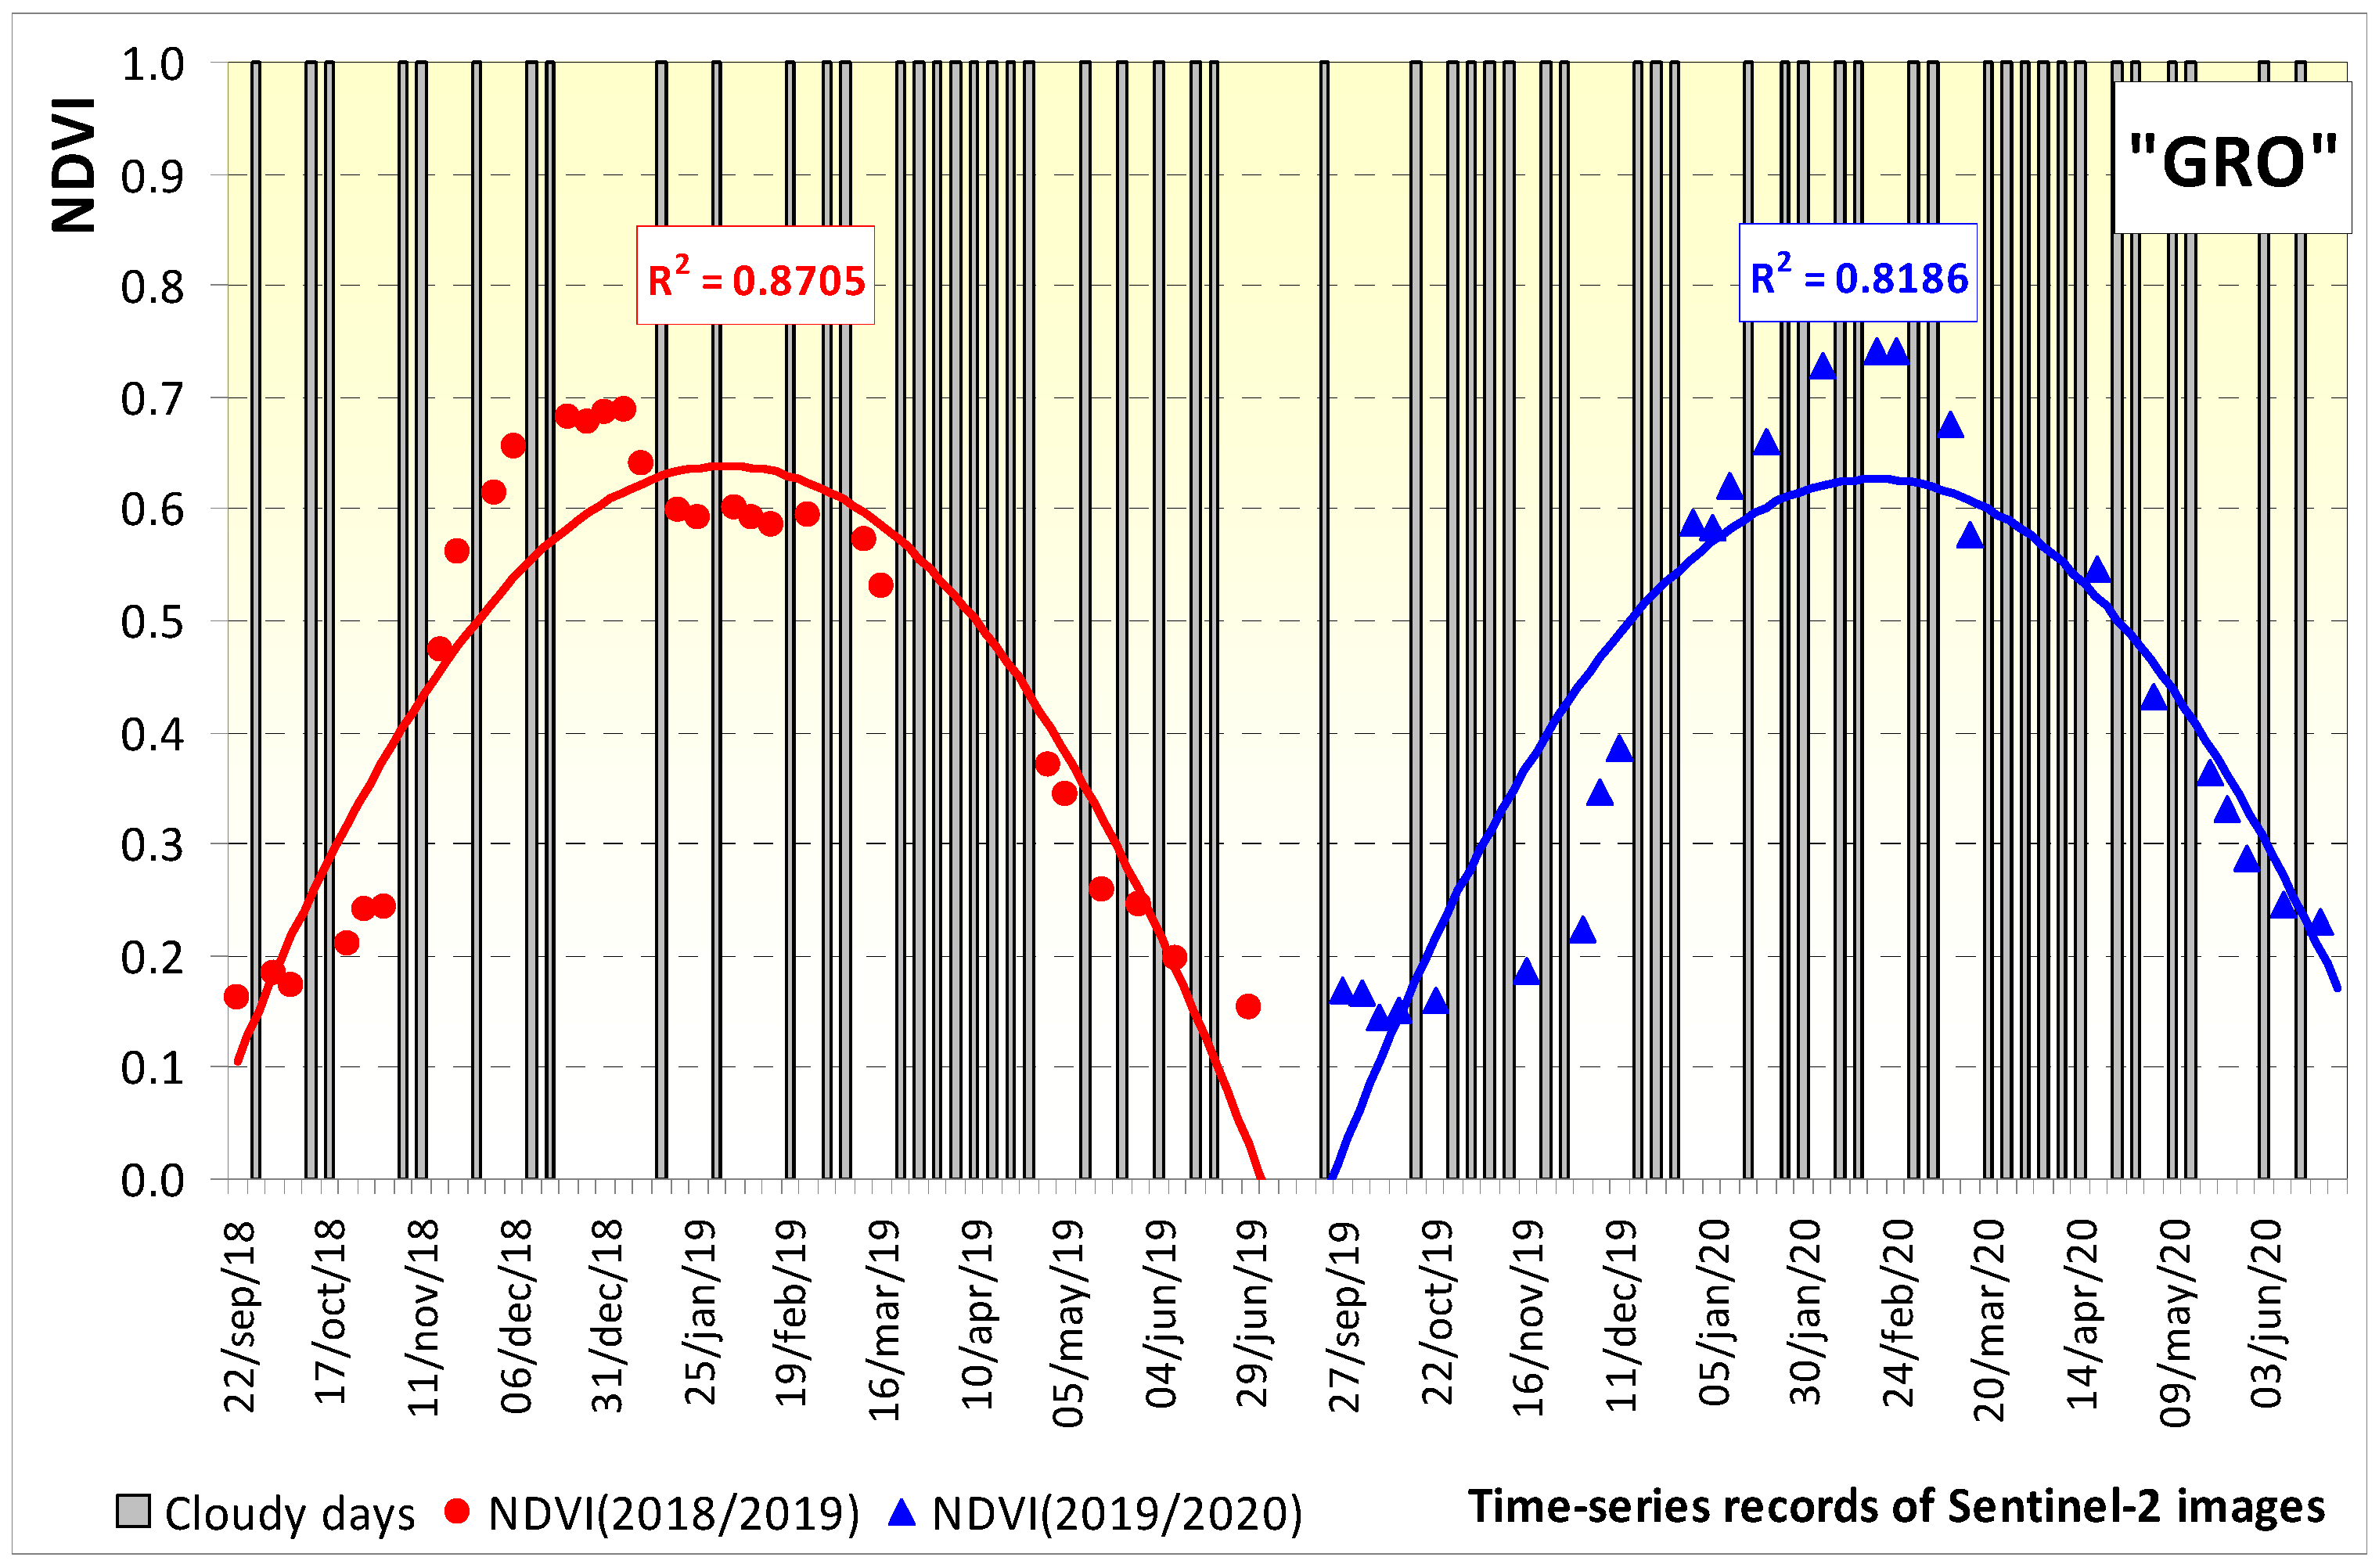
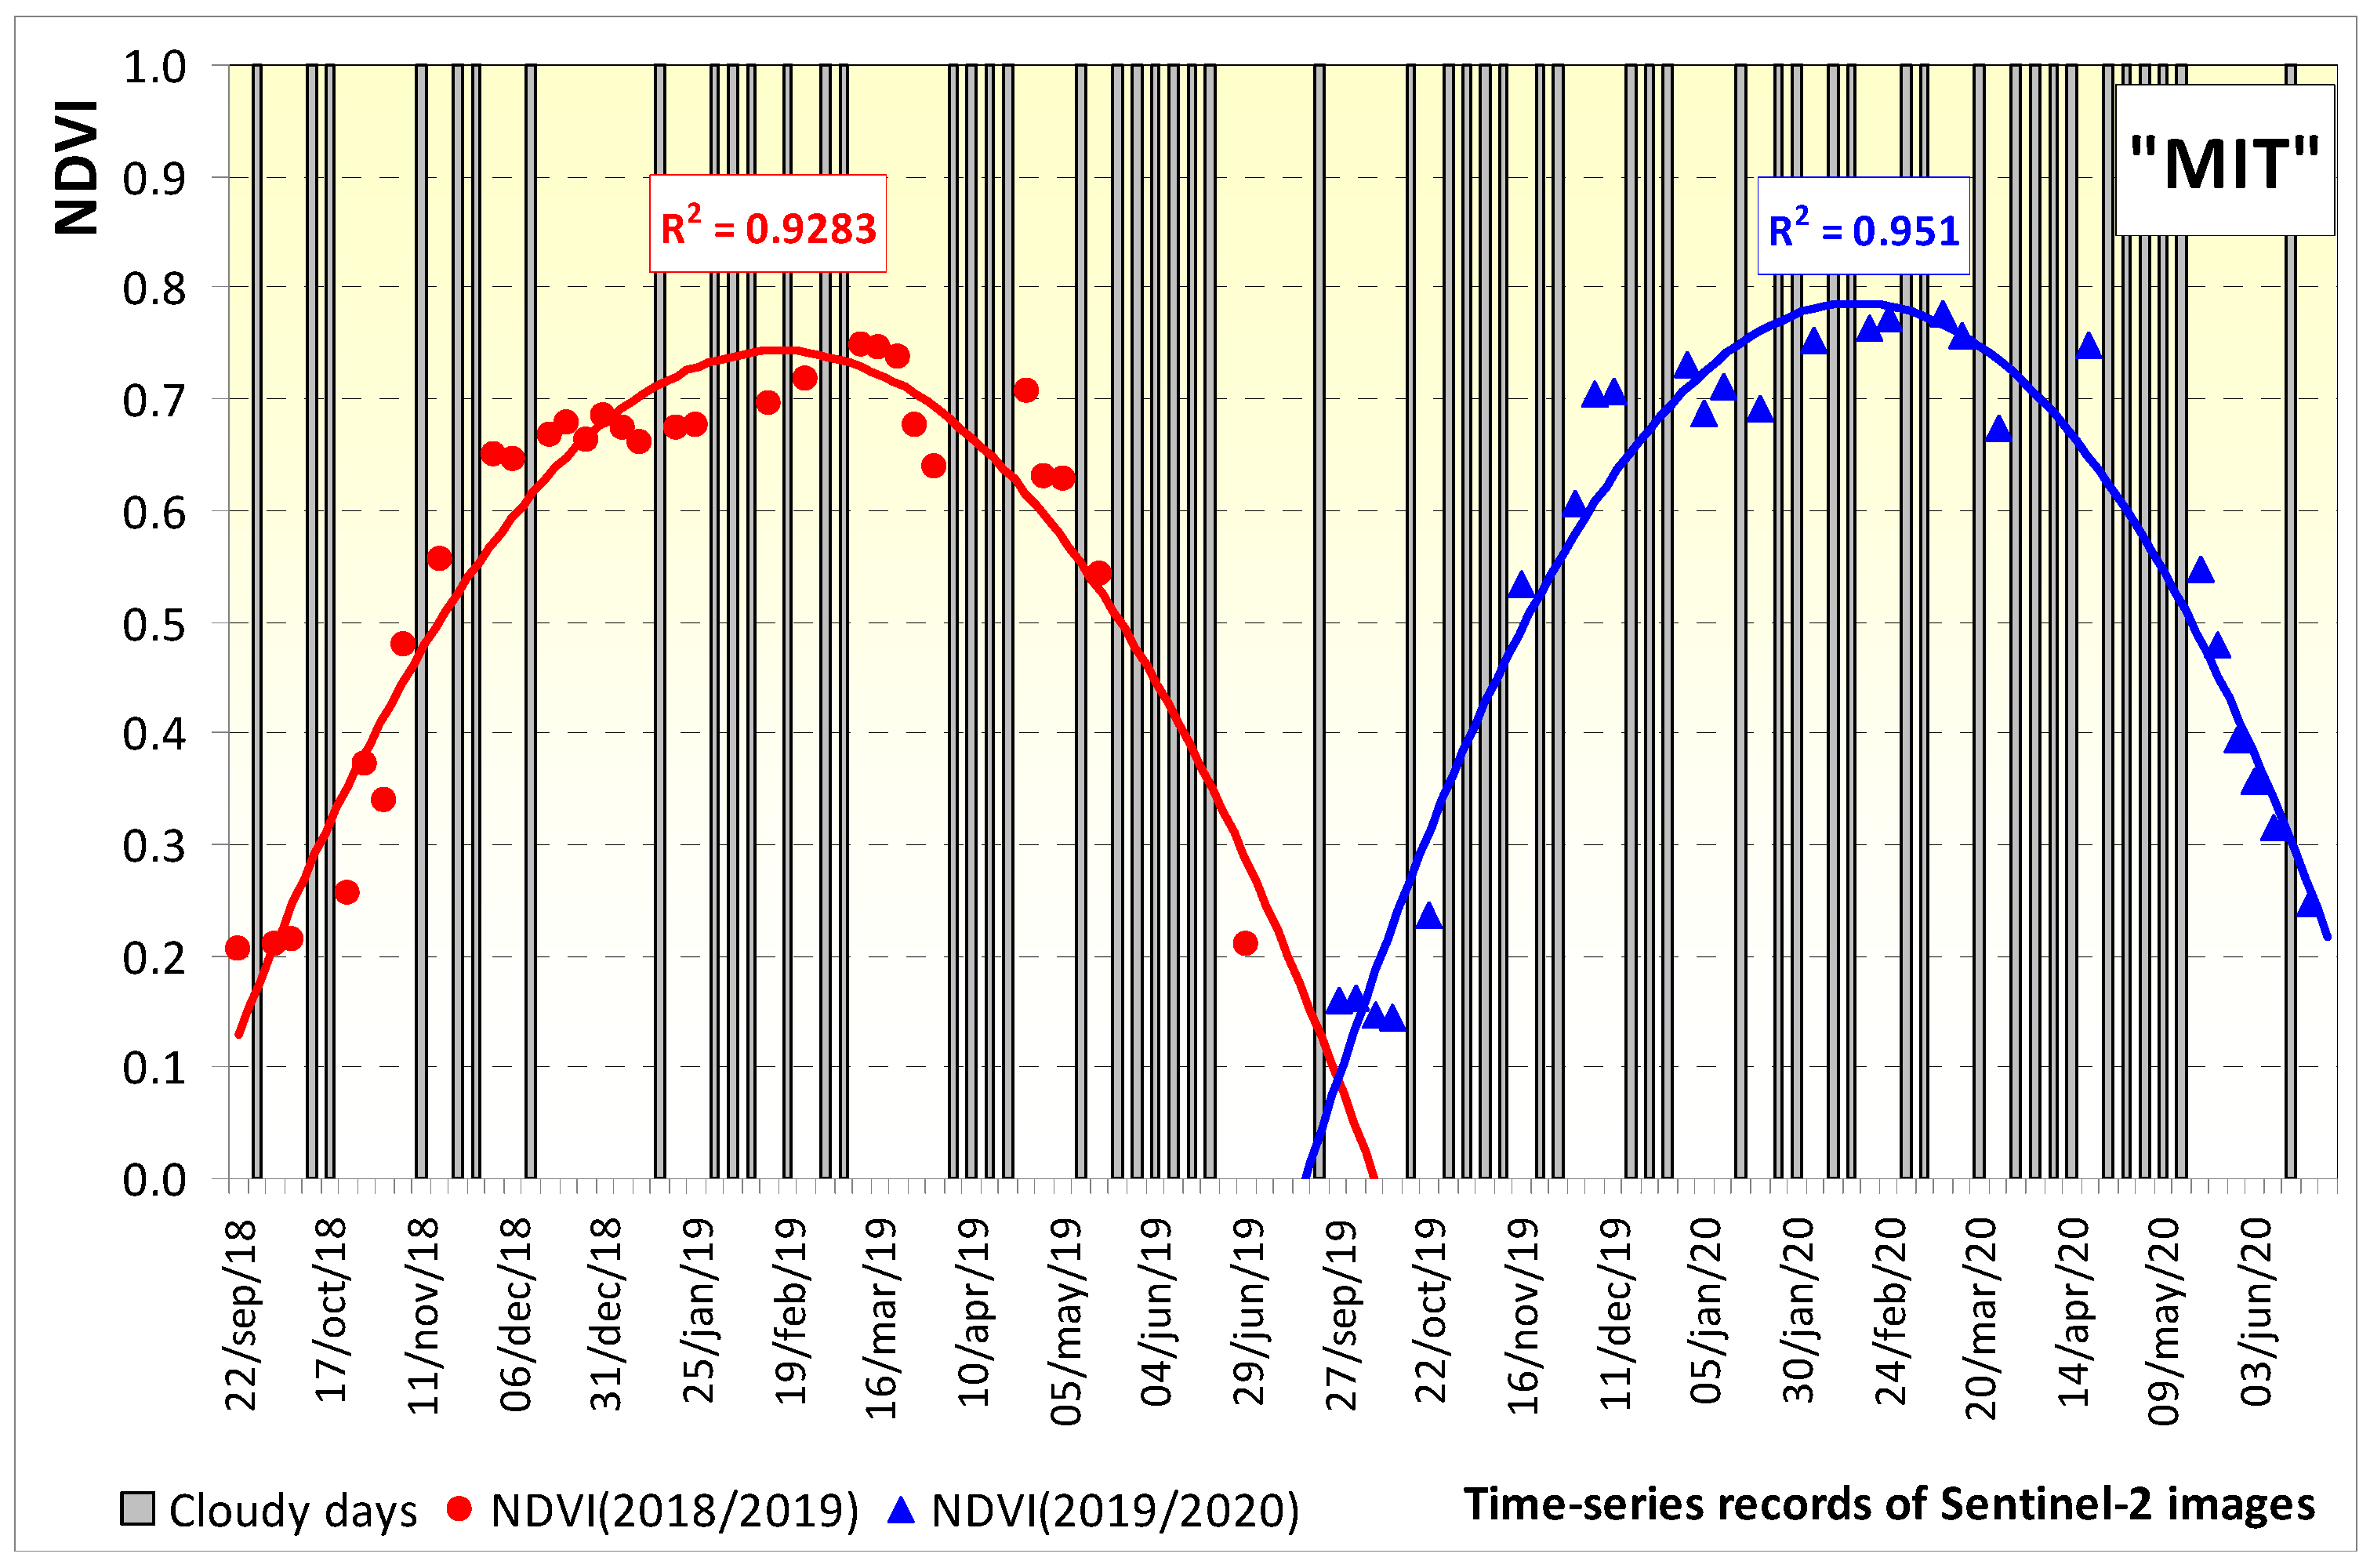
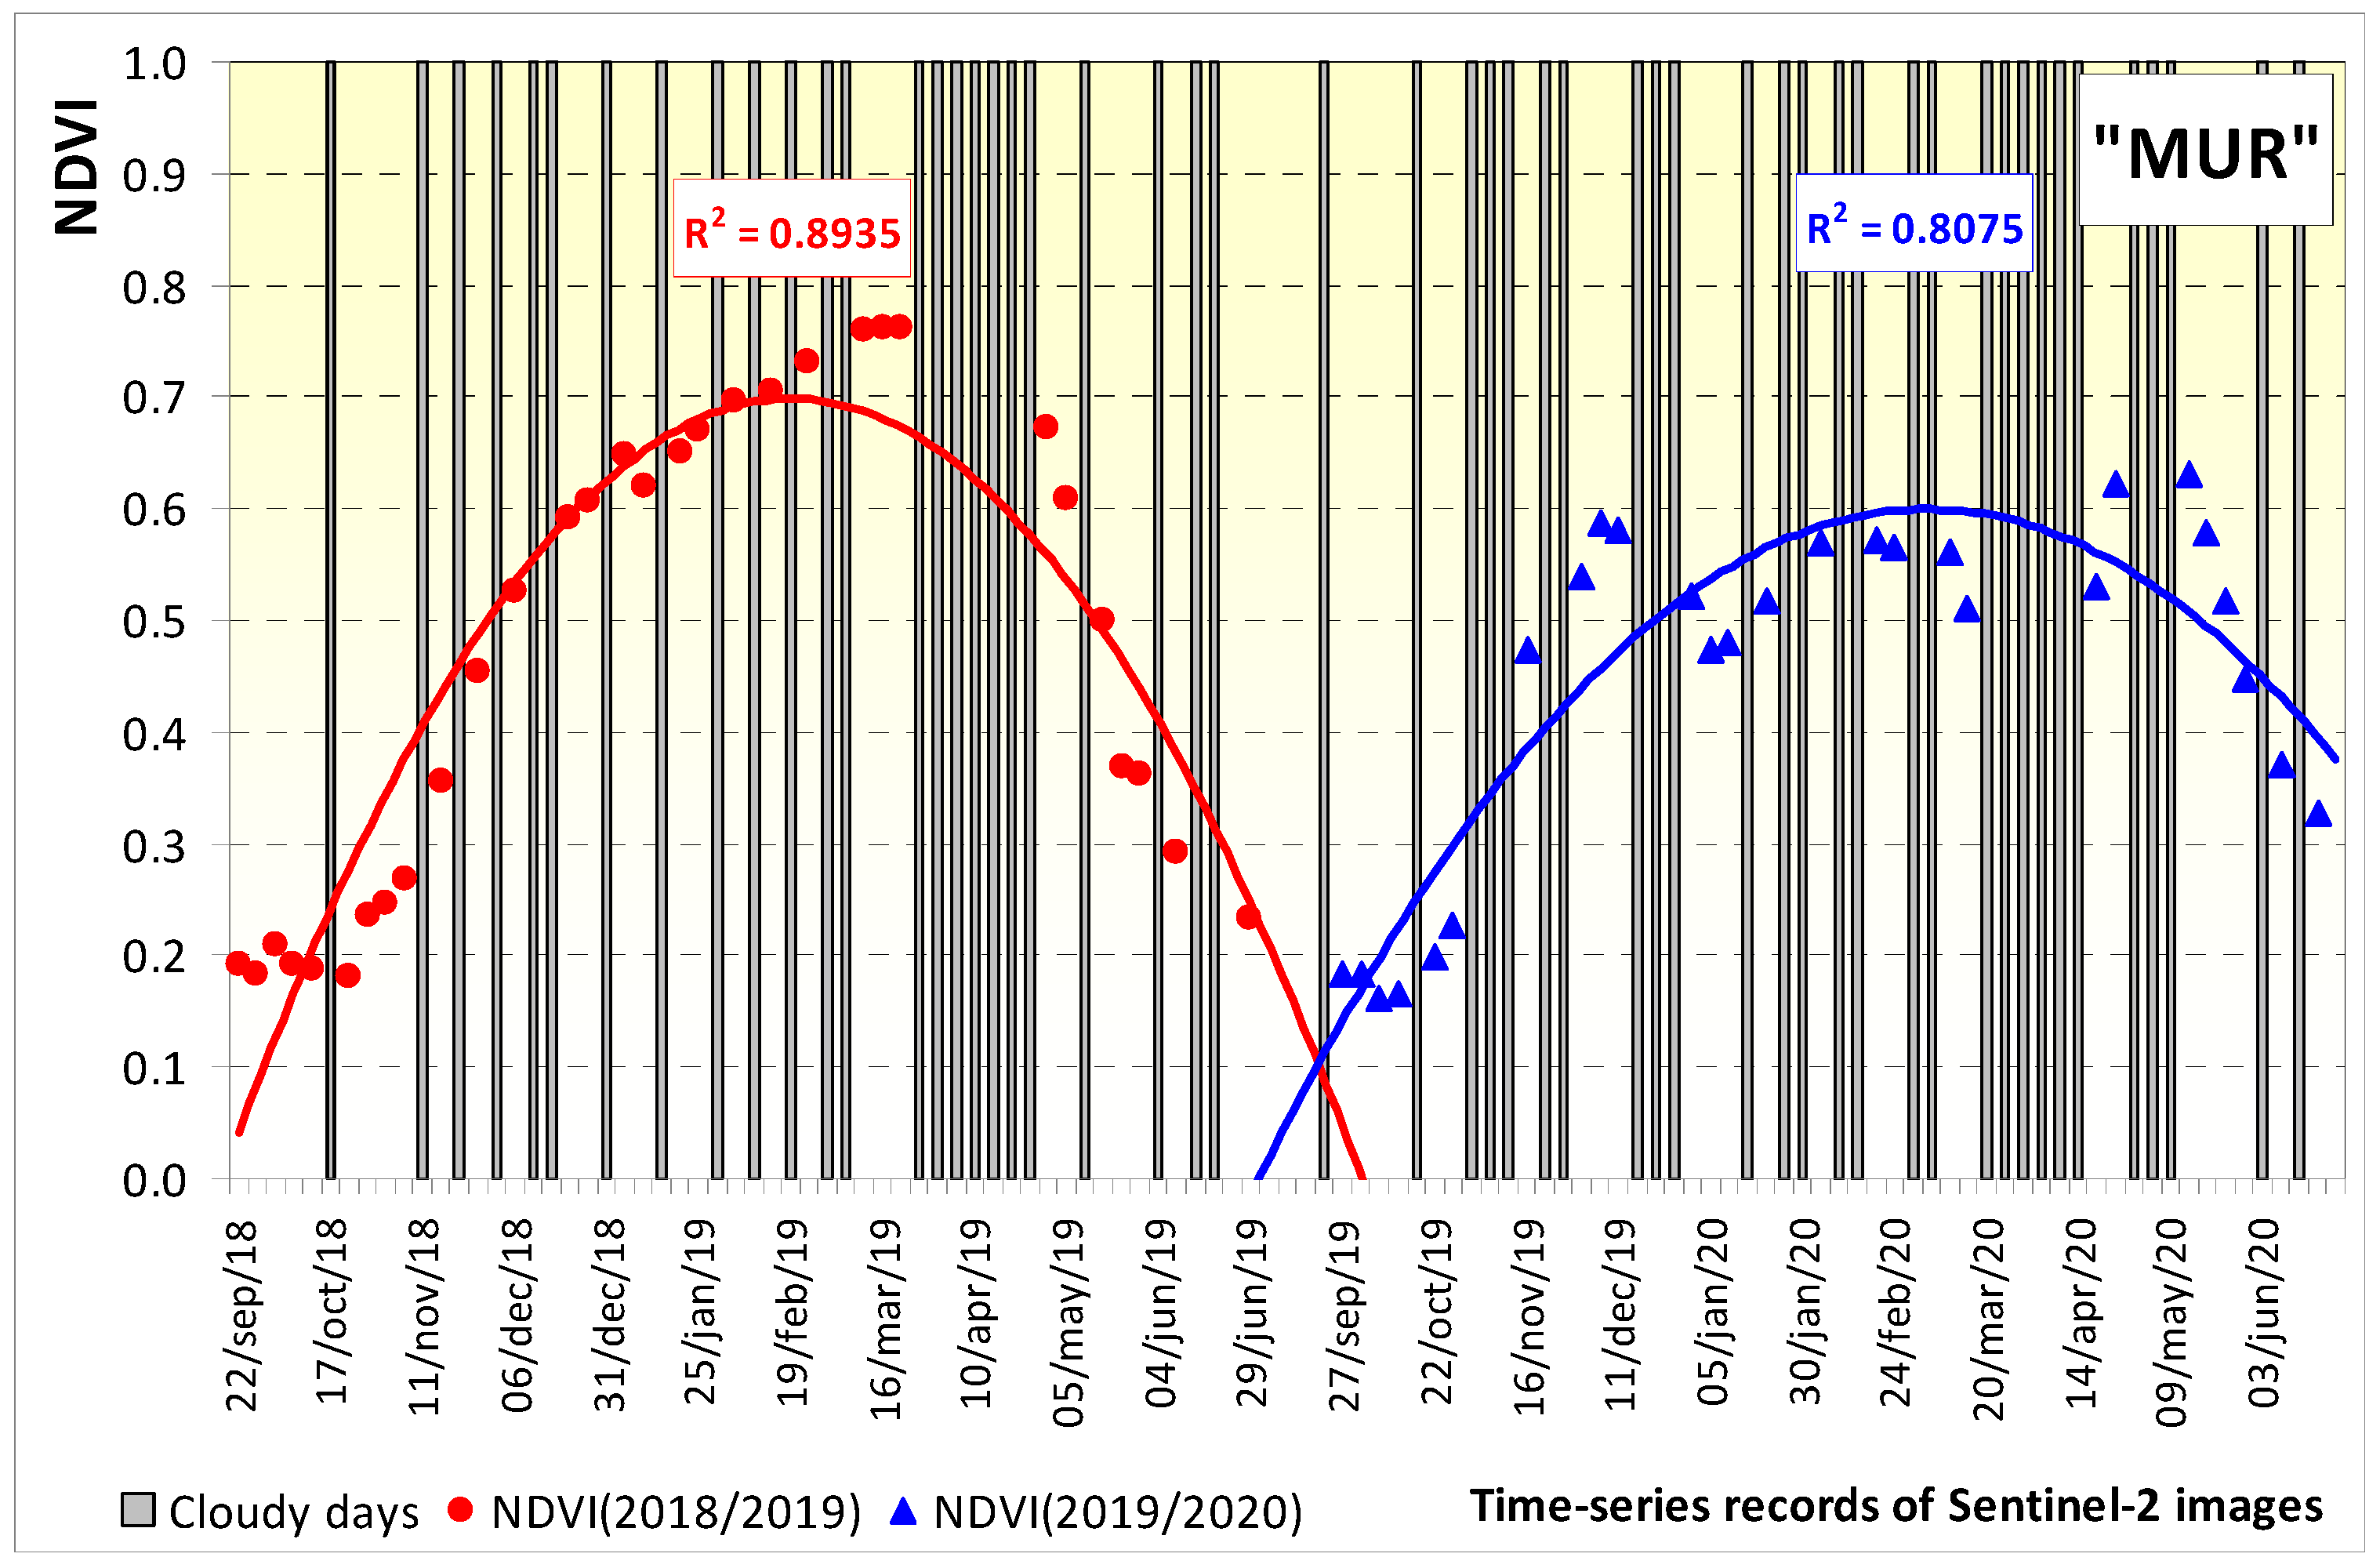
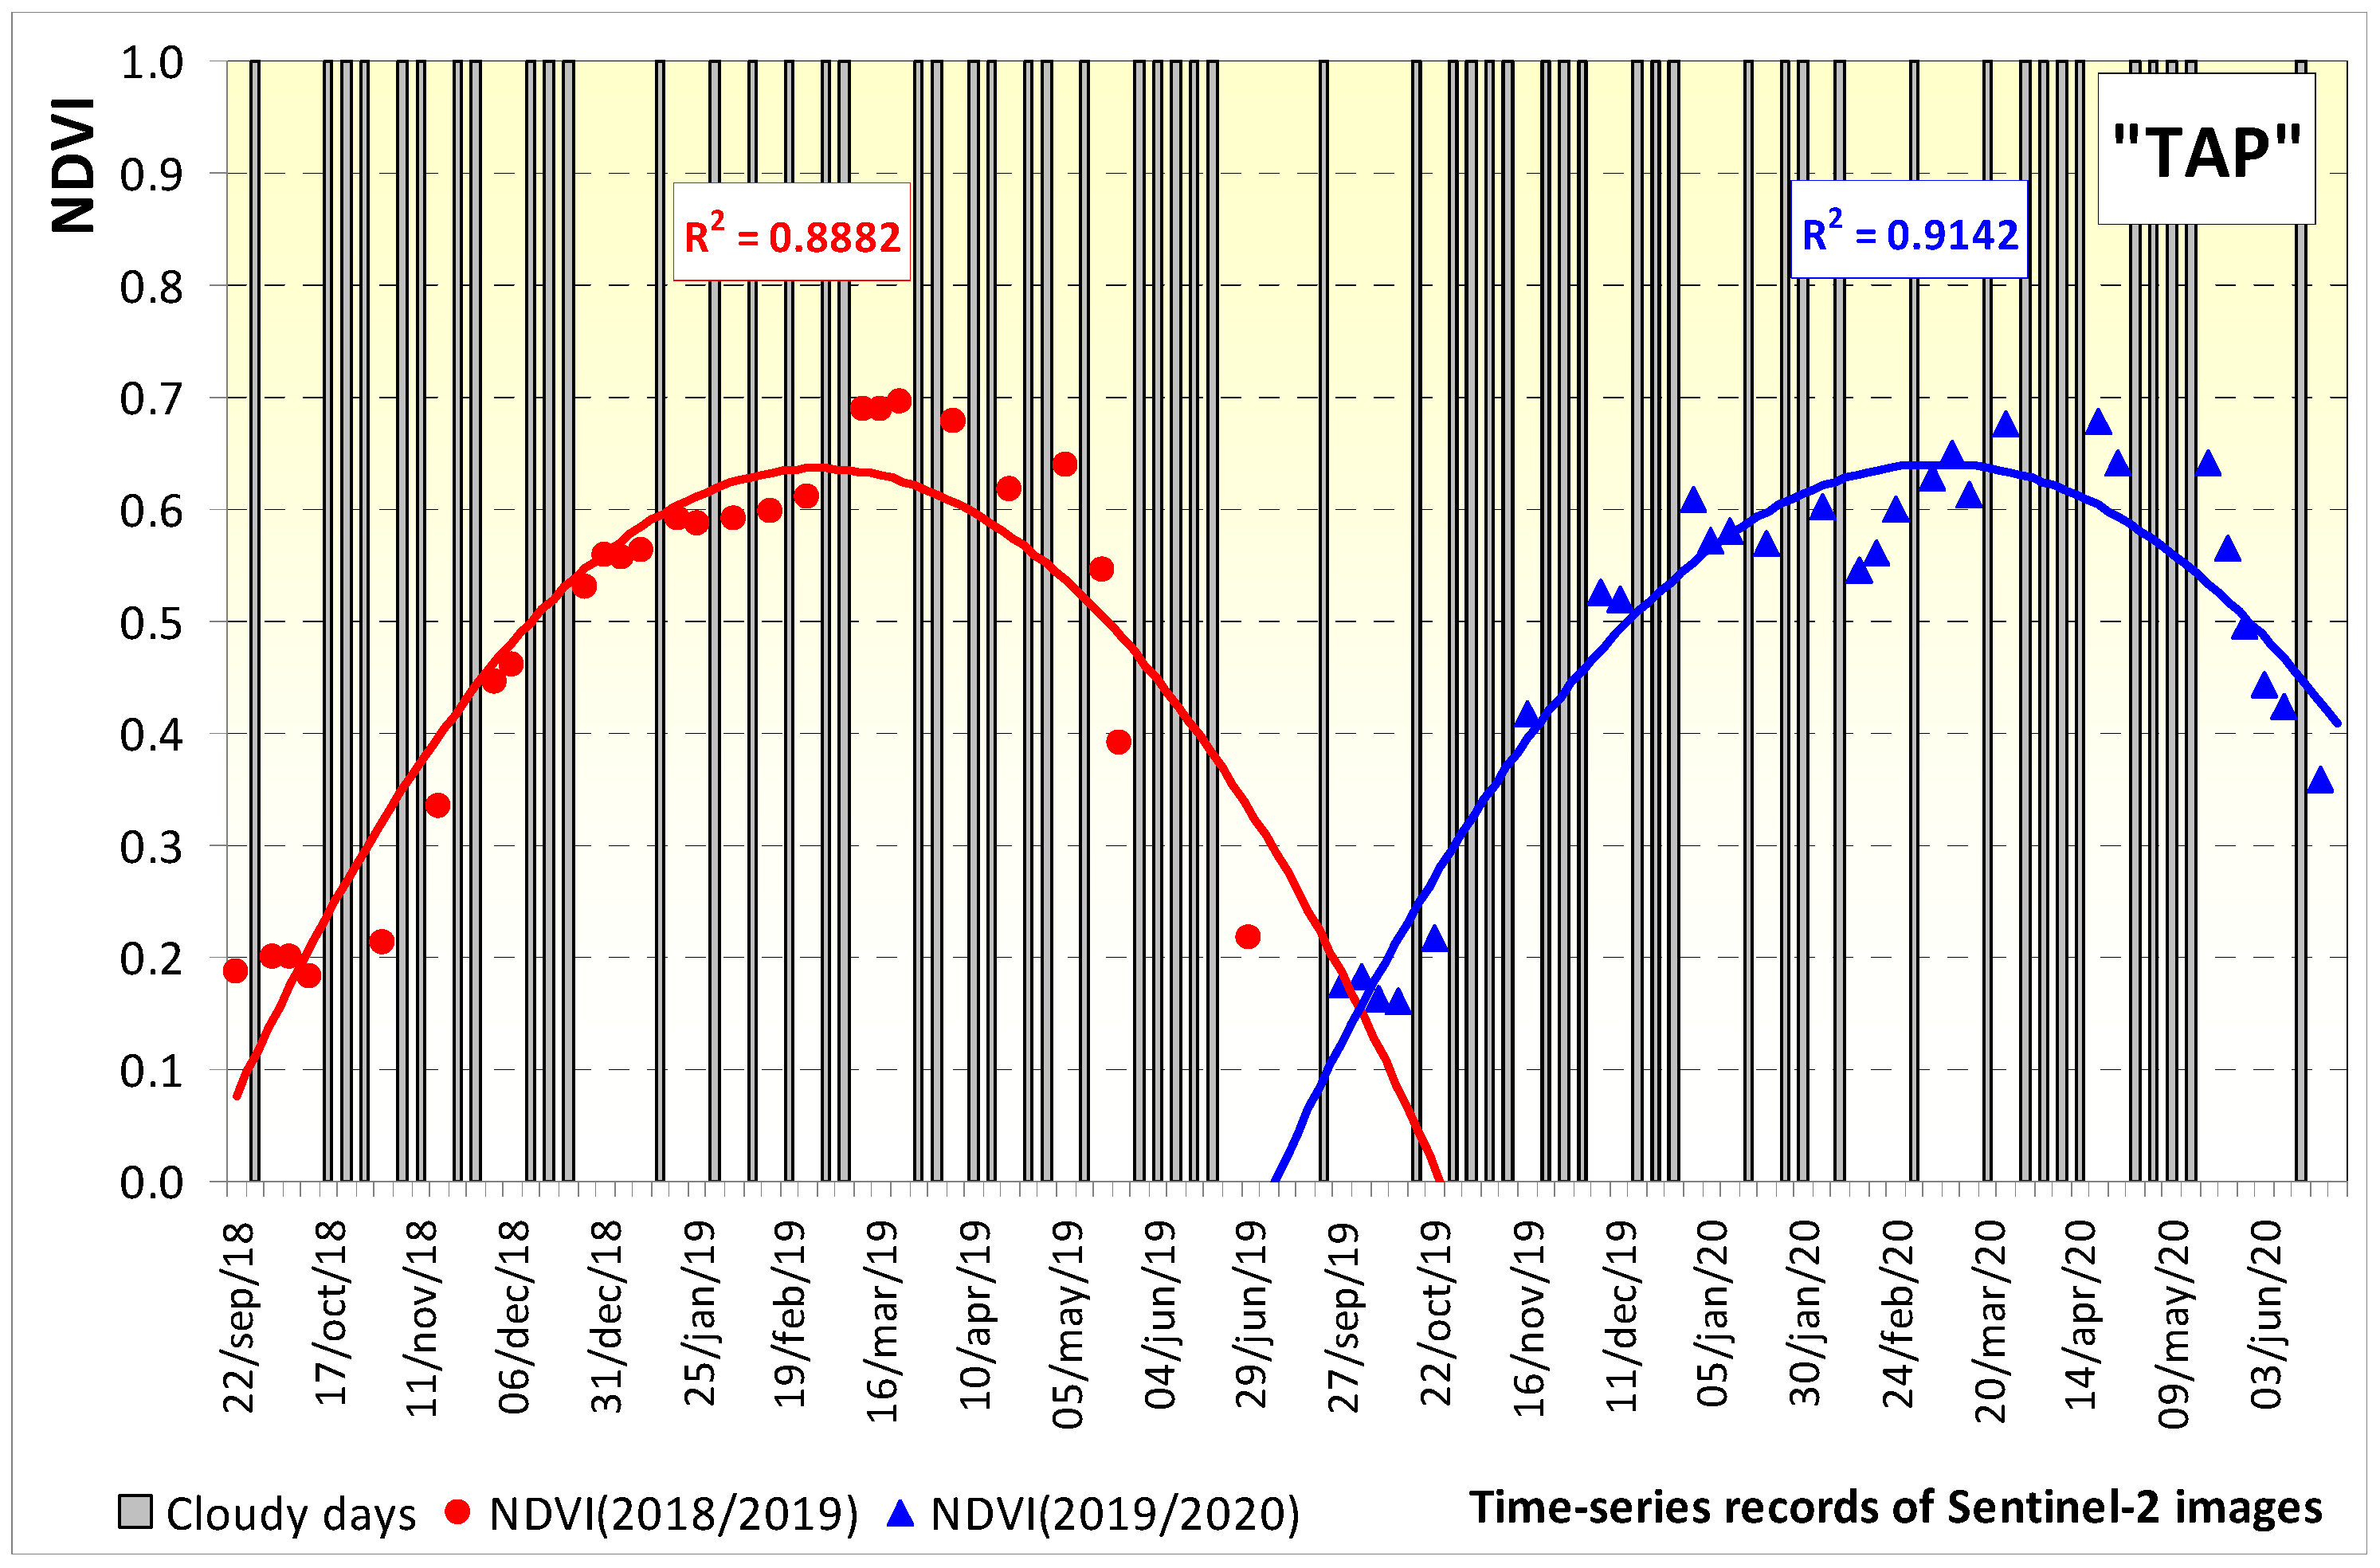
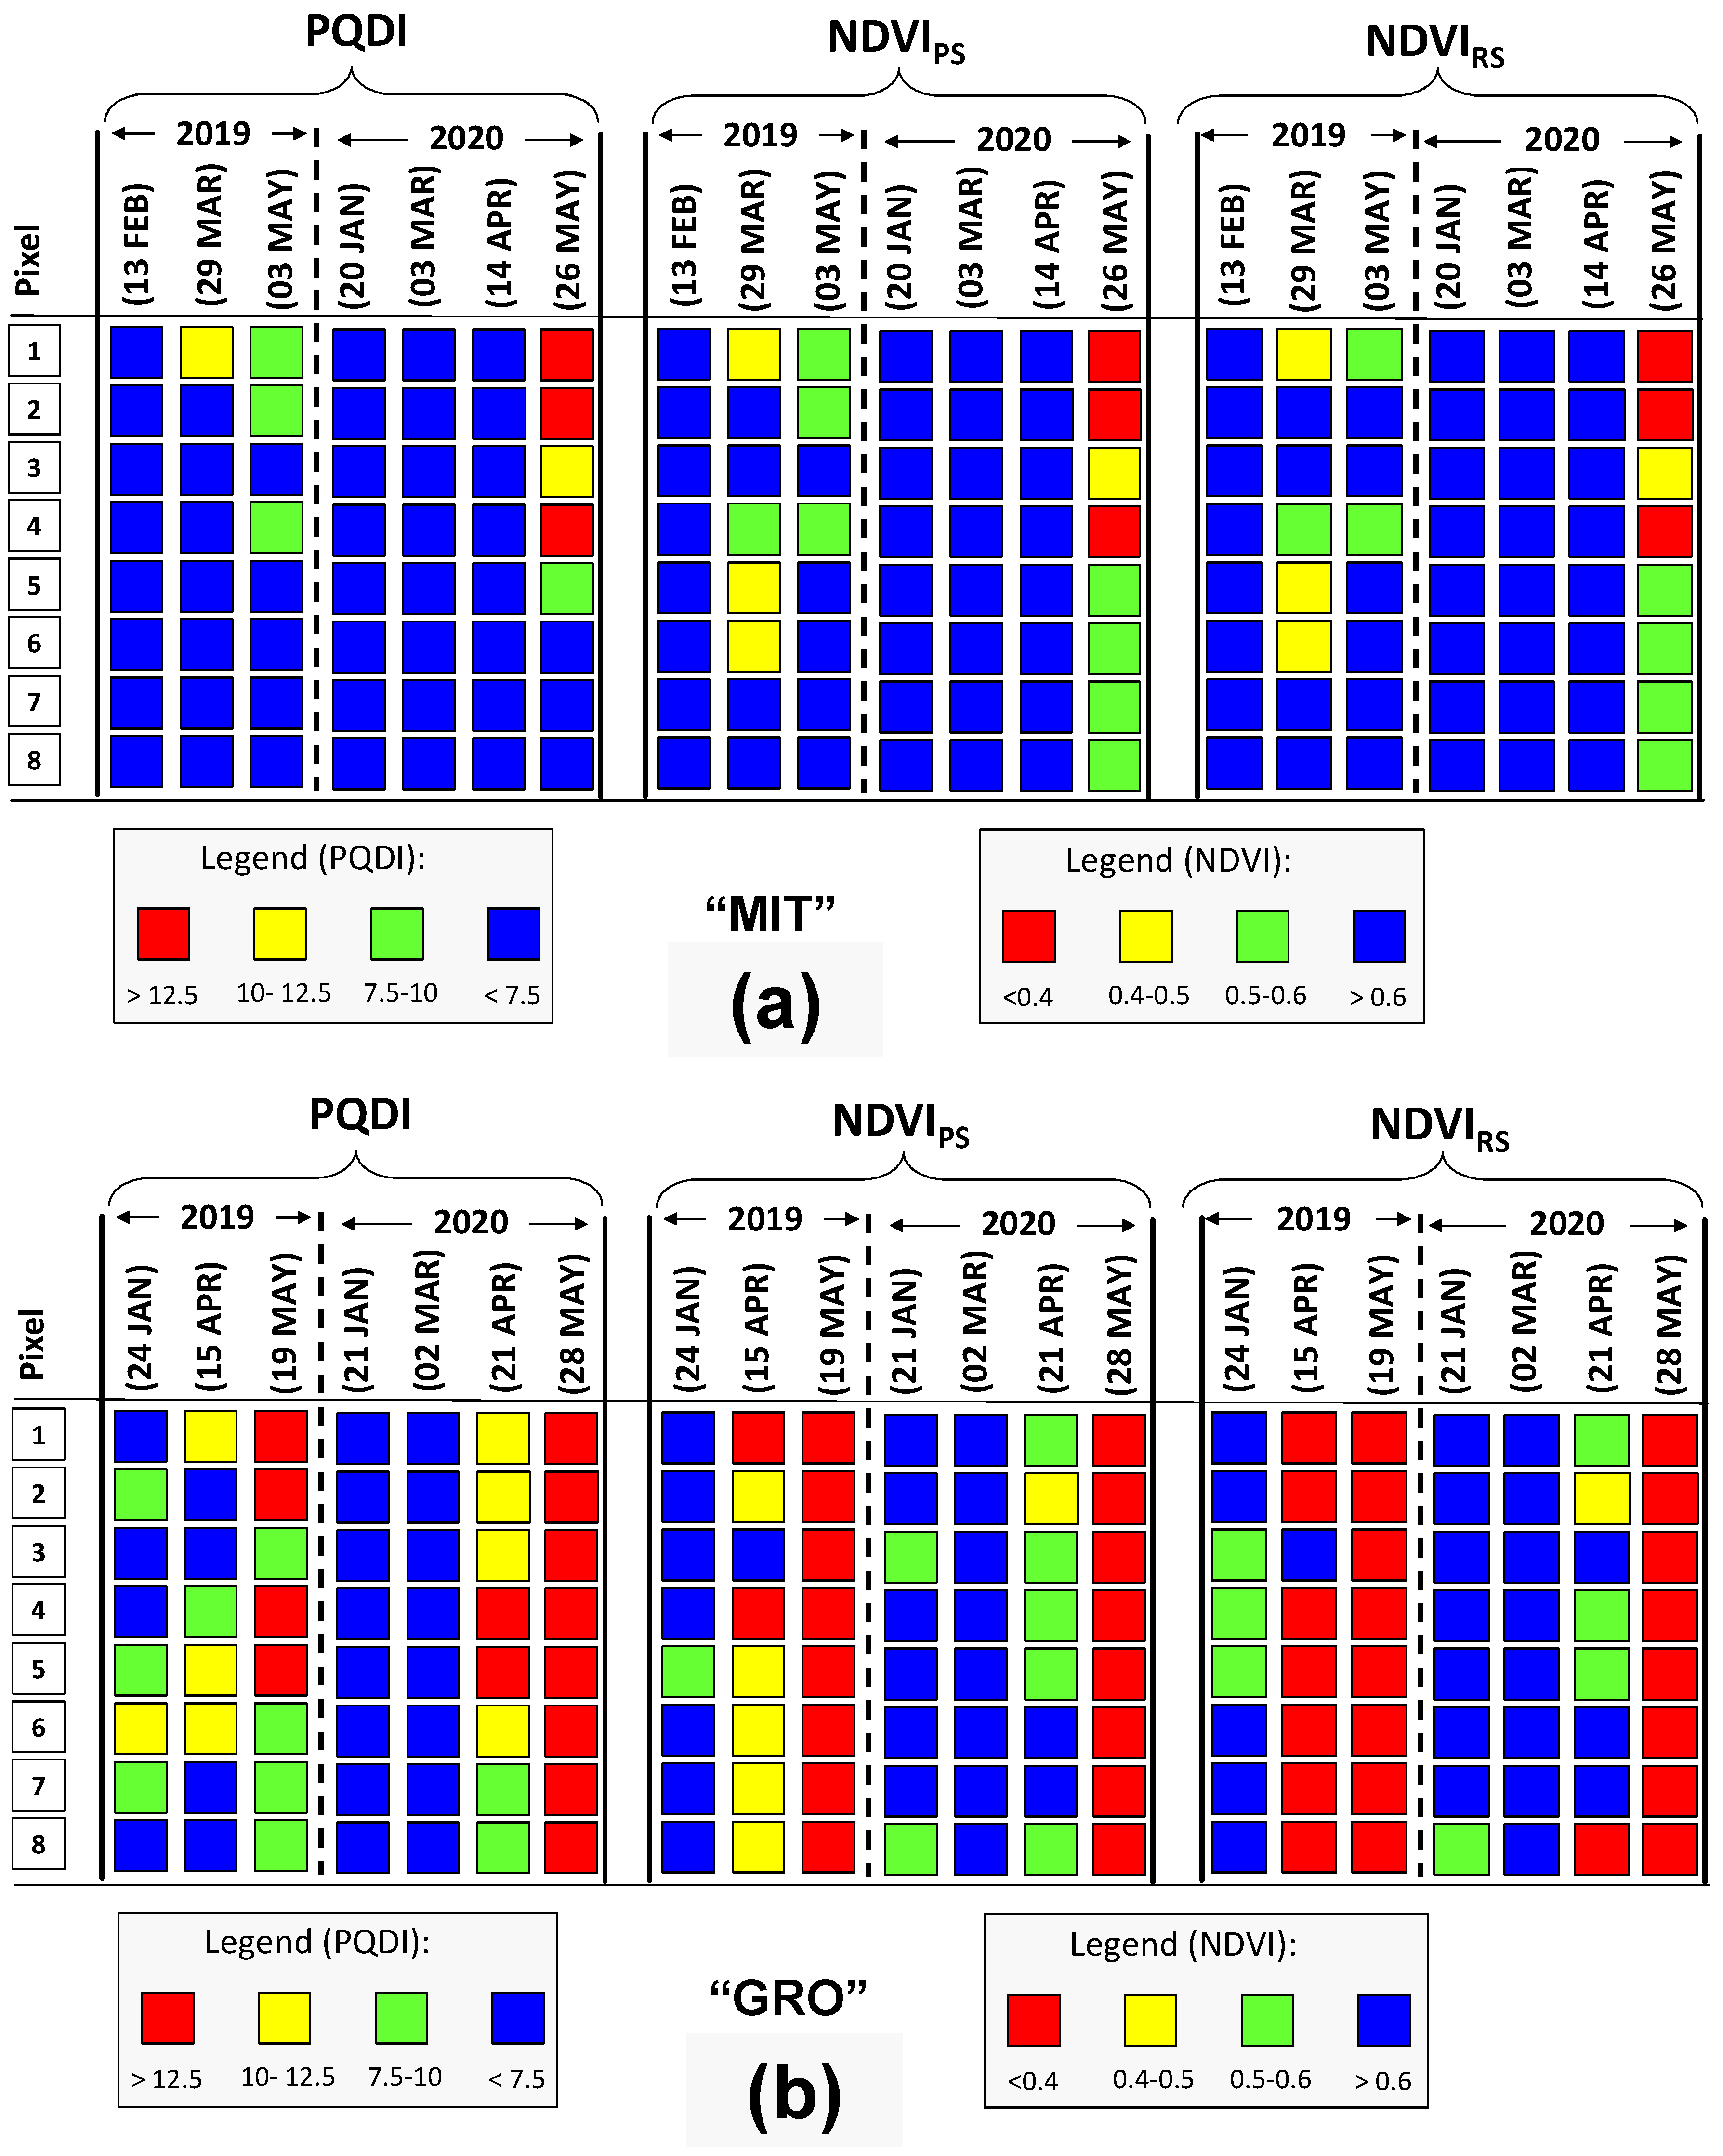
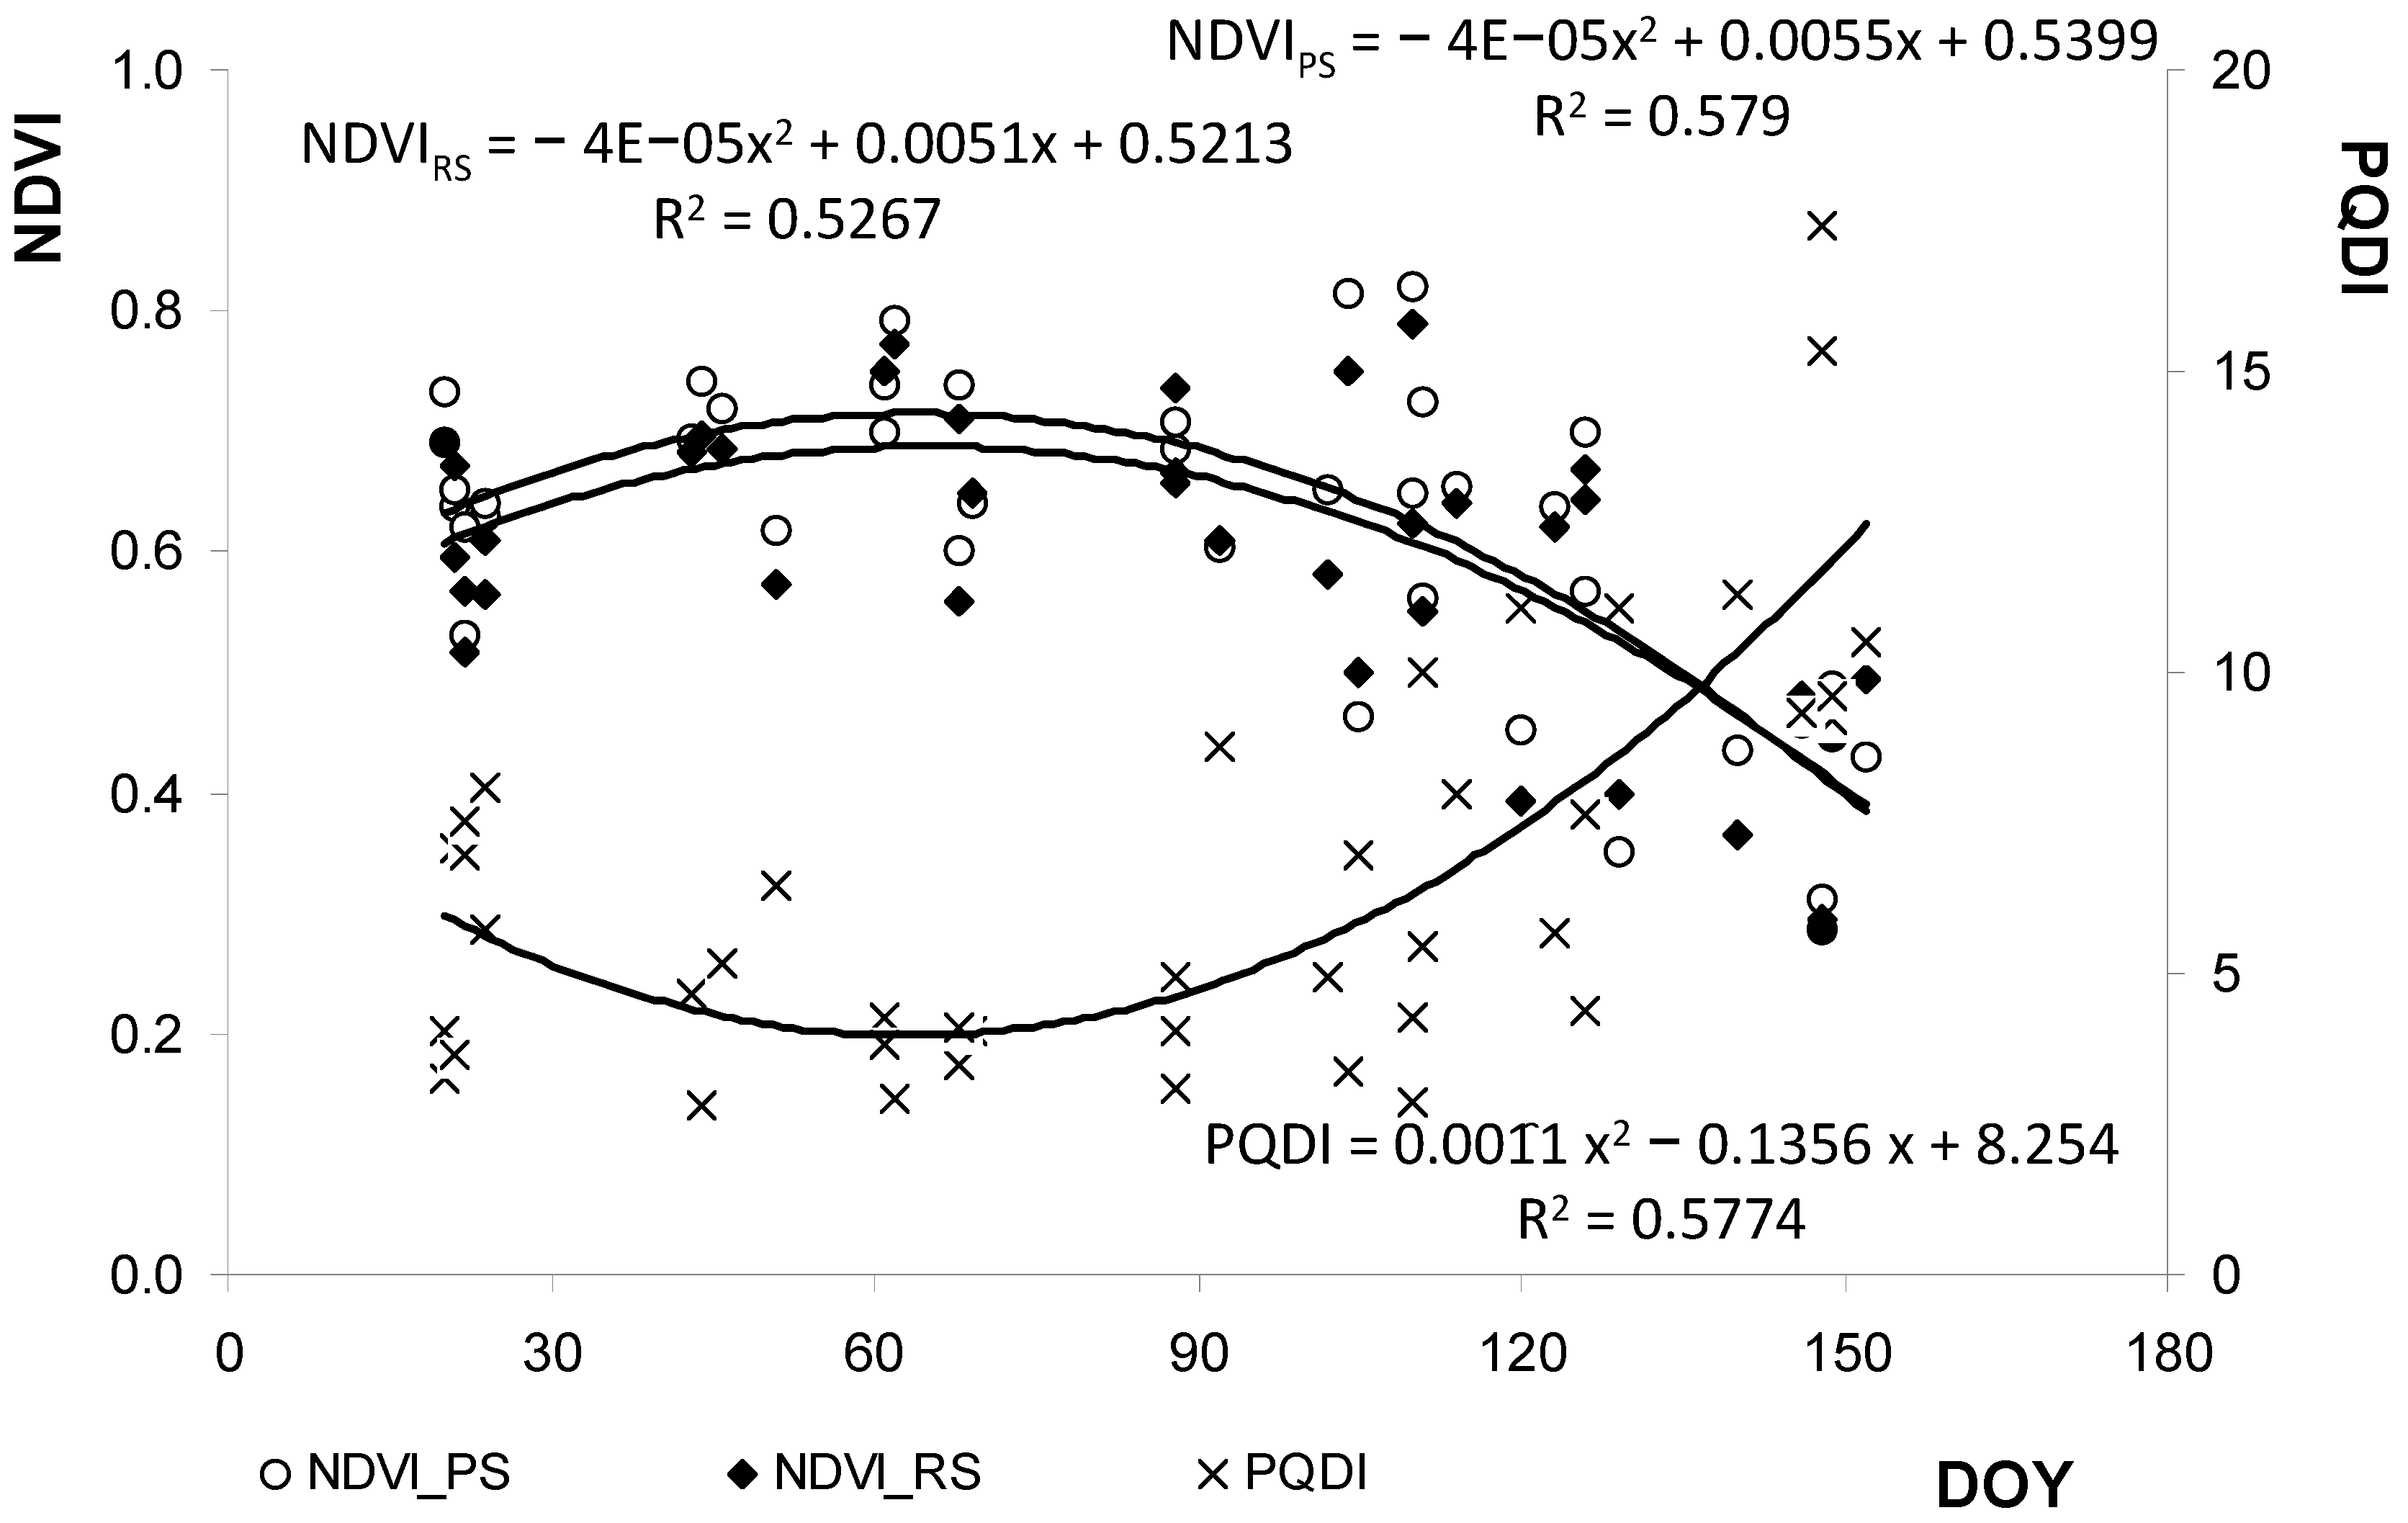
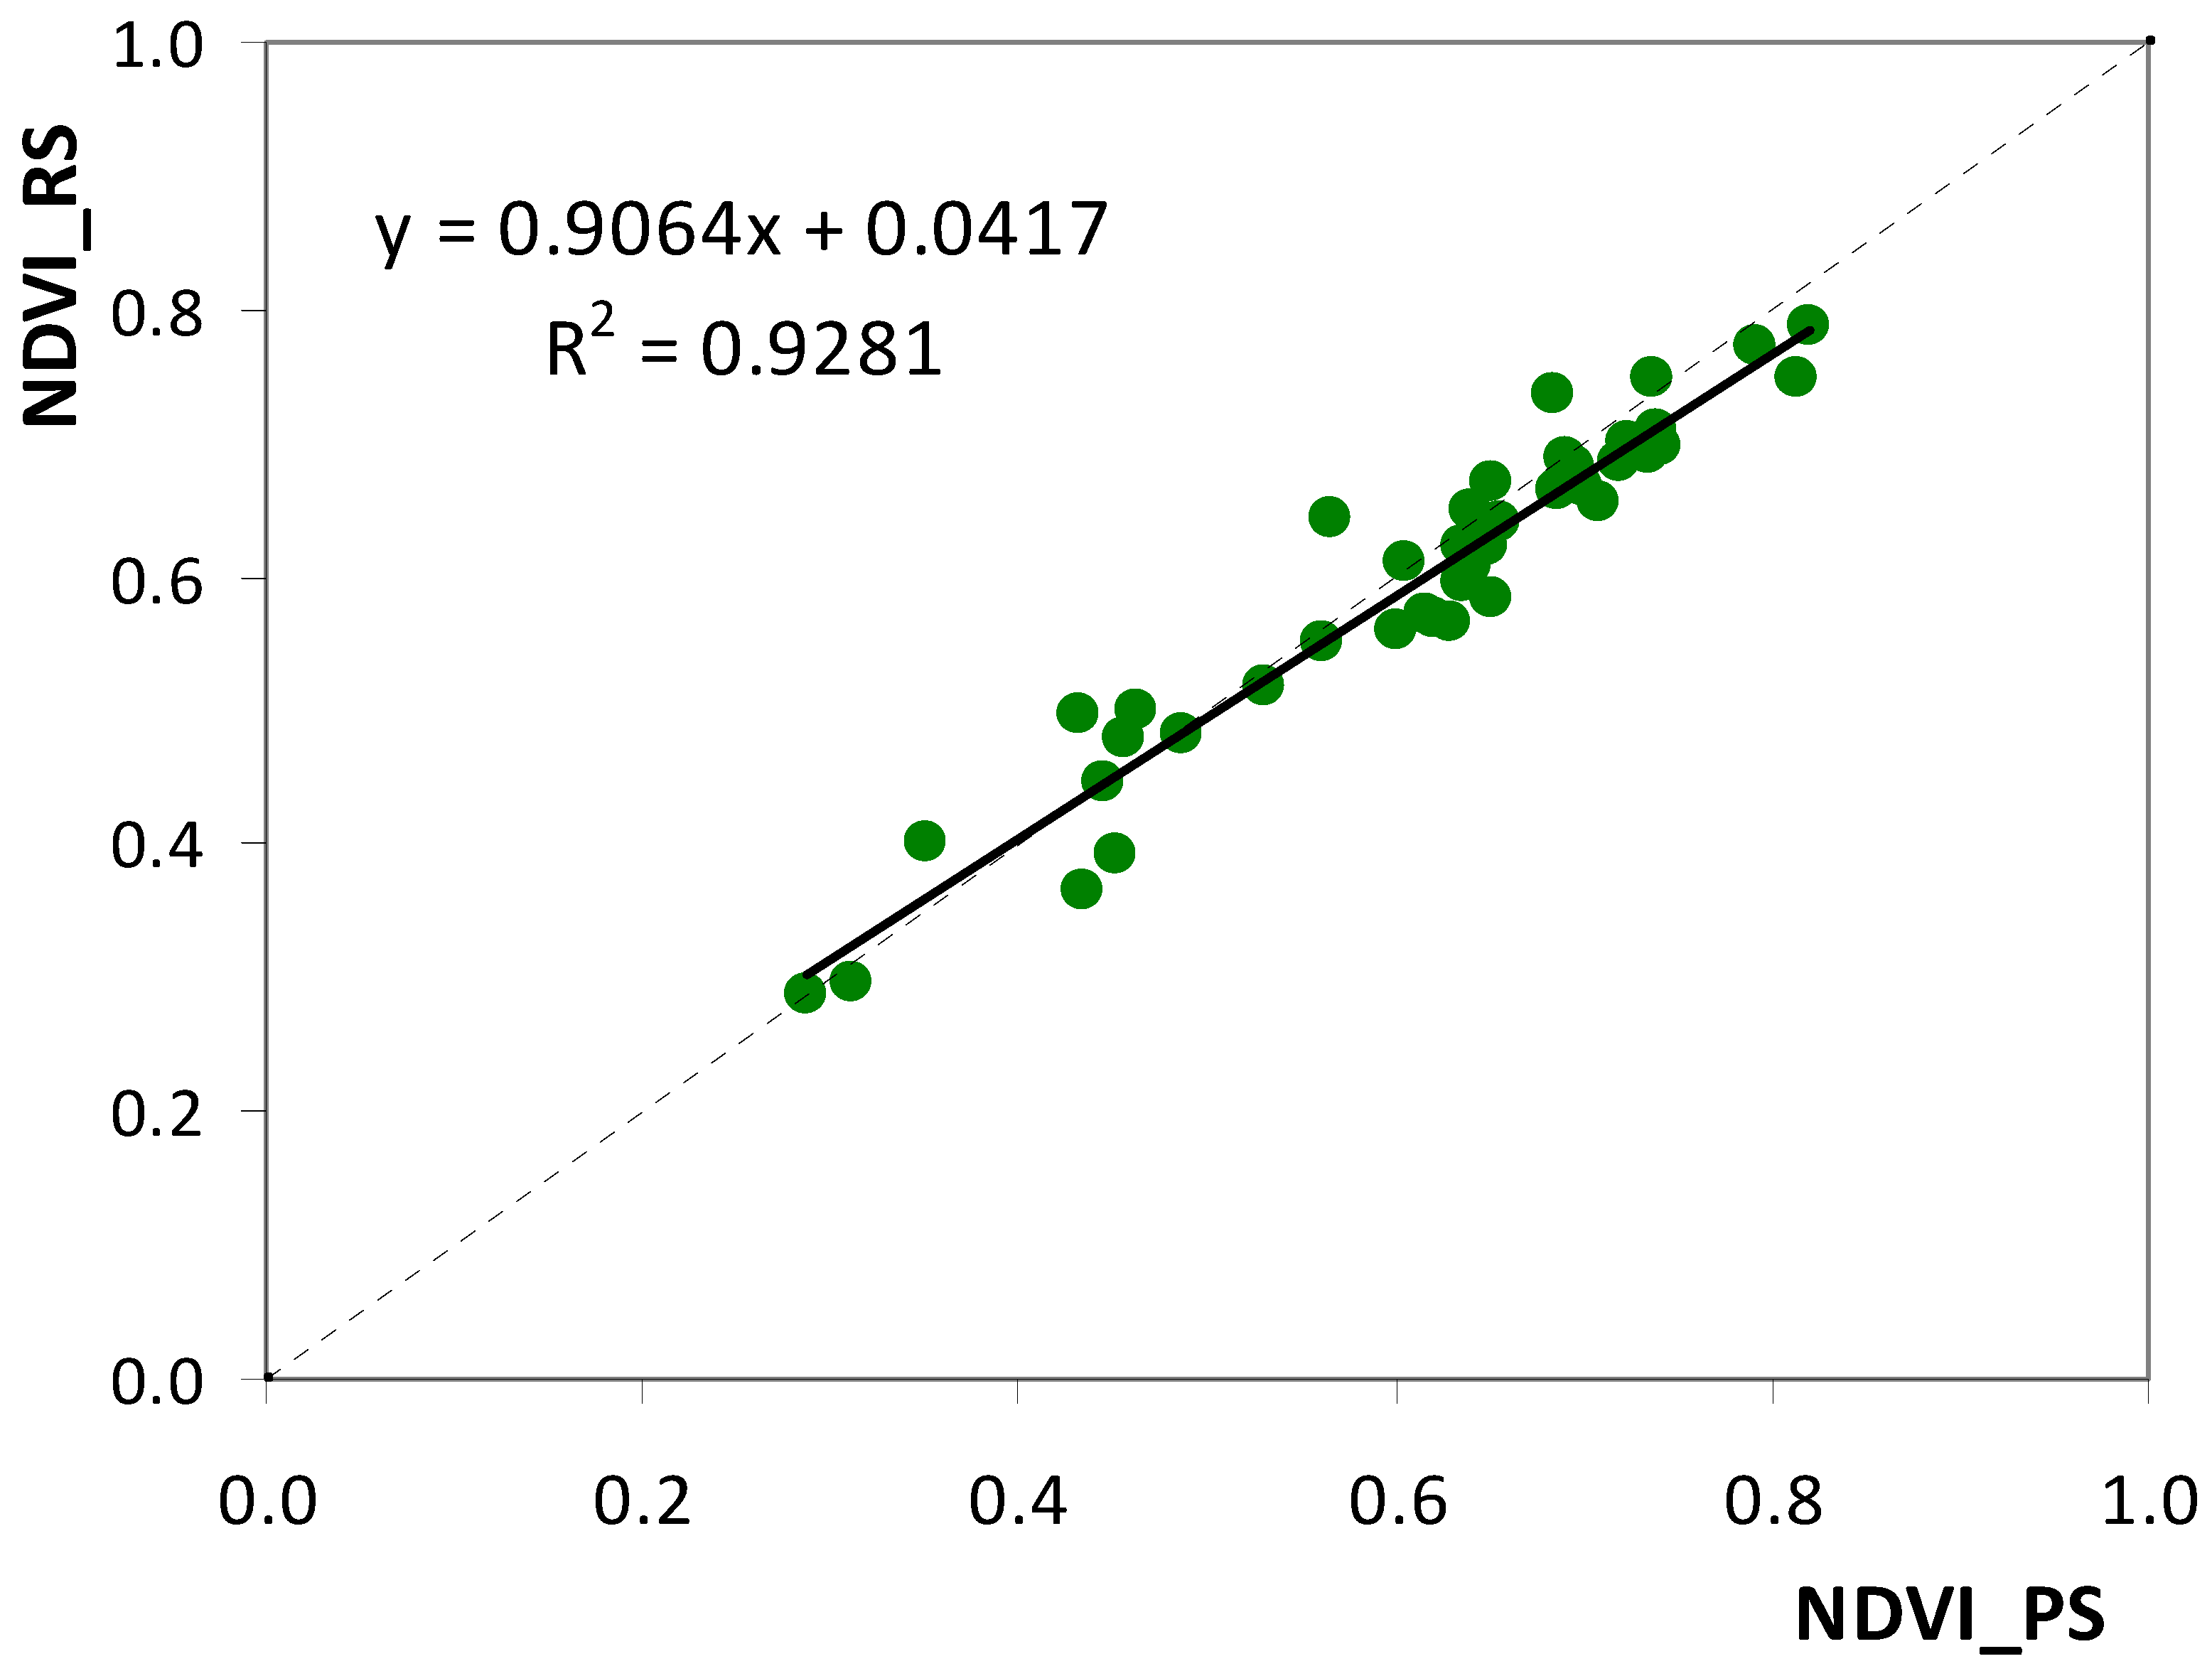
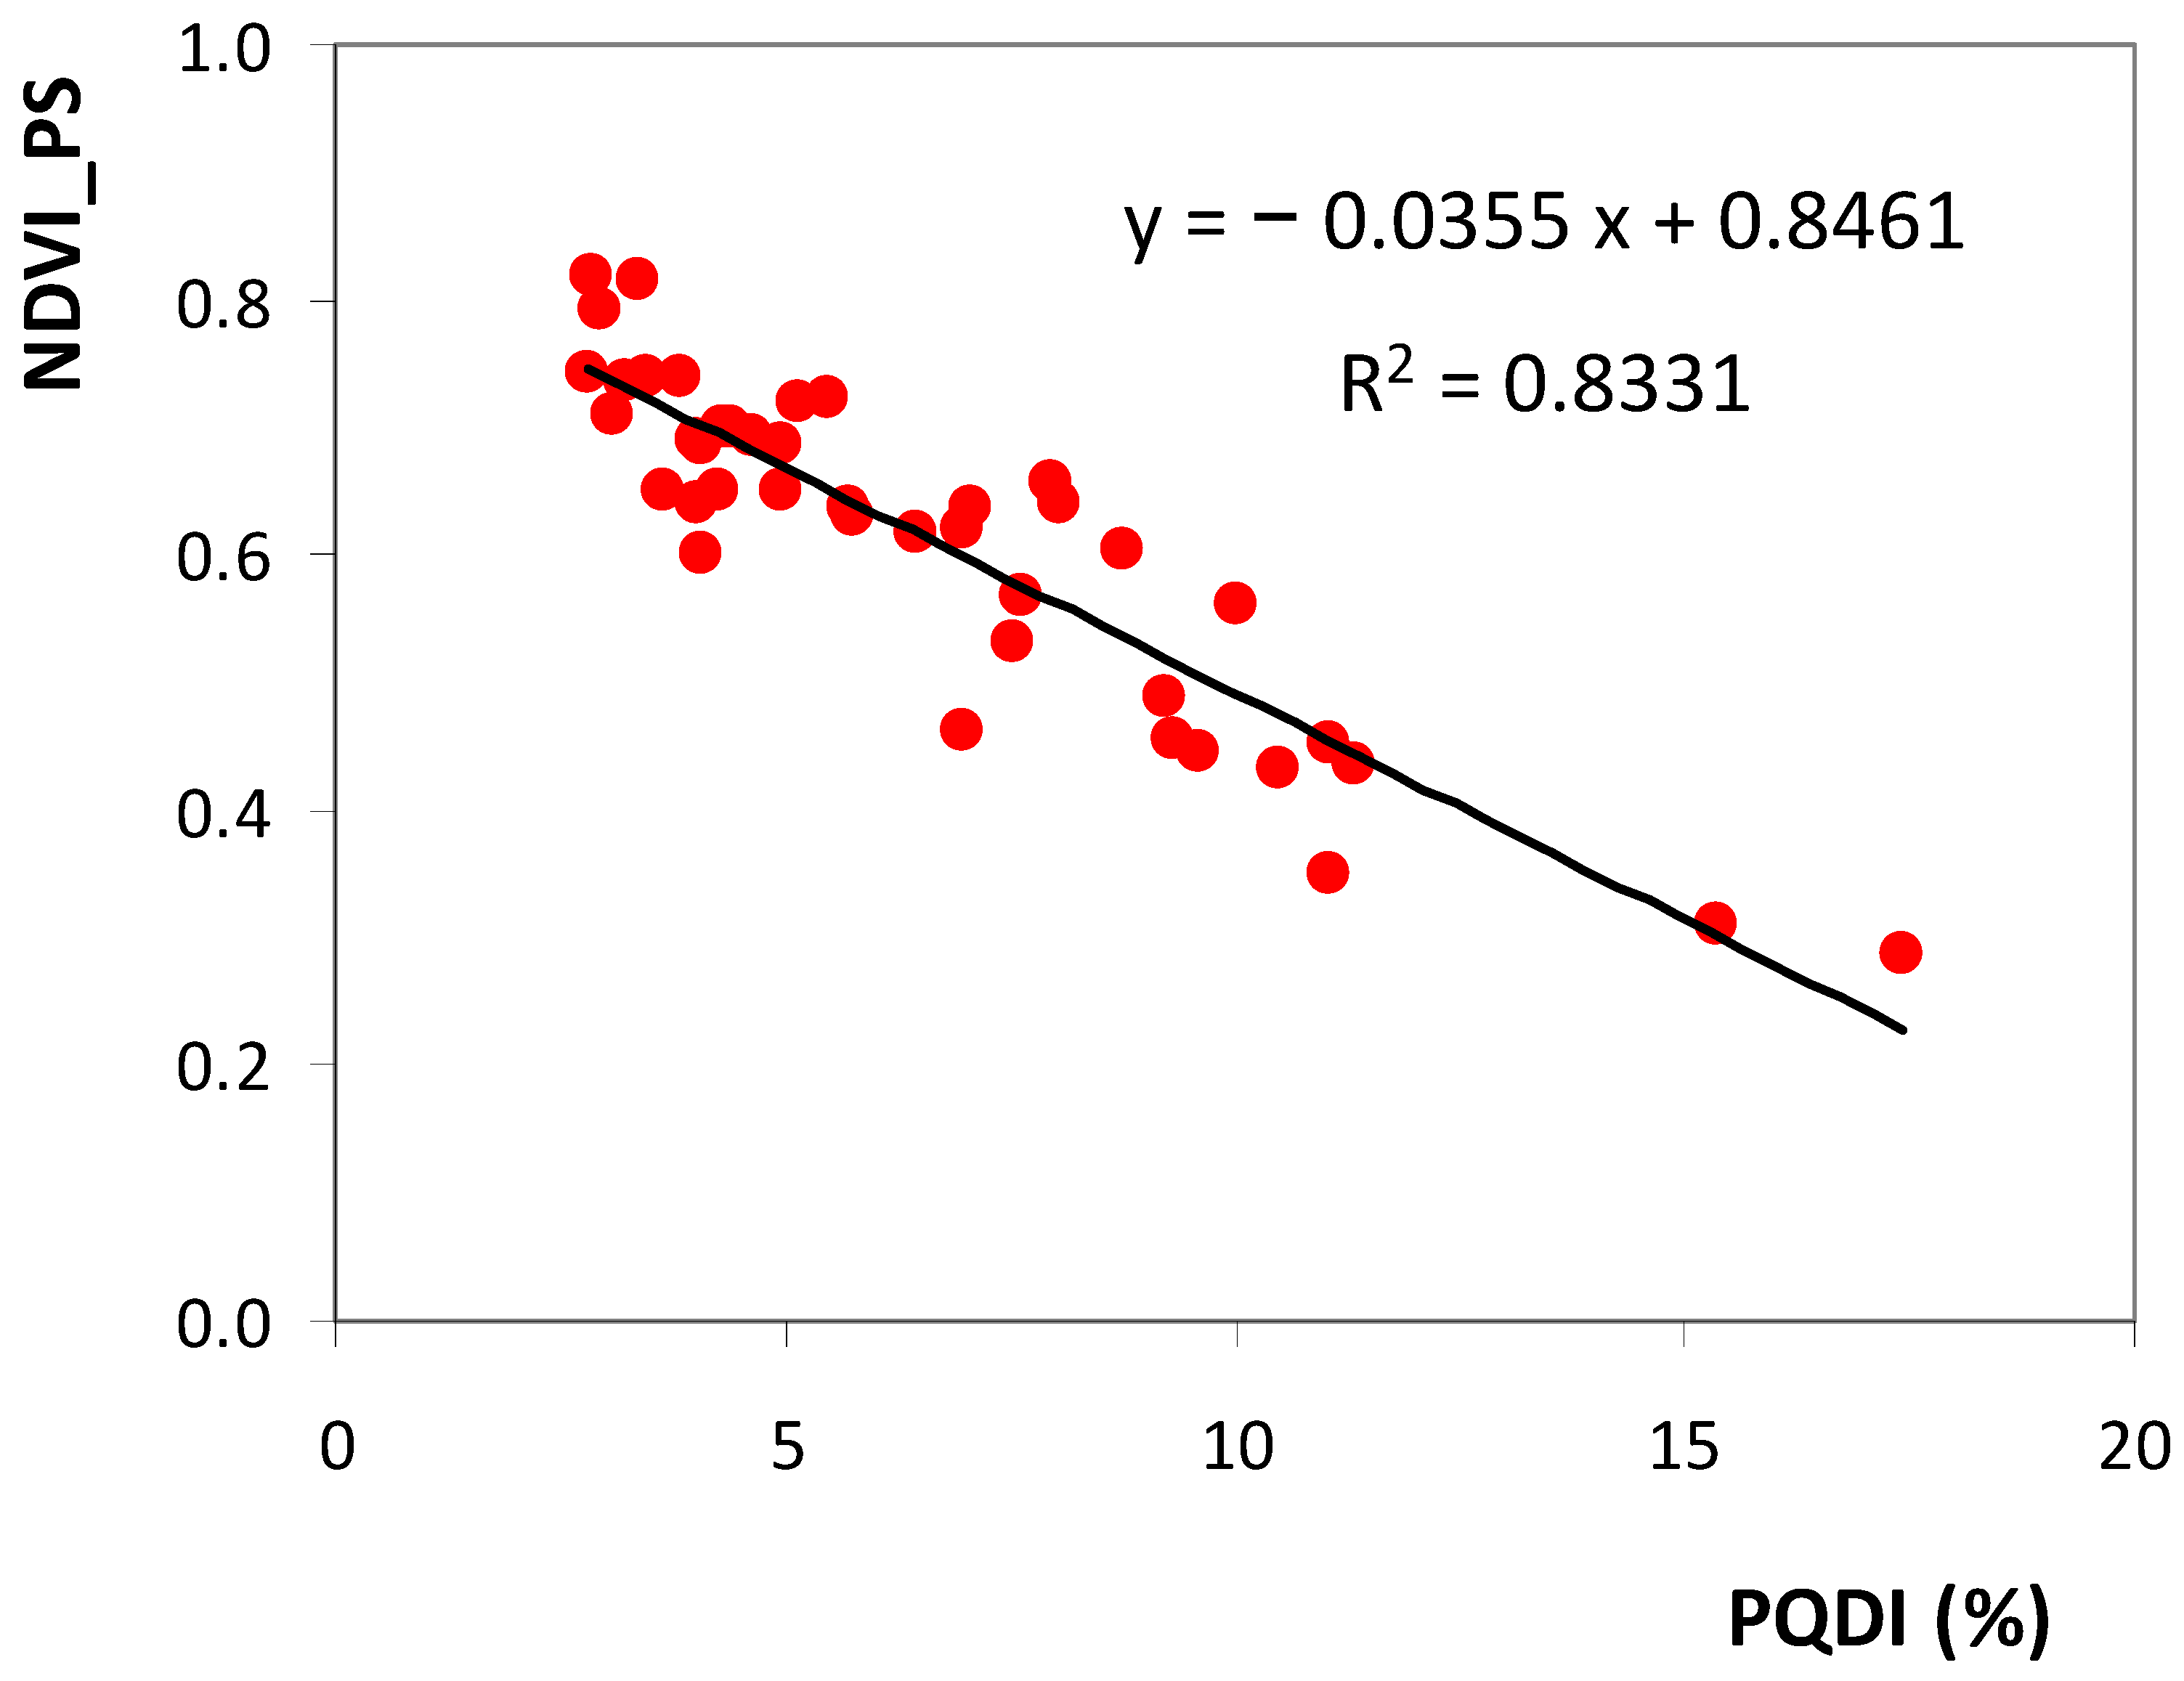
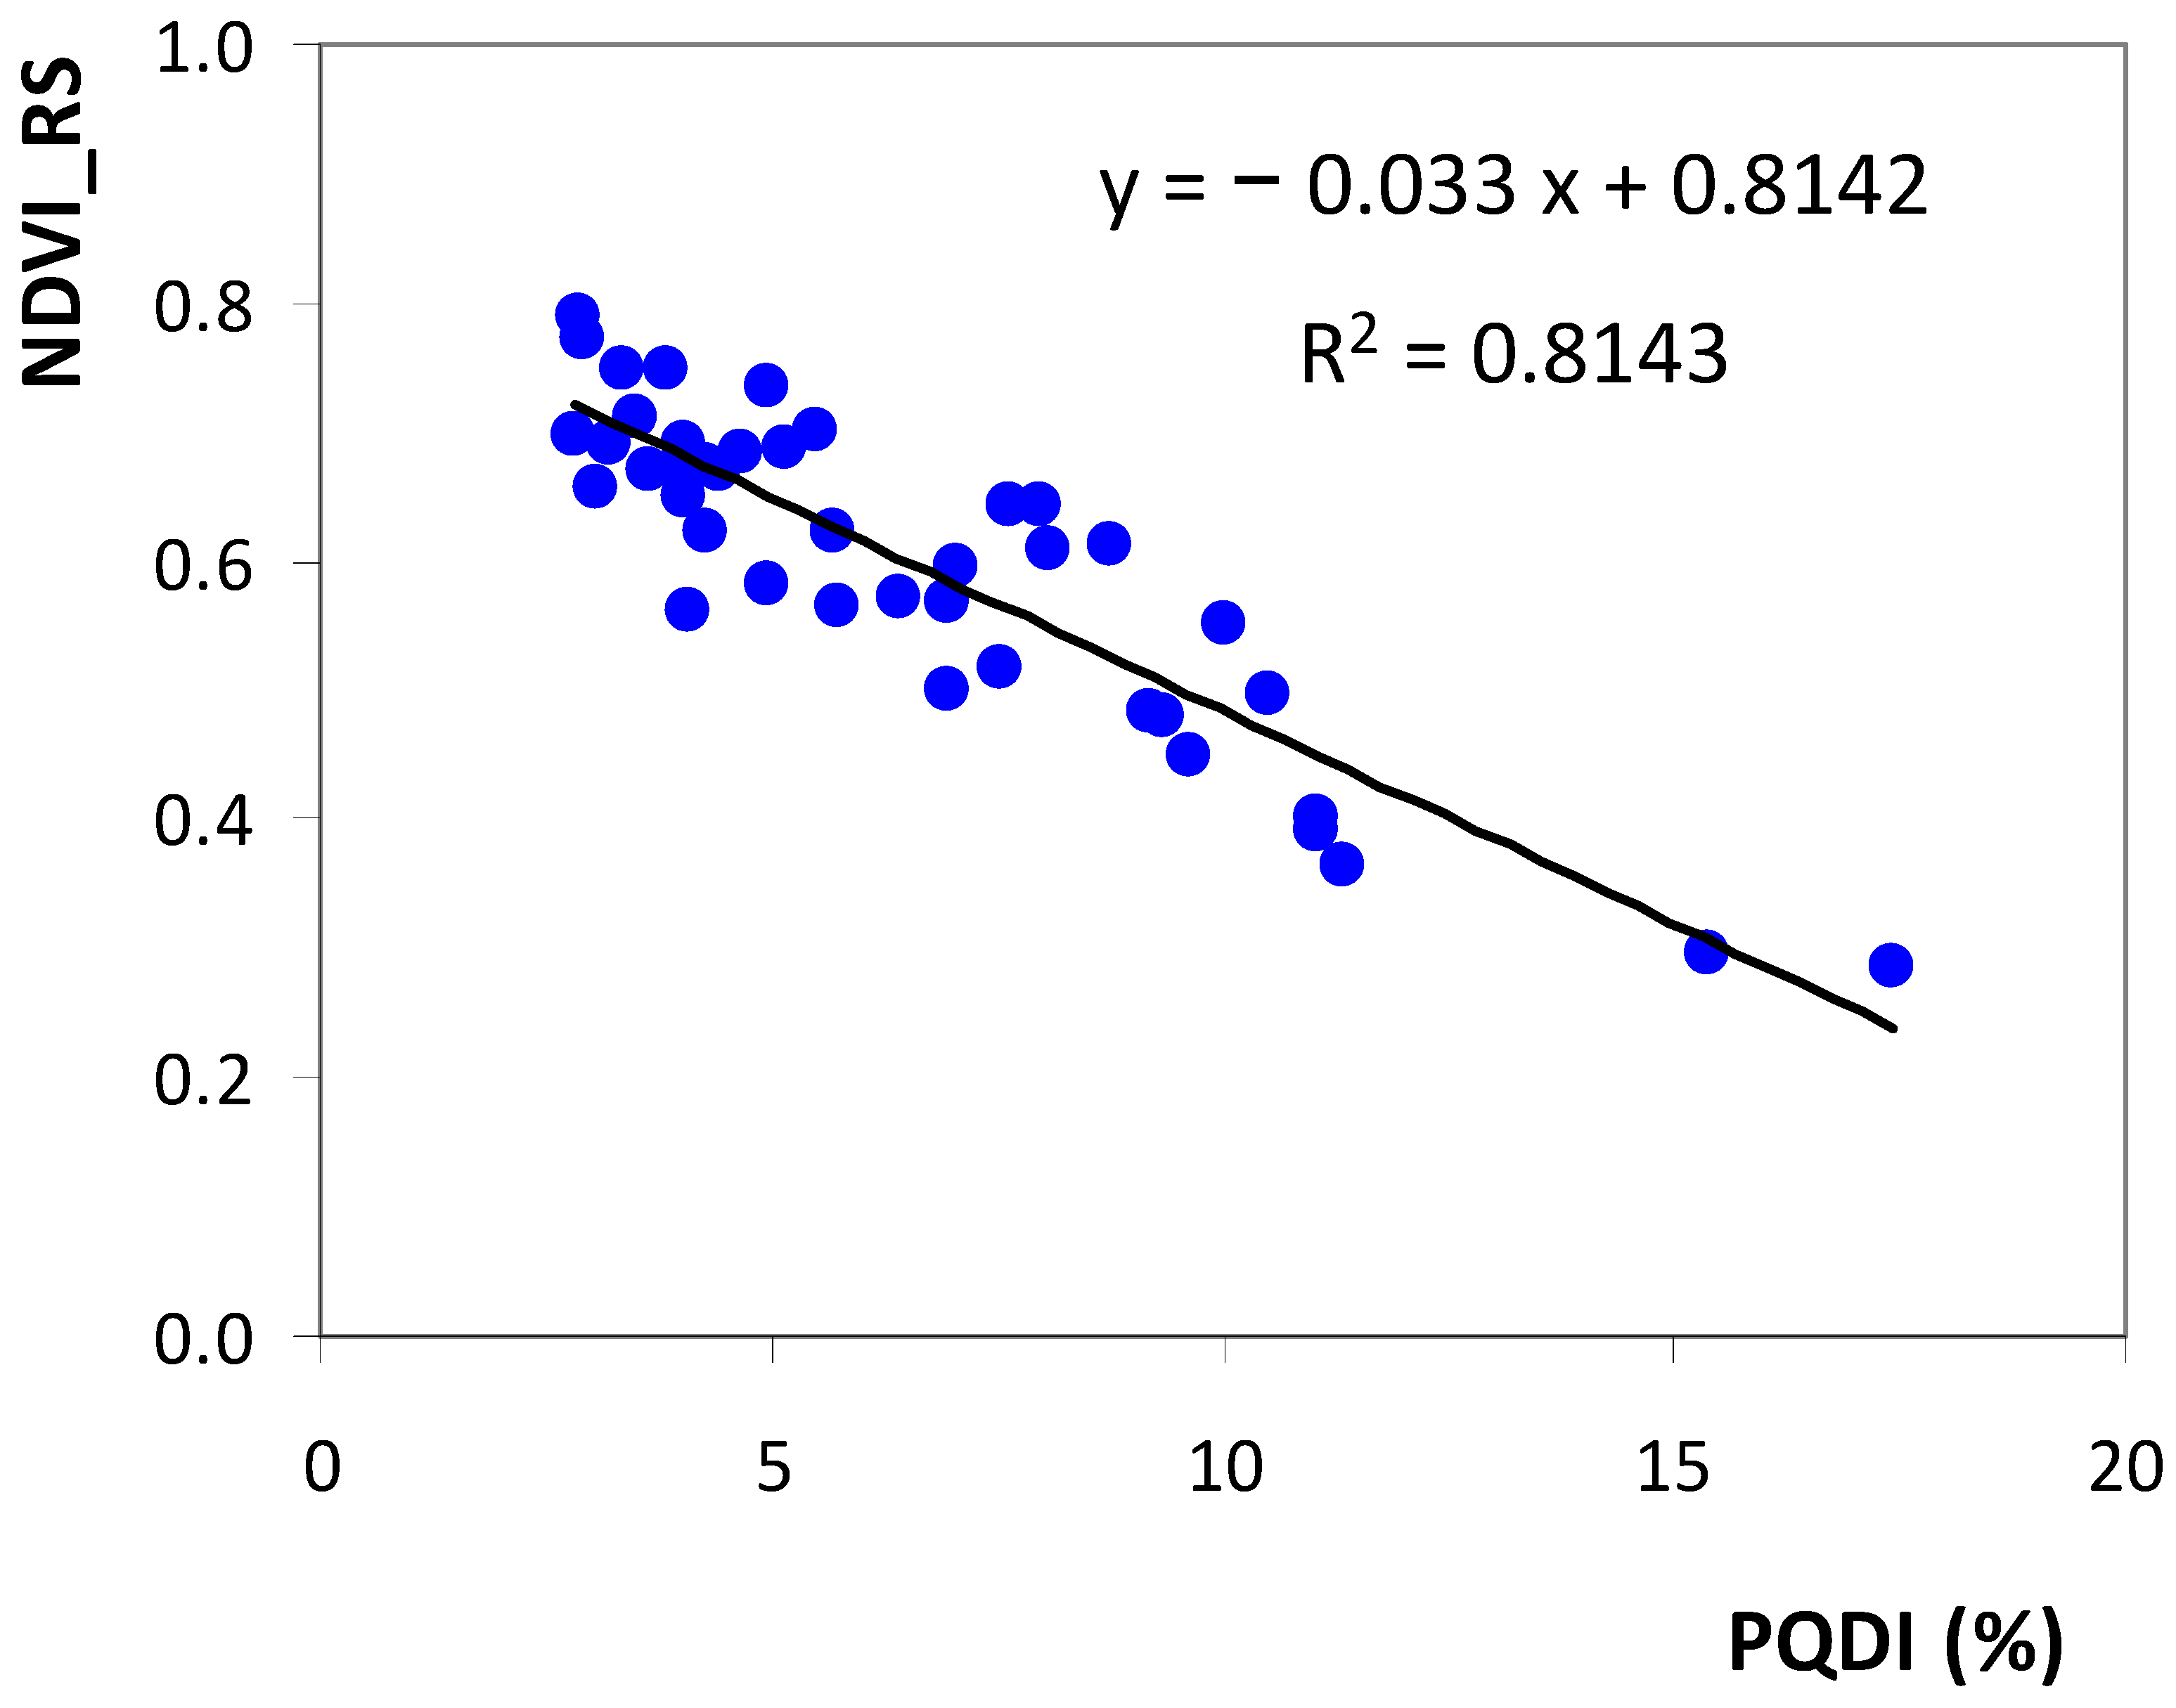
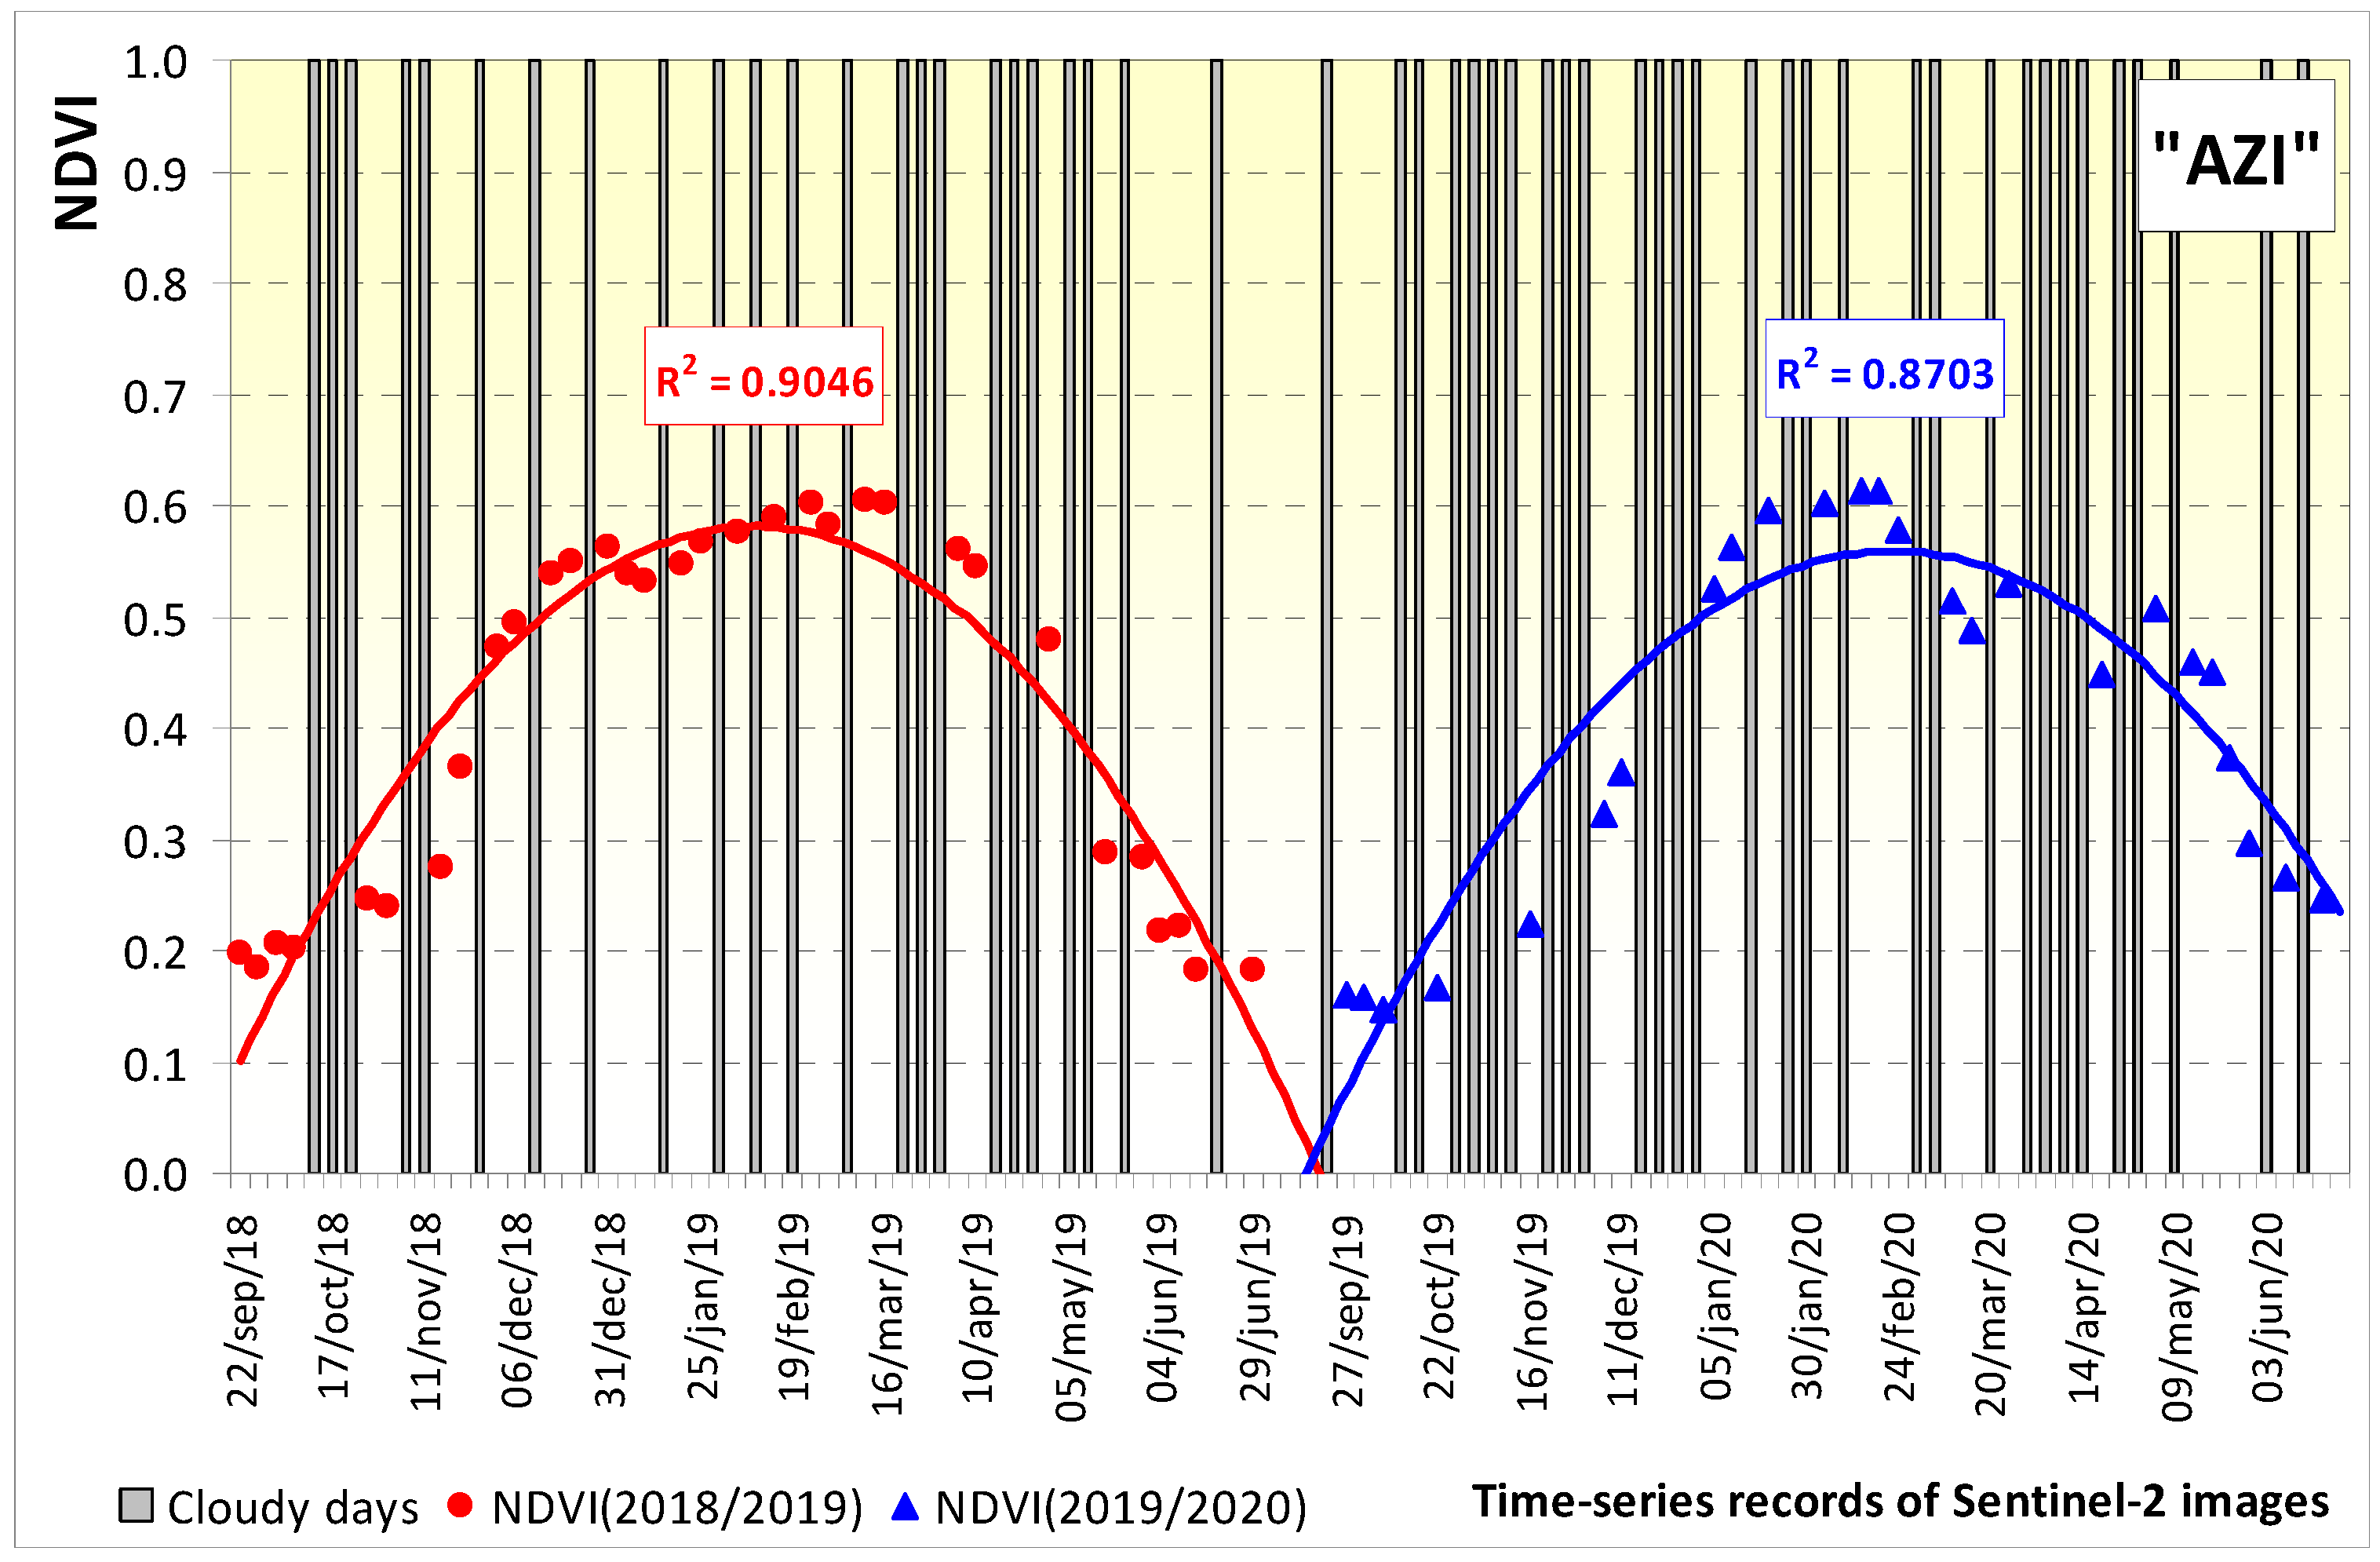
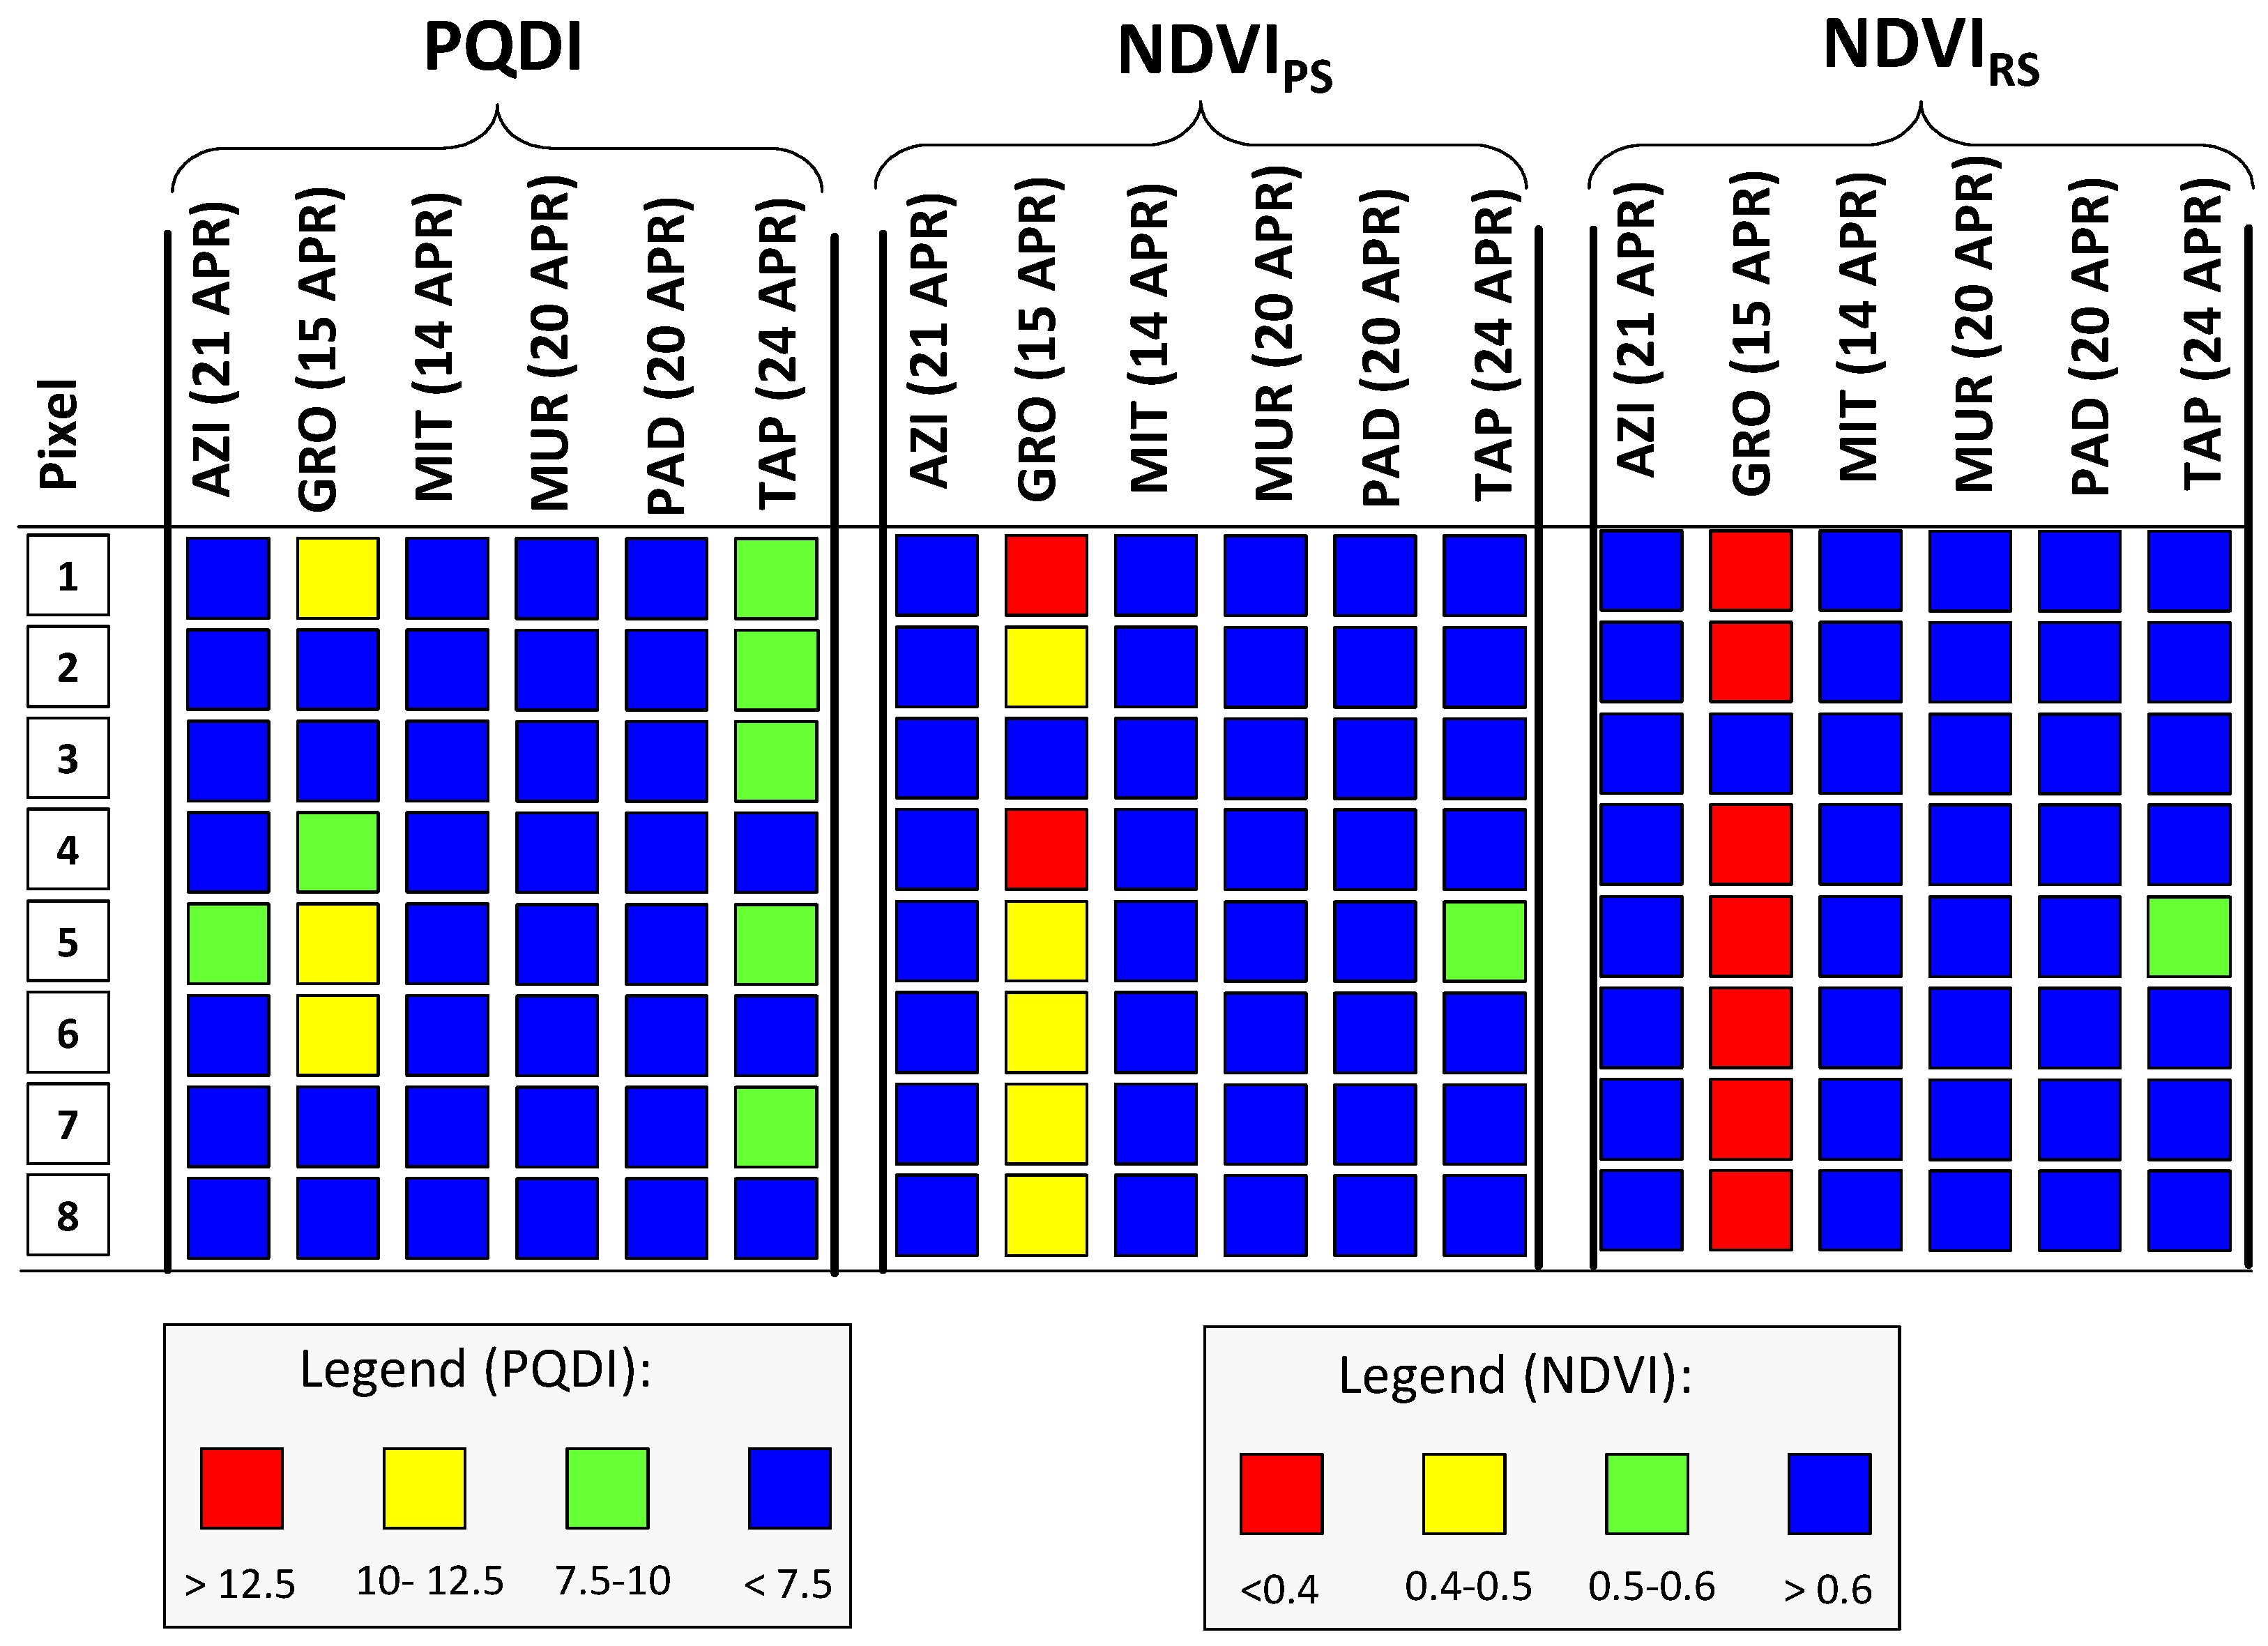
The statistical analysis of the results included a descriptive analysis with a calculation of the mean and standard deviation (SD) of each dataset (NDVIRS, NDVIPS, PMC, CP, and NDF). Means of NDVIRS time-series data in each field were organized graphically to show the temporal evolution in the pasture vegetative cycles of 2018/2019 and 2019/2020. As mentioned above, only the images without clouds were used. Mean of CP, NDF, NDVIRS, NDVIPS, and PQDI in each sampling area of all fields over the pasture vegetative cycles (depending on the day of the year, DOY) were also organized graphically to show the temporal patterns. PQDI and NDVI spatial variability was organized in map format with four classes: PQDI < 7.5, 7.5–10.0, 10.0–12.5 and > 12.5%; NDVI < 0.4; 0.4–0.5, 0.5–0.6, and >0.6.
The inferential treatment of these results was performed using MSTAT-C software (MSTAT-C, Michigan State University, MI, USA) with a significance level of 95% (p < 0.05) and consisted of a regression analysis between NDVIRS and NDVIPS, between NDVIRS and PQDI and between NDVIPS and PQDI. A flowchart of the methodological steps used in this study is shown in Figure 8.

3. Results

NDVI time-series records obtained in cloudless days in two consecutive years (2018/2019 and 2019/2020) at the six experimental fields are presented (Figure 9, Figure 10, Figure 11, Figure 12, Figure 13 and Figure 14). Each graph shows the coefficient of determination (R2) of the second-degree polynomial equation that best fits each NDVI time-series pattern. Between September of a year and June of the following year, NDVI and, consequently, pasture vegetative vigor tend to increase during early autumnal phase as the pasture emerges and increases in density, stabilizes in an intermediate winter phase, then reaches a peak in the spring when the plants are flowering, and then decreases as the plants reach the end of their annual cycle.
The number of Sentinel-2 images of the six experimental fields during autumn, winter, and spring of 2018/2019 and 2019/2020 without cloud effect (cloudless days) amount to approximately only half (51.0 ± 6.2%) of the total number of satellite images available in the same period (Table 1). These cloudless days are distributed evenly over the three seasons under consideration (autumn, winter, and spring).
Date of pasture sampling, mean ± standard deviation of pasture parameters (PMC, CP and NDF), and NDVI obtained by proximal sensing, date of remote sensing reading, NDVI obtained by remote sensing, and the temporal gap between proximal measurements and remote NDVI reading are presented in Table 2 and Table 3, for 2019 and 2020, respectively. When the temporal gap between proximal sensing and Sentinel-2 image records without cloud interference exceeded ten days (two dates of 2019, one on 2 April —“AZI” field, another on 15 April—“GRO” field), the data were discarded in the subsequent regression analysis between NDVIRS and NDVIPS and between NDVIRS and PQDI.
In the set of forty-two sampling moments (6 experimental fields × 7 dates), mean PMC ranged between 53.7 and 87.6%, with an average CV of 6.4% (variation between 1.7 and 17.5%); mean CP ranged between 6.9 and 19.0%, with an average CV of 18.9% (variation between 4.0 and 39.8%); mean NDF ranged between 38.4 and 66.2%, with an average CV of 9.5% (variation between 3.3 and 20.7%); mean NDVI measured by RS ranged between 0.287 and 0.788, with an average CV of 8.3% (variation between 2.3 and 26.9%); and mean NDVI measured by PS ranged between 0.288 and 0.820, with an average CV of 8.9% (variation between 2.1 and 18.8%).
There is an important spatial (within each experimental field and between fields), seasonal (throughout the cycle), and inter-annual variability in the different parameters analyzed. Figure 15 shows an example of this PQDI and NDVI (PS and RS) spatial variability, within each experimental field (in the 8 pixels of each experimental field) in April 2020. In the set of three hundred and thirty-six samples (6 experimental fields × 8 pixels × 7 dates), PS presented a similarity of 76.2% (256 pixels in 336) with PQDI, RS presented a similarity of 74.1% (249 pixels in 336) with PQDI, and PS presented a similarity of 86.9% (292 pixels in 336) with RS. Figure 16 shows the evolution of the same parameters (PQDI and NDVI) over time (on the 7 sampling dates, 3 in 2019 and 4 in 2020), taking as an example two experimental fields: “MIT” (Figure 16a) and “GRO” (Figure 16b).
The general trend of average values shows an inverse pattern in the evolution of CP in comparison with NDF (Figure 17) and of NDVI (obtained by proximal or remote sensing) in comparison with PQDI (Figure 18). In both years under review, around DOY 90 (end of March), there is a sharp drop in CP and NDVI and an inverse behavior (also sharp rise) in NDF and PQDI. The regression analysis between NDVI obtained by proximal sensing (NDVIPS) and NDVI obtained by remote sensing (NDVIRS) showed a coefficient of determination very close to the unit (R2 = 0.93; Figure 19). The regression analysis between NDVIPS and PQDI and between NDVIRS and PQDI showed that both parameters (NDVIPS and NDVIRS) are excellent indicators of the evolution of the pasture quality degradation (with R2 of, respectively, 0.83, Figure 20, and 0.82, Figure 21).

4. Discussion

4.1. Evolution of Pasture Quality Parameter Patterns throughout the Vegetative Cycle

Dryland pastures in the Mediterranean region have a vegetative cycle with marked seasonal and inter-annual variability, depending on the influence of air temperature and precipitation distribution [1,4,19]. Variability occurs not only in terms of available biomass, but also in terms of the quality of that biomass [4], which consequently affects the availability and quality of food for animals under extensive grazing. The pasture cycle begins with the emergence of plants, usually between October and November, after the first autumn rains. In years when the autumn is dry, emergence can only happen in the beginning of winter, when the drop in air temperature to 0–10 °C range tends to induce a period of vegetative dormancy, resulting in a shortage of grass for the animals, forcing the continued supplementation with concentrated feed [7]. In the spring period (March–June), rising temperatures and the presence of moisture in the soil tend to lead to high pasture yields, which justifies the dynamic grazing management at the level, for example, of the number of days of grazing and/or the number of animals per unit of area [7].
In our study, the accumulated rainfall increased 24% in Beja district, 49% in Évora district, and 51% in Portalegre district from 2018/2019 (relatively dry year) to 2019/2020 (a year that can be considered normal based on the historical record). On the other hand, there was a significantly higher accumulated rainfall in the most northern district of this study (Portalegre) compared to the southern and central districts (Beja and Évora, respectively), on average +72% of accumulated rainfall in 2018/2019 and +91% in 2019/2020. Nevertheless, the distribution of rainfall was relatively balanced across the three productive seasons (autumn, winter, and spring), in both agricultural years and in the three districts of the region.
The pasture quality reference indicators (PMC and CP; Table 2) displayed a decreasing trend in the set of three evaluation moments carried out in 2019 (January or February, March or April, and April or May) while the indicator of pasture quality degradation (NDF) tended to increase, which is in agreement with other works [4,19]. These trends were particularly evident in the fields located further south (“AZI” and “GRO”).
In 2020 (January, March, April, and May or June), the quality reference indicators (PMC and CP, Table 3) both showed a tendency to decrease from the third to the fourth evaluation moment (between April and May or June), presenting the NDF a symmetrical behavior. The highest amount of rainfall accumulated in spring 2020, compared to spring 2019, may have contributed to the maintenance of the pasture quality over time [16]. For example, accumulated spring 674 rainfall increased 49% between the two periods in Portalegre, the northern district of 675 Alentejo region, 86% in Évora, the central district, and 118% in Beja, the southern district. These results show that the influences of precipitation and temperature on grassland is relatively complex as they can change through the growing season, vary among different grasslands, and interact with each other [1].
Our results (Table 2 and Table 3) also highlight an aspect observed in other studies related to biodiverse pastures [16,20]: the important spatial variability of pasture quality parameters, especially CP (average CV of 18.9%). This behavior reflects the variability resulting from the heterogeneous development of the different plant species that are part of the biodiverse pasture [4,16,20].
If, on the one hand, this spatial variability is the starting point for a precision agriculture strategy [21], on the other hand, the variability that our results reveal, both spatially and temporally, contextualizes the difficulty that agricultural managers have in terms of management decisions, for example, regarding grazing, fertilization, and soil correction, or animal feed supplementation [4]. It is, therefore, essential to evaluate quick tools for monitoring spatial and temporal vegetation changes over several growing seasons, combined with in situ field validation [19].

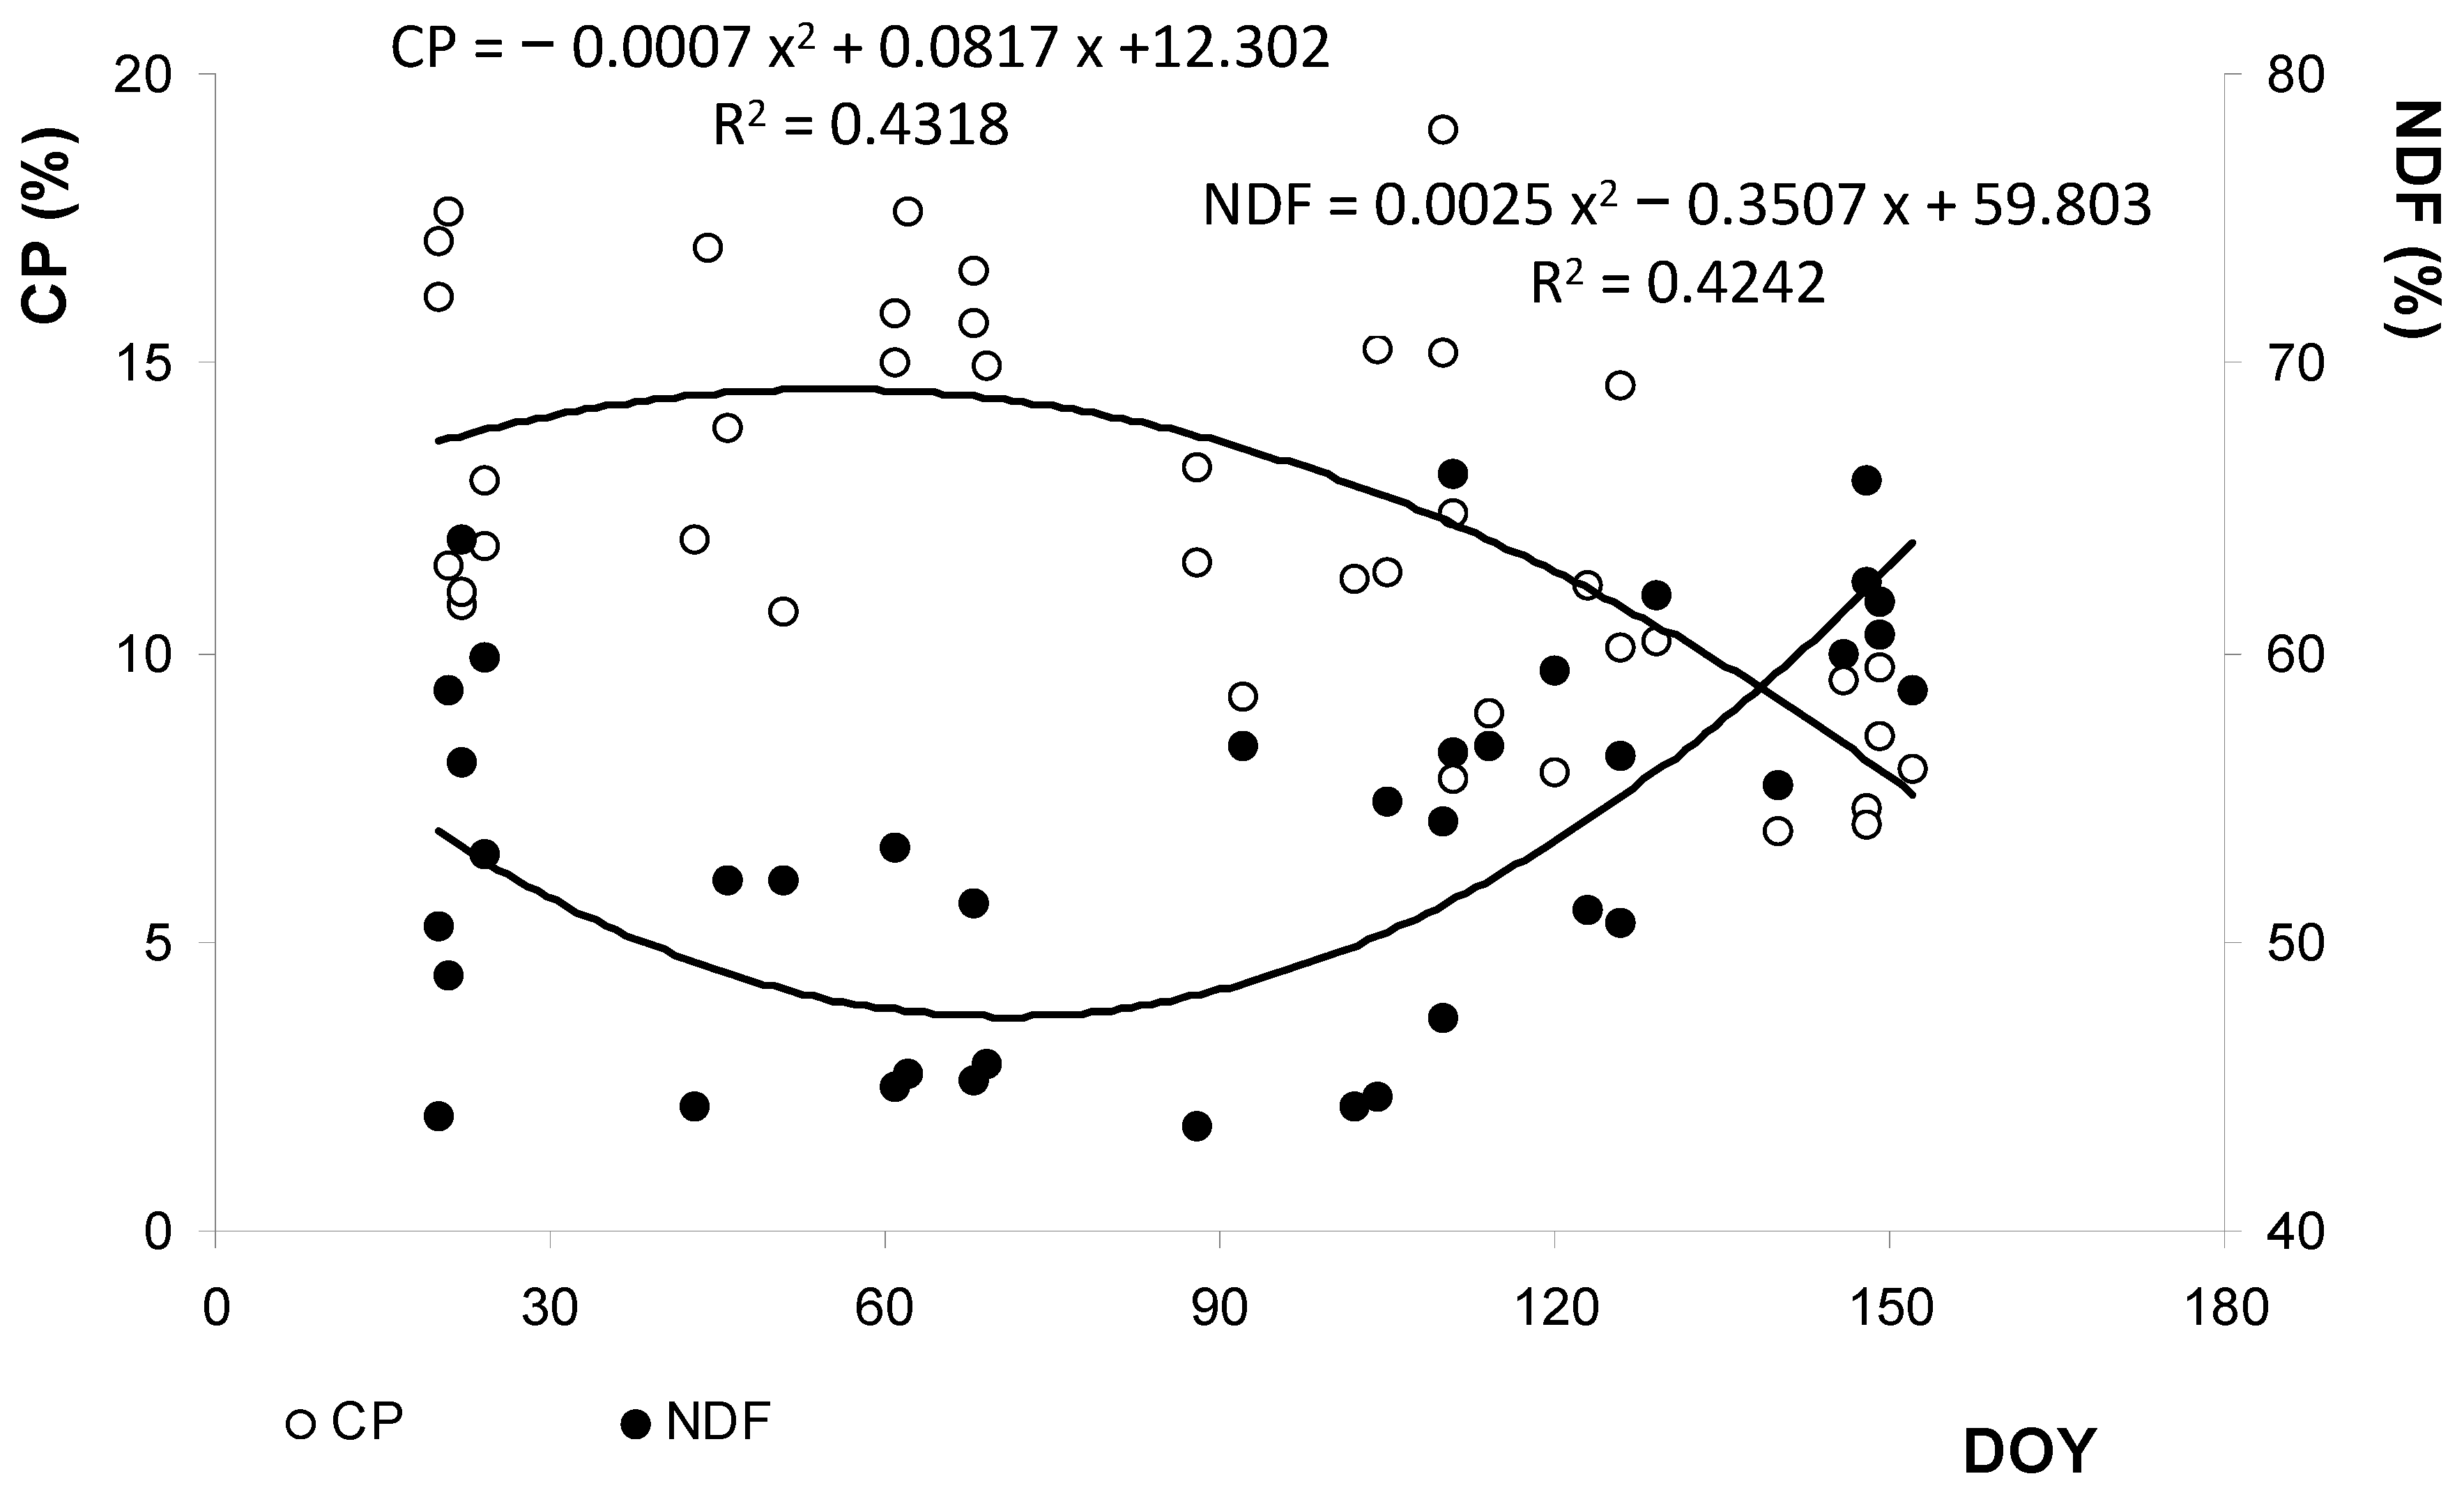
4.2. Correlation between Pasture Quality Parameters and NDVI Obtained from Proximal and Remote Sensing

Despite the high percentage of days with cloud influence that occurred throughout the pasture vegetative cycle (51.0 ± 6.2%, between autumn and spring), NDVI time-series obtained from satellite in each of the six experimental fields between September of a year (2018 and 2019) and June of the following year (2019 and 2020, respectively) systematically and consistently displayed the following pattern (Figure 9, Figure 10, Figure 11, Figure 12, Figure 13 and Figure 14): NDVI tends to increase during the early autumn phase (growth of pasture), stabilizes in an intermediate winter stage, and, after reaching a peak in early spring, decreases as plants reach the end of their annual cycle [6]. This general pattern was represented in simplified form by a polynomial equation in Figure 9, Figure 10, Figure 11, Figure 12, Figure 13 and Figure 14 with excellent coefficients of determination in the two years of study and in the six experimental fields (0.80–0.95). Since most nitrogen in plant tissue is contained in chlorophyll-protein complexes [22], the well established relationship between leaf chlorophyll pigments and nitrogen (and, therefore, crude protein) helps to explain the behavior of NDVI as robust predictor for spatial distribution of pasture vegetative vigor [23].
Cloud influence can lead to relatively long periods without information availability. In this specific study, there were several gaps of 3–4 weeks without cloud-free information due to highly frequent cloud cover. The most extreme case occurred in the experimental field “GRO” between March and April 2019, with about a month and a half without cloud-free information. These results highlight the interest in complementary monitoring systems, for example, by drones [10,24]. Another constraint for RS (by satellite or drone) of permanent grasslands in open woodlands such as Dehesa (in Spain) and Montado (in Portugal) is the presence of scattered trees [4]. Cork oak and Holm oak canopies, with variable spatial density, prevent remote access to pasture in the under-covered areas. Several studies have shown that these are also important areas of pasture quality and animal welfare [7]. The spatial resolution of Sentinel-2 requires open pasture areas where there is no influence of trees on the pixel reflectance [4] or, alternatively, justifies the interest in fusion of multi-sensor data at a medium-to-high spatio-temporal resolution to address this issue [14]. Some studies have been published based on expeditious proximal sensors [16,22].
In this study, the optical sensor “OptRx” was used in the sampling areas (“10 m × 10 m” of Sentinel-2 pixel) of all experimental fields, immediately before cutting the composite pasture sample for laboratory reference determinations. This is therefore a real-time NDVI (and therefore vegetative vigor) reading, based on around 300 measurements per sampling area, which is an excellent representation of the pasture status. The significant and strong coefficient of determination (R2 = 0.93) of the regression analysis between NDVIPS and NDVIRS shows the close relationship between these indexes, surpassing the R2 obtained in an earlier paper on this topic referring only to an experimental field (R2= 0.81; [16]). In comparison to this previous work, not only was the experiment expanded to six experimental fields with different biodiverse pastures, but also the method now contemplates PS monitoring of the entire Sentinel-2 pixel sampling area and not just the small areas where, later, the cutting of the pasture was carried out. In this way, the so-called “scale effect” between RS and PS due to the strong spatial and temporal heterogeneity characteristics of biodiverse pastures [8], reported in others works [16,25], was avoided.
The main purpose of this study was to evaluate the potential of two complementary tools (satellite images, Sentinel-2 and proximal optical sensor, OptRx) for the calculation of the NDVI, to monitor in a timely manner indicators of pasture quality (PMC, CP, and NDF). To simplify and, simultaneously, to search for a more integrative indicator, in this work, a pasture quality degradation index (PQDI, in %) was calculated based on the above mentioned three parameters (Equation (2)). Higher values of this index reveal higher levels of fiber (NDF) and lower levels of PMC and CP, which tend to occur as the vegetative cycle of the pasture advances [4,6]. The regression analysis between NDVIPS and PQDI and between NDVIRS and PQDI showed that both parameters (NDVIPS and NDVIRS) are equivalent indicators of the evolution of the pasture quality degradation (with R2 of, respectively, 0.83, Figure 20, and 0.82, Figure 21). The difference between both tools (with a slight advantage of PS over RS) can be explained by the fact that there is a temporal gap between the date of RS capture and the date of field biomass collection. These determination coefficients are similar to those obtained for pasture quality indicators (CP and NDF) by Pullanagari et al. [26] from proximal sensors (R2 of 0.80) and higher than those recorded from satellite images for example by Lugassi et al. [19] or Raab et al. [23] (R2 about 0.70), Fernández-Habas et al. [4] (R2 about 0.65), or Zhao et al. [27] (R2 about 0.60). According to Fava et al. [28] and Fernández-Habas et al. [4] heterogeneous pastures with multiple functional groups and different phenological stages might have contradictory effects on the relationship between pasture quality variables and reflectance, leading to a wide variability of spectral responses.
Nonetheless, these results are more consistent and representative than those obtained by Serrano et al. [16] in a preliminary study, gaining particular robustness not only because of the similarity between PS and RS, but also because they include the spatial variability characteristic of this ecosystem (six experimental fields of biodiverse pastures) and seasonality and inter-annual variability (seven moments of field validation, distributed over two vegetative cycles of the pasture). The above application of a wide range of predictive tools and forecasting models for support to decision making are of particular interest, since farmers in every region may follow different management strategies in terms of soil management, pasture intensification, or precision grazing. This diversification of management practices is a challenge that needs to be addressed in the coming years and largely determine the availability of ecosystem services [5]. Such information assists the efficient utilization of pastures by avoiding overgrazing, providing guidance with regards to food supplement decisions, or alerting farmers to wastage during periods of surplus pasture availability [29].
Given the small-scale coverage of traditional ground-based methods of grassland monitoring, satellite remote sensing approaches are likely to be a significant contributor to future operational studies [2]. This research may involve not only other indices (for example, the Normalized Difference Water Index, NDWI [11]), but also other parameters considered relevant in assessing the quality of the pasture (for example, its floristic composition). These pastures and grasslands are rich in biodiversity [7], which is recognized as the foundation for ecosystem functioning [5]. In the context of global food security and to avoid food shortages, given the limited number of studies that have been done on grassland and pasture quality assessment using RS approach [2], it will also be interesting to extend this study to longer periods of time, since the models can capture the pasture response to climate change [25], evaluate their capacity to sustain livestock production and their associated ecosystem services [4], and help agricultural managers to respond to the challenges of economic and environmental sustainability.
Grazed pastures are recognized as complex and very spatio-temporal dynamic systems [30], composed of a mosaic of different landscape features [23] in close interaction with animals which graze them selectively in time and space [31]. This complexity also demands further research in development of model-data fusion tools [29,32] and present particular challenges for sensor applications [30], preferably integrating the potential complementarity of remote and proximal sensing. The development of systems with complementary sensors is seen as a very promising research area, and one that will help to overcome the limitations of single sensors and provide better information about grassland composition, yield and quality [30].
Although the application of NDVI as an indicator of crop health monitoring is becoming very common, there are very few published studies on its application in the management of extensive animal grazing. In summary, it is important to highlight in this study that dryland pastures of the Mediterranean Montado ecosystem are the basis of extensive livestock production. Soil limitations (shallow, acidic, and of low fertility) associated with seasonality and climatic irregularity lead to low pasture productivity, which requires animal feed supplementation over several months (in some years more than 6 months) [7]. Therefore, concentrate feed represents a very important percentage of the cost of animal production in the region.
The spatial and temporal variability maps (Figure 15 and Figure 16) of the evaluation parameters (PQDI and NDVI, obtained by PS and RS), show, in April 2020 (Figure 15), a reduced variability within each experimental field and between sites, with NDVI in general (except in “GRO” and “TAP” fields) above 0.6 (blue on maps), which reflect CP contents above the maintenance needs of the animals [16]. Additionally, there is a large degree of similarity between sensor measurements (NDVI) and laboratory determinations (PQDI). This high similarity index is also visible in Figure 16. Monitoring of these parameters during winter and spring 2019 and 2020 reveals the expected pattern of temporal evolution of pasture quality degradation during Spring. This pattern occurred earlier in the “GRO” field (usually in April; Figure 16b); field subject to higher temperatures and less precipitation; Figure 4 and Figure 5) than in the “MIT” field (usually late May; Figure 16a). These results show that, in addition to the climatic effect of temperature and precipitation [33,34,35], grazing can have a significant effect on the evolution of pasture quality [35]. The possibility of small service providers using practically free satellite images, that can go from the plot level (preferably above 0.5 ha) to the farm level (several hundred hectares), or, even, to the global level, associated with a relatively low-cost proximal optical sensor, to support farmers’ management decisions (for example, for each differentiated area, to understand the critical moment at which animal feed supplementation should be introduced) could be very interesting in terms of resource optimization, with economic and environmental impact on this ecosystem [16].

5. Conclusions

This study contributes to increasing the body of knowledge related to the potential application of Sentinel-2 imagery to monitor and predict the quality of permanent grasslands across large areas in Mediterranean open woodlands. The results show a significant correlation between pasture quality degradation index (PQDI) and NDVI measured by satellite (R2 = 0.82) and measured by proximal optical sensor (R2 = 0.83). The optical proximal sensor “OptRx” proved great complementarity and the capacity to solve the constraints of RS resulting from persistent cloud cover and the presence of tree canopy.
Grasslands play a vital role in regulating the global carbon cycle, as well as supporting plant biodiversity and livestock production in Montado ecosystem. The real-time decision making that is made possible by the assessment of pasture quality ensures the resilience of these extensive systems, the estimation and adjustment of stocking rates, establishment of a sound scheduling of grazing or mowing, and the supplementary feeding or grassland improvements with legumes mixes, soil fertilization, or pH correction.
Despite the complexity of grassland ecosystems, characterized by mixed species composition and strong spatial and temporal variability, this work opens perspectives to explore new solutions in the field of Precision Agriculture technologies based on spectral reflectance to respond to the challenges of economic and environmental sustainability of extensive livestock production systems.

Author Contributions

Conceptualization, J.S., R.T. and T.D.; methodology, J.S., L.P., T.M., R.T. and T.D.; validation, J.S., L.P. and T.D.; formal analysis, J.S., S.S., L.P., J.M.d.S. and T.M.; investigation, J.S., S.S., J.M.d.S., R.T. and T.D.; resources, J.S. and T.D.; writing—original draft preparation, J.S. and S.S.; writing—review and editing, J.S., S.S., J.M.d.S., T.M., R.T. and T.D.; supervision, J.S., J.M.d.S., R.T. and T.D.; project administration, J.S. and T.D.; funding acquisition, J.S. and T.D. All authors have read and agreed to the published version of the manuscript.

Funding

This work was funded by National Funds through FCT (Foundation for Science and Technology) under the Project UIDB/05183/2020, Project DSAIPA/DS/0074/2019 (T. Morais) and CEECIND/00365/2018 (R. Teixeira). This work was also supported by FCT/MCTES (PIDDAC) through project LARSyS—FCT Pluriannual funding 2020–2023 (UIDB/50009/2020) and by the projects PDR2020−101-030693 and PDR2020−101-031244 (“Programa 1.0.1-Grupos Operacionais”).

Institutional Review Board Statement

Not applicable.

Informed Consent Statement

Not applicable.

Data Availability Statement

Not applicable.

Acknowledgments

Not applicable.

Conflicts of Interest

The authors declare no conflict of interest.

References

  1. Reinermann, S.; Asam, S.; Kuenzer, C. Remote sensing of grassland production and management—A review. Remote Sens. 2020, 12, 1949. [Google Scholar] [CrossRef]
  2. Ali, I.; Cawkwell, F.; Dwyer, E.; Barret, B.; Green, S. Satellite remote sensing of grasslands: From observation to management—A review. J. Plant Ecol. 2016, 9, 649–671. [Google Scholar] [CrossRef] [Green Version]
  3. Hardy, T.; Kooistra, L.; Franceschini, M.D.; Richter, S.; Vonk, E.; Eertwegh, G.; Deijl, D. Sen2Grass: A cloud-based solution to generate field-specific grassland information derived from Sentinel-2 imagery. AgriEngineering 2021, 3, 118–137. [Google Scholar] [CrossRef]
  4. Fernández-Habas, J.; Moreno, A.M.G.; Hidalgo-Fernández, M.A.T.; Leal-Murillo, J.R.; Oar, B.A.; Gámez-Giráldez, P.J.; González-Dugo, M.P.; Fernández-Rebollo, P. Investigating the potential of Sentinel-2 configuration to predict the quality of Mediterranean permanent grasslands in open woodlands. Sci. Total Environ. 2021, 791, 148101. [Google Scholar] [CrossRef] [PubMed]
  5. Stumpf, F.; Schneider, M.K.; Keller, A.; Mayr, A.; Rentschler, T.; Meuli, R.G.; Schaepman, M.; Liebisch, F. Spatial monitoring of grassland management using multi-temporal satellite imagery. Ecol. Indic. 2020, 113, 106201. [Google Scholar] [CrossRef]
  6. Efe Serrano, J. Pastures in Alentejo: Technical Basis for Characterization, Grazing and Improvement; Universidade de Évora—ICAM: Évora, Portugal, 2006; pp. 165–178. [Google Scholar]
  7. Serrano, J.; Shahidian, S.; Costa, F.; Carreira, E.; Pereira, A.; Carvalho, M. Can soil pH correction reduce the animal supplementation needs in the critical autumn period in Mediterranean Montado ecosystem? Agronomy 2021, 11, 514. [Google Scholar] [CrossRef]
  8. Lugassi, R.; Chudnovsky, A.; Zaady, E.; Dvash, L.; Goldshleger, N. Spectral slope as an indicator of pasture quality. Remote Sens. 2015, 7, 256–274. [Google Scholar] [CrossRef] [Green Version]
  9. Wijesingha, J.; Astor, T.; Schulze-Brüninghoff, D.; Wengert, M.; Wachendorf, M. Predicting forage quality of grasslands using UAV-borne imaging spectroscopy. Remote Sens. 2020, 12, 126. [Google Scholar] [CrossRef] [Green Version]
  10. Barnetson, J.; Phinn, S.; Scarth, P. Estimating plant pasture biomass and quality from UAV imaging across Queensland’s Rangelands. AgriEngineering 2020, 2, 523–543. [Google Scholar] [CrossRef]
  11. Serrano, J.; Shahidian, S.; Marques da Silva, J. Evaluation of normalized difference water index as a tool for monitoring pasture seasonal and inter-annual variability in a Mediterranean agro-silvo-pastoral system. Water 2019, 11, 62. [Google Scholar] [CrossRef] [Green Version]
  12. Nickmilder, C.; Tedde, A.; Dufrasne, I.; Lessire, F.; Tychon, B.; Curnel, Y.; Bindelle, J.; Soyeurt, H. Development of machine learning models to predict compressed sward height in Walloon pastures based on Sentinel-1, Sentinel-2 and meteorological data using multiple data transformations. Remote Sens. 2021, 13, 408. [Google Scholar] [CrossRef]
  13. Dos Reis, A.A.; Werner, J.P.S.; Silva, B.C.; Figueiredo, G.K.D.A.; Antunes, J.F.G.; Esquerdo, J.C.D.M.; Coutinho, A.C.; Lamparelli, R.A.C.; Rocha, J.V.; Magalhães, P.S.G. Monitoring pasture aboveground biomass and canopy height in an integrated crop–livestock system using textural information from PlanetScope imagery. Remote Sens. 2020, 12, 2534. [Google Scholar] [CrossRef]
  14. Chen, Y.; Guerschman, J.; Shendryk, Y.; Henry, D.; Harrison, M.T. Estimating pasture biomass using Sentinel-2 imagery and machine learning. Remote Sens. 2021, 13, 603. [Google Scholar] [CrossRef]
  15. Clementini, C.; Pomente, A.; Latini, D.; Kanamaru, H.; Vuolo, M.R.; Heureux, A.; Fujisawa, M.; Schiavon, G.; Del Frate, F. Long-term grass biomass estimation of pastures from satellite data. Remote Sens. 2020, 12, 2160. [Google Scholar] [CrossRef]
  16. Serrano, J.; Shahidian, S.; da Silva, J.M. Monitoring seasonal pasture quality degradation in the Mediterranean montado ecosystem: Proximal versus remote sensing. Water 2018, 10, 1422. [Google Scholar] [CrossRef] [Green Version]
  17. AOAC. AOAC Official Methods of Analysis of AOAC International, 18th ed.; AOAC International: Arlington, VA, USA, 2005. [Google Scholar]
  18. Goering, H.K.; Van Soest, P.J. Forage Fibre Analysis (Apparatus Reagents, Procedures and Some Applications); Agriculture Handbook no. 379; USDA-ARS: Albany, NY, USA, 1970. [Google Scholar]
  19. Lugassi, R.; Zaady, E.; Goldshleger, N.; Shoshany, M.; Chudnovsky, A. Spatial and temporal monitoring of pasture ecological quality: Sentinel-2-based estimation of crude protein and neutral detergent fiber contents. Remote Sens. 2019, 11, 799. [Google Scholar] [CrossRef] [Green Version]
  20. Serrano, J.; Peça, J.; Marques da Silva, J.; Shahidian, S. Spatial and temporal stability of soil phosphate concentration and pasture dry matter yield. Precis. Agric. 2011, 12, 214–232. [Google Scholar] [CrossRef]
  21. Serrano, J.; Shahidian, S.; Marques da Silva, J.; Carvalho, M. A holistic approach to the evaluation of the montado ecosystem using proximal sensors. Sensors 2018, 18, 570. [Google Scholar] [CrossRef] [Green Version]
  22. Duranovich, F.N.; Yule, I.J.; Lopez-Villalobos, N.; Shadbolt, N.M.; Draganova, I.; Morris, S.T. Using proximal hyperspectral sensing to predict herbage nutritive value for dairy farming. Agronomy 2020, 10, 1826. [Google Scholar] [CrossRef]
  23. Raab, C.; Riesch, F.; Tonn, B.; Barrett, B.; Meißner, M.; Balkenhol, N.; Isselstein, J. Target-oriented habitat and wildlife management: Estimating forage quantity and quality of semi-natural grasslands with Sentinel-1 and Sentinel-2 data. Remote Sens. Ecol. Con. 2020, 6, 381–398. [Google Scholar] [CrossRef]
  24. Vilar, P.; Morais, T.G.; Rodrigues, N.R.; Gama, I.; Monteiro, M.L.; Domingos, T.; Teixeira, R.F.M. Object-based classification approaches for multitemporal identification and monitoring of pastures in agroforestry regions using multispectral unmanned aerial vehicle products. Remote Sens. 2020, 12, 814. [Google Scholar] [CrossRef] [Green Version]
  25. Zhao, F.; Xu, B.; Yang, X.; Jin, Y.; Li, J.; Xia, L.; Chen, S.; Ma, H. Remote sensing estimates of grassland aboveground biomass based on MODIS net primary productivity (NPP): A case study in the Xilingol grassland of Northern China. Remote Sens. 2014, 6, 5368–5386. [Google Scholar] [CrossRef] [Green Version]
  26. Pullanagari, R.R.; Yule, I.J.; Tuoy, M.P.; Hedley, M.J.; Dynes, R.A.; King, W.M. In-field hyperspectral proximal sensing for estimating quality parameters of mixed pasture. Precision Agric. 2012, 13, 351–369. [Google Scholar] [CrossRef]
  27. Zhao, D.; Starks, P.; Brown, M.; Phillips, W.; Coleman, S. Assessment of forage biomass and quality parameters of bermudagrass using proximal sensing of pasture canopy reflectance. Grassl. Sci. 2007, 53, 39–49. [Google Scholar] [CrossRef]
  28. Fava, F.; Colombo, R.; Bocchi, S.; Meroni, M.; Sitzia, M.; Fois, N.; Zucca, C. Identification of hyperspectral vegetation indices for Mediterranean pasture characterization. Int. J. Appl. Earth Obs. Geoinf. 2009, 11, 233–243. [Google Scholar] [CrossRef]
  29. Punalekar, S.M.; Verhoef, A.; Quaife, T.L.; Humphries, D.; Bermingham, L.; Reynolds, C.K. Application of Sentinel-2A data for pasture biomass monitoring using a physically based radiative transfer model. Remote Sens. Environ. 2018, 218, 207–220. [Google Scholar] [CrossRef]
  30. Wachendorf, M.; Fricke, T.; Möckel, T. Remote sensing as a tool to assess botanical composition, structure, quantity and quality of temperate grasslands. Grass Forage Sci. 2018, 73, 1–14. [Google Scholar] [CrossRef]
  31. Michez, A.; Philippe, L.; David, K.; Sébastien, C.; Christian, D.; Bindelle, J. Can low-cost unmanned aerial systems describe the forage quality heterogeneity? Insight from a Timothy pasture case study in Southern Belgium. Remote Sens. 2020, 12, 1650. [Google Scholar] [CrossRef]
  32. Morais, T.G.; Teixeira, R.F.M.; Rodrigues, N.R.; Domingos, T. Characterizing livestock production in Portuguese sown rainfed grasslands: Applying the inverse approach to a process-based model. Sustainability 2018, 10, 4437. [Google Scholar] [CrossRef] [Green Version]
  33. Pérez-Ramos, I.M.; Cambrolléb, J.; Hidalgo-Galveza, M.D.; Matías, L.; Montero-Ramírez, A.; Santolaya, S.; Godoy, Ó. Phenological responses to climate change in communities of plants species with contrasting functional strategies. Environ. Exp. Bot. 2020, 170, 103852. [Google Scholar] [CrossRef]
  34. García-Baquero, G.; Odriozola, I.; Aldezabal, A. Floristic composition mediates change in forage nutritive quality of Atlantic mountain grasslands after experimental grazing exclusion. Agronomy 2021, 11, 25. [Google Scholar] [CrossRef]
  35. Socher, S.A.; Prati, D.; Boch, S.; Müller, J.; Baumbach, H.; Gockel, S.; Hemp, A.; Schöning, I.; Wells, K.; Buscot, F.; et al. Interacting effects of fertilization, mowing and grazing on plant species diversity of 1500 grasslands in Germany differ between regions. Basic Appl. Ecol. 2013, 14, 126–136. [Google Scholar] [CrossRef]
Figure 1. Schematic representation of the methodology used in this work to monitor pasture quality through remote and proximal sensing.
Remotesensing 13 03820 g001
Figure 2. Location of the six dryland permanent pastures in the southern Alentejo region of Portugal.
Remotesensing 13 03820 g002
Figure 3. Montado ecosystem: evolution of the phenological state of the pasture during the vegetative cycles (2018/2019 and 2019/2020).
Remotesensing 13 03820 g003
Figure 4. Thermo-pluviometric data of Beja, Évora, and Portalegre districts of the southern Alentejo region of Portugal between October 2018 and September 2019 (source: Portuguese Institute of Sea and Atmosphere).
Remotesensing 13 03820 g004
Figure 5. Thermo-pluviometric data of Beja, Évora, and Portalegre districts of the southern Alentejo region of Portugal between October 2019 and September 2020 (source: Portuguese Institute of Sea and Atmosphere).
Remotesensing 13 03820 g005
Figure 6. Eight “10 m × 10 m” sampling area without trees georeferenced in each farm.
Remotesensing 13 03820 g006
Figure 7. Sampling area: remote sensing, proximal sensing, and pasture samples.
Remotesensing 13 03820 g007
Figure 8. Flowchart of the various data collection and processing steps.
Remotesensing 13 03820 g008
Figure 9. NDVI time-series records obtained in 2018/2019 and 2019/2020 in “AZI” field.
Remotesensing 13 03820 g009
Figure 10. NDVI time-series records obtained in 2018/2019 and 2019/2020 in “GRO” field.
Remotesensing 13 03820 g010
Figure 11. NDVI time-series records obtained in 2018/2019 and 2019/2020 in “MIT” field.
Remotesensing 13 03820 g011
Figure 12. NDVI time-series records obtained in 2018/2019 and 2019/2020 in “MUR” field.
Remotesensing 13 03820 g012
Figure 13. NDVI time-series records obtained in 2018/2019 and 2019/2020 in “PAD” field.
Remotesensing 13 03820 g013
Figure 14. NDVI time-series records obtained in 2018/2019 and 2019/2020 in “TAP” field.
Remotesensing 13 03820 g014
Figure 15. Example of spatial variability of pasture quality degradation index (PQDI) and normalized difference vegetation index (NDVI) obtained by proximal and remote sensing (PS and RS, respectively) within each experimental field in April 2020.
Remotesensing 13 03820 g015
Figure 16. Evolution of pasture quality degradation index (PQDI) and normalized difference vegetation index (NDVI) obtained by proximal and remote sensing (PS and RS, respectively) over time, in “MIT” (a) and “GRO” (b) experimental fields.
Remotesensing 13 03820 g016
Figure 17. General pattern of mean pasture CP and NDF in function of DOY, for the set of experimental fields and pasture sampling dates (2019 and 2020).
Remotesensing 13 03820 g017
Figure 18. General pattern of mean NDVI (obtained by proximal and remote sensing) and PQDI in function of DOY, for the set of experimental fields and pasture sampling dates (2019 and 2020).
Remotesensing 13 03820 g018
Figure 19. Regression analysis between NDVI obtained by proximal sensing (NDVIPS) and NDVI obtained by remote sensing (NDVIRS).
Remotesensing 13 03820 g019
Figure 20. Regression analysis between NDVI obtained by proximal sensing (NDVIPS) and Pasture Quality Degradation Index (PQDI).
Remotesensing 13 03820 g020
Figure 21. Regression analysis between NDVI obtained by remote sensing (NDVIRS) and Pasture Quality Degradation Index (PQDI).
Remotesensing 13 03820 g021
Table 1. Number of Sentinel-2 images without cloud effect in relation to the total number of satellite images available during the dryland pastures vegetative cycles of 2018/2019 and 2019/2020, by season (autumn: 21 September–20 December; winter: 21 December–20 March; and spring: 21 March–20 June) and throughout the vegetative cycle (21 September–20 June).
Field
Code
YearAutumn
(21 Sep–20 Dec)
Winter
(21 Dec–20 Mar)
Spring
(21 Mar–20 Jun)
Vegetative Cycle
(21 Sep–20 Jun)
AZI2018/201911/1812/188/1831/54 (57%)
2019/20207/189/199/1825/55 (45%)
GRO2018/201910/1813/185/1828/54 (52%)
2019/20209/189/197/1825/55 (45%)
MIT2018/201911/1811/187/1829/54 (54%)
2019/20209/189/198/1826/55 (47%)
MUR2018/201912/1811/187/1830/54 (56%)
2019/202010/189/198/1827/55 (49%)
PAD2018/201910/1812/1813/1835/54 (65%)
2019/20206/189/199/1824/55 (44%)
TAP2018/20198/1811/186/1825/54 (46%)
2019/20208/1811/199/1828/55 (51%)
Table 2. Mean ± standard deviation of pasture parameters (PMC, CP, and NDF) and NDVI obtained by proximal and remote sensing in 2019.
Field
Code
Sampling
Date
DOY
(2019)
PMCCPNDFNDVIPSDate of RS Capture *DOY (2019)Gap PS-RS (Days)NDVIRS
24/Jan2471.0 ± 7.013.0 ± 2.553.0 ± 6.00.629 ± 0.03525/Jan2510.566 ± 0.029
AZI02/Apr9270.2 ± 4.89.2 ± 1.056.8 ± 4.30.605 ± 0.05516/Mar75−170.611 ± 0.038
30/Apr12067.5 ± 5.57.9 ± 1.159.3 ± 5.60.451 ± 0.04705/May12550.392 ± 0.038
24/Jan2462.5 ± 6.211.9 ± 1.159.9 ± 3.00.641 ± 0.05725/Jan2510.609 ± 0.041
GRO15/Apr10569.2 ± 8.711.4 ± 2.654.9 ± 6.10.463 ± 0.06405/May125200.450 ± 0.033
09/May12954.9 ± 9.610.2 ± 2.362.0 ± 6.40.351 ± 0.03015/May13560.342 ± 0.018
13/Feb4482.4 ± 2.617.0 ± 3.839.6 ± 5.60.742 ± 0.04914/Feb4510.697 ± 0.032
MIT29/Mar8878.5 ± 8.515.9 ± 4.138.4 ± 7.50.709 ± 0.08931/Mar9020.656 ± 0.062
03/May12380.5 ± 2.311.1 ± 1.651.1 ± 4.70.637 ± 0.08905/May12520.622 ± 0.039
12/Feb4379.7 ± 3.111.9 ± 2.344.3 ± 4.30.695 ± 0.08104/Feb35−80.683 ± 0.058
MUR29/Mar8876.3 ± 5.311.6 ± 2.543.7 ± 6.10.685 ± 0.05721/Mar80−80.735 ± 0.036
06/May12673.3 ± 6.610.1 ± 2.456.4 ± 5.20.566 ± 0.07530/Apr120−60.643 ± 0.051
15/Feb4672.8 ± 4.613.9 ± 5.552.1 ± 8.80.719 ± 0.01524/Feb5590.685 ± 0.023
PAD29/Mar8873.7 ± 3.413.2 ± 2.539.4 ± 4.30.686 ± 0.03426/Mar85−30.666 ± 0.028
06/May12678.5 ± 3.214.6 ± 2.650.6 ± 4.00.700 ± 0.05705/May125−10.668 ± 0.040
20/Feb5175.7 ± 4.910.7 ± 2.052.2 ± 5.10.617 ± 0.04114/Feb45−60.572 ± 0.044
TAP12/Apr10279.2 ± 4.111.3 ± 3.944.3 ± 7.60.652 ± 0.09320/Apr11080.582 ± 0.069
20/May14070.9 ± 3.66.9 ± 0.955.4 ± 5.40.435 ± 0.07525/May14550.365 ± 0.056
DOY: day of the year; PMC: pasture moisture content; CP: crude protein; NDF: neutral detergent fiber; NDVI: normalized difference vegetation index; PS: proximal sensing; RS: remote sensing; * cloudless days.
Table 3. Mean ± standard deviation of pasture parameters (PMC, CP, and NDF) and NDVI obtained by proximal and remote sensing in 2020.
Field
Code
Sampling
Date
DOY
(2020)
PMCCPNDFNDVIPSDate of RS Capture *DOY (2020)Gap PS-RS (Days)NDVIRS
21/Jan2172.1 ± 4.711.5 ± 1.858.7 ± 5.30.636 ± 0.05520/Jan20−10.596 ± 0.063
AZI02/Mar6178.2 ± 3.715.8 ± 1.153.2 ± 3.70.698 ± 0.04510/Mar6980.674 ± 0.065
21/Apr11183.1 ± 1.912.4 ± 1.856.5 ± 3.50.724 ± 0.03519/Apr109−20.702 ± 0.072
28/May14855.7 ± 6.97.3 ± 1.962.5 ± 2.30.310 ± 0.02629/May14910.296 ± 0.022
21/Jan2175.9 ± 4.617.6 ± 2.348.9 ± 4.20.651 ± 0.07220/Jan2010.671 ± 0.065
GRO02/Mar6178.2 ± 3.715.0 ± 0.645.0 ± 3.30.738 ± 0.04210/Mar6980.749 ± 0.053
21/Apr11172.2 ± 2.97.8 ± 0.966.2 ± 3.60.561 ± 0.05119/Apr109−20.551 ± 0.096
28/May14853.7 ± 6.97.0 ± 1.265.9 ± 3.10.288 ± 0.01929/May14910.287 ± 0.030
20/Jan2079.5 ± 5.817.1 ± 3.143.9 ± 9.10.734 ± 0.09220/Jan2000.691 ± 0.094
MIT03/Mar6287.6 ± 1.817.6 ± 2.445.4 ± 3.30.793 ± 0.02010/Mar6970.772 ± 0.018
14/Apr10487.1 ± 2.215.2 ± 3.544.7 ± 6.30.814 ± 0.04619/Apr10950.749 ± 0.078
26/May14667.4 ± 7.49.5 ± 2.159.9 ± 5.70.457 ± 0.08624/May144−20.480 ± 0.129
22/Jan2276.8 ± 3.411.0 ± 3.163.9 ± 3.20.530 ± 0.06220/Jan20−20.517 ± 0.040
MUR09/Mar6879.9 ± 2.815.7 ± 5.851.3 ± 3.80.600 ± 0.04610/Mar6910.560 ± 0.034
20/Apr11083.2 ± 1.415.2 ± 3.154.2 ± 3.70.649 ± 0.04924/Apr11440.622 ± 0.043
29/May14975.1 ± 4.38.6 ± 1.261.8 ± 3.30.446 ± 0.05729/May14900.447 ± 0.058
20/Jan2077.7 ± 3.716.1 ± 2.050.6 ± 3.70.690 ± 0.02820/Jan2000.690 ± 0.027
PAD09/Mar6878.1 ± 2.016.6 ± 2.245.2 ± 2.50.739 ± 0.02010/Mar6910.711 ± 0.023
20/Apr11086.8 ± 1.519.0 ± 2.647.4 ± 1.90.820 ± 0.02919/Apr109−10.788 ± 0.031
29/May14967.6 ± 3.19.7 ± 1.160.6 ± 2.00.488 ± 0.04229/May14900.481 ± 0.035
22/Jan2274.5 ± 7.510.8 ± 4.356.2 ± 9.40.620 ± 0.05820/Jan20−20.569 ± 0.085
TAP10/Mar6976.1 ± 4.615.0 ± 3.345.8 ± 4.00.640 ± 0.05310/Mar6900.649 ± 0.042
24/Apr11479.4 ± 2.29.0 ± 1.156.7 ± 5.50.656 ± 0.05524/Apr11400.641 ± 0.038
01/Jun15270.0 ± 6.58.0 ± 1.458.7 ± 7.00.431 ± 0.05129/May149−30.496 ± 0.021
DOY: day of the year; PMC: pasture moisture content; CP: crude protein; NDF: neutral detergent fiber; NDVI: normalized difference vegetation index; PS: proximal sensing; RS: remote sensing; * cloudless days.
Publisher’s Note: MDPI stays neutral with regard to jurisdictional claims in published maps and institutional affiliations.

