Article

Consistency and Stability of SNPP ATMS Microwave Observations and COSMIC-2 Radio Occultation over Oceans

1
Earth System Science Interdisciplinary Center, Cooperative Institute for Satellite Earth System Studies (CISESS), University of Maryland, College Park, MD 20740, USA
2
Center for Satellite Applications and Research, NOAA National Environmental Satellite, Data, and Information Service, College Park, MD 20740, USA
*
Author to whom correspondence should be addressed.
Remote Sens. 2021, 13(18), 3754; https://doi.org/10.3390/rs13183754
Submission received: 13 July 2021 / Revised: 14 September 2021 / Accepted: 16 September 2021 / Published: 19 September 2021

Abstract

:
Radio occultation (RO) sensor measurements have critical roles in numerical weather prediction (NWP) by complementing microwave and infrared sounder measurements with information of the atmospheric profiles at high accuracy, precision, and vertical resolution. This study evaluates Constellation Observing System for Meteorology, Ionosphere, and Climate 2 (COSMIC-2) wet temperature and humidity data products’ consistency and stability through inter-comparison with SNPP advanced technology microwave sounder (ATMS) measurements. Through the community radiative transfer model (CRTM), brightness temperature (BT) at SNPP ATMS channels are simulated with COSMIC-2 retrieved atmospheric profiles from two versions of the University Corporation for Atmospheric Research (UCAR) wet profiles (WETprf and WETpf2) as inputs to the CRTM simulation. The analysis was focused on ATMS sounding channels CH07–14 and CH19–22 with sounding weighting function peak heights from 3.2 to 35 km. The COSMIC-2 vs. ATMS inter-comparison indicates that their BT biases are consistent, and the latitudinal difference is <0.3 K over three latitudinal regions. The differences between the two versions of UCAR COSMIC-2 wet profiles are identified and attributed to the differences in the implementation of 1DVAR retrieval algorithms. The stability between UCAR near real-time COSMIC-2 wet profile data and ATMS measurements is also well-maintained. It is demonstrated that the well-sustained quality of COSMIC-2 RO data makes itself a well-suited reference sensor to capture the calibration update of SNPP ATMS. Furthermore, the impacts of the assimilation of COSMIC-2 data into the European Centre for Medium-Range Weather Forecasts (ECMWF) model after 25 March 2020, are evaluated by trending observation-minus-background (O-B) biases, which confirms the statistically significant positive impacts of COSMIC-2 on the ECMWF reanalysis. The validation of stability and consistency between COSMIC-2 and SNPP ATMS ensures the quality of RO and microwave sounder data assimilated into the NWP models.

1. Introduction

With a continuous record from 1980 till now, the passive satellite microwave (i.e., microwave sounding unit (MSU) and the advanced microwave sounding unit (AMSU)) [1,2,3,4,5] and infrared (IR) sounders (i.e., high-resolution infrared radiation sounders (HIRS)) [6,7] have been used to detect long-term variations of atmospheric vertical thermal distributions [8,9]. In addition, microwave (MW) temperature climate data records (CDRs) generated by several groups [10] have been used to quantify the global warming signals in both the troposphere and the lower stratosphere [11,12,13,14].
The advanced technology microwave sounder (ATMS) instrument onboard the Suomi National Polar-orbiting Partnership (SNPP) spacecraft is the first in a series of next-generation weather satellites of the Joint Polar Satellite System (JPSS), which was launched on 28 October 2011. The ATMS is a cross-track scanning microwave radiometer with 22 channels. It provides sounding observations for civilian operational weather forecasting and continuity of these measurements for climate monitoring purposes. ATMS has played a critical role in improving the global medium-range weather forecast and monitoring/predicting severe weather events [15,16,17,18,19,20]. The antenna temperature (Ta) from ATMS was constructed through onboard calibration procedures [15,16] and post-launch validations [21,22,23,24]. However, it is hard to directly use the operationally calibrated ATMS antenna temperatures for climate studies because of the lack of on-orbit anchor references.
The active RO technique provides invaluable information on the atmospheric density, complementing the satellite IR and MW radiance measurements [17,25]. RO is the first technique to provide a high-vertical-resolution all-weather bending angle and refractivity profile [26,27,28]. With a priori information for the temperature and moisture, RO refractivity can be further inverted to pressure, temperature, and moisture profiles in the neutral atmosphere. The RO-retrieved bending angle can be directly assimilated into the weather forecasting model without bias correction. Several global positioning system (GPS)-LEO missions have shown that RO sensors can accurately measure atmospheric temperature and improve global weather prediction [29]. The Constellation Observing System for Meteorology, Ionosphere, and Climate (COSMIC-1) onboard Formosa Satellite Mission 3 has provided spatially uniform RO data since 2006. The neutral atmospheric profiles retrieved from COSMIC-1 RO data have been demonstrated to be very useful for studying atmospheric processes [25,30,31,32,33,34,35,36,37,38,39,40,41,42,43].
It was demonstrated that RO data are beneficial to identify the AMSU brightness temperature (BT) biases for those lower stratosphere channels (channels 9–12) related to: i) solar zenith angle (SZA) dependence biases, ii) inter-satellite biases, and iii) local time drift [44,45,46]. While RO temperature profiles in the lower stratosphere were used to calibrate AMSU BT biases, Iacovazzi et al. [47] used COSMIC-1 GPS-RO soundings over the ocean to quantify BT biases AMSU-A instruments which are onboard NOAA-18, NOAA-19, MetOp-A, and MetOp-B, and ATMS onboard SNPP and NOAA-20. These simulated COSMIC-1 BT values are compared to the observed antenna BT values of the microwave sounders to compute monthly BT bias statistics for each instrument. Results from [47] suggested that the GNSS RO soundings are critical to monitoring and trending TDR biases of individual microwave radiometers. Furthermore, Zou et al. [48] estimated the ATMS scan angle-dependent biases from channels 5 to 13 (where the weighting function peak varies from 5 km to 30 km). This study used RO-derived BT as absolute references to identify and correct viewing angle (sidelobe) biases.
Although RO raw data are traceable to a unit of time, the derived environmental variables such as temperature and water vapor are not. The temperature and water vapor profiles in the troposphere are retrieved from the refractivity profiles. Those retrievals are relatively weighted from the observed information (refractivity) and the a priori used in the one-dimensional variational (1DVAR) retrievals. The temperature retrieval uncertainty may be more significant in the lower troposphere, where the variability of water vapor contributes substantially to the refractivity.
As a COSMIC follow-on mission, the COSMIC-2 constellation with six satellites onboard Formosa Satellite Mission 7 was successfully launched into a 24-degree inclination low Earth orbit on 25 June 2019. Each of the six satellites in the COSMIC-2 constellation has three instruments: the primary Tri-GNSS radio-occultation system (TGRS) payload, radio frequency beacon, and ion velocity meter. The TGRS was designed with a steering beam phase array antenna and advanced receiver to receive navigation signals from multiple GNSS satellites. These include the US GPS, the European Galileo system, and the Russian GLONASS (GLObal NAvigation Satellite System). Such design enhances RO signal quality with a higher signal-to-noise ratio (SNR) and deeper penetration depth and increases the number of successful RO retrievals [49,50,51]. COSMIC-2 routinely provides atmospheric and ionospheric data to daily near-real-time (NRT) weather forecasts, climate studies, and space weather monitoring and forecasts. Evaluations of assimilating COSMIC-2 data into the NWP systems show positive impacts of COSMIC-2 RO data on short- and medium-range weather forecasts [52].
The initial validation shows that COSMIC-2 is compatible with the precision, stability, and accuracy of COSMIC [50]. However, the consistency between COSMIC-2 and ATMS is still unknown. This study examines the stability and consistency between COSMIC-2 and the legacy SNPP ATMS instrument. Given the COSMIC-2 observation distribution, this study focuses mainly on 45°N to 45°S in latitude.
We conducted the ATMS vs. COSMIC-2 comparisons on ATMS sounding channels CH07 to CH14 with peak sounding height from 8 to 35 km and CH19 to CH22 with sounding peak heights ranging from 3.2 to 6.7 km. With a high SNR, COSMIC-2 is of deeper penetration compared to other RO missions. This provides a unique opportunity to evaluate the water vapor profiles retrieved from COSMIC-2 using ATMS CH19 to CH22 observations. Two versions of COSMIC-2 wet profile (wet temperate and humidity profile) data, e.g., WETPrf and WETPf2 that are processed by the University Corporation for Atmospheric Research (UCAR), are evaluated. These two versions differ in the implementation of 1DVAR retrieval algorithms (see http://cdaac-www.cosmic.ucar.edu/cdaac/doc/documents/1dvar.pdf (accessed on 1 September 2021) for WETPrf, and [53] for WETPf2). A very tight constraint is applied to WETPrf in the 1DVAR. Only temperature and moisture profiles are reported when the difference of the observed refractivity and forward computed refractivity computed from the retrieved temperature and moisture profiles are within the uncertainty of refractivity. This ensures that the refractivity measurements are completely used in the 1DVAR (see [50], Section 2.2). However, in the WETPf2 (see [53]), the observed refractivity may differ from the forward computed refractivity. Therefore, the a priori information for WETPrf2 may contribute to the retrievals. More descriptions are in Section 3.2.
To simulate BT data for ATMS channels, the temperature and humidity profile retrieved from COSMIC-2 refractivity data have been fed as inputs to the community radiative transfer model (CRTM). Other inputs to the CRTM simulation are obtained from the European Centre for Medium-Range Weather Forecasts (ECMWF) reanalysis model-5 (ERA-5). Through inter-comparison between CRTM-simulated BT and ATMS BT, the consistency and stability between COSMIC-2 and SNPP ATMS measurements are evaluated. The differences in the bias and uncertainty characteristics between the two versions of UCAR wet profile products are also assessed. The observation-minus-background (O-B) bias of COSMIC-2 vs. ECMWF for ATM channels of interest is also derived through double-difference of biases relative to ATMS, which enables monitoring the bias trend variation after the assimilation of COSMIC-2 RO data into ECMWF on 25 March 2020 [52].
This paper is organized as follows. In Section 2, overviews of SNPP ATMS microwave sounder and COSMIC-2 radio occultation sensor constellation are given. Section 3 illustrates the CRTM simulation setup and presents details and differences of the three sets of temperature/humidity profiles used as inputs to the CRTM simulation. Section 4 presents results from the CRTM-based inter-comparison between COSMIC-2 and ATMS and O-B biases regarding biases, uncertainty, and stability. Finally, Section 5 and Section 6 discuss and summarize our studies.

2. Sensor Overview

2.1. COSMIC-2 Radio Occultation Sensor

The COSMIC-2 satellite system consisted of six small LEO satellites and was successfully launched into equatorial orbit on 25 June 2019. With a 24-degree inclination on the LEO orbit, COSMIC-2 provides comprehensive coverage of atmospheric profile sounding in low and mid-latitude regions, i.e., from 45°N to 45°S. COSMIC-2 adopts the TGRS receiver design with a steering beam phased array antenna to receive navigation signals from US GPS signals and Russian GLONASS satellites in multiple radio frequency bands. By combining high-performance GPS+GLONASS receiver and antenna design, COSMIC-2 aims to increase the number of successful RO retrievals per satellite, enhancing the GNSS-RO measurement quality and improving penetration depth in the troposphere [49,50]. The constellation of six small satellites in COSMIC-2 provides as much as ~5000 RO measurements per day. COSMIC-2 data became operational on 25 February 2020. On 16 March 2020, COSMIC-2 RO data were available to the public for atmospheric and climate studies and NWP applications. COSMIC-2 is the first RO sensor that provides routine GLONASS GNSS-RO measurements for operational NWP applications. Early COSMIC-2 data quality has been evaluated in [49,50]. It was shown that COSMIC-2 had increased signal-to-noise ratio (SNR) and deeper penetration depth. In addition, it has very compatible stability, precision, accuracy, and uncertainty regarding accuracy with those from COSMIC-1. Evaluations of assimilating COSMIC-2 data into the NWP systems show positive impacts of COSMIC-2 RO data on weather prediction [52,54].

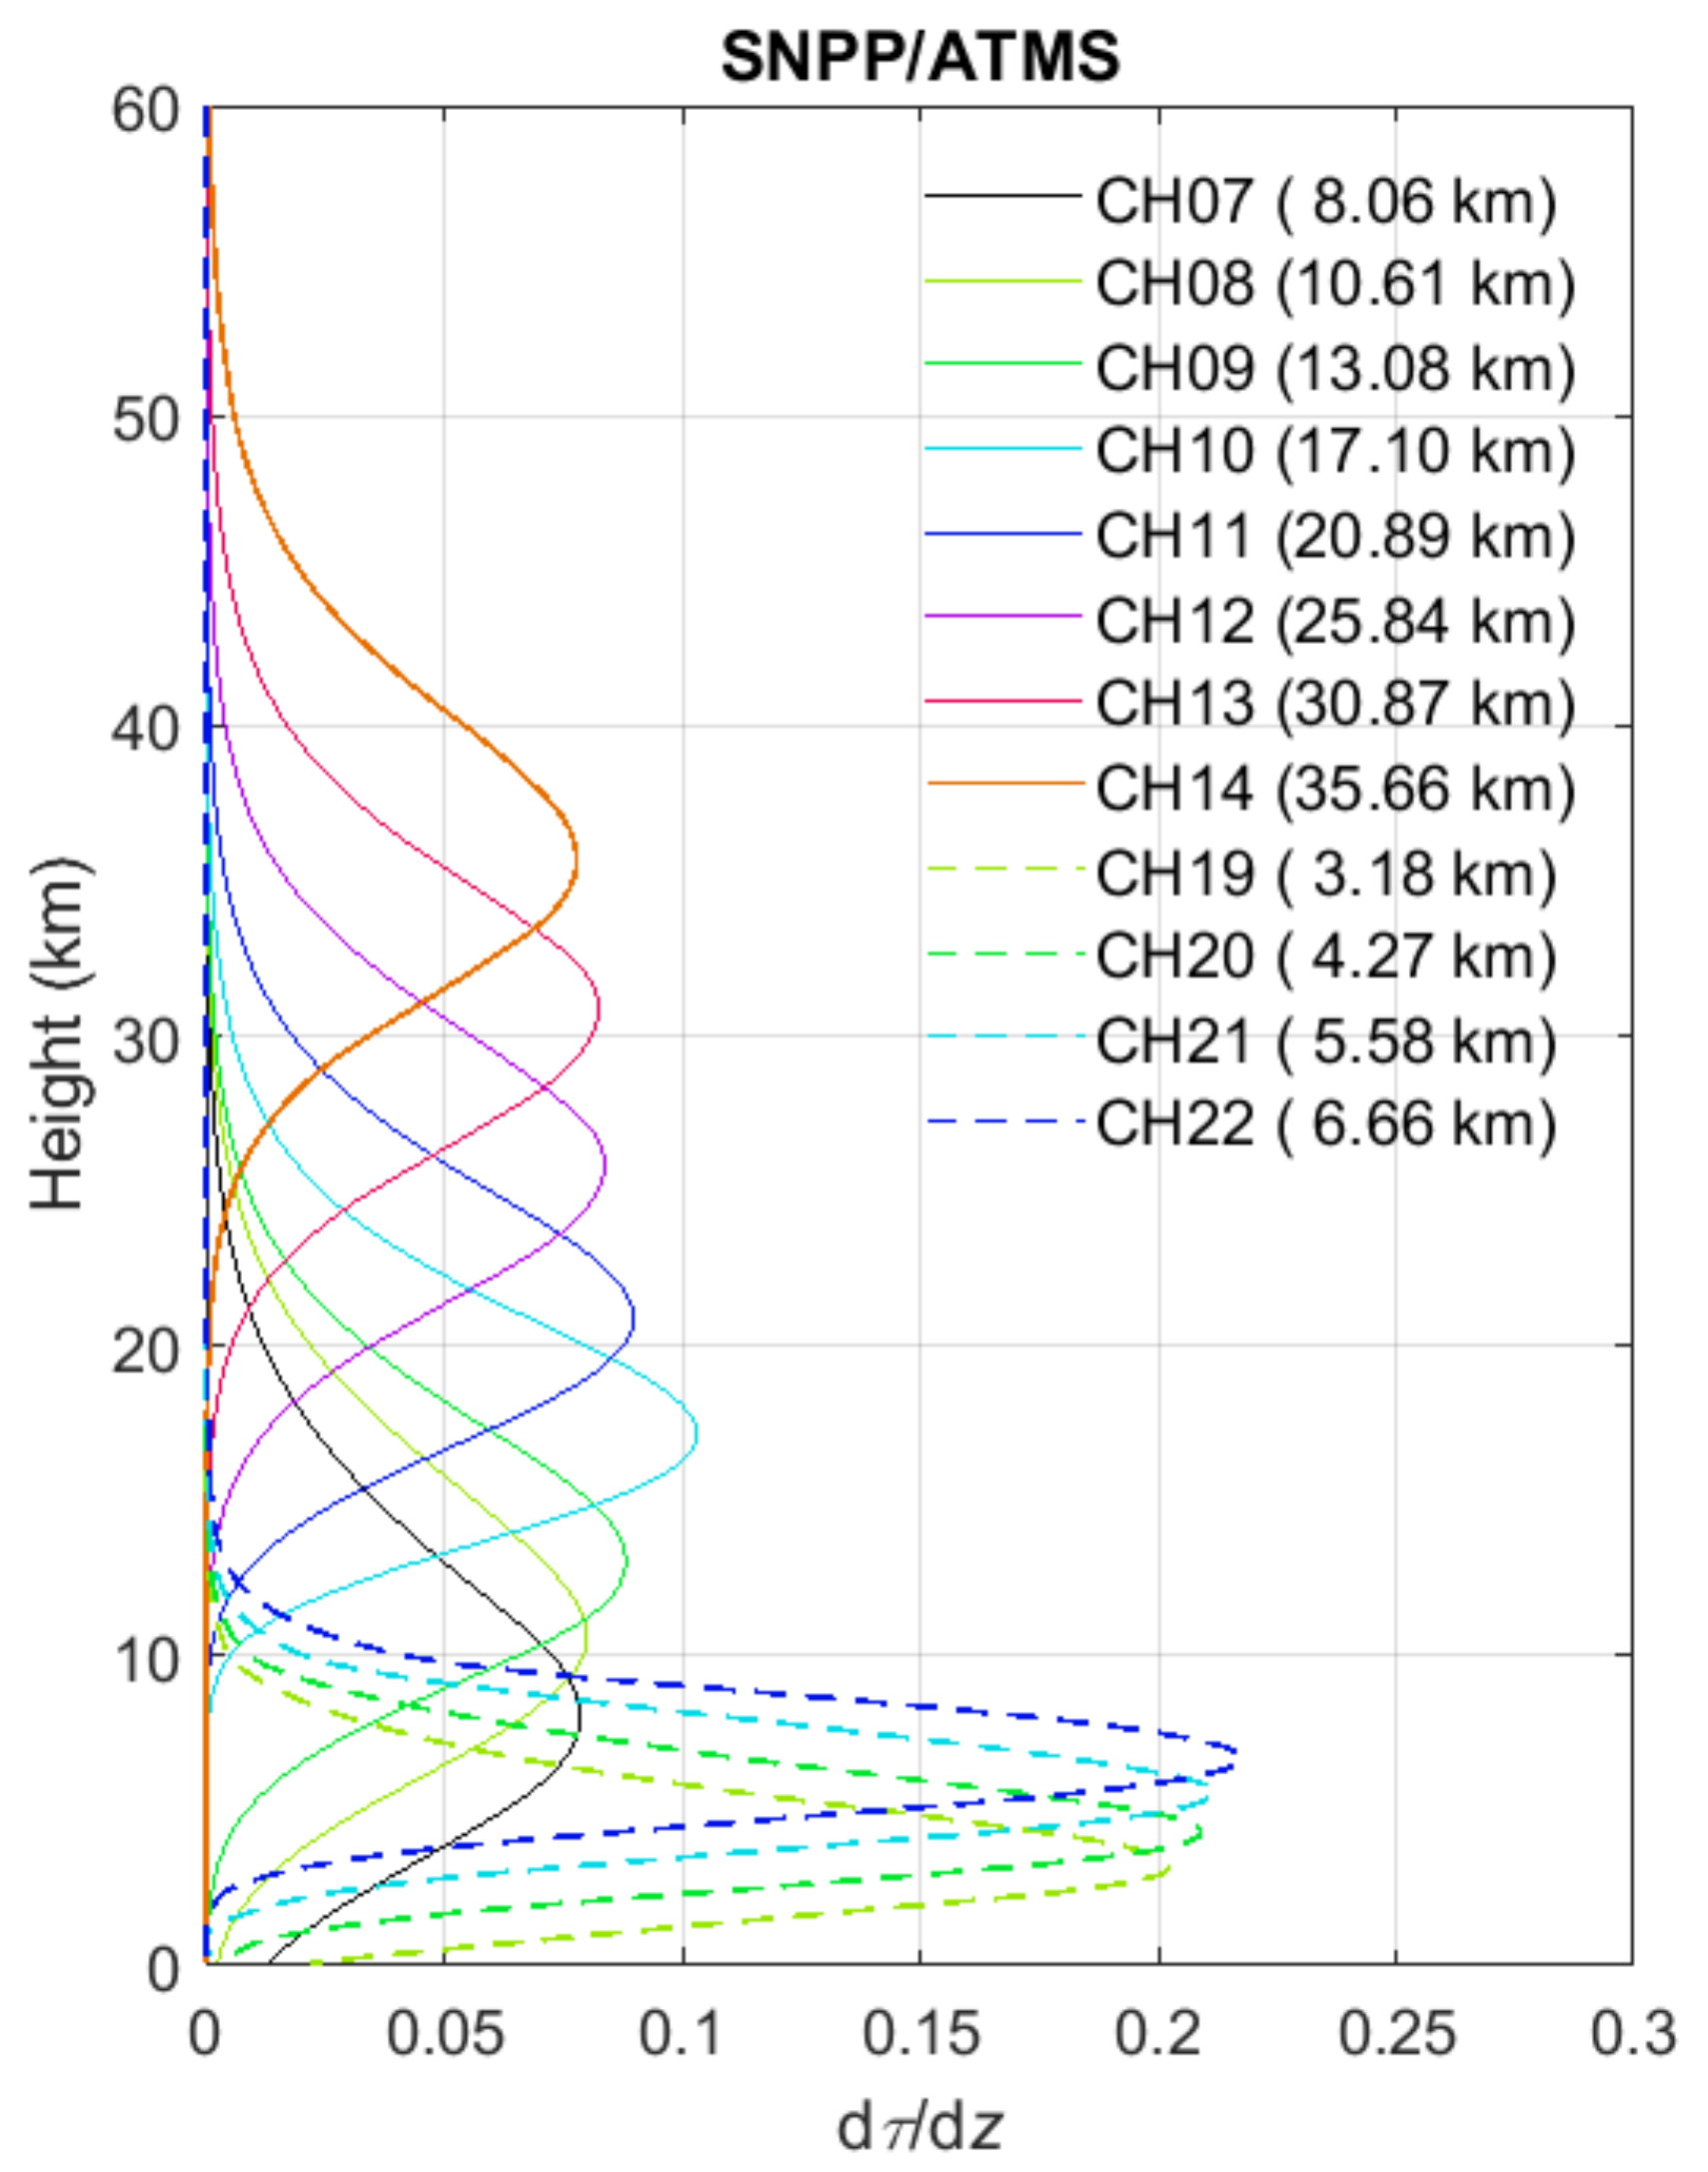
2.2. SNPP ATMS Instrument

The first ATMS microwave sounder onboard SNPP spacecraft was launched into orbit on 28 October 2011. ATMS is currently onboard both SNPP and NOAA-20 spacecraft and will be on the follow-on JPSS missions. ATMS is a cross-track scanner and provides sounding observations to retrieve atmospheric temperature and moisture profiles for operational numerical weather forecasting. ATMS also maintains the continuity of microwave sounder measurements by the preceding AMSU and microwave humidity sounder (MHS) sensors for climate monitoring purposes [15,16,17,18,19,20]. The ATMS covers 22 channels with central frequency varying from 23 GHz through 183 GHz. Among the 22 bands of ATMS, the first 16 channels primarily make sounding measurements of temperature from the surface to about 1 hPa (~45 km), and ATMS CH17–22 (around the 183 GHz) perform humidity soundings from the surface to ~200 hPa (~15 km) in the troposphere. The scan angle of the ATMS instrument is ±52.725° from nadir. It has a swath width of 2700 km by taking 96 field of view measurements along the scan direction. The onboard calibration of ATMS is carried out by measuring the background offset through space view and observing a well-characterized and precisely temperature-controlled internal blackbody during each revolution scan of the reflector antenna. The radiometric accuracy and long term stability of microwave radiometers are maintained through calibration and validation techniques such as:
i)
inter-comparison among microwave sounder measurements with simultaneous nadir overpass (SNO) methods [21,22]
ii)
long term monitoring of stable cold or warm vicarious targets, and global mean [23]
iii)
observation-minus-background (O-B) bias monitoring, and
iv)
observation of the Moon [24].
This study focuses on inter-comparing COSMIC-2 temperature and humidity profiles with the collocated measurements from SNPP ATMS sounding channels CH07 to CH14 and ATMS CH19 to CH22. Figure 1 shows the weighting functions of ATMS channels of interest using the 1976 US standard model atmosphere. ATMS CH07 to CH14 have peak-sounding heights varying from 8.06 to 35.66 km, while ATMS CH19–CH22 have sounding peak heights ranging from 3.18 to 6.66 km. Table 1 summarizes the peak sounding height, central frequency, 3 dB beamwidth, and specified accuracy and NEDT of ATMS channels studies in this paper. ATMS CH07 to CH14 are temperature-sounding channels. ATMS CH19–CH22 are moisture-sounding channels with a center frequency around 183 GHz. In this study, the ATMS sensor data record (SDR) has been evaluated and referred to as ATMS BT data at channels of interest. The ATMS SDR is converted from ATMS temperature data record (TDR) by accounting for beam efficiencies and corrections of near-field sidelobe contributions.

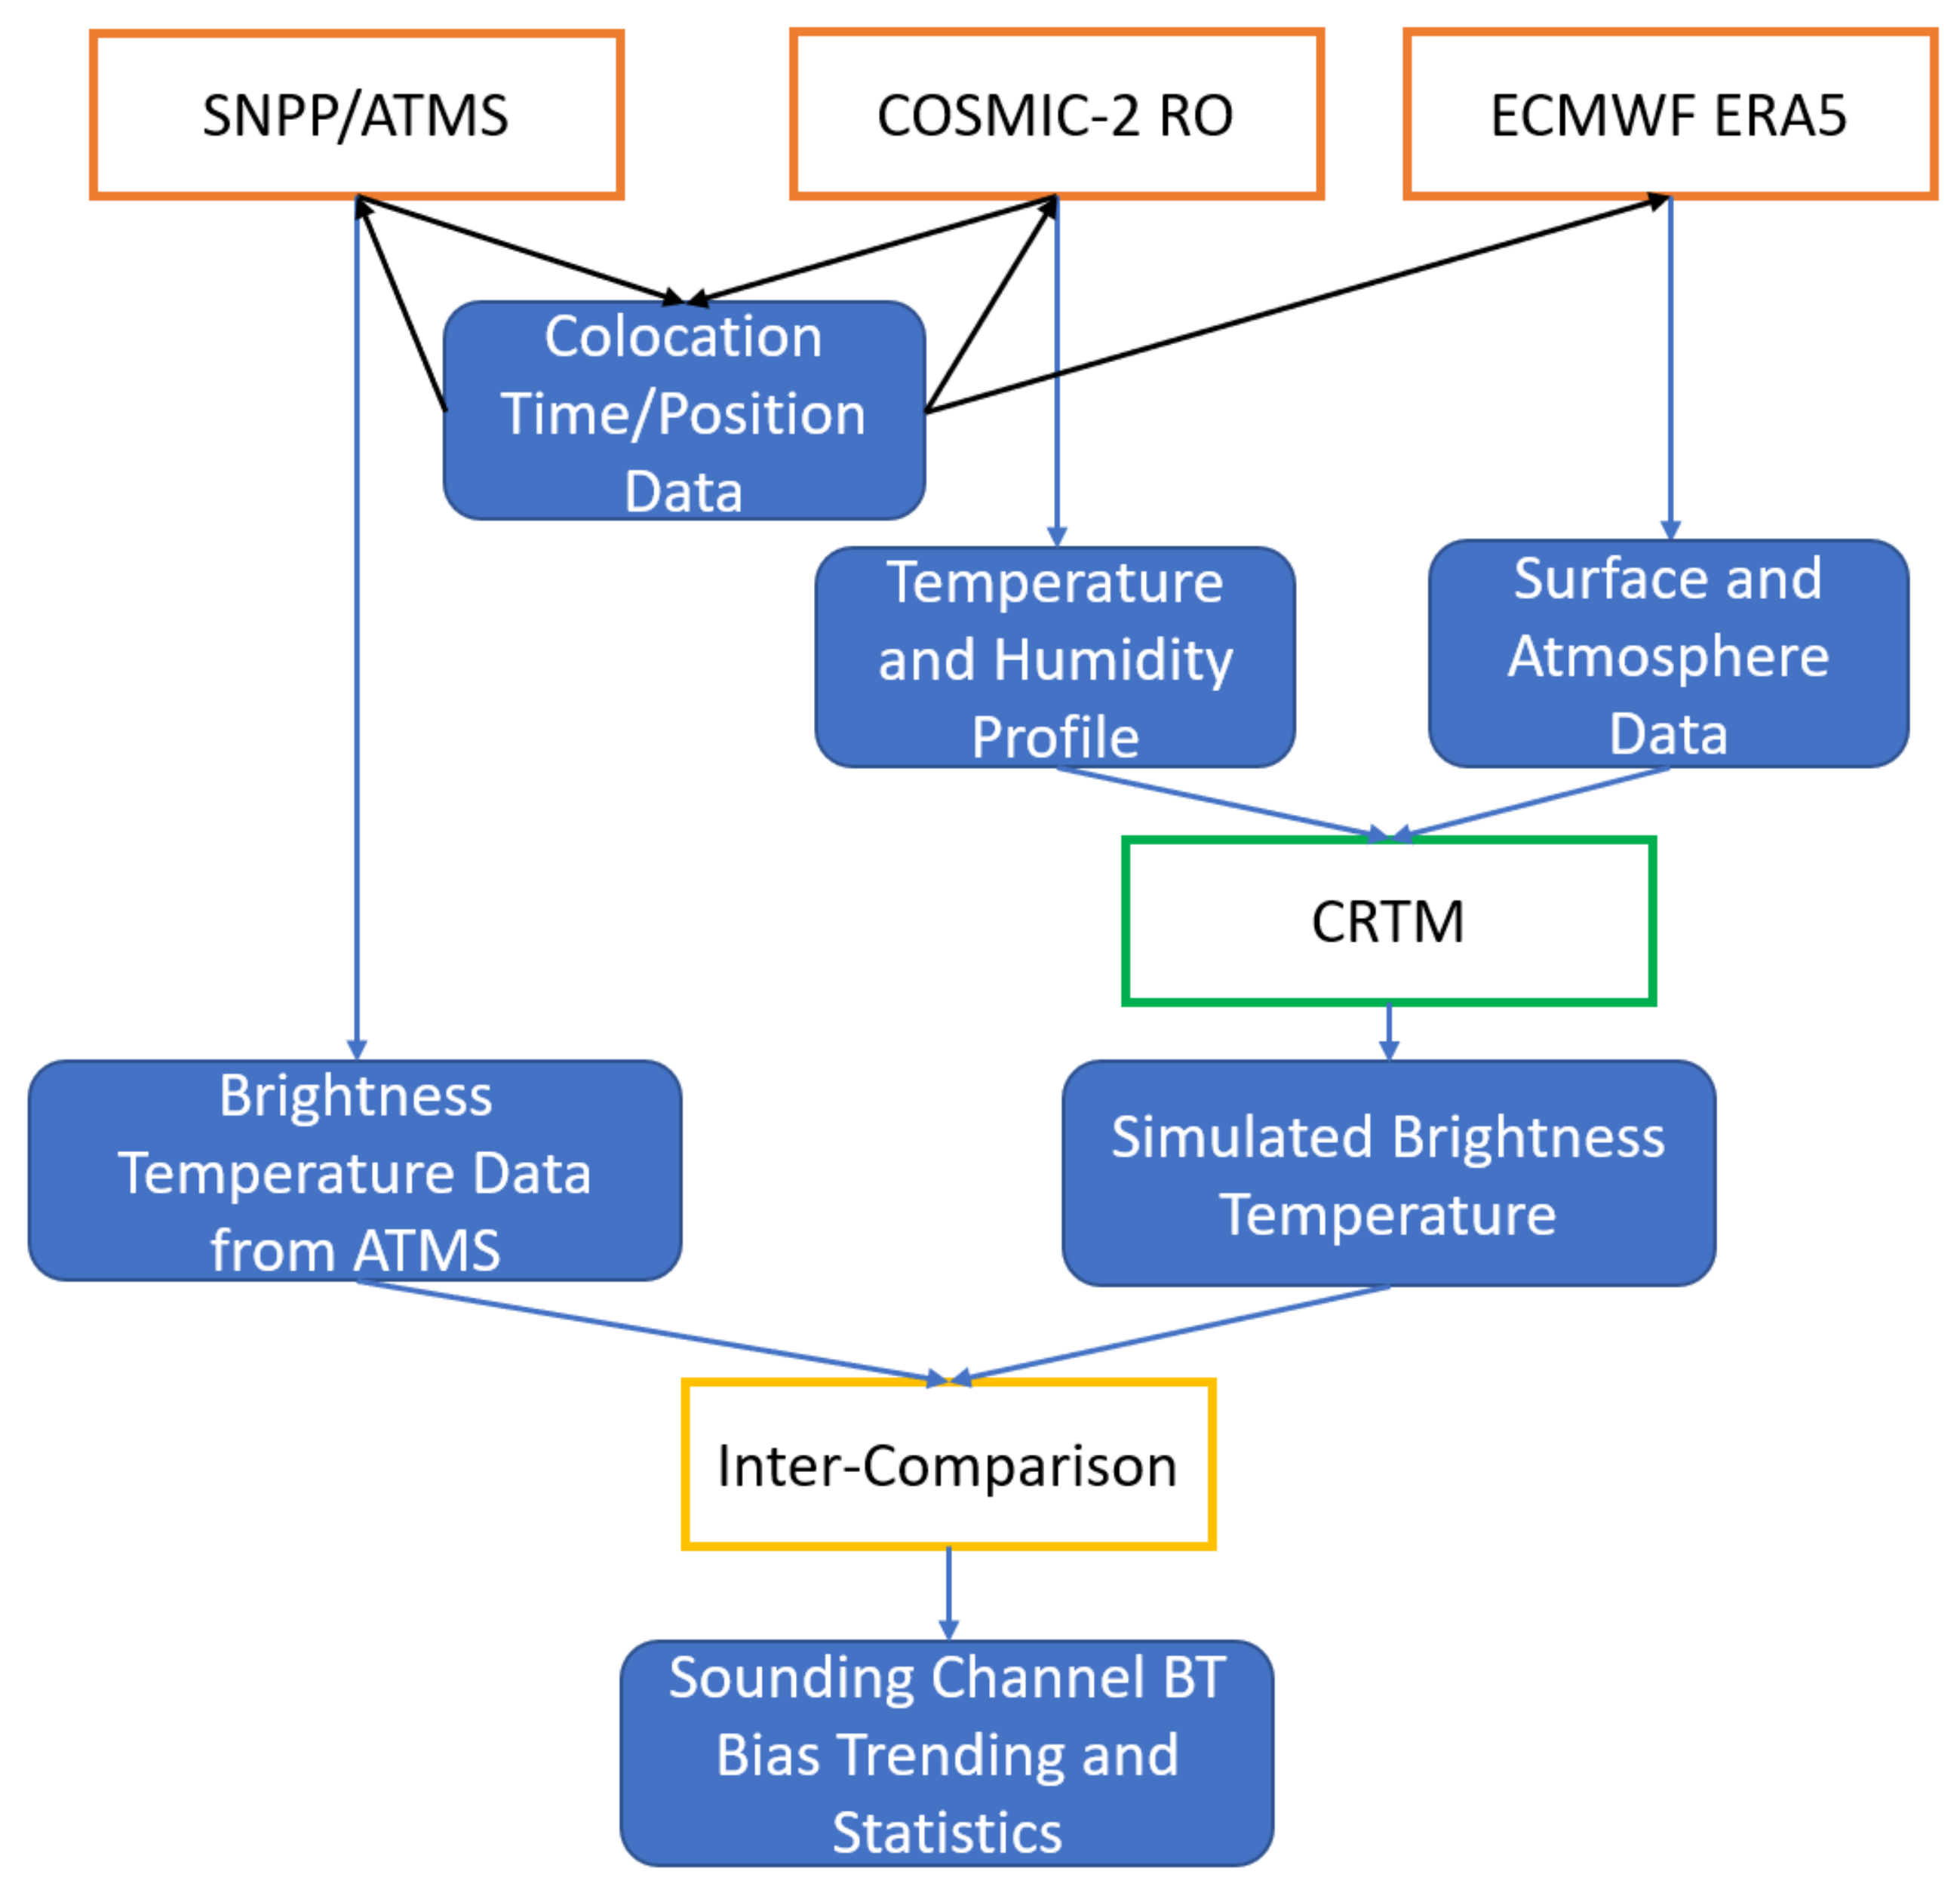
3. CRTM-Based Radiative Transfer Modeling for Inter-Comparison of COSMIC-2 and SNPP ATMS Measurements

3.1. Radiative Transfer Model Setup

This study uses the CRTM (V2.1.3) to perform radiative transfer modeling (RTM) simulations. The CRTM was developed and maintained by U.S. JCSDA and can be downloaded from ftp://ftp.emc.ncep.noaa.gov/jcsda/CRTM/REL-2.1.3/ (accessed on 1 September 2021) [55]. The CRTM is a fast sensor-channel-based RTM tool for simulating satellite-measured radiances for infrared or microwave radiometers by quantitatively accounting for reflection and radiation emission by the Earth’s surface, gaseous absorption in the atmosphere, and scattering and absorption of radiation by clouds and aerosols. It has been widely used to calibrate and assimilate infrared and microwave sensor data and remote sensing applications [56,57]. Given the spectral response data of a new sensor, spectral and transmittance coefficient parameter files need to be created to set up the new sensor’s CRTM simulation. The CRTM package provides comprehensive functions such as forward, adjoint, tangent-linear, and K-matrix models to meet users’ modeling needs. The inputs to the CRTM include atmospheric profiles of water vapor, temperature, pressure, CO2, ozone, and other variable gas concentration at layers defined by the user, aerosol-related characteristic parameters, cloud types, cloud parameters, and surface property parameters such as skin temperature, emissivity, wind speed, and direction. The CRTM computes the satellite-measured thermal radiation radiance and BT at microwave sensor frequencies for the microwave sensor simulation.
Figure 2 illustrates the CRTM simulation setup for modeling radiometric BT at ATMS sounding channel frequencies with the temperature/humidity profile data from the RO sensor as inputs. We have used three sets of temperature/humidity data as inputs to the CRTM simulation, compared in detail in Section 3.2. Other inputs to the CRTM simulation include surface parameters such as skin temperature, wind speed, and wind direction. These data are obtained from ECMWF re-analysis (ERA) single-level data based on six-hourly increments. The mixing ratio profile of ozone is also obtained from ERA5 data, coordinated at 37 mandatory pressure levels varying from ground to ~0.1 hPa. The ERA global atmospheric and climate reanalysis dataset is produced from 4DVAR data assimilation, blends or assimilates observations with a previous NWP forecast to get the best fit. The data from ERA have been collected with 0.5° spatially gridded resolution, which is equivalent to a spatial resolution of ~50 km at the equator. As a reference, the footprint size of SNPP ATMS varies with channels. The ATMS CH07–14 has an antenna beamwidth of 2.2° and nadir footprint sizes of 31.6 km, while the ATMS CH19–22 has a beamwidth of 1.1° and corresponding footprint sizes of 15.8 km at nadir. In this study, the CRTM simulations are focused on the ocean surface, and effects from the cloud or aerosols are not considered in the simulation. The surface emissivity model used in the CRTM simulation is based on the default CRTM oceanic surface model at ATMS channel frequencies. The main reason for focusing on the comparison over oceans is due to the challenges of handling the variability of land surface emissivity and surface temperature in the CRTM model. The selection of the ocean as the site of interest makes the required spatial uniformity of surface emissivity and surface temperature in the radiative transfer modeling easier to be satisfied.
As shown in Figure 2, the CRTM simulations were carried out with time-varying surface and atmospheric profile data as inputs. To prepare for the CRTM simulation, collocated time and position data between SNPP ATMS orbital nadir location and the COSMIC-2 RO profiles’ perigee location are first collected over oceans. These collocation data between SNPP/ATMS and COSMIC-2 are used to collect SNPP ATMS, COSMIC-2, and ECMWF ERA5 data for the simulation and comparison. Spatial and temporal interpolations of ERA surface and ozone profile parameters over the collocated RO and ATMS locations are performed to derive the additional input parameters to the CRTM. Each CRTM simulation outputs BT data for the corresponding ATMS channels. The simulated BT data from CRTM over collocations are further compared with the ATMS measurements to analyze COSMIC-2 vs. SNPP ATMS bias and uncertainty.

3.2. Temperature and Humidity Profile Data Inputs to the CRTM Simulation

As shown in Figure 2, the CRTM simulation requires inputs of atmospheric temperature and moisture profile data. This study has fed three sets of temperature/humidity data (listed in Table 2) into CRTM simulations to output the simulated BT data for ATMS channels. The difference and consistency among the CRTM simulations using these three inputs are evaluated by comparing ATMS BT measurements for the corresponding ATMS channels. Among these three sets of temperature/humidity profile data, COSMIC-2 Wet Profile (WETPrf) and Wet Profile #2 (WETPf2) data are obtained from UCAR retrievals and their differences are discussed below. In addition, the background temperature and humidity data from ECMWF reanalysis version 5 data [ERA5 (fifth generation ECMWF atmospheric reanalysis)] are used in CRTM simulation to enable the derivation and monitoring of the O-B biases.
The retrievals of RO limb-sounding data first derive vertical profiles of bending angle and refractivity from the excess phase data processed from the Doppler-shifted raw radio signals transmitted by GNSS satellites and propagate through the atmosphere. Then, to determine the wet temperature and water vapor profiles of the Earth’s atmosphere from bending angle or refractivity data, the 1DVAR algorithm is applied to find a solution to an under-determined problem. The 1DVAR retrieval generally uses a priori state of the atmosphere, i.e., vertical background temperature and humidity profile, an observable such as RO refractivity or bending angle data, and associated background and observation uncertainties/error covariance matrices (ECM) to minimize a quadratic cost function. Therefore, different implementation of 1DVAR retrieval algorithms can result in different bias and uncertainty characteristics in the retrieved wet temperature and water vapor profiles. Indeed, this is the case for the two versions of the COSMIC-2 wet profile data processed by UCAR.
As listed in Table 2, we analyzed two versions of wet profile data produced by UCAR from COSMIC-2 RO data, namely WETPrf (https://cdaac-www.cosmic.ucar.edu/cdaac/products.html accessed on 1 September 2021) and WETPf2 (https://data.cosmic.ucar.edu/gnss-ro/cosmic2/nrt/ accessed on 1 September 2021). The UCAR COSMIC-2 WETPrf data was generated with the heritage 1DVAR algorithm at CDAAC previously used to produce COSMIC-1 wet temperature and humidity profile data. In the 1DVAR algorithm for WETPrf, background profiles are taken from ECMWF gridded low-resolution reanalysis data interpolated to the time and location of RO measurements to separate the pressure, temperature, and moisture contributions to the refractivity. Unfortunately, the UCAR COSMIC-2 WETPrf data were only available for one month in October 2019.
In the official release of NRT COSMIC-2 RO data in October 2019, UCAR implemented a new 1DVAR retrieval algorithm [53], i.e., WETPf2, to process COSMIC-2 data. Several changes have been implemented in the 1DVAR retrieval algorithm of WETPf2 data compared to the previous WETPrf algorithm. These changes include the use of statistical observation error, consistent background error with correlations to multi-variate, and ECM with higher spatial (10° × 10°) and temporal (monthly) resolution in comparison with the previous ECM with limited three latitude range and four seasonal dependence [53]. The WETPf2 retrieval algorithm also implemented variational Abel transform for bending angle optimization and took into account terrain variation by incorporating a digital elevation model. Additionally, UCAR WETPf2 data are processed using analysis data from the Global Forecasting System (GFS) of NOAA National Centers for Environmental Prediction (NCEP) to initialize the model. In contrast, the old UCAR WETPrf software uses ECMWF data as the initial guess for the 1DVAR retrieval. The UCAR WETPf2 data has been available in NRT since 1 October 2019. This paper analyzed UCAR COSMIC-2 WETPf2 data from 1 October 2019, to 31 December 2020. However, due to the update of UCAR’s 1DVAR algorithm for the NRT Wetpf2 product after 25 September 2020, there are noticeable bias changes after this day. Therefore, the biases and uncertainties we analyzed in this paper are focused on over a ~1 year period from 1 October 2019, to 20 September 2020.
Both UCAR WETPrf and WETPf2 profile data contain latitude and longitude of the RO perigee point, temperature, pressure, specific humidity profile, and mean sea level height. The WETPrf profile data is interpolated to 100 m height intervals. The WETPf2 was sampled to ~800 layers.
With the implementation of the above changes in the UCAR COSMIC-2 WETPf2 data, it is expected that there will be differences in the retrieved wet temperature and humidity data in comparison with those processed with the UCAR WETPrf algorithm. As summarized in Table 2, one month of WETPrf data in October 2019 for COSMIC-2 overlapped the WETPf2 data. In this work, the biases between CRTM-simulated BT using WETPrf data and ATMS measurements are compared with the biases derived with WETPf2 data to evaluate their differences in terms of biases and uncertainties. In addition, the long-term UCAR WETPf2 data from 1 October 2019, to 20 September 2020, are also used to evaluate the stability consistency between COSMIC-2 and ATMS for ATMS CH07–14 and CH19–22.
Furthermore, the long-term global temperature and humidity profile data from ERA5 can be used to replace COSMIC-2 RO data in Figure 2 and feed directly into the CRTM to derive BT data for ATMS channels over the same period. Using the double-difference method (see Section 4.3 for more details) and ATMS BT as the reference, the O-B biases can be derived with BTs from the CRTM simulations with COSMIC-2 or ERA5 data as inputs. The O-B bias trending enables monitoring of the variation of COSMIC-2 vs. ERA5 biases for ATMS channels of interest before and after the assimilation of COSMIC-2 RO data into ECMWF [52].

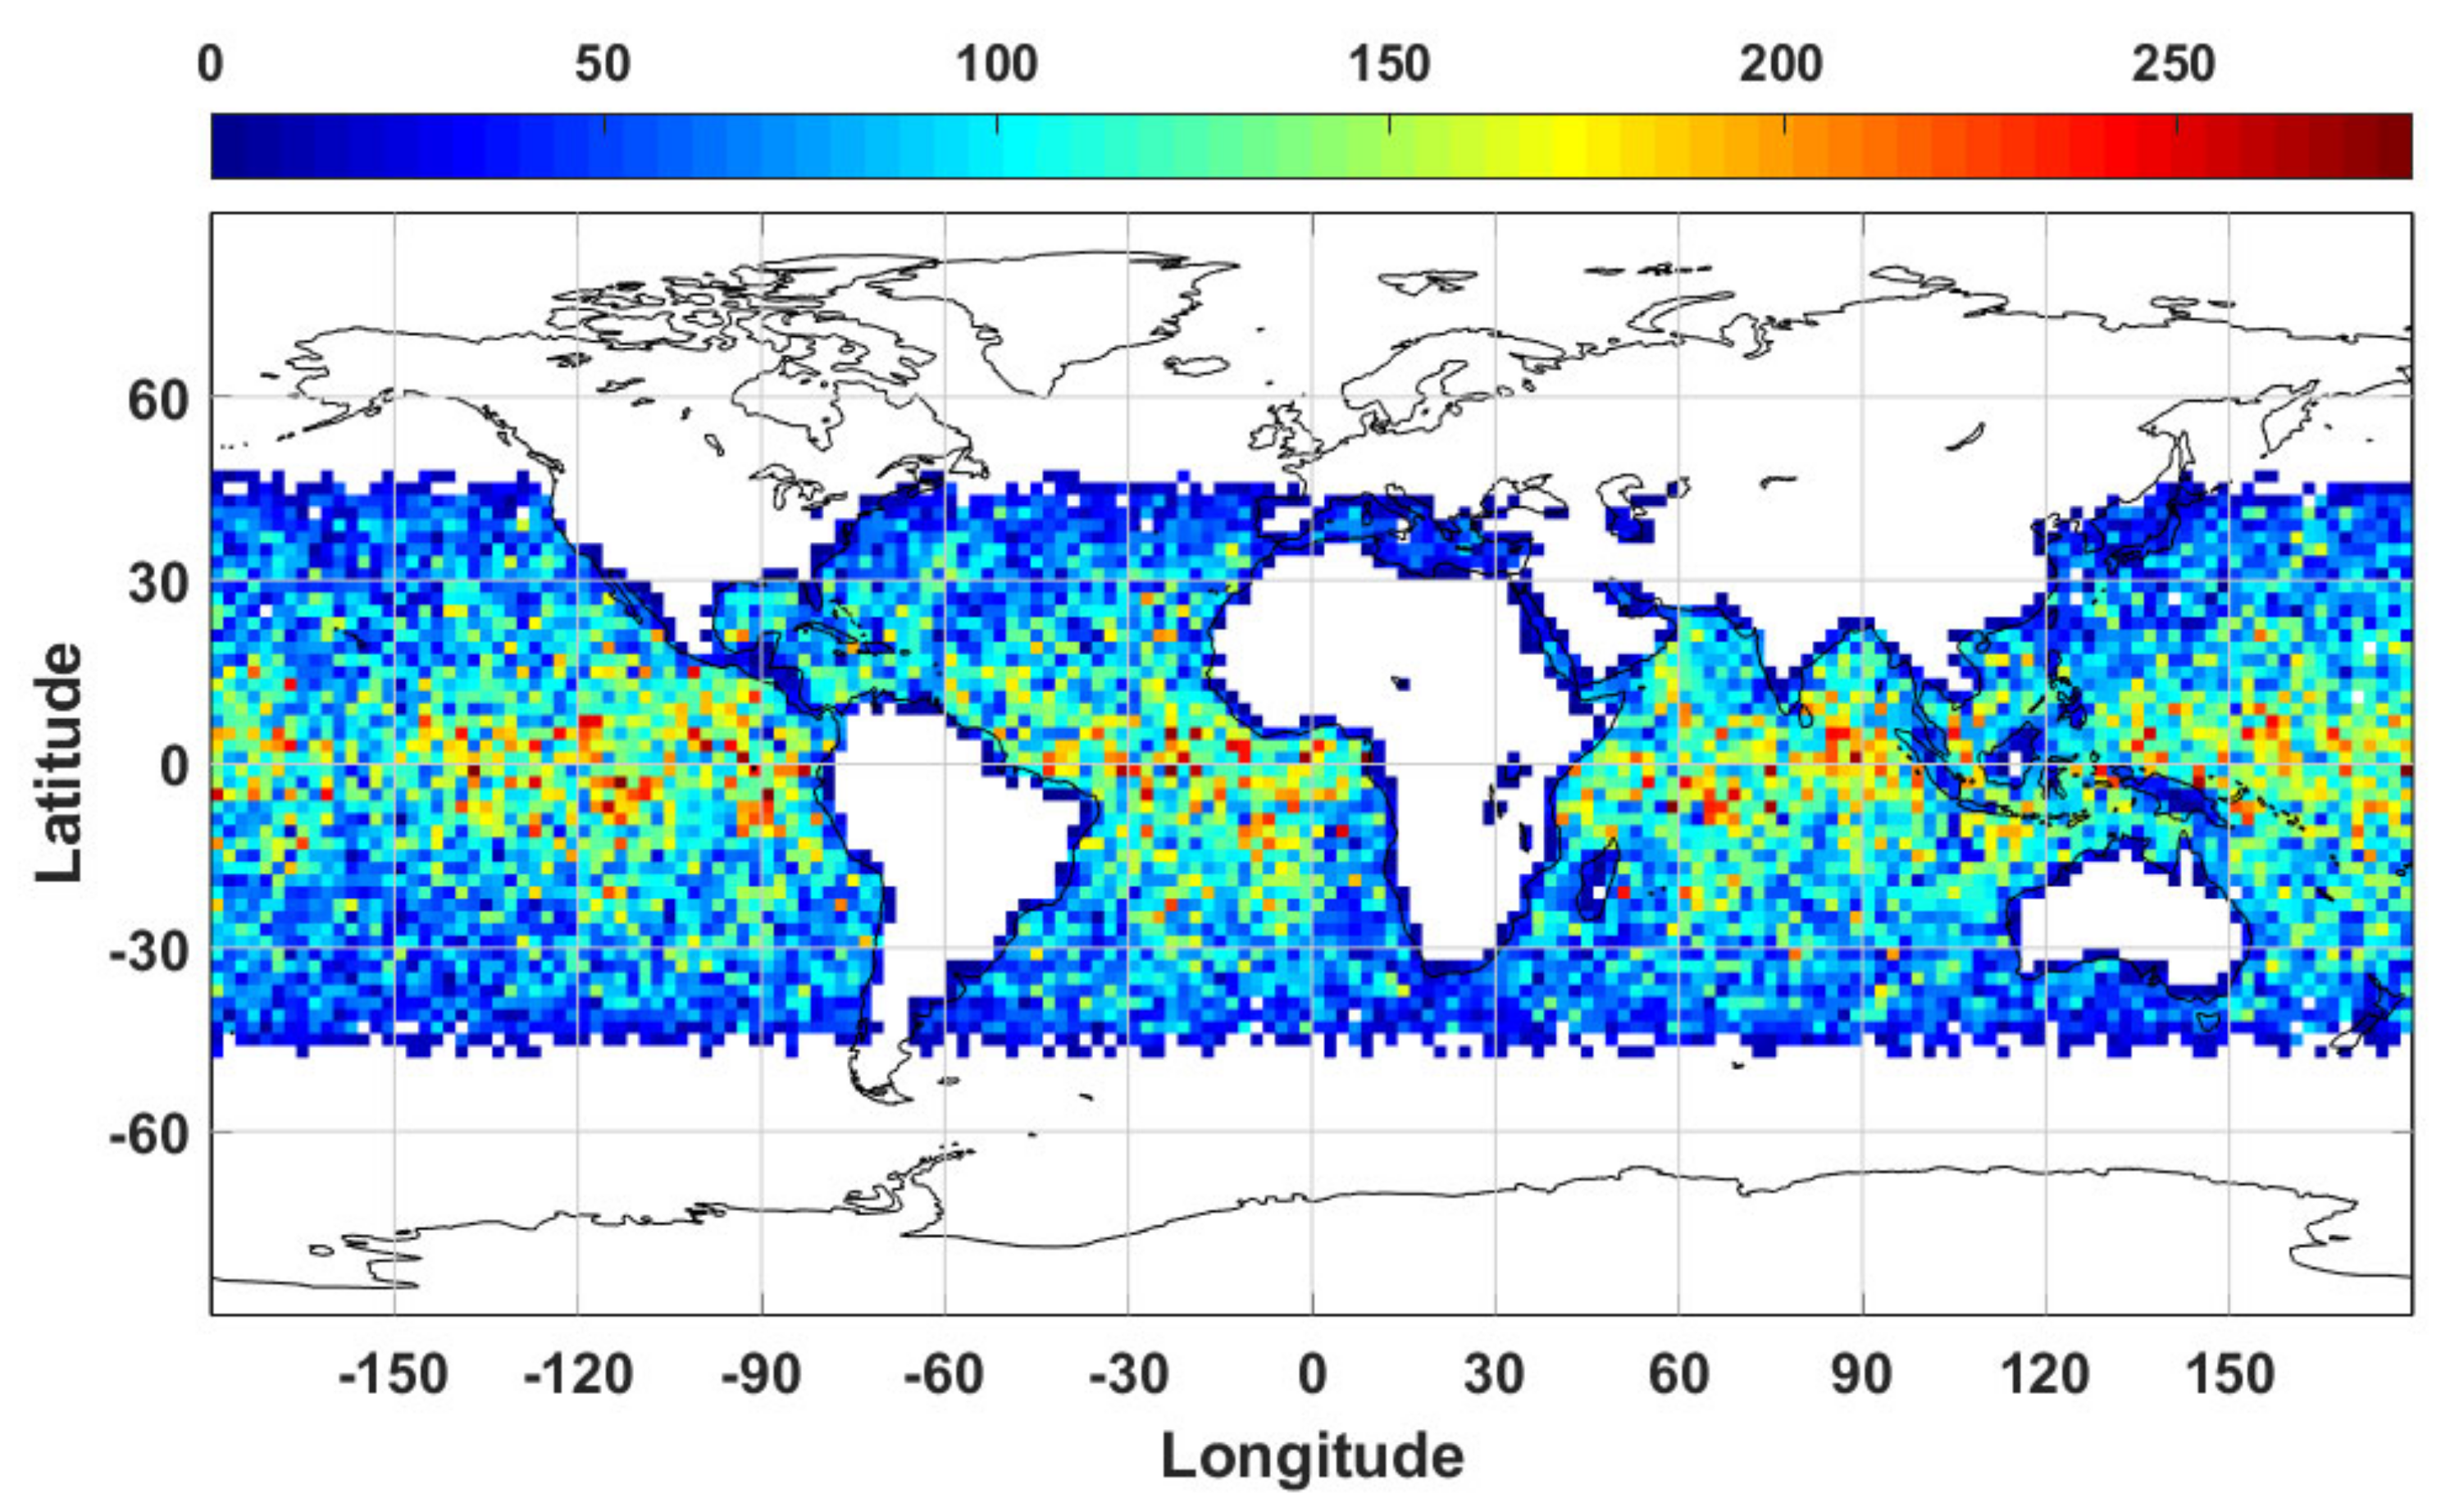
3.3. Collocation and Data Screening Scheme

In the COSMIC-2 vs. SNPP ATMS inter-comparison study, the data associated with the COSMIC-2 RO soundings and the SNPP ATMS measurements must be screened and collocated. In this study, collocated RO and ATMS data are collected, and the areas of interest are confined to be over low to mid-latitude ocean regions equatorward within 48° latitude. The collocation criteria are set with a time difference of no more than 2 h and a spatial distance of less than 150 km. Such matching criteria are used to ensure enough matched collocation cases (~2700 per month) after quality screening for statistical-significant bias and uncertainty analysis. The spatial difference is defined as the difference between the perigee point location of RO profile and SNPP ATMS nadir to minimize the viewing geometry effect of SNPP ATMS. In addition, for COSMIC-2 RO profiles with attribute flags ‘bad’ = 1, ‘L2P’ = 1 or ‘snr2avg’ < 300 v/v are all screened out to ensure consistencies in the RO data quality (personal communication with COSMIC Data Analysis and Archive Center (CDAAC). Figure 3 shows the global distributions of collocations in the 2° × 2° grid between six satellites in the COSMIC-2 constellation and SNPP ATMS over the ocean during the interval from 1 October 2019 to 31 December 2020. In total, there are 2789 matched COSMIC-2 RO profiles with SNPP ATMS for UCAR WETPrf data product in October 2019, and there are 42,315 matched profiles with good quality (after quality screening) for UCAR WETPf2 over ~15 months from 1 October 2019 to 31 December 2020. BT biases over valid scenes each day are combined to derive characteristic daily BT bias (mean), and its uncertainty (standard deviation) for each ATMS channel analyzed. The daily time series of BT biases are further analyzed to evaluate the stability.

4. Results

4.1. Bias and Stability between Simulated BT from COSMIC-2 Retrievals and SNPP ATMS Measurements

In this section, the CRTM-simulated BT data using COSMIC-2 wet temperature and specific humidity profiles from either UCAR WETPrf or WETPf2 data products as inputs have been analyzed and referred to BTCOSMIC-2,WETPrf, and BTCOSMIC-2,WETPf2, respectively. These simulated BT data are compared with SNPP ATMS measurements to derive the BT bias, i.e., ΔBT = BTCOSMIC-2BTATMS, for the ATMS channels of interest, e.g., CH07-14 and CH19–22. Since UCAR WETPrf data are only available over one month during October 2019, the comparison with ATMS BT data is focused on evaluating relative BT bias (ΔBTWETPrf) and associated uncertainty. For UCAR-WETPf2 data, we assess both the long-term consistency and stability between BTCOSMIC-2, WETPf2, and ATMS measurements over the fifteen months from 1 October 2019, to 31 December 2020.
Figure 4 and Figure 5 show the BT bias (ΔBTWETPf2) trending between BTCOSMIC-2,WETPf2, and SNPP ATMS measurements for ATMS CH07–14 and CH19–22, respectively. The change of ΔBTWETPf2 after 15 October 2019, can be identified due to the calibration update of SNPP ATMS on 15 October 2019. Major SNPP ATMS calibration updates were implementations of antenna reflector emission correction algorithm update and antenna pattern correction coefficients update on 15 October 2019. The step changes in Figure 4 and Figure 5 indicate that the COSMIC-2 data’s stability is sensitive enough to capture the calibration update of SNPP ATMS on 15 October 2019.
In Figure 4 and Figure 5, due to a possible code change (personal communication) in the UCAR’s 1DVAR algorithm for NRT Wetpf2 product after 25 September 2020, there are noticeable bias changes after this day (marked with vertical lines), especially noticeable for ATMS CH19–22. The reason for the sudden change of the quality of UCAR Wetprf2 is discussed in [58] and is not further discussed here. Hereafter, we focus on the bias and uncertainty analysis from 15 October 2019, to 20 September 2020, for UCAR WETPf2 data.
To evaluate the variations of relative biases and associated uncertainties between BTCOSMIC-2,WETPf2, and SNPP ATMS measurements, the multi-channel ΔBTWETPf2 time-series data before and after 15 October 2019, as shown in Figure 4 and Figure 5, are processed to calculate the mean bias μBTWETPf2) and associated uncertainty σBTWETPf2). Table 3 summarizes the comparison of mean biases. It can be seen that the SNPP ATMS calibration update implemented on 15 October 2019, effectively reduced the biases between SNPP ATMS measurements and BTCOSMIC-2, WETPf2 for ATMS CH07, and CH10–14. For the humidity sounding channels CH21–22 of ATMS, the biases became larger, which might be related to the significant uncertainties (~1.7 and 2.2 K, respectively) associated with these two ATMS channels. The bias trending results shown in Figure 4 and Figure 5 demonstrate that the GNSS signal retrieval-based COSMIC-2 RO sensor may serve as a reference sensor to detect and monitor the channel bias change and stability variation of microwave sounding sensors due to the calibration updates such as corrections in antenna reflector emission coefficient and antenna pattern, sensor response degradation, and the anomaly or other causes.

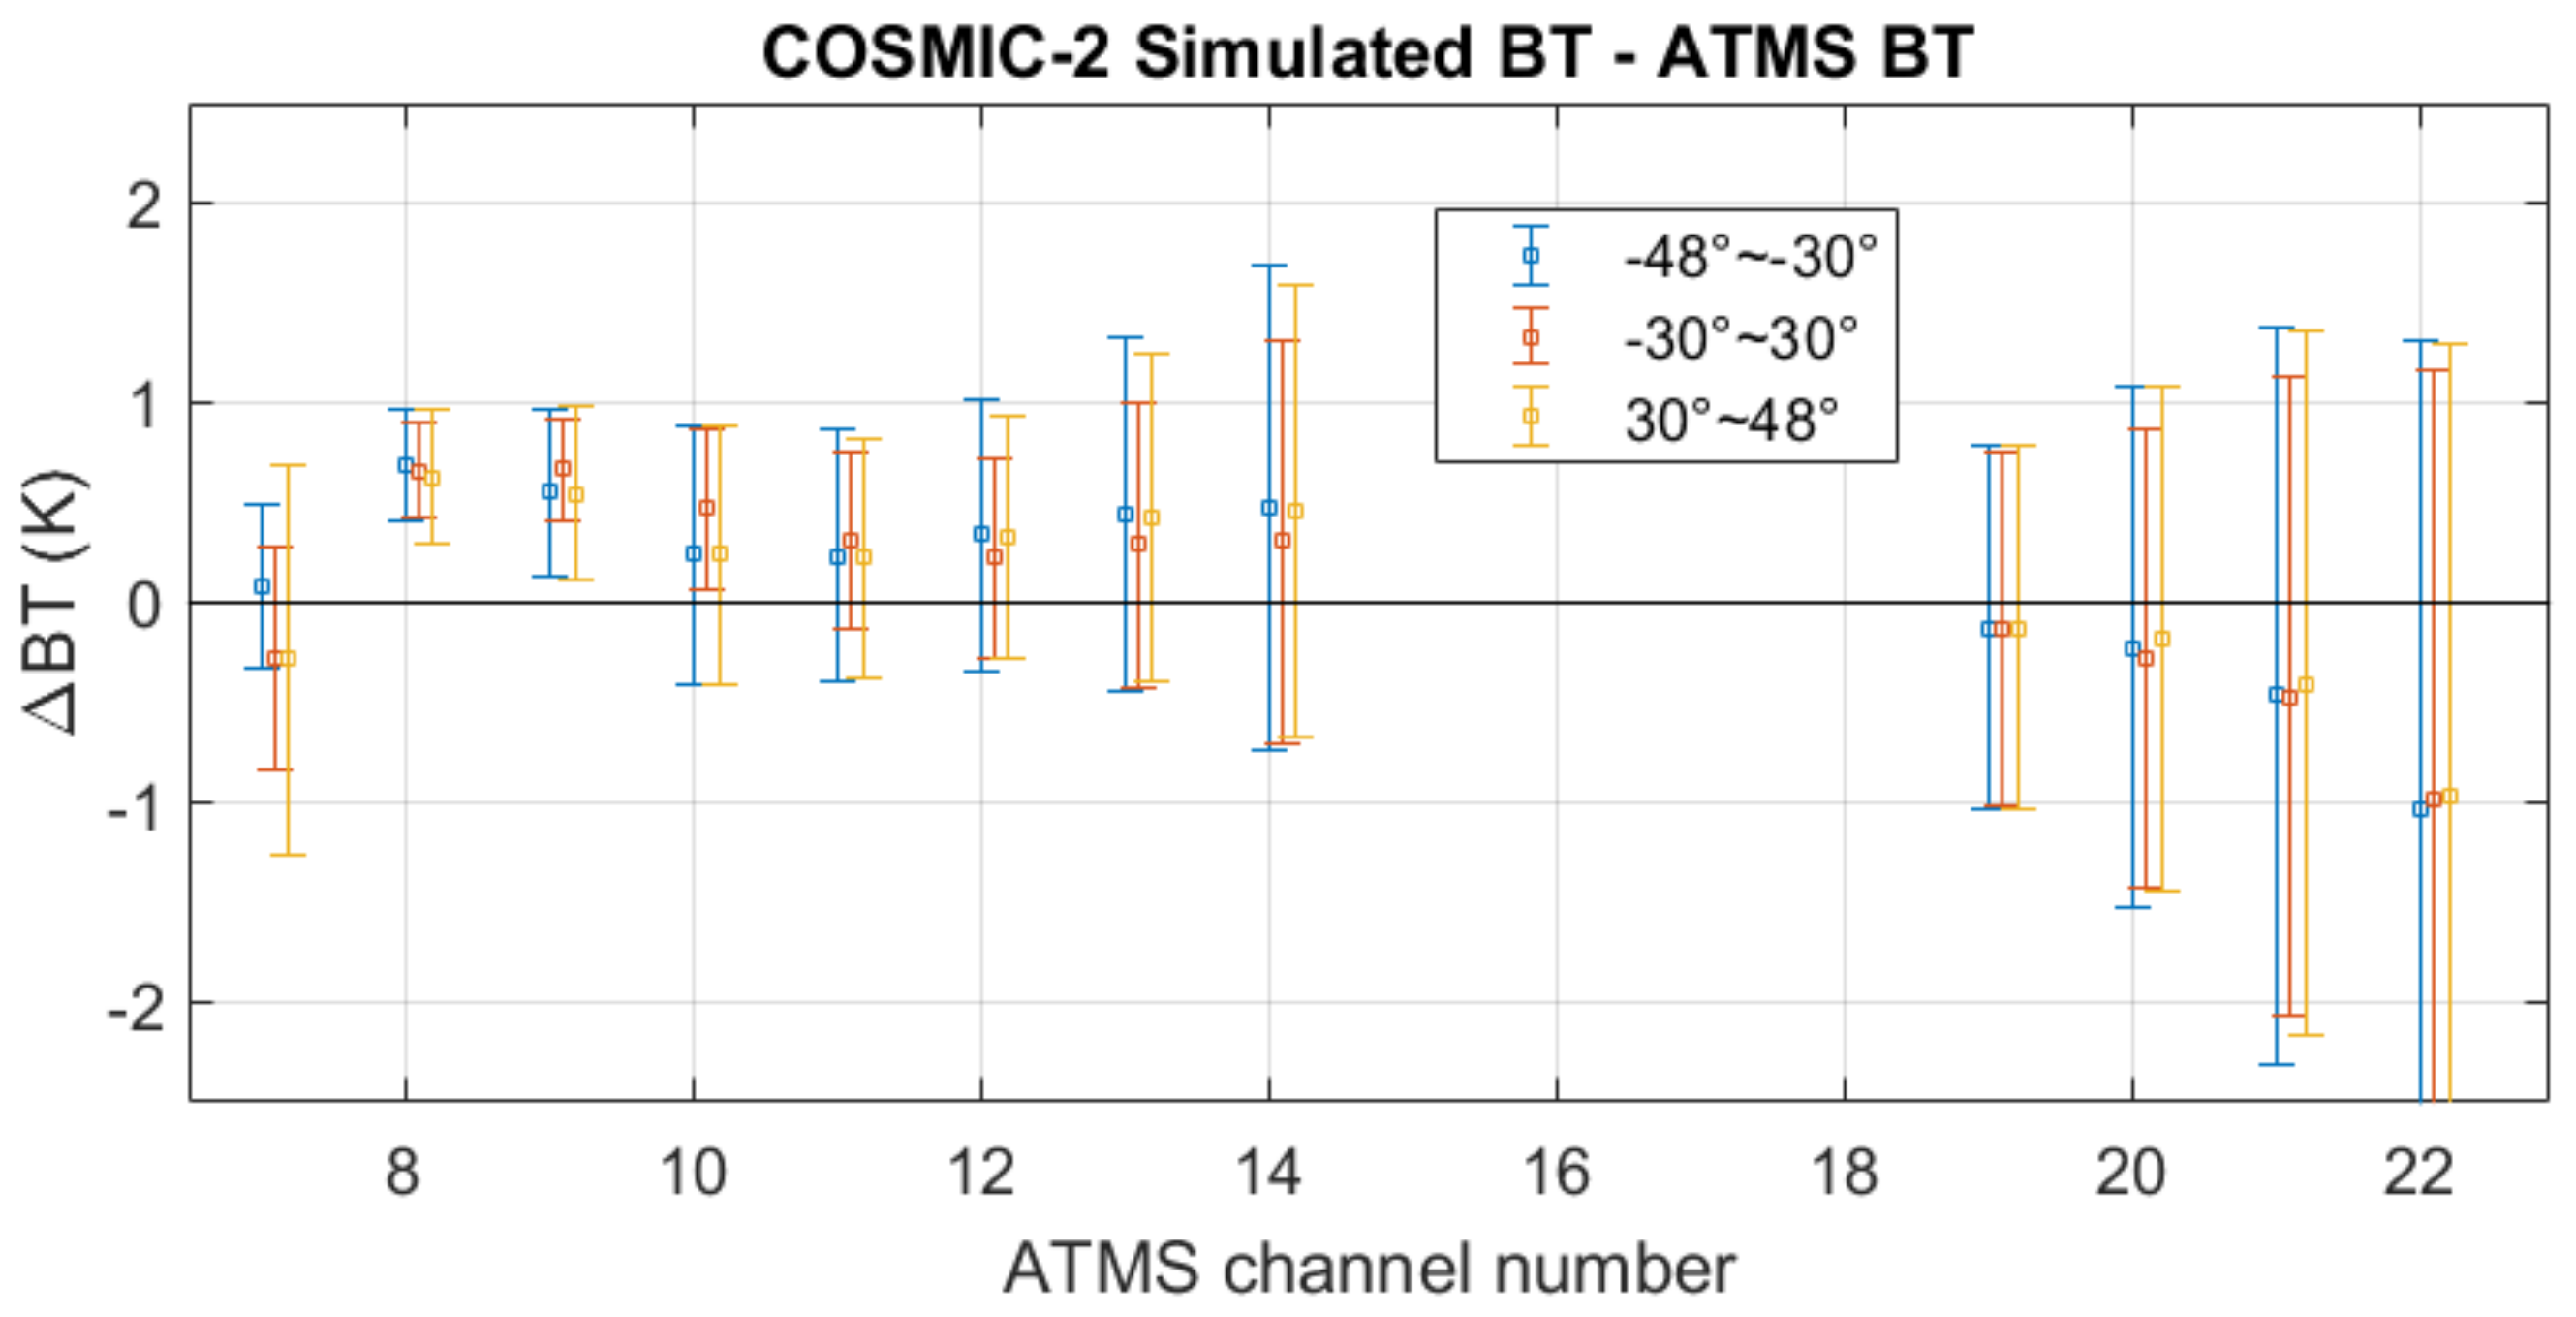
4.1.1. Bias and Uncertainty Analysis

To evaluate the bias and uncertainty of different UCAR 1DVAR retrievals in comparison with SNPP ATMS measurements, the simulated BT from UCAR COSMIC-2 WETPrf and WETPf2 data are compared with ATMS measurements to calculate mean bias μBT) and uncertainties σBT). The resulting μBT) and σBT) for the ATMS channels of interest are summarized in Table 3 and Figure 6. In the comparison of UCAR COSMIC-2 WETPrf, the bias and uncertainty [μBTWETPrf) and σBTWETPrf)] are derived from data collected during 16 October to 31 October 2019. As noted before, due to the update of UCAR’s 1DVAR algorithm for the NRT Wetpf2 product after 25 September 2020, the bias and uncertainty [μBTWETPf2) and σBTWETPf2)] for the comparison of UCAR COSMIC-2 WETPf2 are derived from data collected between 16 October 2019, and 20 September 2020.
In Figure 6a, the mean BT biases of both μBTWETPrf) and μBTWETPf2) are consistent in both magnitude and sign for ATMS CH07–14, CH21, and CH22. In particular, the magnitudes of BT biases for ATMS CH07, CH10–14, CH19, and CH20 are all within 0.4 K for both μBTWETPrf) and μBTWETPf2). The BT biases of ATMS CH08, CH09, and CH22 are consistent of larger magnitude in comparison with other ATMS channels for both μBTWETPrf) and μBTWETPf2). The relatively more significant BT biases of these three channels can be because these channels of ATMS cover a significant portion of the vertical height (below 10 km) impacted by both retrieved temperature and water vapor. The biases in the inputs over this height to the CRTM modeling can dominate the BT biases. On the other hand, the residual BT biases for all of these ATMS channels are stable, as shown in Figure 4 and Figure 5, and in the next section with quantitative stability consistency analysis.
In Figure 6a, the BT biases, μBTWETPrf) and μBTWETPf2), of ATMS CH19 and CH20 with sounding peak heights at 3.18 and 4.27 km, respectively, have an opposite sign. These differences are mainly due to the intrinsic difference in the 1DVAR retrievals of UCAR COSMIC-2 WETPrf and WETPf2, such as different treatments of the open-loop data below 7 km. As introduced in Section 3.2, UCAR WETPf2 employs NCEP GFS analysis data as 1DVAR a priori, different from the ERA5 data used as the initial guess for WETPrf. Other changes implemented in WETPf2 may also contribute to the differences seen in Figure 6a. Figure 7a,b show the temperature and humidity profile biases and uncertainties between COSMIC-2 WETPrf and WETPf2 data in October 2019 through direct comparison. It confirms that while overall temperature and humidity biases are consistent above 7 km between UCAR COSMIC-2 WETPf2 and WETprf data, there are significant biases in temperature and humidity over height regions below 7 km altitude. The most considerable temperature biases between WETPrf and WETPf2 occurred at a height below 2.5 km, with WETPf2 being less than WETPrf. For the ATMS moisture-sounding channels CH19 and CH20, their sounding height coverage varies from near the surface to ~7 km. The integral effects of temperature and humidity biases between WETPrf and WETPf2 can result in the negative μBTWETPf2) vs. positive μBTWETPrf) for these two channels. Such a model-dependent discrepancy in the ATMS troposphere sounding channels needs further investigations, especially on the open-loop data treatment in the 1DVAR retrieval.
It is also found from Figure 6a that μBTWETPf2) of ATMS CH07 and CH19–CH22 with sounding peaks in the troposphere are all negative. Such systematic negative biases may come from the inputs’ biases to the CRTM modeling, such as moisture data from UCAR 1DVAR WETPf2 retrievals in the troposphere. Due to the multi-path propagation of GNSS signals in the troposphere, which is affected by refractions through the atmosphere with moisture, pressure, and temperature profile variations, wave optics algorithm is used to retrieve bending angles near the surface depending on the open-loop model. Previous analysis showed negative bending angle biases near the surface in COSMIC-2 RO data [40]. Due to the height-integration effects of these ATMS troposphere sounding channels, the bending angle’s negative bias can contribute to the μBTWETPf2) biases seen in Figure 6a.
Figure 7c,d further show the comparison of refractivity derived from UCAR WETPrf and WETPf2, e.g., (NWETprf and NWETPf2), with NATMPrf read directly from UCAR ATMPrf data, respectively. UCAR ATMPrf data contains the refractivity data derived directly from the bending angle profile, which entails the RO measurement data before 1DVAR retrieval. As we can see, the 1DVAR retrieval algorithm difference between UCAR WETPrf and WETPf2 exemplifies the fractional refractivity difference compared with the refractivity from UCAR ATMPrf. In particular, the mean bias is consistent between NWETPrf and NATMPrf while NWETPf2 deviates from NATMPrf at a height below 5 km and above 25 km, which can also be observed from our COSMIC-2 vs. ATMS bias analysis. Therefore, differences between UCAR COSMIC-2 WETPrf and WETPf2 can be identified through comparison with ATMS.
Figure 6b shows the comparison of BT bias uncertainties between σBTWETPrf) and σBTWETPf2). Significant reduction of σBTWETPf2) for ATMS CH08-14 can be seen in comparison with σBTWETPrf). In particular, there are more than two times reduction in σBTWETPf2) for ATMS CH12–14 with peak sounding height above 20 km in comparison with σBTWETPrf). For the troposphere sounding channels such as CH19-22 with peak sounding height below 10 km, the magnitudes of BT bias uncertainty is comparable between σBTWETPrf) and σBTWETPf2). For ATMS CH07 to CH11 with peak sounding heights varying from 10 to 20 km in the stratosphere, their BT bias uncertainties are in general less in comparison with those in the troposphere for both σBTWETPrf) and σBTWETPf2). The relatively larger uncertainty in the troposphere sounding channels, e.g., ATMS CH19–22, can be due to the sensitivity of the retrieval algorithm to the moisture troposphere.
The systematic and substantial reduction in the BT bias uncertainty of σBTWETPf2) for ATMS CH07-14 in comparison with σBTWETPrf) can be attributed to the 1DVAR algorithm updates implemented for WETPf2 as mentioned in Section 3.2. In general, the initial guess or a priori from gridded analysis or short-term forecast data plays an essential role in the 1DVAR retrieval process to separate the pressure, temperature, and moisture contributions to refractivity. ERA5 and NCEP GFS model data serve as a priori in retrieving WETPrf and WETPf2 data. Both of them assimilate ATMS and other microwave sounder data. The reduction in the BT bias uncertainty may have contributions from the a priori. In addition, other improvements such as advanced statistical optimization in WETPf2 can also contribute to uncertainty reduction.
In summary, the difference can be attributed to the difference in the location, atmospheric, and a priori-dependence of the 1DVAR model of WETPf2. Therefore, the current analysis could not conclude the exact causes of the uncertainty reduction for ATMS CH08-14. Independent validations such as inter-comparison of COSMIC-2 RO data with in-situ radiosonde measurements [50,58,59] can further help determine or validate the observed uncertainty reduction in UCAR WETPf2 products.

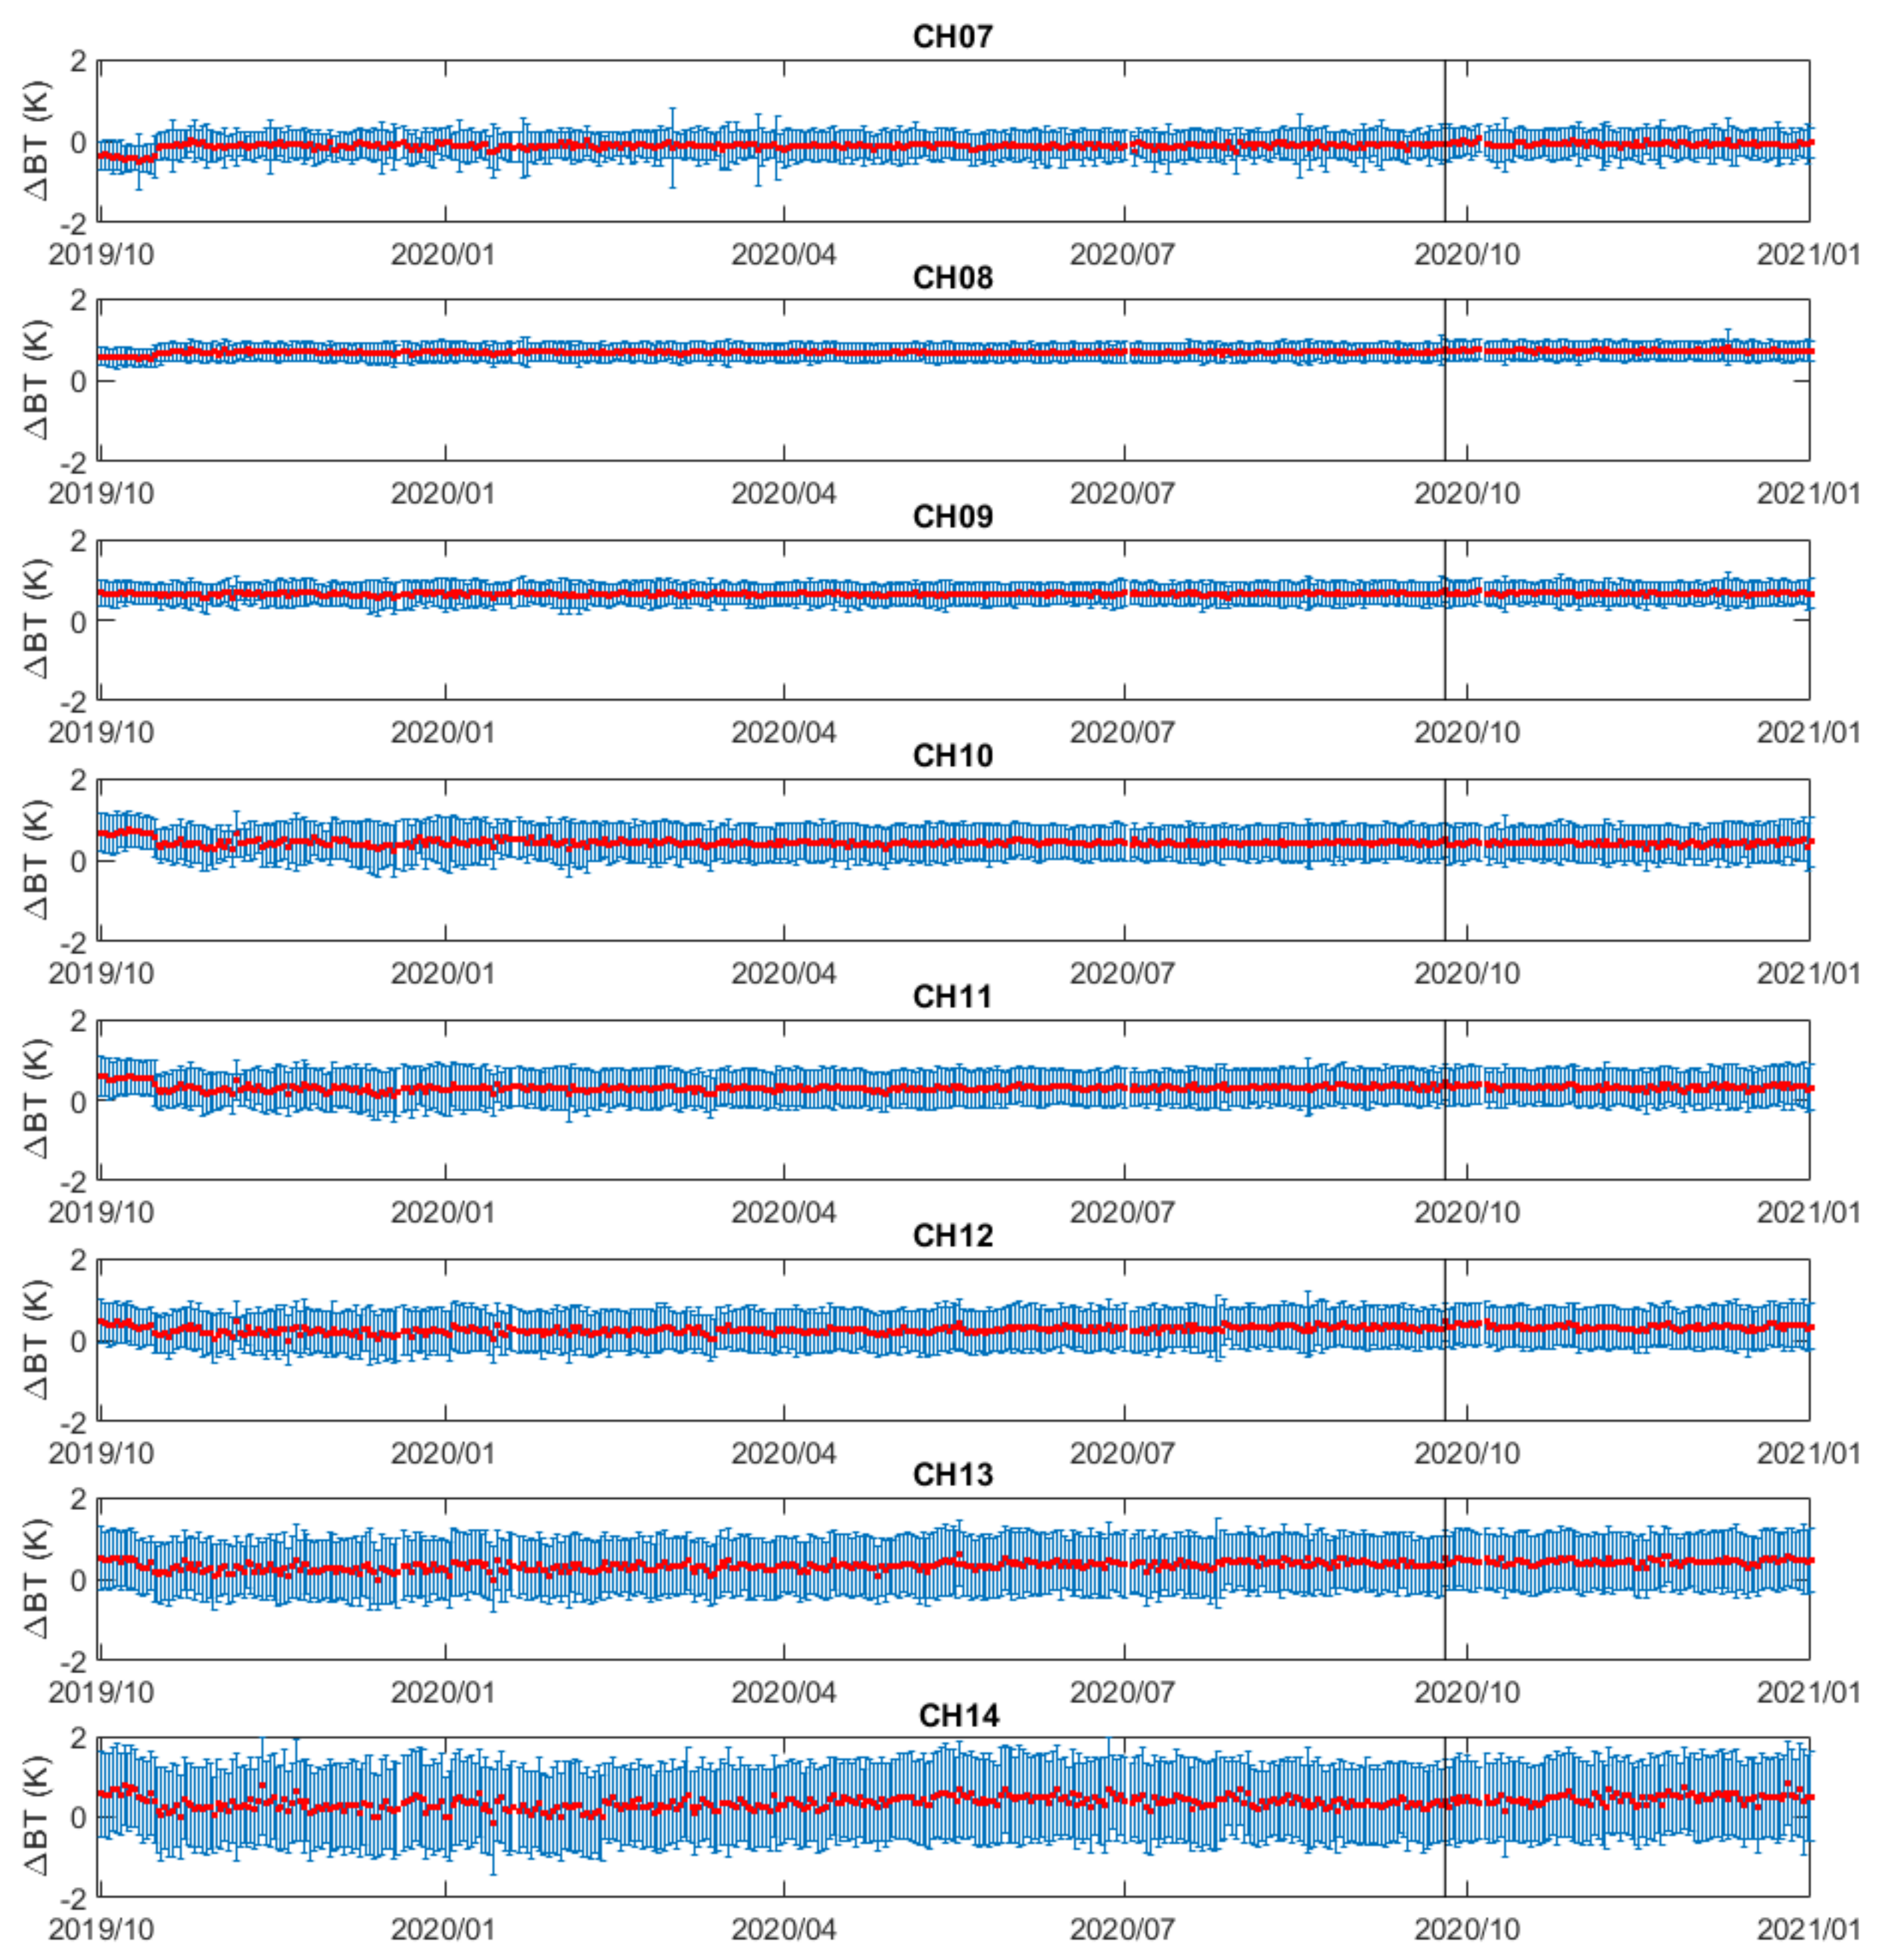
4.1.2. Long-Term Stability Analysis

Figure 4 and Figure 5 show that long-term stability between COSMIC-2 and ATMS are generally maintained after 15 October 2019, for all ATMS channels of interest. To quantitatively evaluate the relative stability between COSMIC-2 and ATMS, the drifts of BT biases shown in Figure 4 and Figure 5 for ATMS channels of interest are calculated by fitting the BT bias data between 16 October 2019 and 20 September 2020 (11 months) with a linear function. The resulting slope DBTWETPf2) is defined as the BT bias’ drift and used as a metric for stability evaluation. The associated 95% confidence interval (CI) of the slope is also calculated. Table 3 and Figure 6c show the drift and associated 95% CI of COSMIC-2 WETPf2 data compared with ATMS through CRTM modeling.
During the 11-month inter-comparison through CRTM, the stability between modeled BT from COSMIC-2 and ATMS measurements is consistent with BT bias drift DBTWETPf2) < 0.02 K/year for ATMS CH07-10 and CH20, and ~0.06 K/year for ATMS CH11 and CH19. This suggests that the CRTM-based BT bias inter-comparison can detect the temperature stability variation of the magnitude ~0.02 K/year for ATMS CH07-10 over the height region below 20 km. In addition, the accuracy and stability of ATMS CH19–20 suggest that the RO data can be used to monitor the stability and calibration updates of these two moisture-sounding channels of ATMS.
The D(ΔBTWETPf2) of the remaining ATMS channels, such as CH13 and CH14 with peak sounding height above 30 km, are 0.19 ± 0.03 and 0.21 ± 0.05 K/year, respectively. This suggests that it is of greater uncertainty to use a short period (<1 year) of COSMIC-2 data to calibrate these ATMS channels with peak sounding height above 30 km. The increase in NEDT for these ATMS channels with high peak sounding heights and the larger collocation horizontal distance due to the RO limb sounding contribute to the uncertainty in D(ΔBTWETPf2) for these two channels.
For ATMS CH07-11, the 95% CI is all within 0.02 K/year. The 95% CI for ATMS CH21-22 is larger than CH07-12, which indicates the trending slope is of more considerable uncertainties. This is mainly due to the moisture sensitivity of ATMS CH21-22, which has a sounding peak height of 5.5–6.6 km in the troposphere. The time-series data analyzed in this paper is over eleven months, which is still relatively short in terms of stability evaluation. Therefore, the trending numbers in Table 3 between ATMS and COSMIC-2 are intended to be only used as references to evaluate the relative stabilities among different ATMS channels. It is noted that a longer period and consistently processed COSMIC-2 data are needed to evaluate the stability more precisely. Nevertheless, this analysis demonstrates that the combination of CRTM simulation and COSMIC-2 RO data enables detecting bias variations in ATMS sounding channels. With multi-year COSMIC-2 and ATMS data being accumulated, the stability evaluation based on COSMIC-2 vs. ATMS BT bias drifts can be more accurate with less uncertainty, especially for ATMS CH12–CH14 and CH21-22. Thus, the GNSS RO observations are an ideal reference standard to monitor the stability variation in microwave sounder measurements.

4.2. Latitude and Solar Zenith Angle-Dependence of COSMIC-2 vs. SNPP ATMS Biases

The six small satellites within the COSMIC-2 constellation maintain a 24-degree orbital inclination angle, and the latitude coverages of their RO measurements vary from the equator to mid-latitude. To study the latitude-dependent difference between CRTM-simulated BTs from UCAR WETPrf and WETPf2 data, we show the scatter plots of ATMS BT vs. BTWETPrf (left column) and ATMS BT vs. BTWETPf2 (right column), respectively, in Figure 8, for selected ATMS channels, e.g., CH08, CH10, CH12, CH13, and CH20. The data are grouped with color-coding into three latitudinal regions: −48° to −30°, −30° to 30°, and 30° to 48° in latitude. There are strong linear correlations for ATMS CH08, CH10, and CH20 compared to ATMS BT and CRTM-simulated BT for COSMIC-2 WETPrf and WETPt2 data. However, for ATMS CH12 and CH13, the correlations between ATMS BT and BTWETPrf (BT from COSMIC-2 WETPrf) in Figure 8e,g are much less linear (more scattered) in comparison with those shown in Figure 8f,h. As shown in Figure 8e,g, the ATMS BT vs. BTWETPrf comparisons over the latitude region −30° to 30° are much larger scattering than those over the southern and northern high latitude regions. The main reason for such difference is that the UCAR WETPf2 model is closer to the background model over height regions of ATMS CH12 and CH13 than the UCAR WETPrf model due to different weighting of the a priori model in the 1DVAR retrieval model construction.
Next, we focus on investigating the latitudinal dependence of ΔBTWETPf2 of UCAR COSMIC-2 WETPf2 data. The ΔBTWETPf2 bias data are collected over three latitude regions covering southern (−48° to −30° latitude) and northern (30° to 48° latitude) mid-latitudes and near equator tropics (−30° to 30° latitude). Figure 9 shows the mean biases and uncertainties of ΔBTWETPf2 calculated over these three latitude regions with the data from 15 October 2019, to 20 September 2020. In general, the simulated COSMIC-2 BT is consistent with ATMS measurements over these three latitude regions by having relative μ(ΔBTWETPf2) within 0.3 K for all ATMS channels of interest. For ATMS CH08, CH09, CH11, and CH19, the differences in μBTWETPf2) among these three latitude regions are within 0.15 K. Figure 10a,b show examples of relatively uniform distributions of ΔBTWETPf2 for ATMS CH08 and CH09, respectively. However, for ATMS CH07, CH10, Ch12, CH13, CH14, and CH20-21, the difference of μBTWETPf2) among three latitude regions is relatively larger (>0.25 K). For example, such remnant latitude-dependent biases can be seen in Figure 10c,d for ATMS CH10 and CH12, respectively. In Figure 10c, the ΔBTWETPf2 is generally smaller in the southern and northern mid-latitude regions than in the equatorial region for ATMS CH10. Figure 10d shows that the ΔBTWETPf2 of ATMS CH12 over the north of the mid-latitude region is more significant than those in the equator and southern mid-latitude areas. Figure 9 also shows that all three latitudinal regions have increasing uncertainties in ΔBTWETPf2 as ATMS channels vary from CH12 to CH14 and CH19 to CH22.
In [44], it was found that BT biases in the lower stratosphere between the simulated-BT from COSMIC-1 data and AMSU microwave sounder BT measurements have local time dependences. Since COSMIC-1 data do not contain orbit drift errors and are not affected by on-orbit heating and cooling of the satellite component, they can be used to identify the AMSU time/location-dependent biases for different NOAA missions. In this study, we further investigate the solar zenith angle (SZA) dependence of ΔBTWETPf2. Since the SNPP satellite is a Sun-synchronous satellite and COSMIC-2 has an orbital inclination angle of 24°, the colocations between COSMIC-2 and ATMS occur mainly around the equator with SZA < 50 (day) or SZA >130° (night) and over the day-night terminator region at higher latitudes. It is shown in Figure 11 that the SZA-dependences of ΔBTWETPf2 are pretty weak for ATMS CH08 and CH09. However, for ATMS CH10 and CH12, there is a trend in BT biases (ΔBTWETPf2) as the SZA varies to deviate from the nominal bias value when the SZA approaches 90 degrees, i.e., near the terminator region. This explains the latitude-dependent ΔBTWETPf2 seen in Figure 10c,d. As studied in [44], the channel and SZA-dependent BT biases might be related to the solar irradiation on microwave sounders and lower stratosphere near the day-night terminator transition region.

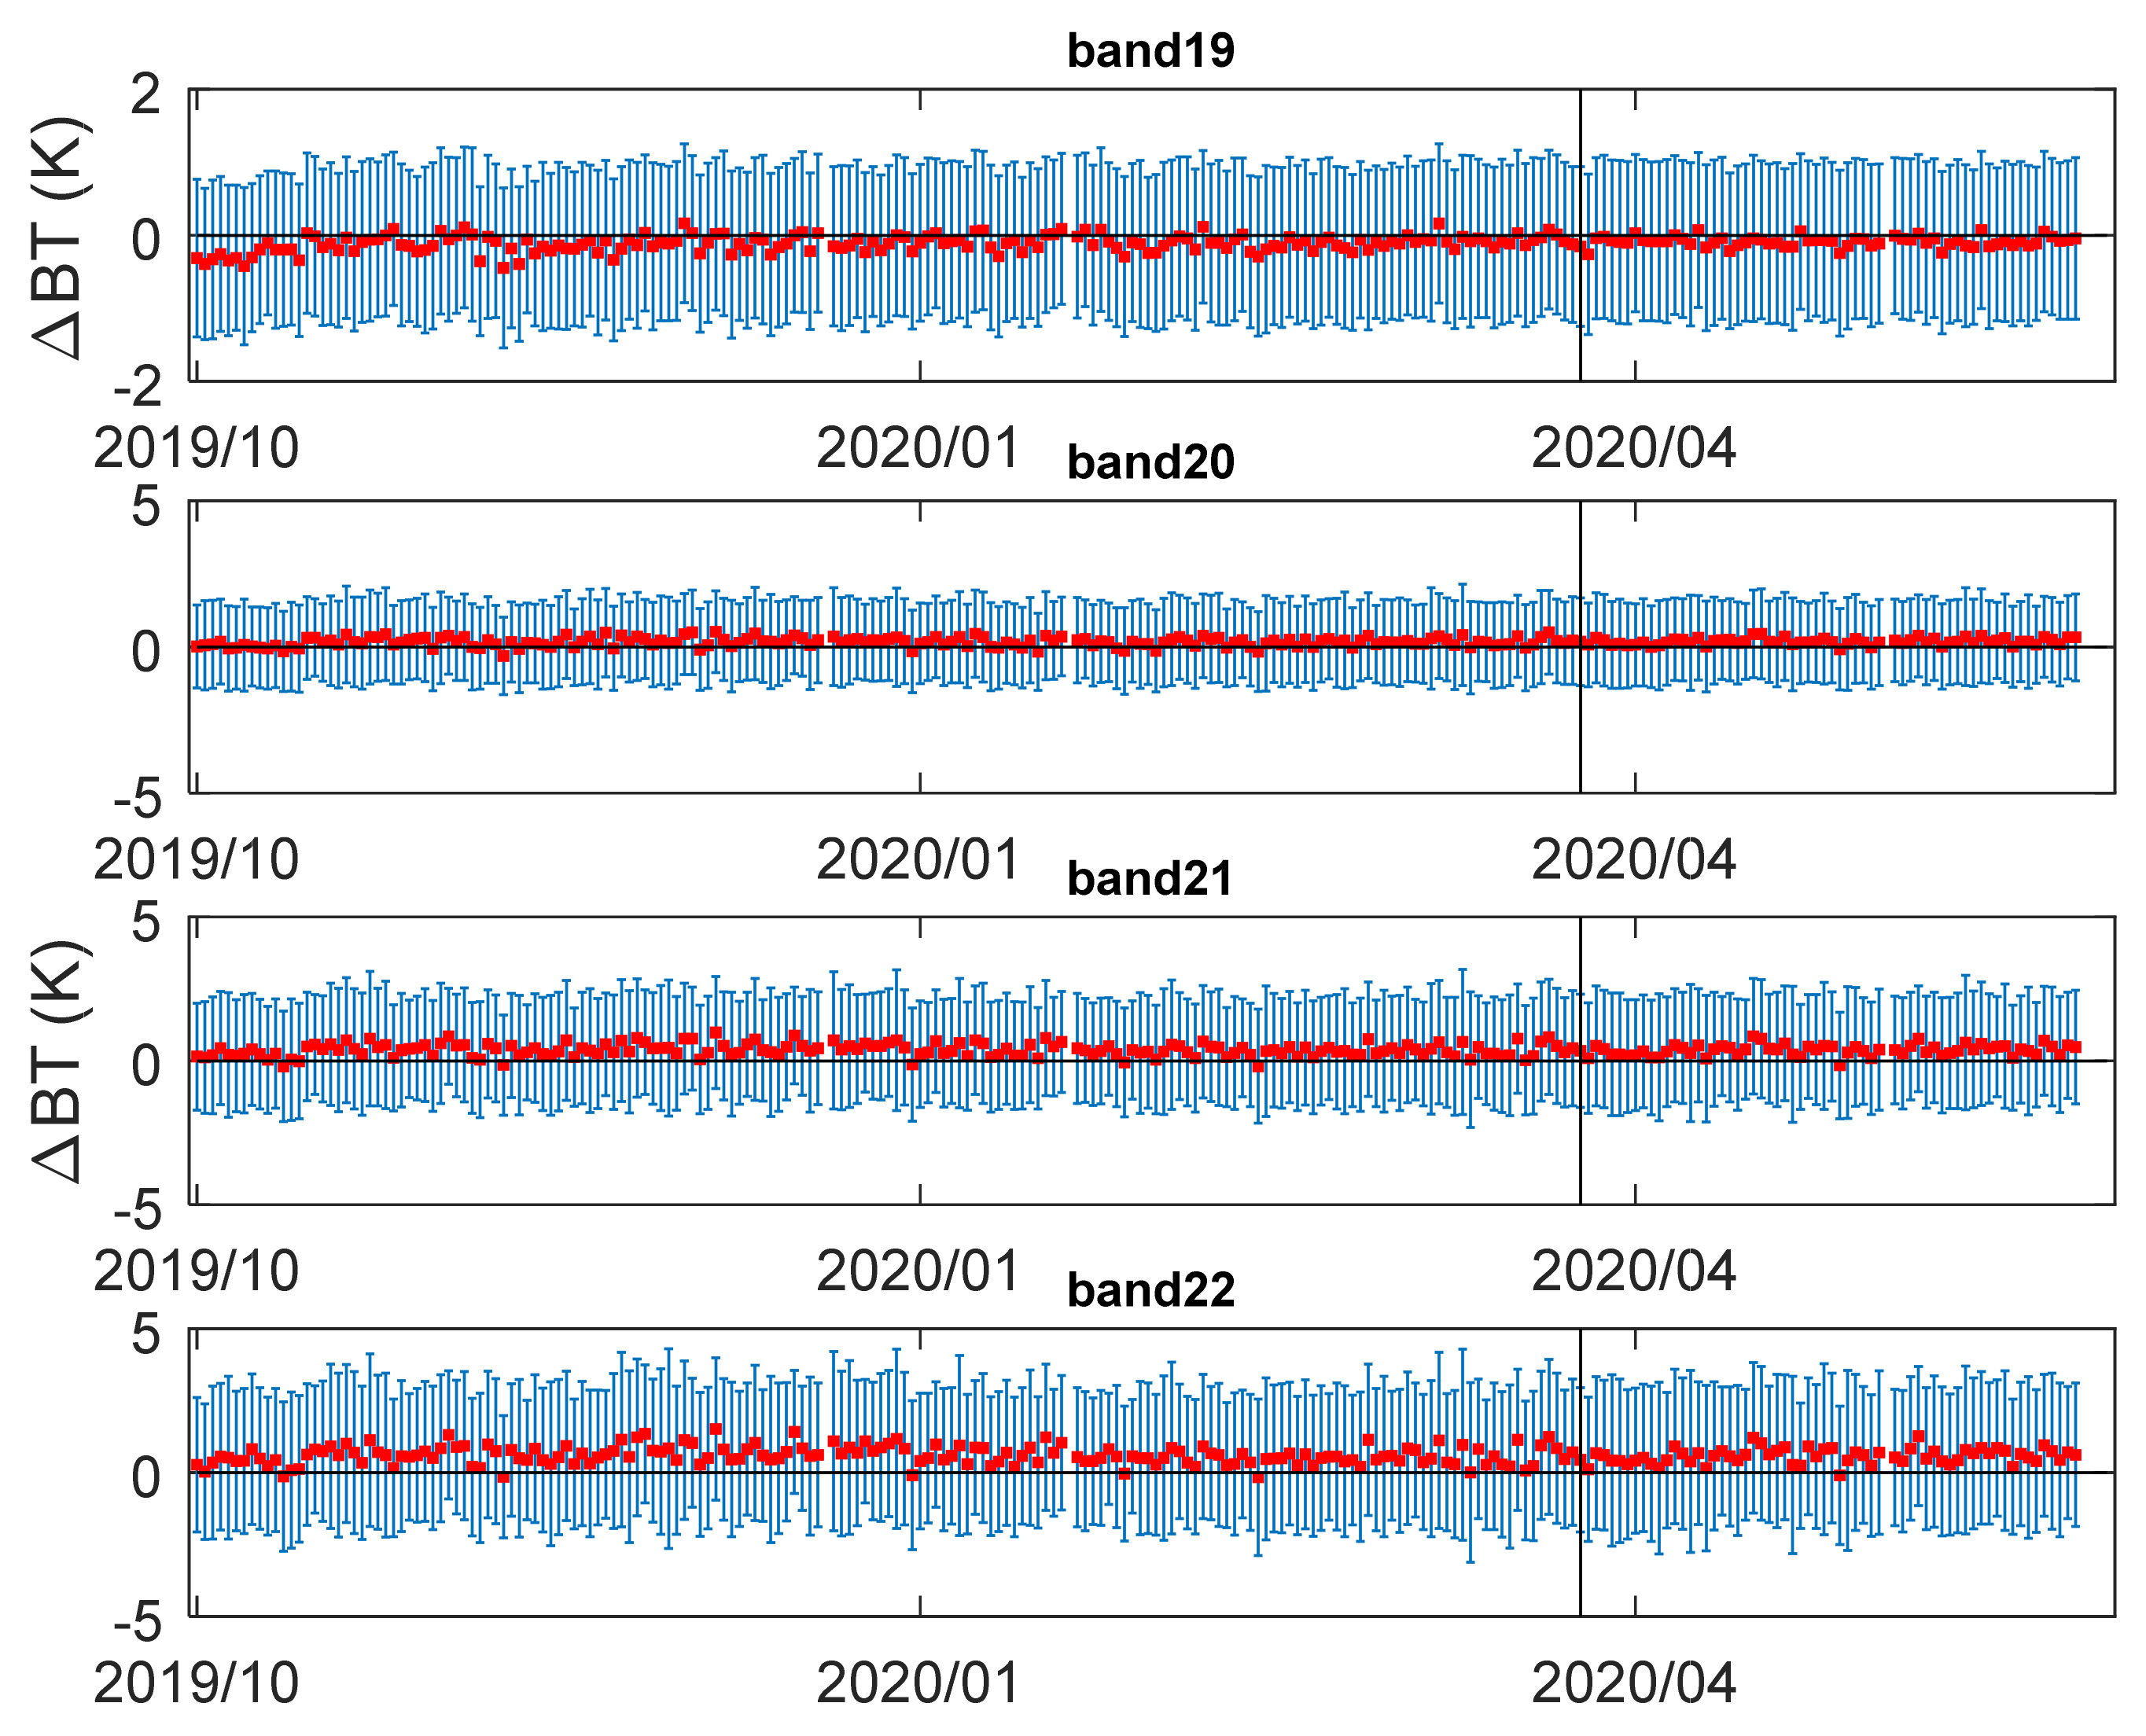
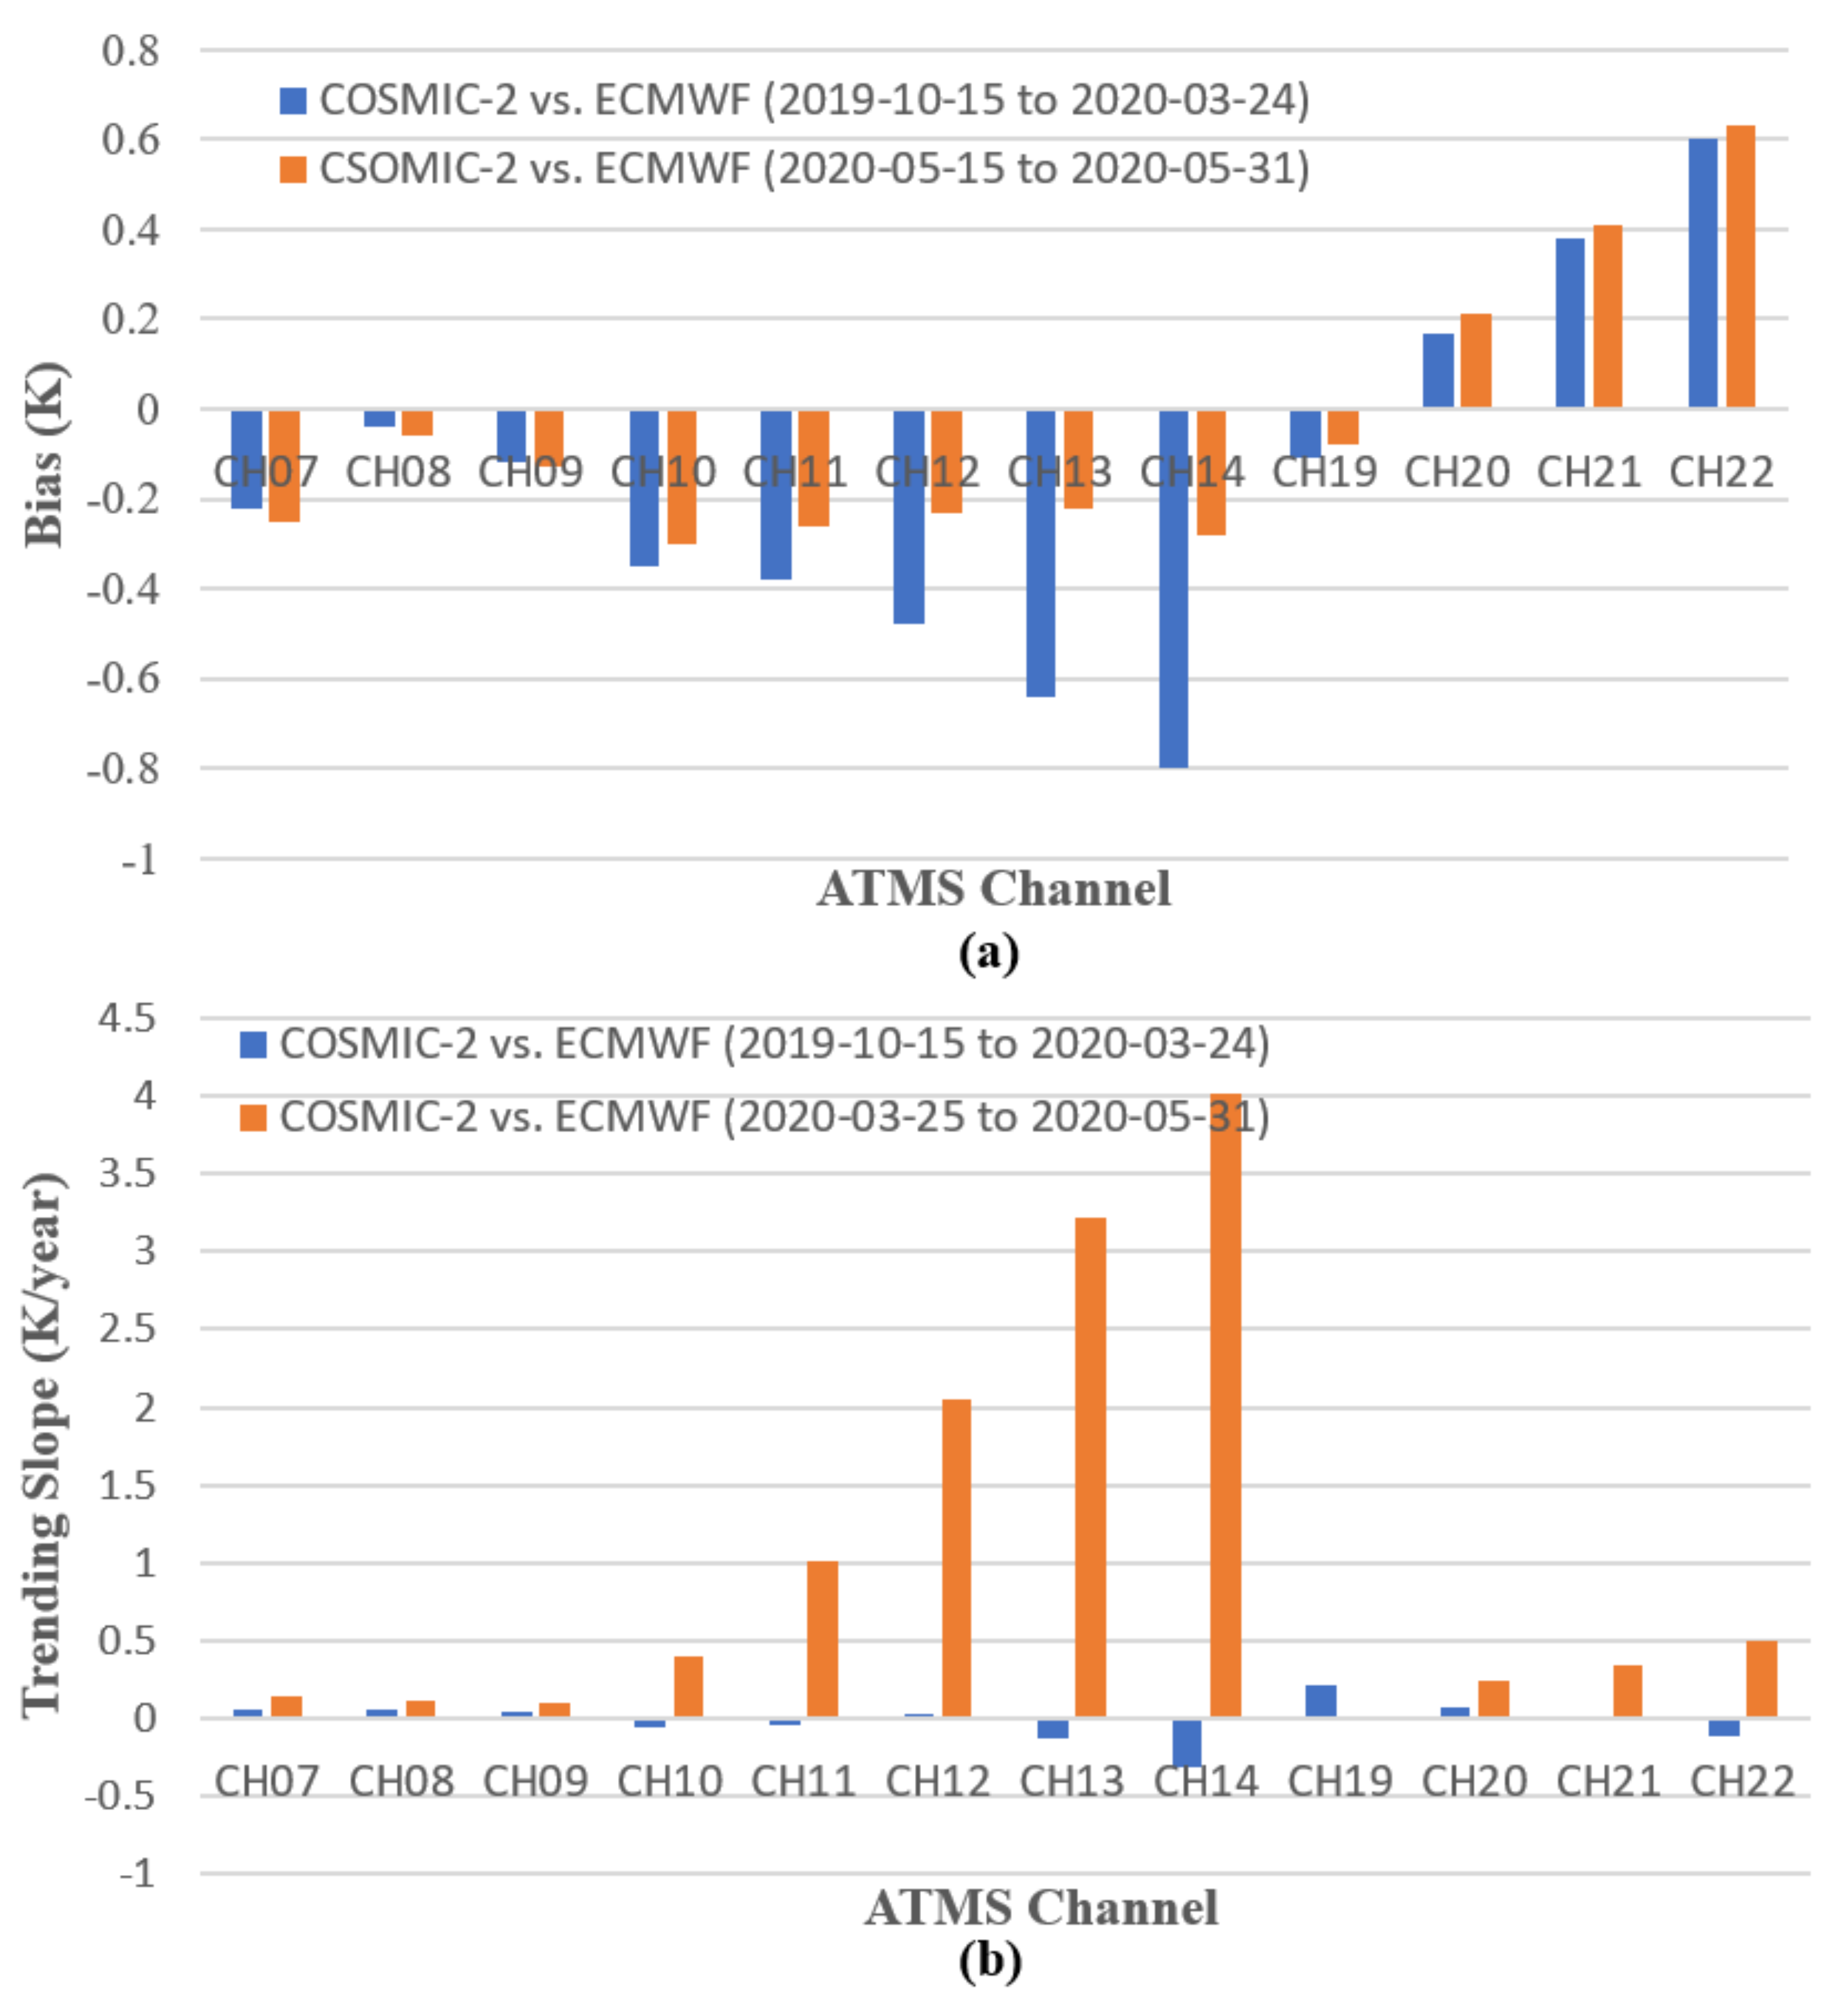
4.3. O-B Bias Trending between COSMIC-2 and ECMWF via ATMS

Healy [52] reported that ECMWF evaluated the impacts of COSMIC-2 by assimilating the COSMIC-2 data for the period from 28 September 2019, to March 2020. It was found that the assimilation produced statistically significant impacts for this period on both short-range and medium-range forecast scores. For the short-range forecast, improvements appear in various aspects, such as reducing standard deviations of the O-B departures down to the 700 hPa level and consistent impacts on the forecast fit to a range of observing systems that are sensitive to tropospheric water vapor. Regarding medium-range forecast, improvements are obtained to forecast tropical stratospheric zonal winds with a statistical significance of 10 days and reduce global stratospheric geopotential height and temperature biases. These positive impacts of COSMIC-2 lead to the operational implementation of assimilating COSMIC-2 RO data into ECMWF on 25 March 2020. Therefore, it is interesting to investigate the variation of the O-B bias trend between COSMIC-2 and ECMWF before and after the assimilation of COSMIC-2 RO data into ECMWF.
In this section, the trending of O-B biases between COSMIC-2 and ECMWF for ATMS channels are evaluated. To derive the O-B bias trend between COSMIC-2 and ECMWF, the CRTM-simulated BTECMWF from ECMWF data are first calculated for ATMS channels of interest. Then, the BT biases ΔBTECMWF = BTECMWFBTATMS are calculated and compared with ΔBTWETPf2 trending to derive O-B biases (ΔBTC2-ECMWF) between COSMIC-2 and ECMWF using the doubled-difference method. In this analysis, the ECMWF is not interpolated onto C2 locations and time. Figure 12 and Figure 13 show the ΔBTC2-ECMWF trending from 1 October 2019 to 31 May 2020 for ATMS CH07–14 and CH19–22, respectively. While the O-B BT bias trends are stable before 25 March 2020, Figure 12 clearly shows the trending up of the O-B biases and approaches the zero line over the two months afterward for most ATMS channels with particularly identifiable channels ATMS CH10–CH14. At the end of May 2020, the O-B bias trending variations for these channels are stabilized. The temporal variations of O-B biases after 25 March 2020, reveal the impacts of assimilating COSMIC-2 RO data into the ECMWF reanalysis data.
To quantitatively evaluate the O-B bias variation before and after the assimilation of COSMIC-2 RO data, mean O-B BT biases μBTC2-ECMWF) and uncertainties σBTC2-ECMWF) during 15 October 2019 to 24 March 2020 and 15 May 2020 to 31 May 2020 intervals are calculated. Moreover, the trending slopes DBTC2-ECMWF) over 15 October 2019 to 24 March 2020 and 25 March 2020 to 31 May 2020 intervals are estimated to characterize the impact on the O-B bias trending variation. The results are summarized in Table 4 and Figure 14.
In Figure 14, a significant reduction in absolute O-B BT biases after the assimilation of COSMIC-2 data into ECMWF on 25 March 2020, can be identified for ATMS CH10 to CH14 and CH19. In particular, the reduction in O-B biases is more than half for ATMS CH12–14. The reductions in O-B biases for these channels are realized by increasing the trending slopes after 25 March 2020, as shown in Figure 14b. It takes about one and a half months for the O-B biases to be stabilized. At the end of May 2020, the O-B biases for ATMS CH07–CH14 and CH19–20 are all within 0.3 K. The reduction of biases after 25 March 2020, confirms the conclusions made by Healy [52] that the assimilation of COSMIC-2 data into ECMWF has statistically significant positive impacts by improving consistency with the data from other observing systems that are used in the ECMWF reanalysis.
Comparing the drift values of DBTWETPf2) and DBTC2-ECMWF) listed in Table 3 and Table 4, respectively, the O-B bias stability between COSMIC-2 and ECMWF reanalysis data during 15 October 2019 to 24 March 2020 interval, in general, agrees with those derived from the COSMIC-2 WETPf2 vs. ATMS comparison for ATMS channels of interest. In terms of BT biases, the O-B biases μBTC2-ECMWF) of ATMS CH08 and CH09 are much smaller than the μBTWETPf2) listed in Table 3.

5. Discussion

5.1. Using More RO Soundings for ATMS Bias Detection

Past studies on inter-comparison of SNPP ATMS measurements demonstrate the feasibility of using high-quality COSMIC-1 RO data to calibrate the measurements of ATMS sensors. Zou et al. [48] estimated the absolute accuracy of SNPP ATMS TDR data using COSMIC-1 RO data as input to the CRTM simulation. They demonstrated the absolute calibration of ATMS upper-level sounding channels. In [16], SNPP ATMS SDR measurements’ biases to the CRTM simulations are generally less than 0.5 K for ATMS CH06-13. In a recent study of [47], COSMIC-1 GPS-RO soundings over the ocean were used as inputs to the CRTM to generate CRTM-simulated BT data for AMSU-A onboard NOAA-18 NOAA-19, MetOp-A, MetOp-B, and ATMS onboard SNPP and NOAA-20. Monthly BT bias statistics for each instrument are studied to evaluate the TDR stability among different microwave sounders. In recent years, only one COSMIC-1 (E6) instrument was functioning to produce up to about 250 daily soundings, limiting the analysis to monthly BT bias statistics.
This study demonstrated that the increased number of RO profiles provided by the COSMIC-2 constellation enables the daily trending of COSMIC-2 vs. ATMS biases. It is shown that the mean BT biases between SNPP ATMS and CRTM-simulated BT from UCAR COSMIC-2 WETPrf and WETPf2 products are all within 0.70 K for ATMS CH07-14 and CH19–21. The mean BT biases between SNPP ATMS and CRTM-simulated BT are within 0.4 K for ATMS CH07, CH10–14, CH19, and CH20. It is also noted that the inter-comparison of ATMS moisture-sounding channels (CH19–22) was not evaluated in earlier studies. The residual biases can be due to several factors.
(1) SNPP ATMS BT data errors
The sources of SNPP ATMS BT data error mainly come from radiometric calibrations such as cold and hot calibrations, nonlinearity in the transfer function and drifts [60], and associated updates and anomalies. The error in ATMS cold calibration for offset determination comes from the Rayleigh approximation used for cold space radiation and the interception of the antenna sidelobe with the Earth and the spacecraft, which can be affected by solar irradiation. The primary error sources for the hot calibration are the bias and uncertainty in the calibration target emissivity, physical target temperature measurement uncertainties, thermal nonuniformity within the target, and radiometric leakage when viewing the target.
(2) Biases and uncertainties of RO data retrievals
Although RO raw data are traceable to a unit of time, the derived environmental variables such as temperature and water vapor are not. This paper showed that different implementations of retrieval algorithms such as UCAR COSMIC-2 WETPrf and WETPf2 to convert COSMIC-2 RO refractivity to temperature and moisture profiles would affect the values of simulated ATMS channel BTs from the RO data and result in differences in the bias and uncertainty characteristics. It is also shown that the BT biases for ATMS CH07 and CH19–CH22 (moisture-sensitive channels) might come from the negative moisture biases below 5 km in the 1DVAR RO retrieval due to super-refraction [58].
(3) Biases/uncertainties of CRTM simulation
The residual biases and uncertainties of CRTM simulation can be due to several factors:
i)
the CRTM forward model is a fast-radiative transfer model with a regression method based on line-by-line simulation with representative training profiles. Its simulation coefficient uncertainty under clear sky conditions come from the gaseous absorption model and training data;
ii)
surface emissivity model and surface temperature used for the simulation for surface-sensitive channels;
iii)
clear sky condition assumption for cloud sensitive channels (the comparison results may include cloudy sky);
iv)
input atmospheric profiles such as the temperature and water vapor profiles from the RO retrieval.
v)
For channels with sounding height at high altitude >35 km, the microwave absorption line shift due to the Zeeman effect was not considered in the CRTM simulation.
(4) Uncertainties due to data collocation or sampling
In this paper, the target of interest was chosen over the ocean to ensure the uniformity of the target, which results in the daily collocation sample number less than 100 per day. The ERA5 reanalysis data used for simulation are sampled at 0.5 degrees (~50 km), while ATMS data are sampled at nadir footprint sizes of 31.6 km for CH07–14 and 15.8 km for CH19–22, respectively. These limiting factors in data collocation number and spatial resampling can add to uncertainty in the BT bias analysis and trending.

5.2. Uncertainty of Climate Monitoring Using RO Wet Profiles

This study also shows that the long-term stability between UCAR COSMIC-2 WETPf2 data and ATMS measurements are well maintained for ATMS CH07–CH10 with the BT bias drifts DBTWETPf2) < 0.02 K/year. For ATMS CH19–CH21, the BT bias drifts DBTWETPf2) are <0.06 K/year, which suggests that RO data can be used to monitor the stability and calibration updates of these two moisture sounding channels ATMS. The time-series data analyzed in this paper is over eleven months, which is still relatively short in terms of stability evaluation. The BT bias drifts are expected to be more accurate with less uncertainty (especially for ATMS CH12–CH14 and CH21–22) with multi-year time series data. Nevertheless, this paper shows that the well-sustained stability of GNSS RO observations makes themselves an ideal reference standard to monitor the stability variation in microwave sounder measurements.
Comparing the two versions of UCAR COSMIC-2 wet profile products, e.g., WETPrf and WETPf2 [53], shows that different 1DVAR models can result in different bias and uncertainty statistics. It is demonstrated that BT biases of ATMS CH19–20 have opposite signs between WETPrf and WETPf2, and there are significant reductions in BT bias uncertainty for ATMS CH07–14 in the UCAR WETPf2. These differences can be traced to different a priori models used and other updates in the 1DVAR retrieval algorithm of the WETPf2 model [53]. It is noted that the UCAR COSMIC-2 WETPrf data is close to the direct retrieval of temperature, i.e., dry temperature, from COSMIC-2 bending angle/refractivity data and is less affected by the a priori reanalysis model used in the 1DVAR retrieval in comparison with the UCAR WETPf2 data. Furthermore, this study shows that the CRTM-based COSMIC-2 RO vs. ATMS inter-comparison enables evaluating the bias and uncertainty characteristics in RO 1DVAR retrievals.
In [50], COSMIC-2 RO data’s latitudinal consistency is evaluated and confirmed through inter-comparison of COSMIC-2 RO with collocated radiosonde refractivity data from June to October 2019. This study demonstrates the latitudinal consistency between COSMIC-2 and ATMS with a BT bias difference <0.3 K over three latitudinal regions. This paper further shows the SZA-dependence of the remnant BT biases between COSMIC-2 and ATMS for the lower stratosphere sounding channels of ATMS.
In Figure 6 and Table 3, it is shown that ATMS low-troposphere channels (CH07 and CH19–CH22) all have negative BT biases (μBTWETPf2)). Such systematic negative biases can come from several sources, such as the inputs, e.g., COSMIC-2 WETPf2 moisture and temperature data in the low troposphere region, to the CRTM modeling, simulation coefficients in CRTM ATMS, and ATMS near-surface sounding measurements. For CRTM, the modeling coefficients are first optimally trained in the least-square sense with the line-by-Line radiative transfer model and then fed into CRTM. The resulting uncertainty in the CRTM coefficients may play some role in the bias uncertainty. The analysis in [50] showed negative moisture biases below 5 km for COSMIC-2 RO retrievals than radiosonde data due to super-refraction, suggesting that the BT biases for ATMS CH07 and CH19–CH22 might come from the 1DVAR retrieval of moisture-rich low-troposphere profiles.
Further investigations through inter-comparison of COSMIC-2 RO data with radiosonde measurements can help evaluate these biases. To adequately address the negative moisture biases in RO retrieval, super-refraction or ducting will require improvements in the 1DVAR retrieval algorithm by possibly incorporating the reconstruction method introduced in [61,62]. In addition, the simultaneous radio occultation (SRO) method developed in [63,64] can help compare temporally and spatially matched individual profiles measured by different RO sensors. In the SRO method, the time difference between RO data can be restricted to be within 10 min, which helps evaluate the quality of RO data through the quantitative comparison of matched profiles.

5.3. Using RO Data for Reanalysis

Healy [52] indicates the positive impacts of COSMIC-2 RO data on short- and medium-range weather forecasts. In a previous study [65], the global mean biases, i.e., O-B global mean biases, between COSMIC and reanalysis model data over 8 and 30 km height range are estimated to be about 0.65K. This study shows the reductions of O-B biases after assimilating COSMIC-2 data into ECMWF and that the O-B biases for ATMS CH07–CH14 and CH19–20 are all within 0.3 K at the end of May 2020. Our O-B bias trending analysis shown in Figure 12, Figure 13, and Figure 14 confirm the statistically significant positive impacts of COSMIC-2 on the ECMWF reanalysis. In addition, the assimilation of COSMIC-2 data into ECMWF improves consistency with the data ingested into ECMWF from other observing systems. After assimilating COSMIC-2 data into ECMWF, the double-differences between observation and simulation using COSMIC-2 retrieval and ECMWF are significantly reduced. It is difficult to further quantify the contribution to the residual O-B bias from COSMIC-2 after COSMIC-2 RO data have been assimilated into ECMWF with the current analysis method.

6. Conclusions

This study evaluates the stability and consistency between COCMIS-2 and SNPP ATMS measurements through CRTM simulation. Two versions of UCAR COSMIC-2 wet profiles, e.g., WETPrf and WERPrf2evals, have been used for the CRTM simulations. The ATMS CH07–14 and CH19–22 measurements, whose peak sounding heights range from 3.2 to 35 km, are used for comparison. In addition, O-B biases between COSMIC-2 and ECMWF reanalysis data are derived and trended through the double-difference method. Comparisons of microwave sensor measurements with the CRTM-simulated BT data and O-B bias trending provide independent evaluations of UCAR COSMIC-2 RO data stability and consistency. The main conclusions are summarized as follows.
(1)
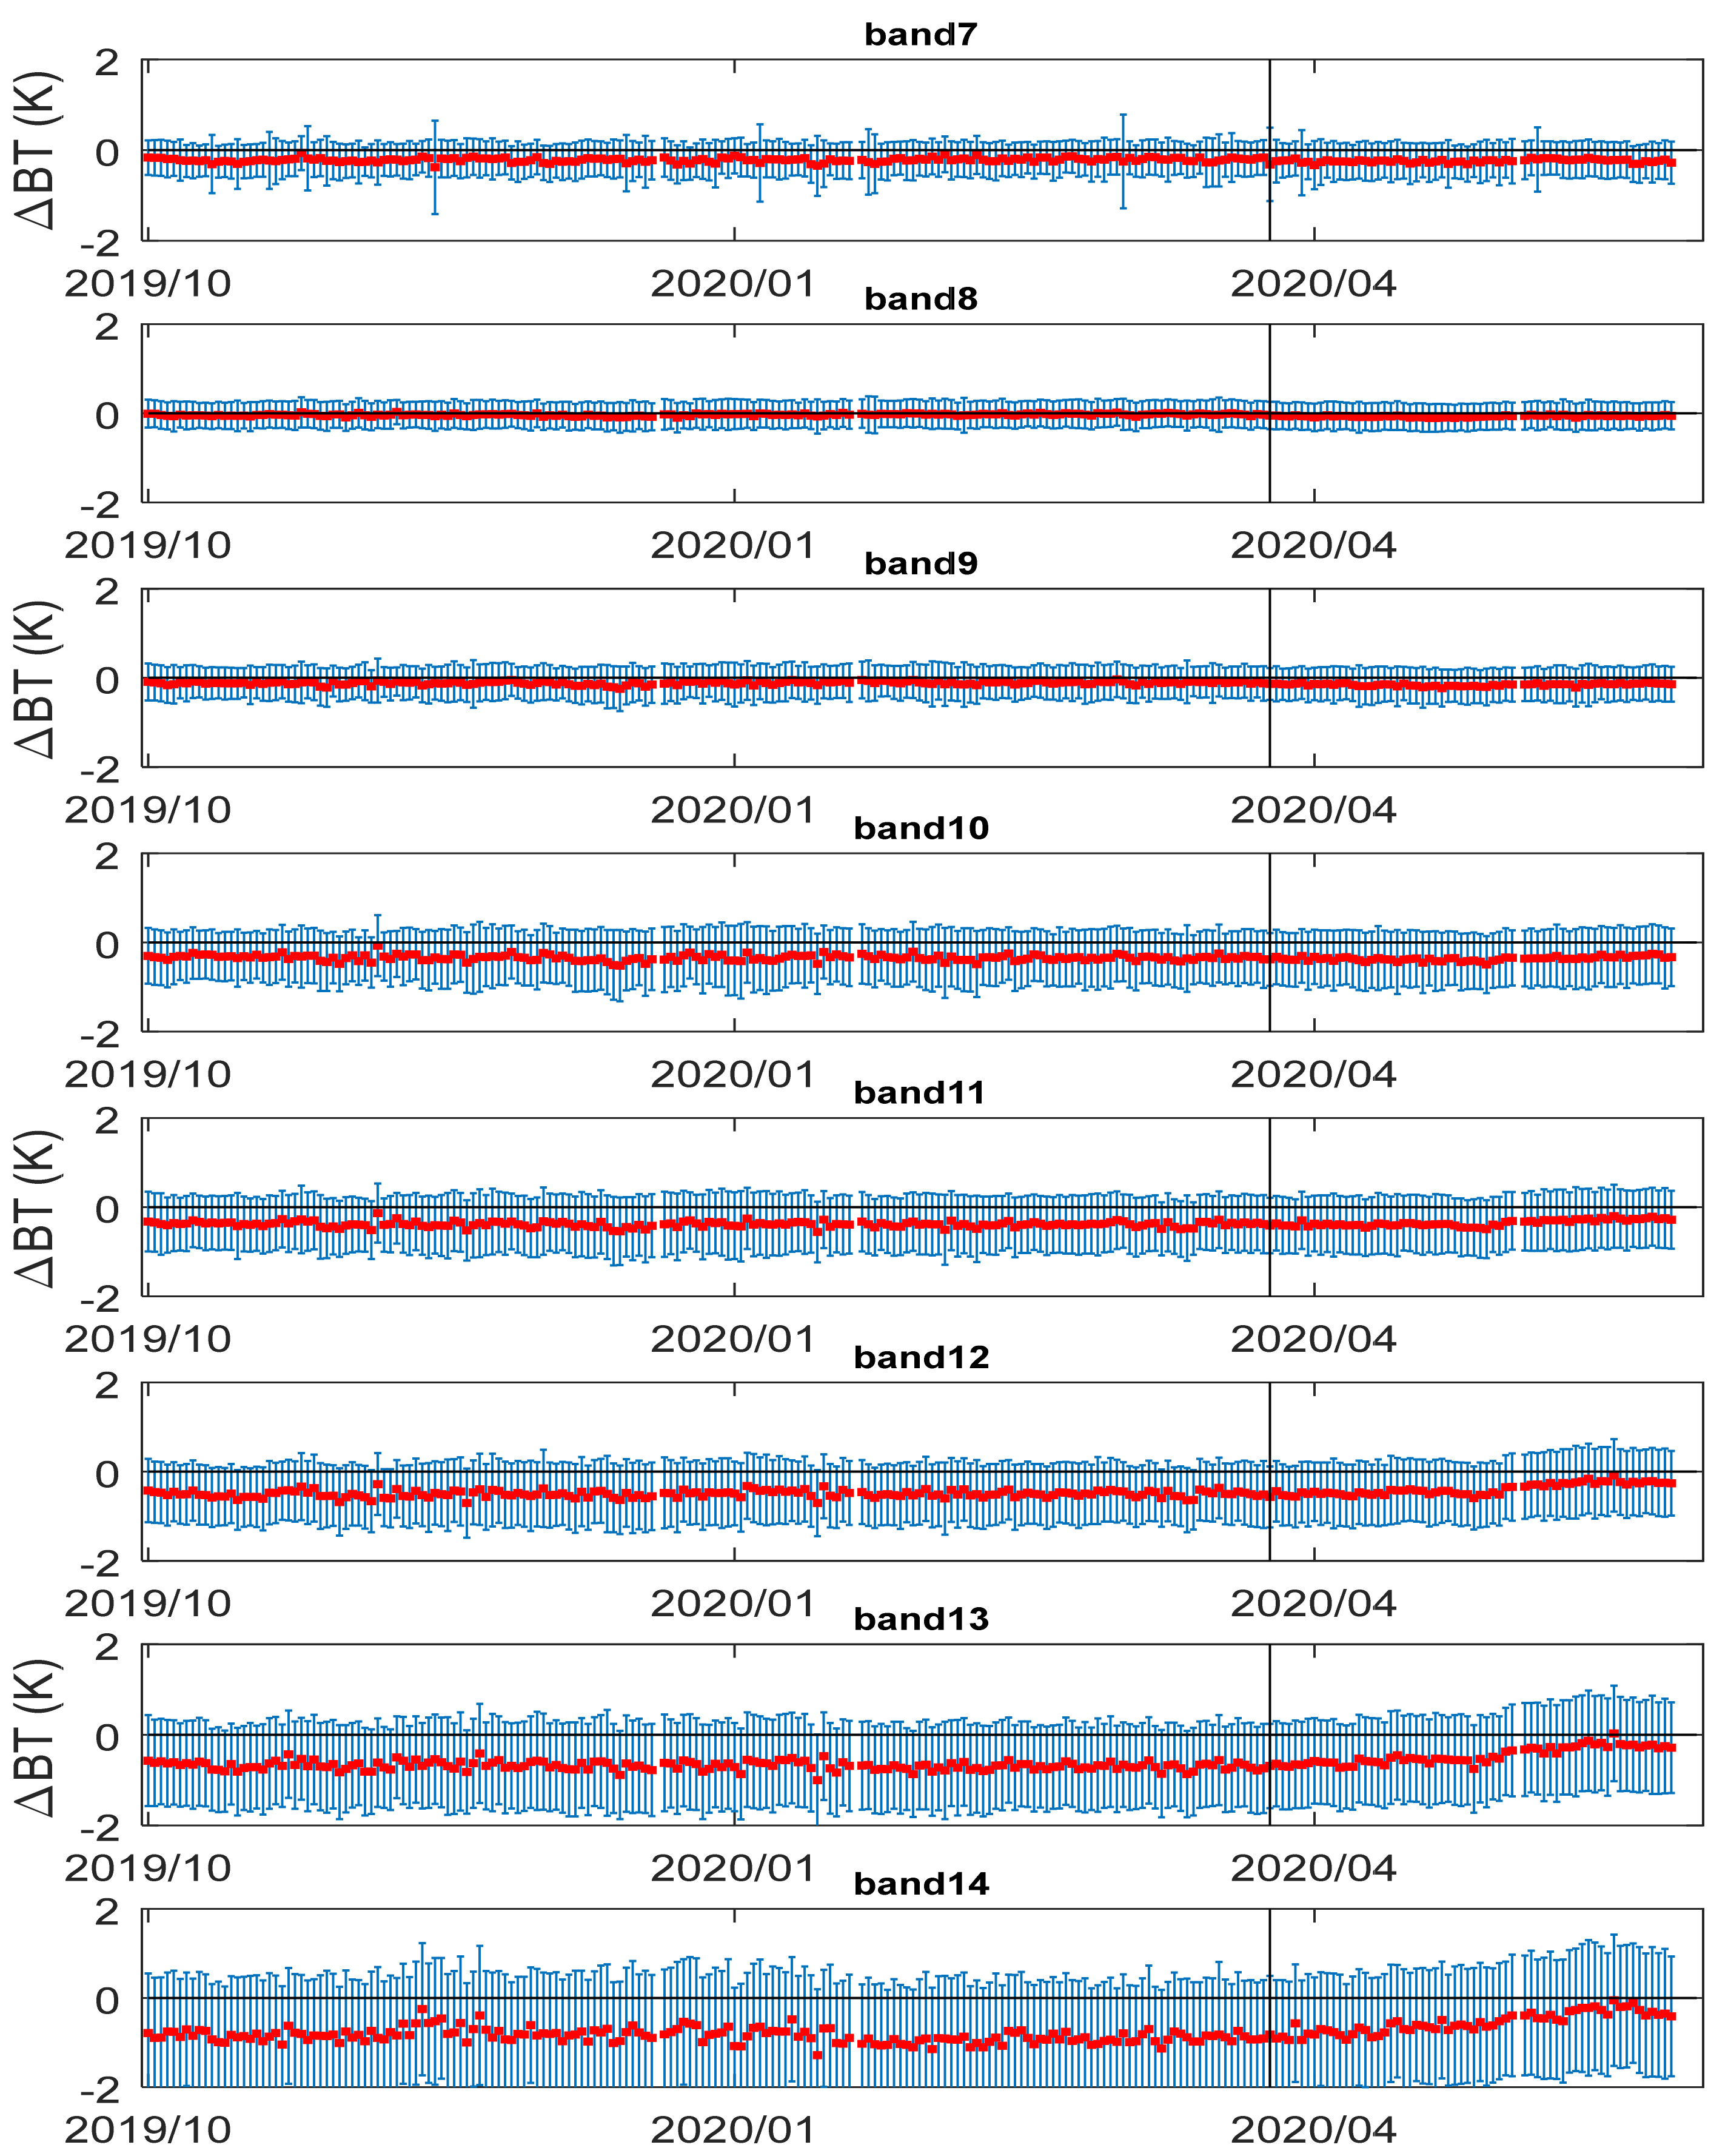
COSMIC-2 data can identify the ATMS calibration variation. The bias trending shows that COSMIC-2 data captured the calibration updates of SNPP ATMS, i.e., antenna reflector emission correction and antenna pattern correction coefficients update on 15 October 2019, very well. The bias of ATMS relative to COSMIC-2 is improved for ATMS CH10–14 and CH19–20 after the calibration update.
(2)
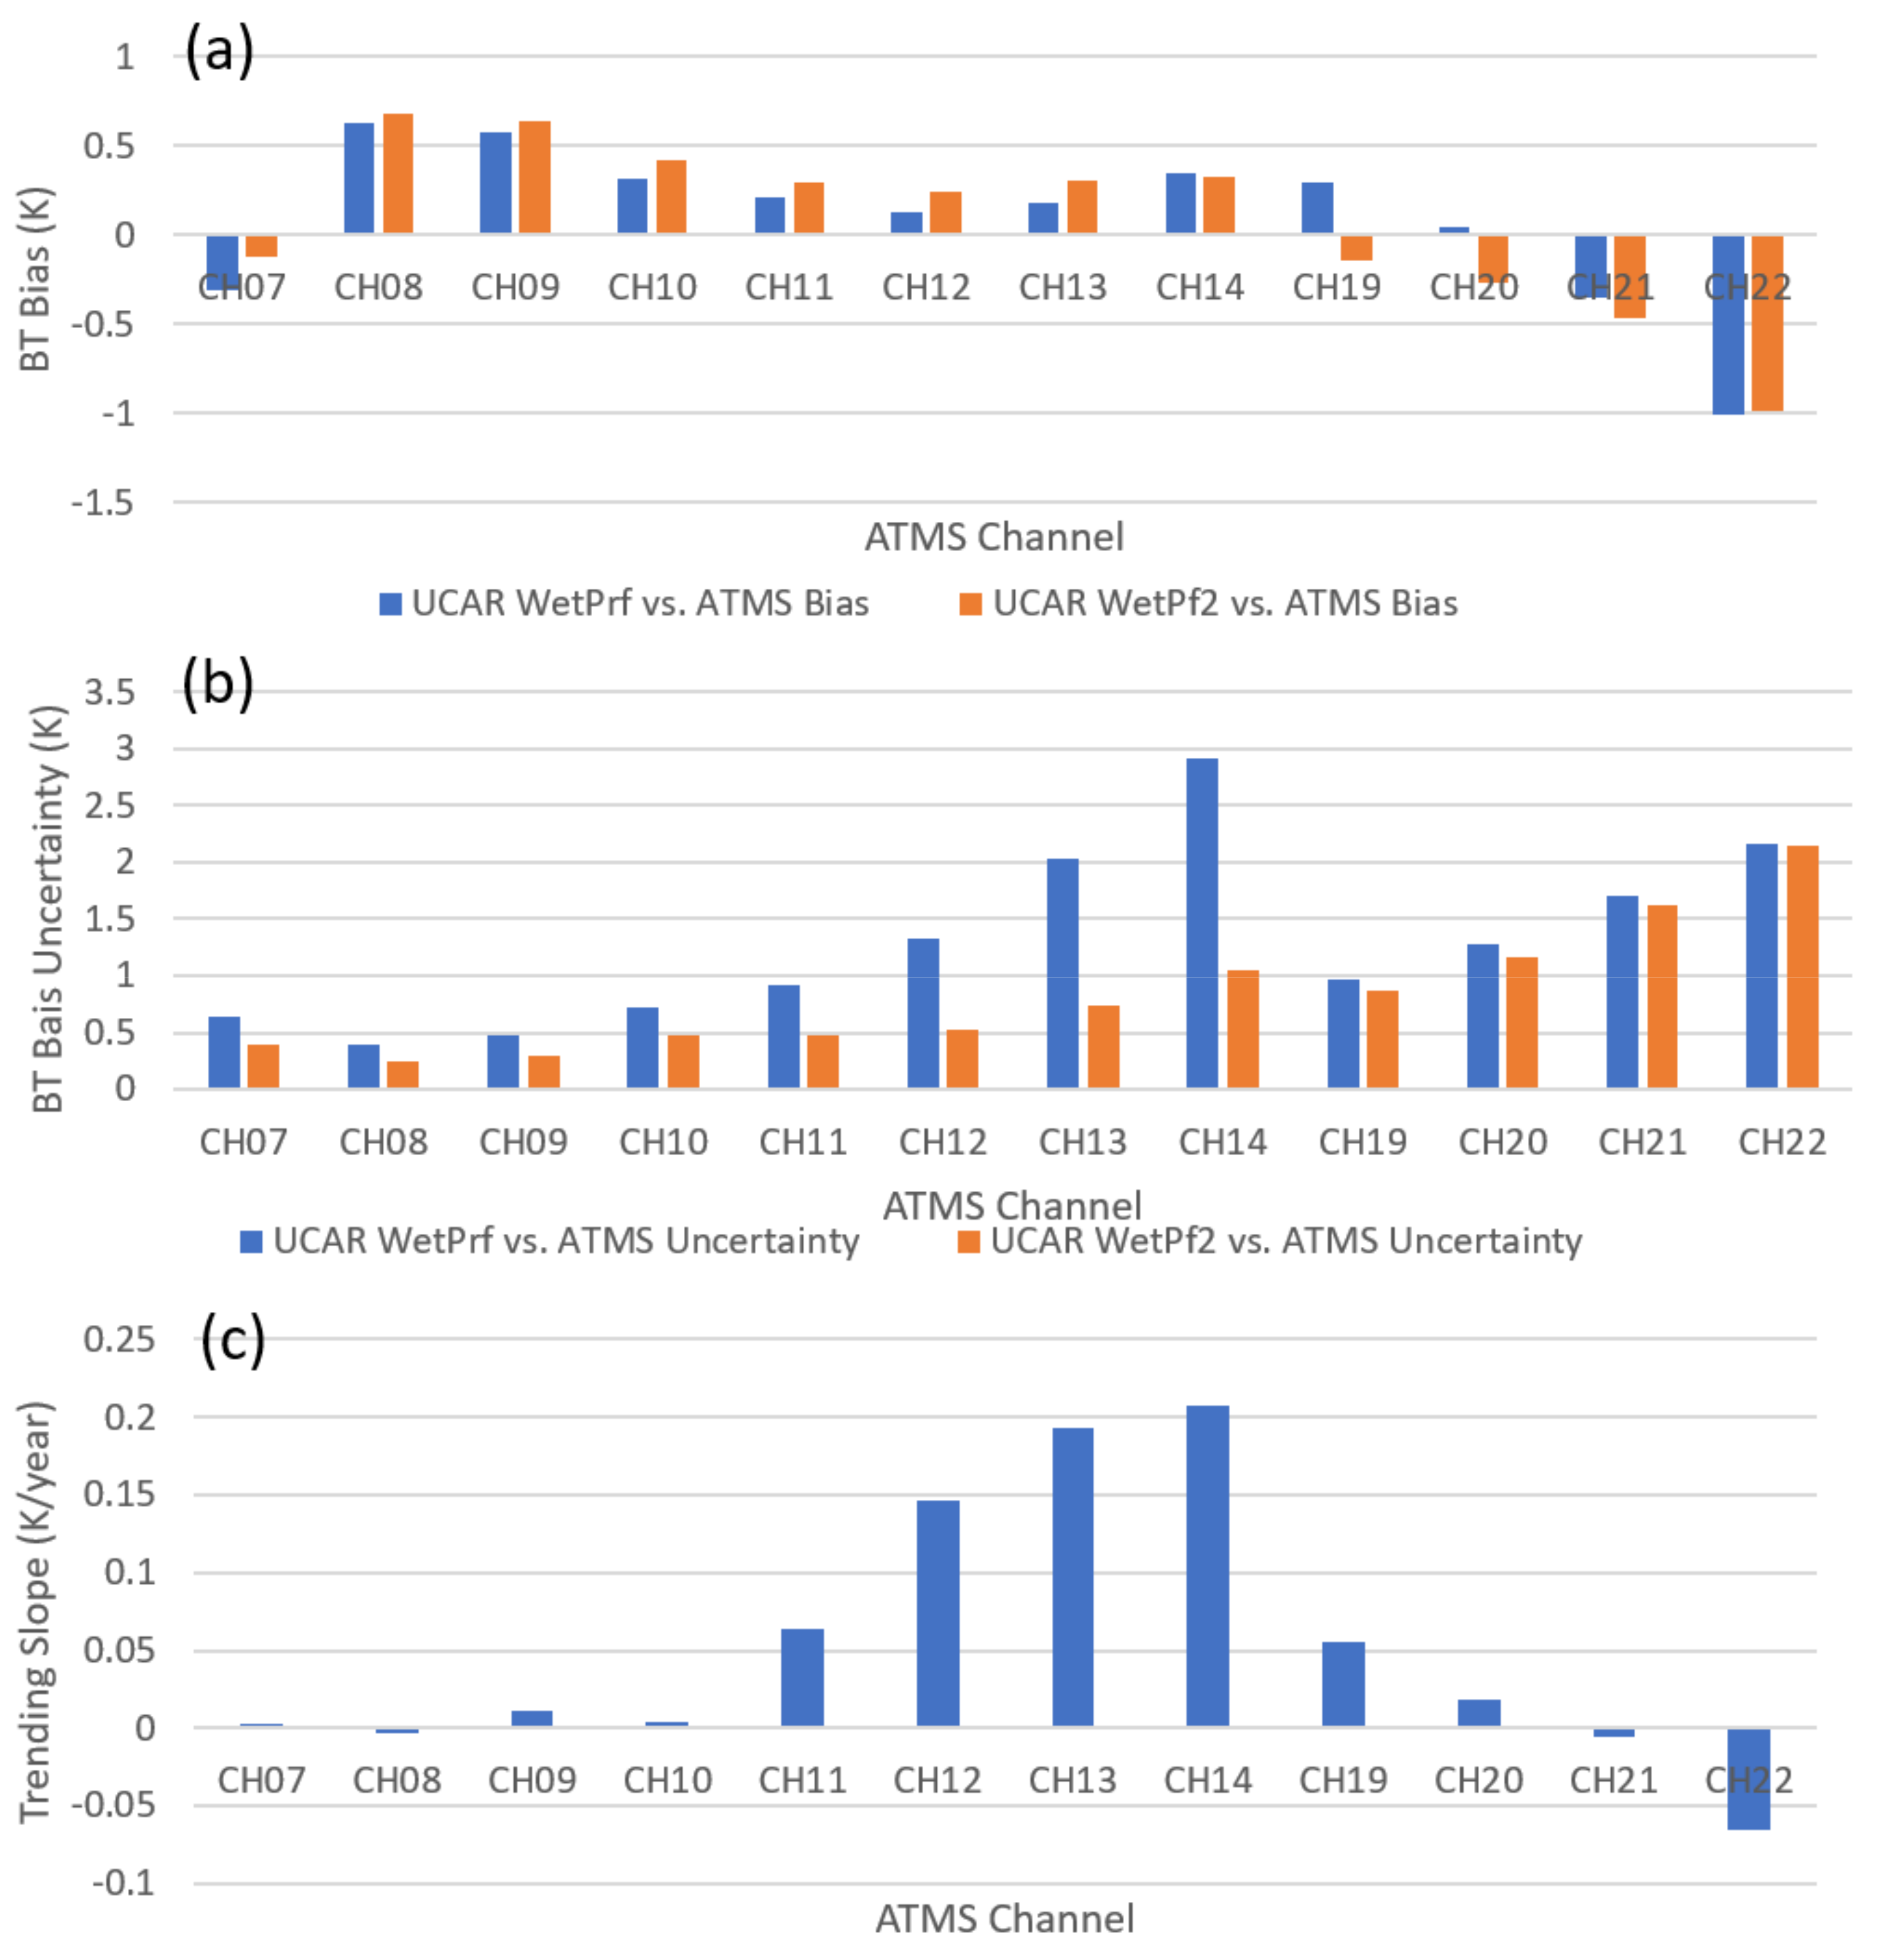
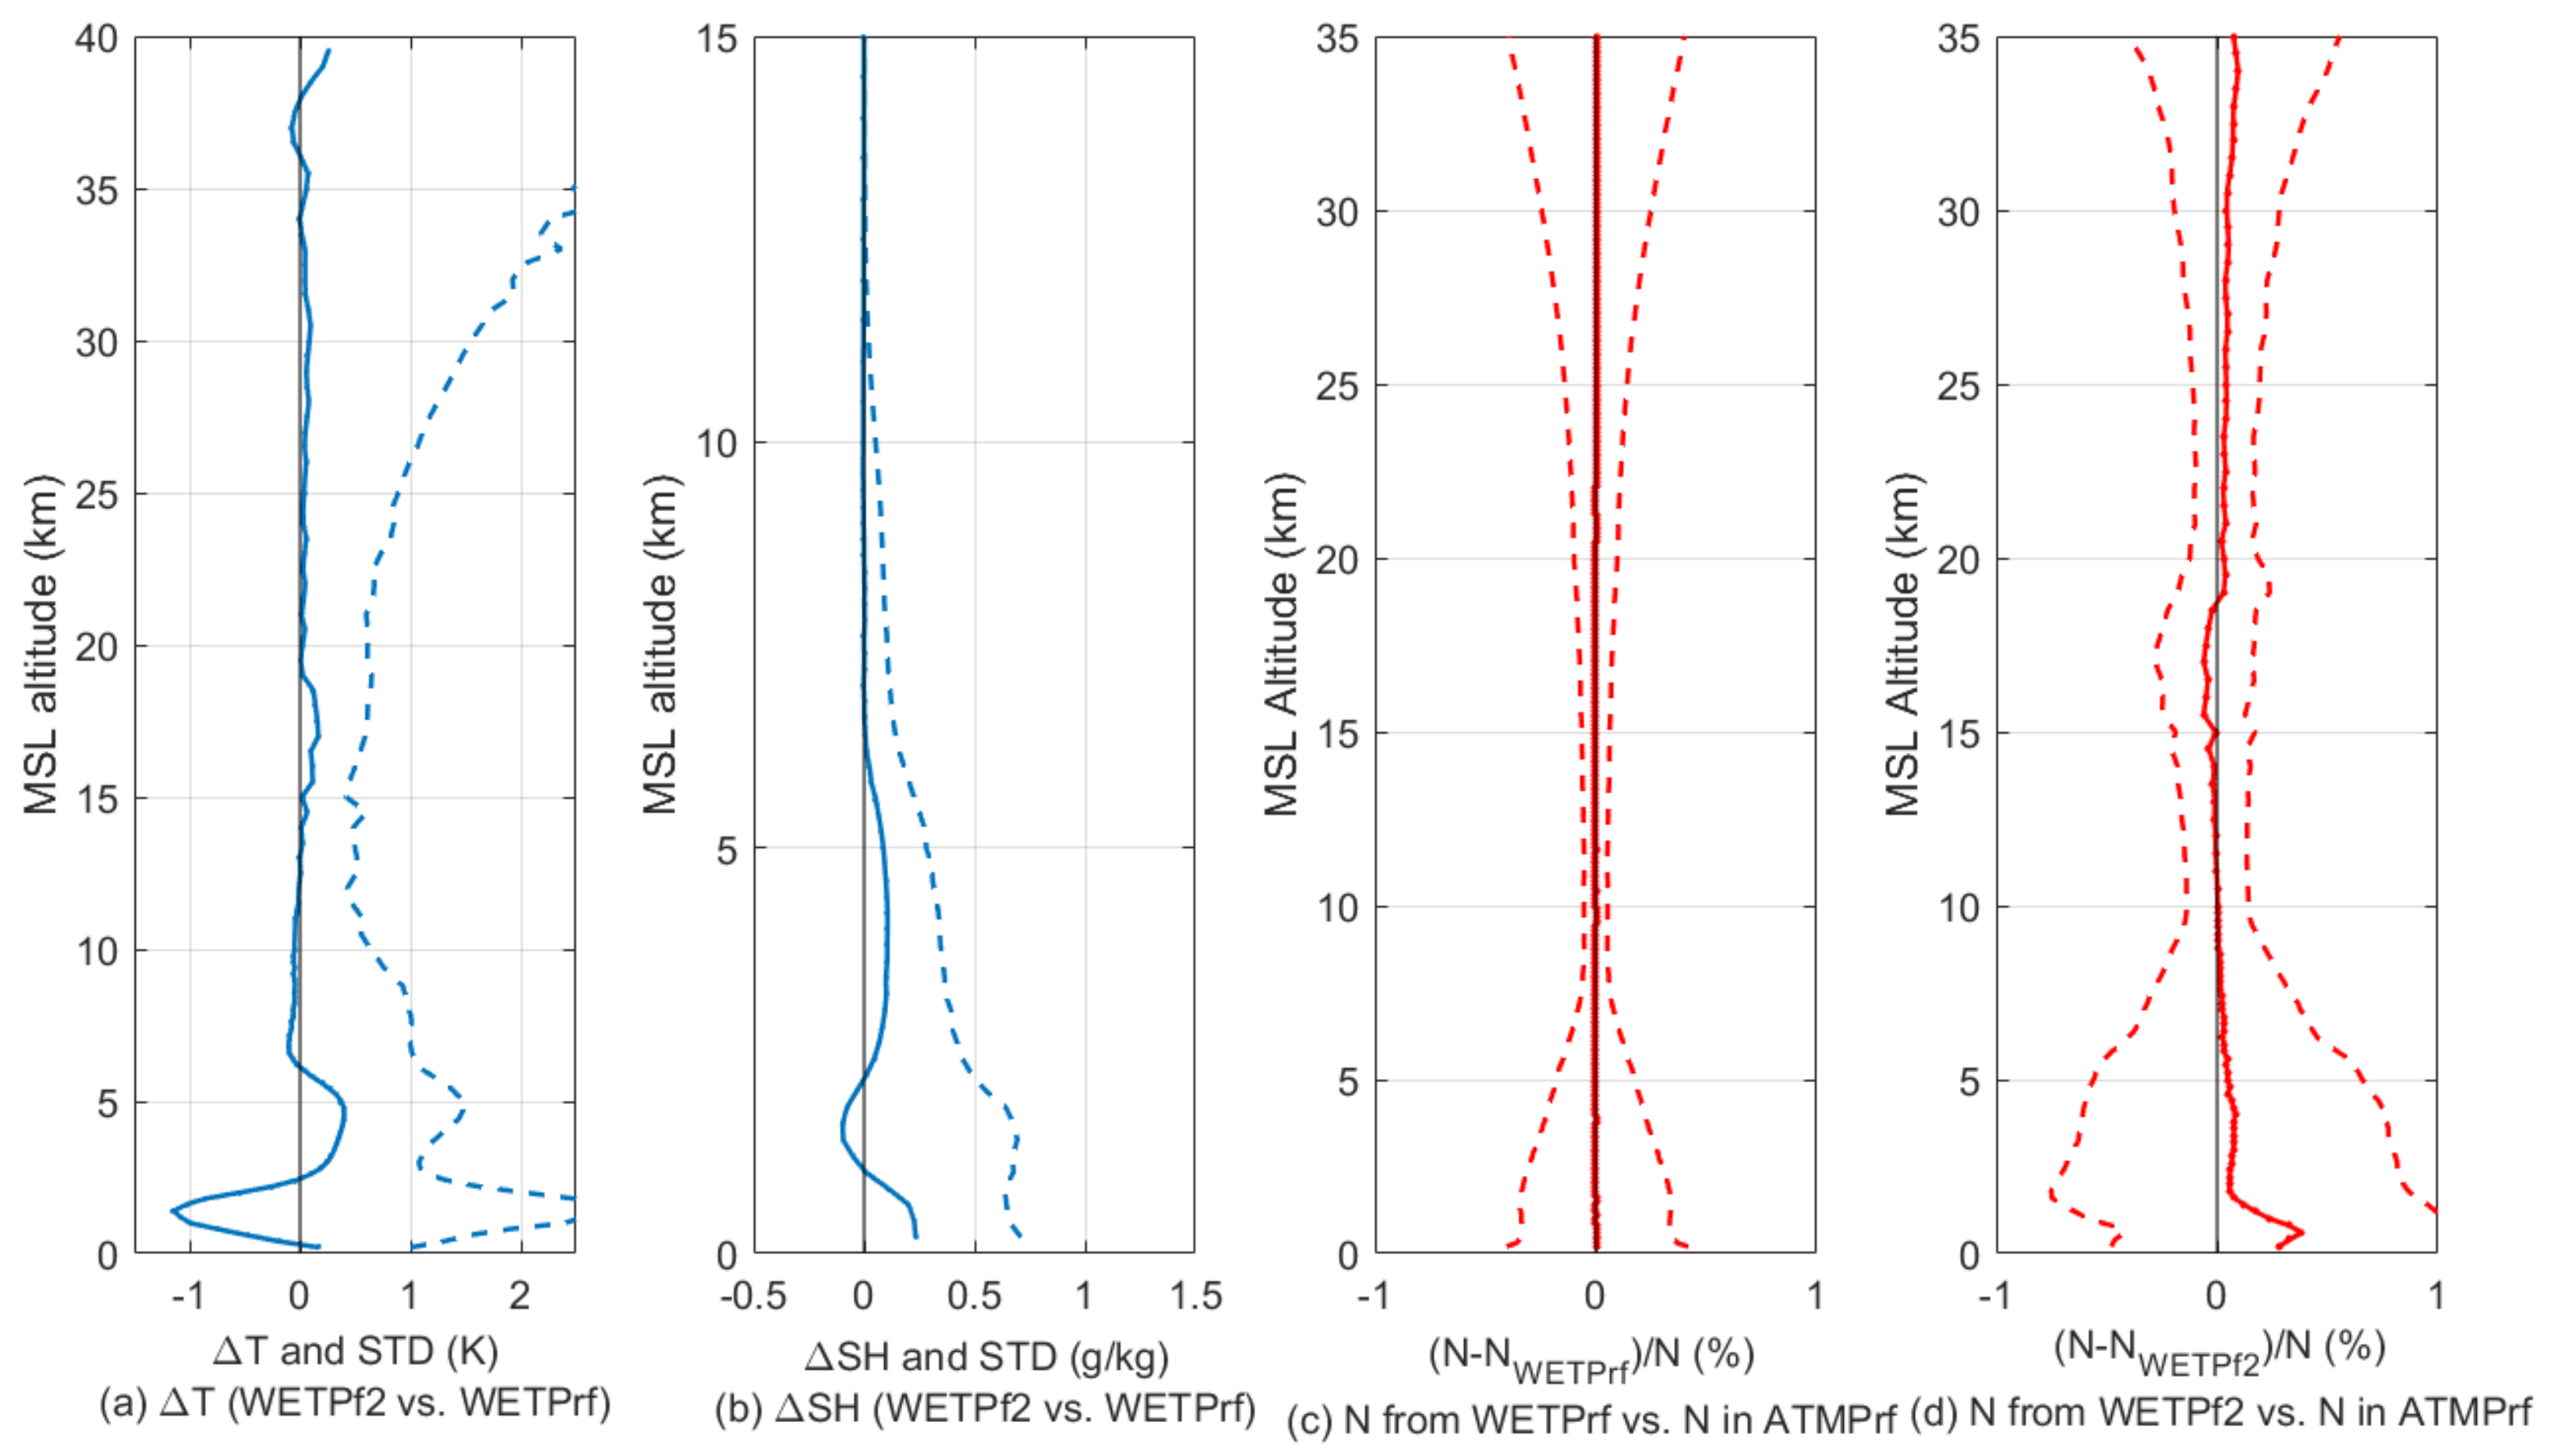
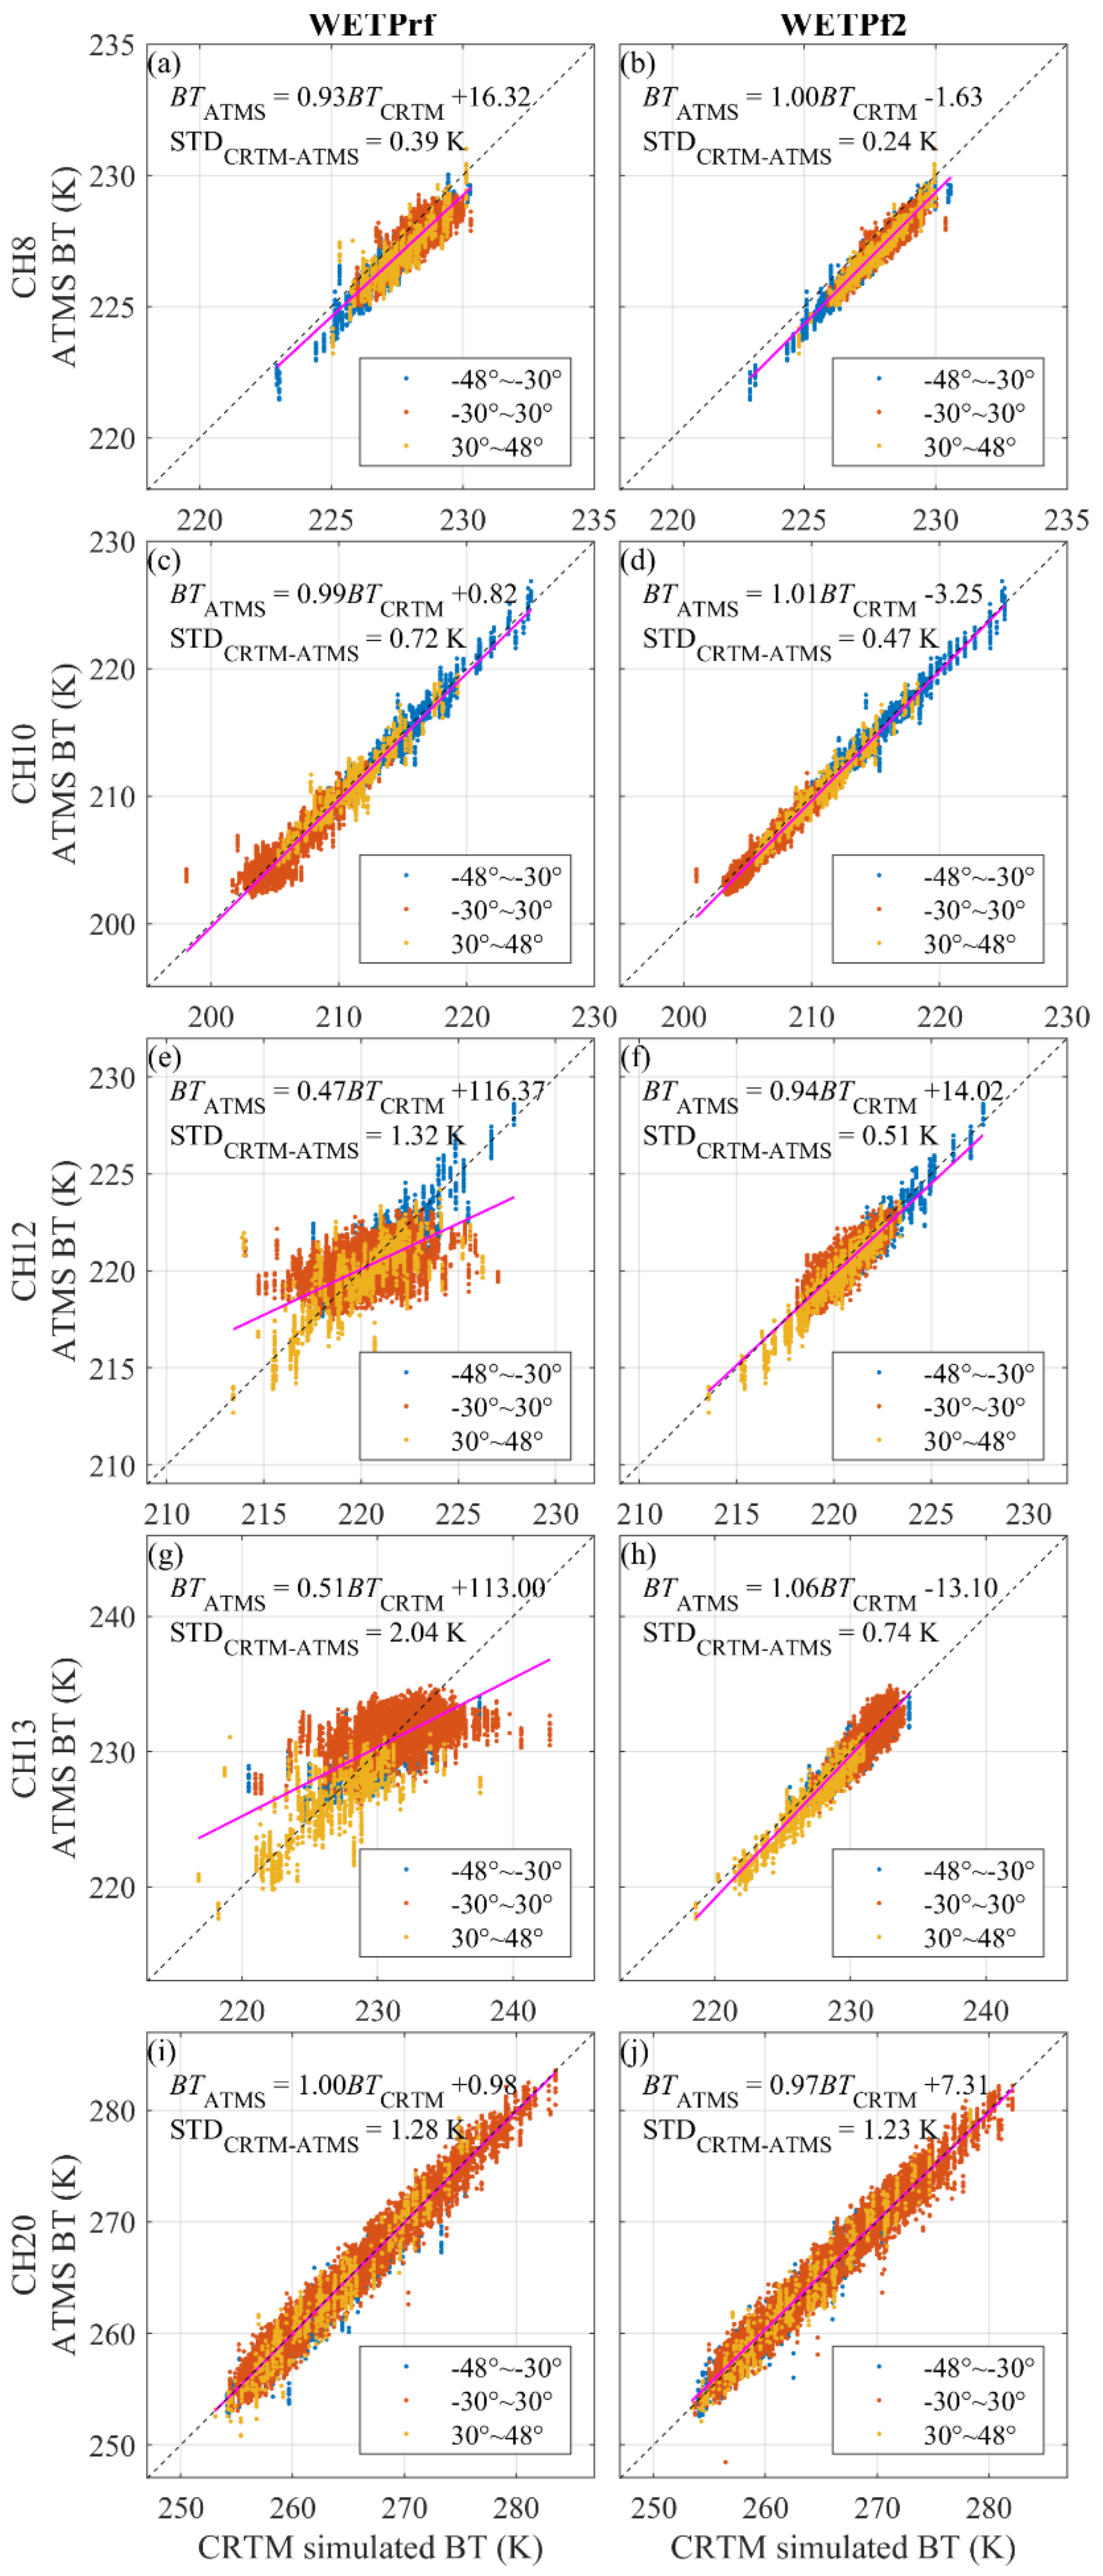
Differences between UCAR COSMIC-2 WETPrf and WETPf2 can be identified through comparison with ATMS. This paper shows the mean biases between BT measurements of SNPP ATMS and CRTM-simulated BT from two versions of UCAR COSMIC-2 wet profiles, e.g., WETPf2 and WETPrf, are all within 0.4 K for ATMS CH07, CH10–14, CH19, and CH20 (see Figure 6 and Table 3). The COSMIC-2 vs. ATMS BT biases of ATMS CH19 and CH20 have an opposite sign between μBTWETPrf) and μBTWETPf2). The direct comparison between COSMIC-2 WETPf2 and WETPrf data shows distinct differences in both temperature and humidity for the height region below 7 km (Figure 7). Therefore, the differences between UCAR COSMIC-2 WETPrf and WETPf2 1DVAR retrieval algorithms cause differences in the retrieved temperature and humidity profiles identified in the COSMIC-2 vs. ATMS comparison. In terms of BT bias uncertainties of UCAR COSMIC-2 wet profile products, it is found that there are significant reductions in σBTWETPf2) for ATMS CH07-14 in comparison with σBTWETPrf). More than two times of reductions in σBTWETPf2) for ATMS CH12–14 are observed. The substantial improvements in the σBTWETPf2) can be attributed to the 1DVAR algorithm updates implemented for the UCAR WETPf2 1DVAR retrieval algorithm [53]. It is suggested that the a priori model used in the 1DVAR retrieval, such as GFS or ECMWF model that has assimilated ATMS data to a different extent, can directly impact the variation of σBT).
(3)
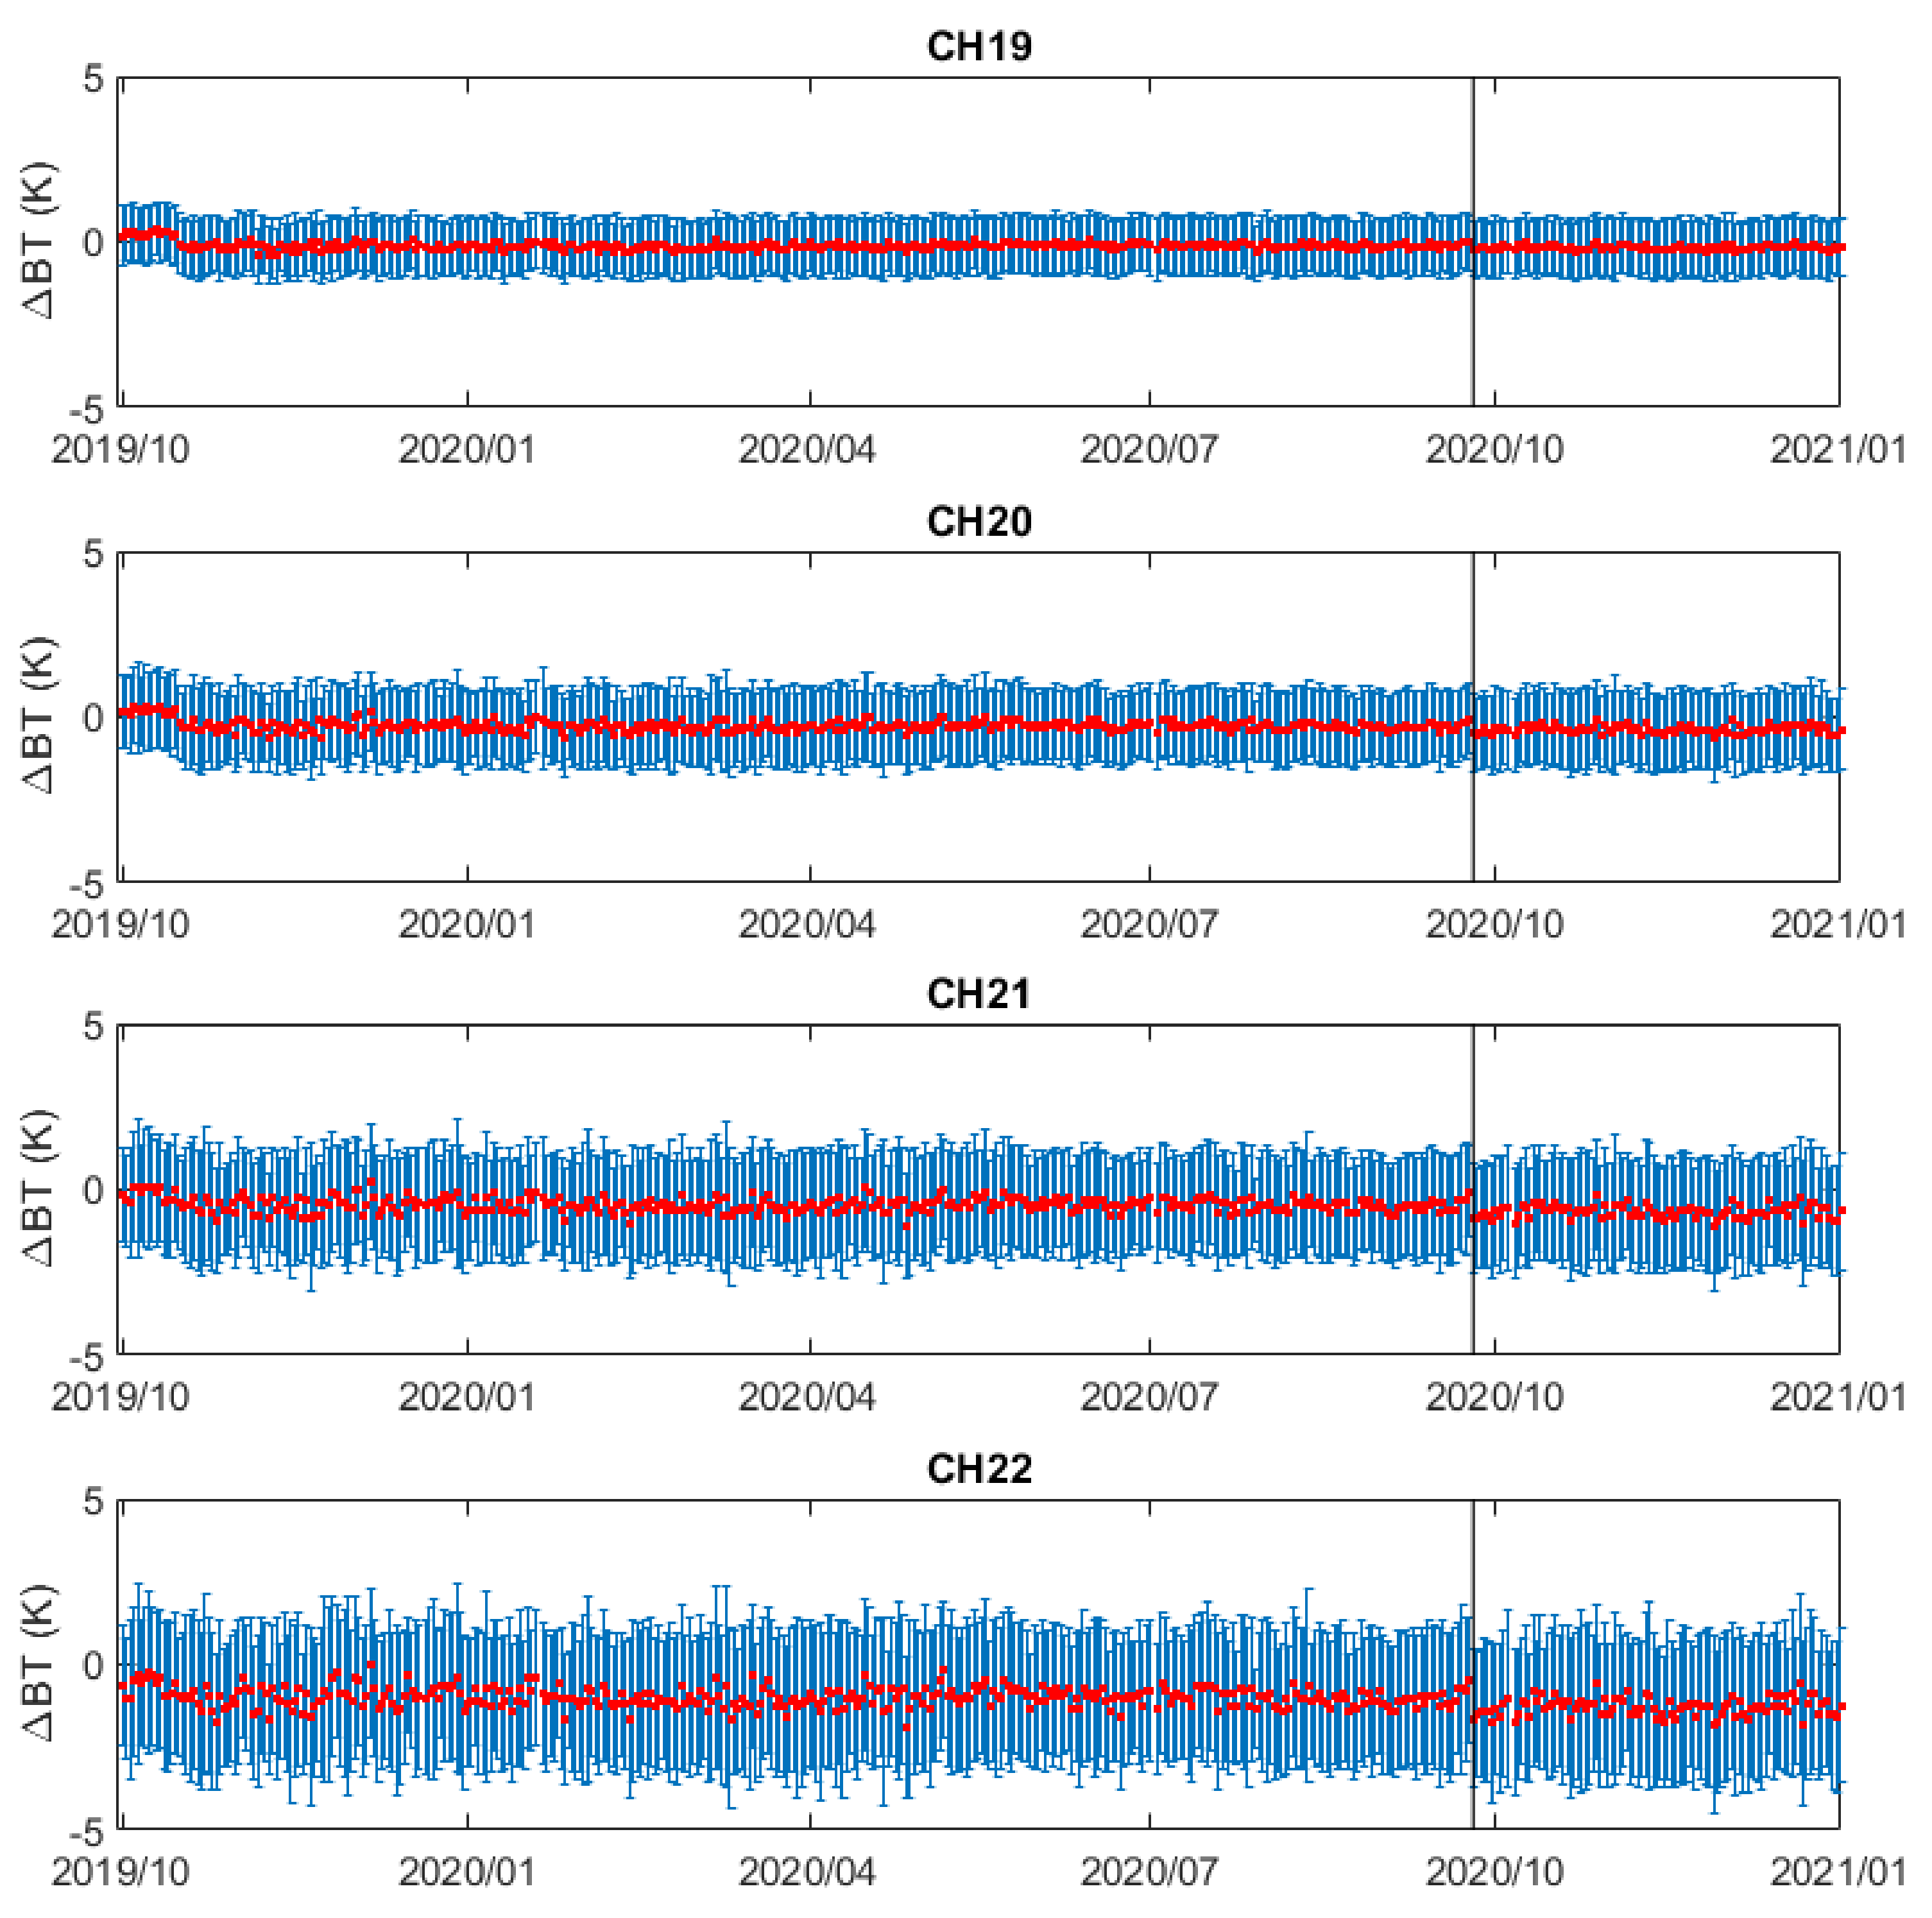
Precision and stability of COSMIC-2 data were evaluated. This paper shows that the UCAR COSMIC-2 WETPrf data is less affected by the a priori reanalysis model used in the 1DVAR retrieval and is close to the direct retrieval of temperature, i.e., dry temperature, from COSMIC-2 bending angle/refractivity data. Our analysis shows that the μBTWETPrf) varies between 0.1 and 0.3 K for ATMS CH10 to CH14 and CH19–21 with increasing uncertainty magnitude, which can be due to the increasing NEDT of these ATMS channels.
The trending of COSMIC-2 vs. ATMS BT biases shows that overall long-term stability consistency between COSMIC-2 and SNPP ATMS are well maintained after 15 October 2019. The stability between modeled BT from COSMIC-2 and ATMS measurements is consistent with the drift of BT bias DBTWETPf2) < 0.02 K/year for ATMS CH07–10. For ATMS CH19–CH21, the BT bias drifts DBTWETPf2) are <0.06 K/year, which shows the promising aspect of using COSMIC-2 wet profiles for the calibration of these two ATMS water vapor channels. The drifts of BT bias of ATMS CH13–14 with peak sounding height above 30 km and ATMS moisture sounding channels CH22 have larger uncertainties, which can be reduced with more extended time series of BT biases. It is shown that the well-sustained stability of COSMIC-2 RO data makes it well serves as the reference standard to detect and monitor the stability variation of sounding channels similar to ATMS CH7–10 and CH19–20 on other microwave-sounding sensors.
(4)
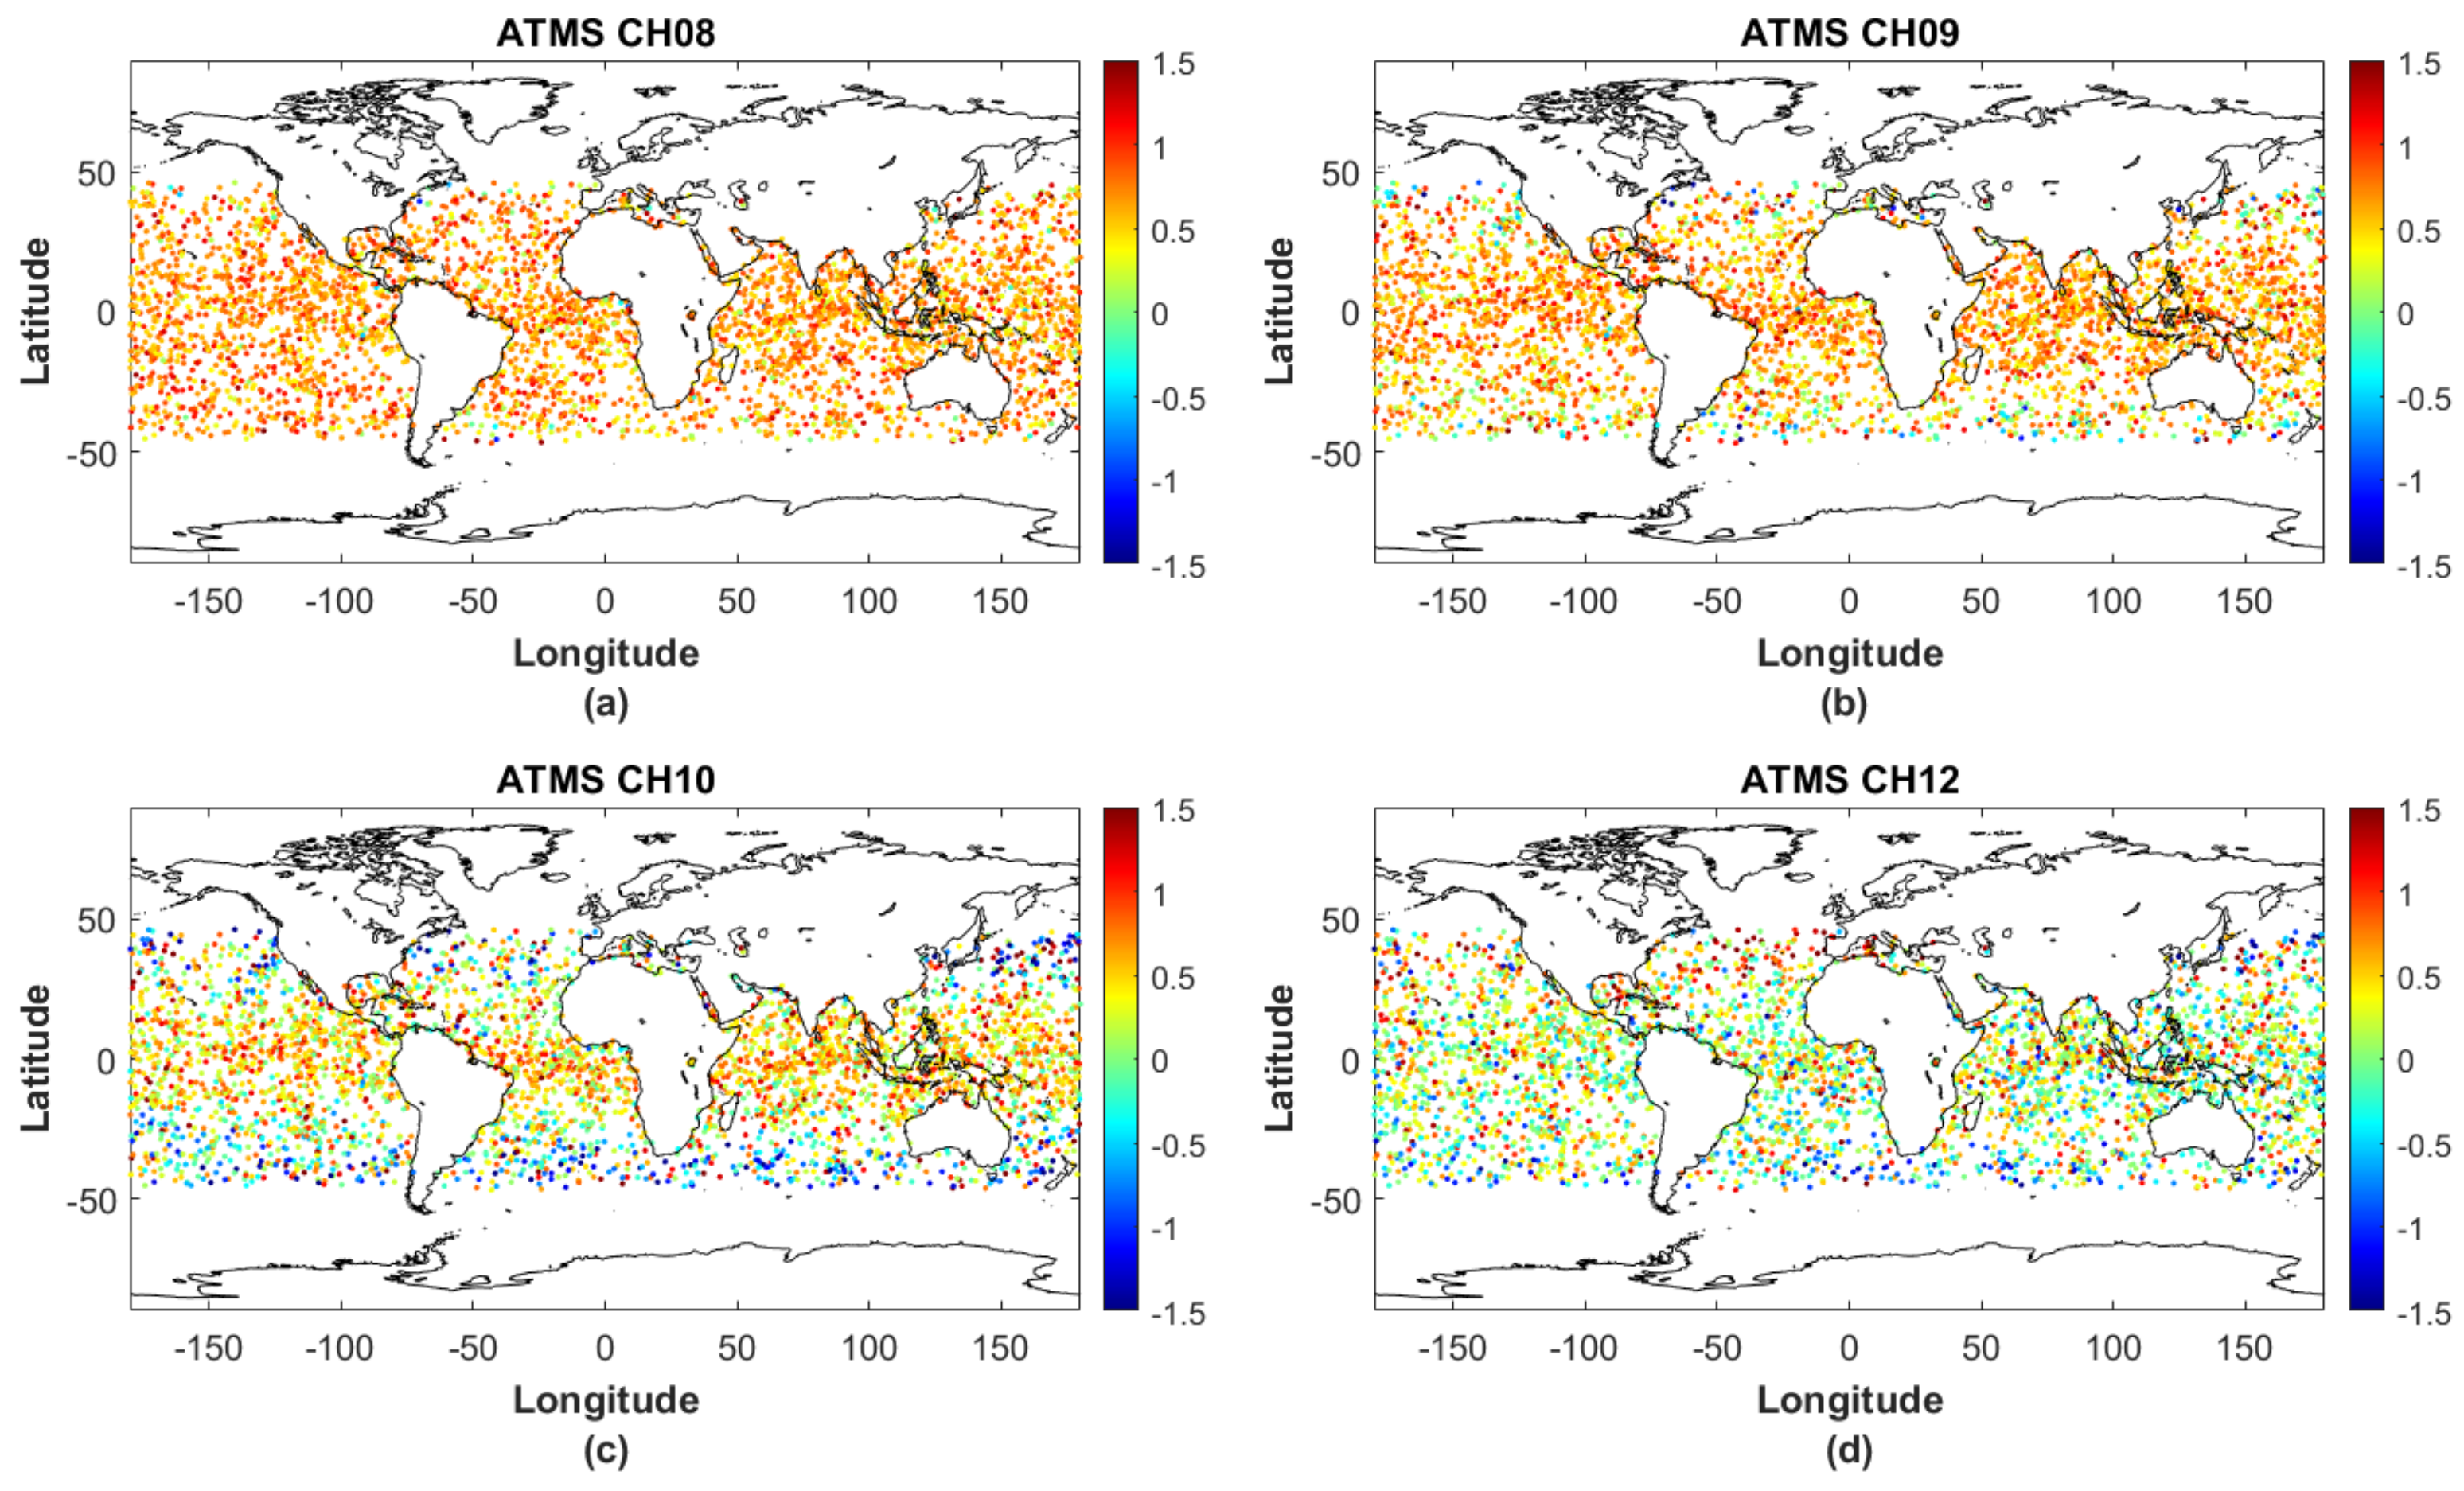
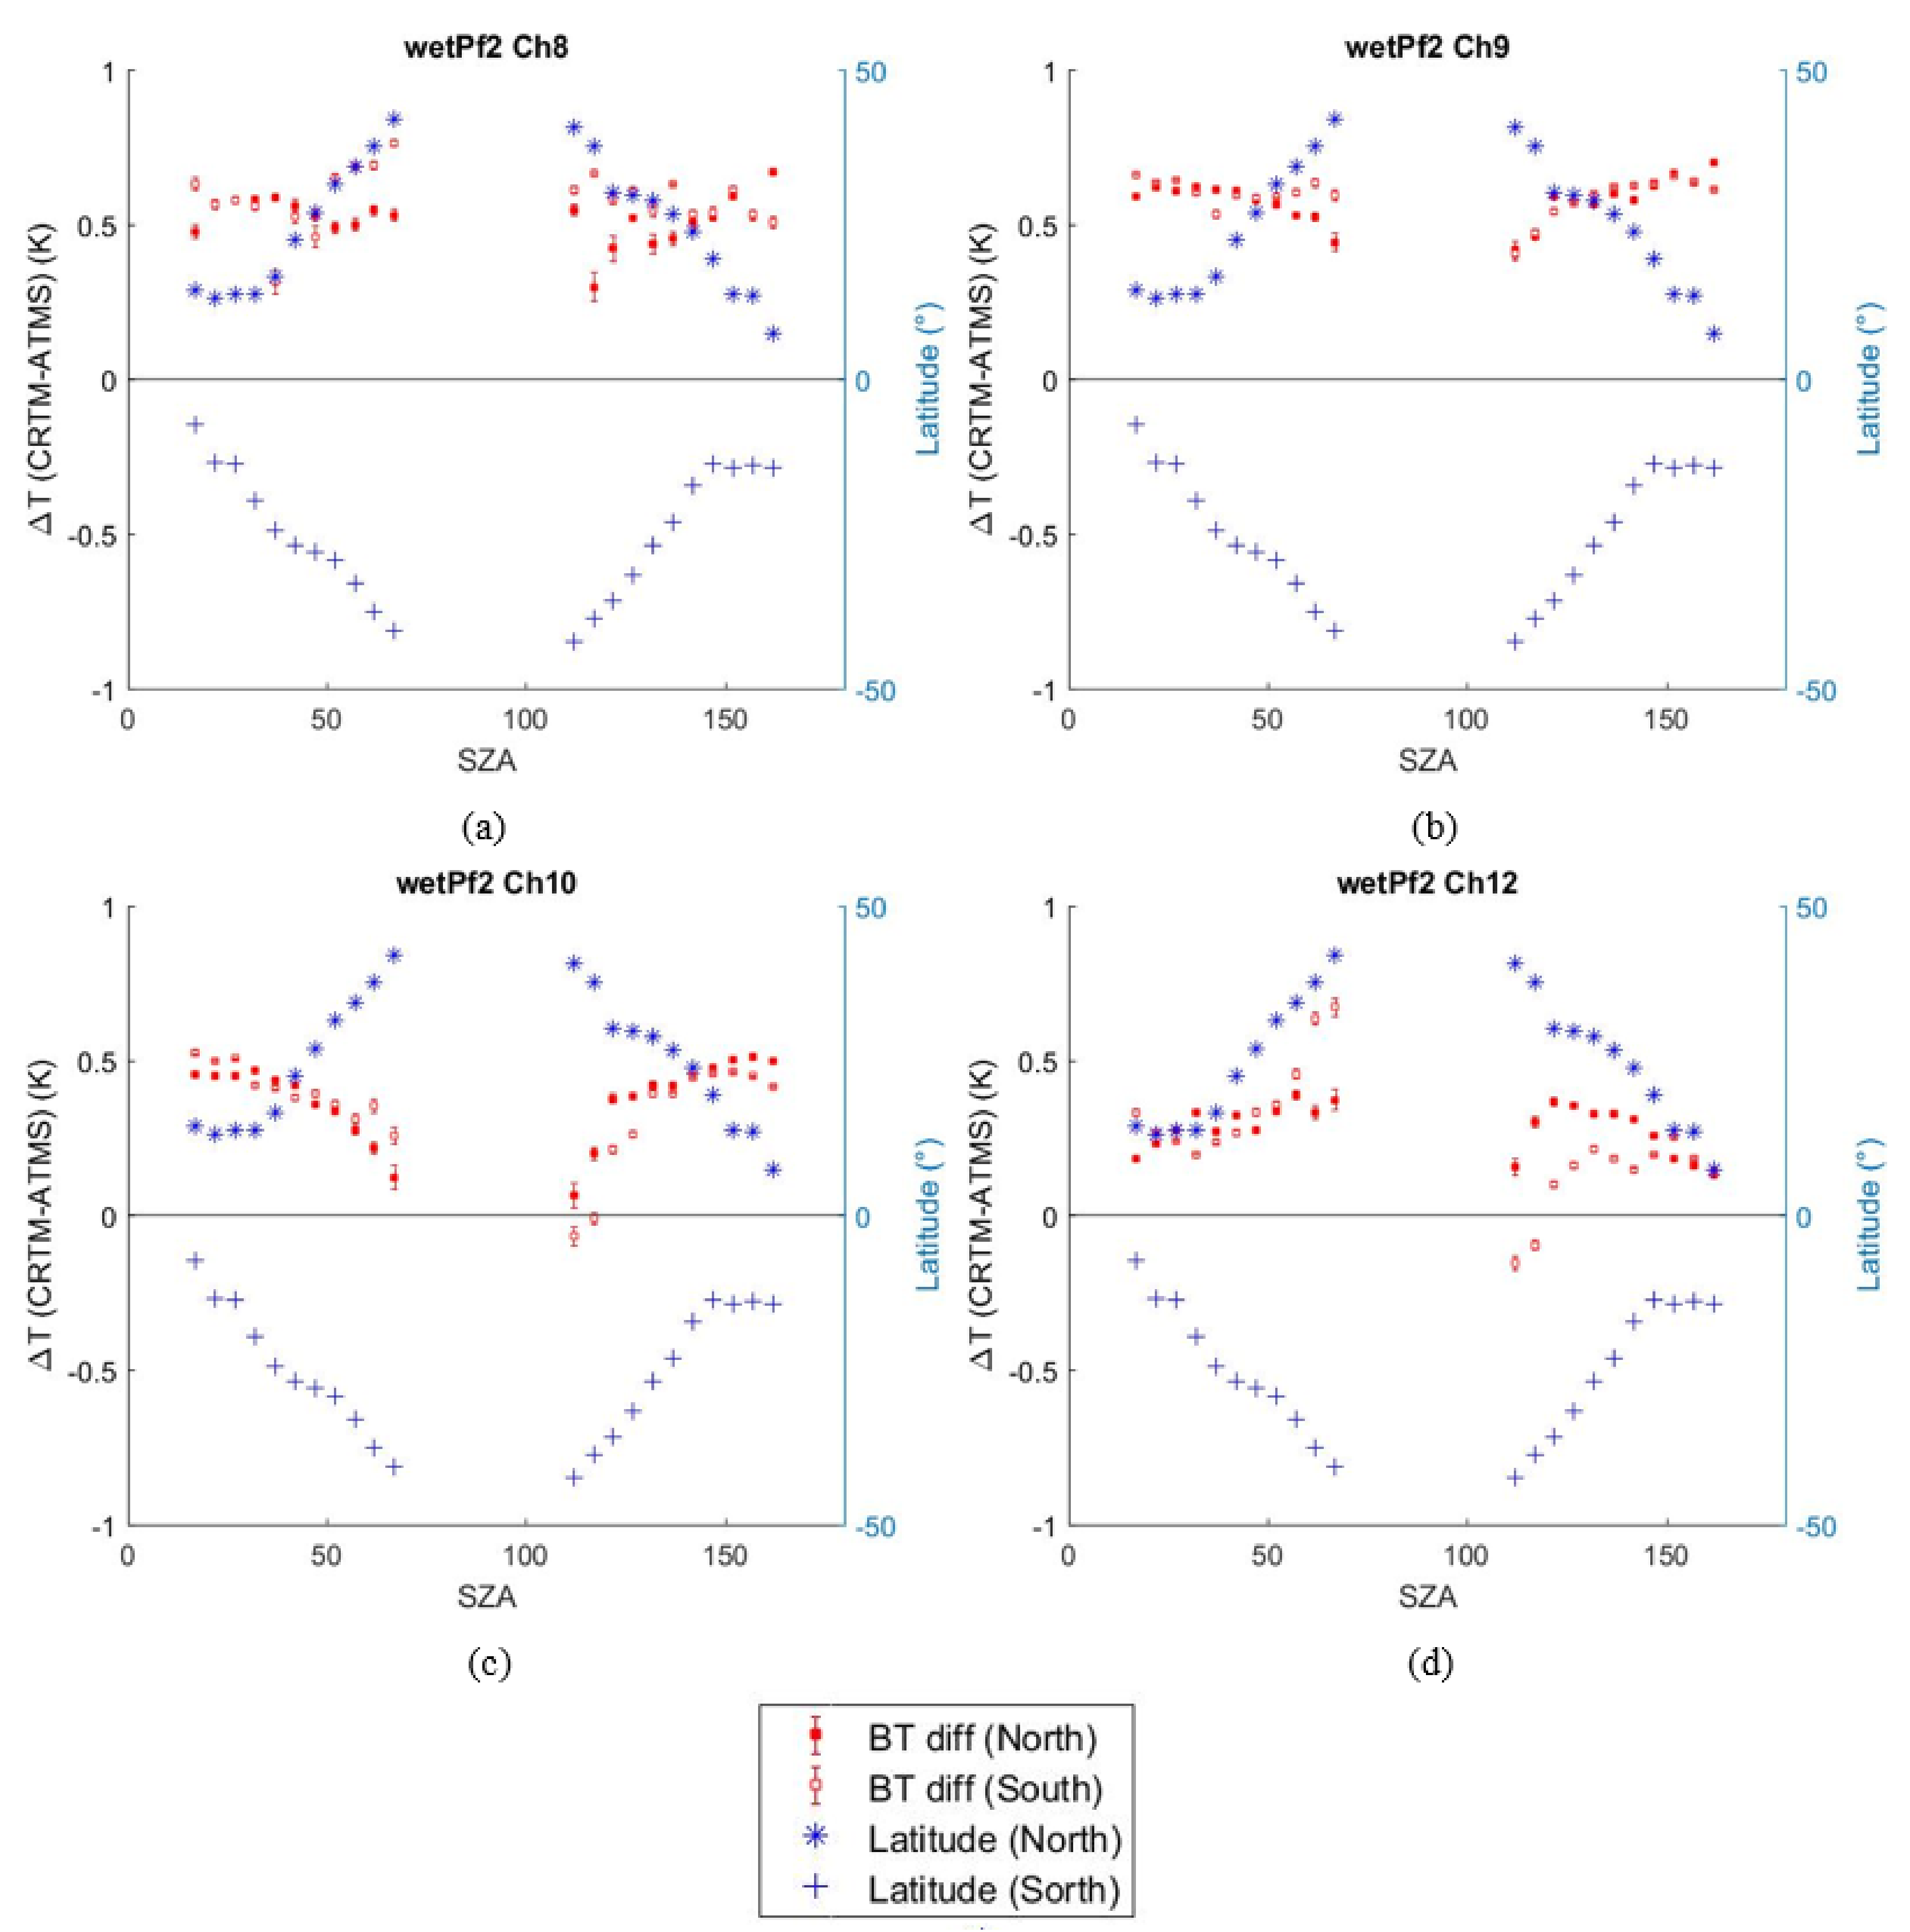
Analysis of latitude and SZA dependence of COSMIC-2 vs. ATMS biases help identify the SZA-dependent bias variation of ATMS near the day–night terminator region. This paper also shows that COSMIC-2 WETPf2 data are generally consistent with ATMS measurements over three latitude regions with μBTWETPf2) difference within 0.3 K for all of the ATMS channels of interest. It further shows the SZA-dependence of the remnant BT biases between COSMIC-2 and ATMS for the lower stratosphere sounding channels of ATMS. COSMIC-2 can identify the ATMS seasonal and latitude-dependent bias, mainly due to the SZA-dependent biases from ATMS near the day-night terminator region.
(5)
O-B bias trending can help evaluate the impacts of assimilation of COSMIC-2 RO data into ECMWF. The trending of O-B biases between COSMIC-2 and ECMWF for ATMS channels quantitatively shows the impacts of the assimilation of COSMIC-2 RO data into ECMWF on 25 March 2020. It is shown that significant reduction in the absolute O-B BT biases for ATMS CH10 to CH14 and CH19 after assimilating COSMIC-2 data into ECMWF. For ATMS CH12–14, the reduction in O-B biases is more than half (Table 4 and Figure 14). After 25 March 2020, the decrease in O-B biases confirms that the assimilation of COSMIC-2 data into ECMWF has statistically significant positive impacts on the ECMWF reanalysis and improves consistency with the data from other observing systems, as shown in [52,66].
RO remote sensing technology provides long-term stable temperature, water vapor, and pressure profiles with high accuracy, precision, and vertical resolution. Both the RO sensor and microwave radiometer provide soundings of the atmospheric temperature profiles and have essential NWP systems roles. The inter-comparison of RO and microwave sounder measurements through CRTM simulation enables monitoring of microwave-sounding sensors’ stability variation; helps identify the difference in the RO wet profile data originated from difference in the 1DVAR retrieval algorithm and ensures the quality of RO and microwave data assimilated into the NWP model. This study was limited to oceans. In future studies, we will extend the model to investigate the challenges, feasibilities, and uncertainties in the comparison of ATMS with RO measurements for sounding channels over other surface types such as land, which can provide a more comprehensive evaluation of the benefits of COSMIC-1 and COSMIC-2 data coverage under various weather conditions. With COSMIC-2 being operational and stable, the daily RO profiles from COSMIC-2 are expected to improve short and medium-range global numerical weather predictions and help construct consistent climate temperature records.

Author Contributions

Conceptualization, X.S., S.-p.H., C.C. and Y.C.; data curation, X.S. and B.Z.; formal analysis, X.S., S.-p.H. and Y.C.; funding acquisition, S.-p.H. and C.C.; investigation, X.S. and B.Z.; methodology, X.S., S.-p.H., B.Z. and C.C.; project administration, S.-p.H. and C.C.; resources, S.-p.H. and C.C.; software, X.S., B.Z. and Y.C.; supervision, S.-p.H. and Y.C.; validation, X.S.; visualization, X.S. and B.Z.; writing—original draft, X.S. and B.Z.; writing—review and editing, X.S., S.-p.H., C.C. and Y.C. All authors have read and agreed to the published version of the manuscript.

Funding

This study was supported by NOAA grant NA19NES4320002 (Cooperative Institute for Satellite Earth System Studies—CISESS) at the University of Maryland/ESSIC. This work is also partially supported by the Technology Maturity Program of NOAA OPPA.

Institutional Review Board Statement

Not applicable.

Informed Consent Statement

Not applicable.

Data Availability Statement

The COSMIC-2 Radio Occultation data are available at https://data.cosmic.ucar.edu/gnss-ro/ and SNPP ATMS data are available at https://www.avl.class.noaa.gov/saa/products/welcome, both accessed on 17 September 2021.

Acknowledgments

The author would like to thank Xinjia Zhou, Erin Lynch, Jun Dong, Xin Jing, and Tung-Chang Liu for their inputs during the process of this manuscript. The scientific results and conclusions, as well as any views or opinions expressed herein, are those of the author(s) and do not necessarily reflect those of NOAA or the Department of Commerce.

Conflicts of Interest

The authors declare no conflict of interest.

References

  1. Spencer, R.W.; Christy, J.R.; Grody, N.C. Global Atmospheric Temperature Monitoring with Satellite Microwave Measurements: Method and Results 1979–84. J. Clim. 1990, 3, 1111–1128. [Google Scholar] [CrossRef] [Green Version]
  2. Mo, T. Calibration of the Advanced Microwave Sounding Unit-A Radiometers for NOAA-L and NO-AA-M. NOAA Tech. Rep. NESDIS 1999, 92, 1–53. [Google Scholar]
  3. Goldberg, M.D.; Crosby, D.S.; Zhou, L. The Limb Adjustment of AMSU-A Observations: Methodology and Validation. J. Appl. Meteorol. 2001, 40, 70–83. [Google Scholar] [CrossRef]
  4. Mears, C.A.; Schabel, M.C.; Wentz, F.J. A Reanalysis of the MSU Channel 2 Tropospheric Temperature Record. J. Clim. 2003, 16, 3650–3664. [Google Scholar] [CrossRef]
  5. Spencer, R.W.; Christy, J.R.; Braswell, W.D.; Norris, W.B. Estimation of Tropospheric Temperature Trends from MSU Channels 2 and 4. J. Atmos. Ocean. Technol. 2006, 23, 417–423. [Google Scholar] [CrossRef]
  6. Wylie, D.P.; Menzel, W.P. Eight Years of High Cloud Statistics Using HIRS. J. Clim. 1999, 12, 170–184. [Google Scholar] [CrossRef]
  7. Cao, C.; Xu, H.; Sullivan, J.; McMillin, L.; Ciren, P.; Hou, Y.-T. Intersatellite Radiance Biases for the High-Resolution Infrared Radiation Sounders (HIRS) on board NOAA-15, -16, and -17 from Simultaneous Nadir Observations. J. Atmos. Ocean. Technol. 2005, 22, 381–395. [Google Scholar] [CrossRef]
  8. Prabhakara, C.; Iacovazzi, R.; Yoo, J.-M.; Dalu, G. Global warming: Evidence from satellite observations. Geophys. Res. Lett. 2000, 27, 3517–3520. [Google Scholar] [CrossRef] [Green Version]
  9. Zou, C.-Z.; Goldberg, M.D.; Cheng, Z.; Grody, N.C.; Sullivan, J.T.; Cao, C.; Tarpley, D. Recalibration of microwave sounding unit for climate studies using simultaneous nadir overpasses. J. Geophys. Res. Atmos. 2006, 111, D19114. [Google Scholar] [CrossRef] [Green Version]
  10. Solomon, S.; Qin, D.; Manning, M.; Chen, Z.; Marquis, M.; Averyt, K.B.; Tignor, M.; Miller, H.L. Climate Change 2007—The Physical Science Basis: Contribution of Working Group I to the Fourth Assessment Report of the Intergovernmental Panel on Climate Change; Cambridge University Press: Cambridge, UK, 2007. [Google Scholar]
  11. Thorne, P.W.; Lanzante, J.R.; Peterson, T.C.; Seidel, D.J.; Shine, K.P. Tropospheric temperature trends: History of an ongoing controversy. Wiley Interdiscip. Rev.—Clim. Chang 2010, 2, 66–88. [Google Scholar] [CrossRef]
  12. Christy, J.R.; Spencer, R.W.; Norris, W.B.; Braswell, W.D.; Parker, D.E. Error Estimates of Version 5.0 of MSU–AMSU Bulk Atmospheric Temperatures. J. Atmos. Ocean. Technol. 2003, 20, 613–629. [Google Scholar] [CrossRef]
  13. Mears, C.A.; Wentz, F.J. Construction of the Remote Sensing Systems V3.2 Atmospheric Temperature Records from the MSU and AMSU Microwave Sounders. J. Atmos. Ocean. Technol. 2009, 26, 1040–1056. [Google Scholar] [CrossRef] [Green Version]
  14. Zou, C.-Z.; Wang, W. Stability of the MSU-Derived Atmospheric Temperature Trend. J. Atmos. Ocean. Technol. 2010, 27, 1960–1971. [Google Scholar] [CrossRef]
  15. Weng, F.; Zou, X.; Wang, X.; Yang, S.; Goldberg, M.D. Introduction to Suomi national polar-orbiting partnership advanced technology microwave sounder for numerical weather prediction and tropical cyclone applications. J. Geophys. Res. Atmos. 2012, 117, D19112. [Google Scholar] [CrossRef]
  16. Weng, F.; Zou, X.; Sun, N.; Yang, H.; Tian, M.; Blackwell, W.J.; Wang, X.; Lin, L.; Anderson, K. Calibration of Suomi national polar-orbiting partnership advanced technology microwave sounder. J. Geophys. Res. Atmos. 2013, 118, 11187–11200. [Google Scholar] [CrossRef]
  17. Zou, X.; Weng, F.; Zhang, B.; Lin, L.; Qin, Z.; Tallapragada, V. Impacts of assimilation of ATMS data in HWRF on track and intensity forecasts of 2012 four landfall hurricanes. J. Geophys. Res. Atmos. 2013, 118, 11558–11576. [Google Scholar] [CrossRef]
  18. Han, Y.; Weng, F.; Zou, X.; Yang, H.; Scott, D. Characterization of geolocation accuracy of Suomi NPP Advanced Technology Microwave Sounder measurements. J. Geophys. Res. Atmos. 2016, 121, 4933–4950. [Google Scholar] [CrossRef] [Green Version]
  19. Zhou, L.; Divakarla, M.; Liu, X. An Overview of the Joint Polar Satellite System (JPSS) Science Data Product Calibration and Validation. Remote Sens. 2016, 8, 139. [Google Scholar] [CrossRef] [Green Version]
  20. Zhou, L.; Divakarla, M.; Liu, X.; Layns, A.; Goldberg, M. An Overview of the Science Performances and Calibration/Validation of Joint Polar Satellite System Operational Products. Remote Sens. 2019, 11, 698. [Google Scholar] [CrossRef] [Green Version]
  21. Cao, C.; Heidinger, A.K. Intercomparison of the Longwave Infrared Channels of MODIS and AVHRR/NOAA-16 Using Simultaneous Nadir Observations at Orbit Intersections. In Proceedings of the International Symposium on Optical Science and Technology, Seattle, DC, USA, 24 September 2002; Volume 4814, p. 24. [Google Scholar]
  22. Iacovazzi, R.; Cao, C. Reducing Uncertainties of SNO-Estimated Intersatellite AMSU-A Brightness Temperature Biases for Surface-Sensitive Channels. J. Atmos. Ocean. Technol. 2008, 25, 1048–1054. [Google Scholar] [CrossRef]
  23. Zhang, B.; Cao, C.; Lillibridge, J.; Miller, L. Assessing the Measurement Consistency Between the Jason-2/AMR and SARAL/AltiKa/DFMR Microwave Radiometers Using Simultaneous Nadir Observations. Mar. Geod. 2015, 38, 143–155. [Google Scholar] [CrossRef]
  24. Yang, H.; Burgdorf, M. A Study of Lunar Microwave Radiation Based on Satellite Observations. Remote Sens. 2020, 12, 1129. [Google Scholar] [CrossRef] [Green Version]
  25. Cucurull, L. Improvement in the Use of an Operational Constellation of GPS Radio Occultation Receivers in Weather Forecasting. Weather Forecast. 2010, 25, 749–767. [Google Scholar] [CrossRef]
  26. Ware, R.; Rocken, C.; Solheim, F.; Exner, M.; Schreiner, W.; Anthes, R.; Feng, D.; Herman, B.; Gorbunov, M.; Sokolovskiy, S.; et al. GPS Sounding of the Atmosphere from Low Earth Orbit: Preliminary Results. Bull. Am. Meteorol. Soc. 1996, 77, 19–40. [Google Scholar] [CrossRef] [Green Version]
  27. Kursinski, E.R.; Hajj, G.A.; Schofield, J.T.; Linfield, R.P.; Hardy, K.R. Observing Earth’s atmosphere with radio occultation measurements using the Global Positioning System. J. Geophys. Res. Atoms. 1997, 102, 23429–23465. [Google Scholar] [CrossRef]
  28. Zou, X.; Vandenberghe, F.; Wang, B.; Gorbunov, M.E.; Kuo, Y.-H.; Sokolovskiy, S.; Chang, J.C.; Sela, J.G.; Anthes, R.A. A ray-tracing operator and its adjoint for the use of GPS/MET refraction angle measurements. J. Geophys. Res. Atoms. 1999, 104, 22301–22318. [Google Scholar] [CrossRef] [Green Version]
  29. Ho, S.-P.; Anthes, R.A.; Ao, C.O.; Healy, S.; Horanyi, A.; Hunt, D.; Mannucci, A.J.; Pedatella, N.; Randel, W.J.; Simmons, A.; et al. The COSMIC/FORMOSAT-3 Radio Occultation Mission after 12 Years: Accomplishments, Remaining Challenges, and Potential Impacts of COSMIC-2. Bull. Am. Meteorol. Soc. 2020, 101, E1107–E1136. [Google Scholar] [CrossRef] [Green Version]
  30. Zeng, Z.; Sokolovskiy, S.; Schreiner, W.S.; Hunt, D. Representation of Vertical Atmospheric Structures by Radio Occultation Observations in the Upper Troposphere and Lower Stratosphere: Comparison to High-Resolution Radiosonde Profiles. J. Atmos. Ocean. Technol. 2019, 36, 655–670. [Google Scholar] [CrossRef]
  31. Alexander, S.P.; Tsuda, T.; Kawatani, Y.; Takahashi, M. Global distribution of atmospheric waves in the equatorial upper troposphere and lower stratosphere: COSMIC observations of wave mean flow interactions. J. Geophys. Res. Atoms. 2008, 113. [Google Scholar] [CrossRef]
  32. Biondi, R.; Randel, W.J.; Ho, S.-P.; Neubert, T.; Syndergaard, S. Thermal structure of intense convective clouds derived from GPS radio occultations. Atmos. Chem. Phys. 2012, 12, 5309–5318. [Google Scholar] [CrossRef] [Green Version]
  33. Ao, C.O.; Hajj, A.J. Monitoring the width of the tropical belt with GPS radio occultation measurements. Geophys. Res. Lett. 2013, 40, 6236–6241. [Google Scholar] [CrossRef]
  34. Luna, D.; Alexander, P.; De La Torre, A. Evaluation of uncertainty in gravity wave potential energy calculations through GPS radio occultation measurements. Adv. Space Res. 2013, 52, 879–882. [Google Scholar] [CrossRef]
  35. Nath, D.; Chen, W.; Guharay, A. Climatology of stratospheric gravity waves and their interaction with zonal mean wind over the tropics using GPS RO and ground-based measurements in the two phases of QBO. Theor. Appl. Clim. 2014, 119, 757–769. [Google Scholar] [CrossRef]
  36. Rieckh, T.; Anthes, R.; Randel, W.; Ho, S.-P.; Foelsche, U. Evaluating tropospheric humidity from GPS radio occultation, radiosonde, and AIRS from high-resolution time series. Atmos. Meas. Tech. 2018, 11, 3091–3109. [Google Scholar] [CrossRef] [Green Version]
  37. Healy, S.B.; Jupp, A.M.; Marquardt, C. Forecast impact experiment with GPS radio occultation measurements. Geophys. Res. Lett. 2005, 32. [Google Scholar] [CrossRef] [Green Version]
  38. Healy, S.B. Forecast impact experiment with a constellation of GPS radio occultation receivers. Atmos. Sci. Lett. 2008, 9, 111–118. [Google Scholar] [CrossRef]
  39. Poli, P.; Moll, P.; Puech, D.; Rabier, F.; Healy, S.B. Quality Control, Error Analysis, and Impact Assessment of FORMOSAT-3/COSMIC in Numerical Weather Prediction. Terr. Atmos. Ocean. Sci. 2009, 20, 101. [Google Scholar] [CrossRef] [Green Version]
  40. Rennie, M.P. The impact of GPS radio occultation assimilation at the Met Office. Q. J. R. Meteorol. Soc. 2010, 136, 116–131. [Google Scholar] [CrossRef]
  41. Bauer, P.; Radnóti, G.; Healy, S.; Cardinali, C. GNSS Radio Occultation Constellation Observing System Experiments. Mon. Weather. Rev. 2014, 142, 555–572. [Google Scholar] [CrossRef]
  42. Bonavita, M. On some aspects of the impact of GPSRO observations in global numerical weather prediction. Q. J. R. Meteorol. Soc. 2013, 140, 2546–2562. [Google Scholar] [CrossRef] [Green Version]
  43. Anthes, R.A.; Bernhardt, P.A.; Chen, Y.; Cucurull, L.; Dymond, K.F.; Ector, D.; Healy, S.B.; Ho, S.-P.; Hunt, D.C.; Kuo, Y.-H.; et al. The COSMIC/FORMOSAT-3 Mission: Early Results. Bull. Am. Meteorol. Soc. 2008, 89, 313–334. [Google Scholar] [CrossRef]
  44. Ho, S.-P.; He, W.; Kuo, Y.-H. Construction of Consistent Temperature Records in the Lower Stratosphere Using Global Positioning System Radio Occultation Data and Microwave Sounding Measurements. In New Horizons in Occultation Research: Studies in Atmosphere and Climate; Steiner, A., Pirscher, B., Foelsche, U., Kirchengast, G., Eds.; Springer: Berlin/Heidelberg, Germany, 2009; pp. 207–217. ISBN 978-3-642-00321-9. [Google Scholar]
  45. Ho, S.-P.; Goldberg, M.; Kuo, Y.-H.; Zou, C.-Z.; Schreiner, W. Calibration of Temperature in the Lower Stratosphere from Microwave Measurements Using COSMIC Radio Occultation Data: Preliminary Results. Terr. Atmos. Ocean. Sci. 2009, 20, 87. [Google Scholar] [CrossRef] [Green Version]
  46. Ho, S.-P.; Kuo, Y.-H.; Zeng, Z.; Peterson, T.C. A comparison of lower stratosphere temperature from microwave measurements with CHAMP GPS RO data. Geophys. Res. Lett. 2007, 34. [Google Scholar] [CrossRef] [Green Version]
  47. Iacovazzi, R.; Lin, L.; Sun, N.; Liu, Q. NOAA Operational Microwave Sounding Radiometer Data Quality Monitoring and Anomaly Assessment Using COSMIC GNSS Radio-Occultation Soundings. Remote Sens. 2020, 12, 828. [Google Scholar] [CrossRef] [Green Version]
  48. Zou, X.; Lin, L.; Weng, F. Absolute Calibration of ATMS Upper Level Temperature Sounding Channels Using GPS RO Observations. IEEE Trans. Geosci. Remote Sens. 2013, 52, 1397–1406. [Google Scholar] [CrossRef]
  49. Schreiner, W.S.; Weiss, J.P.; Anthes, R.A.; Braun, J.; Chu, V.; Fong, J.; Hunt, D.; Kuo, Y.-H.; Meehan, T.; Serafino, W.; et al. COSMIC-2 Radio Occultation Constellation: First Results. Geophys. Res. Lett. 2020, 47, e2019GL086841. [Google Scholar] [CrossRef]
  50. Ho, S.-P.; Zhou, X.; Shao, X.; Zhang, B.; Adhikari, L.; Kireev, S.; He, Y.; Yoe, J.; Xia-Serafino, W.; Lynch, E. Initial Assessment of the COSMIC-2/FORMOSAT-7 Neutral Atmosphere Data Quality in NESDIS/STAR Using In Situ and Satellite Data. Remote Sens. 2020, 12, 4099. [Google Scholar] [CrossRef]
  51. Chen, S.-Y.; Liu, C.-Y.; Huang, C.-Y.; Hsu, S.-C.; Li, H.-W.; Lin, P.-H.; Cheng, J.-P.; Huang, C.-Y. An Analysis Study of FORMOSAT-7/COSMIC-2 Radio Occultation Data in the Troposphere. Remote Sens. 2021, 13, 717. [Google Scholar] [CrossRef]
  52. Healy, S. ECMWF Starts Assimilating COSMIC-2 Data. Available online: https://www.ecmwf.int/en/newsletter/163/news/ecmwf-starts-assimilating-cosmic-2-data (accessed on 29 October 2020).
  53. Wee, T.-K. A variational regularization of Abel transform for GPS radio occultation. Atmos. Meas. Tech. 2018, 11, 1947–1969. [Google Scholar] [CrossRef] [Green Version]
  54. Shao, H. JCSDA Support Leading to the Implementation of Operational Assimilation of COSMIC-2 Data. Available online: https://www.jcsda.org/news-blog/2020/6/2/jcsda-support-leading-to-the-implementation-of-operational-assimilation-of-cosmic-2-datanbsp (accessed on 1 November 2020).
  55. Han, Y.; Van Delst, P.; Weng, F.; Liu, Q.; Groff, D.; Yan, B.; Chen, Y.; Vogel, R. Current Status of the JCSDA Community Radiative Transfer Model (CRTM). In Proceedings of the International Advanced Television and Infrared Observation Satellite Operational Vertical Sounder (ATOVS) Study Conference, Monterey, CA, USA, 14–20 April 2010. [Google Scholar]
  56. Chen, Y.; Han, Y.; van Delst, P.; Weng, F. Assessment of Shortwave Infrared Sea Surface Reflection and Nonlocal Thermodynamic Equilibrium Effects in the Community Radiative Transfer Model Using IASI Data. J. Atmos. Ocean. Technol. 2013, 30, 2152–2160. [Google Scholar] [CrossRef]
  57. Liu, Q.; Boukabara, S.A. Community Radiative Transfer Model (CRTM) applications in supporting the Suomi National Polar-orbiting Partnership (SNPP) mission validation and verification. Remote Sens. Environ. 2014, 140, 744–754. [Google Scholar] [CrossRef]
  58. Ho, S.; Shao, X.; Chen, Y.; Zhang, B.; Adhikari, L.; Zhou, X. NESDIS STAR GNSS RO Processing, Validation, and Monitoring System: Initial Validation of the STAR COSMIC-2 Data Products. Terr. Atmos. Ocean. Sci. 2021. [Google Scholar]
  59. Shao, X.; Ho, S.-P.; Zhang, B.; Zhou, X.; Kireev, S.; Chen, Y.; Cao, C. Comparison of COSMIC-2 Radio Occultation Retrieval Products with Vaisala RS41 and RS92 Radiosonde Water Vapor and Upper-Air Temperature Measurements. Terr. Atmos. Ocean. Sci. 2021. [Google Scholar]
  60. Kim, E.; Lyu, C.-H.J.; Anderson, K.; Leslie, R.V.; Blackwell, W.J. S-NPP ATMS instrument prelaunch and on-orbit performance evaluation. J. Geophys. Res. Atmos. 2014, 119, 5653–5670. [Google Scholar] [CrossRef] [Green Version]
  61. Xie, F.; Syndergaard, S.; Kursinski, E.R.; Herman, B.M. An Approach for Retrieving Marine Boundary Layer Refractivity from GPS Occultation Data in the Presence of Superrefraction. J. Atmos. Ocean. Technol. 2006, 23, 1629–1644. [Google Scholar] [CrossRef]
  62. Xie, F.; Wu, D.L.; Ao, C.O.; Kursinski, E.R.; Mannucci, A.J.; Syndergaard, S. Super-refraction effects on GPS radio occultation refractivity in marine boundary layers. Geophys. Res. Lett. 2010, 37. [Google Scholar] [CrossRef]
  63. Cao, C.; Wang, W.; Lynch, E.; Bai, Y.; Ho, S.-P.; Zhang, B. Simultaneous Radio Occultation for Intersatellite Comparison of Bending Angles toward More Accurate Atmospheric Sounding. J. Atmos. Ocean. Technol. 2020, 37, 2307–2320. [Google Scholar] [CrossRef]
  64. Chen, Y.; Shao, X.; Cao, C.; Ho, S.-P. Simultaneous Radio Occultation Predictions for Inter-Satellite Comparison of Bending Angle Profiles from COSMIC-2 and GeoOptics. Remote Sens. 2021, 13, 3644. [Google Scholar] [CrossRef]
  65. Kishore, P.; Namboothiri, S.P.; Jiang, J.H.; Sivakumar, V.; Igarashi, K. Global temperature estimates in the troposphere and stratosphere: A validation study of COSMIC/FORMOSAT-3 measurements. Atmos. Chem. Phys. Discuss. 2009, 9, 897–908. [Google Scholar] [CrossRef] [Green Version]
  66. Ruston, B.; Healy, S. Forecast Impact of FORMOSAT-7/COSMIC-2 GNSS Radio Occultation Measurements. Atmos. Sci. Lett. 2020, 22, e1019. [Google Scholar] [CrossRef]
Figure 1. The weighting function and peak sounding height of SNPP ATMS channels CH07–CH14 and CH19–22 studied in this paper.
Remotesensing 13 03754 g001
Figure 2. RTM simulation setup with CRTM as the simulator for inter-comparison between SNPP ATMS and COSMIC-2 measurements.
Remotesensing 13 03754 g002
Figure 3. Global collocation distribution (number of collocations in 2° × 2° grid) between COSMIC-2 RO and SNPP ATMS measurements over the ocean.
Remotesensing 13 03754 g003
Figure 4. Trending of BT bias between BTCOSMIC-2, WETPf2, and SNPP ATMS measurements over 15 months from 1 October 2019, to 31 December 2021, for ATMS CH07–14. Vertical lines at 25 September 2020 mark when UCAR implements a WETPf2 1DVAR algorithm update.
Remotesensing 13 03754 g004
Figure 5. Trending of BT bias between BTCOSMIC-2,WETPf2, and SNPP ATMS measurements over 15 months from 1 October 2019, to 31 December 2020, for ATMS CH19–22. Vertical lines at 25 September 2020 mark when UCAR implements a WETPf2 1DVAR algorithm update.
Remotesensing 13 03754 g005
Figure 6. Summary of (a) mean BT bias μBT) and (b) uncertainty σBT) between CRTM-simulated BT with COSMIC-2 UCAR WETPrf or WETPf2 data as inputs and SNPP ATMS measurements for ATMS CH07–14 and CH19–22. (c) Derived trending slope DBTWETPf2) of CRTM-simulated COSMIC-2 WETPf2 data compared with ATMS measurements from 16 October 2019, to 20 September 2020.
Remotesensing 13 03754 g006
Figure 7. (a) Temperature (T) and (b) specific humidity (SH) profile difference (solid line) and uncertainty (dashed line) vs. mean sea level (MSL) height between UCAR COSMIC-2 WETPrf and WETPf2 data in October 2019. (c) Fractional refractivity (%) difference between refractivity derived from UCAR COSMIC-2 WETPrf data and refractivity read directly from UCAR ATMPrf. (d) Fractional refractivity (%) difference between refractivity derived from UCAR COSMIC-2 WETPf2 data and that read directly from UCAR ATMPrf data.
Remotesensing 13 03754 g007
Figure 8. Scatter plots of ATMS BT vs. BTWETPrf (left column, ae) and ATMS BT vs. BTWETPf2 (right column, fj) for ATMS CH08 (panel a,b), CH10 (panel c,d), CH12 (panel e,f), CH13 (panel g,h) and CH20 (panel i,j), respectively. The data are grouped into three latitude regions: −48° to −30°, −30° to 30°, and 30° to 48° with color-coding. The data used to make the plots are collocated ATMS and COSMIC-2 data over the ocean in 2019–10.
Remotesensing 13 03754 g008
Figure 9. Latitude-dependence of BT biases and uncertainties between CRTM-simulated BT with UCAR WETPf2 data and SNPP ATMS measurements over three latitude regions for ATMS CH10–14 and CH19–22.
Remotesensing 13 03754 g009
Figure 10. Global distribution of ΔBTWETPf2 over the ocean between simulated BT from UCAR COSMIC-2 WETPf2 data and ATMS measurements for selected ATMS channels: CH08 (panel a), CH09 (panel b), CH10 (panel c), and CH12 (panel d).
Remotesensing 13 03754 g010
Figure 11. SZA-dependence of CRTM-simulated BT vs. ATMS BT bias (ΔBTWETPf2) over northern and southern hemispheres for selected ATMS channels: CH08 (panel a), CH09 (panel b), CH10 (panel c), and CH12 (panel d).
Remotesensing 13 03754 g011
Figure 12. Trending of COSMIC-2 vs. ECMWF O-B BT biases through double-difference between ΔBTCOSMIC-2,WETPf2, and ΔBTECMWF over 8 months from 1 October 2019, to 31 May 2020, for ATMS CH07–14. The vertical line marks the day (25 March 2020) of assimilating COSMIC-2 RO data into ECMWF.
Remotesensing 13 03754 g012
Figure 13. Trending of COSMIC-2 vs. ECMWF O-B BT bias ΔBTC2-ECMWF through double-difference between ΔBTCOSMIC-2,WETPf2, and ΔBTECMWF over 8 months from 1 October 2019, to 31 May 2020, for ATMS CH19–22.
Remotesensing 13 03754 g013
Figure 14. Summary of (a) mean COSMIC-2 vs. ECMWF O-B BT bias μBTC2-ECMWF) and (b) trending slope DBTC2-ECMWF) over intervals before and after the assimilation of COSMIC-2 RO data into ECMWF on 25 March 2020.
Remotesensing 13 03754 g014
Table 1. Characteristics of ATMS channels studied in this paper.
ATMS ChannelCentral Frequency (GHz)Peak Sounding Height (km)3 dB Beam Width (°)Specified Accuracy and NEDT (K)
CH0754.408.062.20.75/0.7
CH0854.9410.612.20.75/0.7
CH0955.5013.082.20.75/0.7
CH1057.29034417.102.20.75/0.75
CH1157.290344 ± 0.21720.892.20.75/1.2
CH1257.290344 ± 0.3222 ± 0.04825.842.20.75/1.2
CH1357.290344 ± 0.3222 ± 0.02230.872.20.75/1.5
CH1457.290344 ± 0.3222 ± 0.01035.662.20.75/2.4
CH19183.31 ± 4.53.181.11/0.8
CH20183.31 ± 3.04.271.11/0.8
CH21183.31 ± 1.85.581.11/0.8
CH22183.31 ± 1.06.661.11/0.9
Table 2. Temperature/humidity profile data sets used in the CRTM modeling for COSMIC-2 vs. SNPP ATMS inter-comparison.
Data Set NameProvided byTime Coverage
UCAR-WETPrf.UCAR1 October 2019 to 31 October 2019
UCAR-WETPf2UCAR1 October 2019 to 31 December 2020
ERA5 (background)ECMWF1 October 2019 to 31 December 2020
Table 3. Summary of mean BT biases μBT) and trending slope DBTWETPf2) ± 95% Confidence Interval (CI) between CRTM-simulated BT data with COSMIC-2 UCAR WETPrf or WETPf2 temperature/humidity data as inputs and SNPP ATMS measurements for ATMS CH7–CH14 and CH19–H22.
ATMS ChannelPeak Sounding Height (km)μBTWETPrf) ± σBTWETPrf) (K)μBTWETPf2) ± σBTWETPf2) (K)μBTWETPf2) ± σBTWETPf2) (K)DBTWETPf2) ± 95% CI (K/year)
16 October 2019–31 October 20191 October 2019–15 October 201916 October 2019–20 September 202016 October 2019–20 September 2020
CH078.06−0.31 ± 0.64−0.53 ± 0.34−0.12 ± 0.390.003 ± 0.019
CH0810.610.63 ± 0.390.54 ± 0.230.68 ± 0.24−0.003 ± 0.008
CH0913.080.58 ± 0.470.64 ± 0.280.64 ± 0.300.011 ± 0.012
CH1017.100.32 ± 0.720.65 ± 0.440.42 ± 0.470.004 ± 0.021
CH1120.890.21 ± 0.910.54 ± 0.460.29 ± 0.480.064 ± 0.021
CH1225.840.13 ± 1.320.36 ± 0.480.24 ± 0.530.146 ± 0.026
CH1330.870.18 ± 2.040.41 ± 0.710.31 ± 0.740.193 ± 0.033
CH1435.660.35 ± 2.920.57 ± 1.020.33 ± 1.050.208 ± 0.054
CH193.180.30 ± 0.970.23 ± 0.87−0.14 ± 0.870.056 ± 0.035
CH204.270.04 ± 1.280.29 ± 1.21−0.27 ± 1.160.018 ± 0.051
CH215.58−0.35 ± 1.710.02 ± 1.66−0.47 ± 1.62−0.006 ± 0.080
CH226.66−1.01 ± 2.16−0.45 ± 2.15−0.99 ± 2.15−0.066 ± 0.115
Table 4. Summary of mean COSMIC-2 vs. ECMWF O-B BT bias μBTC2-ECMWF) ± σBTC2-ECMWF) and trending slope DBTC2-ECMWF) ± 95% CI for ATMS CH07–CH14 and CH19–22 over intervals before and after the assimilation of COSMIC-2 RO data into ECMWF on 25 March 2020.
ChannelμBTC2-ECMWF) ± σBTC2-ECMWF) (K) (15 October 2019 to 24 March 2020)DBTC2-ECMWF) ± 95% CI (K/year) (15 October 2019 to 24 March 2020)μBTC2-ECMWF) ± σBTC2-ECMWF) (K) (15 May 2020 to 31 May 2020)DBTC2-ECMWF) ± 95% CI (K/year) (25 March 2020 to 31 May 2020)
CH07−0.22 ± 0.420.06 ± 0.05−0.25 ± 0.410.14 ± 0.18
CH08−0.04 ± 0.310.06 ± 0.03−0.06 ± 0.300.12 ± 0.10
CH09−0.12 ± 0.400.05 ± 0.04−0.13 ± 0.390.10 ± 0.14
CH10−0.35 ± 0.64−0.06 ± 0.06−0.30 ± 0.660.40 ± 0.22
CH11−0.38 ± 0.66−0.04 ± 0.06−0.26 ± 0.661.01 ± 0.25
CH12−0.48 ± 0.710.03 ± 0.08−0.23 ± 0.752.05 ± 0.35
CH13−0.64 ± 0.98−0.12 ± 0.09−0.22 ± 1.033.21 ± 0.45
CH14−0.80 ± 1.35−0.31 ± 0.15−0.28 ± 1.404.02 ± 0.55
CH19−0.11 ± 1.090.22 ± 0.12−0.08 ± 1.090.01 ± 0.36
CH200.17 ± 1.450.08 ± 0.170.21 ± 1.430.25 ± 0.57
CH210.38 ± 1.96−0.01 ± 0.240.41 ± 1.940.35 ± 0.96
CH220.60 ± 2.55−0.11 ± 0.350.63 ± 2.530.50 ± 1.33
Publisher’s Note: MDPI stays neutral with regard to jurisdictional claims in published maps and institutional affiliations.

