3.1. Four-GNSS
Detailed characteristics of the four-GNSS constellations are given in
Table 1. According to the satellite observation probability estimation methodology, we derived the
of the four-GNSS MEO satellites, which are list in
Table 1. Then, the
of the four-GNSS MEO satellites were calculated. The results are presented in
Figure 1. Moreover, 12 Galileo 2nd Generation satellites will join the existing constellation [
13,
14]. In the future, there will be 36 Galileo satellites int space to provide global services. Hence, the results of the full Galileo constellation are also shown in
Table 1 and
Figure 1. The satellite observation probability of BDS-3M is similar to that of the 24-satellite Galileo constellation and is less than that of the GPS and the 36-satellite Galileo constellation because there are fewer MEO satellites in BDS-3. With the largest orbit inclination, GLONASS satellites cover a wider range of latitudes, which disperses the probability of latitudinal distribution and results in a minimum observation probability compared to the other systems. Based on the observation probability, the satellite visibility and the DOPs of four-GNSS and their next-generation constellations are estimated and analyzed in the following paragraph.
BDS-3 adopts a heterogeneous constellation design and comprehensively completes deployment [
9]. For future development, Yang et al. [
10] provided several suggestions, one of which was to increase the inclination of IGSO satellites to improve the navigation services in the Arctic region for scientific research and transportation. Based on the observation probability of IGSO satellites
, we derived the average elevation angle
of the IGSO satellites through Equation (16):
where
is the elevation angle of a satellite on the grid
.
The
of the IGSO constellations with 55°, 60°, 65°, 70°, and 75° inclinations are presented in
Table 2. It can be seen that with the nominal constellation parameters of BDS-3I, the average elevation angle is 31.02 at high latitudes (
) in the Eastern Hemisphere. The improvement rate of the average elevation angle is approximately 7% when the inclination of the IGSO is increased by 5°. The average elevation angle reaches 40.06° when the inclination of 3 BDS-3I increases to 75°.
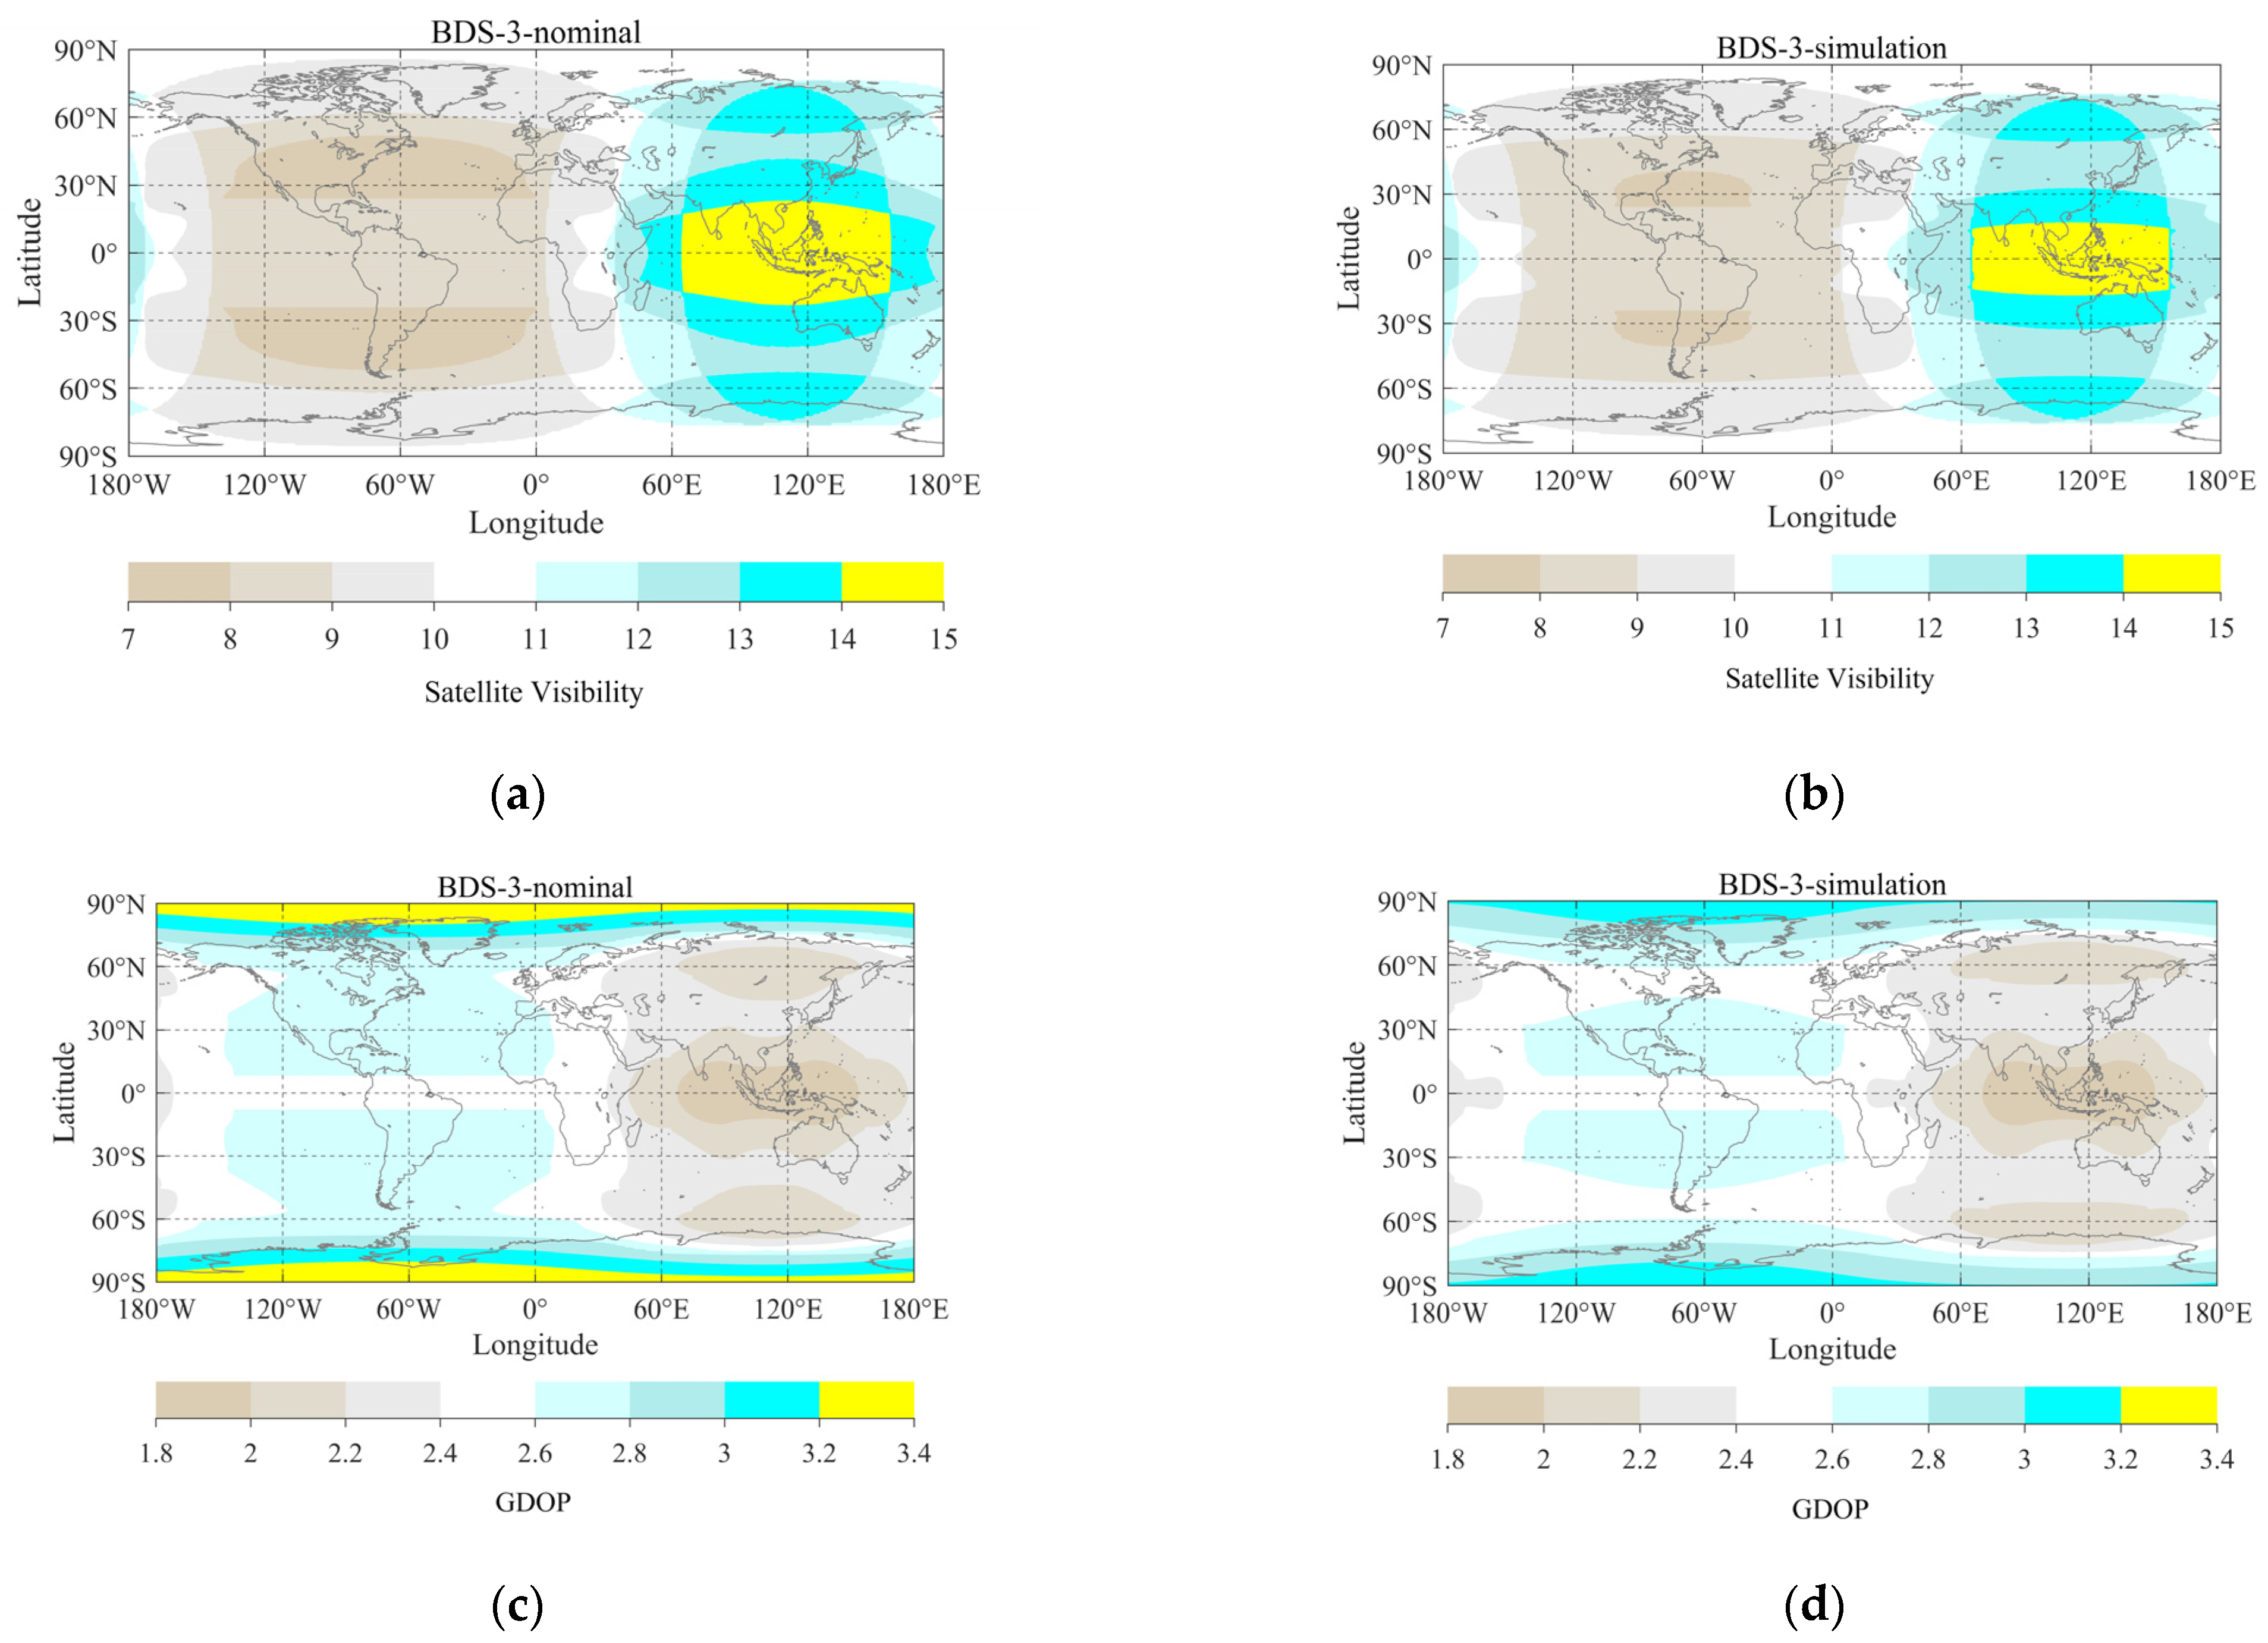
To assess the performance of BDS-3 by adjusting the inclination of BDS-3I from 55° (BDS-3-nominal) to 75° (BDS-3-simulation), satellite visibility and GDOP were calculated. The results are shown in
Figure 2 and
Table 3. The number of visible BDS-3-nominal satellites ranges from 7 to 15 (average: 10.46), which is almost the same as that of the BDS-3-simulation (average: 10.49). Specifically, in the Asia-Pacific region, more than 12 satellites can be observed. The GDOP for both is less than 2.4. As the BDS-3I inclination increases, the GDOP decreases by approximately 3.8–8.0% (average: 6.9%) in the high-latitude region, while that in the high latitudes of the Eastern Hemisphere, the GDOP is 7.2% on average. It is clear that the BDS-3-simulation constellation can improve the geometric distribution of satellites in the Arctic region.
The first satellite of the Galileo 2nd generation is anticipated to launch before the end of 2024, and the full Galileo constellation will consist of 36 satellites [
13,
14,
37].
Figure 3 shows the satellite visibility and GDOP of the 1st generation Galileo (Galileo 1st) and the full constellation (Galileo 2nd). With the number of total satellites increasing, the visible satellites of Galileo 2nd range from 11 to 14 (average: 12.80), which is about four more than that of the 1st generation (average: 8.53). Ranging from 2.02 to 2.78 (average: 2.26), the improvement rate of the Galileo 2nd GDOP is 18.4% on average. In general, the GDOP of the Galileo 2nd is smaller in mid–low latitude regions (range from 2.08 to 2.41) than it is at
latitude regions (range from 2.44 to 2.72).
To improve performance over Russia, GLONASS plans to add IGSO or high Earth orbit (HEO) satellites; however, orbit parameters are still under discussion [
11,
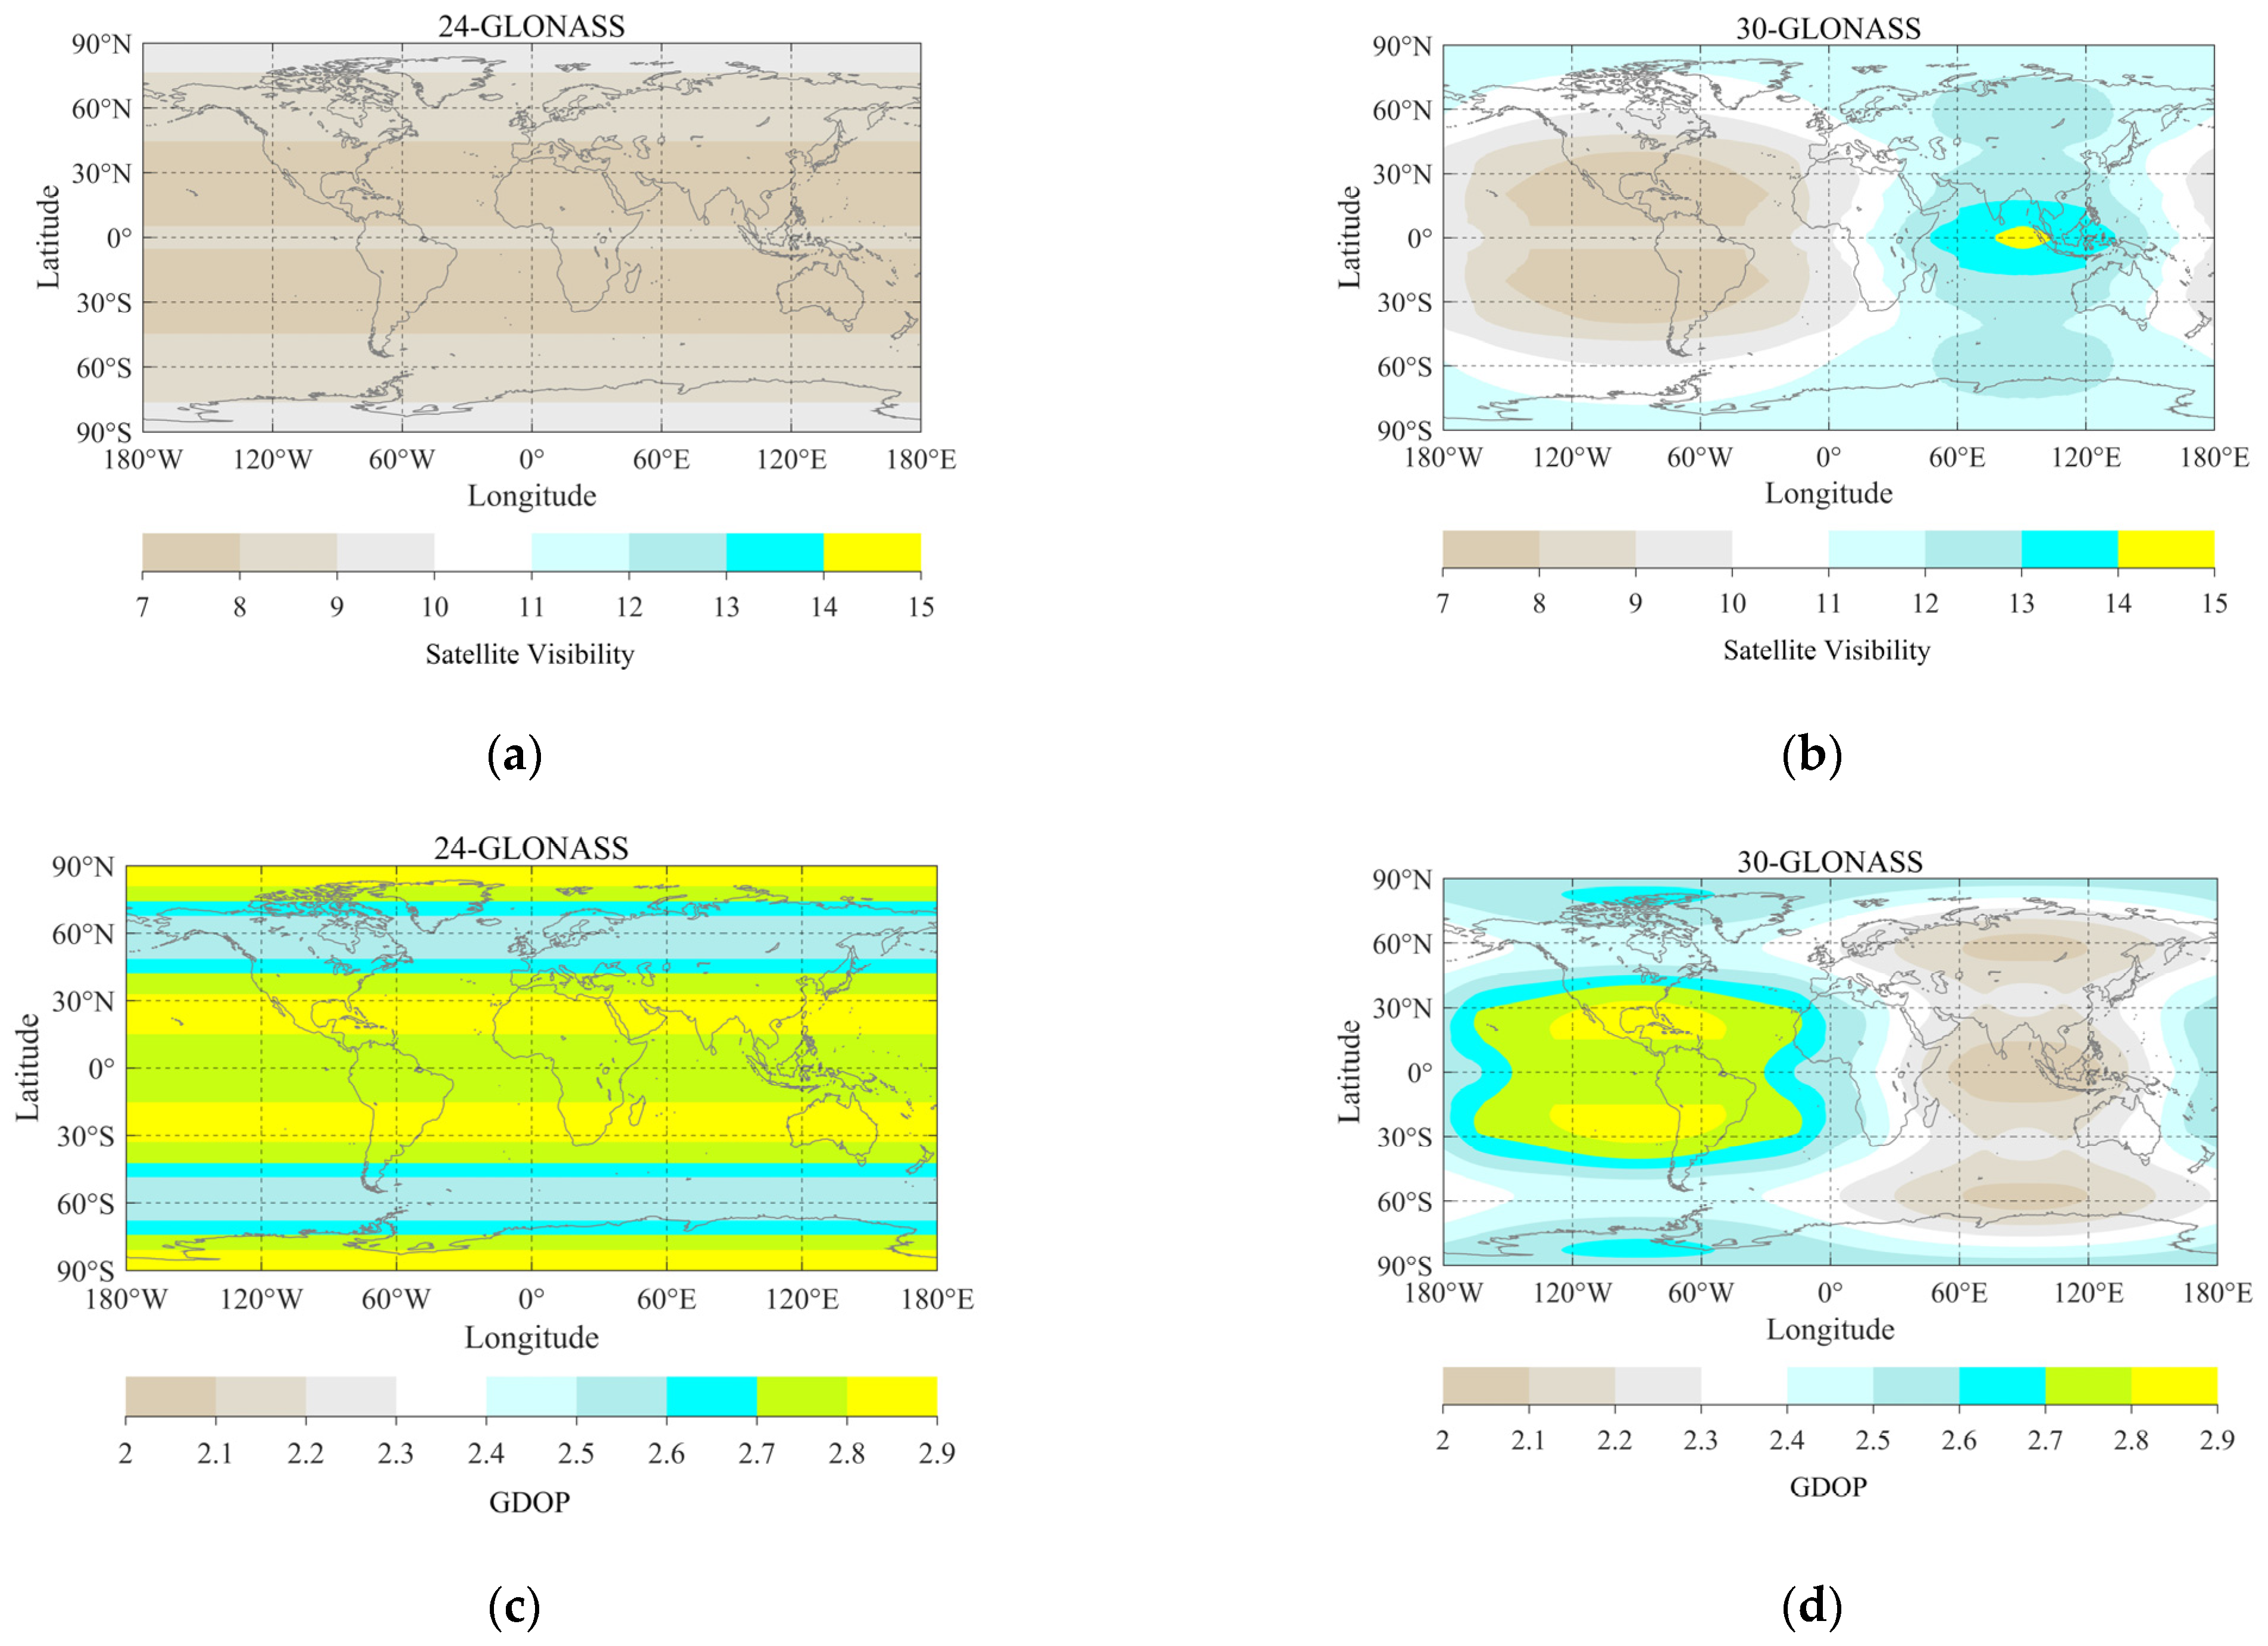
12]. In this study, we simulate six IGSO (GLONASS-I) satellite-enhancement constellations. Satellites equally operate in three orbits with a center longitude of 60°E, 90°E, and 120°E, respectively, to ensure the availability of augmentation over the whole of Russia. The inclination of the orbital planes is 64.8°, which is the same as that of the GLONASS MEO satellites. The satellite visibility of 24-GLONASS and 30-GLONASS as well as the GDOP are shown in
Figure 4. It can be seen that 7–10 satellites of 24-GLONASS can be observed worldwide. Fewer satellites can be observed over mid-latitude regions (
) if compared to visibility at other latitudes. Adding six GLONASS-I to 24-GLONASS increases the number of visible satellites by 1.7–6 (average: 3.46) in the Eastern Hemisphere. In Russia and its surrounding areas (20°E–170°W, 40°N–85°N), the improvement is from 1.8 to 4.33 (average: 3.08). The GDOP of 24-GLONASS is smaller at latitudes of 45–70° than it is at lower latitudes and at the north and south ends. For 30-GLONASS, the GDOP decreases by 15.7% on average in the Eastern Hemisphere and by 14.4% in (20°E–170°W, 40°N~85°N) regions.
The GPS modernization program includes 10 GPS III satellites and 22 GPS IIIF satellites. The previous generation orbit parameters are still adopted for the 32 MEO satellites [
7,
38]. The satellite visibility and GDOP of the GPS are plotted in
Figure 5. More GPS satellites can be observed over low latitudes (
) and high latitudes (
), which is similar to the distribution of Galileo. Compared to BDS-3 and 30-GLONASS, the number of visible GPS and Galileo satellites is more globally balanced. However, although there are fewer satellites in the BDS-3 and 30-GLONASS constellations, they show better GDOP in the Asia-Pacific region and in the high latitudes of the Eastern Hemisphere, which are benefits of GEO and IGSO satellite-augmented MEO constellations.
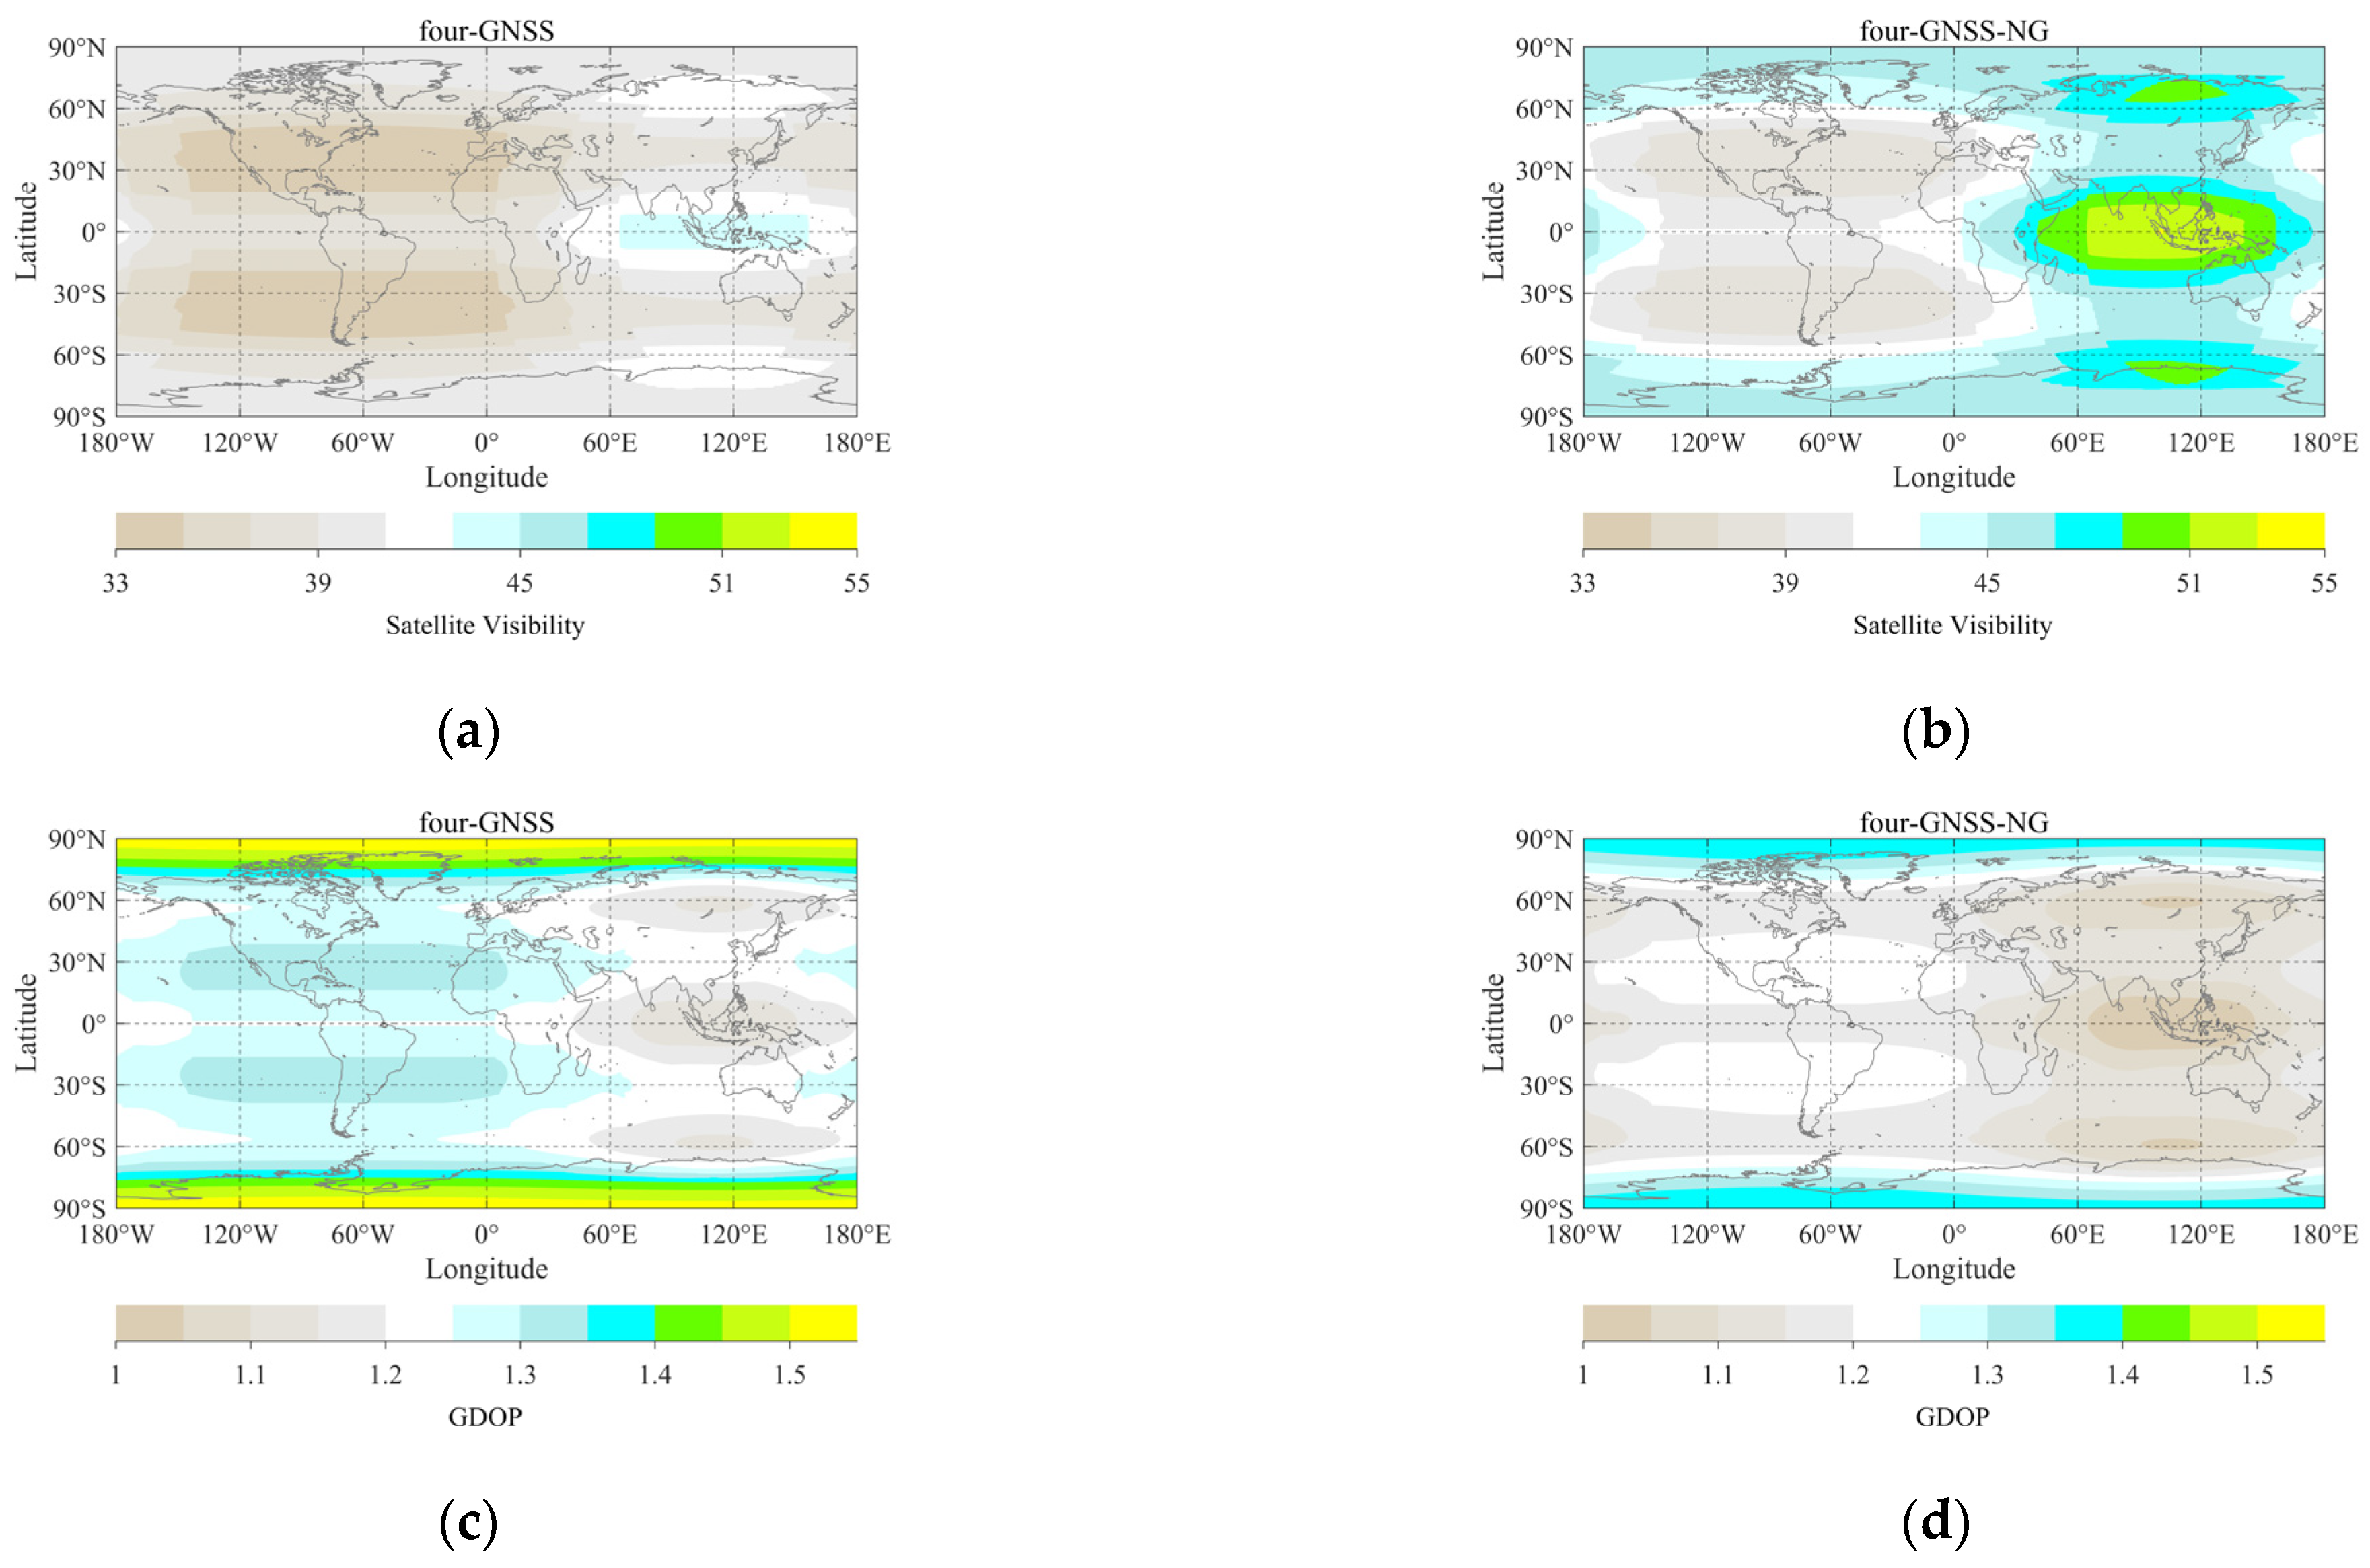
The satellite visibility and GDOP of the four-GNSS and four-GNSS-NG are illustrated in
Figure 6. The number of visible four-GNSS satellites is 33–45 worldwide (average: 38.25). When the four-GNSS are upgraded, the average number visible satellites of the four-GNSS-NG will reach 44.86, which is an increase of 6-7 satellites compared to four-GNSS. With the help of the BDS-3I, BDS-3G, and GLONASS-I satellites, the Asia-Pacific region will become the hottest GNSS area in the world, and more than 45 satellites will be able to be observed. In contrast, the number of observed satellites in the North, Central, and South America regions will be fewer. However, at least 37 satellites will still be able to be observed. Overall, the combination positioning of the four-GNSS-NG can greatly enhance the availability of satellite navigation and can provide more observations for global users. A benefit of the satellite visibility increasing is that the four-GNSS-NG satellites exhibit a better geometrical structure, which is helpful for the significant decrease in the GDOP. The average GDOP of the four-GNSS-NG is 1.19, which is an improvement rate of 7.8% on average compared to that of four-GNSS (average: 1.29). Additionally, at high-latitude regions, the there is a distinct GDOP increase of nearly 1.2, which is mainly caused by the lower elevation of the satellites observed and an increase in the station latitude.
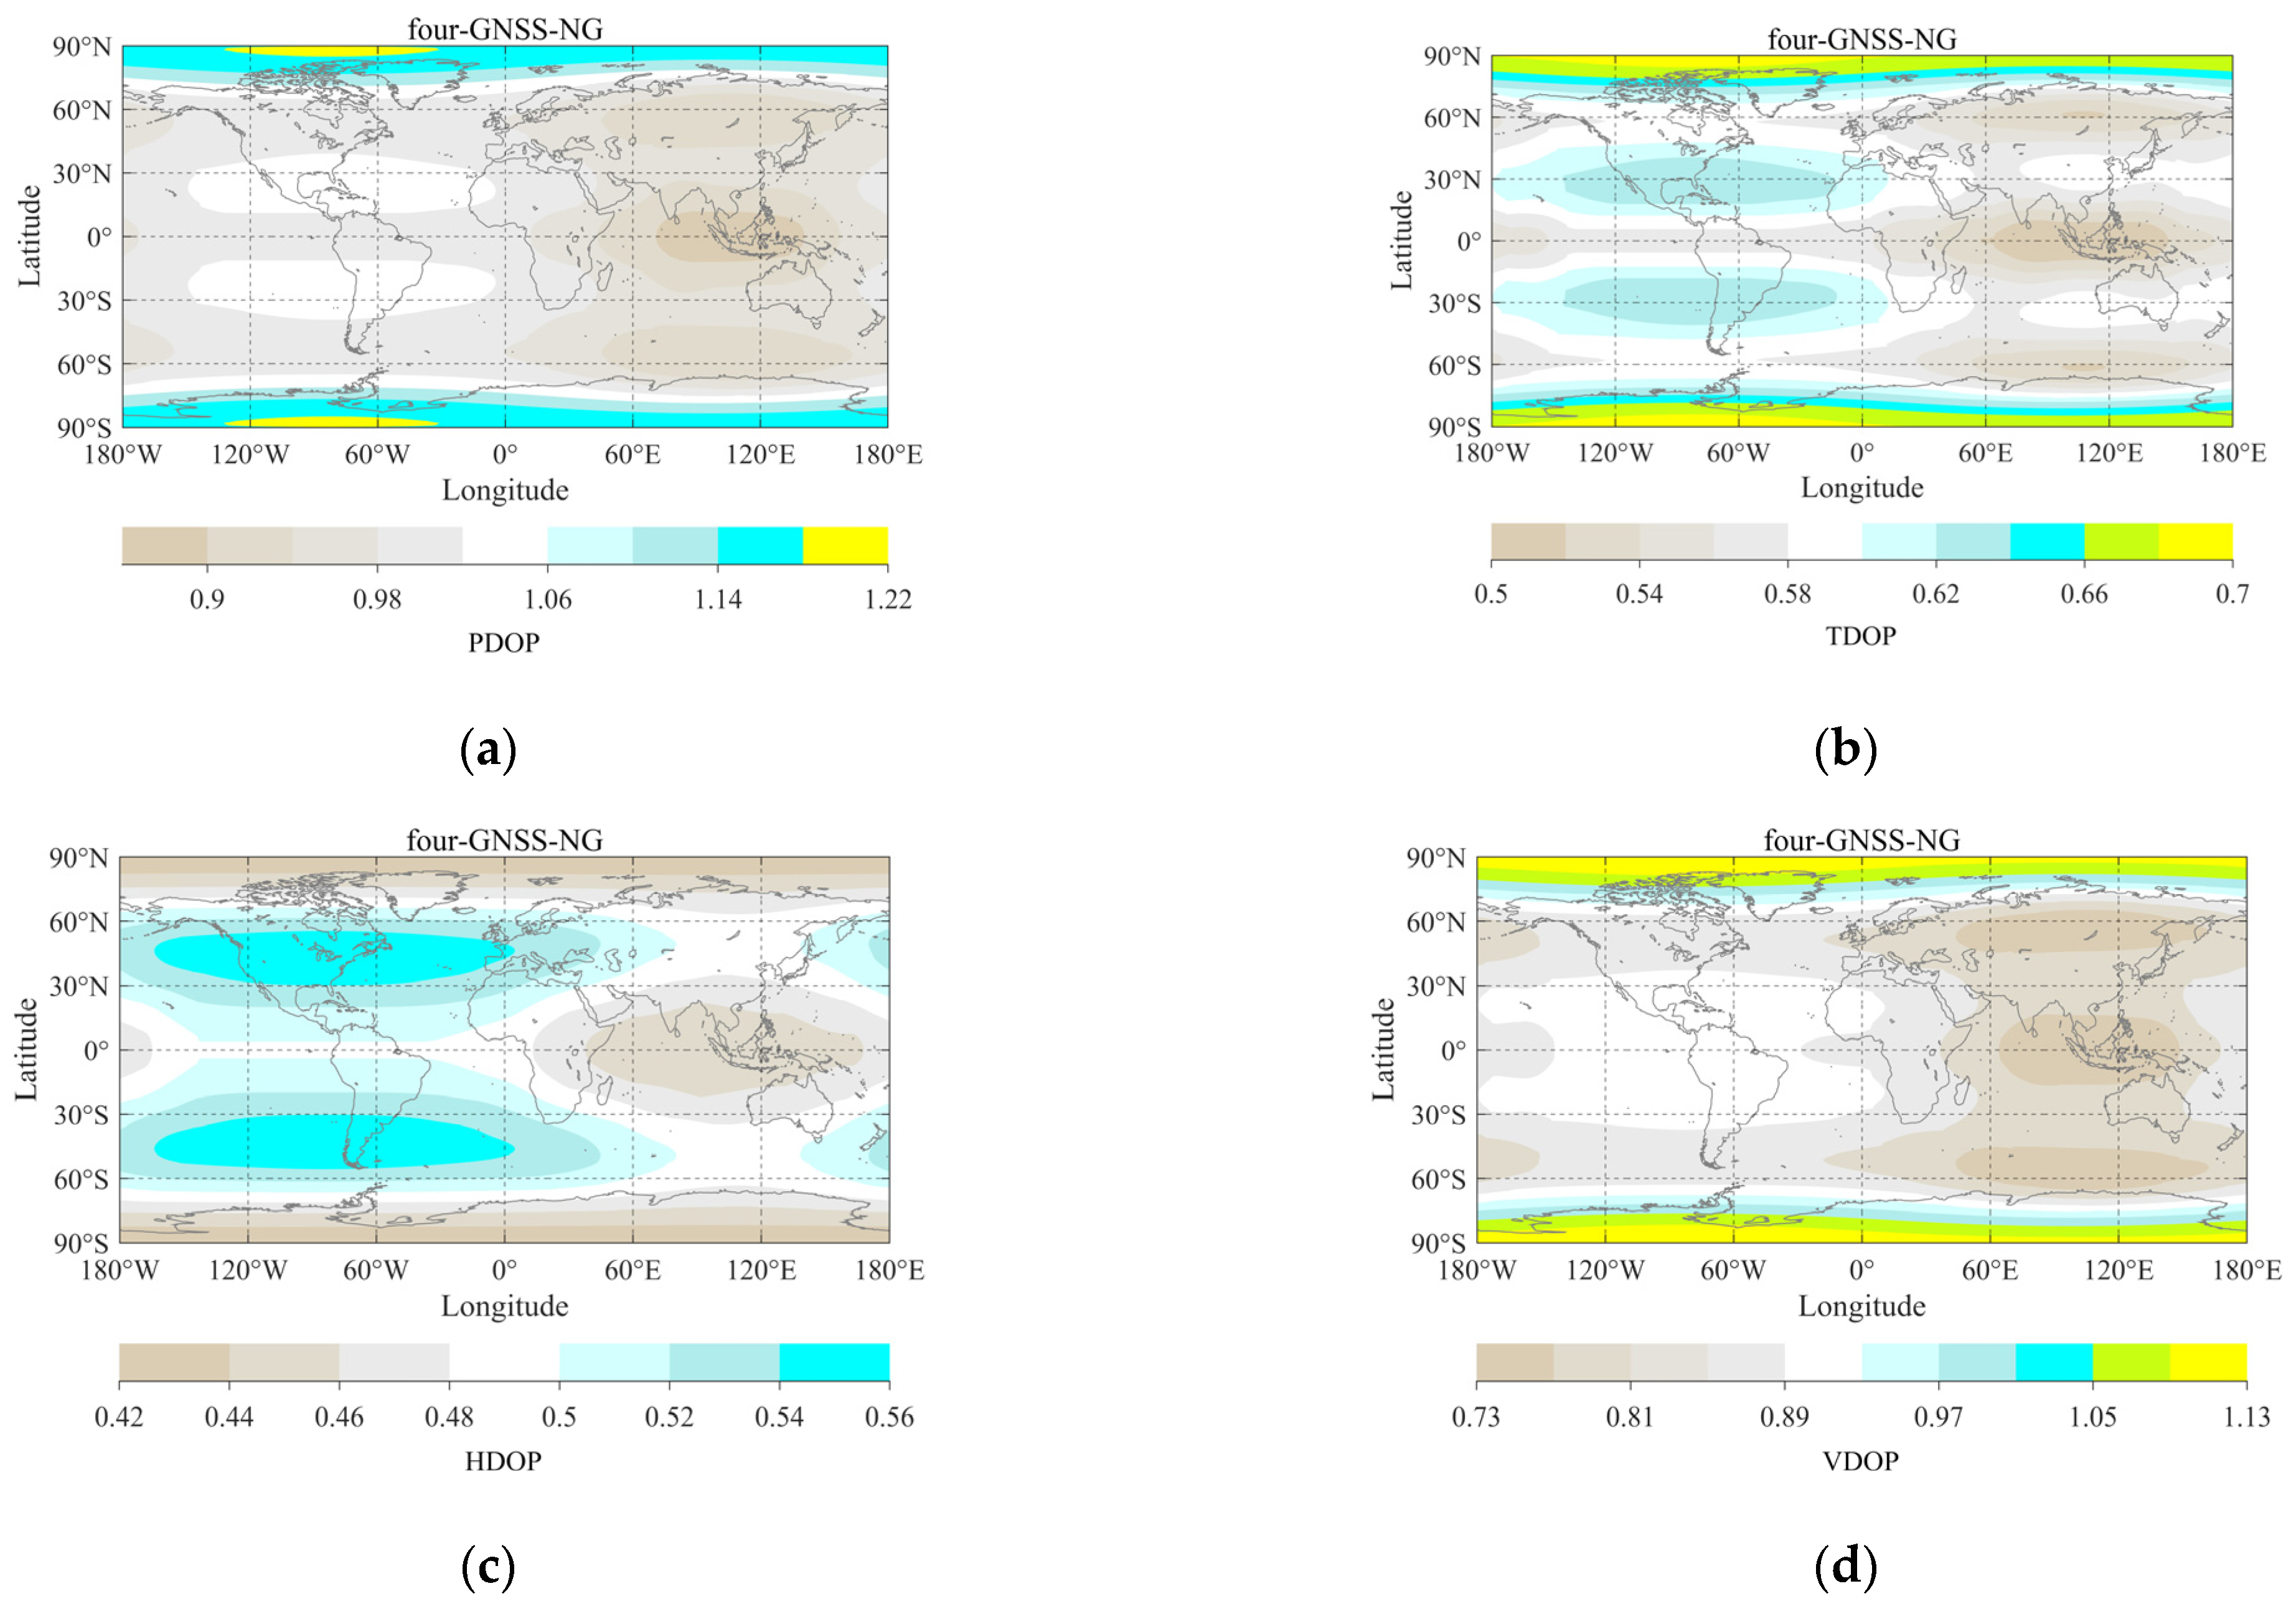
Based on Equation (15), we calculated the DOPs of combined positioning of the four-GNSS-NG. The results are presented in
Figure 7. From
Figure 7a,b, we found that the distributions of PDOP and TDOP are similar to the GDOP. The average PDOP and TDOP are 1.03 and 0.60, respectively. As shown in
Figure 7c,d, the HDOP is from 0.42 to 0.56 (average: 0.49), and the VDOP is between 0.73 and 1.13 (average: 0.90). Both of these values are lower in the Asia-Pacific region. However, the HDOP is larger at latitudes of
, while the VDOP is larger in high-latitude regions. To further analyze the HDOP characteristics,
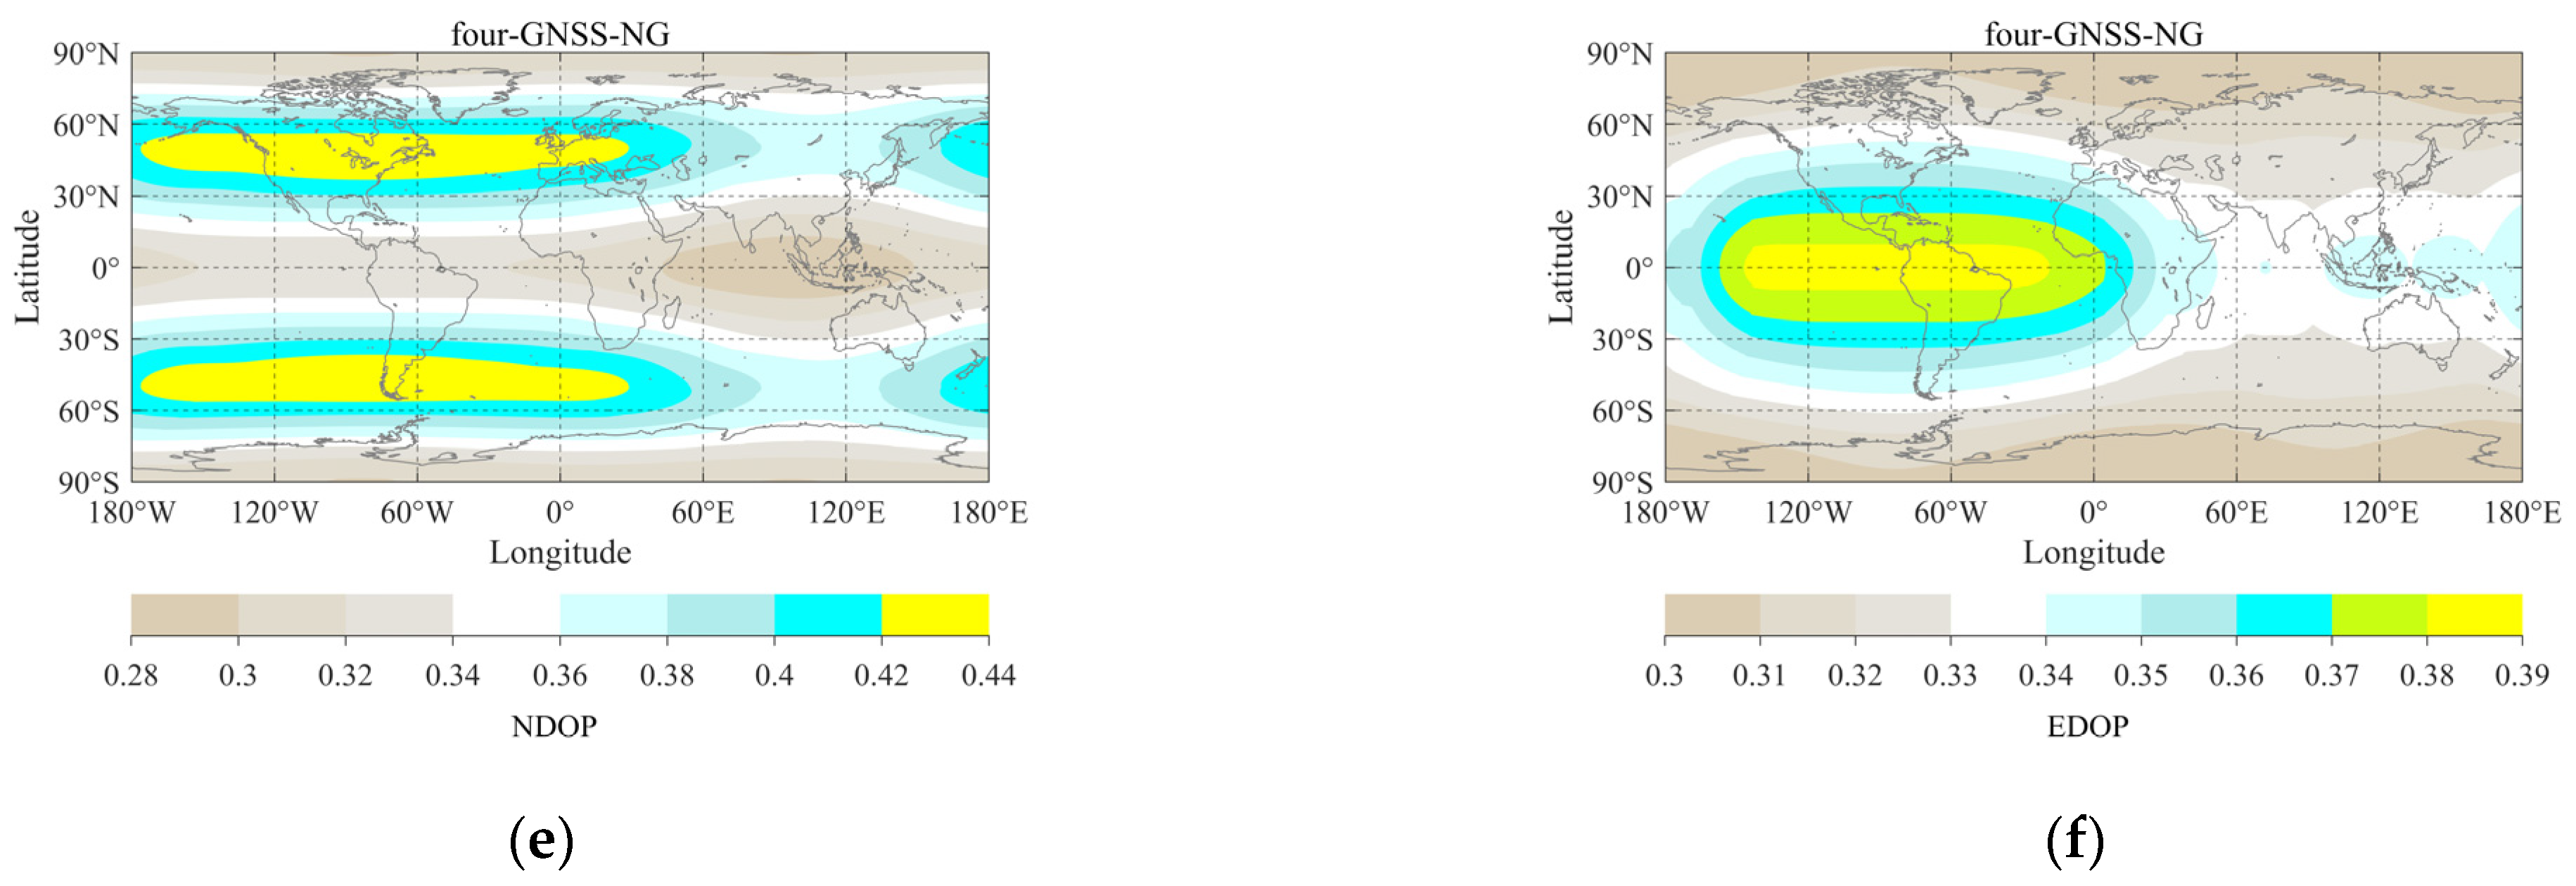
Figure 7e,f present the NDOP and EDOP, respectively. It is clear that NDOP, which is shown to range from 0.28 to 0.44, is lower than EDOP (ranging from 0.30 to 0.39) for 25°S–25°N, while for other areas, the accuracy in the north–south direction is lower than it is in the east–west direction.
In summary, more visible four-GNSS-NG satellites can be observed on a global scale. This is helpful, as it strengthens the satellite geometry and contributes to rapid changes in the geometric distribution the satellites, which can effectively mitigate multipath effects and can shorten the convergence time in precise positioning.
3.2. LEO-Augmented Four-GNSS
Similar to four-GNSS constellations, the LEO constellation, serving as a navigation system, should satisfy satellite visibility as well as DOP, which is equally distributed as much as possible on a global scale [
39]. In this paper, we simulate six LEO constellation schemes in terms of orbital planes and orbital inclinations to study the distribution of LEO satellites. The detailed information of the six Schemes LEO constellations is presented in
Table 4. Schemes 1 and 2 LEO constellations adopt polar orbits with altitudes of 1000 km and 600 km, respectively. Schemes 3–5 are designed with an inclined orbit. The altitude of Schemes 3–5 is 1000 km. The inclination angles for Schemes 3–5 are 65°, 60°, and 30°, respectively. For Scheme 6, we designed mixed-orbit LEO constellations and included both the polar orbit and the inclined orbit, and all of the satellites operate in orbit at an altitude of 1000 km.
According to the principle of GNSS, availability means that more than four LEO satellites above a specific CEA can be observed on a global scale, for the ground receiver needs at least four satellite signals to determine its position, which can be expressed as follows:
According to Equation (17), the results of the minimum number of LEO constellations with global service ability for Schemes 1–5 were calculated, which are listed in
Table 5. Because a lower altitude implies narrower coverage for LEO satellites, Schemes 1–3 need at least 126, 220, and 196 LEO satellites, respectively, to ensure global coverage. That is far more than the total number of GNSS satellites. The satellite visibility of LEO constellation Schemes 4 and 5, whose orbit inclinations are smaller, drops rapidly at high latitudes, which results in their coverage being
and
, respectively, with 183 and 202 satellites.
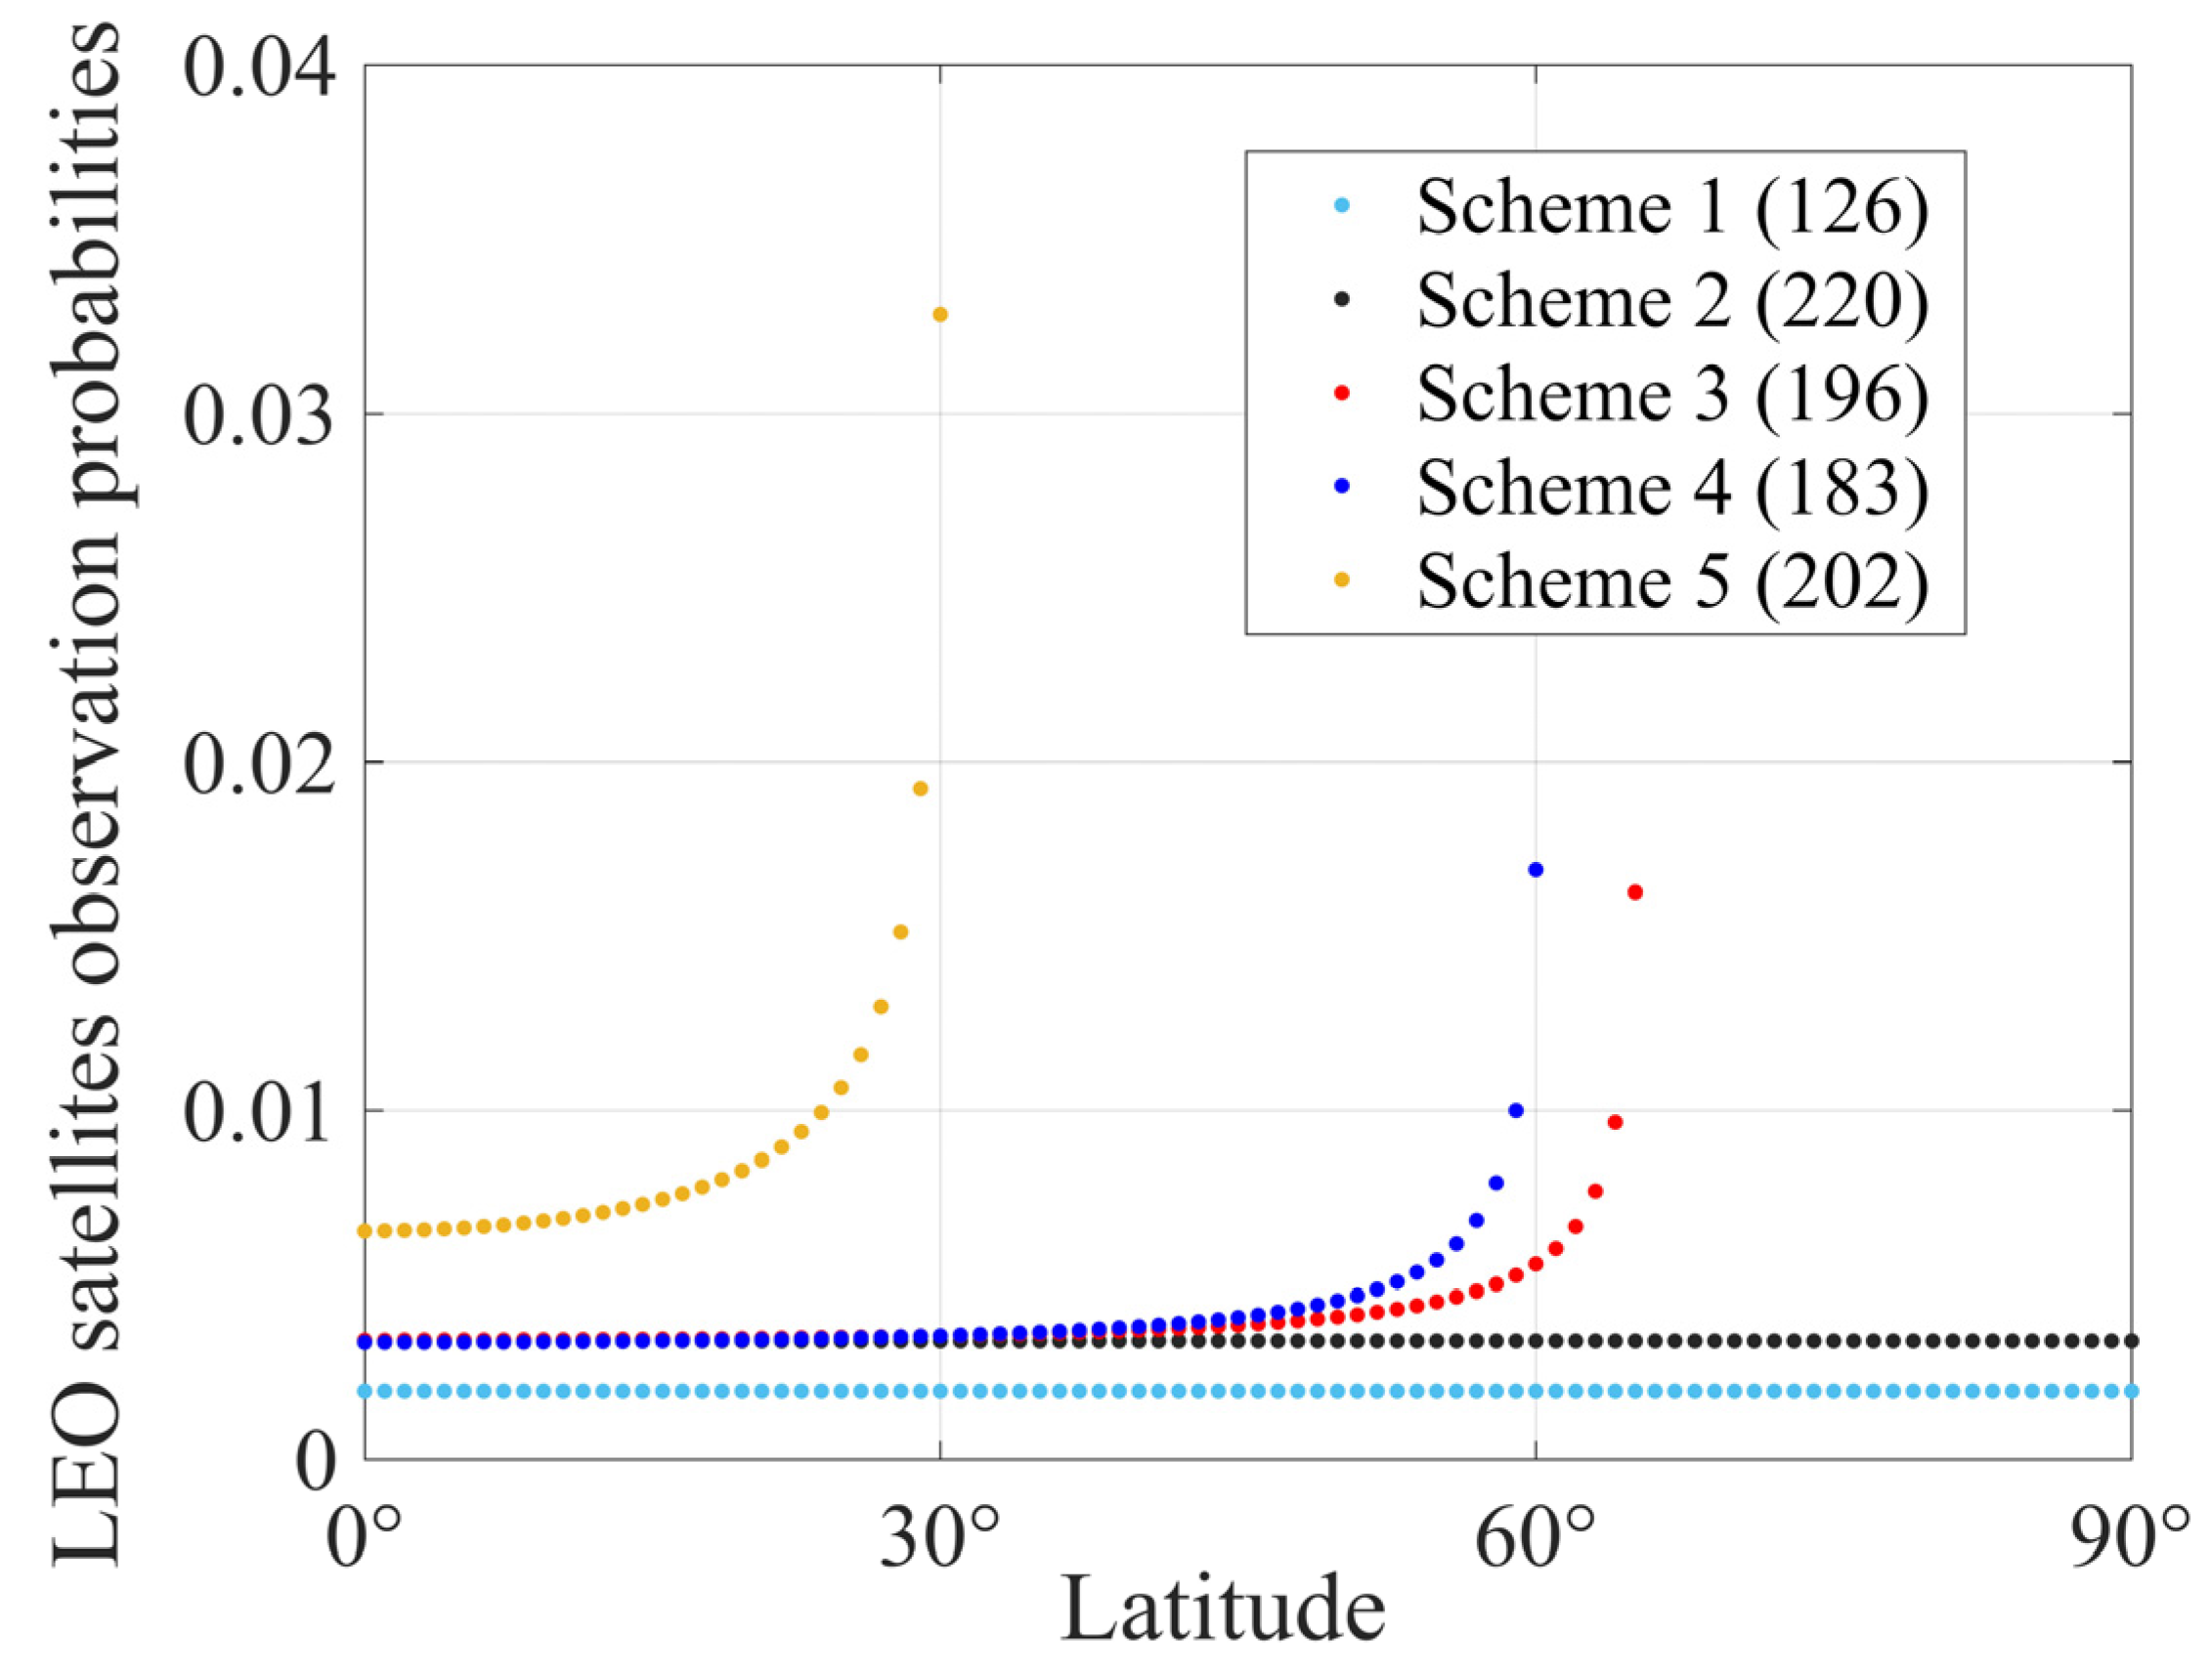
According to the number of satellites of each LEO constellation, the observation probabilities of the LEO satellites
for the five schemes are plotted in
Figure 8. Due to the increasing number of satellites, the
is much larger than the
of the GNSS. The distribution of polar-orbiting LEO constellations (Schemes 1 and 2) is more even than that of inclined-orbiting LEO constellations at all latitudes. Because a satellite travels north–south over the Earth, and the angular velocity is only in this direction. Comparing to Schemes 3 and 4, the distribution of the Scheme 5 LEO satellites with an inclination angle of 30° is narrower, which results in higher observation probabilities.
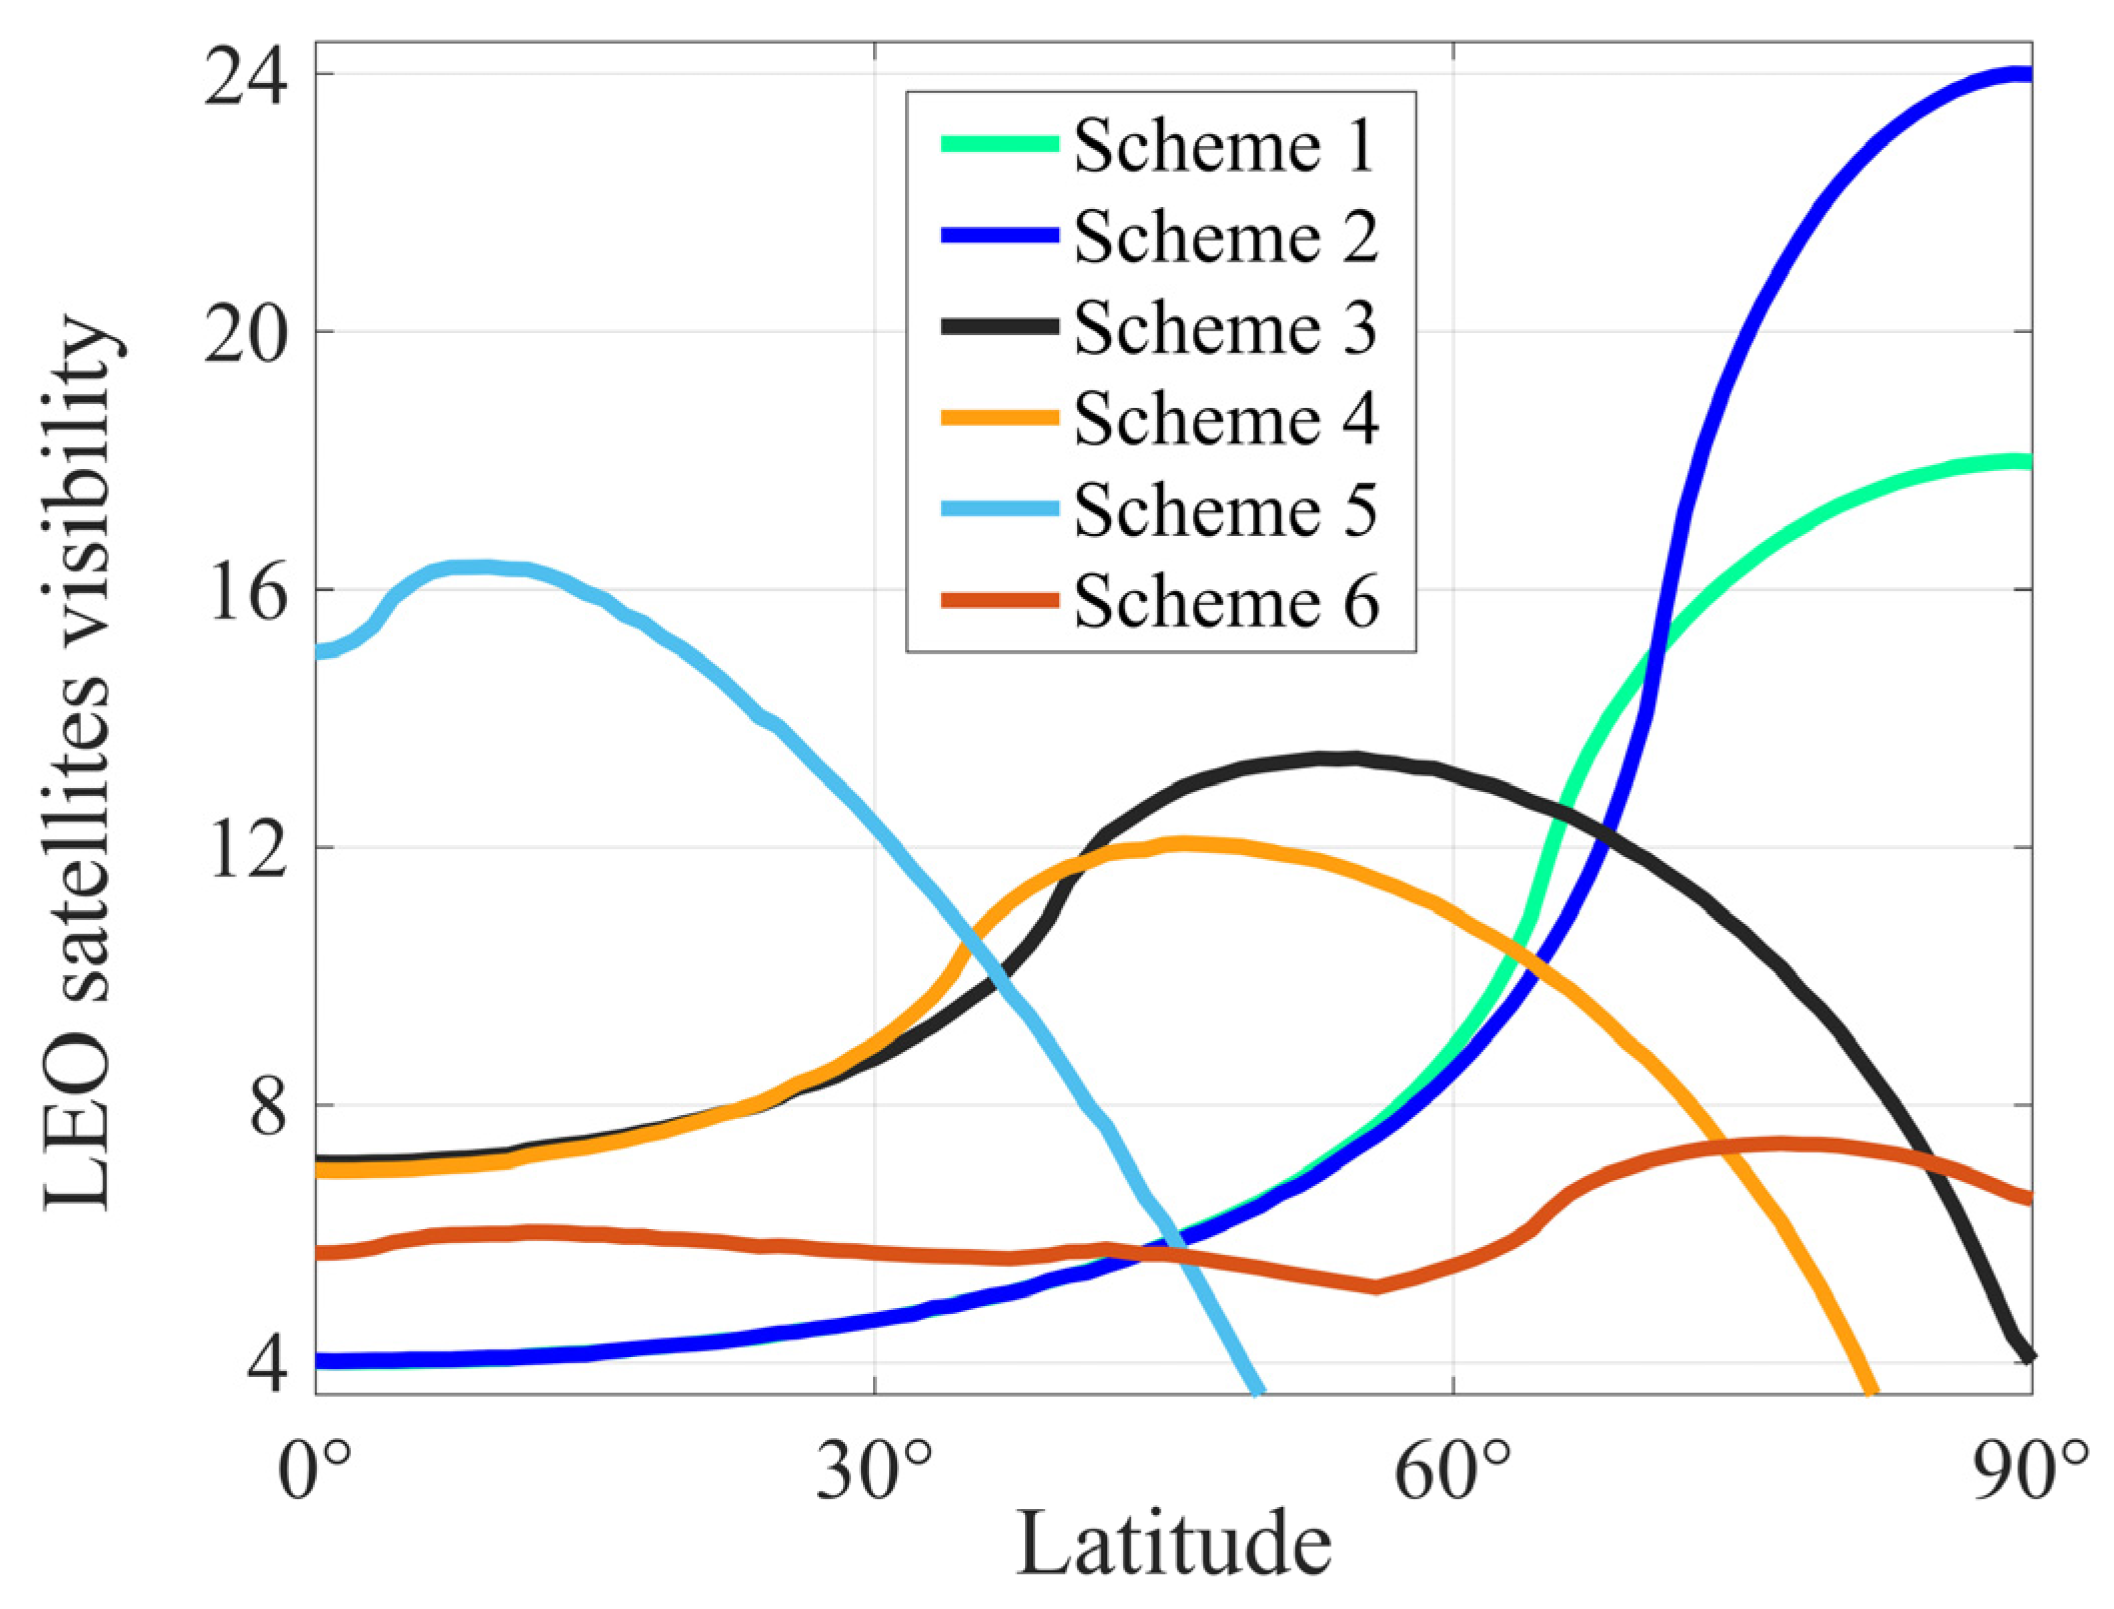
The coverage of the five Schemes LEO constellations is shown in
Figure 9. Obviously, for Schemes 1 and 2, the satellite visibility varies greatly with increasing latitude, from approximately 4 LEO satellites at low latitudes to more than 16 at high latitudes. Scheme 3 is the most abundant in terms of visible satellites in the middle latitude region, with the number of visible satellites being over 10; however, that value significantly decreases in high-altitude regions. With a lower orbit inclination, the number visible satellites for Scheme 5 LEO constellation are larger in the low-latitude regions (30°S–30°N), where more than 12 satellites are visible.
LEO constellations with different orbit parameters have great differences in satellite visibility. To satisfy the equally distributed LEO satellites as much as possible on a global scale, we designed mixed-orbit LEO constellations (LEO-mix), which are presented as Scheme 6. Each orbit of the LEO-mixed constellation contains 40 satellites. The satellite visibility of the Scheme 6 LEO constellations ranges from 5 to 8 (average: 6.53) over all latitudes, which is shown in
Figure 6 (red line).
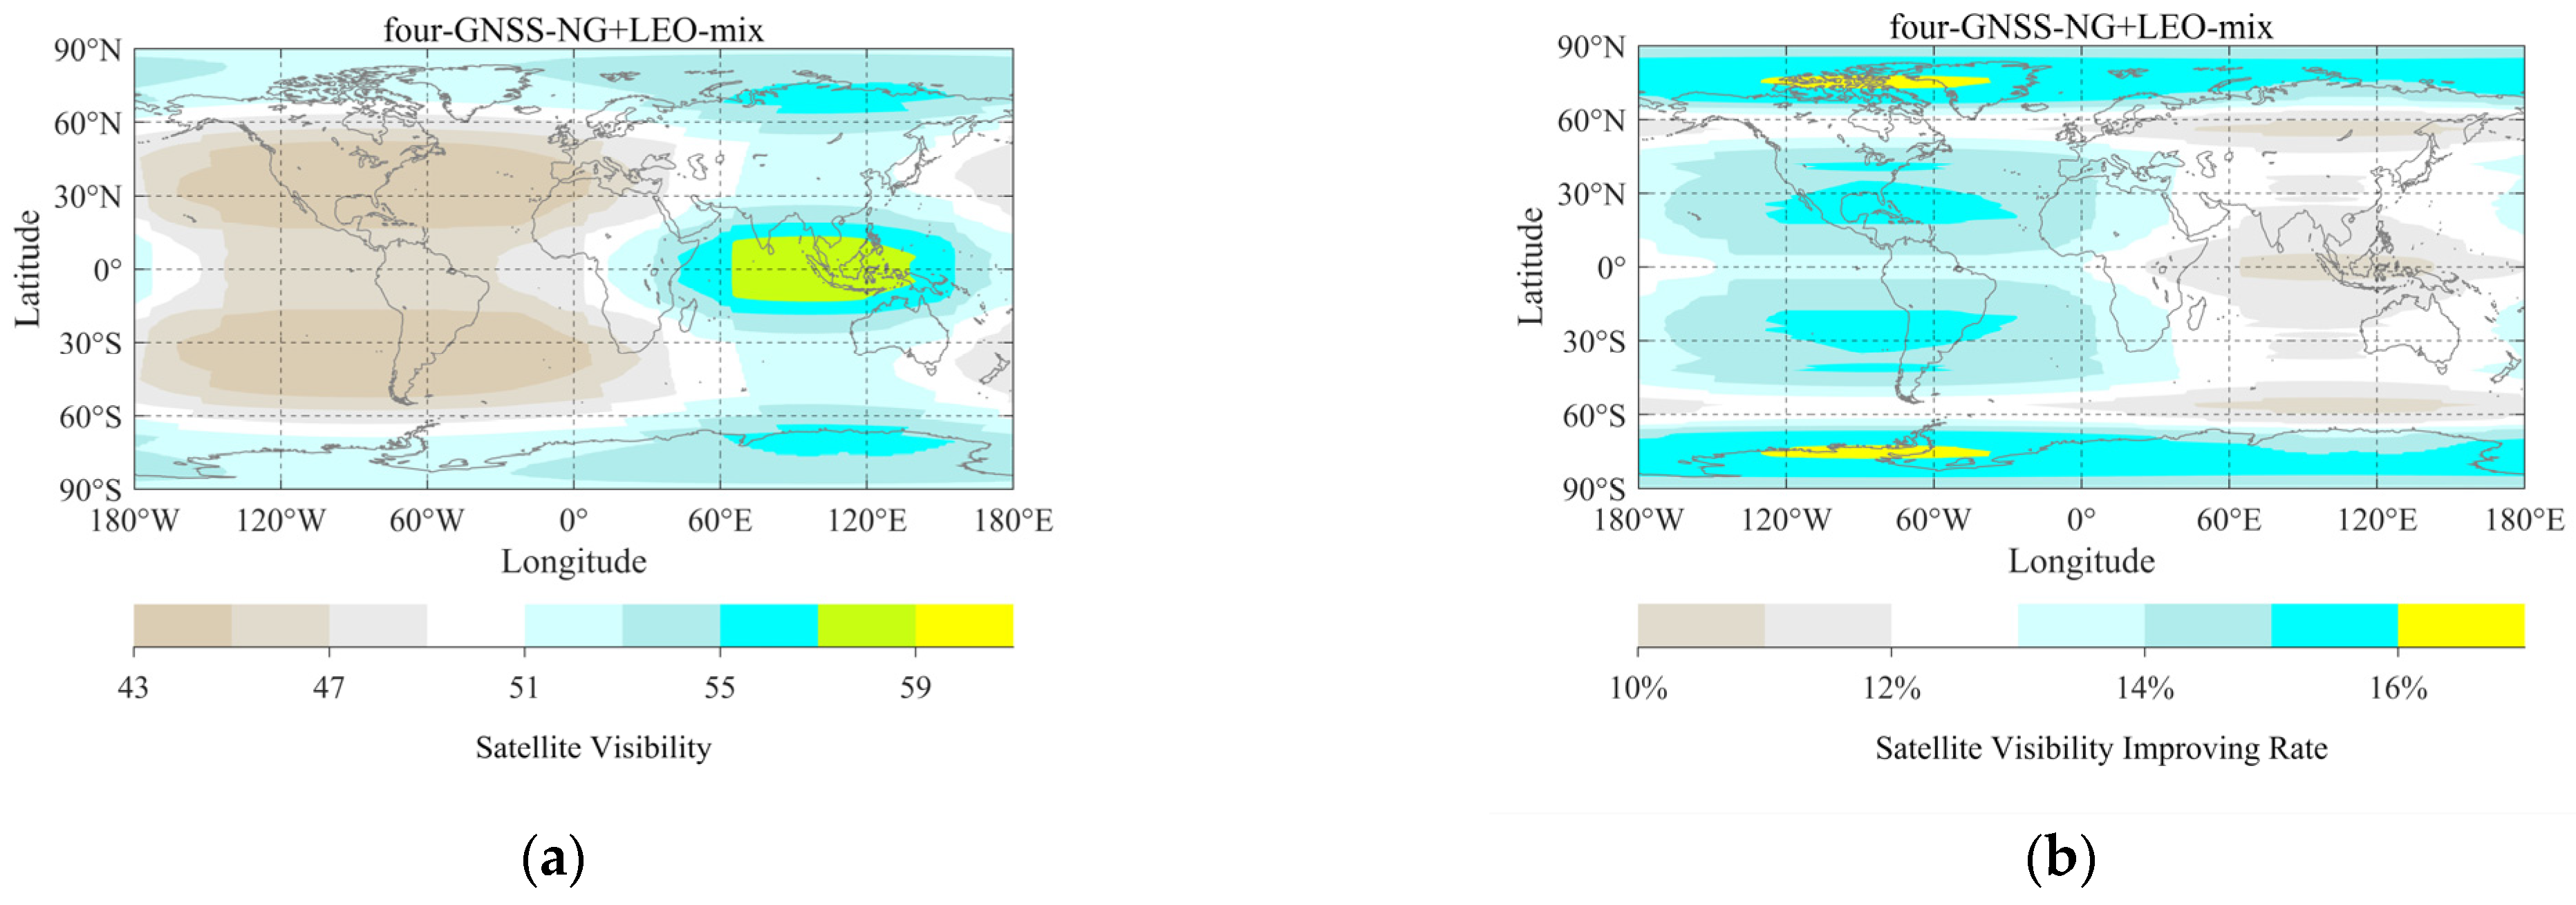
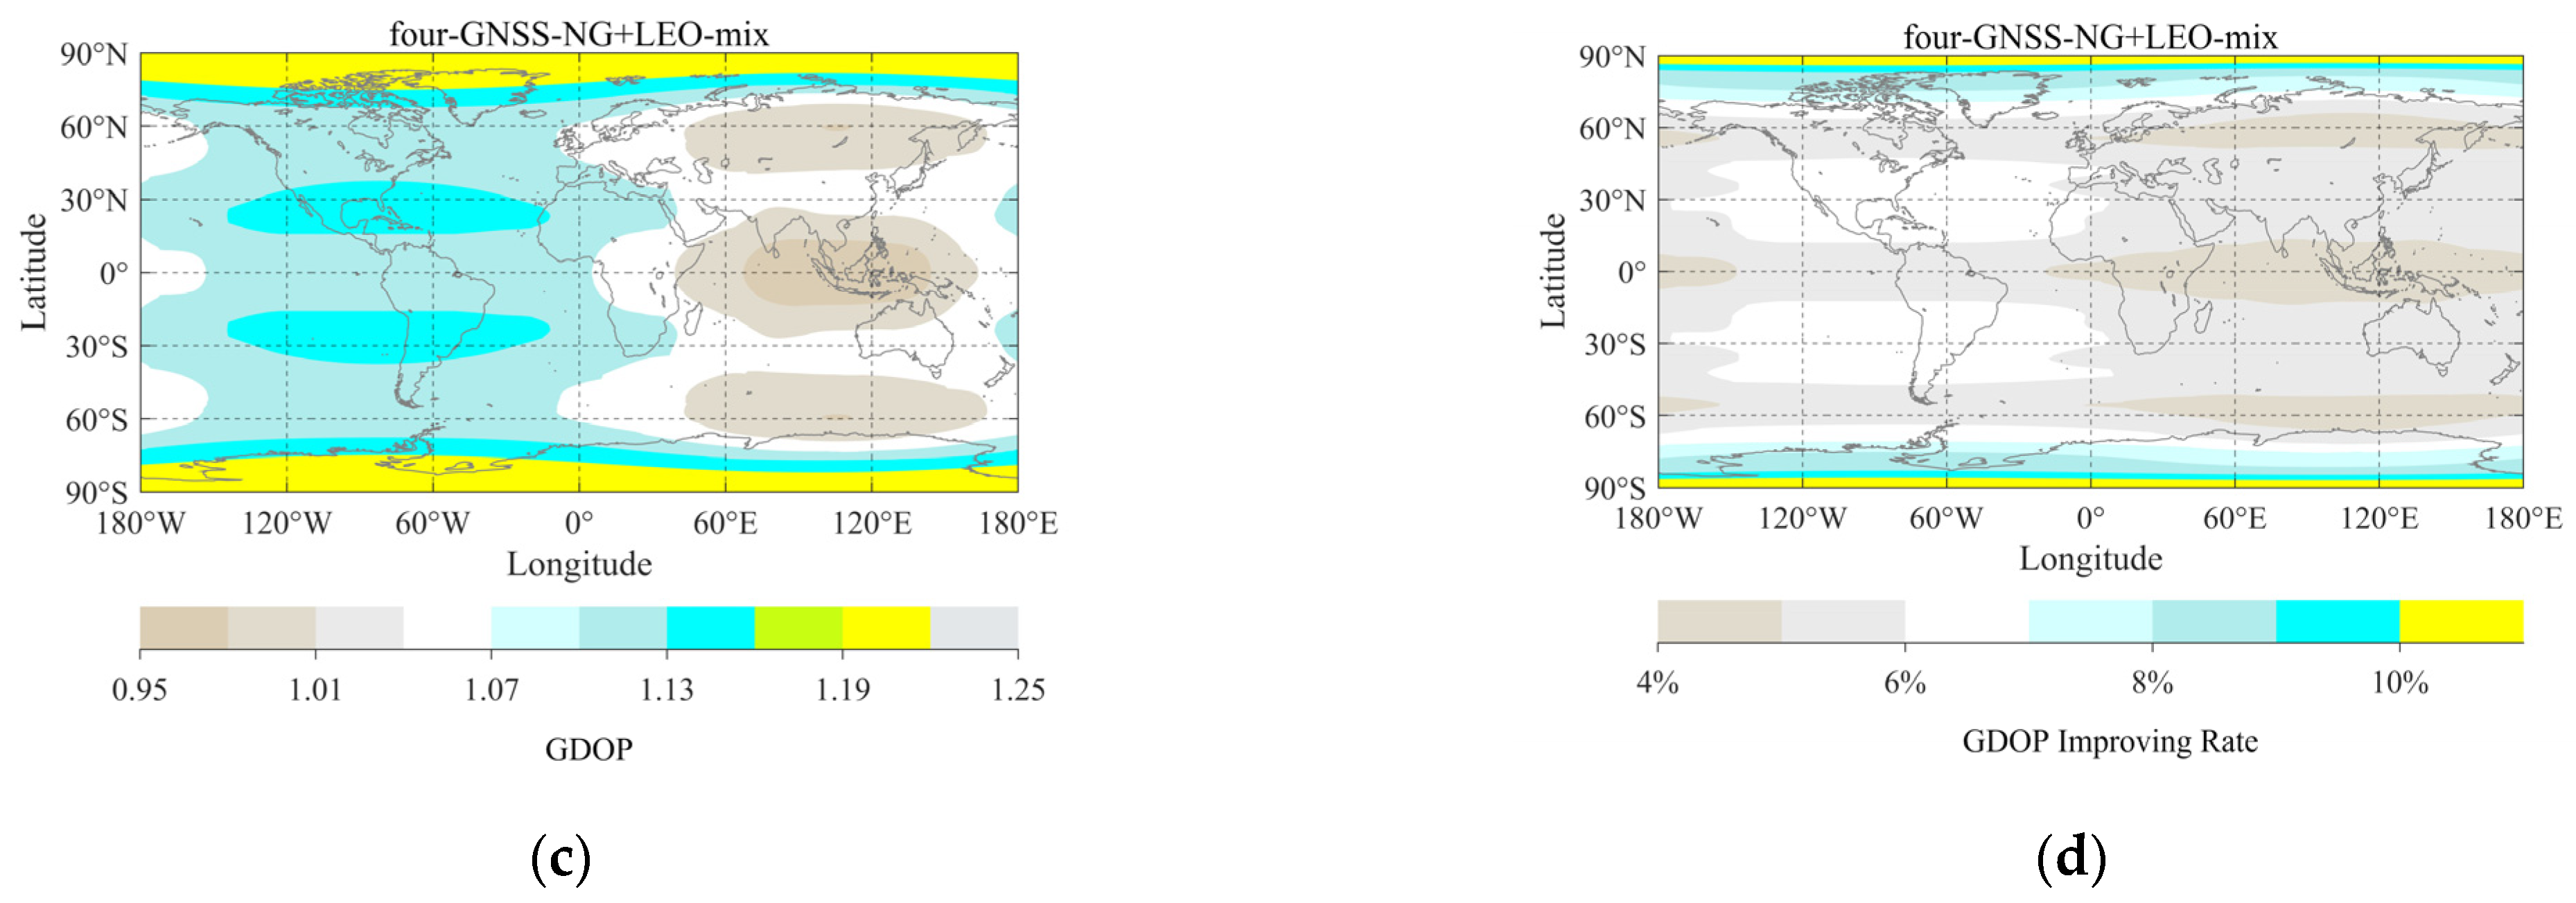
Figure 10a,c present the satellite visibility and GDOP of LEO-mix (Scheme 6) with the four-GNSS-NG, respectively, and the corresponding
Figure 10b,d illustrate their improvement rate compared to the four-GNSS-NG. As shown in
Figure 10a,c, LEO-mixed satellites can fill the coverage gap in the polar area, which is helpful for users at high latitudes (
). With more visible LEO satellites in this region (average: 6.86), the average improvement rate of the four-GNSS-NG+LEO-mix reaches 14.7%. Likewise, in the mid–low latitude region of the Western Hemisphere, approximately five more satellites can be observed, and the improvement rate is 14.4% on average. In general, the average visible satellites of the four-GNSS-NG+LEO-mix is 50.97. Ranging from 0.95–1.25 (average: 1.12), the GDOP of the four-GNSS-NG+LEO-mix decreases by about 4.1–11.0% (average: 6.2%) compared to four-GNSS-NG, and at the high latitudes, that value is almost more than 9%.
Overall, new LEO satellites will provide the better signal coverage at high latitudes, which are not well-covered at the present. This contributes to ensuring the efficiency of all kinds of scientific research and to the safety of transportation in the Arctic region.
3.3. RNSS + Four-GNSS
At present, three QZO satellites and one GEO satellite make up QZSS, and these satellites transmit signals to provide services [
40]. Three QZSS satellites, which will be deployed in the future, include one QZO satellite and two GEO satellites, one of which has a small inclination angle and is called a quasi-geostationary Earth orbit (QGEO) satellite [
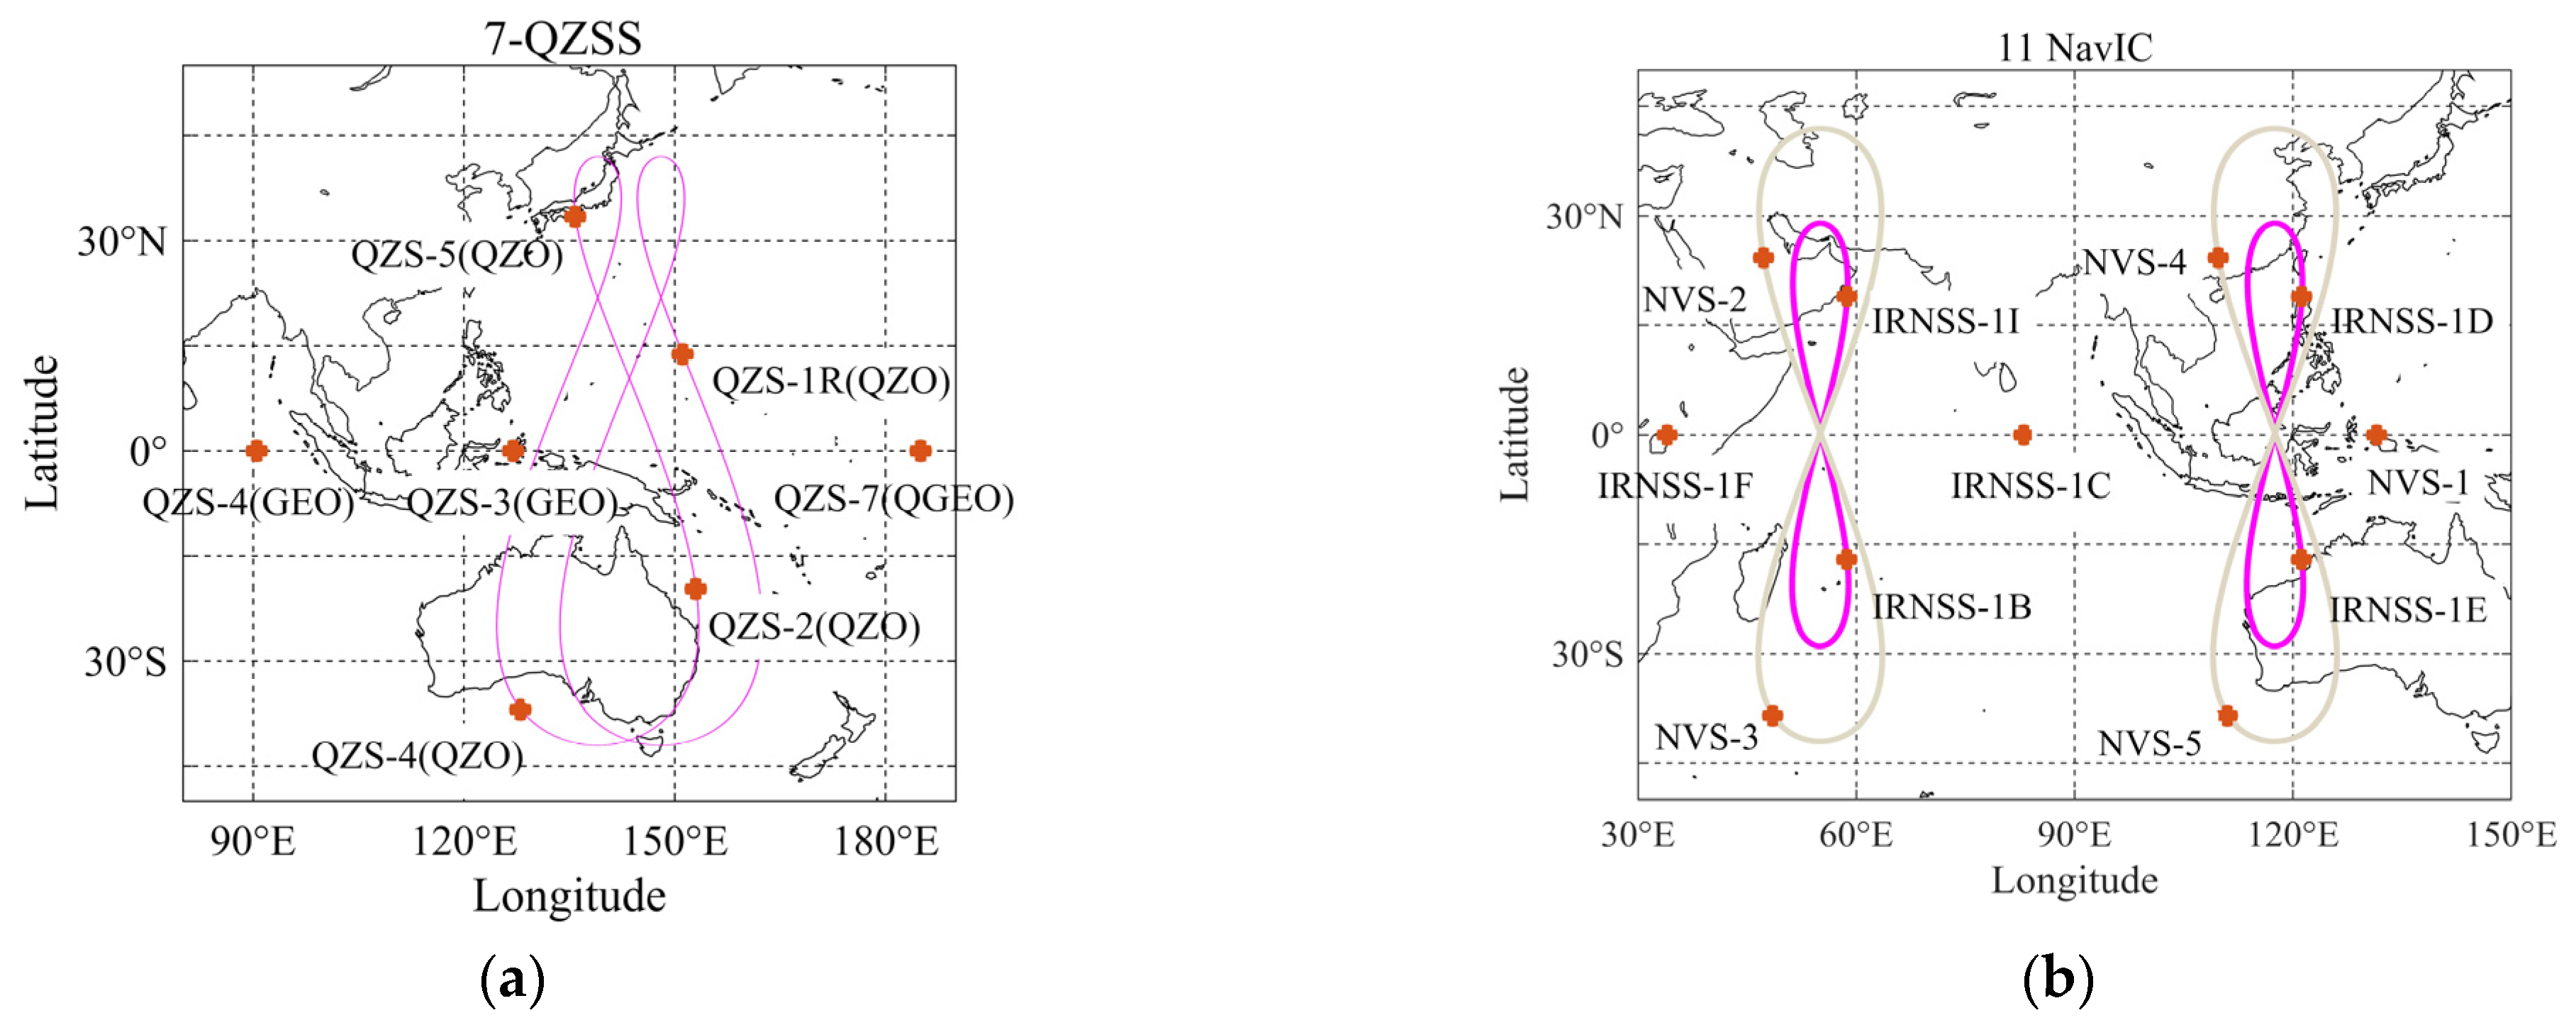
41]. The 7-QZSS satellite constellation parameters are listed in
Table 6. Their ground tracks are plotted in
Figure 11a. For the NavIC (formerly known as IRNSS), seven satellites—4 in geosynchronous and 3 in geostationary orbits, are on-orbit operations [
42,
43]. In the future, five new visible satellites (NVS) will be added to the constellation, in which NVS-01 (also known as IRNSS-1J) will replace IRNSS-1G, while the other satellite (NVS-02~NVS-05) parameters are summarized in
Table 6 [
43]. The ground tracks of the 11-NavIC satellites are shown in
Figure 11b.
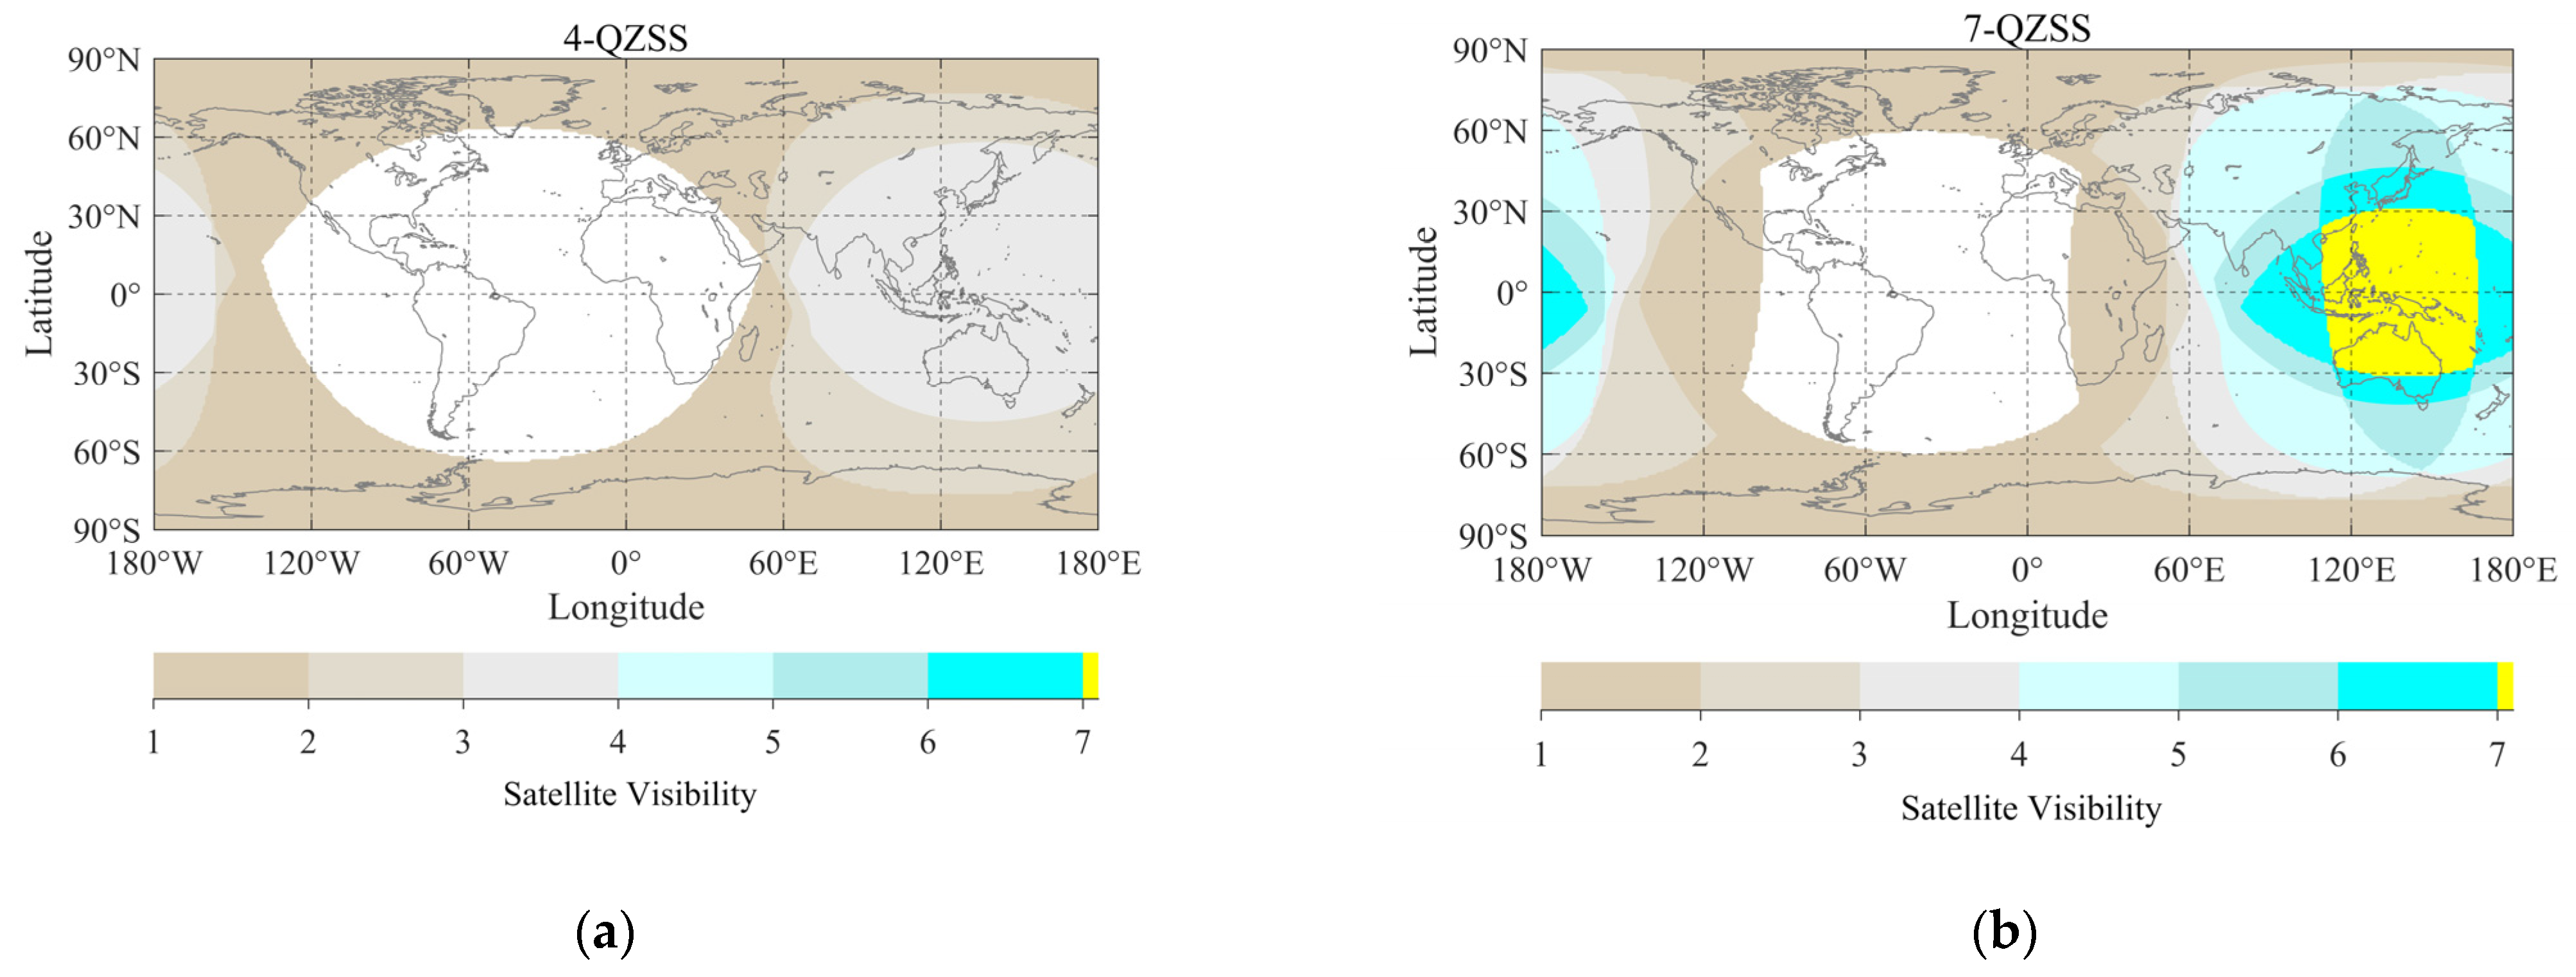
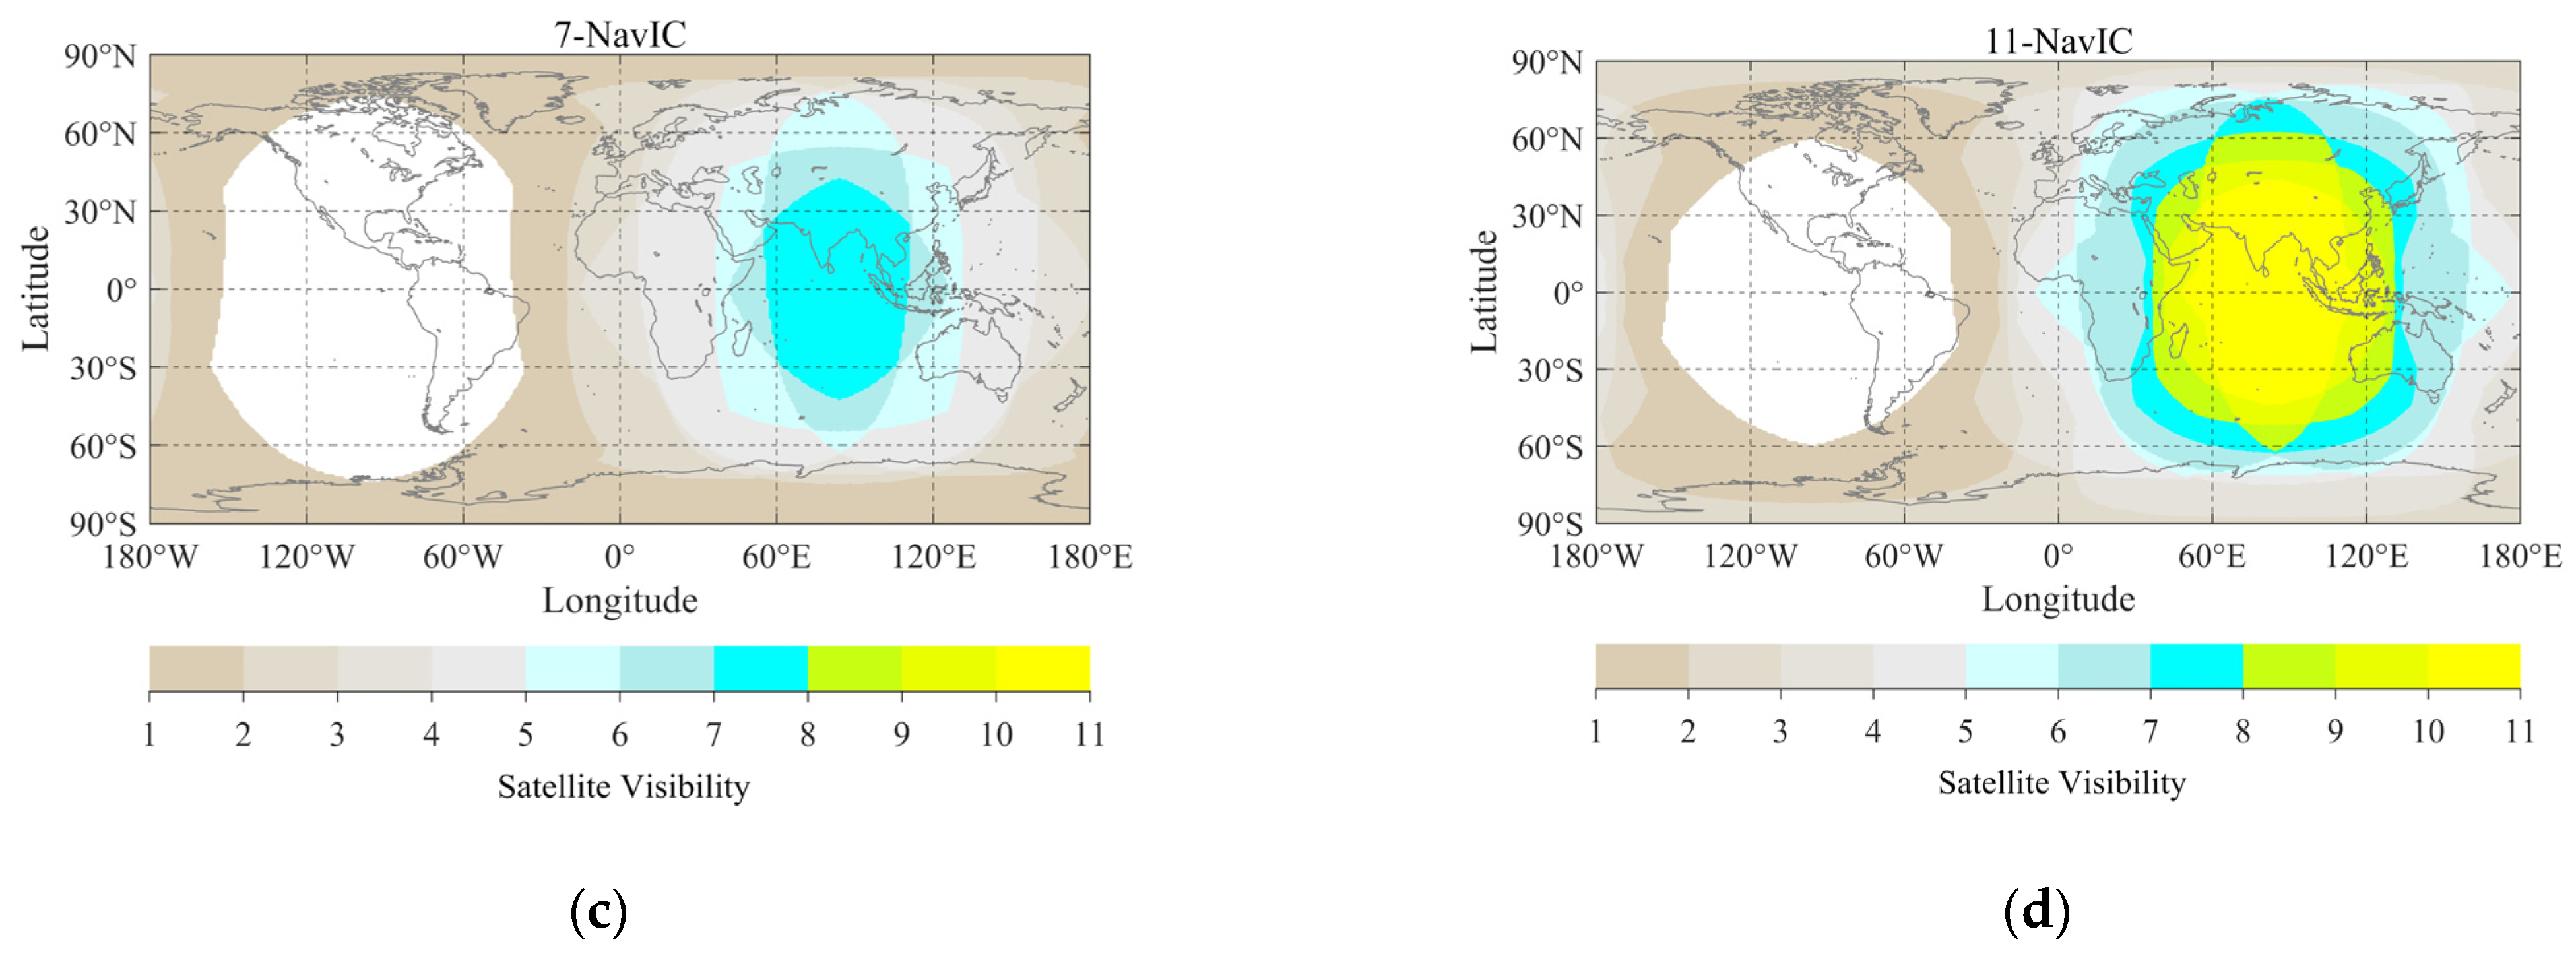
The method discussed earlier was used to assess the QZSS satellite visibility. The results are presented in
Figure 12a,b, and
Table 7 (to simplify the calculation, the QGEO satellite is regarded as a GEO satellite). One can see that the QZSS service is roughly in the Asia-Pacific region. More than two satellites can be observed for 4-QZSS in (60°E–180°E, 60°S–60°N), while 7-QZSS exceeds four. Specifically, in Southeast Asia and in Northwestern Australia, five visible satellites can be guaranteed. However, QZSS satellites are rarely observed at low altitudes in the Western Hemisphere. Similar to the QZSS, there are almost no visible NavIC satellites in most areas of North and South America. For 7-NavIC, four or more visible satellites are present in (30°E–150°E, 60°S–60°N) while the number of 11-NavIC satellites reaches six. Specifically, with full 11-NavIC constellations, at least 10 satellites are always visible from the whole India as well as its surrounding areas. Generally, the visibility of 7-QZSS satellites (average: 5.57) increases by 0.9~3 (average: 2.17) in the areas of (60°E–180°E, 60°S–60°N) compared to 4-QZSS satellites, and the value for 11-NavIC satellites (average: 8.78) with 7-NavIC is 1.83–4 (average: 3.11) in the areas of (30°E–150°E, 60°S–60°N).
To evaluate the contribution of QZSS and NavIC for regional services, the estimated number of the four-GNSS-NG+7-QZSS and four-GNSS-NG+11-NavIC visible satellites as well as their combination GDOP positioning were calculated. As shown in
Figure 13 and
Table 7, with a 5° mask, there are more than 37 four-GNSS-NG+7-QZSS satellites (average: 50.94) in the Eastern Hemisphere. Particularly, in the area of (60°E–180°E, 60°S–60°N), that number increases to 50 or more. The maximal improvement rate of satellite visibility, compared to the four-GNSS-NG, reaches 15.7%, while the average is 7.6%. Adding 7-QZSS to the four-GNSS-NG reduces the GDOP by 18.0% on average, and that value ranges from 10.8% to 35% (average: 27%) in (60°E–180°E, 60°S–60°N). In general, the GDOP basically reduces to a value within 1.16, and the average is 0.95. For four-GNSS-NG+11-NavIC combination positioning, the number visible satellites ranges from 43.93 to 65.00 (average: 53.80), with the exception of a small area in the extreme north India, more than 59 usable satellites are always visible over the entire Indian landmass. Ranging from 0.60 to 1.17, the GDOP of the four-GNSS-NG+11-NavIC is 0.86 on average in the Eastern Hemisphere, which is an improvement of 8.3~42.9% (average: 26.1%) compared to the four-GNSS-NG. Especially in India and Southeast Asia, the GDOP is less than 0.68, and the improvement rate is at least 34.0%.
According to the four-GNSS and two RNSSs development programs,
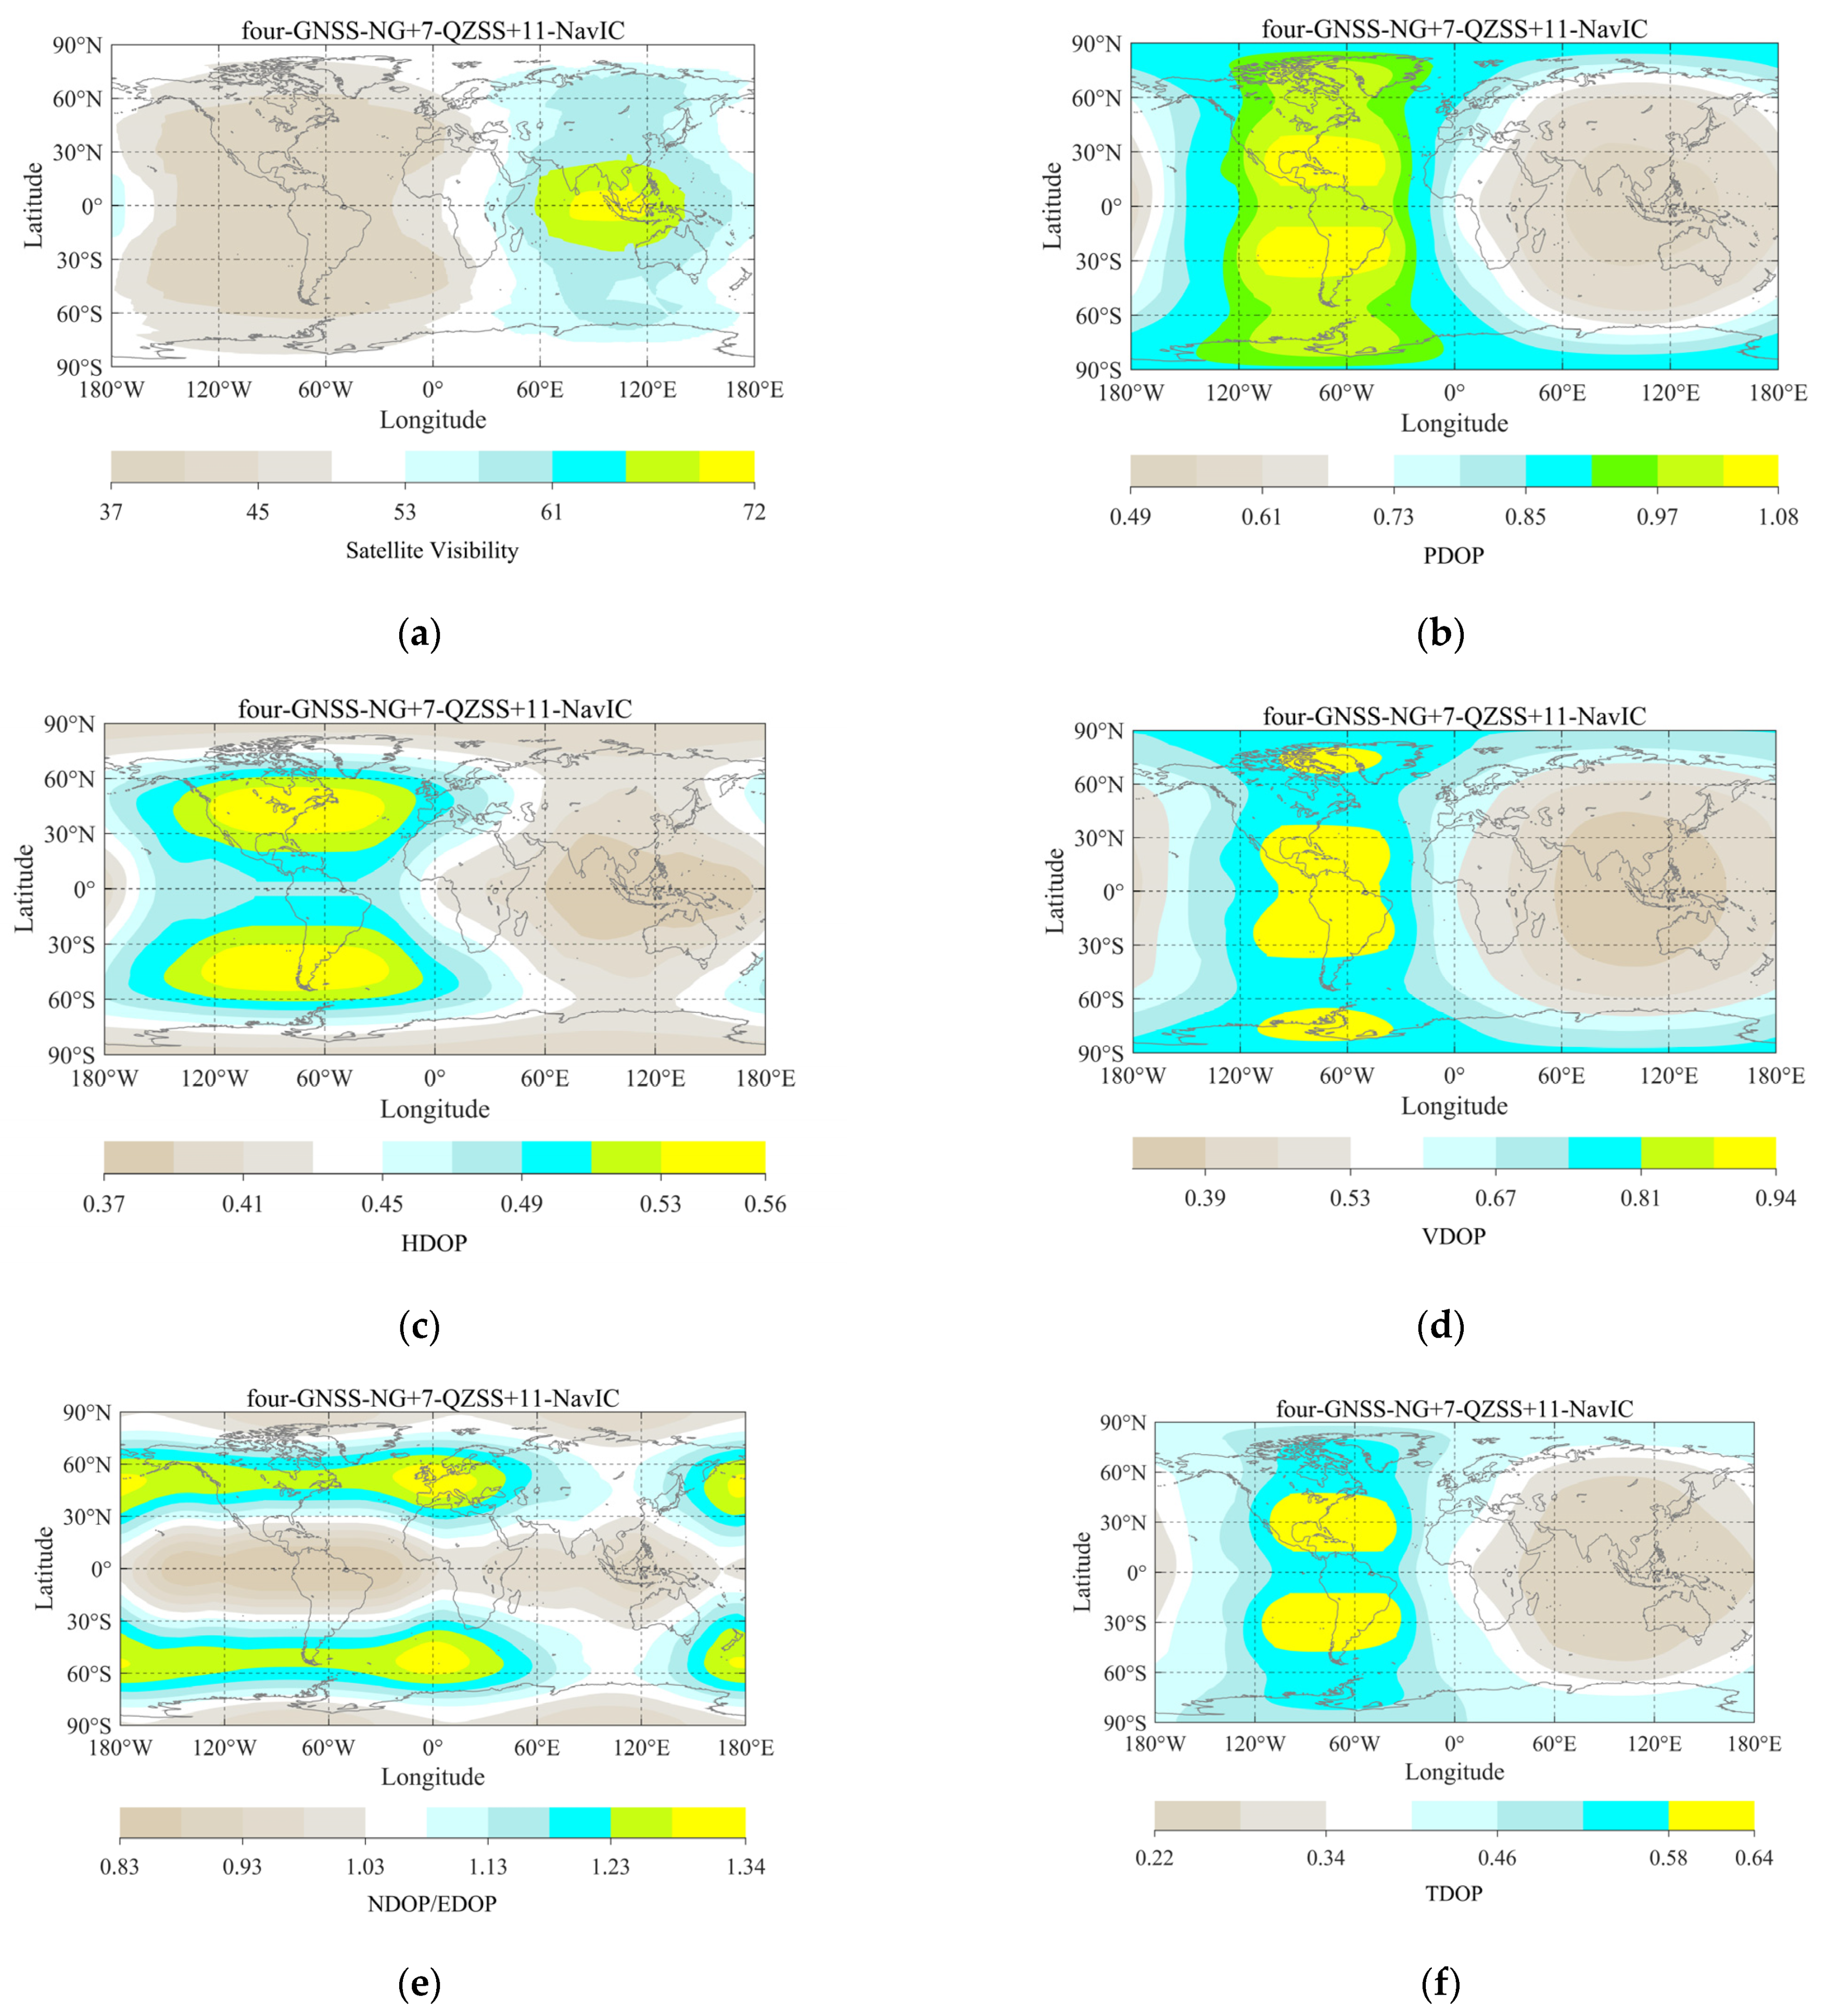
Figure 14 presents the satellite visibility and DOPs of the four-GNSS-NG+7-QZSS+11-NavIC on a global scale. The statistical results are listed in
Table 8. The number of visible satellites is from 37.51 to 71.58 (average: 51.24). More satellites can be observed in the low altitudes of the Eastern Hemisphere and less in the areas of North and South America. Comparing to the operating satellites of four-GNSS+4-QZSS+7-NavIC, the satellite visibility improvement rate is from 11.6% to 32.0% (average: 21.1%). With more visible satellites, the PDOP, ranging from 0.50 to 1.08 (average: 0.82), improves by 12.8% on average. As shown in the illustration, the PDOP generally increases in the areas of (60°E–130°E, 30°S–30°N) towards the east and west ends. The maximum PDOP is at around 30° latitude in the Western Hemisphere. The HDOP and VDOP range from 0.37 to 0.56 (average: 0.46) and 0.32 to 0.94 (average: 0.67), respectively. Both of them are lower in the Asia-Pacific region. However, the HDOP is larger at
, while VDOP is larger in (30°S~30°N) and in some high latitude areas.
Figure 11e presents the ratio of NDOP/EDOP to explain the HDOP features. It can be seen that NDOP, which ranges from 0.26 to 0.44 (average: 0.34), is less than EDOP, which ranges from 0.27 to 0.38 (average: 0.34), in the areas of (30°S~30°N) and
. Additionally, the east direction positioning accuracy is higher than that of the north in other areas. TDOP, which has same characteristics as PDOP, ranges from 0.22 to 0.64 (average: 0.44).
To conclude, adding 7-QZSS and 11-NavIC to the four-GNSS-NG creates a further increase of the number of visible satellites and a decrease of DOP values in the Asia-Pacific region, where the great majority of the world’s population and industrial activity are concentrated. This benefits high-precision positioning and navigation applications in urban environments, such as intelligent transportation and automated driving.

