Article

Emerging Sensor Platforms Allow for Seagrass Extent Mapping in a Turbid Estuary and from the Meadow to Ecosystem Scale

by
Johannes R. Krause
1,*,
Alejandro Hinojosa-Corona
2,
Andrew B. Gray
3 and
Elizabeth Burke Watson
1
1
Department of Biodiversity, Earth & Environmental Science, Drexel University, Philadelphia, PA 19104, USA
2
Departamento de Geología, Centro de Investigación Científica y de Educación Superior de Ensenada, Ensenada 22860, BC, Mexico
3
Department of Environmental Sciences, University of California, Riverside, CA 92521, USA
*
Author to whom correspondence should be addressed.
Remote Sens. 2021, 13(18), 3681; https://doi.org/10.3390/rs13183681
Submission received: 2 August 2021 / Revised: 7 September 2021 / Accepted: 9 September 2021 / Published: 15 September 2021

Abstract

:
Seagrass meadows are globally important habitats, protecting shorelines, providing nursery areas for fish, and sequestering carbon. However, both anthropogenic and natural environmental stressors have led to a worldwide reduction seagrass habitats. For purposes of management and restoration, it is essential to produce accurate maps of seagrass meadows over a variety of spatial scales, resolutions, and at temporal frequencies ranging from months to years. Satellite remote sensing has been successfully employed to produce maps of seagrass in the past, but turbid waters and difficulty in obtaining low-tide scenes pose persistent challenges. This study builds on an increased availability of affordable high temporal frequency imaging platforms, using seasonal unmanned aerial vehicle (UAV) surveys of seagrass extent at the meadow scale, to inform machine learning classifications of satellite imagery of a 40 km2 bay. We find that object-based image analysis is suitable to detect seasonal trends in seagrass extent from UAV imagery and find that trends vary between individual meadows at our study site Bahía de San Quintín, Baja California, México, during our study period in 2019. We further suggest that compositing multiple satellite imagery classifications into a seagrass probability map allows for an estimation of seagrass extent in turbid waters and report that in 2019, seagrass covered 2324 ha of Bahía de San Quintín, indicating a recovery from losses reported for previous decades.

1. Introduction

Seagrass meadows provide important ecosystem services such as shoreline protection, constitute habitat for commercially important fish, and potentially sequester significant volumes of carbon [1,2,3]. However, both anthropogenic and natural environmental stressors have led to a worldwide reduction in coastal seagrass extent, with rates of decline increasing from 0.9% per year before 1940 to 7% per year since 1990 [4]. In recognition of their potential to offset carbon emissions, seagrass meadows are being evaluated as National Determined Contributions by nations that signed the Paris Climate Agreement, creating an urgent need to determine their spatial extent and document trends globally [5,6].
For purposes of management and restoration, it is essential to produce accurate maps of seagrass meadows and to record indicators of seagrass ecological structure and function at the ecosystem scale and at temporal frequencies ranging from months to years. Although satellite remote sensing has long been employed to produce maps of seagrass, challenges persist [7]. These are related to poor performance of remote sensing techniques under adverse atmospheric and hydrologic conditions characterized by high particle concentrations that scatter and absorb electromagnetic radiation.
Furthermore, costs of both extensive field work and the acquisition of high-frequency (e.g., daily to weekly), high-resolution (<5 m) imagery over large areas of interest can be prohibitive. It is desirable to map submerged aquatic vegetation at low tide to reduce attenuation of the benthic seagrass signal by the water column, especially in turbid conditions. However, morning image captures of sun-synchronous polar orbiting satellites are not always synchronized with low tides. Therefore, remote sensing techniques are often restricted to broad temporal and spatial scales and limited to measures of presence/absence [8,9,10]. Existing seagrass monitoring programs typically employ a tiered approach, with in situ observations of seagrass characteristics (Tier 2, e.g., shoot density, percent cover, and canopy height) occurring sub-annually along transects or fixed quadrats accessed via wading, snorkel, or SCUBA [10,11]. This monitoring effort can be supplemented by interannual seagrass meadow delineations using satellite or acoustic remote sensing (Tier 1).
Depending on the monitoring tier, seagrass ecology can be studied at either the shoot (cm2), patch (m2), meadow (ha), or community (km2) scale. Studies of high temporal resolution exist at the shoot and patch scales but are scarce on a community level [12]. Although better suited for measuring seagrass growth metrics (e.g., shoot density, percent cover), in situ methods are often too labor intensive to scale up spatially [11]. Potential small-scale, high-frequency investigations can deliver important information about seagrass dynamics, such as disturbance events and subsequent recovery, impacts of process drivers on landscape dynamics, seasonal growth patterns, or effects of management practices [13]. The analysis of seasonal dynamics in seagrass cover can inform management and restoration practices, where high-frequency analyses on the community scale are scarce [13,14]. Therefore, remote sensing techniques need to be developed that harness high-resolution imagery for seasonal, community scale analysis.
Emerging sensor technologies offer the potential to overcome some of the spatiotemporal limitations in seagrass remote sensing. For example, unmanned aerial vehicles (UAV) can generate imagery with very high resolution at low and decreasing cost, with flexible acquisition time. Although UAV have been successfully used to map seagrass, most UAV systems are restricted to mapping at the meadow scale [15,16]. For community-scale observations at high temporal frequencies, the recent proliferation of satellite flocks such as Planet Doves show promise [8,17]. These multispectral sensor systems revisit most of the globe daily, acquiring high-resolution imagery (3 m pixel−1). Compared to sensor platforms that were used to map seagrass at coarser resolutions in the past (e.g., Landsat; 30 m pixel−1) [18], higher-resolution imagery may better capture fine-scale meadow features (e.g., patchiness, meadow boundaries) by providing a smaller minimum mapping unit.
The recent progress in sensor technology is paralleled by developments in image analysis techniques. For example, object-based image analysis (OBIA) proved especially useful for seagrass delineation [19]. OBIA is advantageous for extent mapping and even for discerning different species of seagrass, or seagrass and algae, because attributes beyond the pixel extent are used to characterize a class sample, allowing for additional information to inform classifications [19]. Moreover, image classification can benefit from improved algorithms, particularly machine learning approaches [11]. The application of machine learning classifiers has allowed geospatial researchers to achieve highly accurate seagrass maps [9,20]. The performance of machine learning techniques depends on the quality and size of training datasets [21]. To this end, obtaining high-resolution ground-truthing data from UAV can generate suitable datasets, if employed over the full suite of expected cover classes [15].
As blue carbon accounting becomes an important task for non-profits and government agencies globally and resources are allocated towards the management and restoration of seagrass habitats, there is a growing need for scalable mapping techniques that are both cost- and time-efficient [11]. This study builds on recent advances in image processing and classification technology, increased availability of affordable high temporal frequency imaging platforms, and an innovative integration of survey methods to produce seasonal time series of high-resolution seagrass classifications in a challenging environment. Specifically, we test whether UAV-derived seagrass extent classifications generated via OBIA can inform machine learning classifiers to produce accurate seagrass extent maps from satellite imagery on the community scale. We further test whether previously reported quadrat-derived seasonal trends in seagrass growth metrics at our study site are reflected in seagrass extent changes at the meadow scale and estimate the overall area of eelgrass cover for 2019. We chose Bahía de San Quintín (Figure 1) for our case study, because of the importance of its eelgrass meadows to migrating birds, local fisheries, and the dependence of the local economy on bay resources [22]. Previous reports of declines in seagrass extent between 1987 and 2012 merit this effort to produce current seagrass extent estimates for Bahía de San Quintín [23,24].

2. Materials and Methods

2.1. Study Site

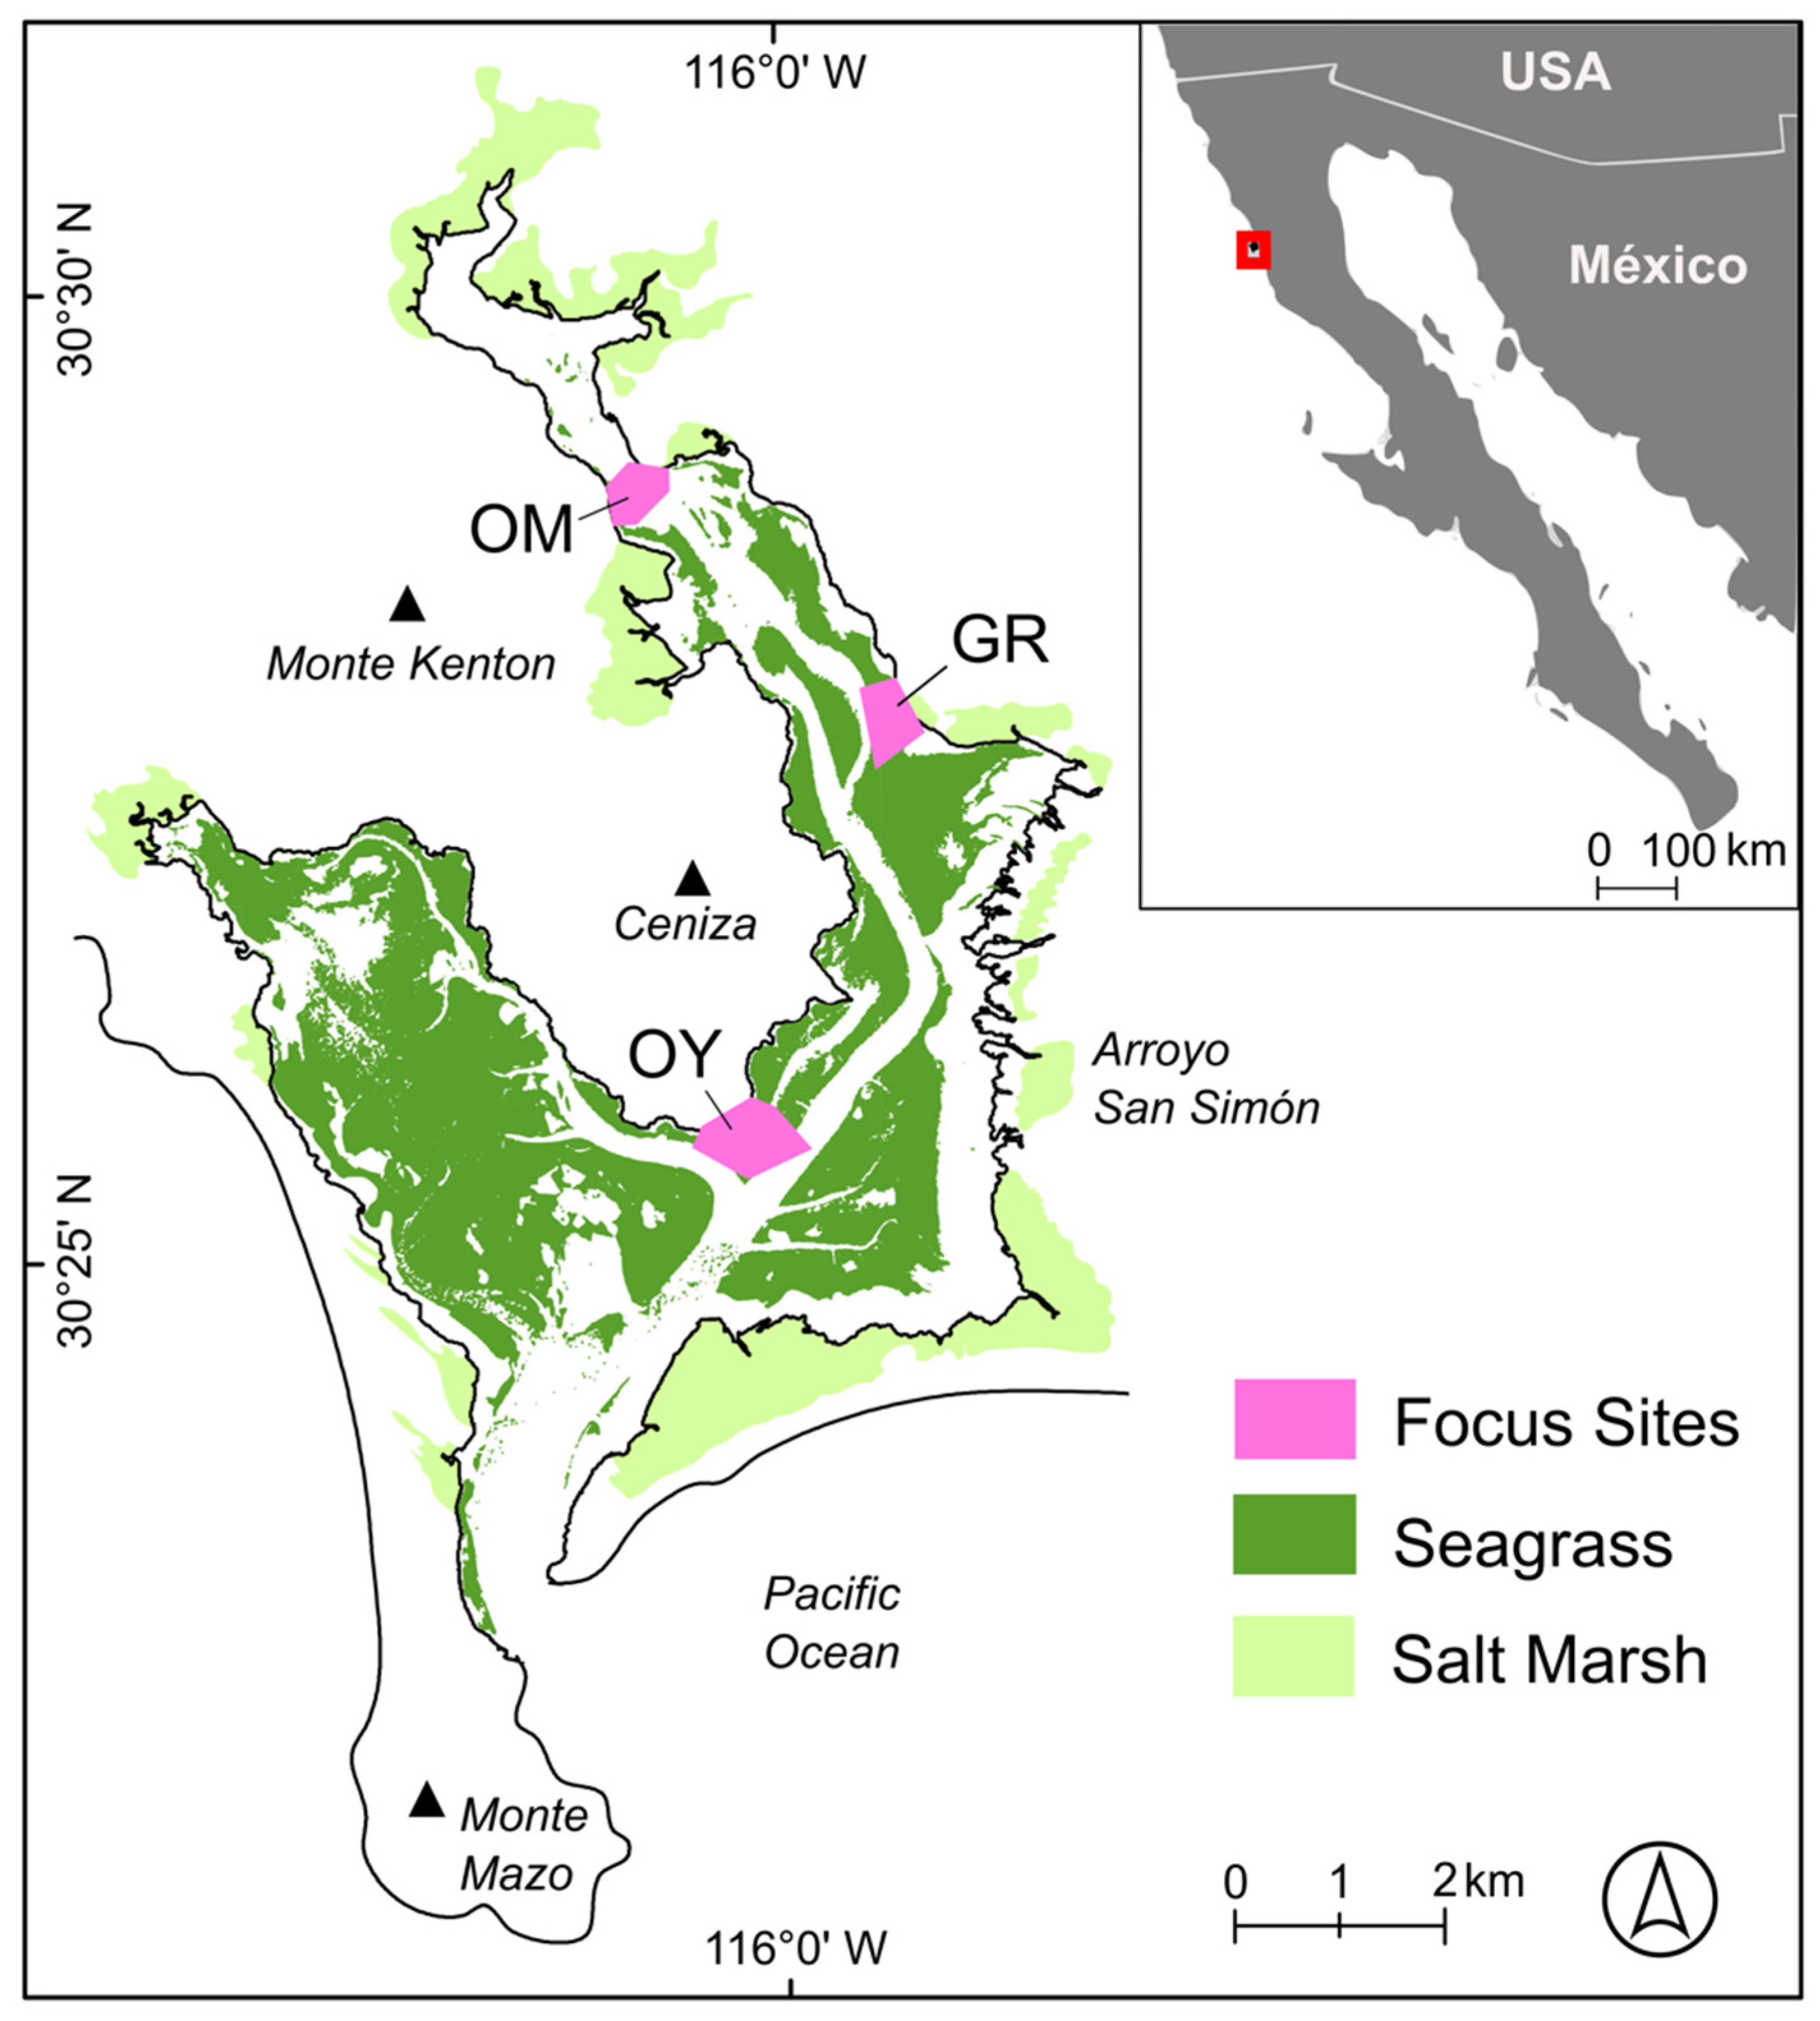
This study was carried out at Bahía de San Quintín, a hypersaline lagoon with an area of ~40 km2 (Figure 1), located at the Pacific coast of Baja California, México (30°25′57′′ N; 115°57′59′′ W). The bay is mostly shallow (<3 m depth), with navigable channels spanning the length of both of its arms. The mixed semidiurnal tides have a maximum amplitude of 2.5 m, exposing large parts of the bay at spring tides. Approximately 40% of the areal extent of Bahía de San Quintín is colonized by the eelgrass Zostera marina, with both subtidal and intertidal meadows.
The eelgrass population undergoes a seasonal growth cycle, with peak shoot density and biomass in September [25]. The ocean off Bahía de San Quintín is impacted by the California Current system, with wind-driven upwelling throughout the year [26]. However, the most intense upwelling events occur in spring and early summer [27], and the nutrient-dense waters promote spring blooms of Ulva expansa, among other species [28]. Both phytoplankton productivity and suspended sediments contribute to high turbidity and light limitation might be a factor constraining seagrass distribution in the bay [29]. This study system is in a close-to-natural state, with very little anthropogenic influence from coastal development or local land use [30].

2.2. Image Acquisition and Ground Truthing

UAV surveys were conducted at three focus sites (Figure 1) during the lowest astronomical tides (−0.3 m to 0 m MLLW) of January, March, July, and October 2019, using a DJI Phantom 4 Pro (DJI, Shenzhen, CHN) flown at 61 m altitude at 3.5 m s−1 to record images with 80% overlap and a resolution of 2.5 cm pixel−1. Ground control points (n ≥ 12) were evenly distributed throughout the focus sites and geolocated to within 5 cm using a differential GPS base station and rover (System 1200, Leica, Wetzlar, Germany). Differential GPS observations were postprocessed using the national geodetic survey’s online positioning user service (geodesy.noaa.gov/OPUS/, accessed on 7 September 2021) and data from a permanent GNSS station in San Quintín [31]. The location of focus sites was chosen so that they were distributed evenly over the extent of the bay and represented the expected variation of bottom types of the whole study system, including shallow mudflats, deep sandy channels, as well as subtidal and intertidal eelgrass beds. Percent cover of benthic macrophytes was estimated in January and July at each focus site using 0.25 m2 quadrats in a stratified random sampling design. The center of each quadrat was geolocated using the differential GPS. Additionally, eelgrass presence/absence was recorded at the locations of ground control points at all sites and timepoints. Orthorectified and radiometrically corrected multispectral satellite imagery was downloaded under an educational license from Planet Lab (PlanetScope Analytic 3B, 4 bands, 3 m resolution, <10 m RME) [32] and visually inspected for spatial co-registration with UAV imagery. Imagery was selected for minimal cloud cover (<5%), low tidal stage, and an acquisition date within three weeks of field sampling (Table 1). These criteria allowed for sourcing of suitable satellite images from winter, spring, and fall 2019, but no imagery with high enough quality could be obtained for the summer sampling period.

2.3. Imagery Pre-Processing

Orthomosaics (5 cm px−1) were produced from UAV images following a standard photogrammetry workflow in Metashape (Agisoft, St. Petersburg, Russia) [33] achieving horizontal errors for winter surveys at OM, GR, and OY of 0.06, 0.03, and 0.88 m, respectively; 0.02, 0.03, and 0.02 m for spring; 0.11, 0.02, and 0.33 m for summer; and 0.05, 0.03, and 0.02 m for fall surveys. Lowest astronomical tides in winter occurred in the evening when a low sun angle and reduced illumination decreased the quality of UAV images. Therefore, winter surveys of OM and OY were excluded from further analysis. Individual satellite image tiles were mosaiced and clipped to the study region in ArcGIS 10.2.2 (Esri, Redlands, CA, USA).

2.4. Object-Based Image Analysis

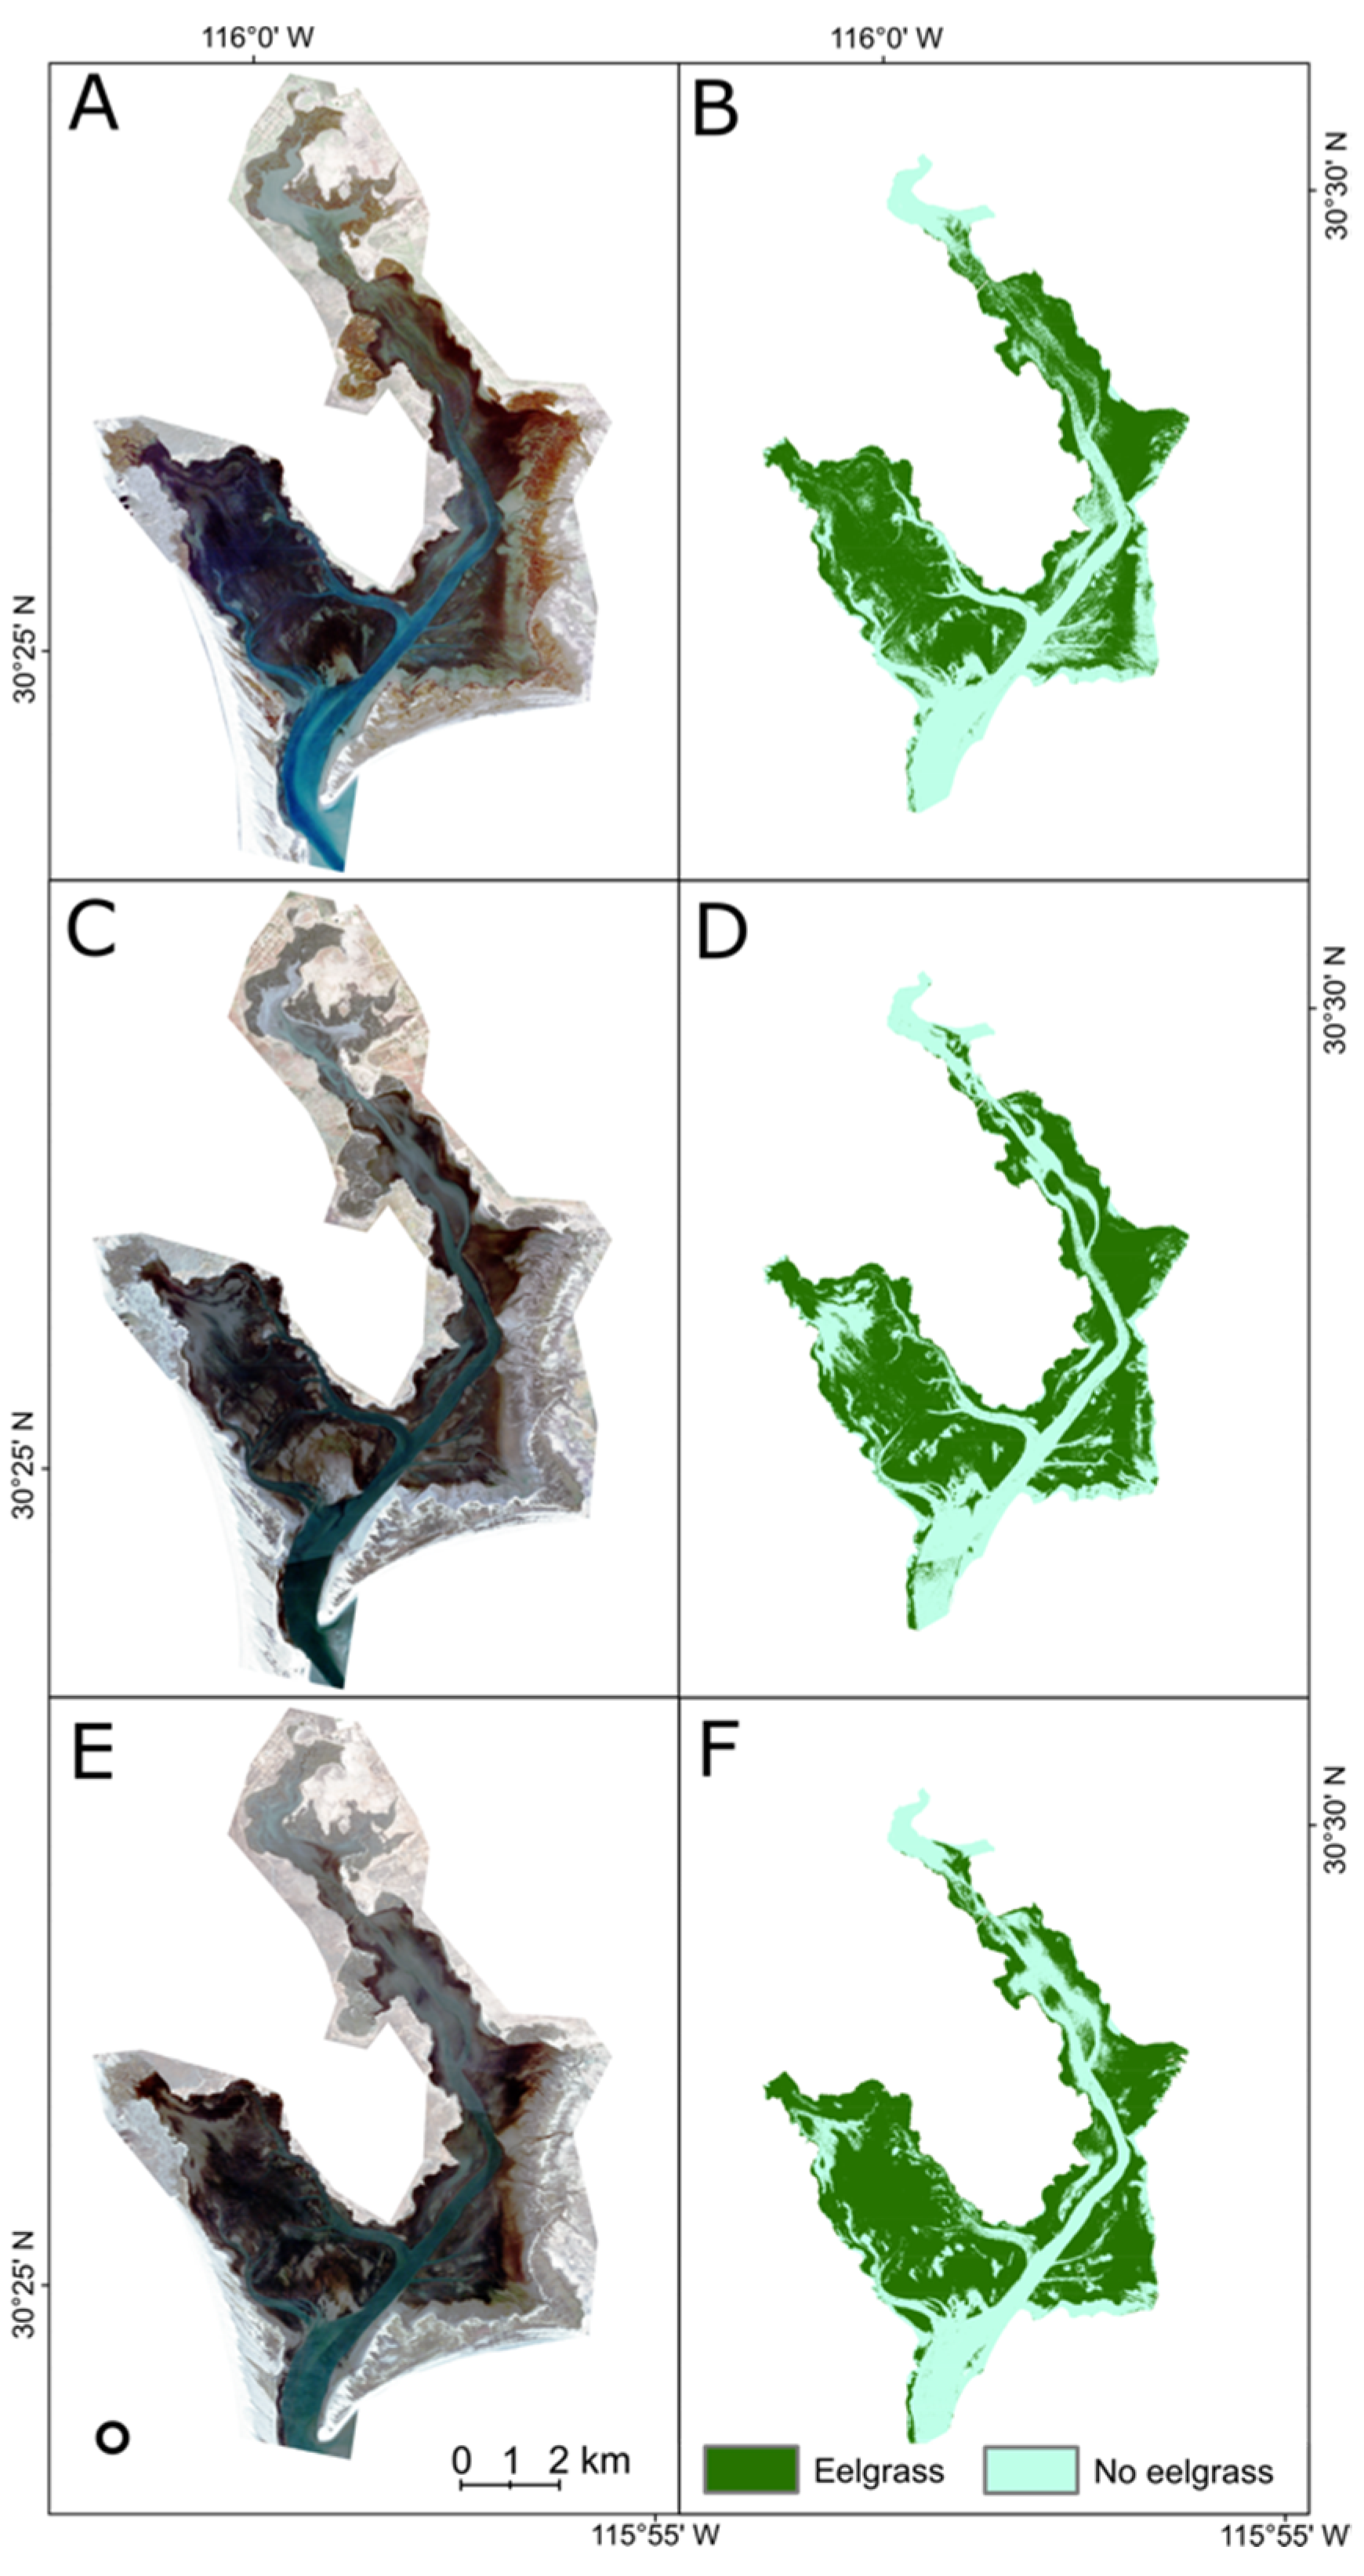
Satellite and UAV orthomosaics were classified via object-based image analysis in eCognition Developer 9 (Trimble, Sunnyvale, CA, USA). Individual UAV orthomosaics were first segmented into 0.25 m2 squares (level 1), which were subsequently segmented into smaller subobjects using the multiresolution segmentation algorithm (level 2). Eelgrass, algae, and bare ground were classified on level 2 using decision trees based on object means for red, green, blue spectral bands, hue, brightness, or max. difference. In a second classification step, the level 1 objects were assigned the cover classes Eelgrass (>10% of pixels contained in object classified as eelgrass on level 2) or No Eelgrass (0–9% of pixels in object classified as eelgrass on level 2). The resulting eelgrass extent raster datasets with a pixel size of 0.25 m2 were exported to serve as training data for satellite image analysis. Multispectral satellite orthomosaics were imported into eCognition Developer and segmented using the multiresolution segmentation algorithm (scale: 3, shape: 0.1, compactness: 0.5). UAV eelgrass extent raster datasets from the 3 focus sites were subset into imported as thematical layers and used to assign classes to satellite image objects. The resulting classified image objects served as training data for machine learning classifiers, using mean object blue, green, red, and near-infrared radiance, brightness, max. difference, and texture (GLCM homogeneity, all directions). Salt marsh and upland classes were assigned to image objects based on near-infrared radiance and brightness. All other objects represent intertidal flats or submerged features and were classified as Eelgrass or No Eelgrass by application of machine learning classifiers. Parameter tuning for support vector machine (SVM) classifiers with radial basis function-kernel included step-wise alteration of C (controlling penalty of misclassification) and γ (generalization of class regions) [34]. The resulting eelgrass extent classifications for the entire bay were exported in raster format with a 3 m2 cell size to perform trends analyses (Figure 2).

2.5. Accuracy Assessment

The accuracy assessments in this work were conducted adhering to general best practice recommendations, in that reference data were of higher quality than the classification being assessed, separate datasets were used for training and validation, and reference classifications were obtained by sampling from the entire study region [35]. The classification accuracy of UAV imagery (level 1) was assessed using the eelgrass cover field observations (quadrats, n = 57). A confusion matrix was created and overall accuracy as well as specificity (fraction of bare ground correctly detected), sensitivity (fraction eelgrass cover correctly detected), positive predictive value (PPV, fraction of eelgrass predictions correct), and negative predictive value (NPV, fraction of bare ground predictions correct) are reported. The accuracy of satellite imagery classifications was assessed using the UAV-derived classifications as reference. For each timepoint, the corresponding UAV-derived maps were subsampled in a stratified design to collect 1000 points per cover class. These validation samples were intersected with the satellite classification to compare reference point classes to pixel values of the satellite imagery classifications. The error for satellite-derived eelgrass extent estimates was derived by taking the square root of the sum of square errors of UAV and satellite classification.

2.6. Trends Analysis

For each seasonal SVM classification of satellite imagery, the total area with Eelgrass and No eelgrass cover was extracted. Similarly, the area of cover classes for UAV classifications (level 1) was computed for each season and focus site. Area calculations were performed on the common footprint of all UAV surveys for each site, to avoid bias by differences in UAV survey extent between timepoints. The resulting common footprints include intertidal seagrass meadows and mudflats but not subtidal eelgrass, because at least one of the seasonal UAV surveys failed to capture the subtidal portion at all focus sites. However, eight out of twelve UAV surveys did include subtidal eelgrass and training of the SVM classifiers for whole-bay seagrass extent mapping was done on the full UAV survey footprints, allowing for the classification of subtidal eelgrass from satellite imagery. A seagrass probability map was generated by raster multiplication of the three SVM classifications of satellite imagery (winter, spring, and fall). The resulting map differentiates four cover classes, representing the fraction of seasonal classifications that predicted eelgrass presence for each pixel (0/3, 1/3, 2/3, 3/3). For example, if one pixel was classified as eelgrass in only one of the three seasonal classifications, the probability for 2019 was 33% for that pixel. This probability for eelgrass detection incorporates potential seasonal fluctuations in seagrass extent as well as classification error. This approach was used to derive the overall eelgrass extent at San Quintín Bay for the year 2019, providing a measure of confidence in eelgrass presence. Two estimates of overall classification error were derived for the probability map, representing the range of uncertainty that can be expected for this multi-temporal map [36]. The upper bound of the uncertainty range assumes completely independent error and was calculated by taking the square root of the square errors of input maps. The lower bound of the uncertainty range was calculated assuming complete spatial correlation of error and corresponds to the largest classification error of the three seasonal input maps. Seagrass extent estimates derived from the probability map are reported as ‘area ha ± min. error-max. error ha’. Statistical analysis was performed in R using the packages ‘caret’ 6.0–86 [37], ‘sp’ 1.4–4 [38] and ‘raster’ 3.4–5 [39]. All maps were created in ArcMap 10.2.2.

3. Results

3.1. UAV Image Accuracy Assessment and Trends

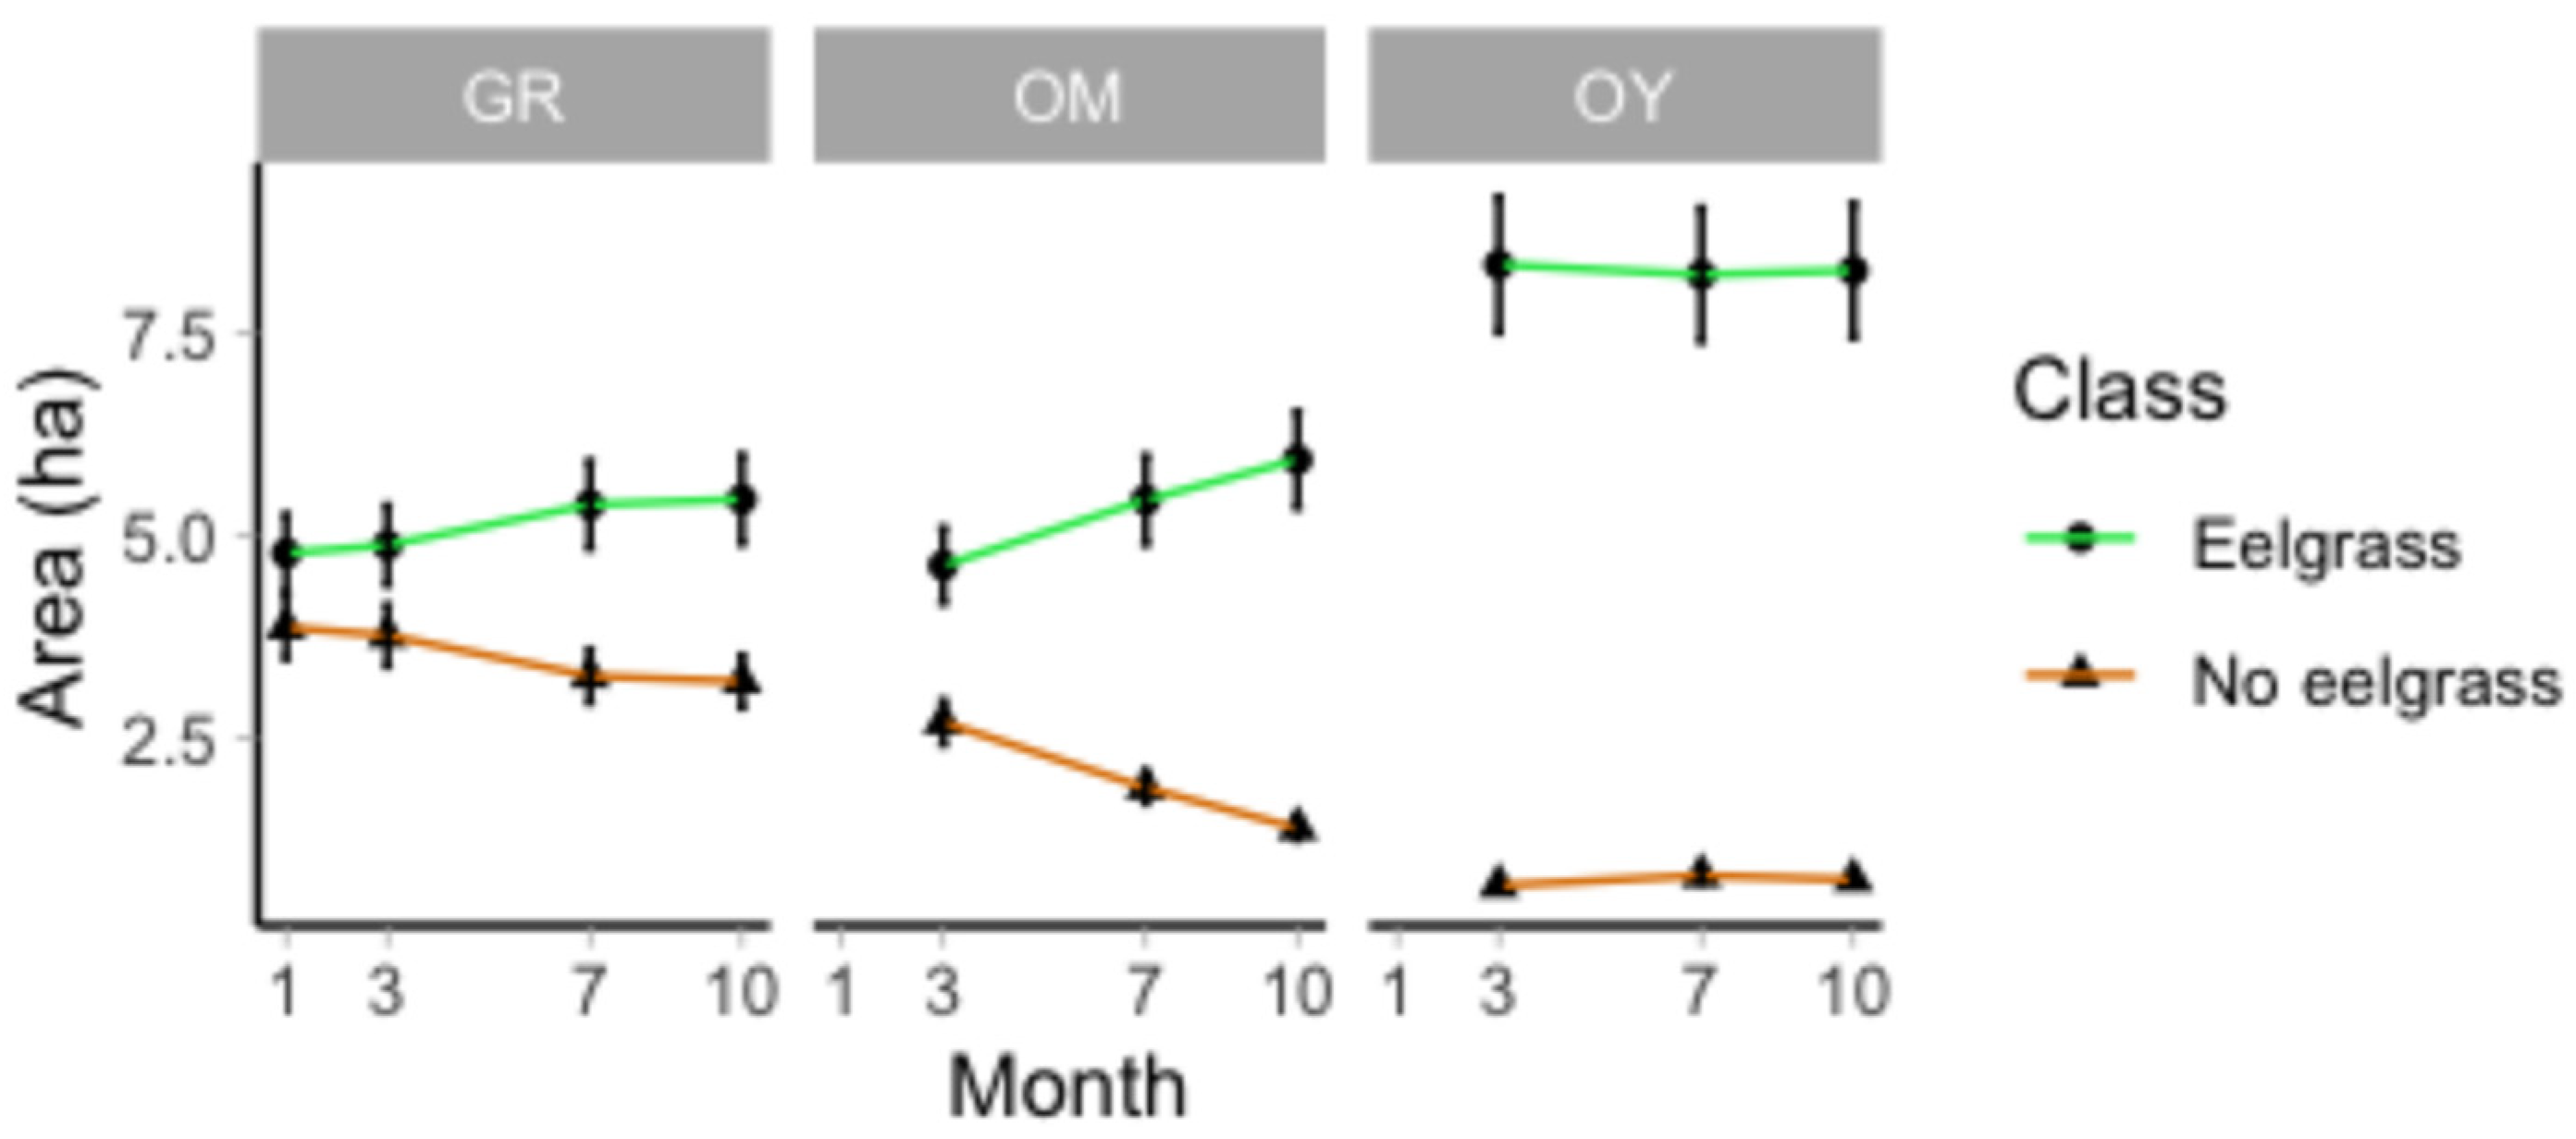
The overall accuracy of UAV imagery classifications was 0.90 (95% confidence interval: 0.79, 0.96) (Table 2). The Eelgrass class was reliably discerned from No Eelgrass (Sensitivity: 0.94, specificity: 0.84). The relatively higher sensitivity compared to specificity indicates that classifications identified eelgrass at higher accuracy than bare areas. The overall error was low (0.1), but classifications likely slightly overestimated eelgrass extent. The available reference data from quadrats were slightly unbalanced and we report a balanced accuracy of 0.89. The area covered by eelgrass at the three focus sites as estimated from UAV surveys differed by site and month (Figure 3). While eelgrass extent stayed constant at 8.2 ± 0.8 ha (pixel count ± classification error) over the surveyed months at the focus site ‘OY’, at ‘OM’ there was a linear increase from 4.6 ± 0.5 ha of eelgrass in January to 5.9 ± 0.6 ha in October. At the focus site ‘GR’, no statistically significant trend could be detected; however, the area classified as eelgrass was 0.5 ha higher in July and October compared to January and March.

3.2. Satellite Image Accuracy and Trends

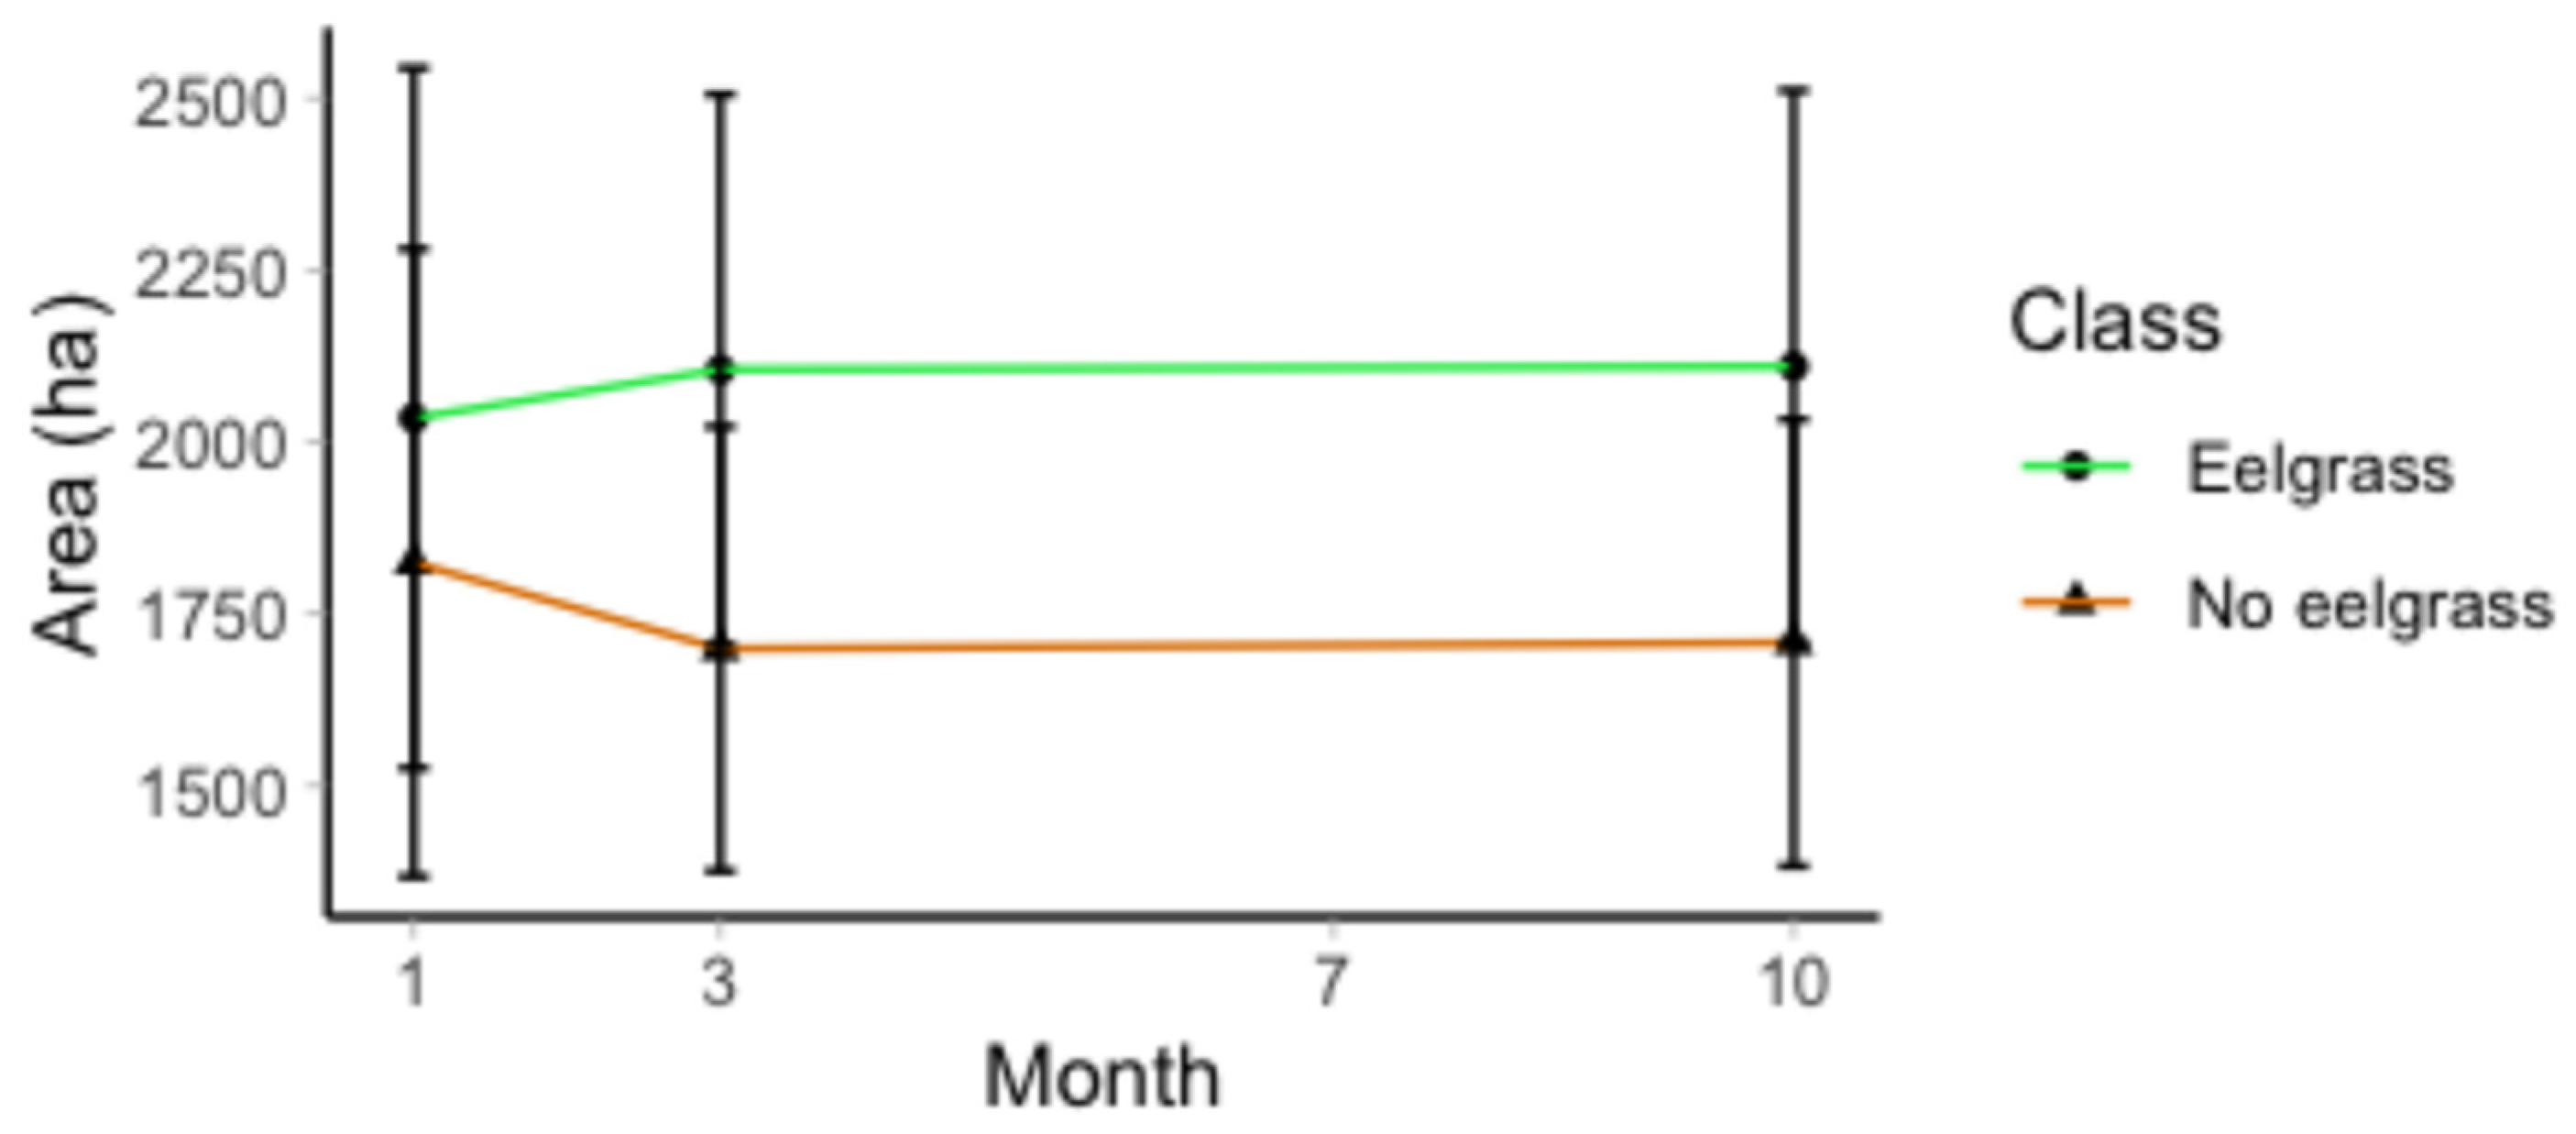
The accuracy of satellite imagery classifications was moderate to high overall but differed between timepoints (Table 3). The highest accuracy was achieved for the fall and spring classifications (0.81), while the winter classification had the lowest accuracy (0.75). For winter and spring, specificity was higher (0.91, 0.89) than sensitivity (0.68, 0.75), indicating that if Eelgrass was absent, the classifiers tended to correctly predict No Eelgrass. However, for areas where seagrass was present, individual classifications tended to be less accurate. The predicted eelgrass extent appeared to increase from winter (2035 ± 509 ha) to spring (2105 ± 400 ha) and was highest in fall (2210 ± 401 ha). Due to moderate accuracies of satellite classifications and additional error propagated from UAV-derived classifications, no seasonal trend in bay-wide seagrass extent can be discerned (Figure 4).

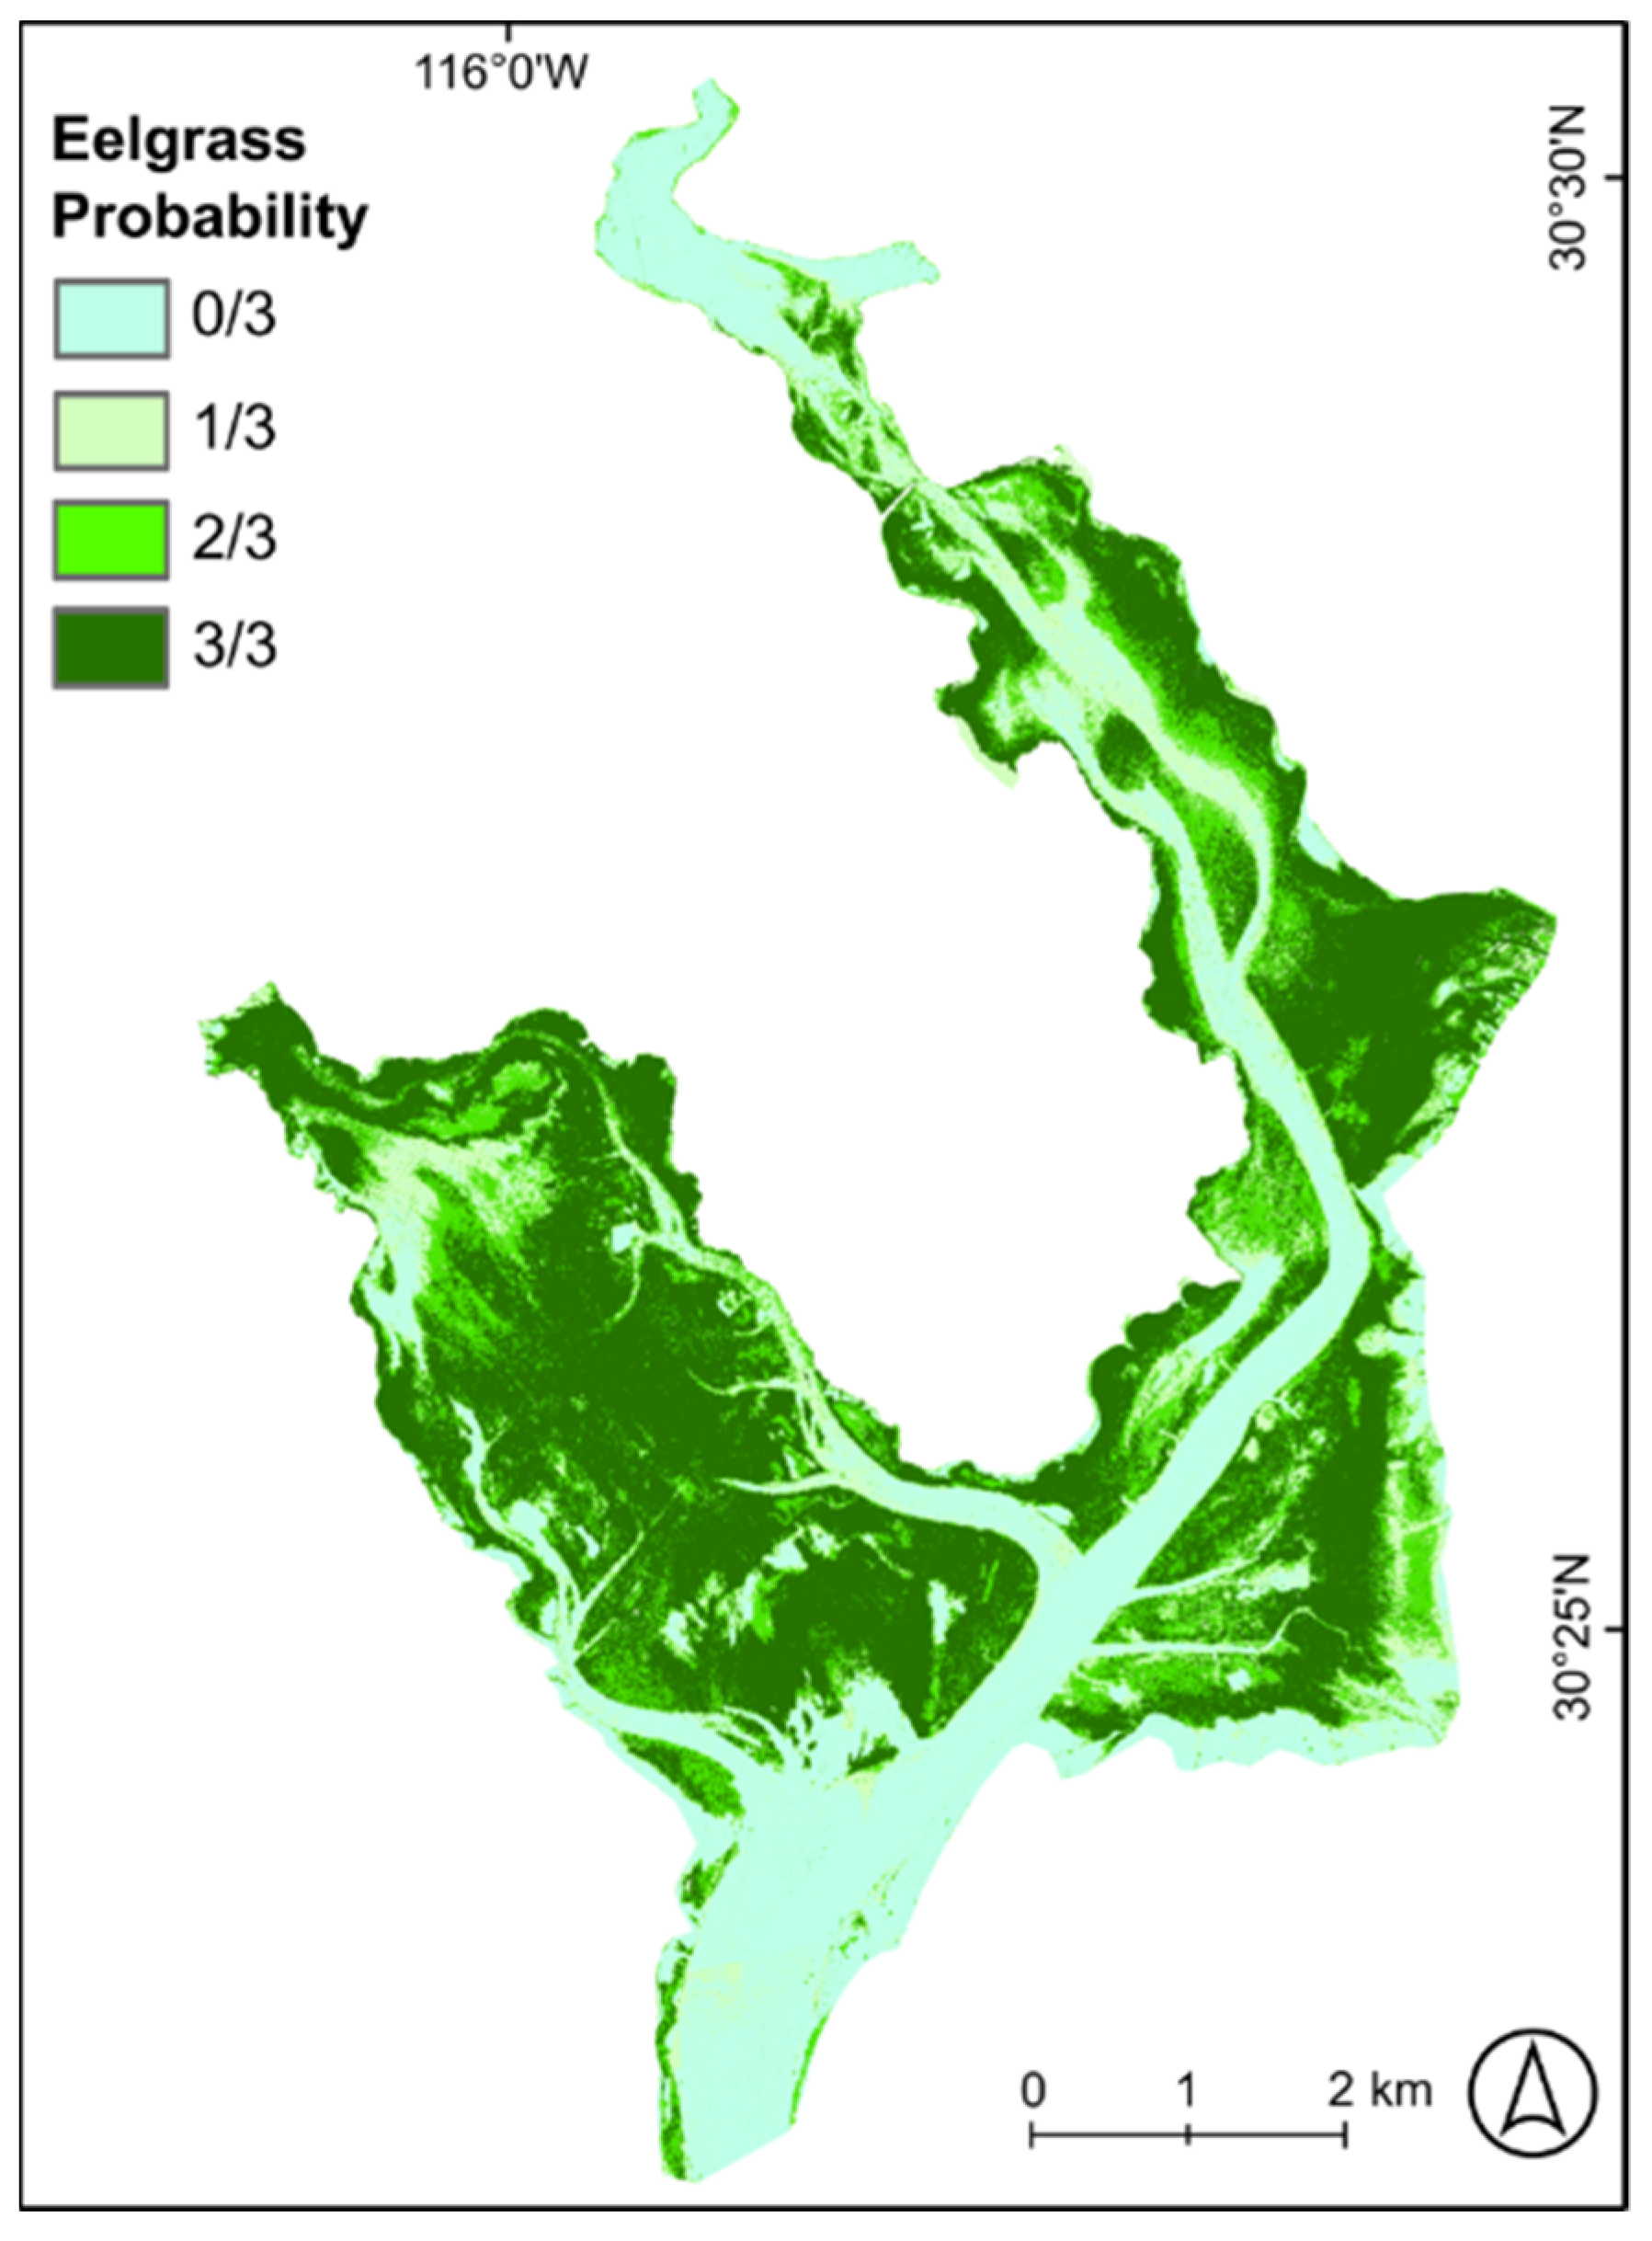
3.3. Eelgrass Probability

A synthesis map of eelgrass extent for 2019 was produced by combining the seasonal SVM classifications, assigning to each pixel a value that represents the fraction of seasonal classifications for which eelgrass was predicted at that location (Figure 5). Eelgrass extent (area in ha) was calculated for each class. For 1000 ha ± 250–400 ha of the bay, none of the seasonal classifications predicted eelgrass (0/3). These areas comprise mostly of channels and mudflats. Low eelgrass probability (1/3) was assigned to 536 ha ± 134–214 ha, with pixel locations mostly falling on deeper channels and submerged mudflats. These likely represent true eelgrass absence, where one seasonal classification erred. Moderate eelgrass probability (2/3) was derived for 804 ha ± 201–322 ha, mostly at the upper intertidal and in subtidal portions of eelgrass beds. The very high (3/3) eelgrass probability classes account for 1520 ha ± 380–608 ha. These classes make up the majority of the area of Bahía San Quintín and are located in the inter- and subtidal portions with known eelgrass beds. Expressed cumulatively, the area of the bay with at least low eelgrass probability for 2019 was 2860 ha ± 715–1144 ha and the area with at least moderate probability was 2324 ha ± 581–930 ha.

4. Discussion and Conclusions

With this study, we tested the suitability of UAV and Planet imagery for seasonal mapping of eelgrass bed extent in an Eastern Pacific bay with turbid waters and high tidal amplitude. We found that high resolution, UAV-derived eelgrass cover classifications from three focus sites were suitable as test and training data for machine learning classifiers and allowed for seagrass extent mapping of the entire bay using PlanetScope satellite imagery. We further synthesized seasonal observations into an eelgrass probability map for the year of 2019 and derived estimates of eelgrass extent at various levels of confidence. In the following paragraphs, we evaluate the strengths and weaknesses of this approach and discuss the implications of our eelgrass extent observations in relation to the study site Bahía San Quintín.

4.1. UAV Surveys Bridge In Situ and Satellite Remote Sensing Observations

In recent years, falling prices of UAVs have increased their accessibility to the scientific community and led to their application for a broad range of mapping tasks, including seagrass bed delineations [15,40,41]. Among the benefits of this technology are the ability to capture very high-resolution images with ample flexibility in the timing of observations. These assets were particularly important to our study because they allowed for image acquisition at the lowest low tides, generating training data for classifiers delineating the eelgrass extent in a turbid coastal system, which is a traditionally challenging environment for remote sensing applications. However, even the flexible timing of imagery acquisition did not enable us to capture subtidal eelgrass at every survey, as lowest astronomical tides could occur in low-light conditions, particularly in winter. The accuracies achieved for UAV-derived intertidal eelgrass extent maps were sufficient to identify seasonal trends at the meadow scale, complementing in situ observations of intertidal eelgrass growth from quadrat and transect studies. While we only classified UAV imagery into eelgrass presence and absence, the OBIA workflow presented in this study would allow for percent cover observations. However, adequate ground truthing has to be available, which increases the effort required for field work. It was previously noted that the human observer interpreting UAV imagery is a source of classification uncertainty [15]. Therefore, expert knowledge of the field site is essential for successful mapping, even at the level of detail provided by UAV surveys.

4.2. PlanetScope-Daily Revisits but Mixed Image Quality

We tested the suitability of PlanetScope imagery for scaling up UAV classifications to the entire study region (40 km2), aiming to leverage almost daily satellite revisit times for seasonal classifications. Previous benthic habitat mapping attempts with Planet imagery report moderate accuracies (50–70%) in optically shallow waters, but a high signal-to-noise ratio which can deteriorate image quality [8], especially in deeper water [42]. This and the typically turbid waters at San Quintín require imagery taken at low tidal stage, however, no such imagery was available for summer, because of regular cloud cover. Large-scale benthic habitat mapping efforts that rely on Planet imagery have used a cloud-free satellite scene composite [43], but our attempt of seasonal mapping required imagery to be acquired in close temporal proximity to field sampling, narrowing the choice of satellite scenes. Tidal stage, cloud cover, and imagery acquisition timing are well described constrains for benthic habitat mapping [12] and these are not fully alleviated by daily satellite revisits. Nevertheless, for the other seasons, suitable imagery was available, allowing for eelgrass mapping with moderate accuracy. One of the factors influencing classification accuracy is the choice of input statistics used in OBIA. After testing a suite of object statistics, we chose the ones listed in Section 2.4; however, we recognize that other object statistics might have improved classification accuracy. Overall, classification error was too large to detect minor changes in eelgrass extent, such as those detected by UAV surveys. While there was an increase in predicted eelgrass extent from winter to spring and fall, this observation could have been caused by classification error alone. The least accurate classification was derived for the winter imagery (75% overall accuracy), which was also acquired at a higher tidal stage compared to scenes from the other timepoints (Table 1). Considering the turbid waters of Bahía San Quintín, high tidal stage could have resulted in a reduced capacity to detect eelgrass correctly, resulting in smaller estimates of eelgrass extent for winter.

4.3. Temporal Composite of Satellite Imagery for Eelgrass Probability Mapping

To overcome shortfalls of individual satellite imagery classifications, we derived a map of eelgrass probability, synthesizing the seasonal eelgrass bed delineations (Figure 6). This approach proved useful for estimating the eelgrass extent at Bahía San Quintín, because error inherent in individual classifications based on single satellite images can be reduced. This error can be introduced by multiple sources, some of which are especially relevant to bays with turbid waters. First, atmospheric and hydrological conditions can vary across the study region, with higher suspended sediment loads potentially causing optically deep water in parts of the bay. This locally reduces the likelihood of detection of bottom features such as seagrass, leading to errors of omission (‘false negatives’). For the seasonal classifications in this study, this is a likely source of error, as indicated by decreased sensitivity of SVM classifiers for winter and spring (Table 3). Second, individual PlanetScope images are known to have a relatively low signal-to-noise ratio, introducing error particularly over areas of open water [8,42]. This noise can lead to errors of commission (‘false positives’) in locations unlikely to have seagrass cover, such as deeper navigation channels. By compositing several classifications of the same year, we can gain a more nuanced picture of seagrass extent by attaching probability estimates to each pixel. Previous studies found temporal composite approaches useful for mapping of terrestrial vegetation [44,45], as well as coral reefs and other marine benthic habitats [43]. A drawback of the approach presented herein is that both classification error and seasonal growth dynamics reduce seagrass detection probability. The UAV surveys revealed seasonal growth dynamics in parts of the bay (Figure 2), but our method cannot discriminate these patterns from classification error when scaled up to the entire bay. However, for the purpose of delineating seagrass extent representative of the timespan of a whole year, the probability map is intuitive, as seasonal absence of eelgrass is reflected in a reduced probability. This type of map may prove useful for resource management or conservation applications that require knowledge of the spatial distribution of seagrass alongside a measure of uncertainty, which is especially important for remote, deep, or turbid systems for which seagrass extent estimates are scarce [46].

4.4. Mapping Accuracy

We adhered to best practices for accuracy assessment [35] where feasible. A notable weakness of this study is a lack of reference classification for the entire study system, which was unattainable given the high temporal classification frequency and size of the study system. However, assessing accuracy based on UAV image classifications at the three focus sites ensured that reference data were consistent between timepoints, with excellent temporal representation and geolocation, and of higher quality (i.e., resolution) than the assessed classification. This approach led to moderate overall classification accuracies while staying within constrains of time and cost of field surveys. It is important to note that, even though the classes of the probability map provide a measure of uncertainty for eelgrass presence on a pixel basis, overall map accuracy is not readily assessable. The standard approach assuming independent error of input maps aggregates the accuracies of each individual map that makes up the probability map, leading to a rapid deterioration of overall accuracy with the inclusion of more timepoints [36], until the mapping accuracy is lower than random chance [13]. This is almost certainly not true; rather than completely independent, misclassifications on the pixel level of individual maps are to some degree spatially correlated [13,36]. The true error for multi-temporal seagrass classifications, such as the probability map presented here, is likely a combination of independent and spatially correlated error. Therefore, we provide the range of expected classification error, with the lower bound representing spatially correlated error, while the upper bound represents completely independent error [36].

4.5. The Seasonality of Eelgrass Growth at San Quintin

Previous studies have described the seasonality of eelgrass growth at Bahía San Quintín, with lower eelgrass shoot density, leaf area index, and biomass in winter and spring compared to summer [25,47,48]. These seasonal dynamics of eelgrass morphometrics were captured using transect and quadrat studies, which allow for detailed observations, but often lack spatially explicit representations of the observed dynamics. Our seasonal UAV surveys of eelgrass beds at the three focus sites revealed that this seasonality in seagrass growth is accompanied by trends of eelgrass bed extent. However, this trend is not spatially uniform. At the site OY, which is closest to the oceanic inlet, eelgrass extent was constant throughout the year. In contrast, seasonal change in eelgrass extent was most pronounced at site OM, at the head of the bay. Previous studies described gradients of salinity, temperature, and nutrient availability at Bahía San Quintín, a result of coastal upwelling supplying colder, less salty, and nutrient rich waters to the mouth of the bay [49]. The conditions at the head of the bay are hypersaline and warmer, potentially leading to stress of intertidal eelgrass already living at the limit of their thermal tolerance. Indeed, drawing on multiple decades of biomass observations, Ibarra-Obando et al. [50] showed that higher eelgrass biomass at San Quintín was related to periods of colder water temperature. Therefore, our observation of pronounced eelgrass extent changes at the head of the bay could reflect stress-induced dieback followed by revegetation or an adaptation of life history strategy to higher temperatures.

4.6. Eelgrass Extent at San Quintin

The eelgrass meadows of Bahía San Quintín are an integral part of the local ecosystem, but their value reaches beyond the region. As an important stop on the Pacific flyway, San Quintín eelgrass provides a major food source for waterfowl that seek out the bay in winter, such as the black brant (Branta bernicla nigricans). The importance of San Quintín wetlands to migrating birds led to their designation as RAMSAR site and a heightened interest in the status of eelgrass beds. Ward et al. [23] used satellite remote sensing to compare eelgrass cover at San Quintín between 1987 and 2000 and found that the extent of eelgrass meadows decreased from 2390 ha to 2069 ha, with most decrease occurring in subtidal meadows. This decline in eelgrass extent continued from 2000 to 2011, at an increasing rate [24]. In 2011, only 1503 ha of the bay were covered with eelgrass, with most losses occurring in the east of the bay, at the delta of the arroyo San Simón [24]. Both authors attribute eelgrass loss to increased sediment inputs to the bay from Arroyo San Simón in years of high precipitation [23,24]. Based on the data gathered in our study, we can estimate the eelgrass extent at Bahía San Quintín for 2019. Because errors of omission as well as errors of commission can occur for any individual classification, it is likely that the area with eelgrass probability of at least 1/3 is an overestimate of true eelgrass extent, while the area with eelgrass probability of 1 is an underestimate of true eelgrass extent. Therefore, we use the area with at least 2/3 eelgrass probability as our best estimate, which is 2324 ha ± 581–930 ha. This result indicates that eelgrass cover expanded compared to 2011, with areas of gain located in the delta of Arroyo San Simón and the center of the bay south of focus site OY. If event-driven sediment loading was indeed the main cause of previous eelgrass loss, the impact appears to be temporally limited. The recovery of eelgrass extent suggests that this stressor was less pronounced in recent years, allowing for recolonization of previously uninhabited sites. However, additional factors such as water temperature, nutrient dynamics, disease, or trophic interactions may be governing cycles of eelgrass loss and recovery at San Quintín and an evaluation of causative relationships is beyond the scope of this study.

4.7. Outlook and Lessons Learned

We demonstrated that consumer-grade UAV can be a valuable tool for uncovering seasonal trends in seagrass extent, detecting changes at the meadow scale. Moreover, UAV survey data were useful for informing SVM classifiers to derive eelgrass distribution maps for the entire bay when processed in an OBIA workflow. We found that UAV surveys have the potential to bridge the gap in spatial and temporal scales of quadrat surveys and satellite image analysis, making them valuable tools for seagrass monitoring. However, we emphasize the need for good knowledge of the sampling site, because although UAV imagery can be rich in resolution and information, the interpretation and classification of UAV imagery is expert driven.
This study mapped seagrass in notoriously difficult conditions posed by a turbid system with tidal amplitude of 2.5 m. We took advantage of a satellite platform with high revisit frequency, which proved useful for sourcing suitable satellite imagery for multiple timepoints in 2019. Nevertheless, a composite approach was necessary to improve upon individual satellite classifications and to derive a seagrass distribution map. The accuracy of individual classifications was not sufficient to detect small-scale changes in seagrass extent, but it has to be noted that we did not perform more sophisticated satellite imagery preprocessing steps, which would likely have improved accuracy [42,51]. Potential seasonal differences in eelgrass growth should be considered when estimating seagrass bed extent for a given year. If only one satellite scene is analyzed, it should correspond to the maximum growth period to increase the likelihood of seagrass detection.
Our analysis suggests that overall eelgrass cover at Bahía San Quintín increased compared to estimates from 2000 and 2011 and is comparable to estimates for 1987 [24,52]. This finding implies that past seagrass loss at this bay does not continue in a unidirectional trajectory. It was proposed that event-based disturbance in the form of increased sediment loads led to the past decline of seagrass in the bay [23,24]. The apparent recovery from these periods of decline points to the ability of eelgrass at San Quintín to recolonize regions of previous loss, such as the delta of Arroyo San Simón. Nevertheless, previously vegetated areas at the heads of the bay are now converted to unvegetated mudflat. These fluctuations in eelgrass distribution are not well captured by trends analysis that compare only two timepoints with decades between observations and studies documenting year-to-year change are necessary to better understand the trajectory of seagrass habitats at Bahía San Quintín.

Author Contributions

Conceptualization, J.R.K., A.H.-C. and E.B.W.; methodology, J.R.K. and A.H.-C.; formal analysis, J.R.K.; investigation, J.R.K. and E.B.W.; resources, A.H.-C., A.B.G., J.R.K. and E.B.W.; writing—original draft preparation, J.R.K.; writing—review and editing, A.B.G., A.H.-C. and E.B.W.; supervision, A.H.-C. and E.B.W.; project administration, A.B.G. and A.H.-C.; funding acquisition, A.B.G., A.H.-C., J.R.K. and E.B.W. All authors have read and agreed to the published version of the manuscript.

Funding

This research was supported by UC Mexus-CONACYT collaborative grant [CN-16-147]. ABG was supported in part by USDA NIFA Hatch project [CA-R-ENS-5120-H] and USDA Multi-State Project W4188. JRK was supported by the William L. McLean III and the Claudio Elia Memorial fellowships. EBW was supported by a Fulbright-Garcia Robles Scholar Award, EBW and JRK were supported by the Association of American Geographers Marcus Fund.

Data Availability Statement

The data presented in this study are openly available in FigShare at 10.6084/m9.figshare.16578569.

Acknowledgments

We would like to thank Kirk L. Raper, Sergio Arregui, Luis Gradilla, Elisabeth B. Powell, Sofi Courtney, and Anastazja Kryńska for support in the field.

Conflicts of Interest

The authors declare no conflict of interest. The funders had no role in the design of the study; in the collection, analyses, or interpretation of data; in the writing of the manuscript, or in the decision to publish the results.

References

  1. Duarte, C.M.; Marbà, N.; Gacia, E.; Fourqurean, J.W.; Beggins, J.; Barrón, C.; Apostolaki, E.T. Seagrass community metabolism: Assessing the carbon sink capacity of seagrass meadows. Glob. Biogeochem. Cycles 2010, 24, 1–8. [Google Scholar] [CrossRef] [Green Version]
  2. Heck, K.L.; Hays, G.; Orth, R.J. Critical evaluation of the nursery role hypothesis for seagrass meadows. Mar. Ecol. Prog. Ser. 2003, 253, 123–136. [Google Scholar] [CrossRef] [Green Version]
  3. Koch, E.W.; Barbier, E.B.; Silliman, B.R.; Reed, D.J.; Perillo, G.M.E.; Hacker, S.D.; Granek, E.F.; Primavera, J.H.; Muthiga, N.; Polasky, S.; et al. Non-linearity in ecosystem services: Temporal and spatial variability in coastal protection. Front. Ecol. Environ. 2009, 7, 29–37. [Google Scholar] [CrossRef]
  4. Waycott, M.; Duarte, C.M.; Carruthers, T.J.B.; Orth, R.J.; Dennison, W.C.; Olyarnik, S.; Calladine, A.; Fourqurean, J.W.; Heck, K.L.; Hughes, A.R.; et al. Accelerating loss of seagrasses across the globe threatens coastal ecosystems. Proc. Natl. Acad. Sci. USA 2009, 106, 12377–12381. [Google Scholar] [CrossRef] [PubMed] [Green Version]
  5. McKenzie, L.J.; Nordlund, L.M.; Jones, B.L.; Cullen-Unsworth, L.C.; Roelfsema, C.M.; Unsworth, R.K.F. The global distribution of seagrass meadows. Environ. Res. Lett. 2020, 15, 074041. [Google Scholar] [CrossRef]
  6. UNEP. Out of Blue: The Value of Seagrasses to the Environment and to People; UNEP: Nairobi, Kenya, 2020. [Google Scholar]
  7. Pham, T.D.; Xia, J.; Ha, N.T.; Bui, D.T.; Le, N.N.; Tekeuchi, W. A Review of Remote Sensing Approaches for Monitoring Blue Carbon Ecosystems: Mangroves, Seagrasses and Salt Marshes during 2010–2018. Sensors 2019, 19, 1933. [Google Scholar] [CrossRef] [Green Version]
  8. Traganos, D.; Cerra, D.; Reinartz, P. Cubesat-Derived Detection of Seagrasses Using Planet Imagery Following Unmixing-Based Denoising: Is Small the Next Big? ISPRS Int. Arch. Photogramm. Remote Sens. Spat. Inf. Sci. 2017, XLII-1/W1, 283–287. [Google Scholar] [CrossRef] [Green Version]
  9. Traganos, D.; Reinartz, P. Interannual Change Detection of Mediterranean Seagrasses Using RapidEye Image Time Series. Front. Plant. Sci. 2018, 9, 96. [Google Scholar] [CrossRef] [Green Version]
  10. Neckles, H.A.; Kopp, B.S.; Peterson, B.J.; Pooler, P.S. Integrating Scales of Seagrass Monitoring to Meet Conservation Needs. Estuar Coast. 2012, 35, 23–46. [Google Scholar] [CrossRef]
  11. Duffy, J.E.; Benedetti-Cecchi, L.; Trinanes, J.; Muller-Karger, F.E.; Ambo-Rappe, R.; Boström, C.; Buschmann, A.H.; Byrnes, J.; Coles, R.G.; Creed, J.; et al. Toward a coordinated global observing system for seagrasses and marine macroalgae. Front. Mar. Sci. 2019, 6, 1–26. [Google Scholar] [CrossRef] [Green Version]
  12. Phinn, S.; Roelfsema, C.; Kovacs, E.; Canto, R.; Lyons, M.; Saunders, M.; Maxwell, P. Mapping, monitoring and modelling seagrass using remote sensing techniques. In Seagrasses of Australia: Structure, Ecology and Conservation; Ralph, P., Kendrick, G.A., Larkum, A.W.D., Eds.; Springer Nature: Cham, Switzerland, 2018; pp. 445–487. [Google Scholar] [CrossRef]
  13. Lyons, M.; Roelfsema, C.M.; Phinn, S.R. Towards understanding temporal and spatial dynamics of seagrass landscapes using time-series remote sensing. Estuar. Coast. Shelf Sci. 2013, 120, 42–53. [Google Scholar] [CrossRef]
  14. Kendrick, G.A.; Duarte, C.M.; Marbà, N. Clonality in seagrasses, emergent properties and seagrass landscapes. Mar. Ecol. Prog. Ser. 2005, 290, 291–296. [Google Scholar] [CrossRef] [Green Version]
  15. Duffy, J.P.; Pratt, L.; Anderson, K.; Land, P.E.; Shutler, J.D. Spatial assessment of intertidal seagrass meadows using optical imaging systems and a lightweight drone. Estuar. Coast. Shelf Sci. 2018, 200, 169–180. [Google Scholar] [CrossRef]
  16. Nahirnick, N.K.; Reshitnyk, L.; Campbell, M.; Hessing-Lewis, M.; Costa, M.; Yakimishyn, J.; Lee, L.; Horning, N.; Poursanidis, D. Mapping with confidence; delineating seagrass habitats using Unoccupied Aerial Systems (UAS). Remote Sens. Ecol. Conserv. 2019, 5, 121–135. [Google Scholar] [CrossRef]
  17. Asner, G.P.; Martin, R.E.; Mascaro, J. Coral reef atoll assessment in the South China Sea using Planet Dove satellites. Remote Sens. Ecol. Conserv. 2017, 3, 57–65. [Google Scholar] [CrossRef]
  18. Pu, R.; Bell, S.; Meyer, C.; Baggett, L.; Zhao, Y. Mapping and Assessing Seagrass along the Western Coast of Florida Using Landsat TM and EO-1 ALI/Hyperion Imagery. Estuar. Coast. Shelf Sci. 2010, 115, 234–245. [Google Scholar] [CrossRef]
  19. Roelfsema, C.M.; Lyons, M.; Kovacs, E.M.; Maxwell, P.; Saunders, M.I.; Samper-Villarreal, J.; Phinn, S.R. Multi-temporal mapping of seagrass cover, species and biomass: A semi-automated object based image analysis approach. Remote Sens. Environ. 2014, 150, 172–187. [Google Scholar] [CrossRef]
  20. Pu, R.; Bell, S. Mapping seagrass coverage and spatial patterns with high spatial resolution IKONOS imagery. Int. J. Appl. Earth Obs. Geoinf. 2017, 54, 145–158. [Google Scholar] [CrossRef]
  21. Qian, Y.; Zhou, W.; Yan, J.; Li, W.; Han, L. Comparing Machine Learning Classifiers for Object-Based Land Cover Classification Using Very High Resolution Imagery. Remote Sens. 2015, 7, 153–168. [Google Scholar] [CrossRef]
  22. Aguirre-Muñoz, A.; Buddemeier, R.W.; Camacho-Ibar, V.; Carriquiry, J.D.; Ibarra-Obando, S.E.; Massey, B.W.; Smith, S.V.; Wulff, F. Sustainability of Coastal Resource Use in San Quintin, Mexico. AMBIO J. Hum. Environ. 2001, 30, 142–149. [Google Scholar] [CrossRef]
  23. Ward, D.H.; Morton, A.; Tibbitts, T.L.; Douglas, D.C.; Carrera-Gonzalez, E. Long-Term Change in Eelgrass Distribution at Bahía San Quintín, Baja California, Mexico, Using Satellite Imagery. Estuaries 2003, 26, 1529–1539. [Google Scholar] [CrossRef]
  24. Simancas-Ortíz, J.E. Evaluación de la Calidad del Hábitat de Invernación para Branta Bernicla Nigricans en la Bahía de San Quintín. Master’s Thesis, Centro de Investigación Científica y de Educación Superior de Ensenada (CICESE), Ensenada, México, 2012. [Google Scholar]
  25. Poumian-Tapia, M.; Ibarra-Obando, S.E. Demography and Biomass of the Seagrass Zostera marina in a Mexican Coastal Lagoon. Estuaries 1999, 22, 837–847. [Google Scholar] [CrossRef]
  26. Bakun, A.; Nelson, C.S. The seasonal cycle of wind-stress curl in subtropical eastern boundary current regions. J. Phys. Oceanogr. 1991, 21, 1815–1834. [Google Scholar] [CrossRef]
  27. Camacho-Ibar, V.F.; Carriquiry, J.D.; Smith, S.V. Non-conservative P and N Fluxes and Net Ecosystem Production in San Quintin Bay, Mexico. Estuaries 2003, 26, 1220–1237. [Google Scholar] [CrossRef]
  28. Aguilar-Rosas, R.; López-Carrillo, M.; Aguilar-Roses, L.E. Macroalgas Marinas De La Bahía De San Quintín, Baja California, México. Polibotanica 2005, 19, 19–38. [Google Scholar]
  29. Aveytua-Alcázar, L.; Camacho-Ibar, V.F.; Souza, A.J.; Allen, J.I.; Torres, R. Modelling Zostera marina and Ulva spp. in a coastal lagoon. Ecol. Model. 2008, 218, 354–366. [Google Scholar] [CrossRef] [Green Version]
  30. Zertuche-González, J.; Camacho-Ibar, V.; Pacheco-Ruíz, I.; Cabello-Pasini, A.; Galindo-Bect, L.; Guzmán-Calderón, J.; Macias-Carranza, V.; Espinoza-Avalos, J. The role of Ulva spp. as a temporary nutrient sink in a coastal lagoon with oyster cultivation and upwelling influence. J. Appl. Phycol. 2009, 21, 729. [Google Scholar] [CrossRef]
  31. REDNOM: Red Géodesica Del Noroeste de México, Departamento de Sismología Del Centro de Investigación Científica y Educación Superior de Ensenada. Baja California, México. Available online: http://regnom.cicese.mx (accessed on 12 November 2019).
  32. Planet Team. Planet Application Program Interface: In Space for Life on Earth. Available online: http://planet.com (accessed on 12 November 2019).
  33. USGS National Unmanned Aircraft Systems Project Office. Umanned Aircraft Systems Data Post-Processing—Structure-from-motion Photogrammetry. Available online: https://uas.usgs.gov/nupo/pdf/PhotoScanProcessingDSLRMar2017.pdf (accessed on 8 June 2018).
  34. Christianini, N.; Shawe-Taylor, J. An. Introduction to Support. Vector Machines and Other Kernel-Based Learning Methods, 16th ed.; Cambridge University Press: Cambridge, MA, USA, 2000. [Google Scholar]
  35. Olofsson, P.; Foody, G.M.; Herold, M.; Stehman, S.V.; Woodcock, C.E.; Wulder, M.A. Good practices for estimating area and assessing accuracy of land change. Remote Sens. Environ. 2014, 148, 42–57. [Google Scholar] [CrossRef]
  36. Congalton, R.G.; Green, K. Assessing the Accuracy of Remotely Sensed Data. Principles and Practices, 3rd ed.; CRC Press: Boca Raton, FL, USA, 2019. [Google Scholar]
  37. Kuhn, M. Building predictive models in R using the caret package. J. Stat. Softw. 2008, 28, 1–26. [Google Scholar] [CrossRef] [Green Version]
  38. Pebesma, E.; Bivand, R.S. S Classes and Methods for Spatial Data: The sp Package. Econ. Geogr. 2005, 50, 1–21. Available online: http://citeseerx.ist.psu.edu/viewdoc/download?doi=10.1.1.160.9361&rep=rep1&type=pdf (accessed on 7 September 2021).
  39. Hijmans, R.J.; van Etten, J.; Sumner, M.; Cheng, J.; Bevan, A.; Bivand, R.; Busetto, L.; Canty, M.; Forrest, D.; Golicher, D.; et al. Package ‘Raster’. R Topics Documented. 2019. Available online: https://cran.r-project.org/web/packages/raster/raster.pdf (accessed on 7 September 2021).
  40. Agrafiotis, P.; Skarlatos, D.; Georgopoulos, A.; Karantzalos, K. Shallowwater bathymetry mapping from UAV imagery based on machine learning. Int. Arch. Photogramm. Remote Sens. Spat. Inf. Sci. 2019, 42, 9–16. [Google Scholar] [CrossRef] [Green Version]
  41. Ventura, D.; Bonifazi, A.; Gravina, M.F.; Belluscio, A.; Ardizzone, G. Mapping and classification of ecologically sensitive marine habitats using unmanned aerial vehicle (UAV) imagery and Object-Based Image Analysis (OBIA). Remote Sens. 2018, 10, 1331. [Google Scholar] [CrossRef] [Green Version]
  42. Wicaksono, P.; Lazuardi, W. Assessment of PlanetScope images for benthic habitat and seagrass species mapping in a complex optically shallow water environment. Int. J. Remote Sens. 2018, 39, 5739–5765. [Google Scholar] [CrossRef]
  43. Li, J.; Knapp, D.E.; Fabina, N.S.; Kennedy, E.V.; Larsen, K.; Lyons, M.B.; Murray, N.J.; Phinn, S.R.; Roelfsema, C.M.; Asner, G.P. A global coral reef probability map generated using convolutional neural networks. Coral Reefs 2020, 39, 1805–1815. [Google Scholar] [CrossRef]
  44. Holben, B.N. Characteristics of maximum-value composite images from temporal AVHRR data. Int. J. Remote Sens. 1986, 7, 1417–1434. [Google Scholar] [CrossRef]
  45. Shelestov, A.; Lavreniuk, M.; Kussul, N.; Novikov, A.; Skakun, S. Exploring Google earth engine platform for big data processing: Classification of multi-temporal satellite imagery for crop mapping. Front. Earth Sci. 2017, 5, 1–10. [Google Scholar] [CrossRef] [Green Version]
  46. Unsworth, R.K.F.; McKenzie, L.J.; Collier, C.J.; Cullen-Unsworth, L.C.; Duarte, C.M.; Eklöf, J.S.; Jarvis, J.C.; Jones, B.L.; Nordlund, N.L. Global Challenges for Seagrass Conservation. Ambio 2019, 48, 801–815. [Google Scholar] [CrossRef] [PubMed] [Green Version]
  47. Cabello-Pasini, A.; Muñiz-Salazar, R.; Ward, D.H. Annual variations of biomass and photosynthesis in Zostera marina at its southern end of distribution in the North Pacific. Aquat. Bot. 2003, 76, 31–47. [Google Scholar] [CrossRef]
  48. Solana-Arellano, M.E.; Echavarria-Heras, H.A.; Ibarra-Obando, S.E. Leaf-size Dynamics for Zostera marina L. in San Quintin Bay, México: A Theoretical Study. Estuar. Coast. Shelf Sci. 1997, 44, 351–359. [Google Scholar] [CrossRef]
  49. Aveytua-Alcazar, L.; Melaku Canu, D.; Camacho-Ibar, V.F.; Solidoro, C. Changes in upwelling regimes in a Mediterranean-type lagoon: A model application. Ecol. Model. 2020, 418, 108908. [Google Scholar] [CrossRef]
  50. Ibarra-Obando, S.E.; Solana Arellano, M.E.; Poumian-Tapia, M. El papel de Zostera marina en el ciclo del carbono en Bahía San Quintín, Baja California. In Carbono en Ecosistemas Acuáticos de México; Hernández-de-la-Torre, B., Gaxiola-Castro, G., Eds.; CICESE: Ensenada, Mexico, 2007; pp. 201–214. [Google Scholar]
  51. Eugenio, F.; Marcello, J.; Martin, J.; Rodríguez-Esparragón, D. Benthic habitat mapping using multispectral high-resolution imagery: Evaluation of shallow water atmospheric correction techniques. Sensors 2017, 17, 2639. [Google Scholar] [CrossRef] [PubMed] [Green Version]
  52. Ward, D.H. Use of digital multispectral videography to assess seagrass distribution in San Quintín Bay, Baja California, Mexico. Cienc. Mar. 2004, 30, 47–60. [Google Scholar] [CrossRef] [Green Version]
Figure 1. Study site Bahía San Quintín is located at the Pacific coast of Baja California, México. The focus sites Old Mill (OM), Graveyard (GR), and Oyster (OY) were surveyed seasonally. Approximate extent of seagrass meadows (dark green) and salt marshes (light green) are shown.
Remotesensing 13 03681 g001
Figure 2. Multispectral satellite imagery (PlanetScope) and SVM classification outputs for January (A,B), March (C,D) and October (E,F) in 2019, respectively. Panels (B,D,F) show Eelgrass and No eelgrass classes only, excluding the area classified as salt marsh or upland.
Remotesensing 13 03681 g002
Figure 3. Area (ha) of focus sites classified as Eelgrass or No Eelgrass, for January, March, July, and October 2019 UAV surveys.
Remotesensing 13 03681 g003
Figure 4. Area (ha) of the bay with Eelgrass and No Eelgrass cover, as predicted from SVM classifications of satellite imagery. Error bars incorporate satellite and UAV classification error.
Remotesensing 13 03681 g004
Figure 5. Eelgrass probability map, displaying the fraction of seasonal SVM classifications that classify a given pixel as Eelgrass, based on satellite imagery from winter, spring, and fall.
Remotesensing 13 03681 g005
Figure 6. UAV imagery from March (‘Spring’), July (‘Summer’), and October (‘Fall’) 2019 at the focus site OM. At this site at the head of the bay, eelgrass cover increased over the course of the year.
Remotesensing 13 03681 g006
Table 1. Multispectral satellite imagery metadata. All images acquired by PlanetScope (4 bands, 3 m resolution) and downloaded at level ‘Analytic 3B’ [32].
WinterSpringFall
ID20190104_17
3541_0f2a
20190314_17
2554_0f33
20191005_18
0405_0f35
Date4 January 201914 March 20195 October 2019
Time (UTM)17:35:4117:25:5418:04:05
Tidal stage (m MLLW)1.500.190.96
Sun elevation28.14248.8
Sun azimuth145126145
Table 2. Confusion matrix for the assessment of UAV-derived seagrass cover classification accuracy. Reference data were obtained using geolocated quadrats in the field.
Reference
PredictionEelgrassNo Eelgrass
Eelgrass304PPV: 0.88
No eelgrass221NPV: 0.91
Sensitivity: 0.94Specificity: 0.84Accuracy: 0.90
Table 3. Accuracy metrics for SVM classifications of multispectral satellite imagery. Eelgrass cover classification accuracy was tested for a binary classifier, using UAV-derived reference imagery.
Accuracy MetricsWinterSpringFall
Accuracy0.750.810.81
Sensitivity0.680.750.82
Specificity0.910.890.80
PPV0.940.920.80
NPV0.570.700.82
Publisher’s Note: MDPI stays neutral with regard to jurisdictional claims in published maps and institutional affiliations.