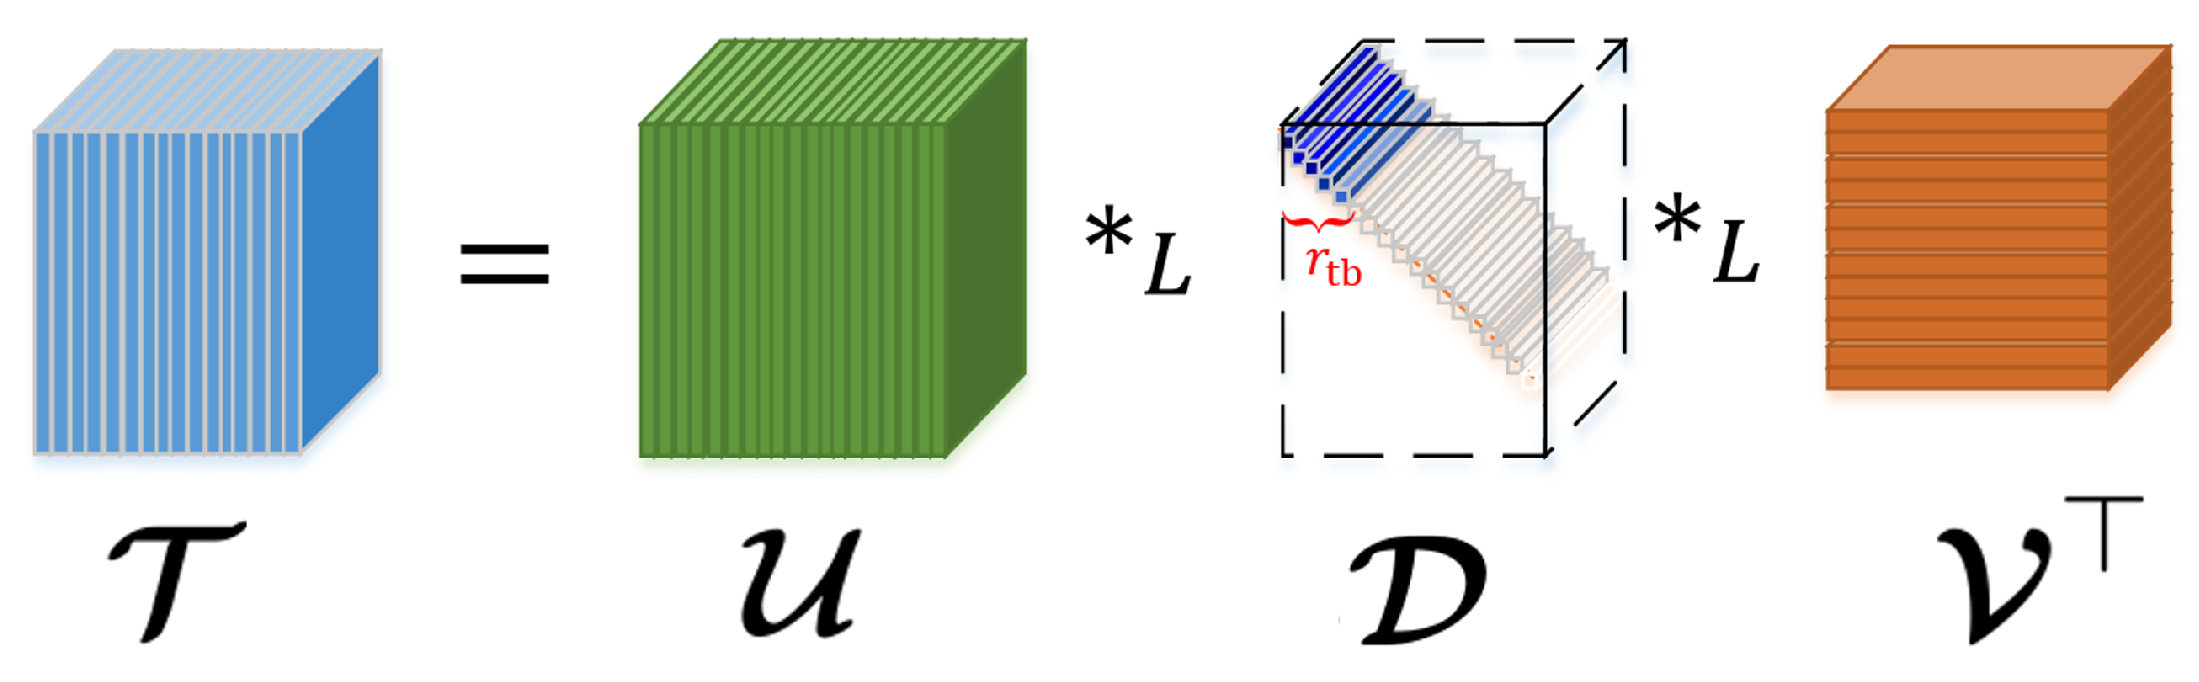
Figure 1.
An illustration of
–SVD [
18].
Figure 1.
An illustration of
–SVD [
18].
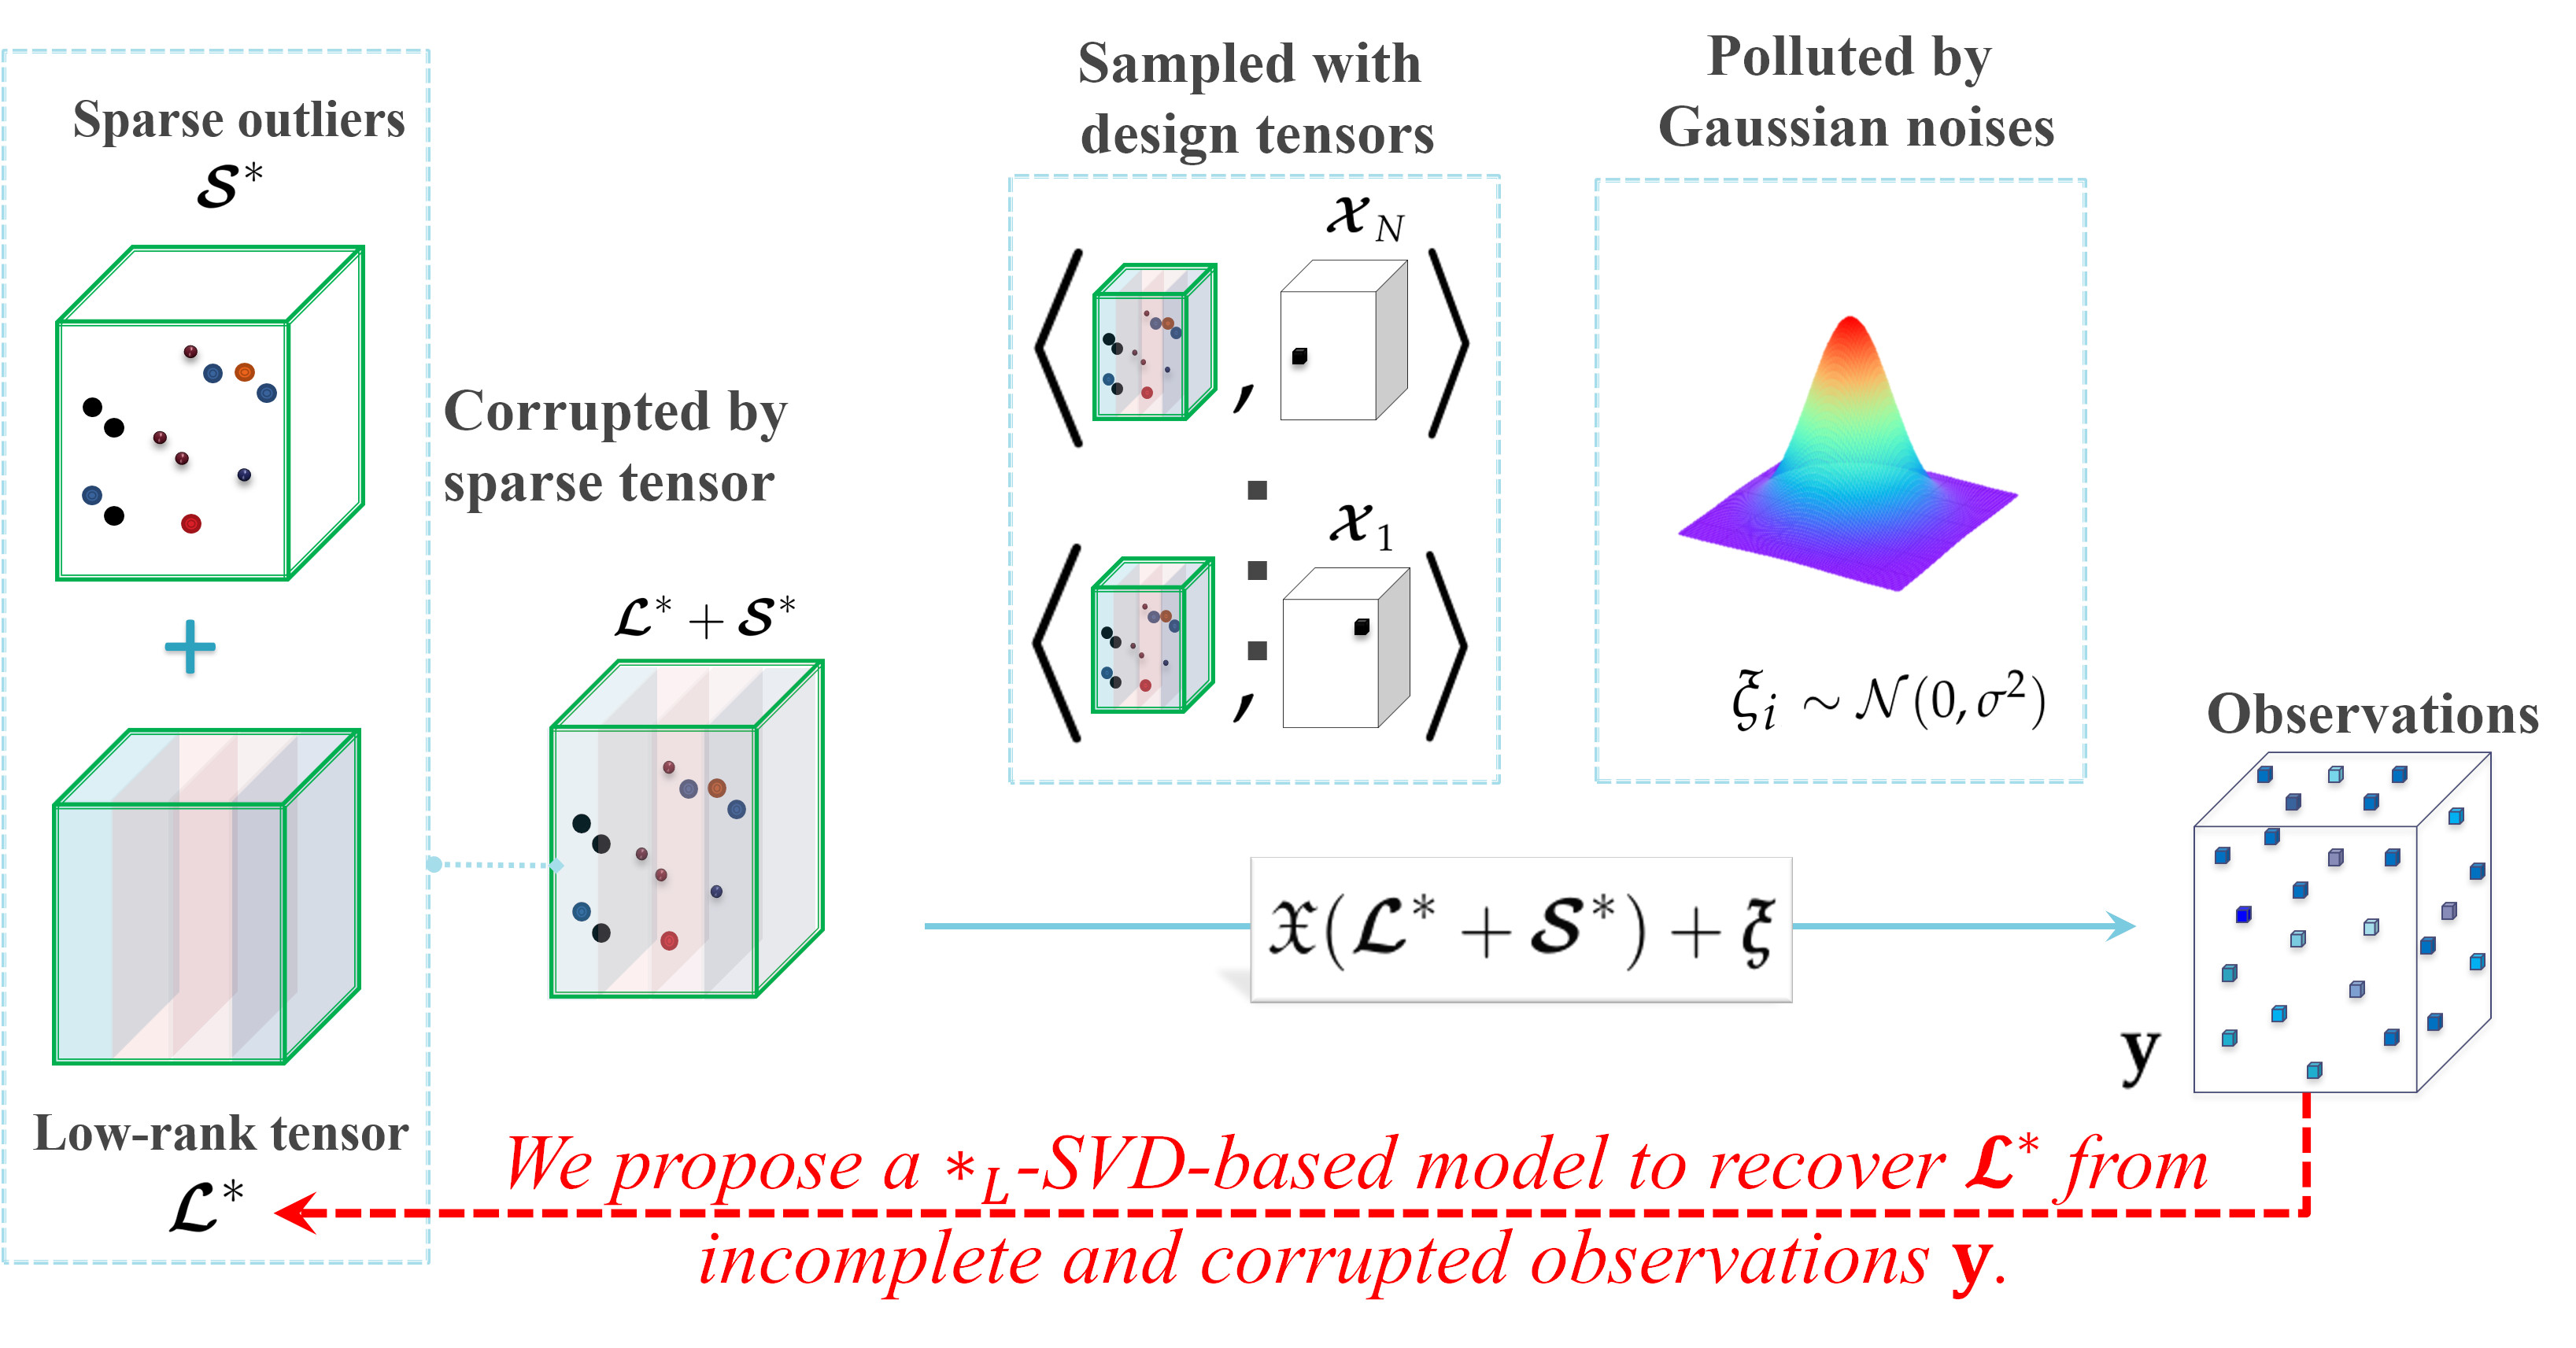
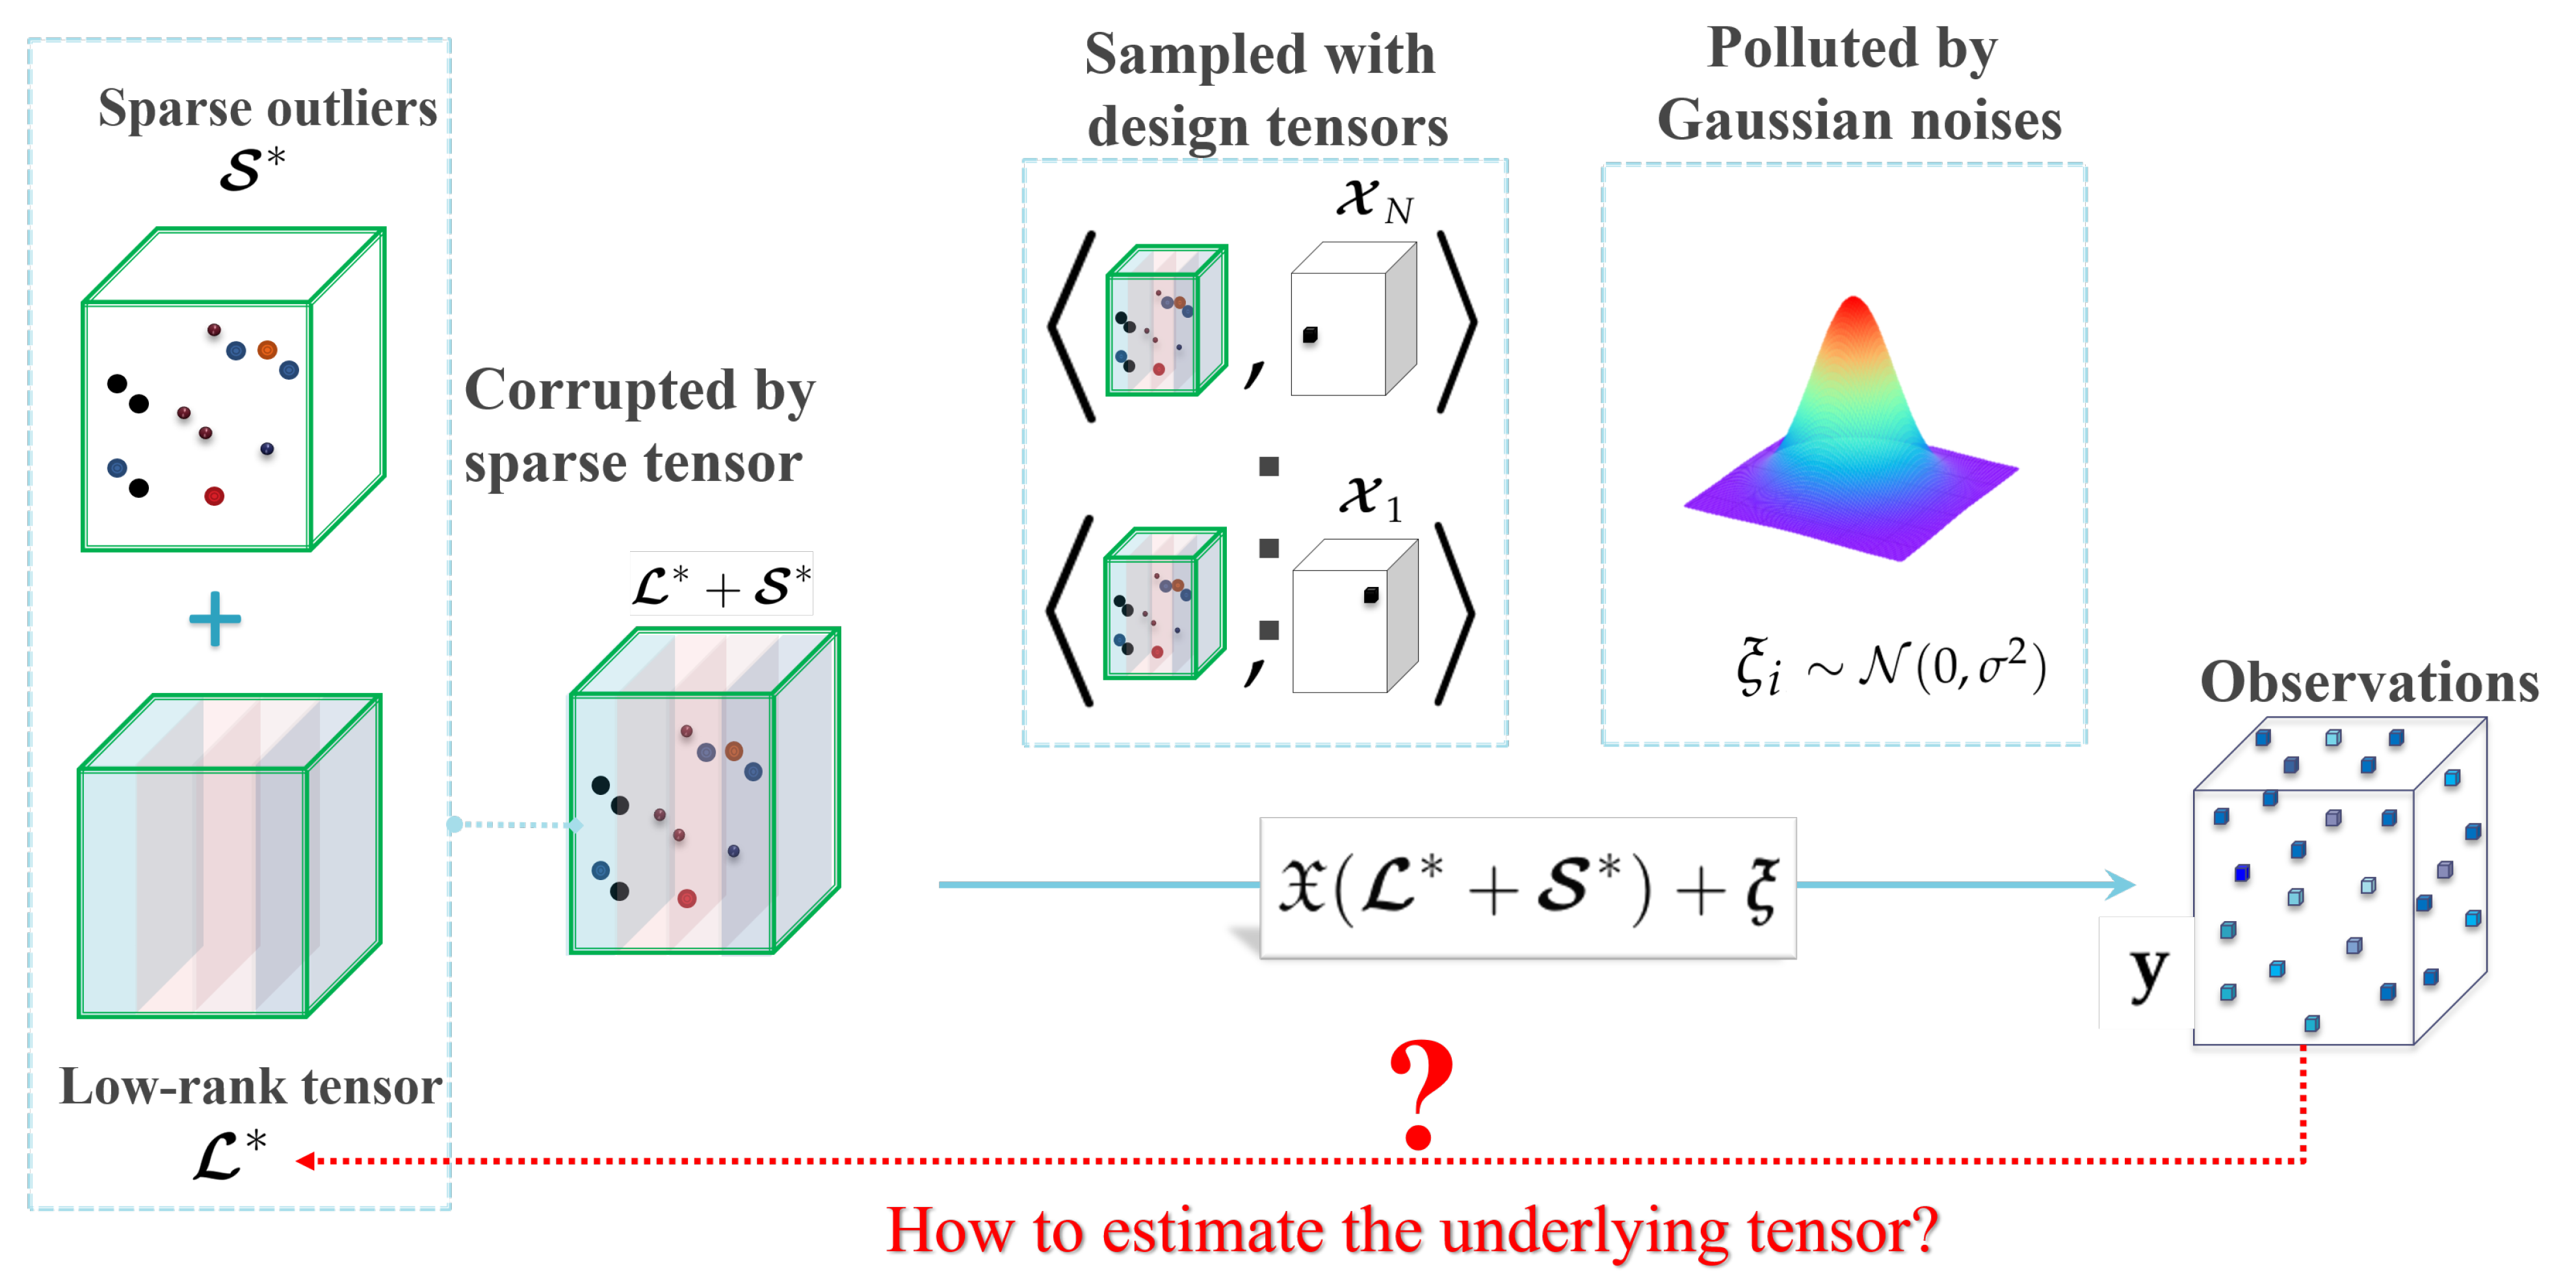
Figure 2.
An illustration of the robust tensor completion problem.
Figure 2.
An illustration of the robust tensor completion problem.
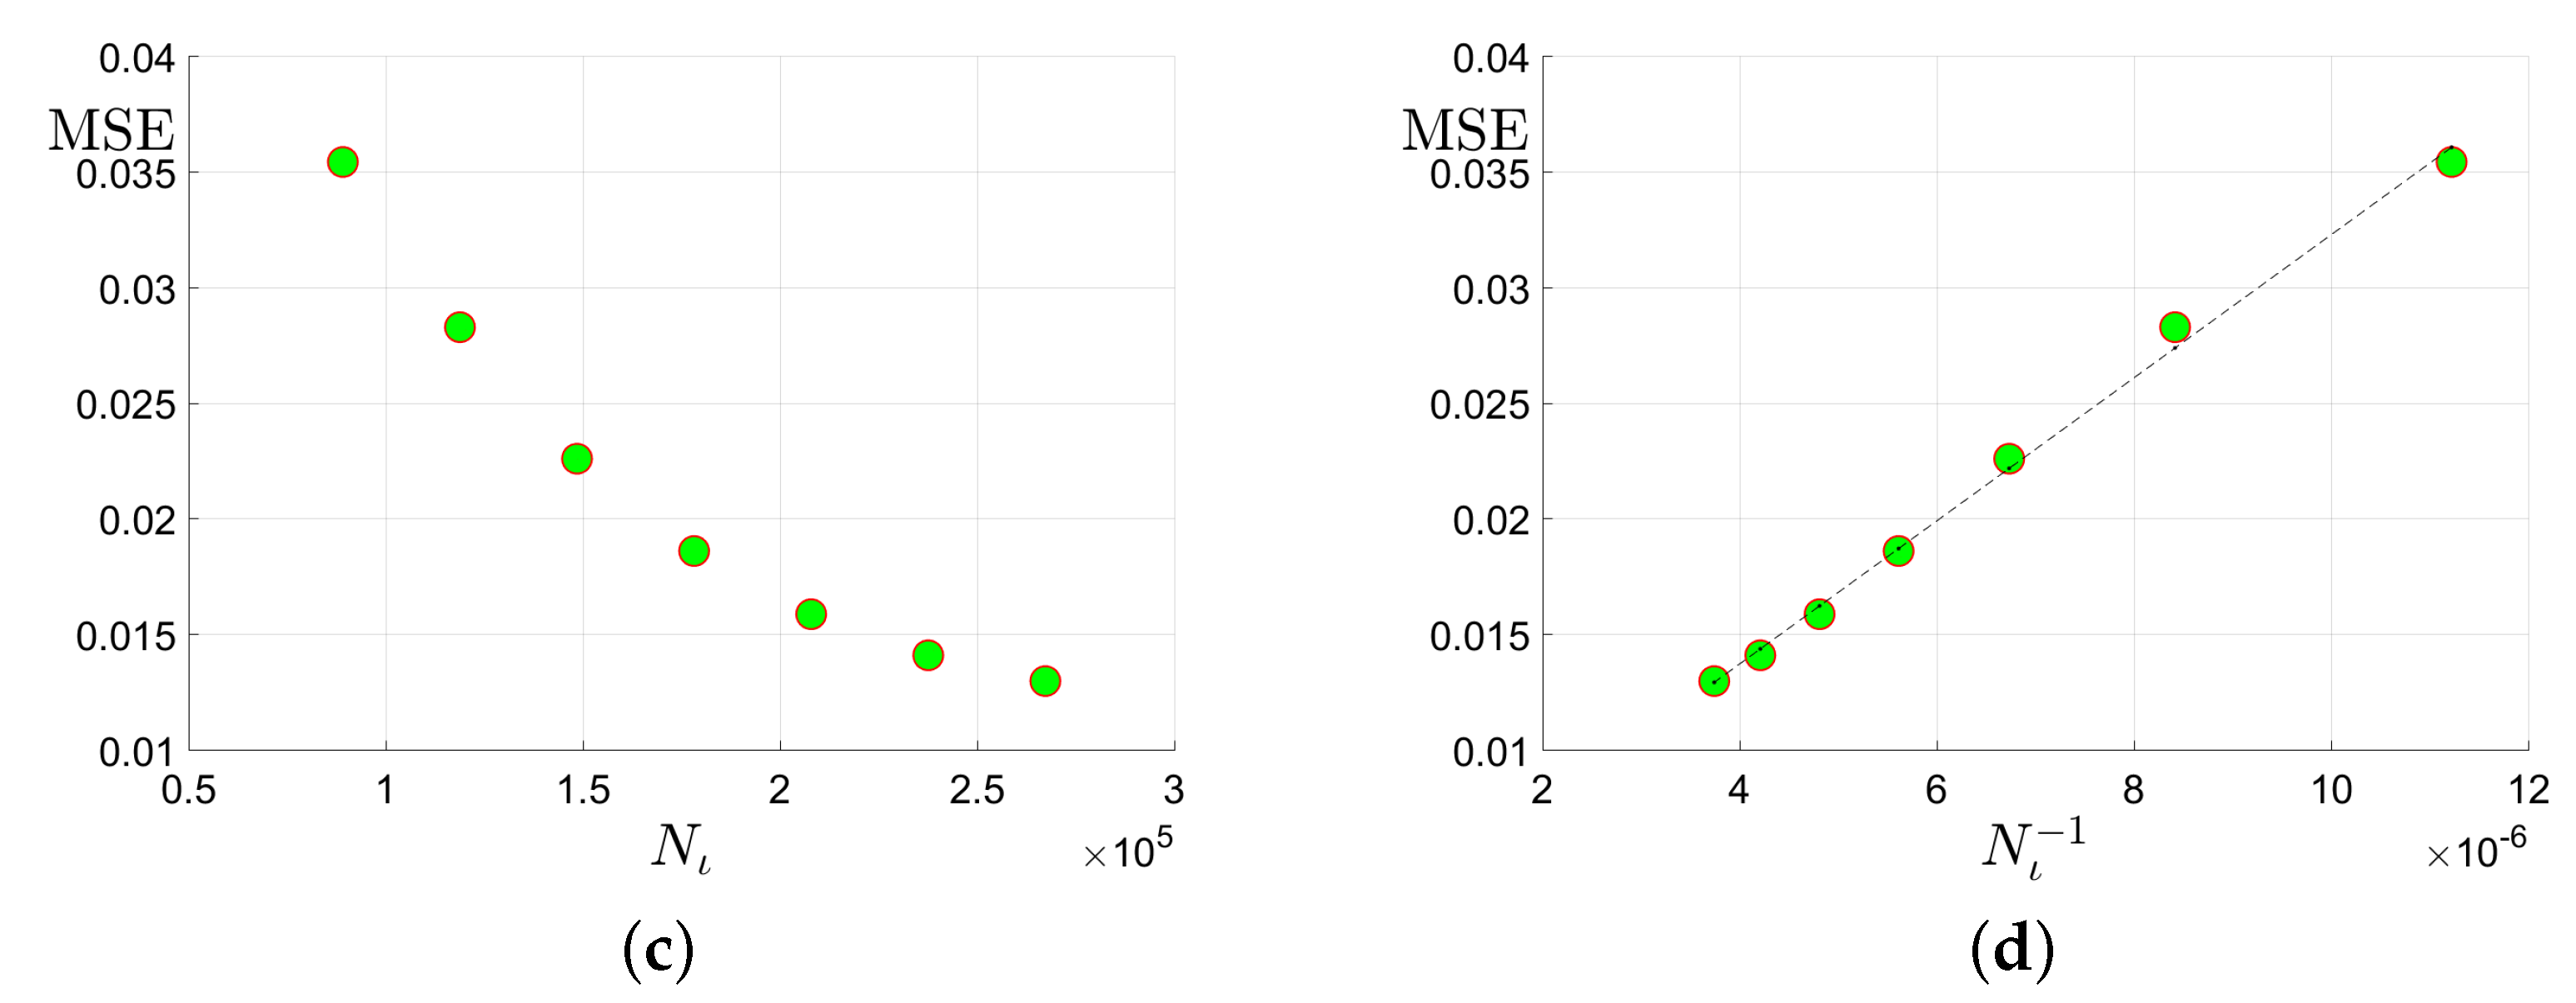
Figure 3.
Plots of the MSE versus the tubal rank of the underlying tensor, the number of corruptions , the number of uncorrupted observations and its inversion : (a) MSE vs. the tubal rank with fixed corruption level and number of uncorrupted observations ; (b) MSE vs. the number of corruptions with fixed tubal rank 9 and total observation number ; (c) MSE vs. the number of uncorrupted observation with and corruption level ; (d) MSE vs. with and .
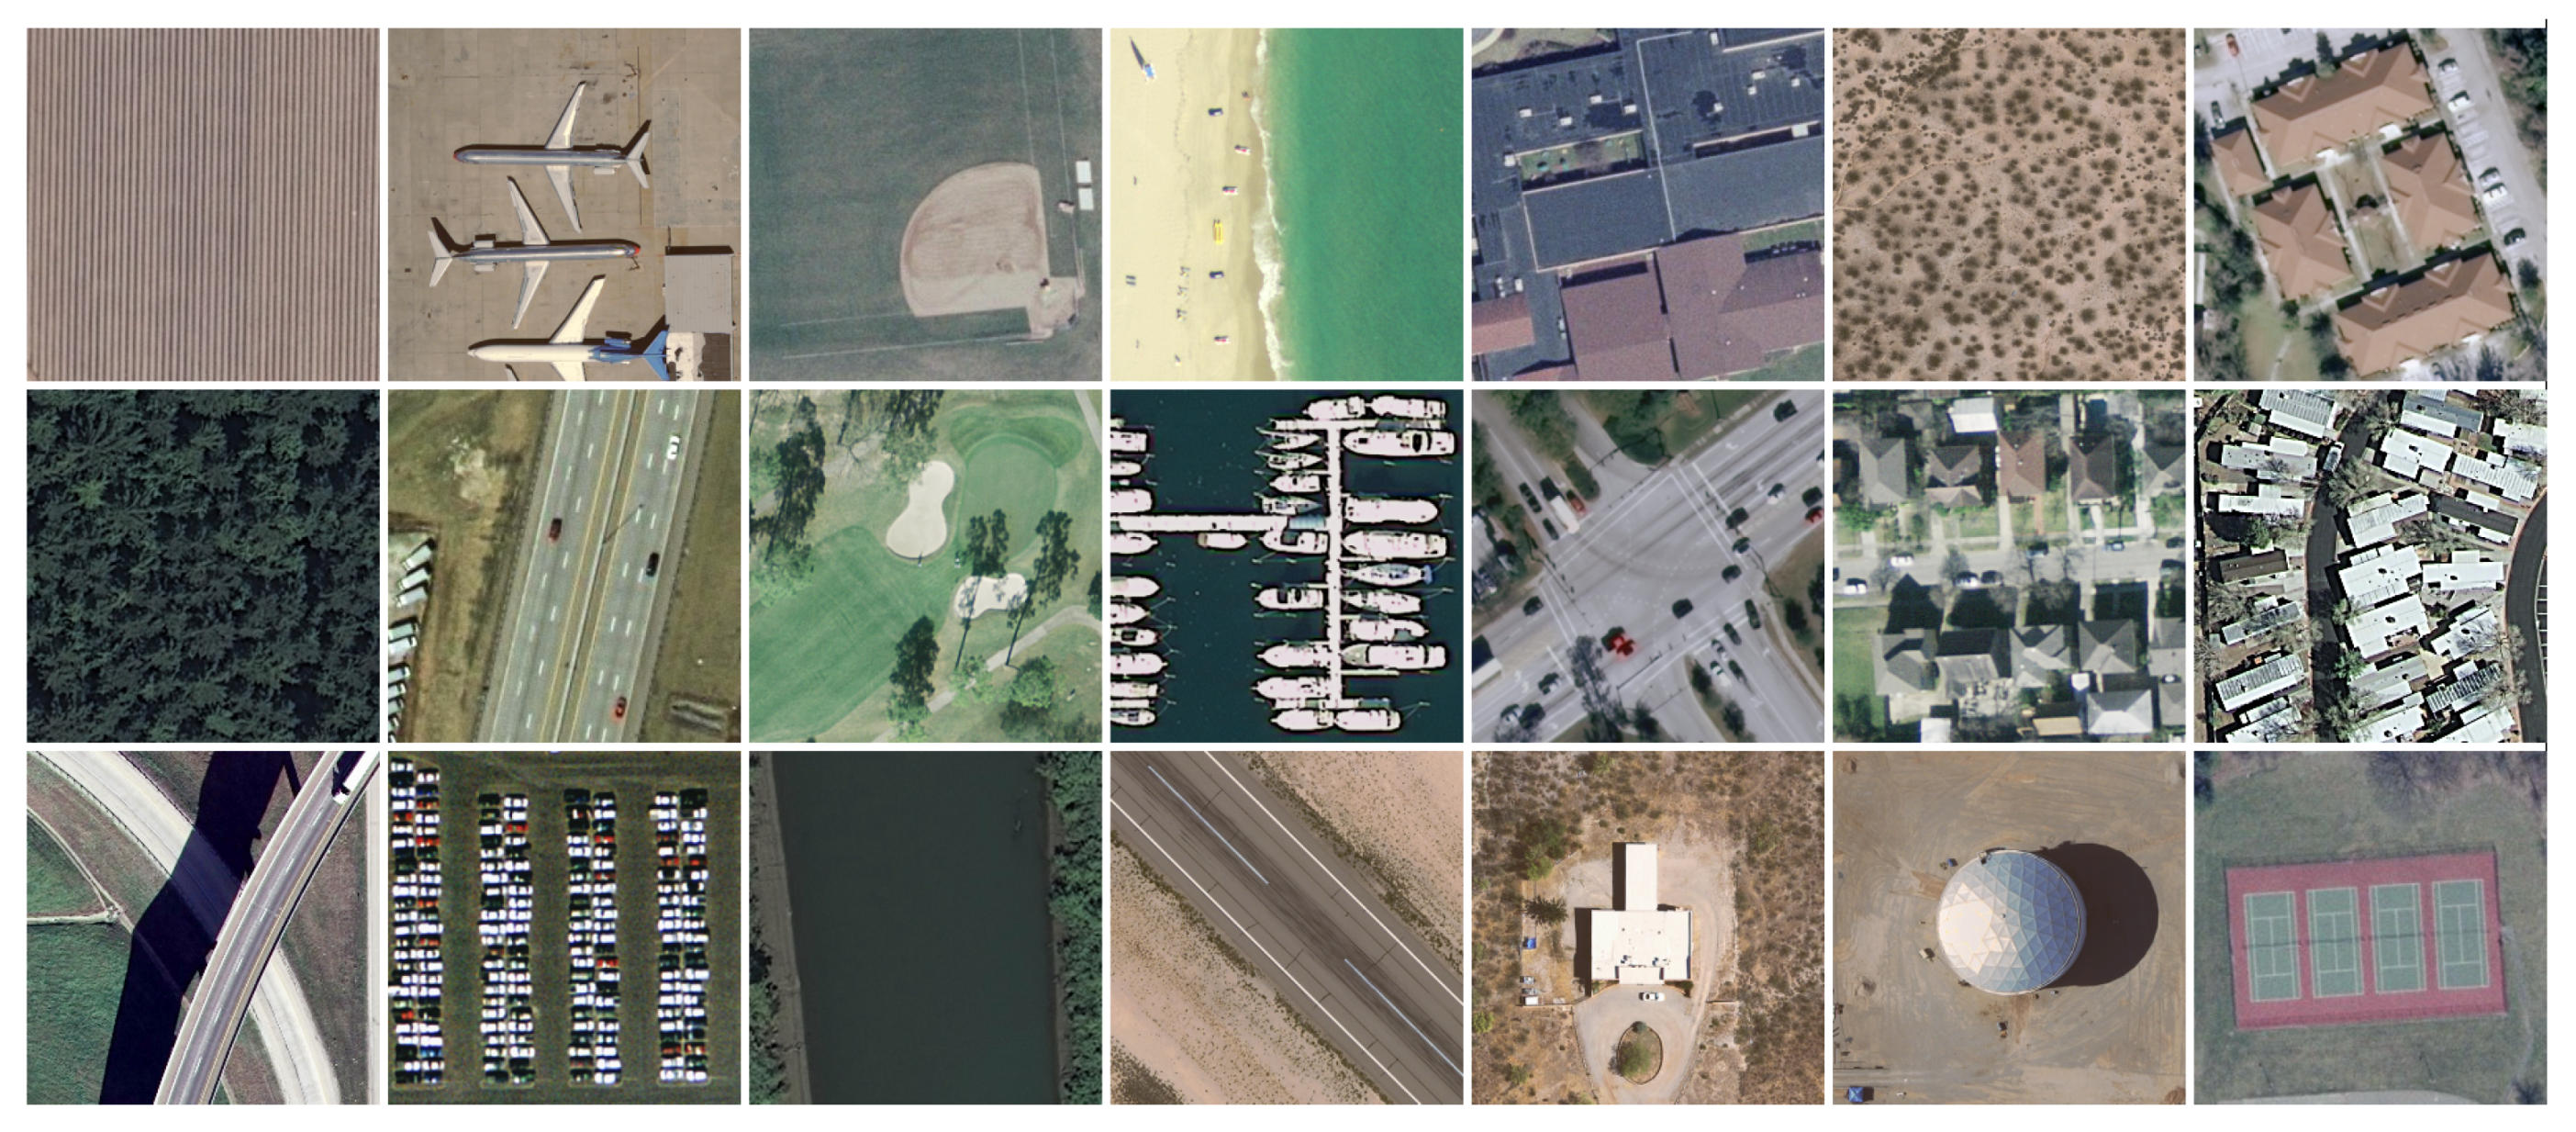
Figure 4.
The dataset consists of the 85-th frame of all the 21 classes in the UCMerced dataset.
Figure 4.
The dataset consists of the 85-th frame of all the 21 classes in the UCMerced dataset.
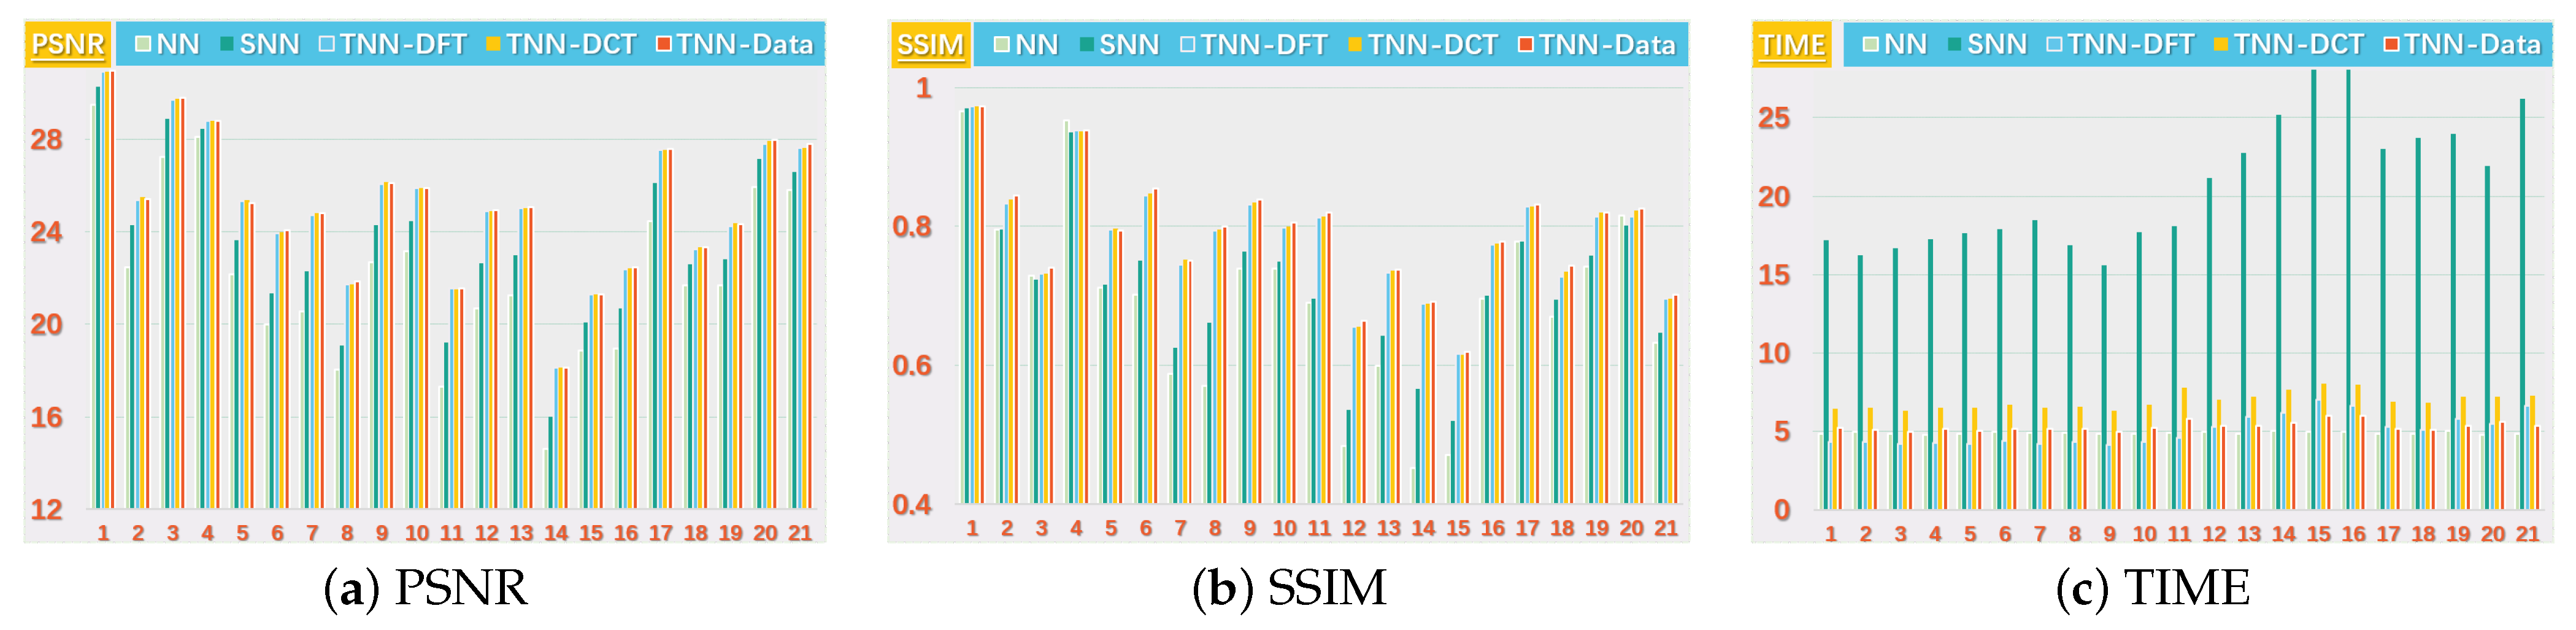
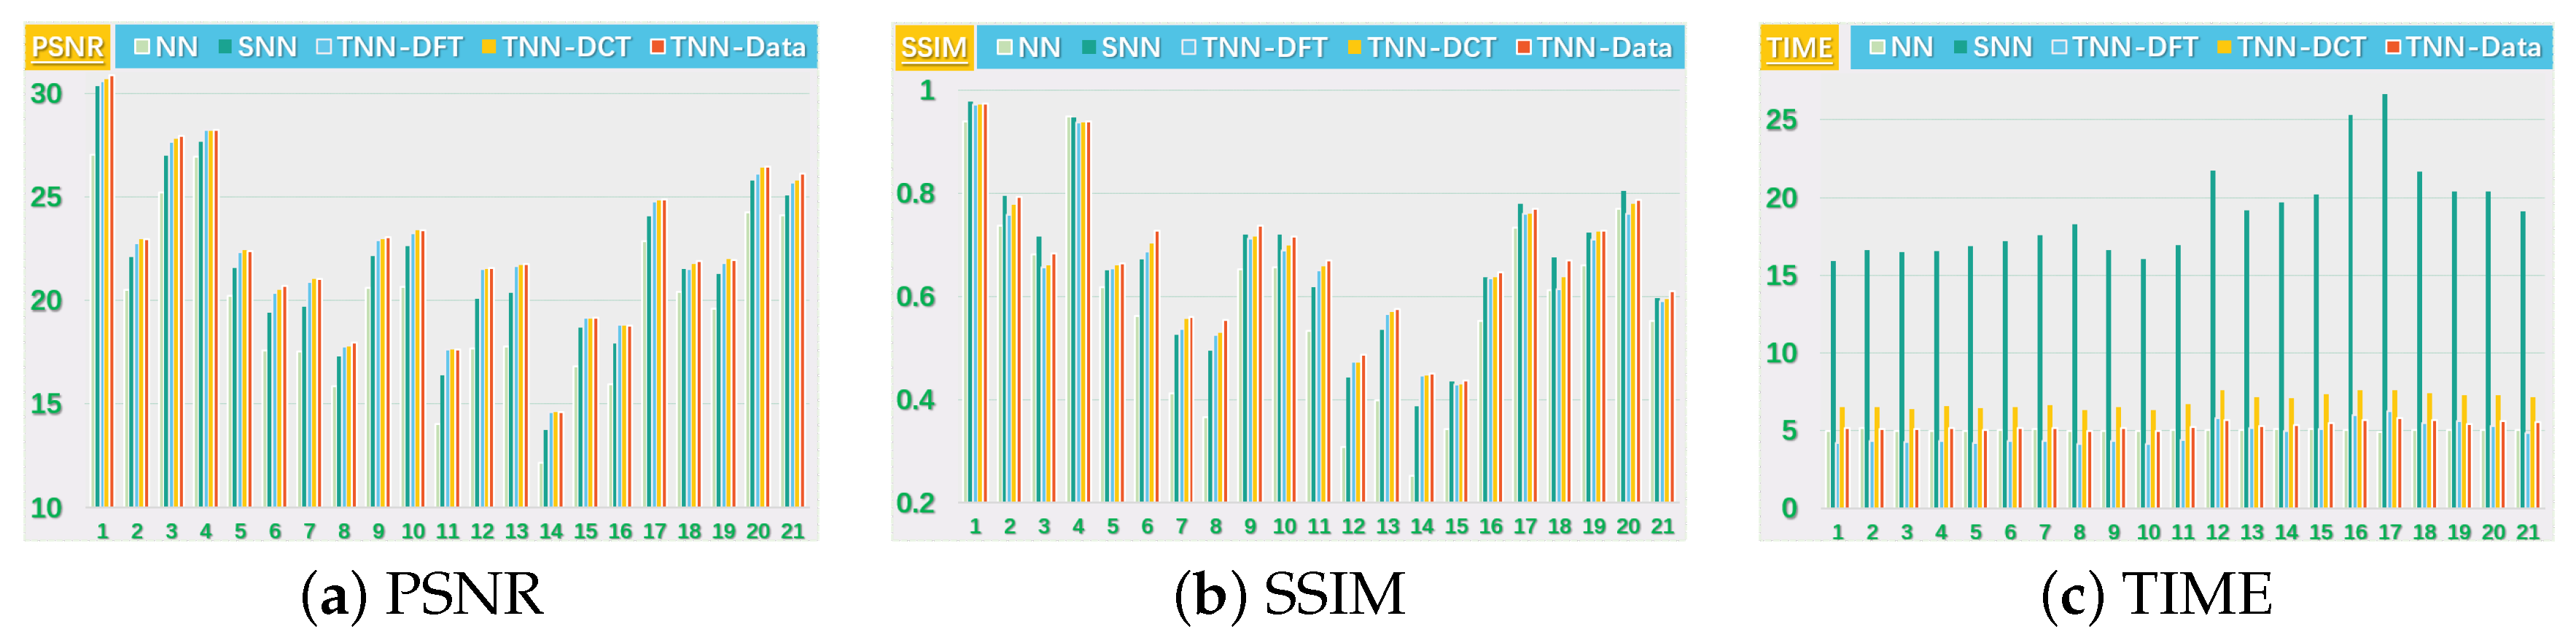
Figure 5.
The PSNR, SSIM values and running time (in seconds) on the UCMerced dataset for the setting .
Figure 5.
The PSNR, SSIM values and running time (in seconds) on the UCMerced dataset for the setting .
Figure 6.
The PSNR, SSIM values and running time (in seconds) on the UCMerced dataset for the setting .
Figure 6.
The PSNR, SSIM values and running time (in seconds) on the UCMerced dataset for the setting .
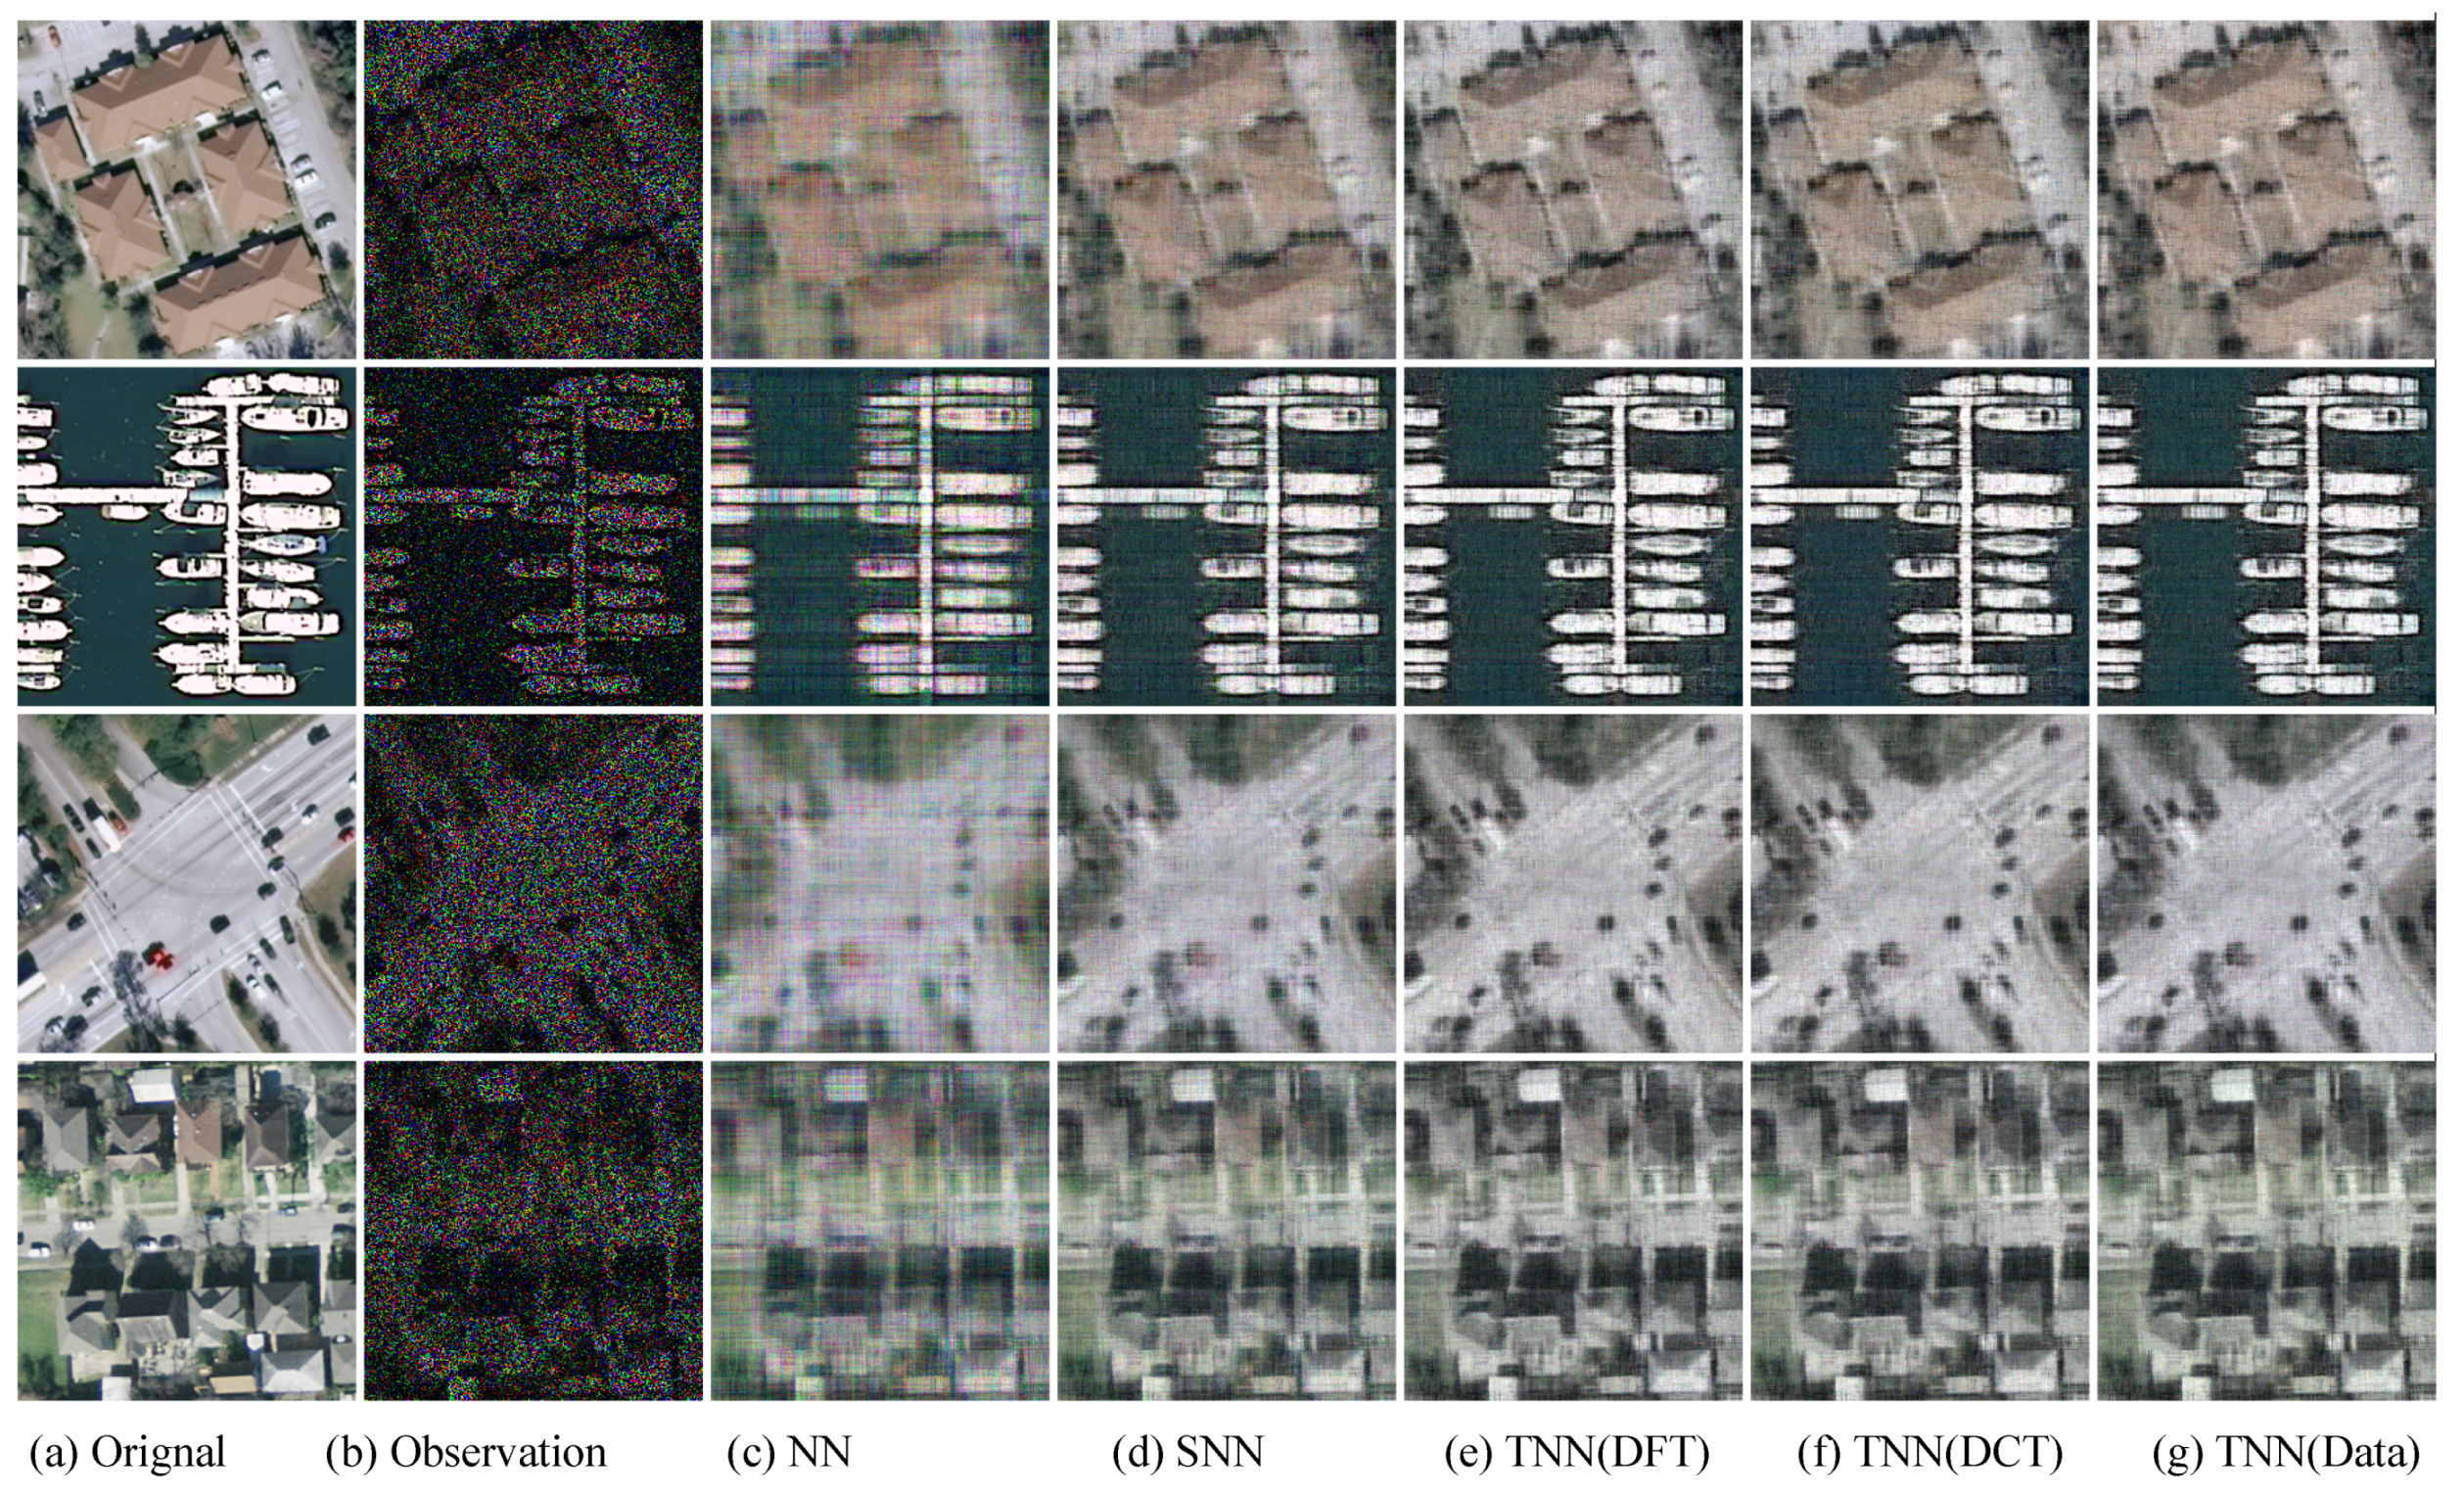
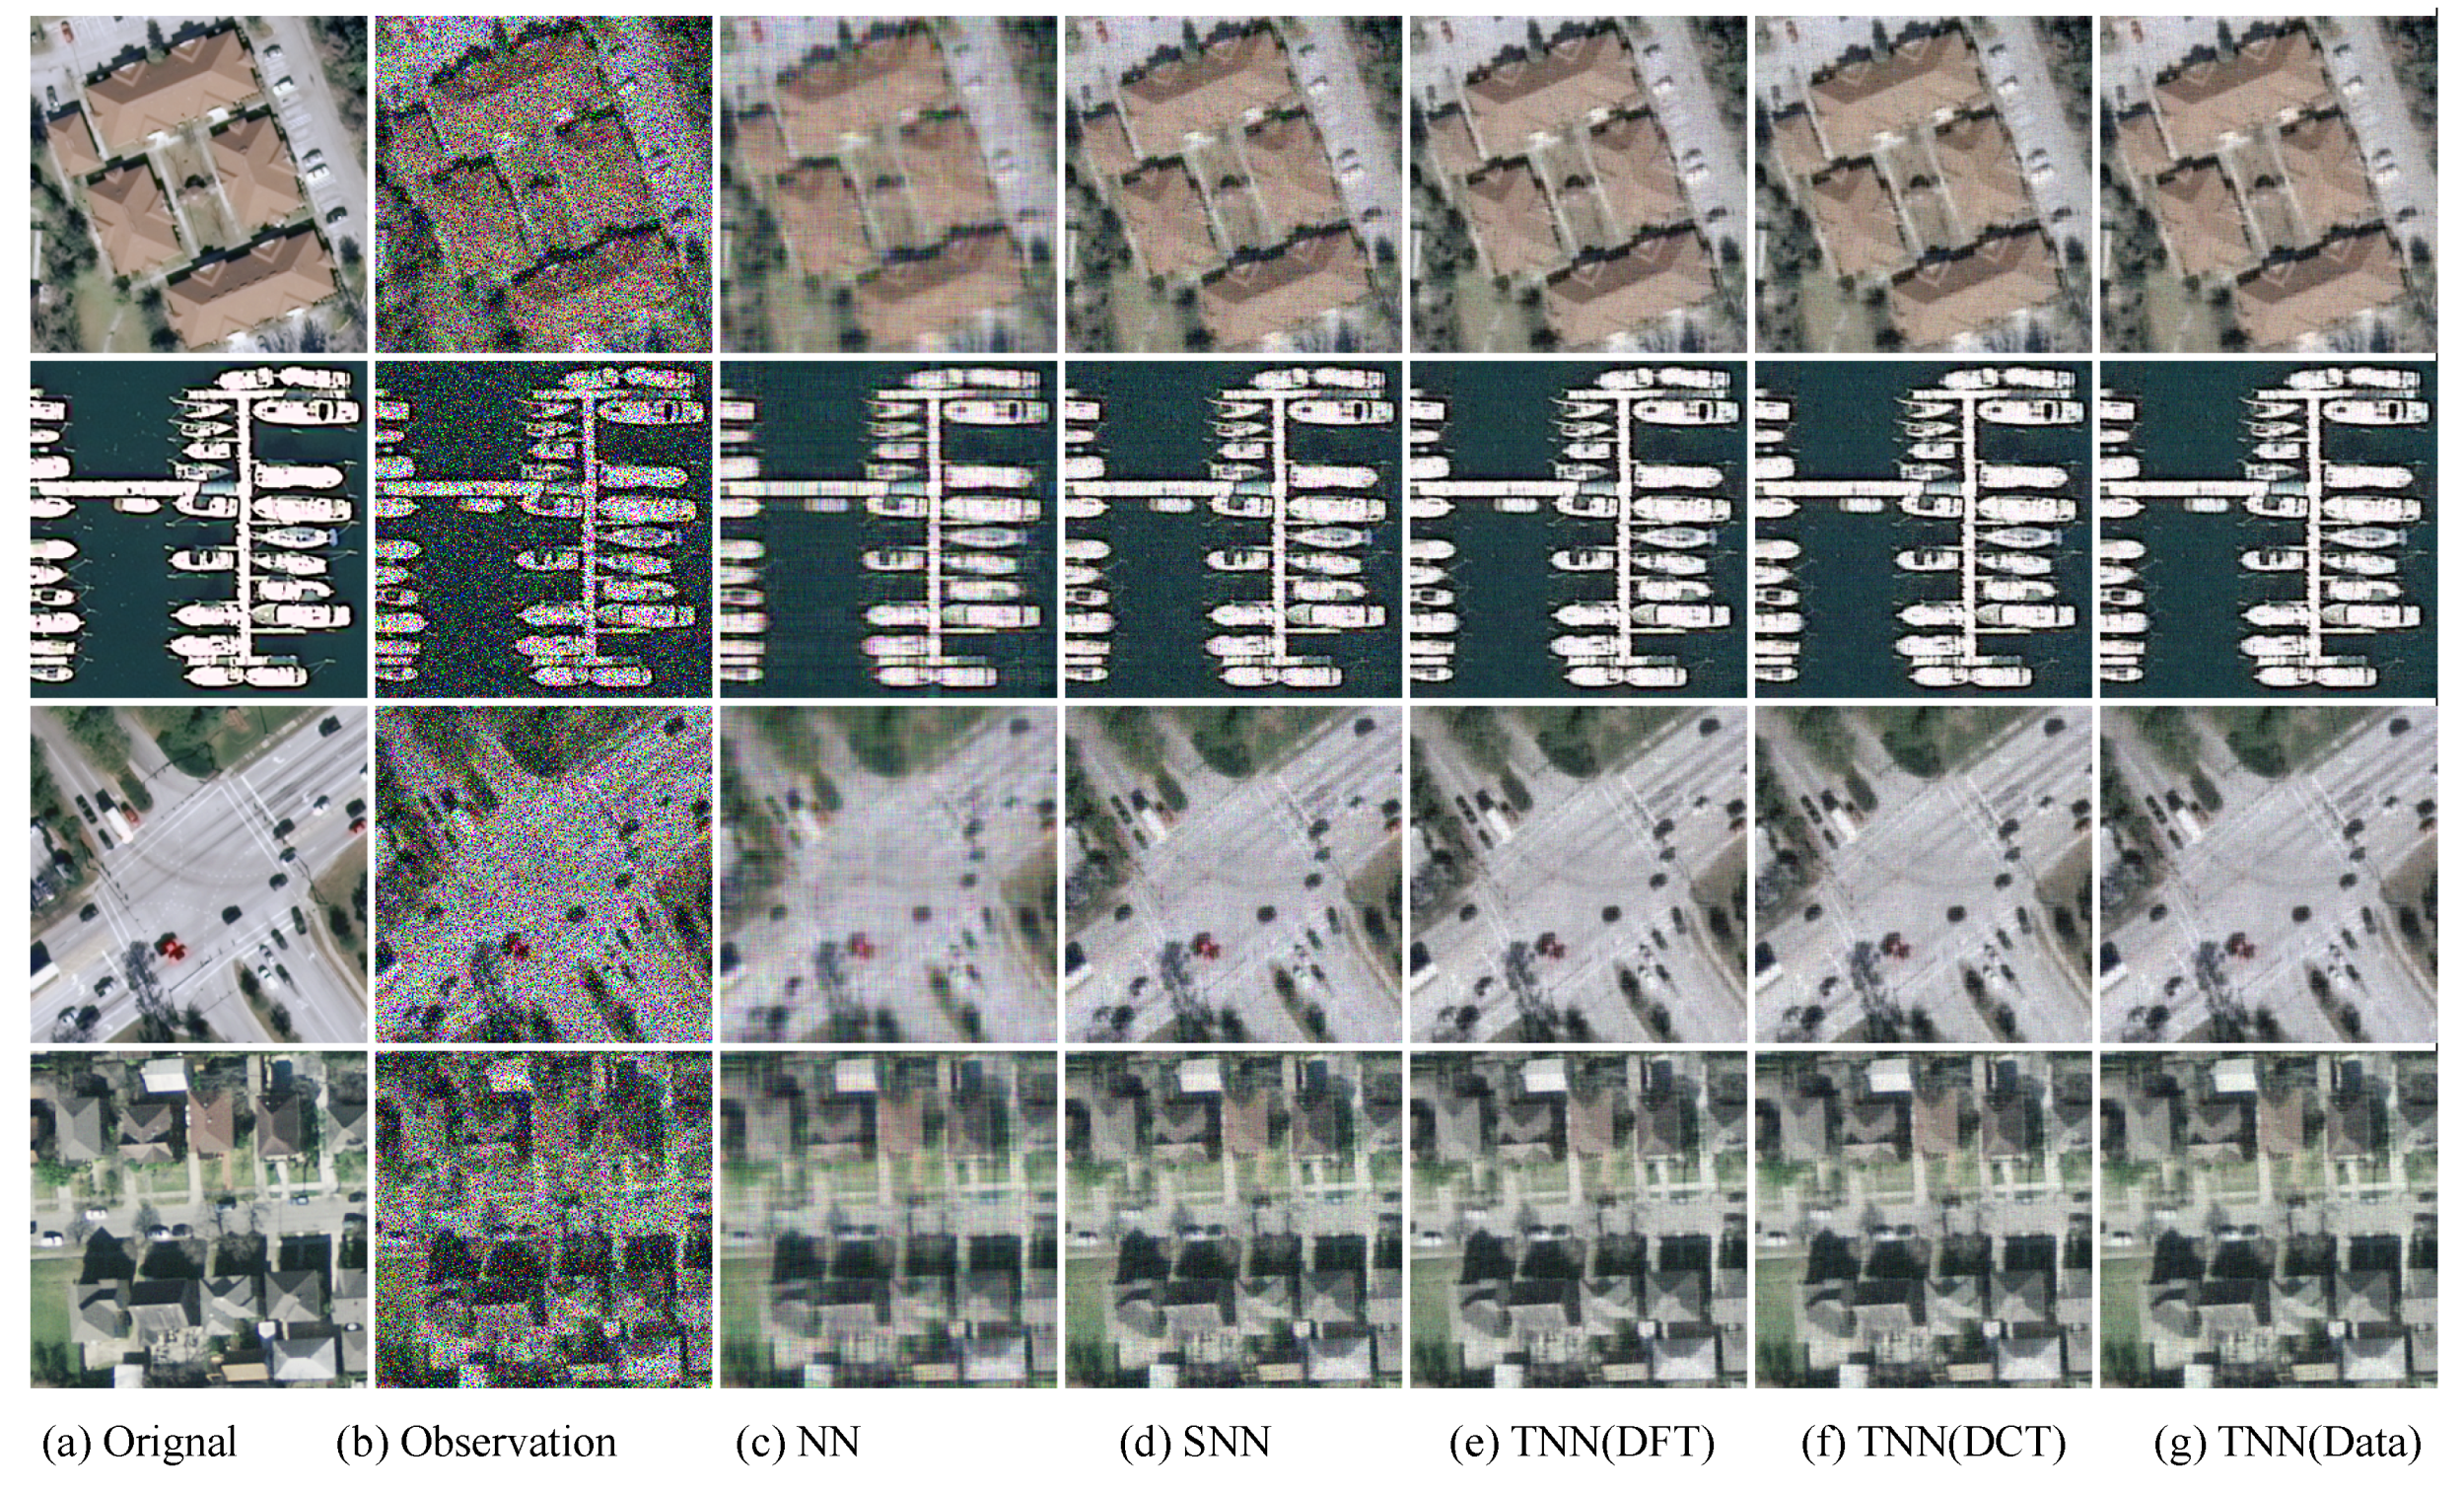
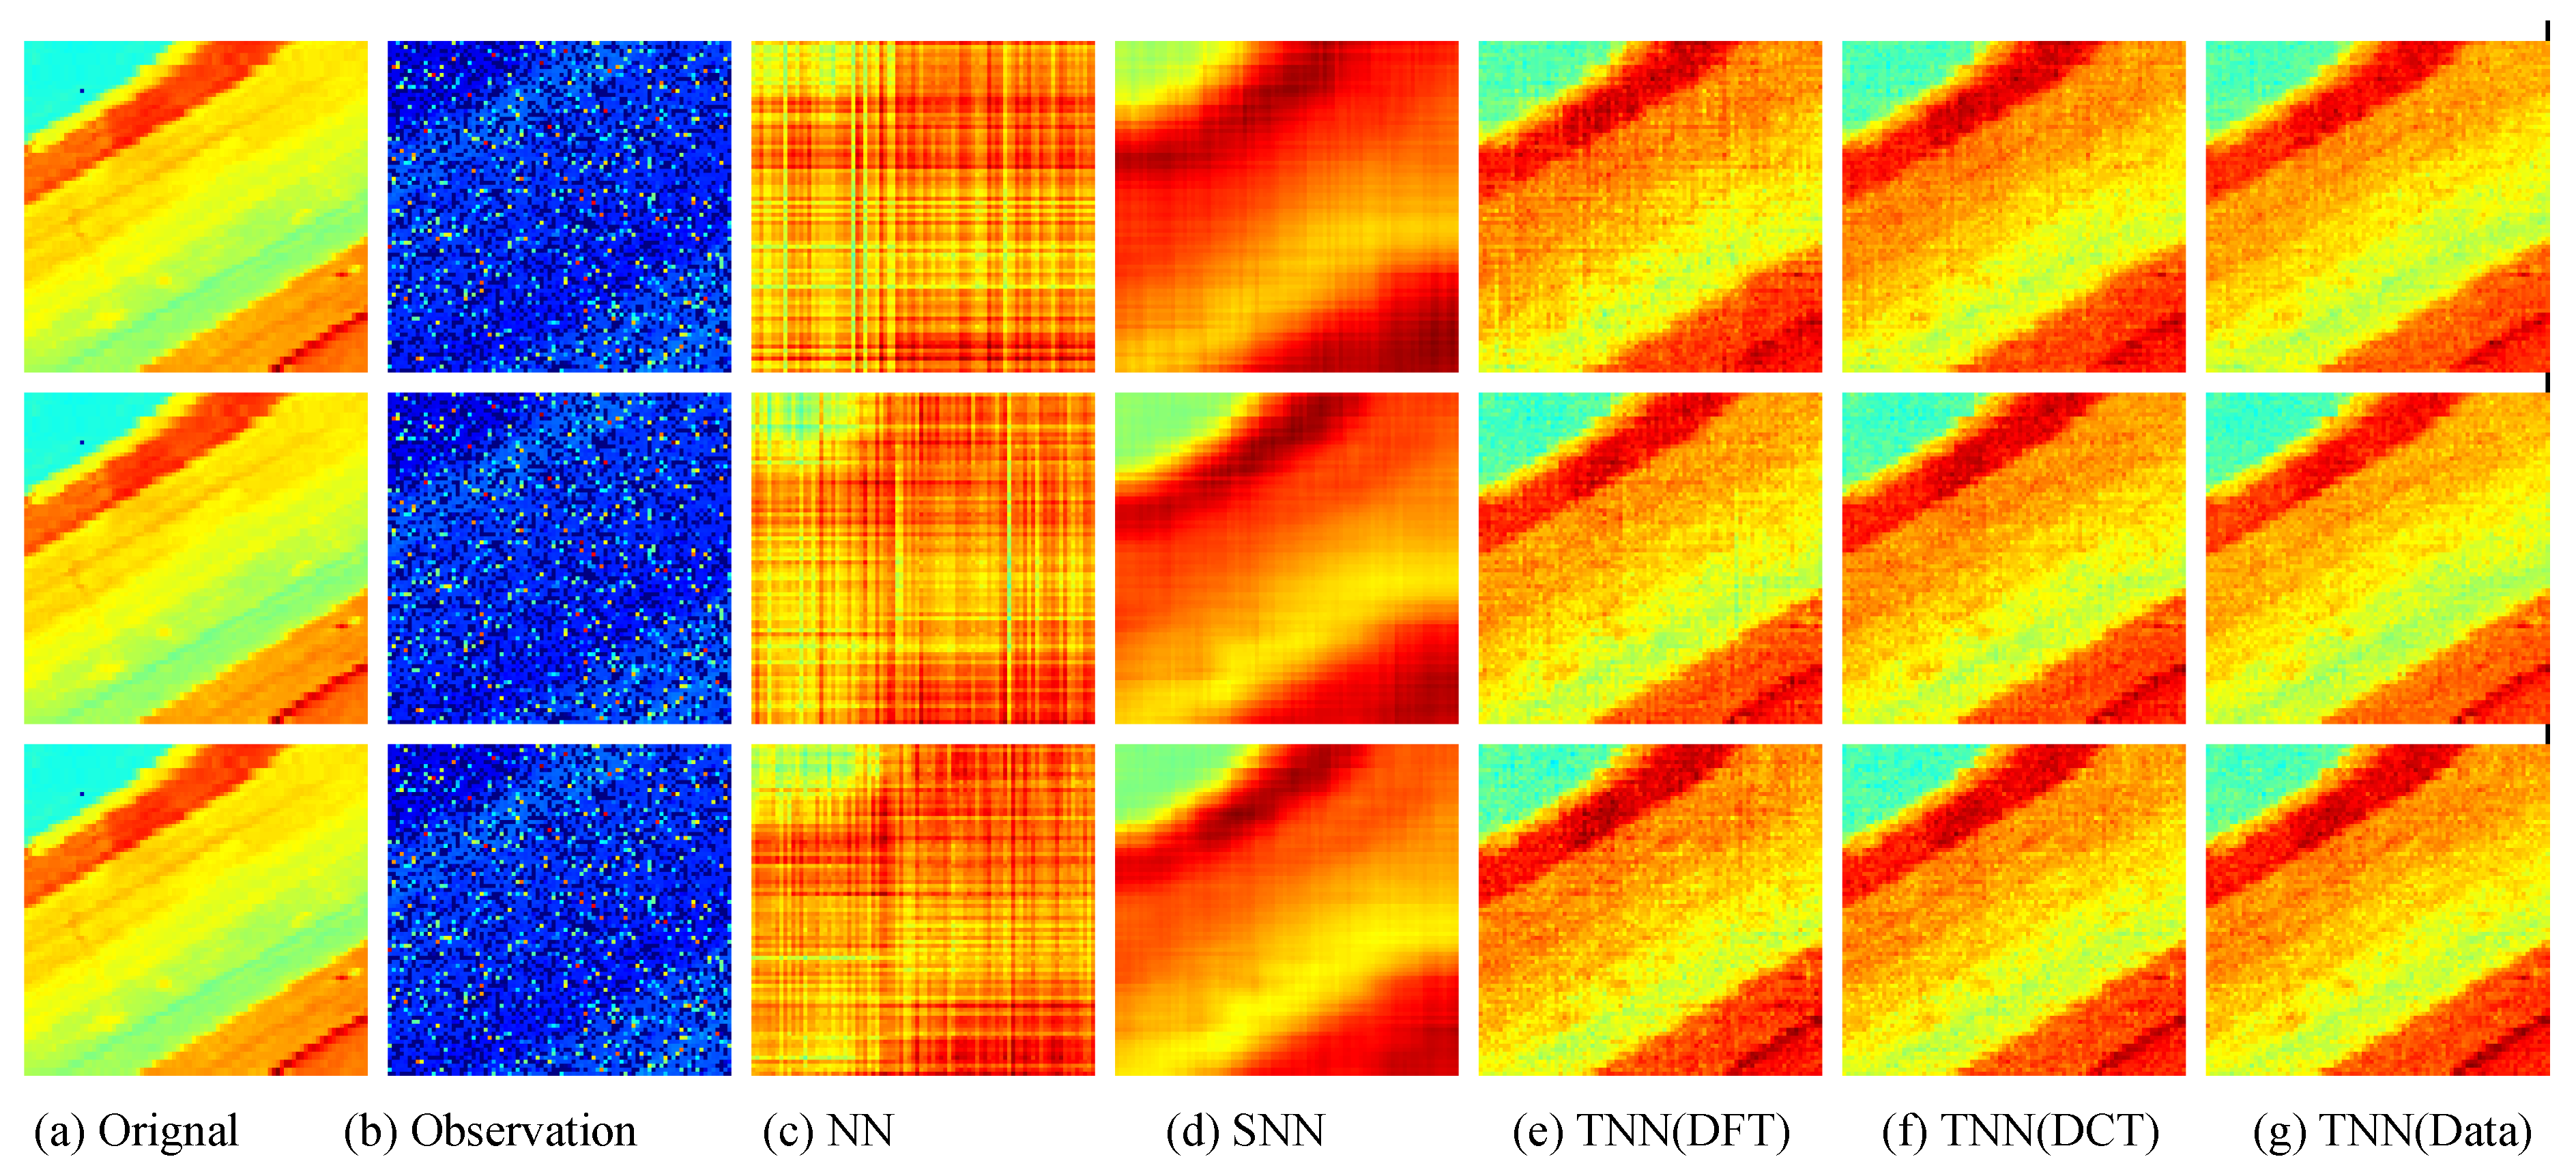
Figure 7.
The visual examples for five models on UCMerced dataset for the setting
. (
a) The original image; (
b) the observed image; (
c) image recovered by the matrix nuclear norm (NN) based Model (
32); (
d) recovered by the sum of mode-wise nuclear norms (SNN) based Model (
33); (
e) image recovered by TNN (DFT); (
f) image recovered by TNN (DCT); (
g) image recovered by TNN (Data).
Figure 8.
The visual examples for five models on UCMerced dataset for the setting
. (
a) The original image; (
b) the observed image; (
c) image recovered by the matrix nuclear norm (NN) based Model (
32); (
d) recovered by the sum of mode-wise nuclear norms (SNN) based Model (
33); (
e) image recovered by TNN (DFT); (
f) image recovered by TNN (DCT); (
g) image recovered by TNN (Data).
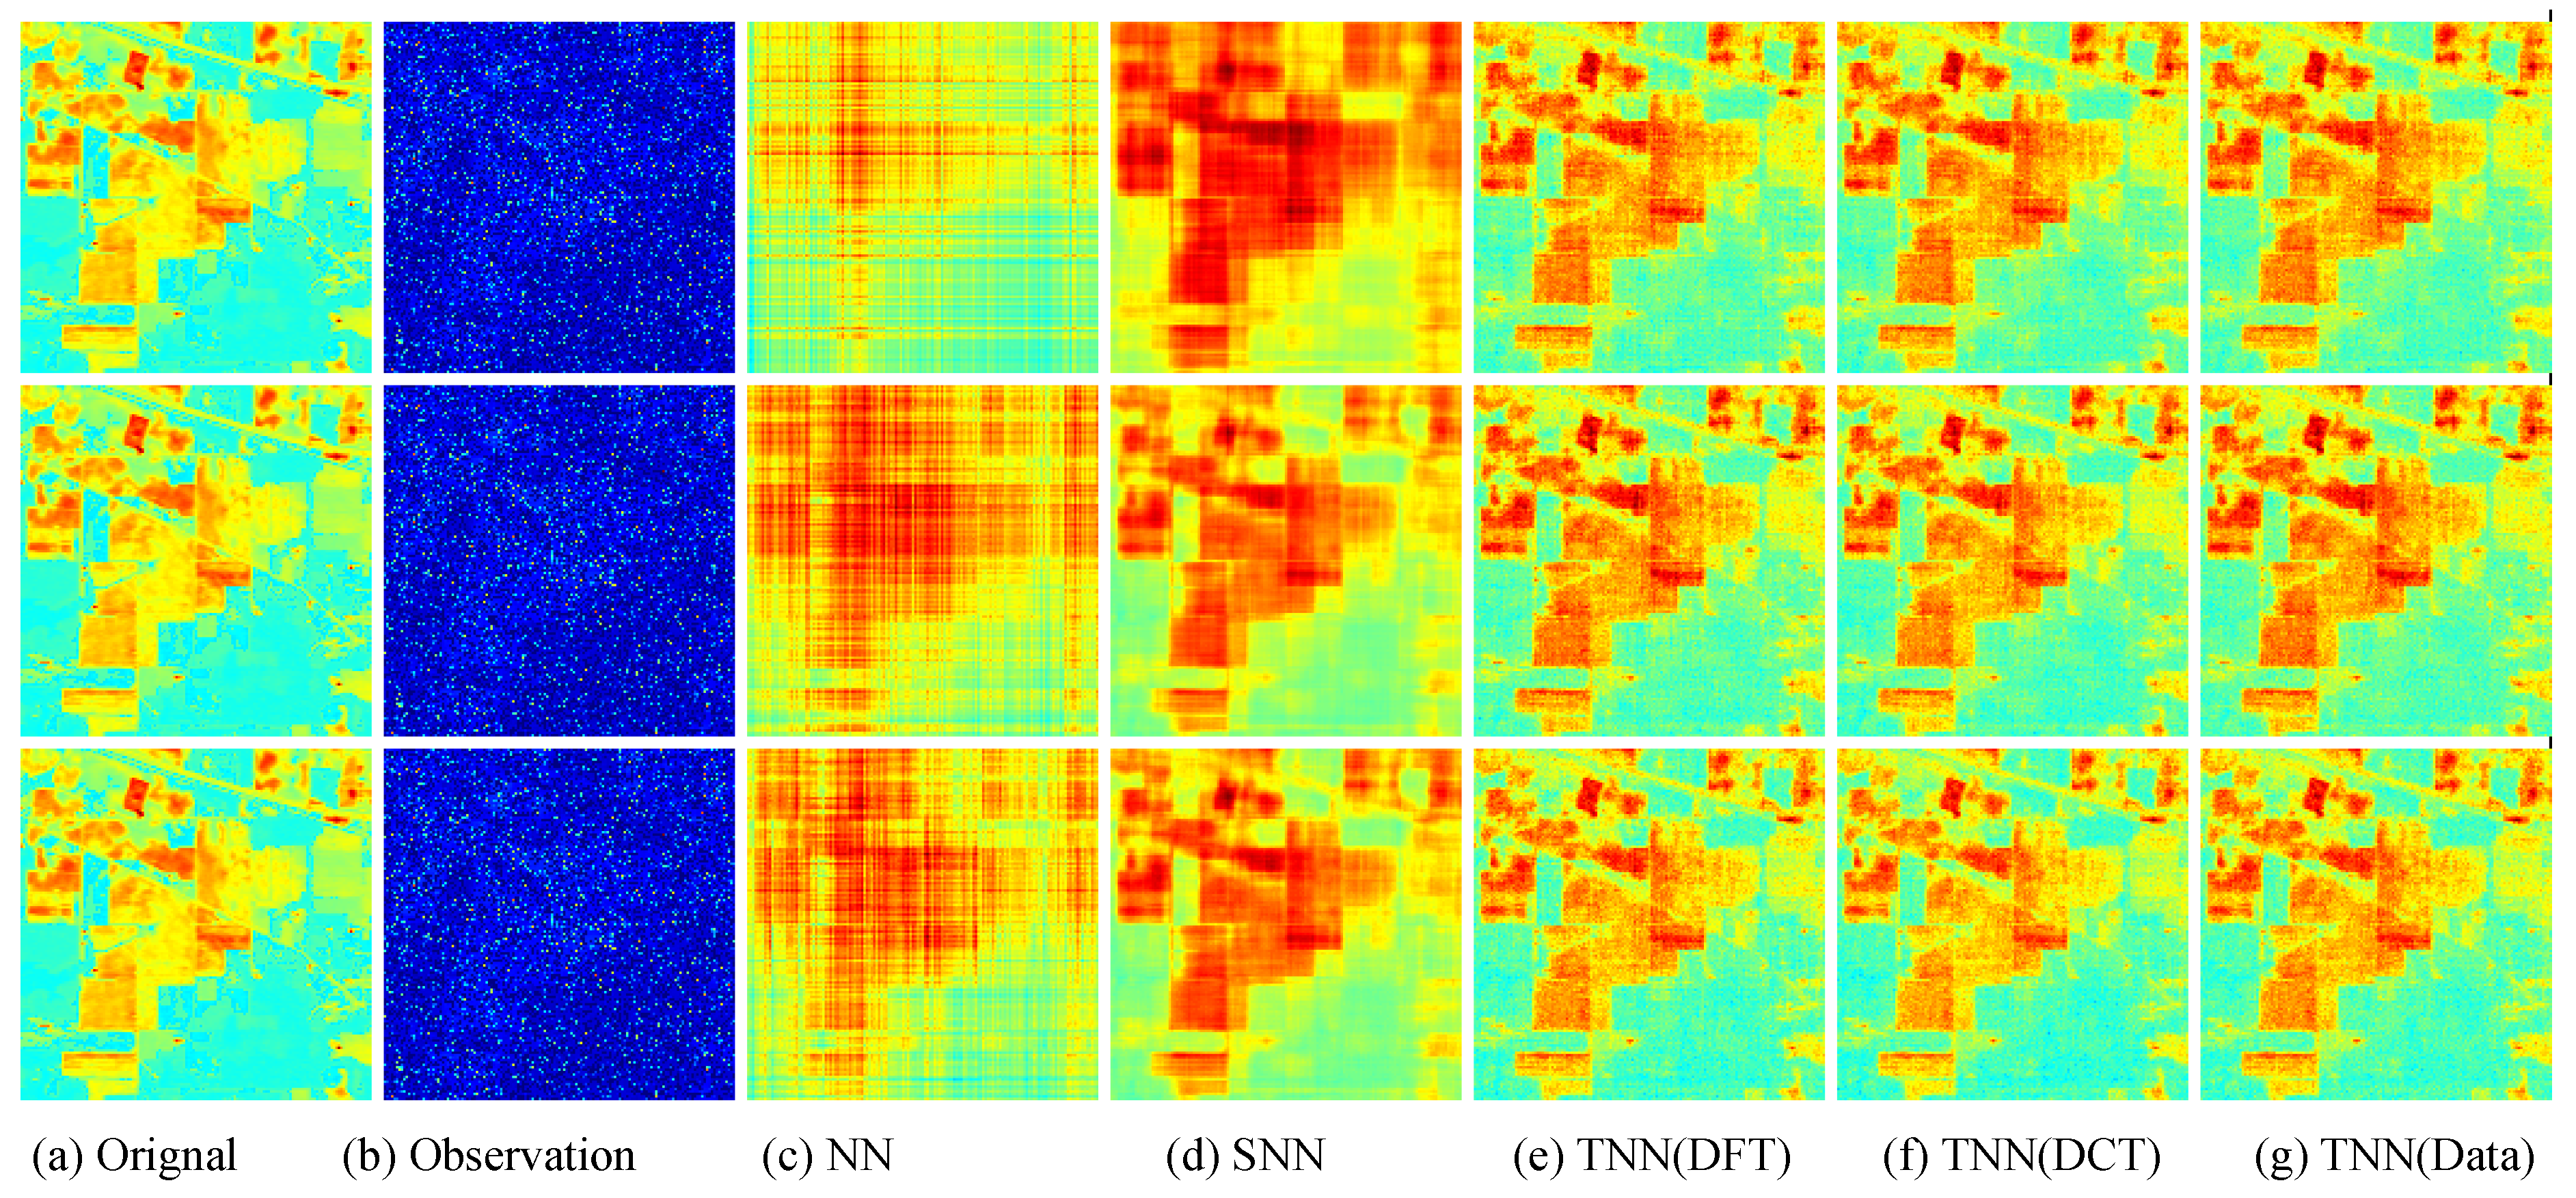
Figure 9.
Visual results of robust tensor completion for five models on the 21st bound of Indian Pines dataset. The top, middle, and bottum row corresponds to the Setting I
, Setting II
, and Setting III
, respectively. The sub-plots from (
a) to (
g): (
a) the original image; (
b) the observed image; (
c) image recovered by the matrix nuclear norm (NN) based Model (
32); (
d) recovered by the sum of mode-wise nuclear norms (SNN) based Model (
33); (
e) image recovered by TNN (DFT); (
f) image recovered by TNN (DCT); (
g) image recovered by TNN (Data).
Figure 10.
Visual results of robust tensor completion for five models on the 21st bound of Salinas A dataset. The top, middle, and bottum row corresponds to the Setting I
, Setting II
, and Setting III
, respectively. The sub-plots from (
a) to (
g): (
a) the original image; (
b) the observed image; (
c) image recovered by the matrix nuclear norm (NN) based Model (
32); (
d) recovered by the sum of mode-wise nuclear norms (SNN) based Model (
33); (
e) image recovered by TNN (DFT); (
f) image recovered by TNN (DCT); (
g) image recovered by TNN (Data).
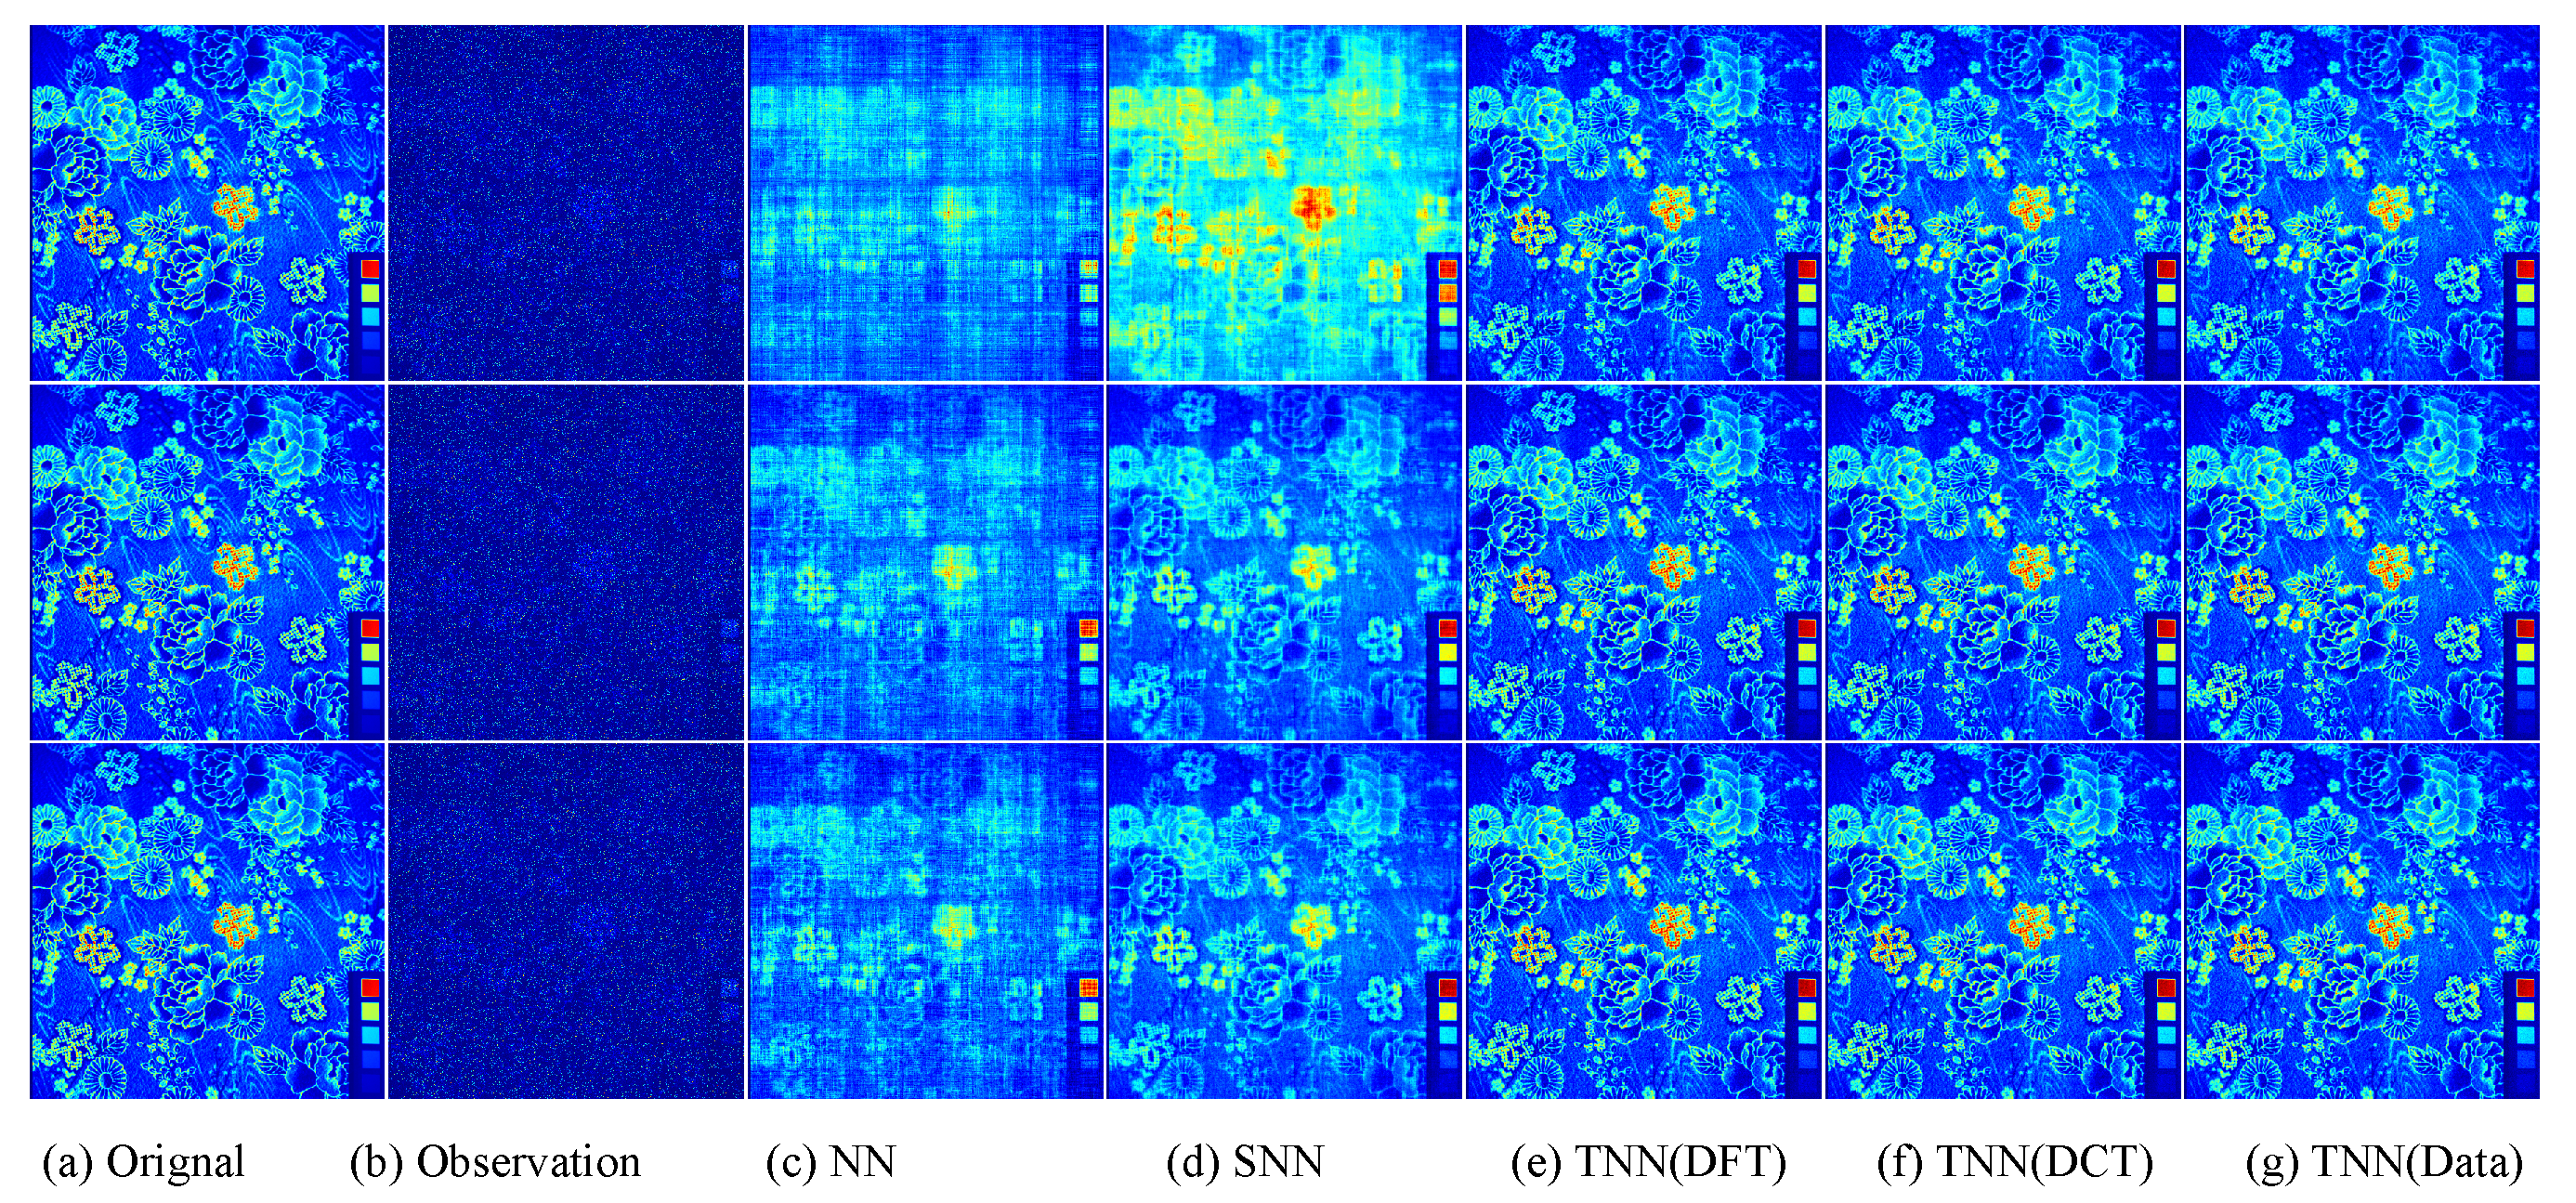
Figure 11.
Visual results of robust tensor completion for five models on the 21st bound of Cloth dataset. The top, middle, and bottum row corresponds to the Setting I
, Setting II
, and Setting III
, respectively. The sub-plots from (
a) to (
g): (
a) The original image; (
b) the observed image; (
c) image recovered by the matrix nuclear norm (NN) based Model (
32); (
d) recovered by the sum of mode-wise nuclear norms (SNN) based Model (
33); (
e) image recovered by TNN (DFT); (
f) image recovered by TNN (DCT); (
g) image recovered by TNN (Data).
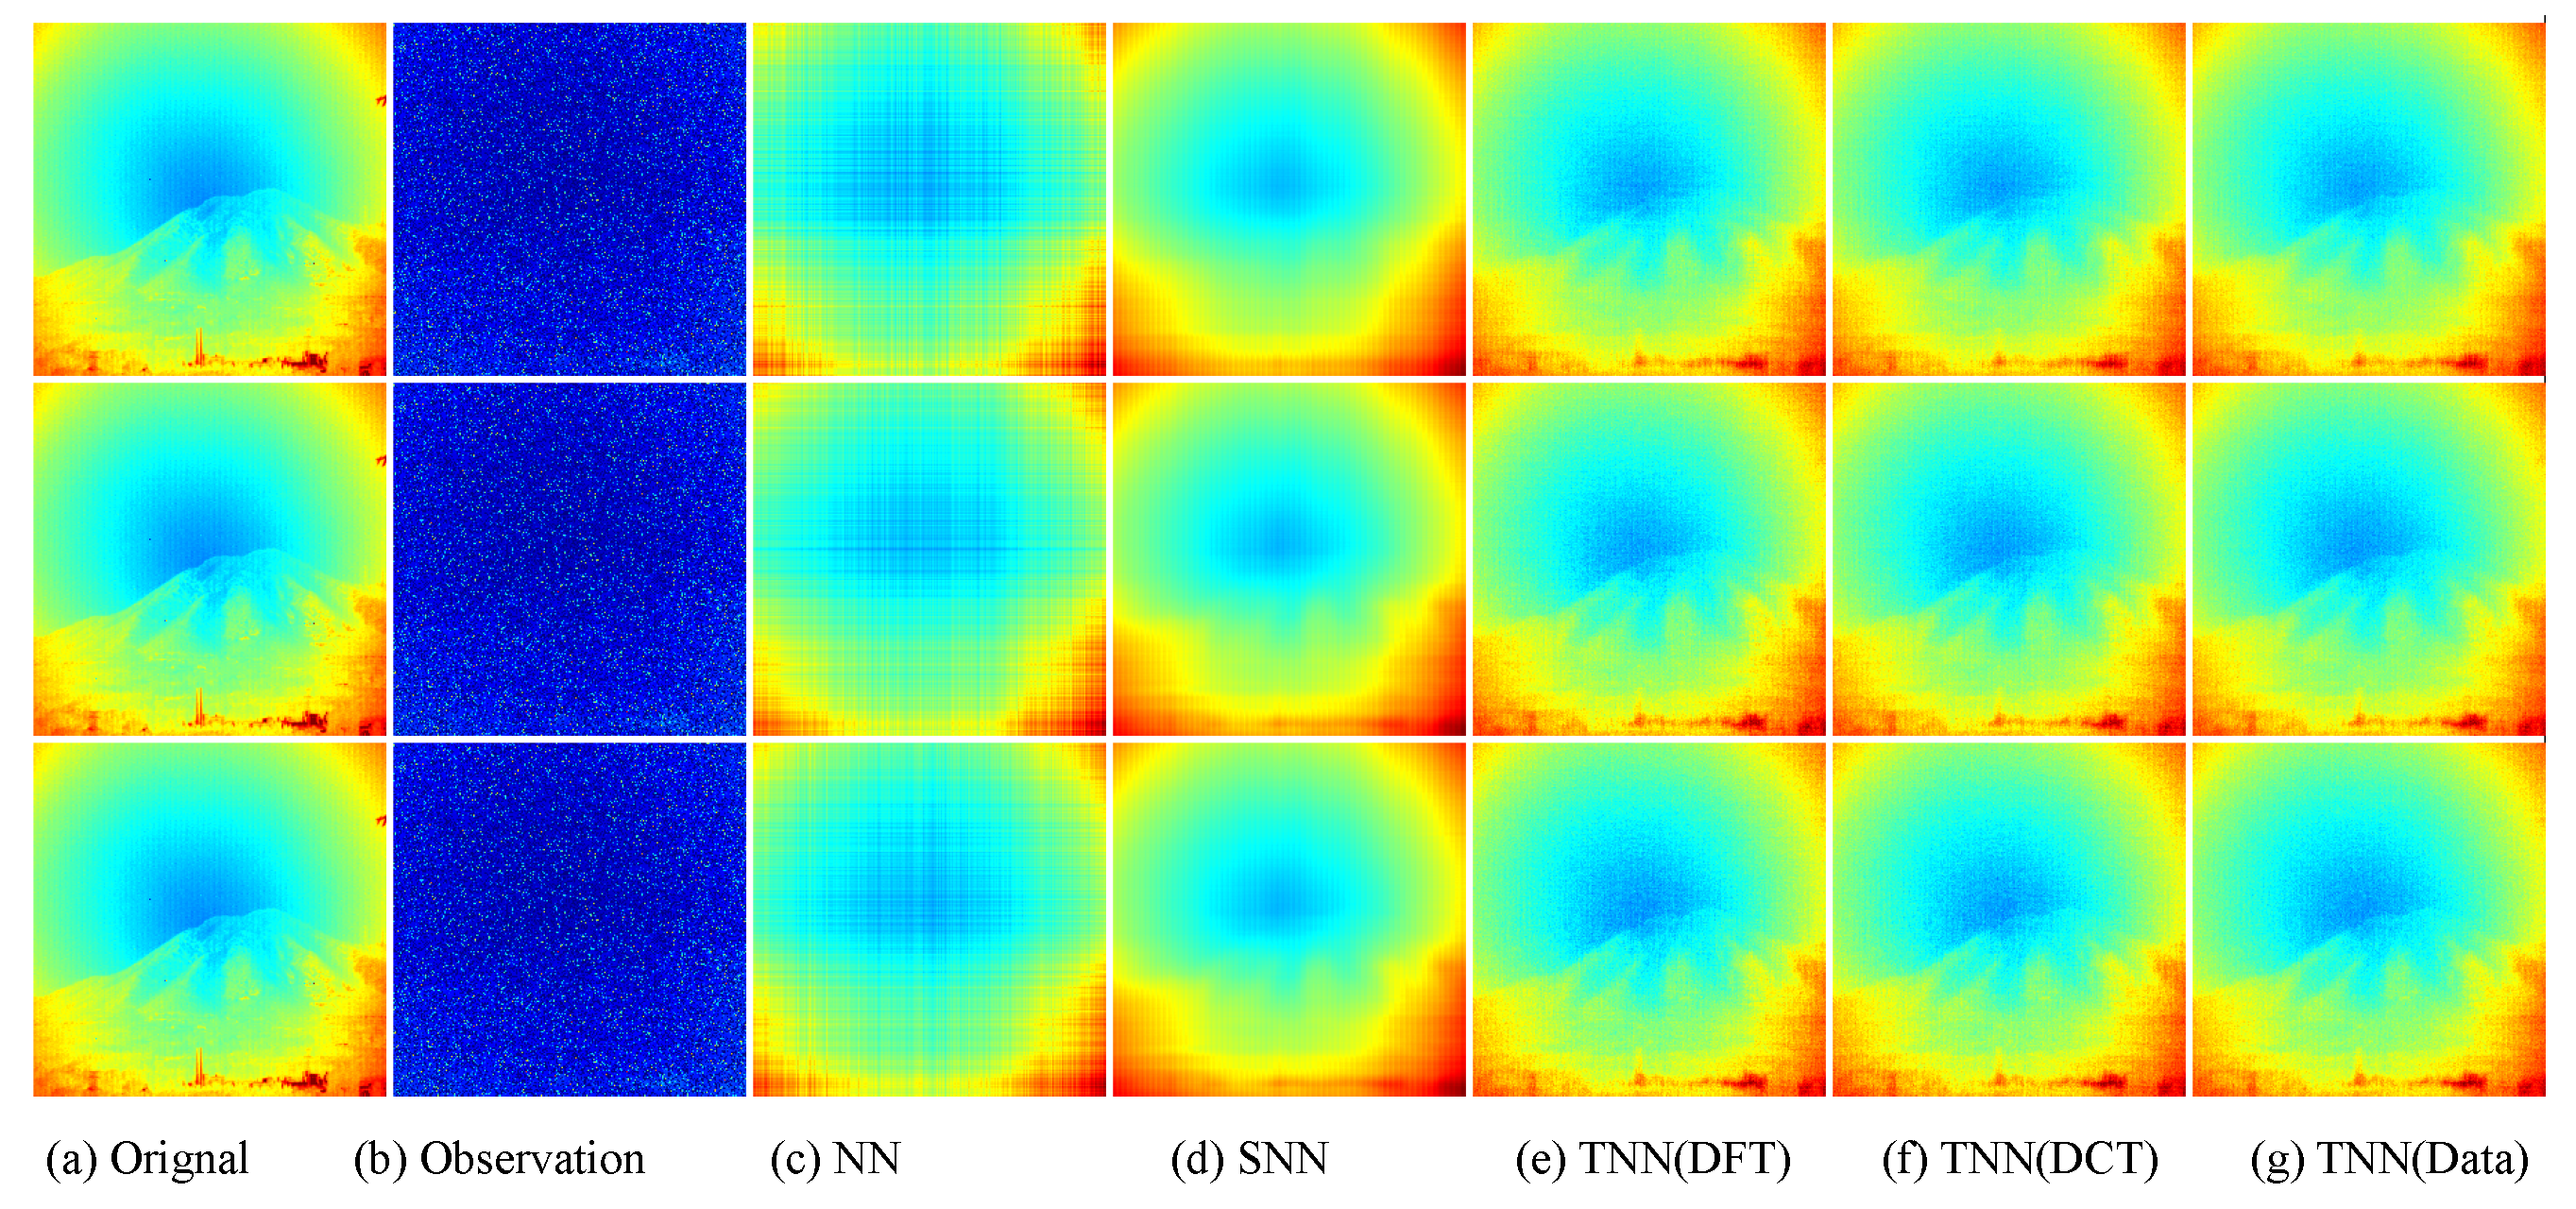
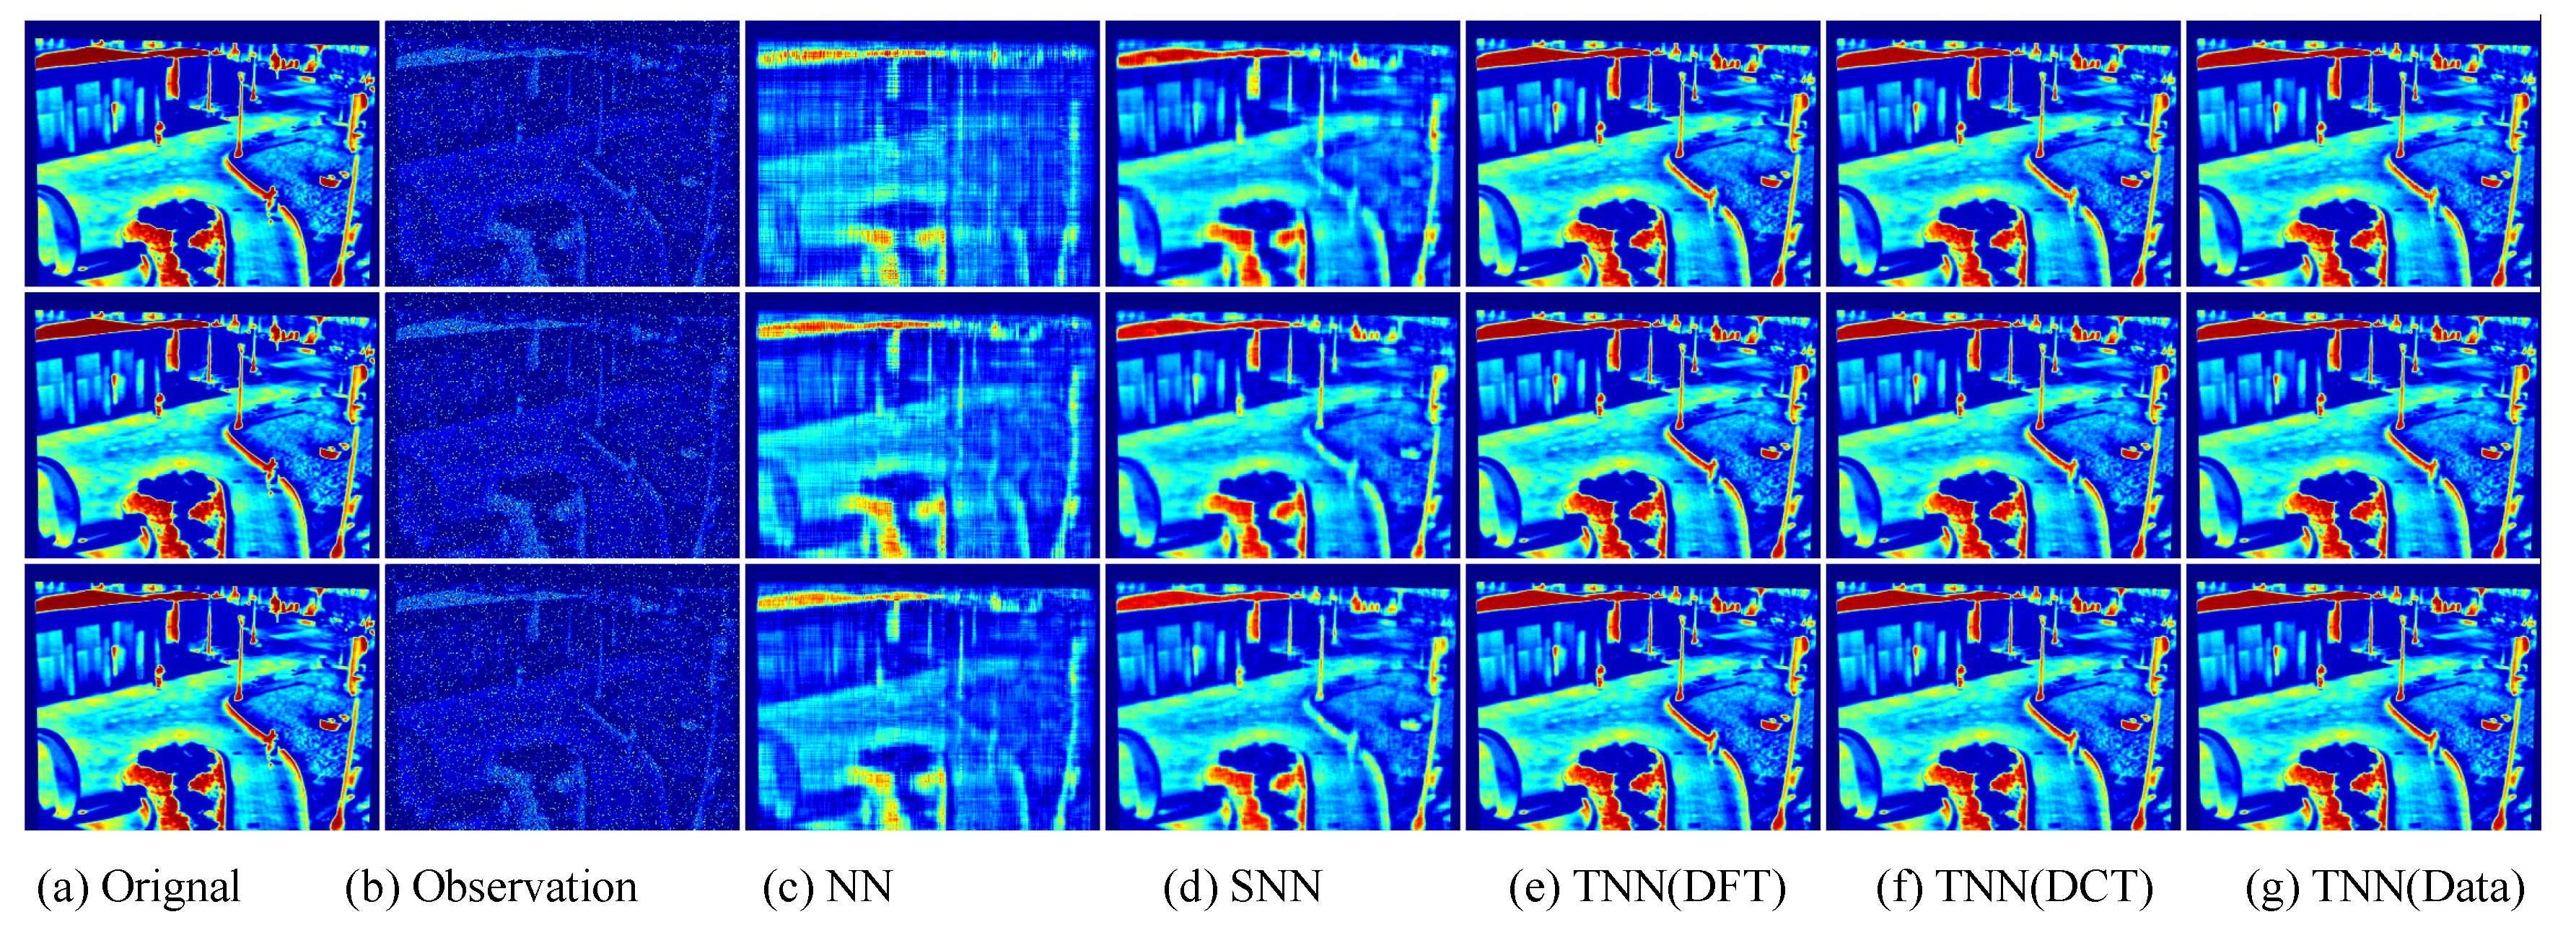
Figure 12.
Visual results of robust tensor completion for five models on the 21st bound of Infraed Detection dataset. The top, middle, and bottum row corresponds to the Setting I
, Setting II
, and Setting III
, respectively. The sub-plots from (
a) to (
g): (
a) the original image; (
b) the observed image; (
c) image recovered by the matrix nuclear norm (NN) based Model (
32); (
d) recovered by the sum of mode-wise nuclear norms (SNN) based Model (
33); (
e) image recovered by TNN (DFT); (
f) image recovered by TNN (DCT); (
g) image recovered by TNN (Data).
Figure 13.
Visual results of robust tensor completion for five models on the 21st bound of OSU Thermal Database dataset. The top, middle, and bottum row corresponds to the Setting I
, Setting II
, and Setting III
, respectively. The sub-plots from (
a) to (
g): (
a) the original image; (
b) the observed image; (
c) image recovered by the matrix nuclear norm (NN) based Model (
32); (
d) recovered by the sum of mode-wise nuclear norms (SNN) based Model (
33); (
e) image recovered by TNN (DFT); (
f) image recovered by TNN (DCT); (
g) image recovered by TNN (Data).
Table 1.
List of notations.
Table 1.
List of notations.
| Notations | Descriptions | Notations | Descriptions |
|---|
| t | a scaler | | a matrix |
| a vector | | a tensor |
| the true low-rank tensor | | the estimator of |
| the true sparse tensor | | the estimator of |
| a scalar observation | | Gaussian noise |
| a design tensor | N | number of observations |
| number of uncorrupted observations | | |
| support of corruption tensor | | complement of |
| design operator | | adjoint operator of |
| an orthogonal matrix in | | tensor L-transform |
| block-diagonal matrix of | | tensor spectral norm |
| entry of | | tubal nuclear norm |
| tube of | | tensor -norm |
| frontal slice of | | tensor F-norm |
| | | tensor -norm |
| mode-k unfolding of | | tensor inner product |
Table 2.
Quantitative evaluation on the Indian Pines dataset in PSNR, SSIM, and running time of five models for robust tensor completion in three settings, i.e., Setting I , Setting II , and Setting III . The highest PSNR/SSIM, or lowest time (in seconds) is highlighted in bold.
Table 2.
Quantitative evaluation on the Indian Pines dataset in PSNR, SSIM, and running time of five models for robust tensor completion in three settings, i.e., Setting I , Setting II , and Setting III . The highest PSNR/SSIM, or lowest time (in seconds) is highlighted in bold.
| Settings | Metrics | NN | SNN | TNN-DFT | TNN-DCT | TNN-Data |
|---|
| PSNR | 20.63 | 25.46 | 28.49 | 29.33 | 30.08 |
| Setting I | SSIM | 0.4842 | 0.7275 | 0.7619 | 0.7872 | 0.8181 |
| | TIME | 14.77 | 40.1 | 11.17 | 15.53 | 13.54 |
| PSNR | 21.95 | 27.66 | 29.49 | 30.17 | 30.61 |
| Setting II | SSIM | 0.5454 | 0.7864 | 0.7912 | 0.8073 | 0.8296 |
| | TIME | 14.18 | 39.76 | 11.04 | 15.23 | 13.29 |
| PSNR | 22.43 | 28.22 | 29.64 | 30.31 | 30.87 |
| Setting III | SSIM | 0.5534 | 0.8051 | 0.7971 | 0.8139 | 0.8345 |
| | TIME | 14.21 | 38.88 | 11.05 | 15.27 | 13.43 |
Table 3.
Quantitative evaluation on the Salinas A dataset in PSNR, SSIM, and running time of five tensor completion models for robust tensor completion in three settings, i.e., Setting I , Setting II , and Setting III . The highest PSNR/SSIM, or lowest time (in seconds) is highlighted in bold.
Table 3.
Quantitative evaluation on the Salinas A dataset in PSNR, SSIM, and running time of five tensor completion models for robust tensor completion in three settings, i.e., Setting I , Setting II , and Setting III . The highest PSNR/SSIM, or lowest time (in seconds) is highlighted in bold.
| Settings | Metrics | NN | SNN | TNN-DFT | TNN-DCT | TNN-Data |
|---|
| PSNR | 19.01 | 26.18 | 27.1 | 30.99 | 32.69 |
| Setting I | SSIM | 0.4918 | 0.837 | 0.7501 | 0.8350 | 0.8774 |
| | TIME | 5.57 | 11.53 | 4.07 | 5.73 | 4.9 |
| PSNR | 20.97 | 28.79 | 29.4 | 32.26 | 33.3 |
| Setting II | SSIM | 0.5806 | 0.8675 | 0.8117 | 0.8645 | 0.8714 |
| | TIME | 5.41 | 11.36 | 4.02 | 5.67 | 4.79 |
| PSNR | 21.54 | 29.5 | 29.73 | 32.38 | 33.54 |
| Setting III | SSIM | 0.5914 | 0.8772 | 0.8208 | 0.8683 | 0.8848 |
| | TIME | 5.34 | 11.01 | 3.98 | 5.59 | 4.91 |
Table 4.
Quantitative evaluation on the Beads dataset in PSNR, SSIM, and running time of five tensor completion models for robust tensor completion in three settings, i.e., Setting I , Setting II , and Setting III . The highest PSNR/SSIM, or lowest time (in seconds) is highlighted in bold.
Table 4.
Quantitative evaluation on the Beads dataset in PSNR, SSIM, and running time of five tensor completion models for robust tensor completion in three settings, i.e., Setting I , Setting II , and Setting III . The highest PSNR/SSIM, or lowest time (in seconds) is highlighted in bold.
| Settings | Metrics | NN | SNN | TNN-DFT | TNN-DCT | TNN-Data |
|---|
| PSNR | 18.58 | 18.71 | 25.11 | 25.18 | 27.05 |
| Setting I | SSIM | 0.448 | 0.6208 | 0.804 | 0.8203 | 0.8673 |
| | TIME | 309.55 | 933.12 | 280 | 260.46 | 241.65 |
| PSNR | 20.4 | 21.35 | 27.31 | 27.46 | 28.9 |
| Setting II | SSIM | 0.5406 | 0.7603 | 0.8754 | 0.8894 | 0.9143 |
| | TIME | 302.95 | 915.57 | 276.2 | 268.58 | 244.5 |
| PSNR | 21.01 | 22.36 | 27.96 | 28.13 | 29.4 |
| Setting III | SSIM | 0.5531 | 0.7848 | 0.8803 | 0.8944 | 0.9165 |
| | TIME | 301.92 | 922.07 | 276.99 | 272.59 | 244.02 |
Table 5.
Quantitative evaluation on the Cloth dataset in PSNR, SSIM, and running time of five tensor completion models for robust tensor completion in three settings, i.e., Setting I , Setting II , and Setting III . The highest PSNR/SSIM, or lowest time (in seconds) is highlighted in bold.
Table 5.
Quantitative evaluation on the Cloth dataset in PSNR, SSIM, and running time of five tensor completion models for robust tensor completion in three settings, i.e., Setting I , Setting II , and Setting III . The highest PSNR/SSIM, or lowest time (in seconds) is highlighted in bold.
| Settings | Metrics | NN | SNN | TNN-DFT | TNN-DCT | TNN-Data |
|---|
| PSNR | 21.5 | 22.79 | 29.7 | 30.83 | 30.77 |
| Setting I | SSIM | 0.5054 | 0.6333 | 0.8649 | 0.8883 | 0.8941 |
| | TIME | 308.29 | 915.43 | 281.4 | 264.84 | 242.63 |
| PSNR | 22.63 | 24.94 | 32.32 | 33.57 | 33.86 |
| Setting II | SSIM | 0.5566 | 0.7355 | 0.916 | 0.9323 | 0.9391 |
| | TIME | 300.3 | 911.27 | 273.36 | 268.46 | 243.37 |
| PSNR | 22.99 | 25.78 | 32.76 | 34.02 | 34.39 |
| Setting III | SSIM | 0.5652 | 0.7643 | 0.9183 | 0.9342 | 0.941 |
| | TIME | 297.94 | 910.64 | 280.51 | 268.25 | 246.14 |
Table 6.
Quantitative evaluation on the SenerioB Distance dataset in PSNR, SSIM, and running time of five tensor completion models for robust tensor completion in three settings, i.e., Setting I , Setting II , and Setting III . The highest PSNR/SSIM, or lowest time (in seconds) is highlighted in bold.
| Settings | Metrics | NN | SNN | TNN-DFT | TNN-DCT | TNN-Data |
|---|
| PSNR | 17.55 | 20.01 | 23.86 | 23.86 | 23.87 |
| Setting I | SSIM | 0.468 | 0.763 | 0.8732 | 0.8737 | 0.8739 |
| | TIME | 15.22 | 186.31 | 14.49 | 19.66 | 15.83 |
| PSNR | 18.57 | 23.87 | 25.28 | 25.31 | 25.34 |
| Setting II | SSIM | 0.551 | 0.9055 | 0.9096 | 0.91 | 0.9105 |
| | TIME | 15.51 | 189.87 | 15.55 | 18.68 | 16.31 |
| PSNR | 18.98 | 24.78 | 25.79 | 25.83 | 25.87 |
| Setting III | SSIM | 0.5678 | 0.9197 | 0.9179 | 0.9184 | 0.9189 |
| | TIME | 15.03 | 195 | 14.8 | 19.11 | 15.02 |
Table 7.
Quantitative evaluation on the SenerioB Intensity dataset in PSNR, SSIM, and running time of five tensor completion models for robust tensor completion in three settings, i.e., Setting I , Setting II , and Setting III . The highest PSNR/SSIM, or lowest time (in seconds) is highlighted in bold.
| Settings | Metrics | NN | SNN | TNN-DFT | TNN-DCT | TNN-Data |
|---|
| PSNR | 16.35 | 20.35 | 21.28 | 21.26 | 21.31 |
| Setting I | SSIM | 0.2588 | 0.7076 | 0.7114 | 0.7116 | 0.7137 |
| | TIME | 15.13 | 188.96 | 14.18 | 19.06 | 15.19 |
| PSNR | 17.09 | 22.17 | 22.28 | 22.32 | 22.45 |
| Setting II | SSIM | 0.3149 | 0.7889 | 0.7708 | 0.7718 | 0.7781 |
| | TIME | 14.64 | 187.61 | 14.09 | 19.1 | 15.74 |
| PSNR | 17.35 | 22.48 | 22.57 | 22.61 | 22.79 |
| Setting III | SSIM | 0.3331 | 0.7985 | 0.7828 | 0.7836 | 0.7914 |
| | TIME | 14.7 | 187.66 | 14.23 | 19 | 15.22 |
Table 8.
Quantitative evaluation on the Sky dataset in PSNR, SSIM, and running time of five tensor completion models for robust tensor completion in three settings, i.e., Setting I , Setting II , and Setting III . The highest PSNR/SSIM, or lowest time (in seconds) is highlighted in bold.
Table 8.
Quantitative evaluation on the Sky dataset in PSNR, SSIM, and running time of five tensor completion models for robust tensor completion in three settings, i.e., Setting I , Setting II , and Setting III . The highest PSNR/SSIM, or lowest time (in seconds) is highlighted in bold.
| Settings | Metrics | NN | SNN | TNN-DFT | TNN-DCT | TNN-Data |
|---|
| PSNR | 21.03 | 26.74 | 28.67 | 28.59 | 29.74 |
| Setting I | SSIM | 0.4875 | 0.7805 | 0.708 | 0.7076 | 0.788 |
| | TIME | 36.1 | 144.84 | 28.1 | 39.85 | 34.43 |
| PSNR | 22.44 | 28.8 | 29.41 | 29.35 | 30.48 |
| Setting II | SSIM | 0.5715 | 0.8026 | 0.7155 | 0.7147 | 0.7814 |
| | TIME | 34.23 | 138.52 | 27.11 | 38.77 | 33.74 |
| PSNR | 22.77 | 28.72 | 29.55 | 29.49 | 30.59 |
| Setting III | SSIM | 0.5786 | 0.7471 | 0.7324 | 0.7307 | 0.7906 |
| | TIME | 34.42 | 139.78 | 26.97 | 39.14 | 33.86 |
Table 9.
Quantitative evaluation on the Infraed Detection dataset in PSNR, SSIM, and running time of five tensor completion models for robust tensor completion in three settings, i.e., Setting I , Setting II , and Setting III . The highest PSNR/SSIM, or lowest time (in seconds) is highlighted in bold.
| Settings | Metrics | NN | SNN | TNN-DFT | TNN-DCT | TNN-Data |
|---|
| PSNR | 24.82 | 30.09 | 31.94 | 32.07 | 32.84 |
| Setting I | SSIM | 0.6021 | 0.8231 | 0.7408 | 0.7437 | 0.7768 |
| | TIME | 49.01 | 215.41 | 48.97 | 52.37 | 46.59 |
| PSNR | 26.58 | 31.8 | 32.33 | 32.43 | 33.11 |
| Setting II | SSIM | 0.6679 | 0.8414 | 0.7428 | 0.7453 | 0.7724 |
| | TIME | 47.55 | 217.43 | 50.07 | 52.9 | 47.18 |
| PSNR | 26.95 | 31.9 | 33.11 | 33.2 | 33.81 |
| Setting III | SSIM | 0.6682 | 0.8454 | 0.7237 | 0.7265 | 0.7525 |
| | TIME | 48.65 | 216.42 | 49.13 | 52.81 | 46.94 |
Table 10.
Quantitative evaluation on the OSU Thermal Database in PSNR, SSIM, and running time of five tensor completion models for robust tensor completion in three settings, i.e., Setting I , Setting II , and Setting III . The highest PSNR/SSIM, or lowest time (in seconds) is highlighted in bold.
Table 10.
Quantitative evaluation on the OSU Thermal Database in PSNR, SSIM, and running time of five tensor completion models for robust tensor completion in three settings, i.e., Setting I , Setting II , and Setting III . The highest PSNR/SSIM, or lowest time (in seconds) is highlighted in bold.
| Settings | Metrics | NN | SNN | TNN-DFT | TNN-DCT | TNN-Data |
|---|
| PSNR | 15.62 | 21.5 | 31.33 | 31.5 | 31.51 |
| Setting I | SSIM | 0.3402 | 0.8105 | 0.9345 | 0.9347 | 0.935 |
| | TIME | 49 | 222.49 | 40.31 | 49.45 | 42.22 |
| PSNR | 17.47 | 29.48 | 32.88 | 33.19 | 33.21 |
| Setting II | SSIM | 0.4428 | 0.9057 | 0.9427 | 0.9431 | 0.9433 |
| | TIME | 46.18 | 197.9 | 36.14 | 47.19 | 41.79 |
| PSNR | 18.17 | 30.83 | 33.31 | 33.71 | 33.75 |
| Setting III | SSIM | 0.468 | 0.9265 | 0.9495 | 0.95 | 0.9507 |
| | TIME | 45.85 | 200.39 | 36.39 | 46.96 | 41.36 |
Table 11.
Quantitative evaluation on the UAVSAR-Dataset1-2015 dataset in PSNR, SSIM, and running time of five tensor completion models for robust tensor completion in three settings, i.e., Setting I , Setting II , and Setting III . The highest PSNR/SSIM, or lowest time (in seconds) is highlighted in bold.
| Settings | Metrics | NN | SNN | TNN-DFT | TNN-DCT | TNN-Data |
|---|
| PSNR | 29.14 | 25.86 | 26.22 | 26.5 | 31.62 |
| Setting I | SSIM | 0.8748 | 0.8797 | 0.8868 | 0.8909 | 0.9438 |
| | TIME | 23.54 | 75.07 | 17.46 | 25.24 | 22.6 |
| PSNR | 31.3 | 26.71 | 26.96 | 27.31 | 34.28 |
| Setting II | SSIM | 0.9044 | 0.8742 | 0.9018 | 0.9059 | 0.9615 |
| | TIME | 23.09 | 74.75 | 17.6 | 24.77 | 22.59 |
| PSNR | 31.8 | 26.98 | 27.14 | 27.66 | 35.03 |
| Setting III | SSIM | 0.9118 | 0.8829 | 0.903 | 0.9092 | 0.9649 |
| | TIME | 22.88 | 73.03 | 17.64 | 25.22 | 22.54 |


