Article

Evaluation of Polycentric Spatial Structure in the Urban Agglomeration of the Pearl River Delta (PRD) Based on Multi-Source Big Data Fusion

1
School of Geography and Planning, Sun Yat-sen University, Guangzhou 510275, China
2
Key Laboratory of the Sustainable Development of Xinjiang’s Historical and Cultural Tourism, Xinjiang University, Urumqi 830046, China
*
Author to whom correspondence should be addressed.
Remote Sens. 2021, 13(18), 3639; https://doi.org/10.3390/rs13183639
Submission received: 5 August 2021 / Revised: 2 September 2021 / Accepted: 8 September 2021 / Published: 12 September 2021

Abstract

:
The rapid development of the urban city has led to great changes in the urban spatial structure. Thus, analyses of polycentric urban spatial structures are important for understanding these kinds of structures. In order to accurately evaluate the polycentric spatial structure of urban agglomerations and judge the differences between the actual development situation and overall planning of urban agglomerations, this study proposes a new method to identify the polycentric spatial structure of urban agglomerations in the Pearl River Delta based on the fusion of nighttime light (NTL) data, point of interest (POI) data, and Tencent migration data (TMG). In the first step, the NTL, POI, and TMG data are fused via wavelet transform; in the second step, Anselin local Moran’s I (LMI) and geographically weighted regression (GWR) were used to identify the main centers and subcenters, respectively. In the third step, the accuracy of the results of this study was further verified and discussed in the context of overall planning. The results show that the accuracy of urban polycenter identification via LMI and GWR after data fusion was 92.84%, and the Kappa value was 0.8971, which was higher than the results of polycenter identification via the traditional relative threshold. After comparing the identification results with the overall planning, firstly, we see that the fusion of multi-source big data can help to accurately evaluate the polycentric spatial structure within the urban agglomeration. Secondly, the fusion of dynamic data and static data can help identify the polycentric spatial structure of urban space more accurately. Therefore, this study can provide a new design for urban polycentric spatial structures, and further provide a reliable reference for the spatial optimization of urban agglomeration and the formulation of regional spatial development policies.

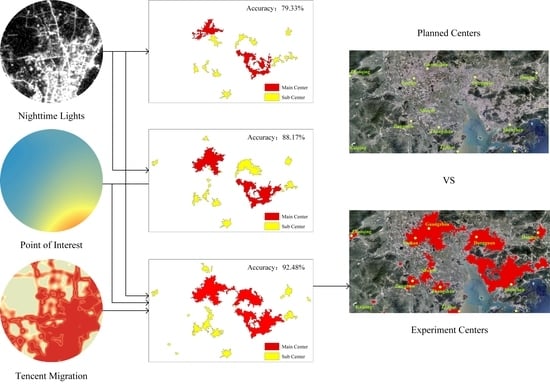
Graphical Abstract

1. Introduction

China has made rapid progress in its urbanization construction in more than 40 years since 1978 [1], which is embodied in the following aspects: first of all, the urbanization rate increased by 42.44% from 17.90% in 1978 to 60.34% in 2020 [2], and the urbanization rate of first-tier cities, including Beijing, Shanghai, and Guangzhou exceeded 70% [3], especially Shenzhen, whose urbanization rate reached 88% in 2020 [4]. Secondly, rapid urbanization has shifted the focus of human activities, resulting in the rapid outflow of the population from urbanized areas [5]. According to statistics, in the past 40 years, more than 97.7% of the regional population in northeast China has flowed into the eastern coastal regions of China [6]. The rapid growth of population has led to great changes in the spatial structure, function, and nature of the urban interior, and many polycentric cities have gradually emerged [7,8]. The reason for such change is that previously relatively closed and independent cities have gradually evolved into a larger and more integrated urban system on a geographical scale [9]. As an area with a high concentration of population, economy, and production factors [10], although the urban center is the most innovative and diverse region in urban development [11], there will still be social problems such as traffic congestion, environmental pollution [12], including pseudo-urbanization. Although a large number of rural industrial workers living in cities are regarded as urban populations, they have not settled in cities. This phenomenon is particularly obvious in developing countries. All these problems have caused serious impacts on the sustainable development of urban centers [13,14]. Although the population continues to migrate to urban centers at the local scale [15,16], it restricts the sustainable development of cities to a certain extent [17]. At the same time, the polycentric urban spatial structure is a rapid and sustainable urban development model, which can alleviate these urban problems [18,19]. Moreover, polycentric urban spatial structures cover multiple cities and their affiliated towns and rural areas [20,21]. Therefore, the study on polycentric urban spatial structure will not only help to understand the characteristics of cities but will also help to formulate corresponding urban planning and management policies, which will, in turn, result in the polycentric urban spatial structure development model becoming favored by urban planners and decision-makers. Last but not least, as the urbanization process of urban areas is ahead of that of township areas, there will be an obvious siphon effect within the city [22], which means that population and resources gradually flow to the urban center, and the polycentric spatial structure becomes more and more obvious [23]. However, although the overall planning process of many big cities in China generally employs the polycentric urban spatial structure development model, the implementation of such strategic planning often takes decades. Furthermore, there is a dearth of effective and objective methods to analyze and judge whether the urban development is consistent with the planning intention [24,25]. Therefore, to accurately evaluate the spatial structure of polycentric cities by using scientific methods is the basis for understanding the current status of urban development, and the core of this study is to provide a reliable polycenter development model for the sustainable development of internal urban space on the basis of accurate evaluation of the implementation of planning policies.
In the internal spatial structure of a city, the city center usually consists of a main center and subcenter. The main center of a city is its core and generally refers to the central business district and the areas where human activity is most concentrated, while the subcenter refers to areas wherein the human activity is significantly different. The latter will usually include satellite cities, airport cities, and so on [26,27]. The urban subcenter can not only share the functions of the urban main center, but it can also provide more convenient commuting services for urban residents, and it exhibits lower land costs for businesses [28]. This is similar to the heterogeneity of landscape patterns. The structure, function, nature, and status of urban interior space are largely determined by the heterogeneity of urban spatial landscape patterns [29]. The urban center, as the region with the most perfect urban function and structure, is the direct embodiment of the heterogeneity of landscape patterns. Therefore, the polycenter urban spatial structure has a significant effect on enriching the heterogeneity of urban spatial landscape pattern. At present, the development planning of most cities, especially first-tier cities, all clearly require the realization of urban polycentric development [30] when formulating policies or reaching the standard of a polycentric city within the planning period [31]. In the formulation of development planning policies for first-tier cities, urban development and construction in the coming decades will be considered. Therefore, the formulation of polycentric development planning policies is also conducive to the sustainable development of urban cities [32]. All in all, it is necessary to accurately evaluate the polycentric spatial structure of urban space in order to alleviate urban expansion and realize the sustainable development of the city [33,34].
However, due to the limitations in the data, the study of urban polycentric spatial structures is itself limited, which manifests as follows: first of all, previous studies mainly relied on traditional statistical data, including census data and socioeconomic data [35,36]. For example, areas with high employment density are defined as urban centers according to economic data [37]. Secondly, traditional studies have only used population data to conduct multi-scale urban center analyses of multiple regions in China [38]. Fortunately, in 2003, McMillen developed a complex but accurate method for identifying the spatial structure of urban polycenters based on census data—using the local weighted regression method and employment index, the urban subcenter can be defined as an area within a certain distance of the urban main center and whose population density is significantly higher than the average threshold value. This method has been widely approved because it improves the accuracy of studies of urban polycentricity [39,40,41]. However, this method requires a certain basic understanding of the study area, which is mainly reflected in the following aspects: firstly, the location of urban main center needs to be determined. Without a detailed understanding of the study area, it would be very difficult to define the urban main center. Secondly, with the rapid development of cities, the number of urban main centers is not necessarily just one. Thirdly, census data have a long renewal cycle, which makes the identification of the spatial structure of polycentric cities more complicated [42,43].
Compared with traditional methods, remote sensing image data, including NTL data, can provide the spatial characteristics of the urban landscape and urban infrastructure [44]. Moreover, NTL data can capture the brightness of city lights at night, reflecting the nature of urban activities, for which reason NTL data are widely used in urban space research. At present, many studies are being carried out on the application of NTL data, such as those from the Defence Meteorological Program Operational Line-Scan System, the Suomi National Polar-orbiting Partnership/Visible Infrared Imaging Radiometer Suite, Luojia-01, and data that combines lidar and remote sensing are used to identify urban built-up areas and judge urban agglomeration expansion, as well as to identify urban forms and spatial structures [45,46,47], and socioeconomic assessments and predictions of urban development [48,49]. However, NTL data have limitations that cannot be ignored. Firstly, although the spatial correlation between urban activities and night light is an important basis for the application of NTL data in urban-related studies, different spatial resolutions of NTL data will lead to different results on urban spatial structure [50]. Secondly, compared with traditional data, although NTL data have greater spatial stability and objectivity, they cannot reflect the nature of the human activities, they cannot reflect the nature of the human activities especially in the daytime period. Moreover, the spillover effect of NTL data would lead to errors in the assessment of urban spatial structure [51]. However, the combination of lidar and remote sensing to identify urban spatial structure can achieve quite high accuracy, but it takes too long to deal with large-scale urban agglomeration, which means it cannot be widely promoted [52]
In recent years, big data based on location services and social platforms has played an important role in urban-related studies, which in turn offer new methods for observing human activities and spatial characteristics, such as POI data and location-based services [53,54]. There is a significant correlation between big data and human activities. Compared with static data (such as census data), big data can provide better spatial and temporal observations, and thus more accurately reflect the spatial characteristics of urban residents [55,56]. As a category of point data obtained from online maps, POI data offer an abstract representation of geographical entities in virtual space, with the advantage of wider coverage and a faster updating speed [57]. At present, studies on POI data in urban space mainly focus on urban built-up areas [58], the identification of the urban center [59], the delineation of urban boundaries, and the distribution of population space [60,61]. For example, in urban center identification, some studies have used POI data to identify the boundary of the Guangzhou commercial center and discuss the commercial space in Guangzhou [62]. There are also some studies that have identified the urban center system of the Beijing metropolitan area via the center agglomeration effect of different industries [63]. Tencent is an Internet company focusing on social and communication services. It owns apps including Wechat, QQ, and Amap (Amap is an online electronic map). When users use social communication tools such as Wechat and QQ, location tags with timestamps will be generated. Tencent’s Amap application service [64,65] will generate population migration data according to these location tags, which is also known as Tencent-migration data (TMG). Tencent migration (TMG) data constitute one of the most important indexes reflecting population migration and are provided by Amap. TMG data reflect changes in population movements within a certain time and region and thus offer a wider collection range and higher accuracy. As such, they play an important role in studies of population movement [66], especially in the period of COVID-19, in which they provide an important basis for city health decision-making by reflecting population movements [67].
There is a significant correlation between NTL data and POI data in space. It has also been reflected by previous studies that fusing different data sets can significantly improve the accuracy of research on urban spatial structure in terms of both extracting urban built-up areas and delineating urban agglomeration boundaries [1]. That said, data fusion is still relatively rare in studies on urban spatial structure, especially in the identification and evaluation of the polycentric spatial structures of urban cities and urban agglomerations. Furthermore, at present, few studies have focused on the impacts of inter-city factor flow, such as population migration [68], on the polycentric evaluation of urban agglomerations. Moreover, in previous studies on polycentric spatial structure, instead of discussing how to evaluate the identified polycentric spatial structure, such as assessing the accuracy of the identified urban center and comparing it with the urban planning results, scholars have been shown to be more likely to use different methods to identify the polycentric spatial structure [69,70]. Therefore, in order to evaluate the polycentric spatial structure of urban agglomerations and judge the differences between the actual development and planning proposed by urban agglomerations, this study proposes an effective way to accurately identify the polycentric spatial structure of urban agglomerations on the basis of data fusion. In addition, the results of polycentric evaluations of urban agglomerations facilitate further objective verification, which is useful for urban planning. In other words, compared with the existing research, the new contribution of this study is to propose a new method and approach to evaluate the urban polycentric spatial structure, and this new method and approach are validated effectively. The main contents of this study are as follows: firstly, NTL data, POI data, and TMG data are fused by wavelet transformation; secondly, LMI and GWR are used to identify the main center and subcenter of the PRD urban agglomeration. Then, the results derived from different data sources are compared with those derived via the threshold method, and the accuracy is verified. Finally, a comparison with the polycentric spatial structure of the overall plan in the urban agglomeration is carried out.

2. Materials and Methods

2.1. Study Area

Located in Guangdong Province, China (Figure 1), the PRD urban agglomeration is one of the most dynamic economic zones in the Asia-Pacific region, covering 9 cities including Guangzhou, Foshan, Zhaoqing, Shenzhen, Dongguan, Huizhou, Zhuhai, and Zhongshan Jiangmen (Figure 1). As one of the urban agglomerations in mainland China with the largest populations, the strongest innovation capabilities, and the greatest overall strength, the total administrative area of the PRD is 42,200 square kilometers, and the permanent population exceeds 60 million [71]. Compared with a single city, an urban agglomeration is the most potent economic pole of a country or region within a certain geographical area. Urban agglomeration plays an important role in economic development and population agglomeration in all countries and regions of the world, such as the New York Area and the Tokyo Bay Area [72]. The influence of these urban agglomerations has gone far beyond their administrative boundaries. With the rapid absorption of the population by urban agglomerations, their urban spatial structures have also undergone drastic changes [49]. Due to the unique institutional environment and economic environment in China, the evolution of China’s urban agglomeration has been significantly different from that of other countries. Therefore, with the rapid economic development of China and the acceleration of the construction of urban agglomerations, it will be of great value to accurately identify and evaluate the spatial structures of urban agglomerations to ensure their sustainable development.

2.2. Study Data

In order to achieve the above purpose, this study uses NTL data, which is widely used in the study of urban agglomeration spatial structure, as well as POI data and TMG data, which has a significant spatial correlation with NTL data in the space and time range. The reason for using the above 3 kinds of data is that the 3 kinds of data have strong spatial correlation, which means that these 3 types of data can be better fused. Since it is necessary to test the accuracy of the polycenter evaluation of urban agglomerations and compare the differences with the overall planning, the spatial grid distribution data of the population with the highest degree of correlation with the urban center is used to finalize the evaluation results. The acquisition methods and temporal-spatial resolutions of different data sets are shown in Table 1.

2.2.1. Nighttime Light Data (NTL Data)

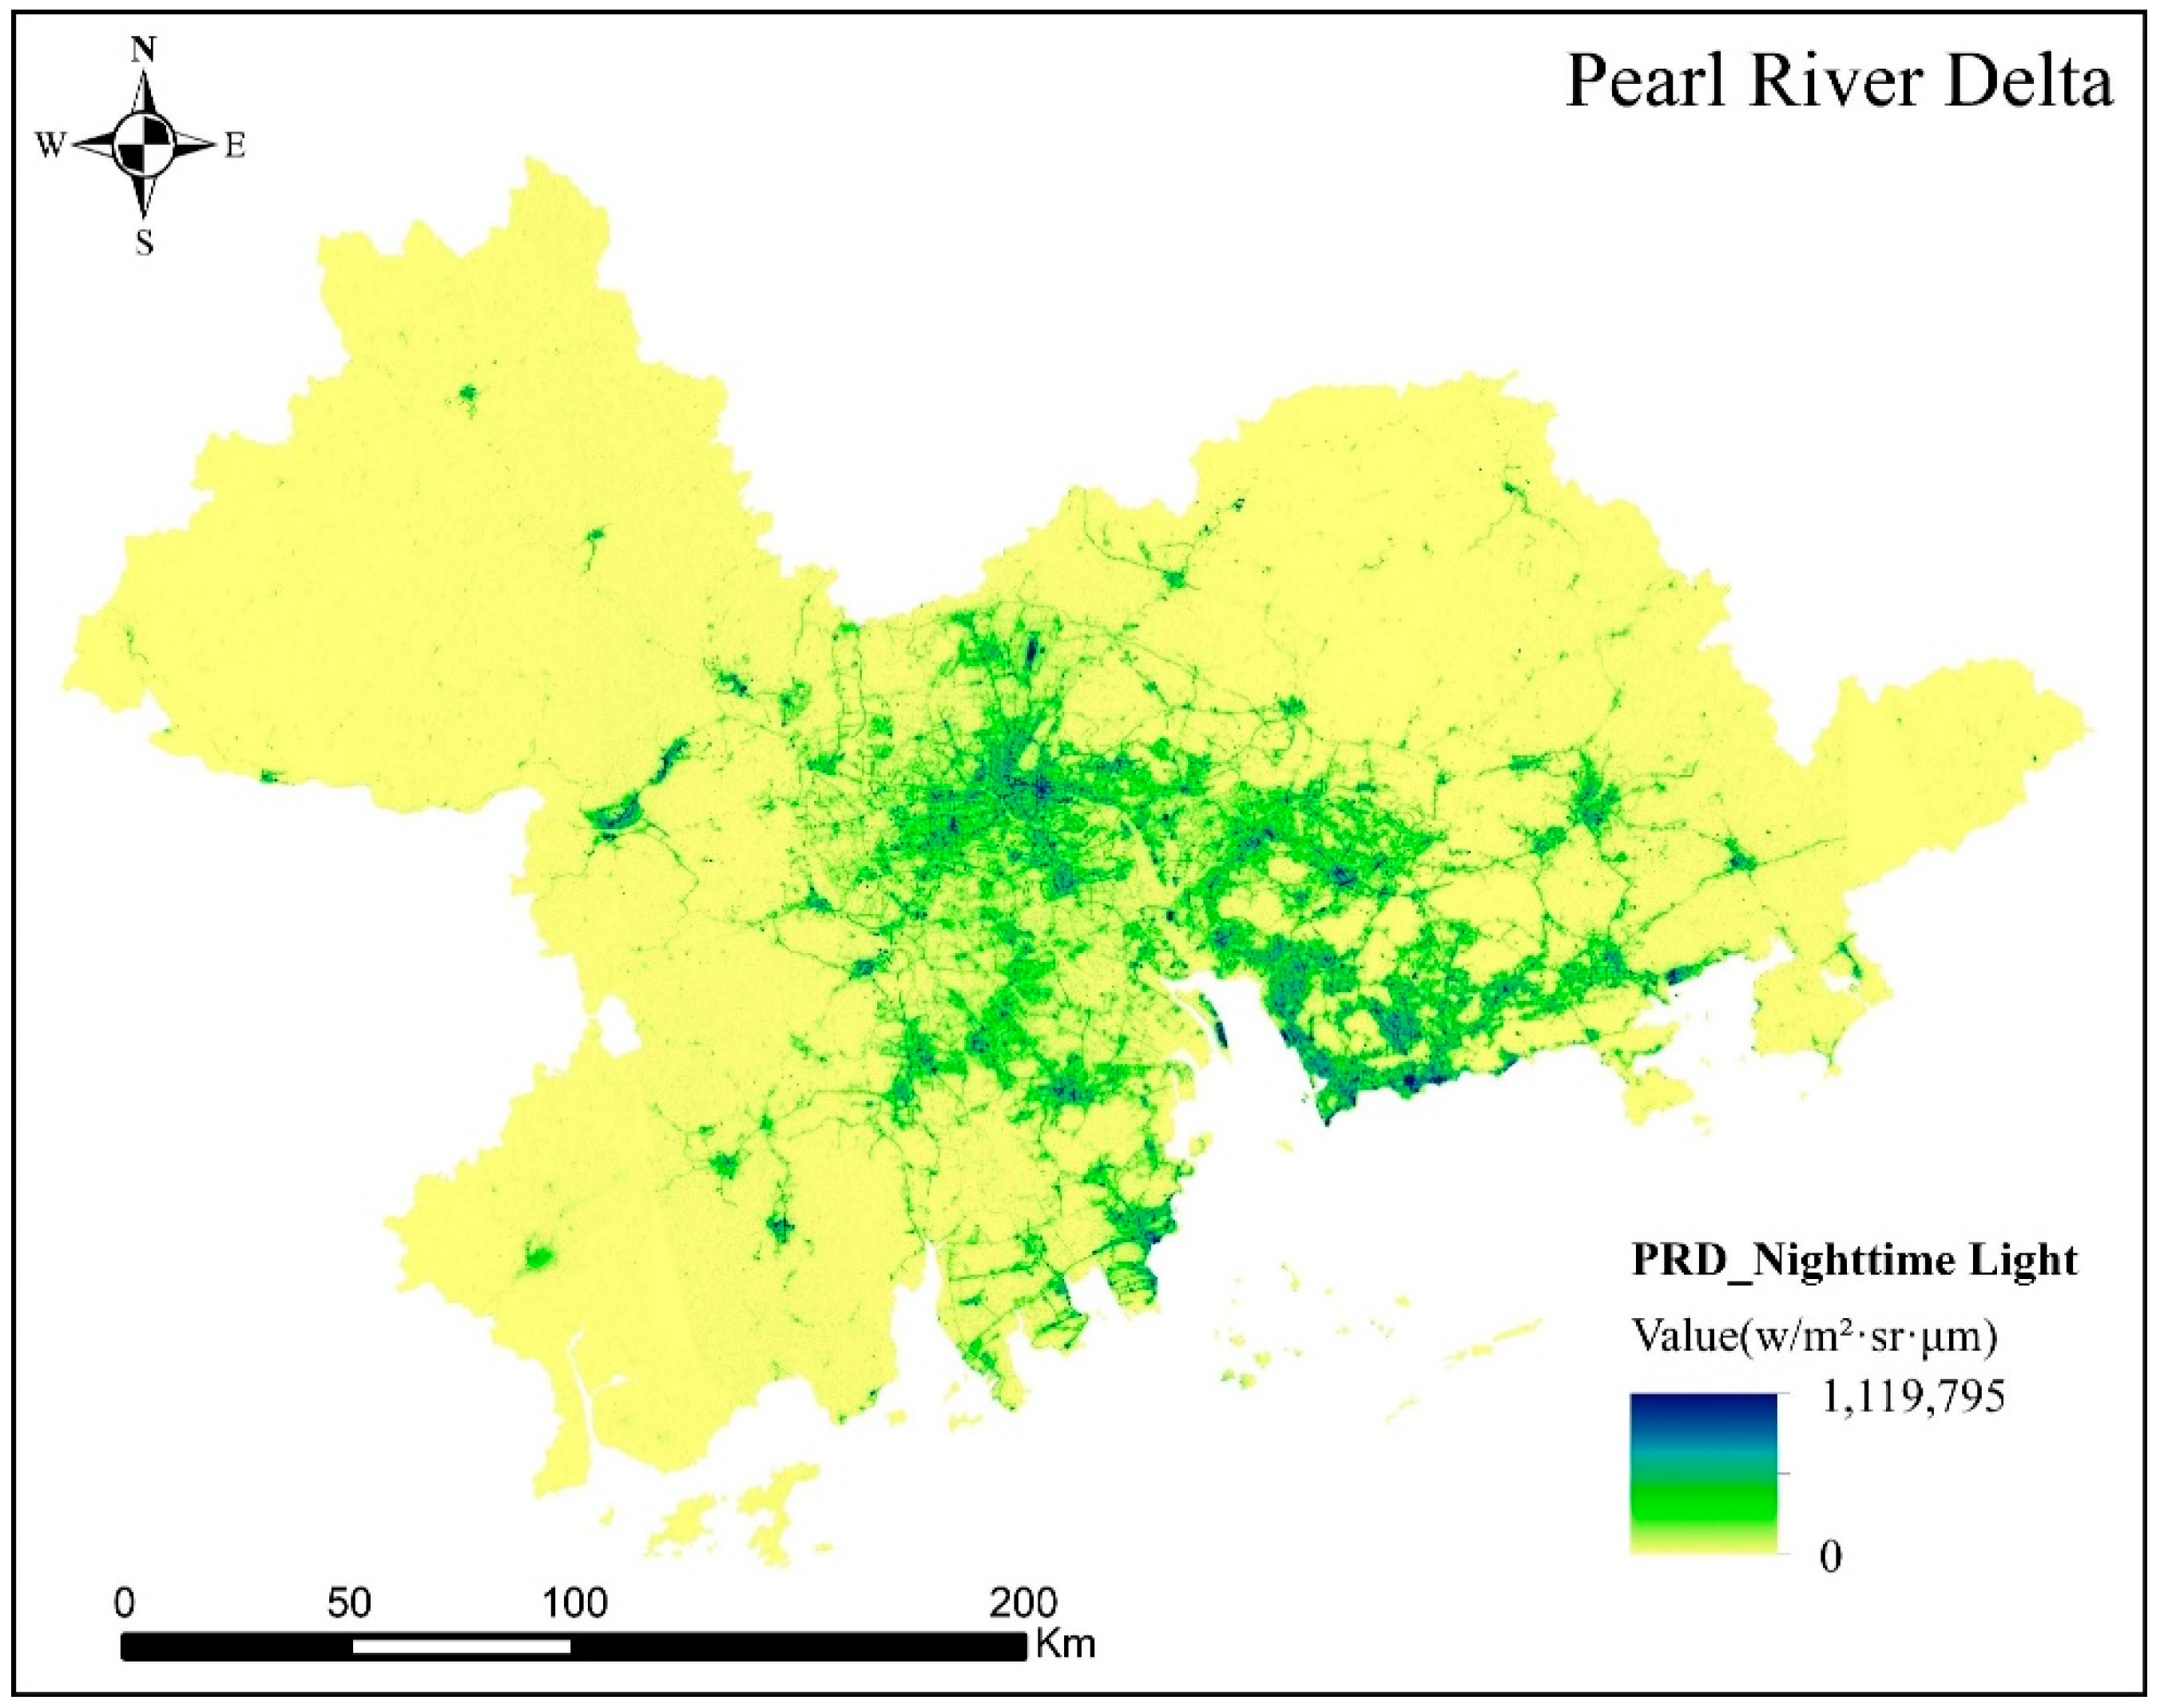
The Luojia-01 experimental satellite, developed by Wuhan University in 2018, can provide NTL data with a spatial resolution of 130 meters and a width of 260 km using a high-precision night light remote sensing camera [73,74]. Compared with the spatial resolutions of 1000 m for the NTL data from the Defence Meteorological Program Operational Line-Scan System and 500 m for that from the Suomi National Polar-orbiting Partnership/Visible Infrared Imaging Radiometer Suite, that of the Luojia-01 is significantly better, which makes the study of NTL data in large-scale geographic areas such as urban agglomerations more refined. We obtained PRD urban agglomeration data from October 2018 to March 2019 from the Luojia-01 data download website. Then, radiation correction and radiance conversion were performed on these data, followed by multi-period average processing to obtain the pre-process result of PRD night light, which is shown in Figure 2.

2.2.2. POI Data

As an abstract, virtual expression of each geographic entity in the urban space, POI data can generally be obtained from an electronic map [75]. Incorporating basic attributes such as name, latitude and longitude coordinates, category, address, etc., POI data are expressed as a point vector data set within the geographic information system, which can be used to express the density distribution of infrastructure within a city through spatial analysis and the calculation of data volume and aggregation degree. In this study, there were 22 categories and 3,103,761 quantities of POI data obtained for the PRD urban agglomeration in 2021 through the application programming interface of Amap. Since POI data directly obtained through the interface will contain some repeated and meaningless data, it was necessary to check, screen, check, filter, and clean the POI data. Finally, 2,201,753 POI data points were obtained from the PRD urban agglomeration, and the density distribution of the data is shown in Figure 3.

2.2.3. Tencent Migration (TMG) Data and Population Grid Data

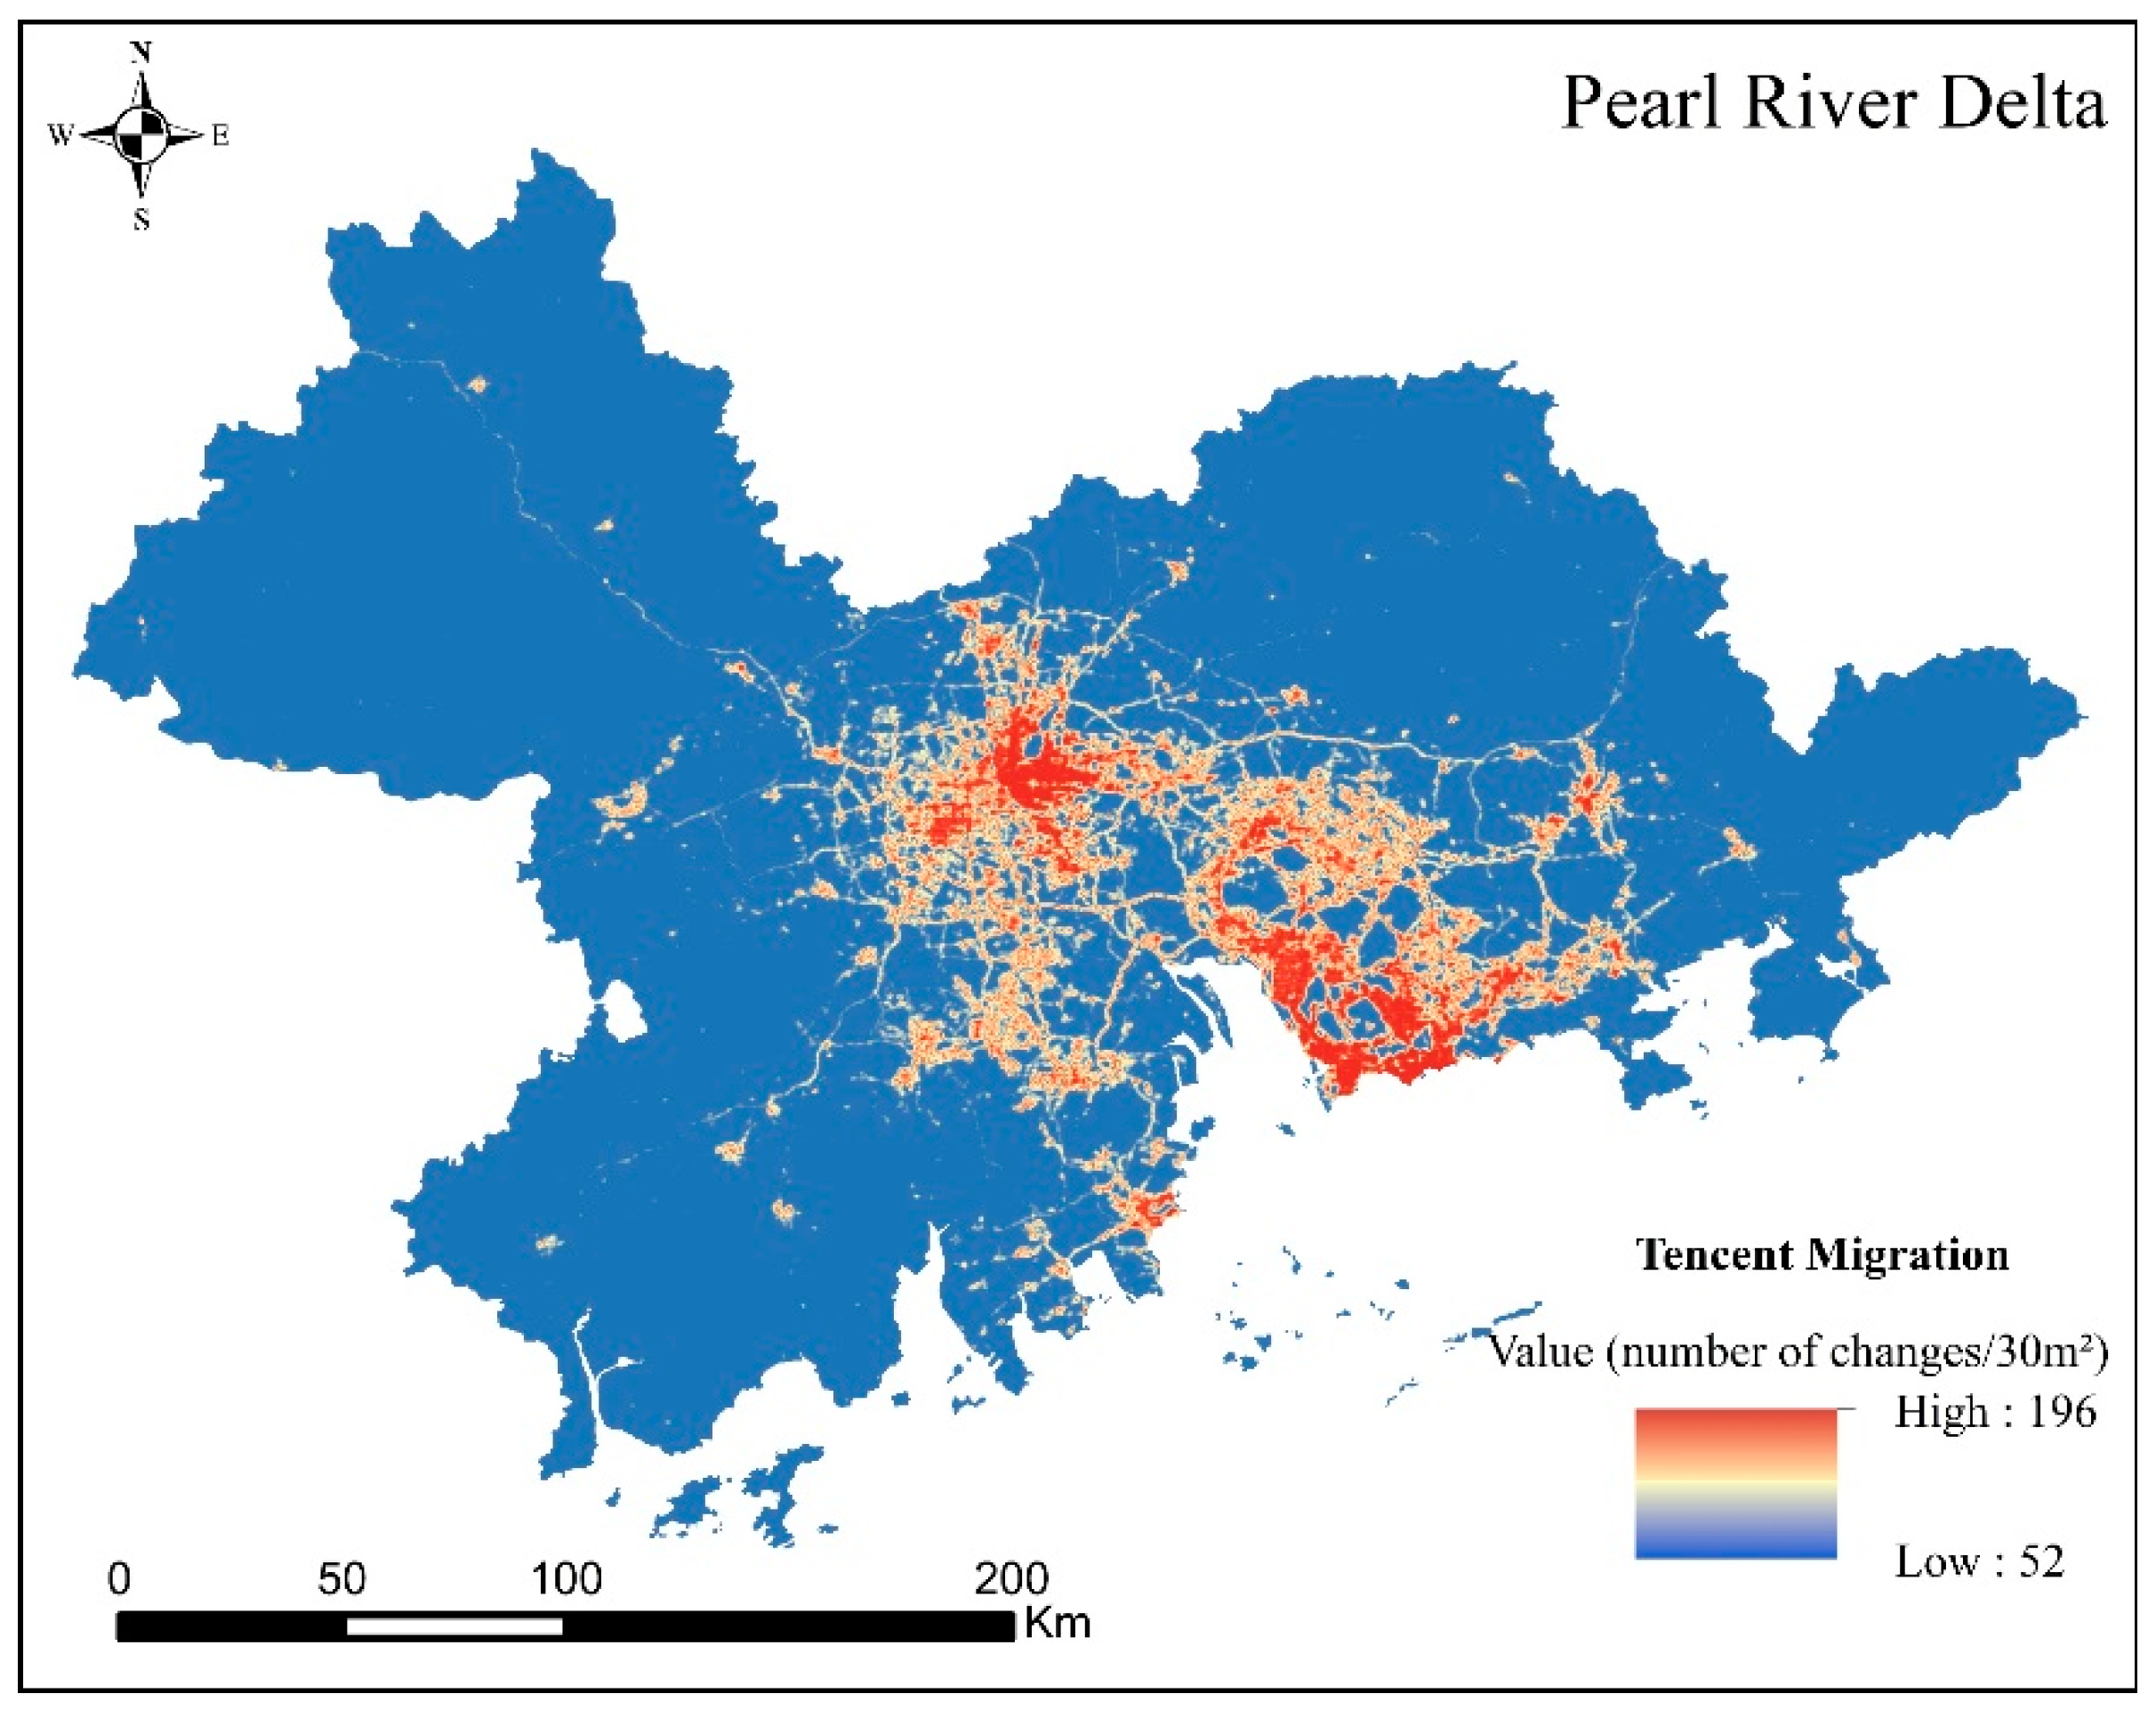
TMG data show the locations of users of the application affiliated with Tencent, expressed by different colors. Therefore, they reflect the movements and changes of the population over a certain period of time within a certain area [45], which means that TMG data offer an accurate representation of population migration in urban areas. In this study, the Tencent migration data for the PRD urban agglomeration from January 2020 to December 2020 were obtained using Amap for different time periods. The attributes of the Tencent migration data obtained in this study include the starting point, terminal point, longitude and latitude, population emigration quantity, population immigration quantity, and the ratio of different modes of migration transportation, and average processing was performed to obtain the population change in the PRD urban agglomeration (the population change is the amount of population moving in minus the amount of population moving out over a fixed period of time and within a given region.), as shown in Figure 4.

2.2.4. Grid Data of Population Spatial Distribution

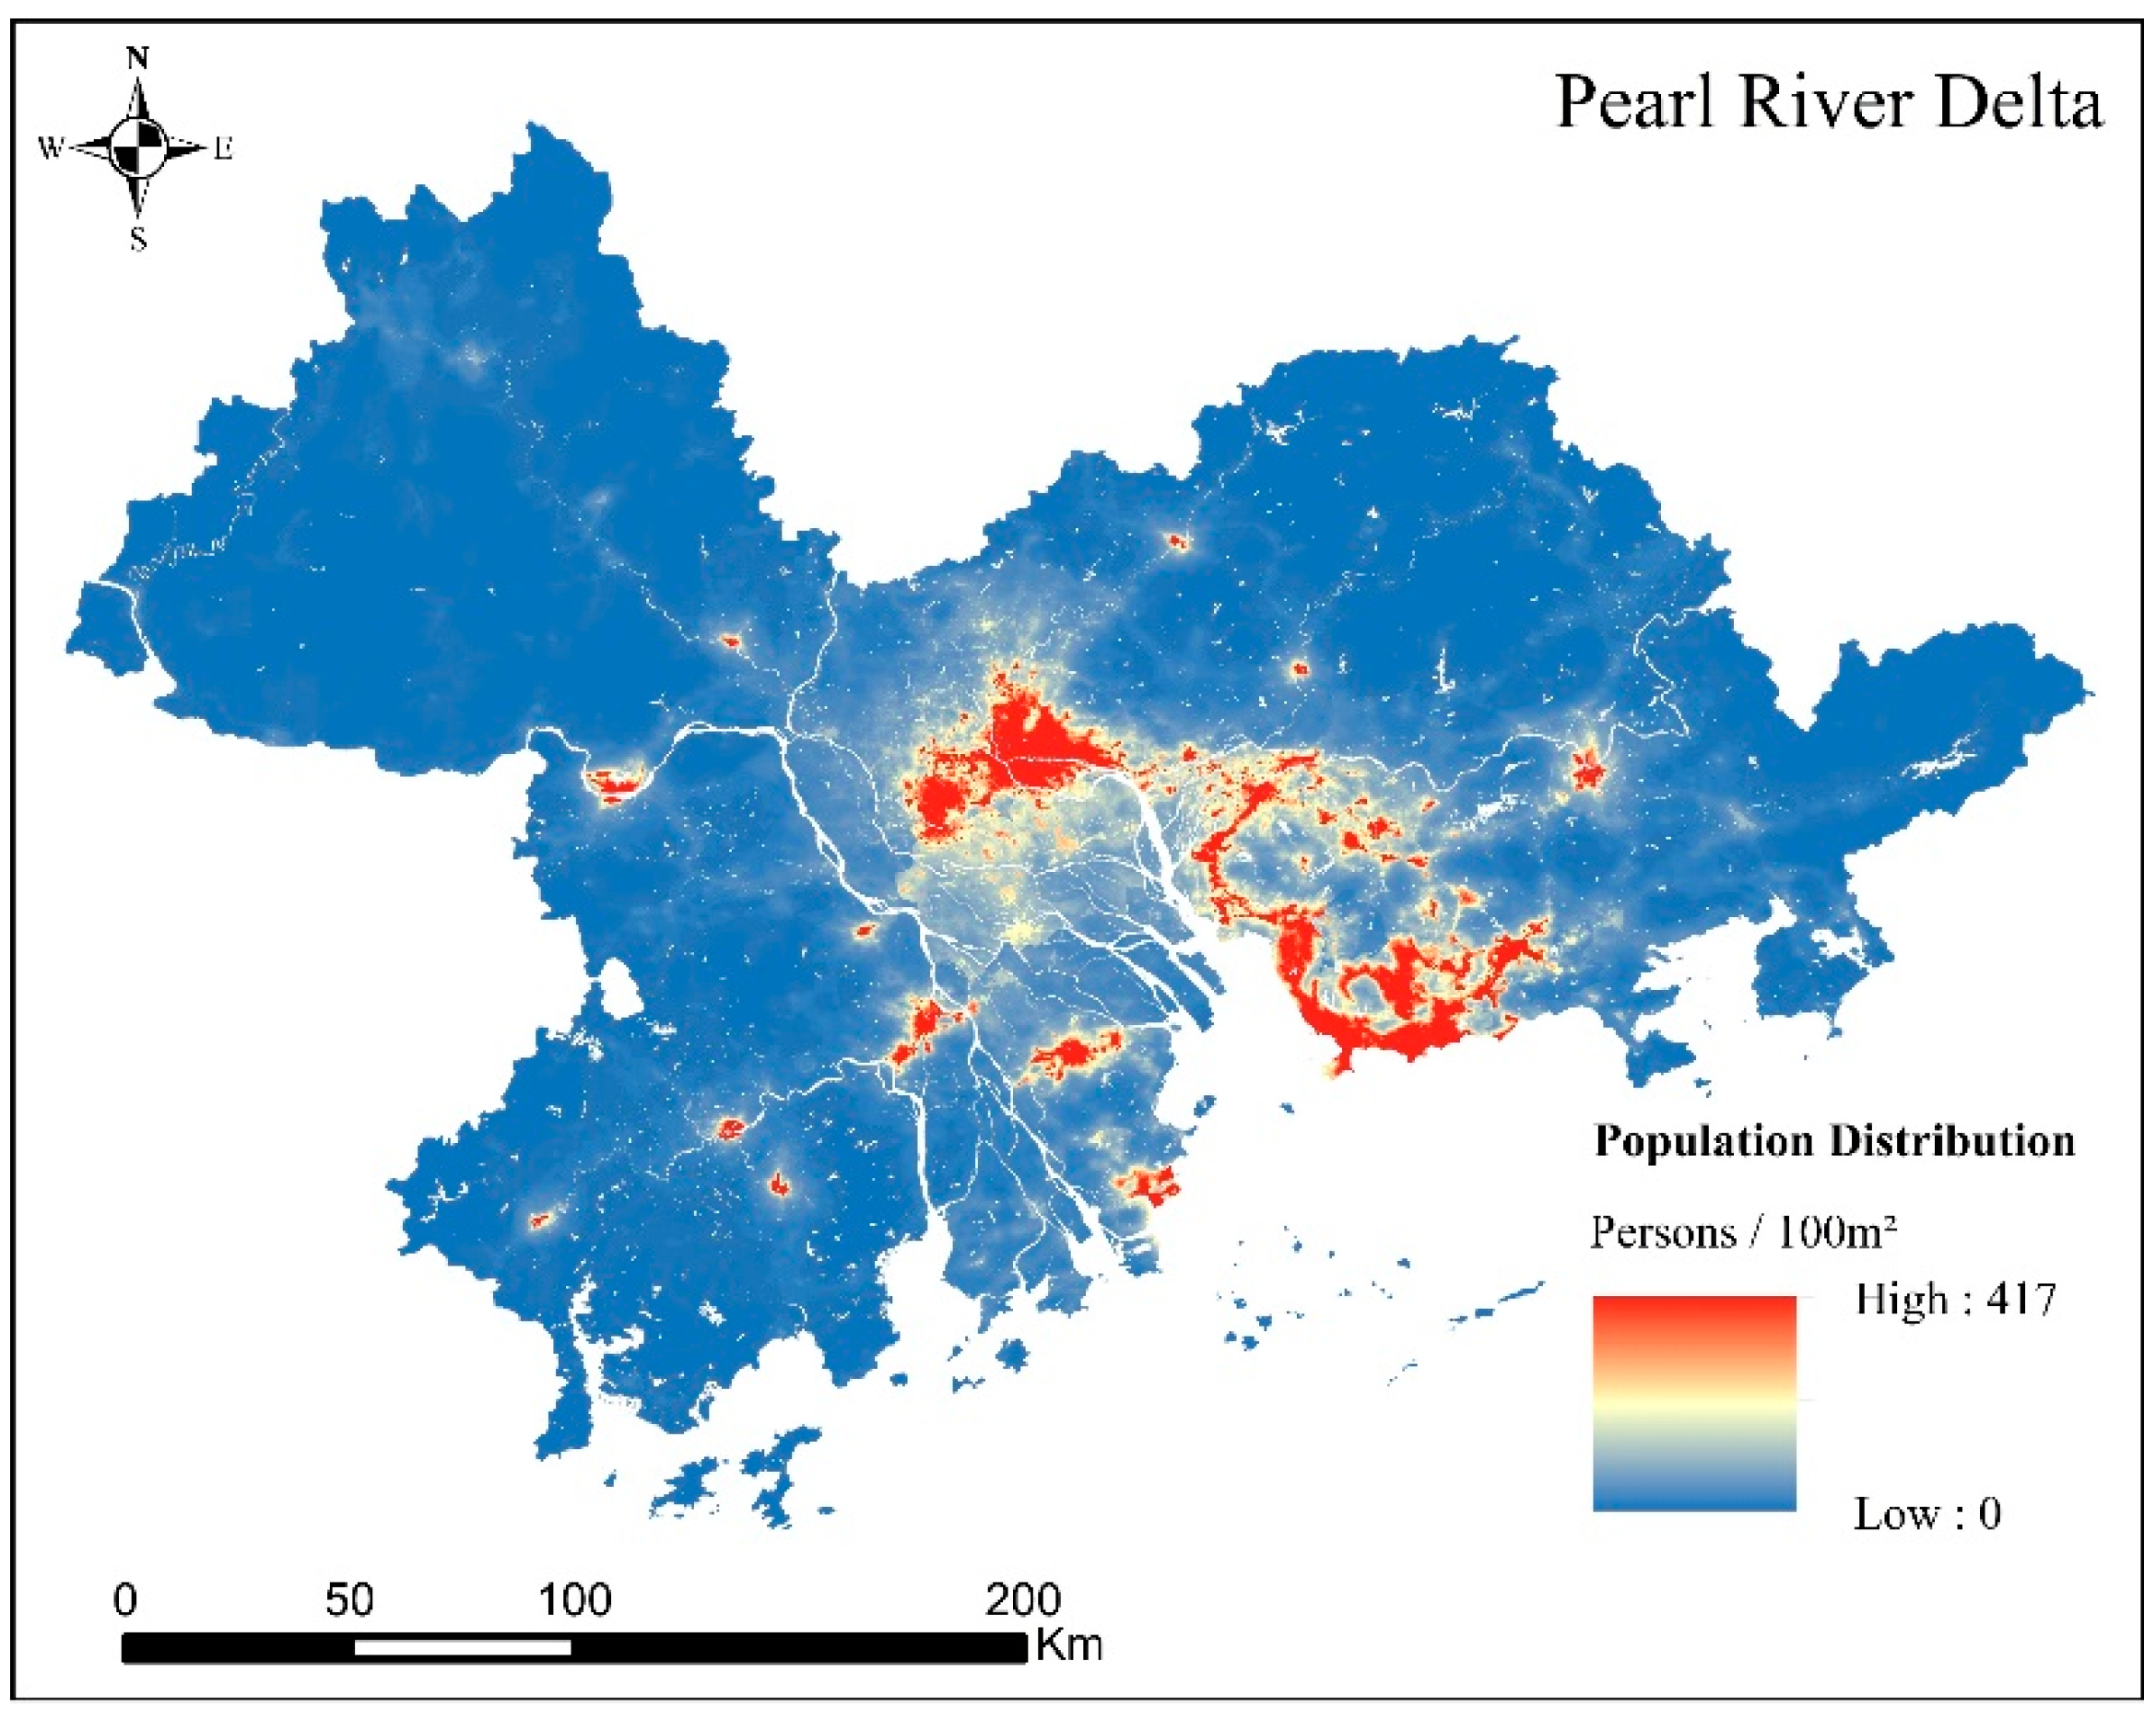
As for the population spatial distribution data, this was obtained by combining the census data of Guangdong Province at the end of 2020 with the land use and economic development data. Differently from the demographic data of administrative regions, the population spatial distribution data extend the population statistics data to the spatial scale, making them an important data source that can be used to assess urban spatial development. In this study, the statistical population data of Guangdong Province were used in combination with different characteristics of the region, and then the population density, traffic conditions, and digital elevation model of urban agglomeration were used conjunctly for correction. Finally, all the data were integrated into a 100 m grid to form a spatial distribution data graph for the population grid, as shown in Figure 5.

2.3. Methods

2.3.1. Data Fusion

The method and technical route of this study are shown in Figure 6.
Wavelet transform is an excellent algorithm for fusing different data [45]. As an image fusion algorithm on the pixel-scale, wavelet transform makes use of the relationship between time and frequency in different images to enlarge the local features of the image. In image transformation, wavelet transform can focus on and analyze part of an image through a "time-frequency" dynamic observation window, which means that wavelet transform can unify different images in the time and frequency domains from decomposition to fusion [76,77]. Therefore, wavelet transform can decompose the image into relatively independent parts in both the time domain and frequency domain while retaining the details of the original image, which can ensure that the best observation is derived after image fusion [54]. The formula of wavelet transform is as follows:
W T ( α , τ ) = f ( t ) φ ( t ) = 1 α f ( t ) + φ ( t b α ) d t
where f ( t )   is the signal vector of the image, φ ( t ) is the wavelet transform function, α is the wavelet transform scale, τ is the translation of the image signal, and b is the parameters.

2.3.2. Main Center Identification

The urban main center is the area with the highest population agglomeration characteristics within the urban space and is usually located in the center of a city. Moran’s I can reflect spatial autocorrelation (the potential interdependence between observation data of some variables in the same distribution area) and is widely applied to identify the main center of an urban city [78,79]. Moran’s I can be divided into global Moran’s I and Anselin local Moran’s I (LMI) [80]. The former generally reflects the spatial autocorrelation characteristics of spatial computing units [81], and the latter reflects the degree of autocorrelation between a single unit and other spatial units [82,83]. Therefore, LMI is used in this study to detect the main center of the Pearl River Delta urban agglomeration. The formula of LMI is as follows:
I i = x i x ¯ S 2 i j = 1 ,   j i n w i j ( x i x ¯ )
where I i is the statistical points of   i in LMI, w i j is the spatial weight matrix, x i is the attribute value of point i , x ¯ is the average value of all attribute values, and S i 2 is the variance of all the samples, whose formula is as follows:
S i 2 = j = 1 , j i n ( x i x ¯ ) 2 n 1
After normalizing the spatial weight matrix w i j , the following formula can be obtained:
i = 1 n j i n w i j = n
A positive value of I i indicates that i has neighbors with similar values; therefore, segment i and its neighbors can form a cluster. To identify all of the segments with statistically significant positive LMI values, a z-score is introduced. After introducing the Z score, statistics with similar I i values can be obtained, as follows:
Z ( I i ) = I i E ( I i ) V a r ( I i )
where E ( I i ) is
E ( I i ) = j = 1 , j i n w i j n 1
V a r ( I i ) = E ( I i 2 ) E ( I i ) 2
where the variable of LMI is the value after fusion of several different data of NTL, POI, and TMG data.

2.3.3. Subcenter Identification

The subcenter is an area with a high density of urban activities, although it is far from the main center of the city. From the perspective of geographic space, there is spatial correlation and spatial heterogeneity between urban centers and non-urban centers, and GWR can solve this problem by embedding geographical location into regression parameters. The results of GWR include standardized residuals, local R², condition numbers, and explanatory variable coefficients. Among which, standardized residuals were used to measure the reliability of coefficient estimates, while local R² was used to indicate the fit degree of the regression model, and the condition number was used to evaluate multicollinearity, the explanatory variable coefficient indicates the degree of influence of explanatory variable on urban center. Since the urban sub-center is a certain distance from the main center of the city and has a high urban activity density, after determining the standardized residual, the local R², and the condition number, the urban subcenter was determined by the size of the explanatory variable coefficient. As an area with high urban activity density and far from the main urban center, the urban subcenter can be determined by the size of the explanatory variable coefficient after determining the standardized residual, local R², and condition number. The formula of GWR is as follows:
y i = β 0 ( μ i , v i ) + j = 1 k β j ( μ i , v i ) x i j + ε i
where y i   stands for the density of urban activity, μ i , v i   stands for the spatial center, β 0 ( μ i , v i ) stands for the intercept, β k ( μ i , v i ) stands for the local estimation coefficient, and ε i stands for the residual value. Variables of GWR include dependent variables and explanatory variables, where the dependent variable is the calculated urban center value of LMI (geographically weighted dummy variables have been carried out to ensure that there is no multicollinearity), and the explanatory variable is the distance from the non-urban center value to the urban center calculated by LMI.

3. Results

3.1. Polycentric Spatial Structure of Urban Agglomerations Identified by Different Data

3.1.1. Polycentric Spatial Structure of Urban Agglomerations Identified by NTL Data

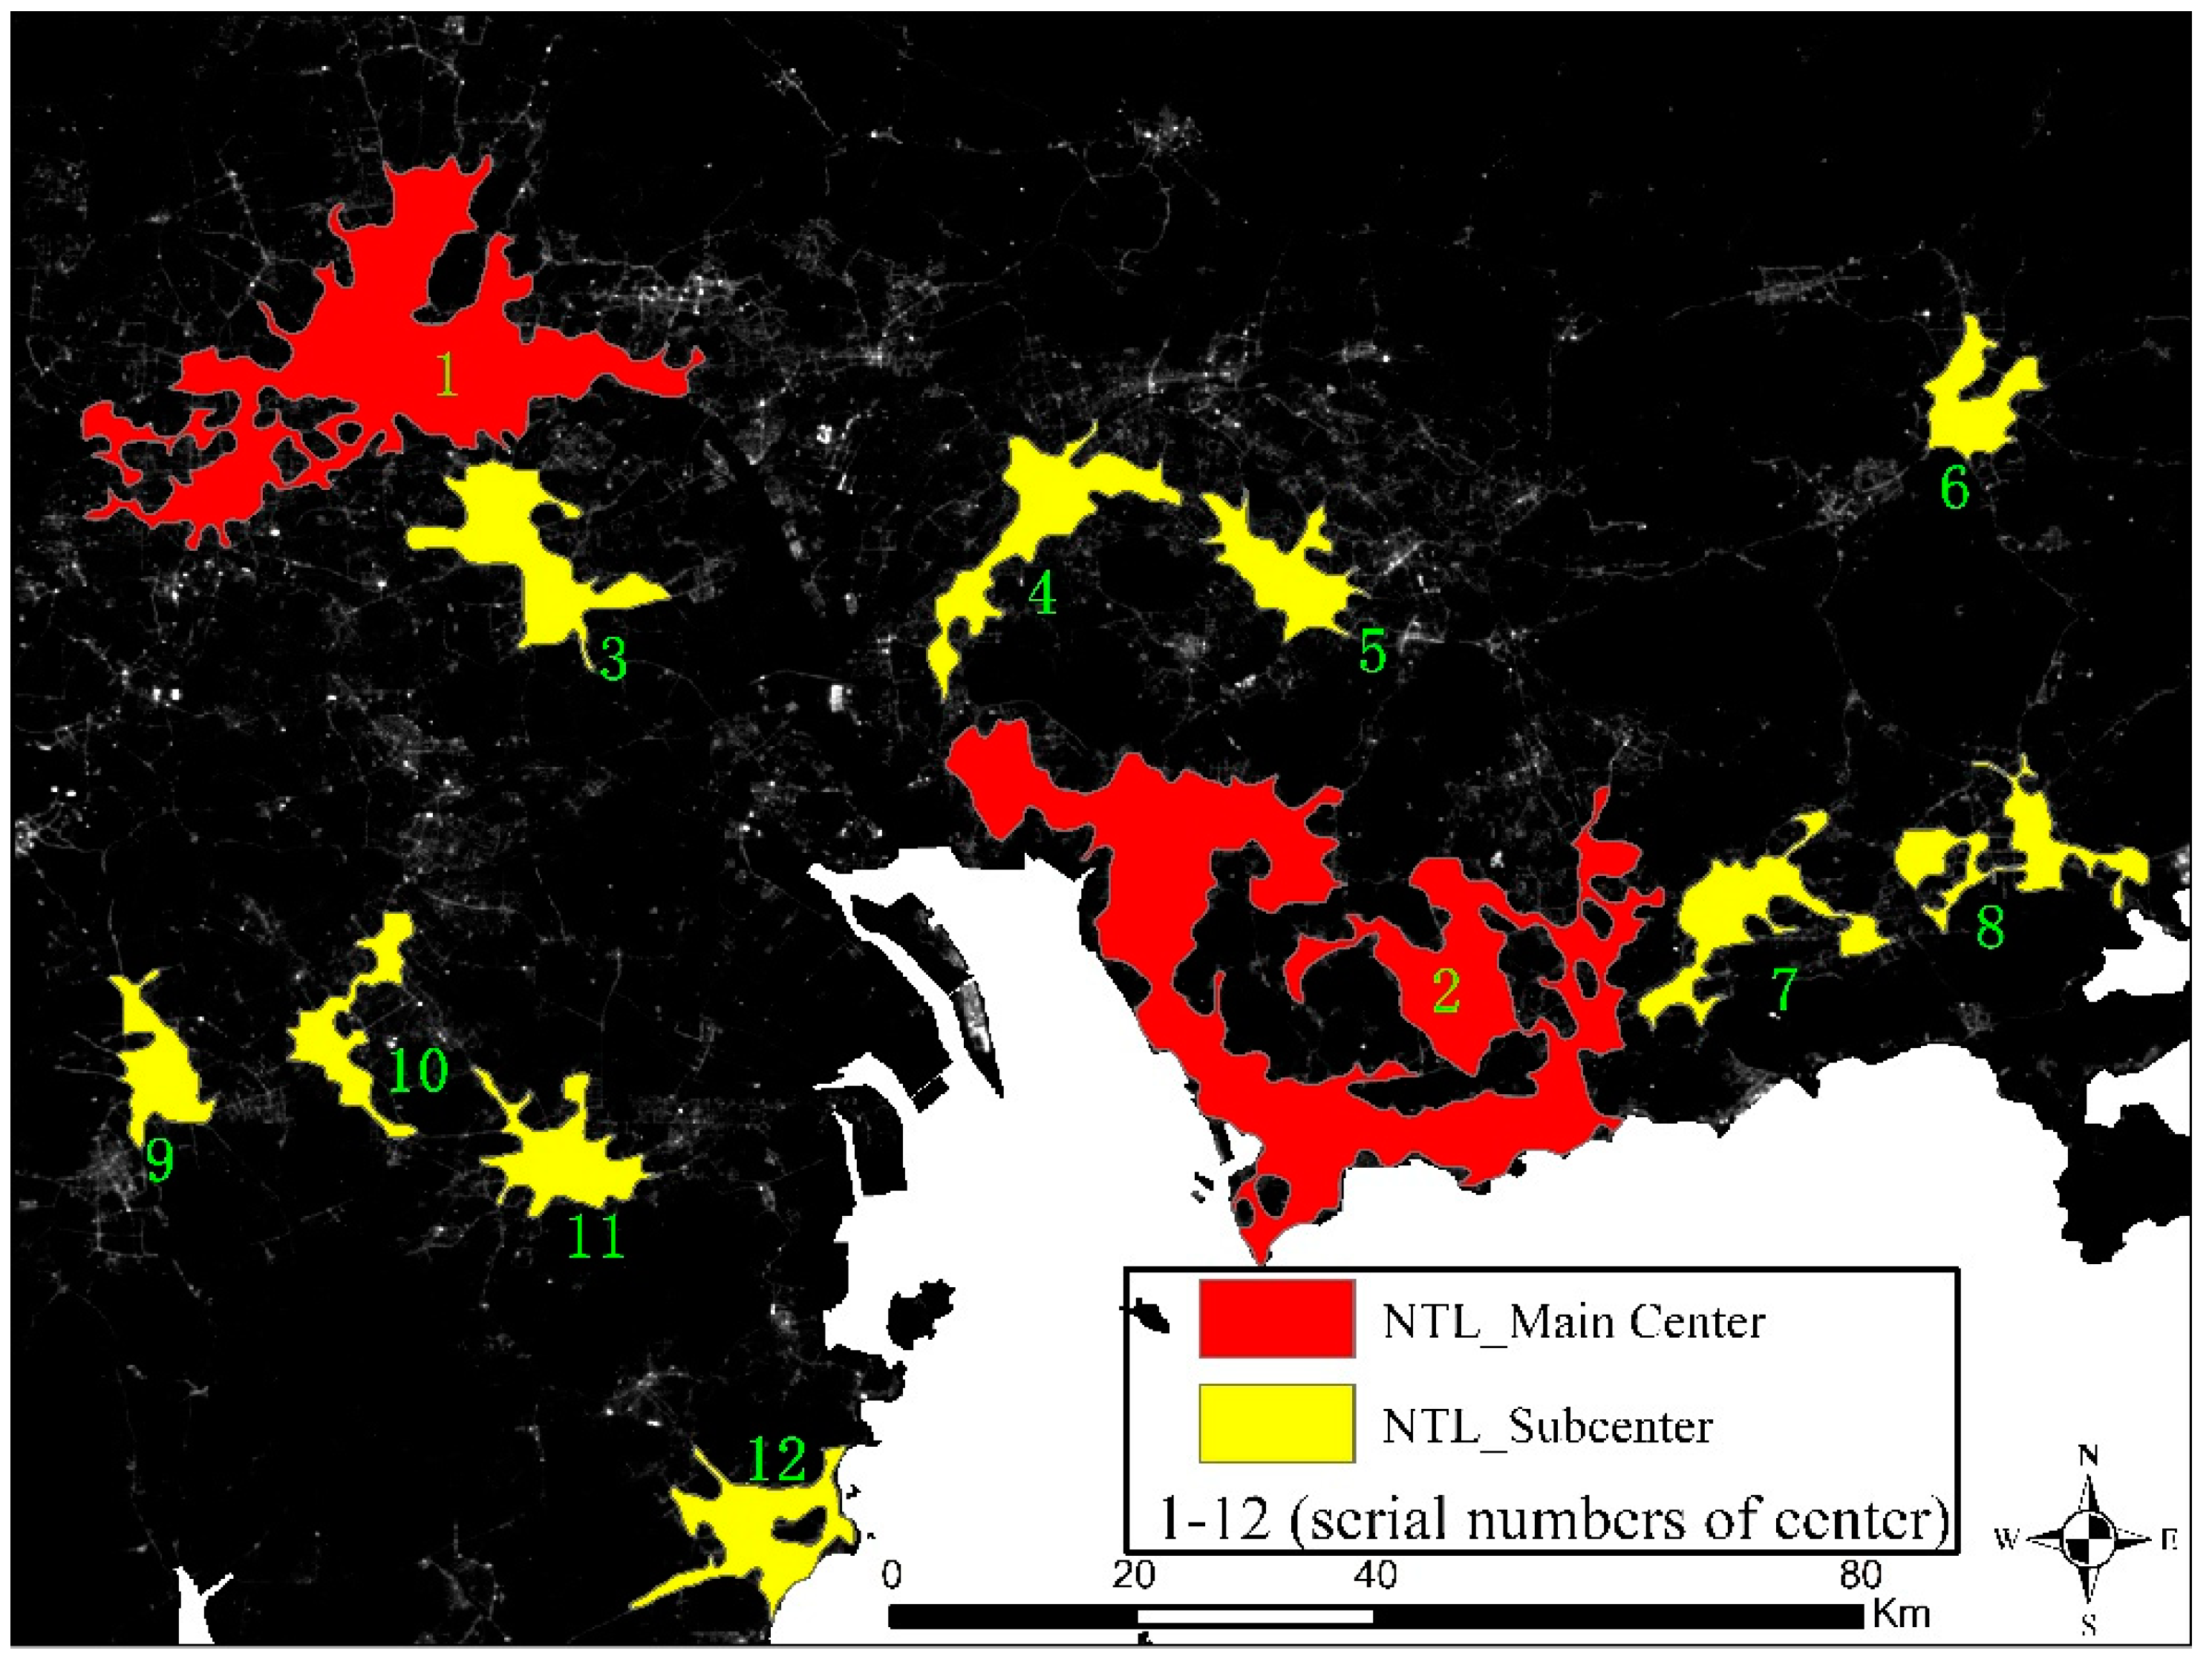
The results were analyzed based on the spatial resolution of the original data, which was more refined than the administrative boundary. It can be seen from the NTL image in Figure 2 that the highest NTL values were mainly distributed in Guangzhou and Shenzhen, while the lowest NTL values were in the east and west sides of the PRD, such as in Zhaoqing, Kaiping, and Huizhou. This shows that there were significant differences in the development levels within the PRD urban agglomeration. The main center of urban agglomeration, identified by the NTL data through LMI, is shown in Figure 7. Here, two main centers, Guangzhou and Shenzhen, were identified. The area of the main center is 1118.14 square kilometers, accounting for 2.65% of the total administrative area. However, after GWR analysis, 10 subcenters were obtained, excluding the 2 main centers of Guangzhou and Shenzhen. The subcenters were mainly distributed in Zhuhai, Huizhou, Jiangmen, and Zhongshan. The identified subcenters cover 686.29 square kilometers, accounting for 1.63% of the total administrative area.
By analyzing the urban main center and subcenters of the PRD as identified by NTL data, it can be found that Guangzhou and Shenzhen, as first-tier cities, play a dominant role in the development of urban agglomeration, and the areas of their main centers also far exceed those of other urban subcenters. Besides Guangzhou and Shenzhen, the subcenters are mainly distributed in the municipal city centers, such as Zhuhai and Zhongshan. On the whole, the numbers of main centers and subcenters of the PRD urban agglomeration identified by NTL data depend on the light value of NTL data, which means that areas with high brightness and concentration of light values were identified as urban centers, such as the administrative centers of cities, while areas with low light values, such as the mountainous areas on the east and west sides of the PRD, were not identified as urban centers.

3.1.2. Polycentric Spatial Structure of Urban Agglomerations Identified by NTL_POI (NP)

By comparing Figure 2 and Figure 3, it can be seen that the brightness value of NTL data gradually decreased from the urban center to the rural fringe, while the number of POI data points also shows an obvious downward trend from the center to the rural fringe. Therefore, it can be concluded that the higher the light value, the more concentrated the POI data in the region, which means that there is a strong spatial connection between NTL data and POI data.
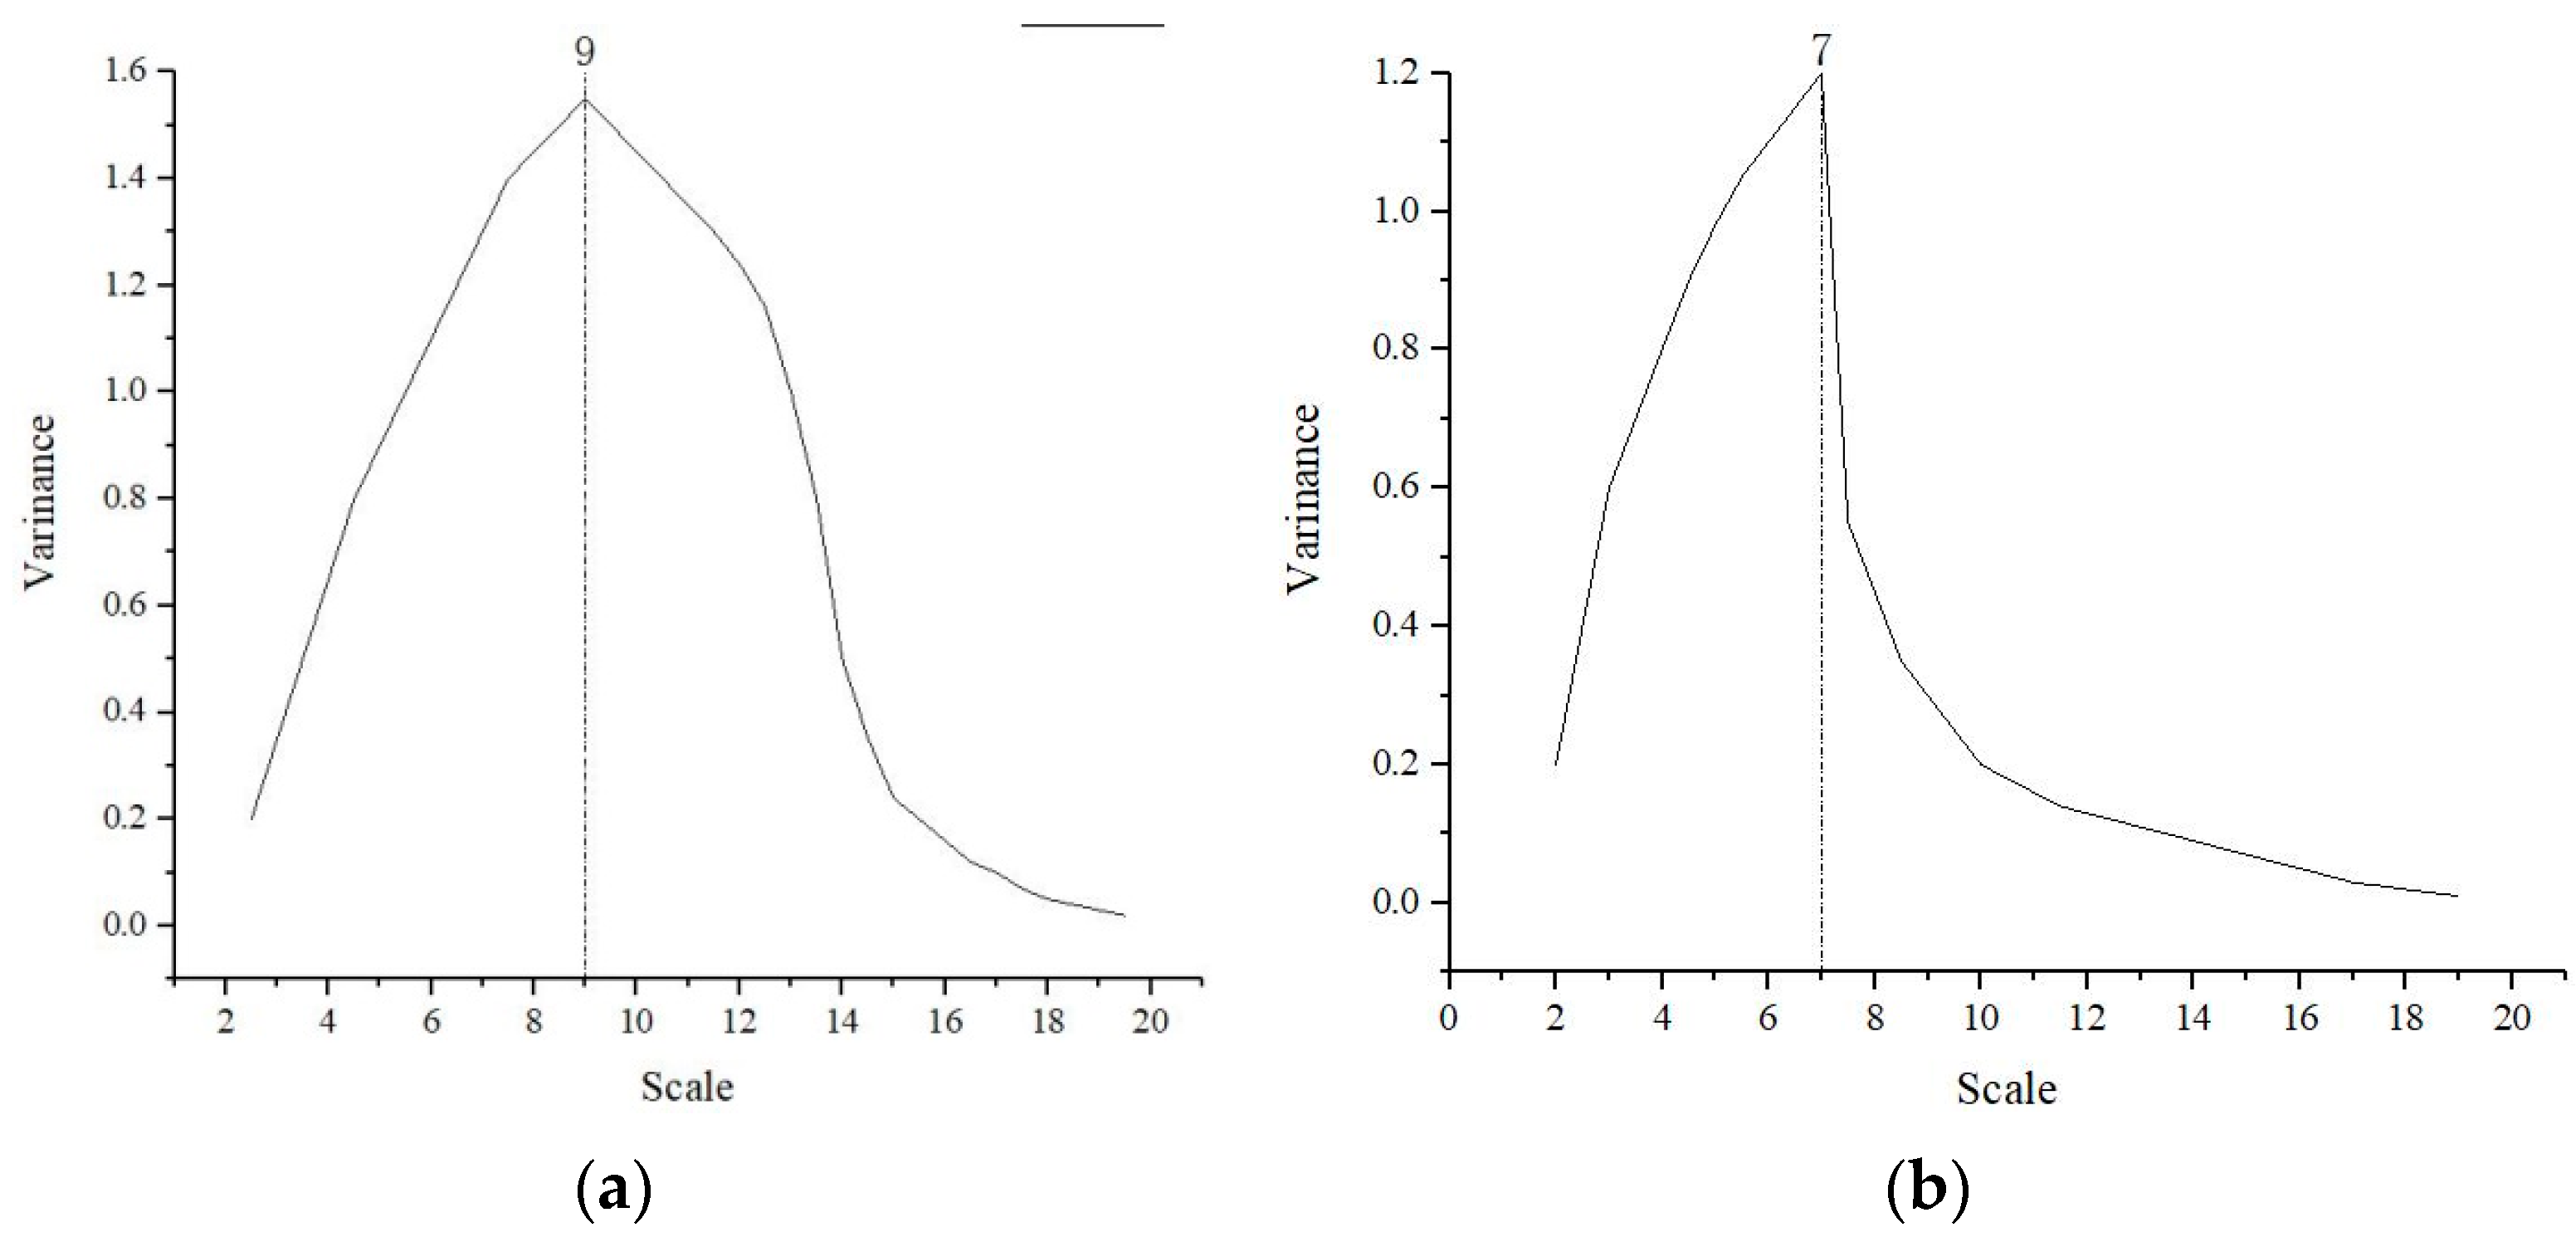
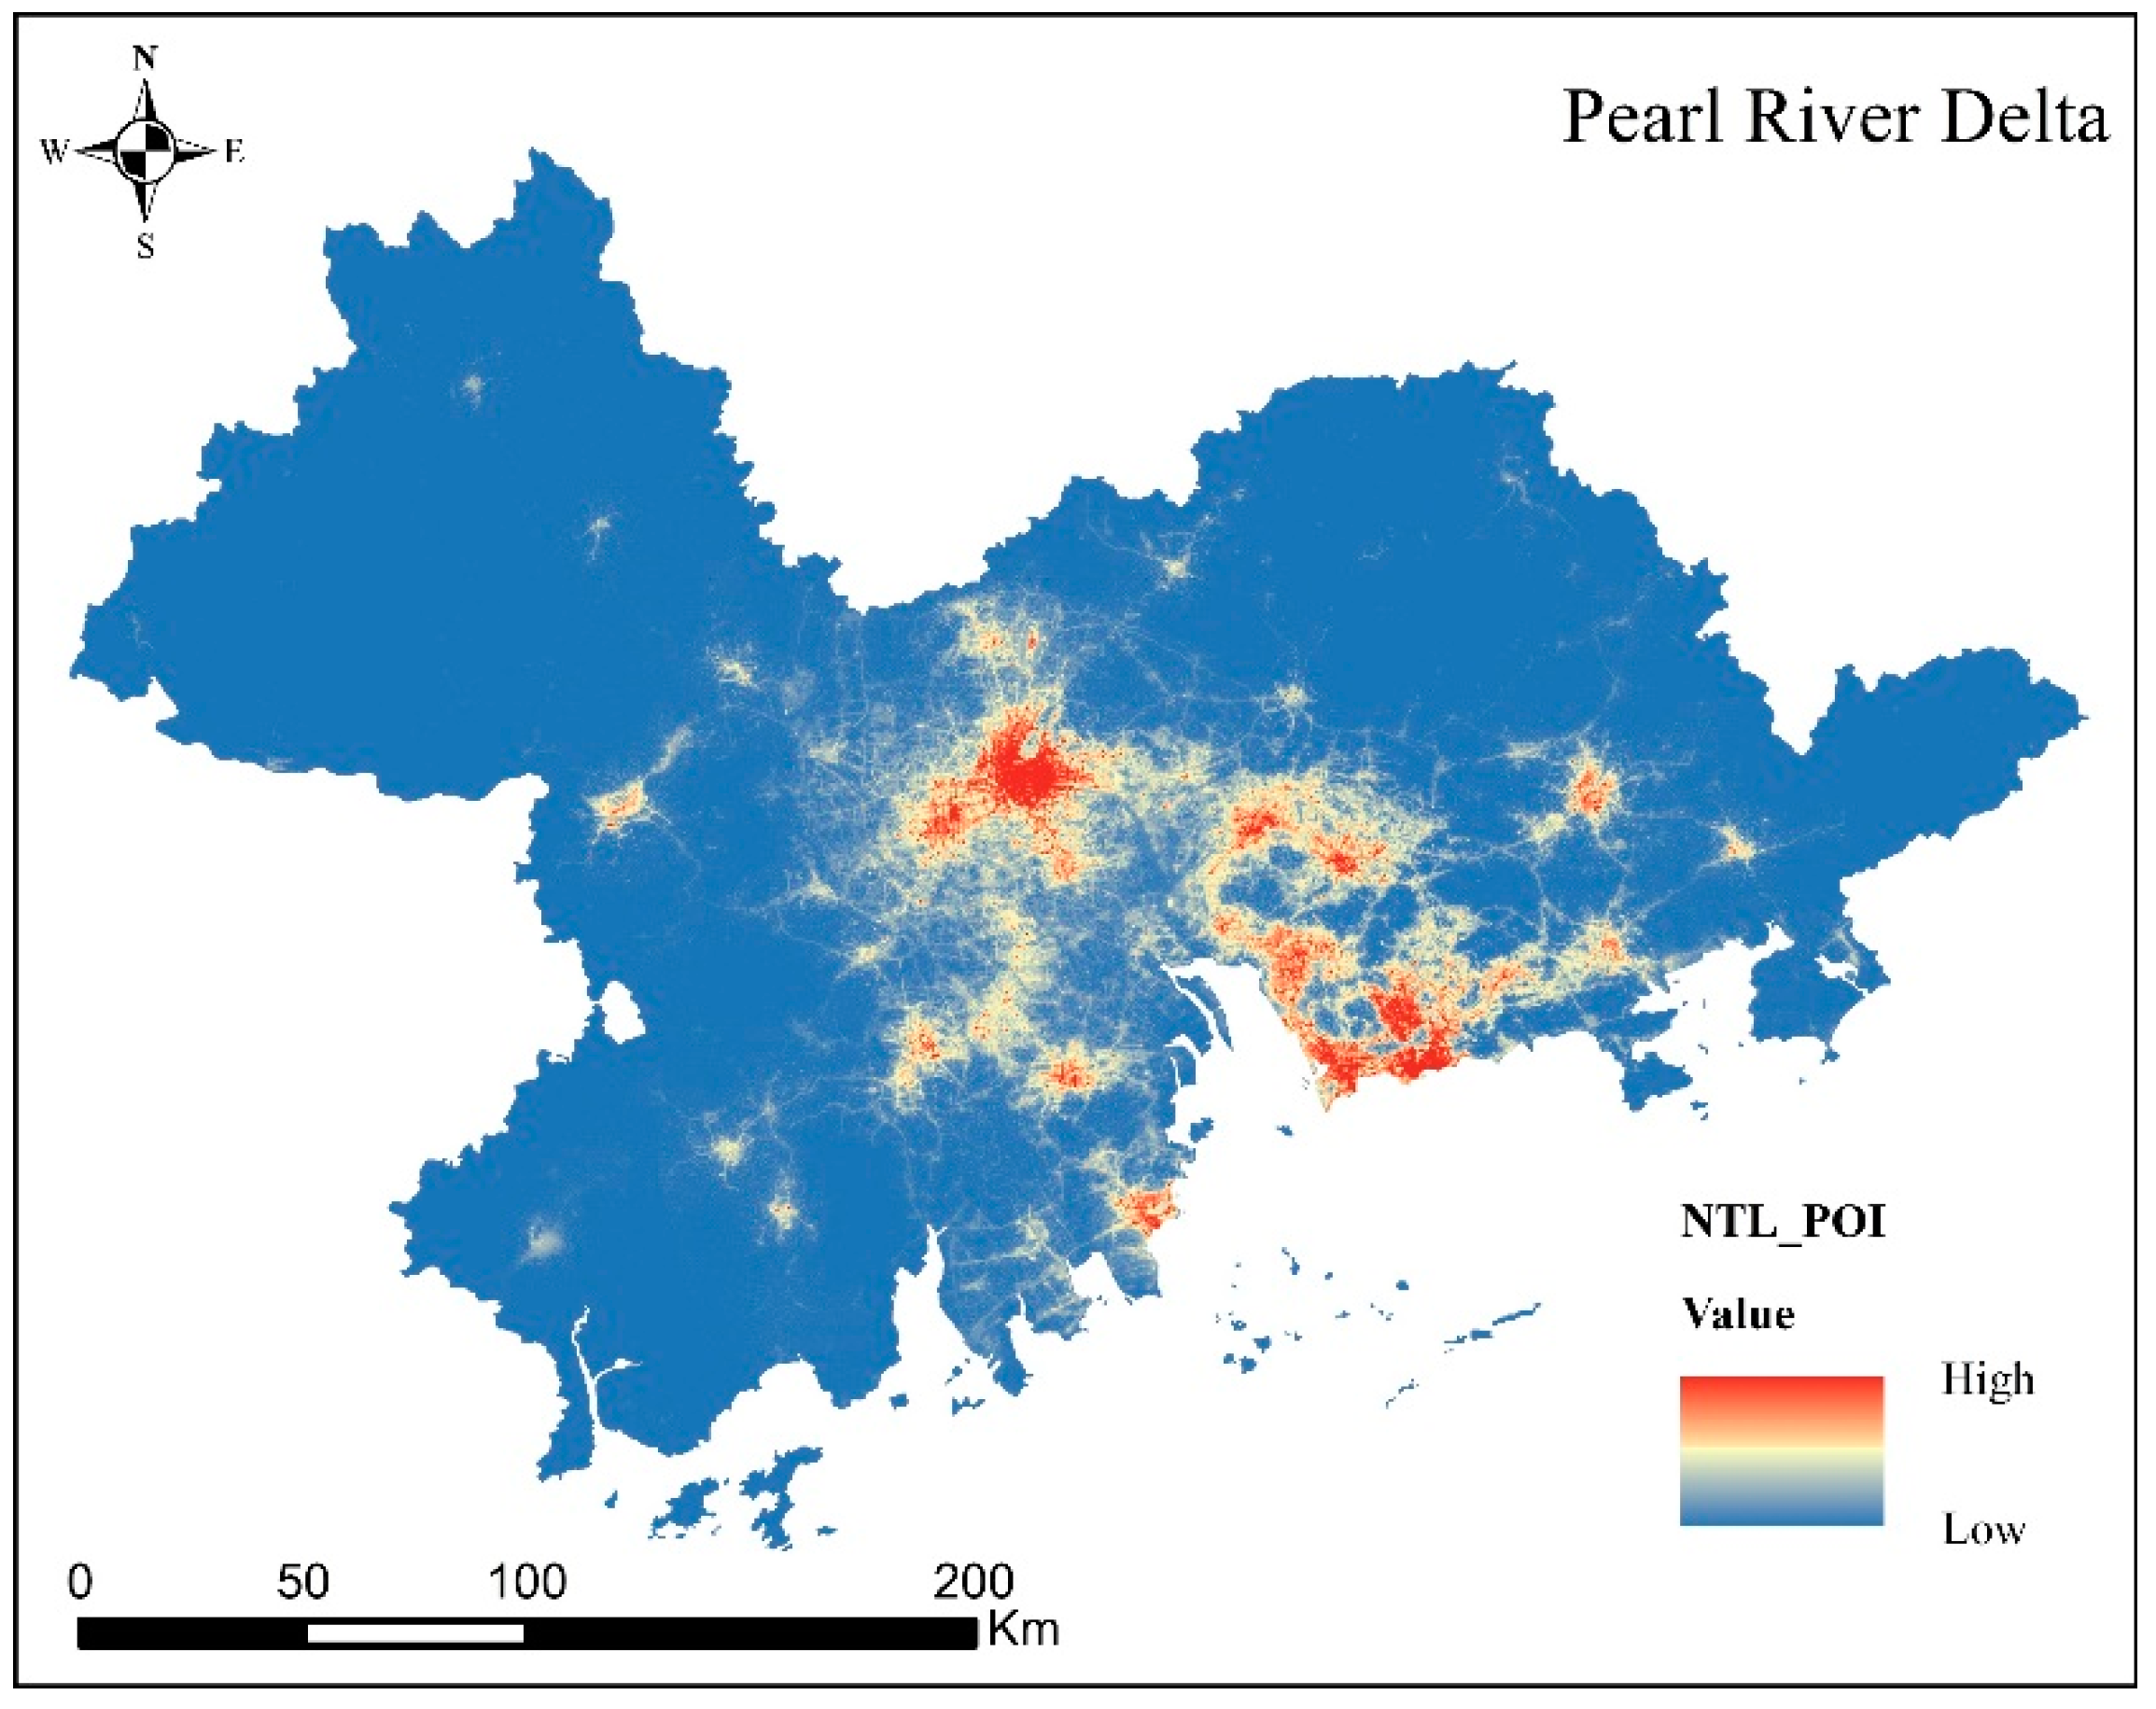
Wavelet transform highlights the characteristic parts of different original images through a time-frequency window, given that characteristic parts correspond to the absolute value of the wavelet coefficient. This means that in the wavelet transform, as long as the absolute value of the wavelet coefficient is maximized, the featured parts of the transformed image will be obvious [84]. As can be seen in the coefficient variance diagram of the wavelet transform, Figure 8a, the optimum scale for the fusion of NTL and POI data is 9. The fused diagram is shown in Figure 9. It can be seen from the figure that the highest values of NP (NTL_POI) were mainly concentrated in Guangzhou, Foshan, Shenzhen, Zhuhai, and some other places, among which Guangzhou and Foshan, and Shenzhen and Dongguan, showed trends of integration. There were also more high values in other municipal administrative regions, which was more representative of the current situation of urbanization in the PRD [85].
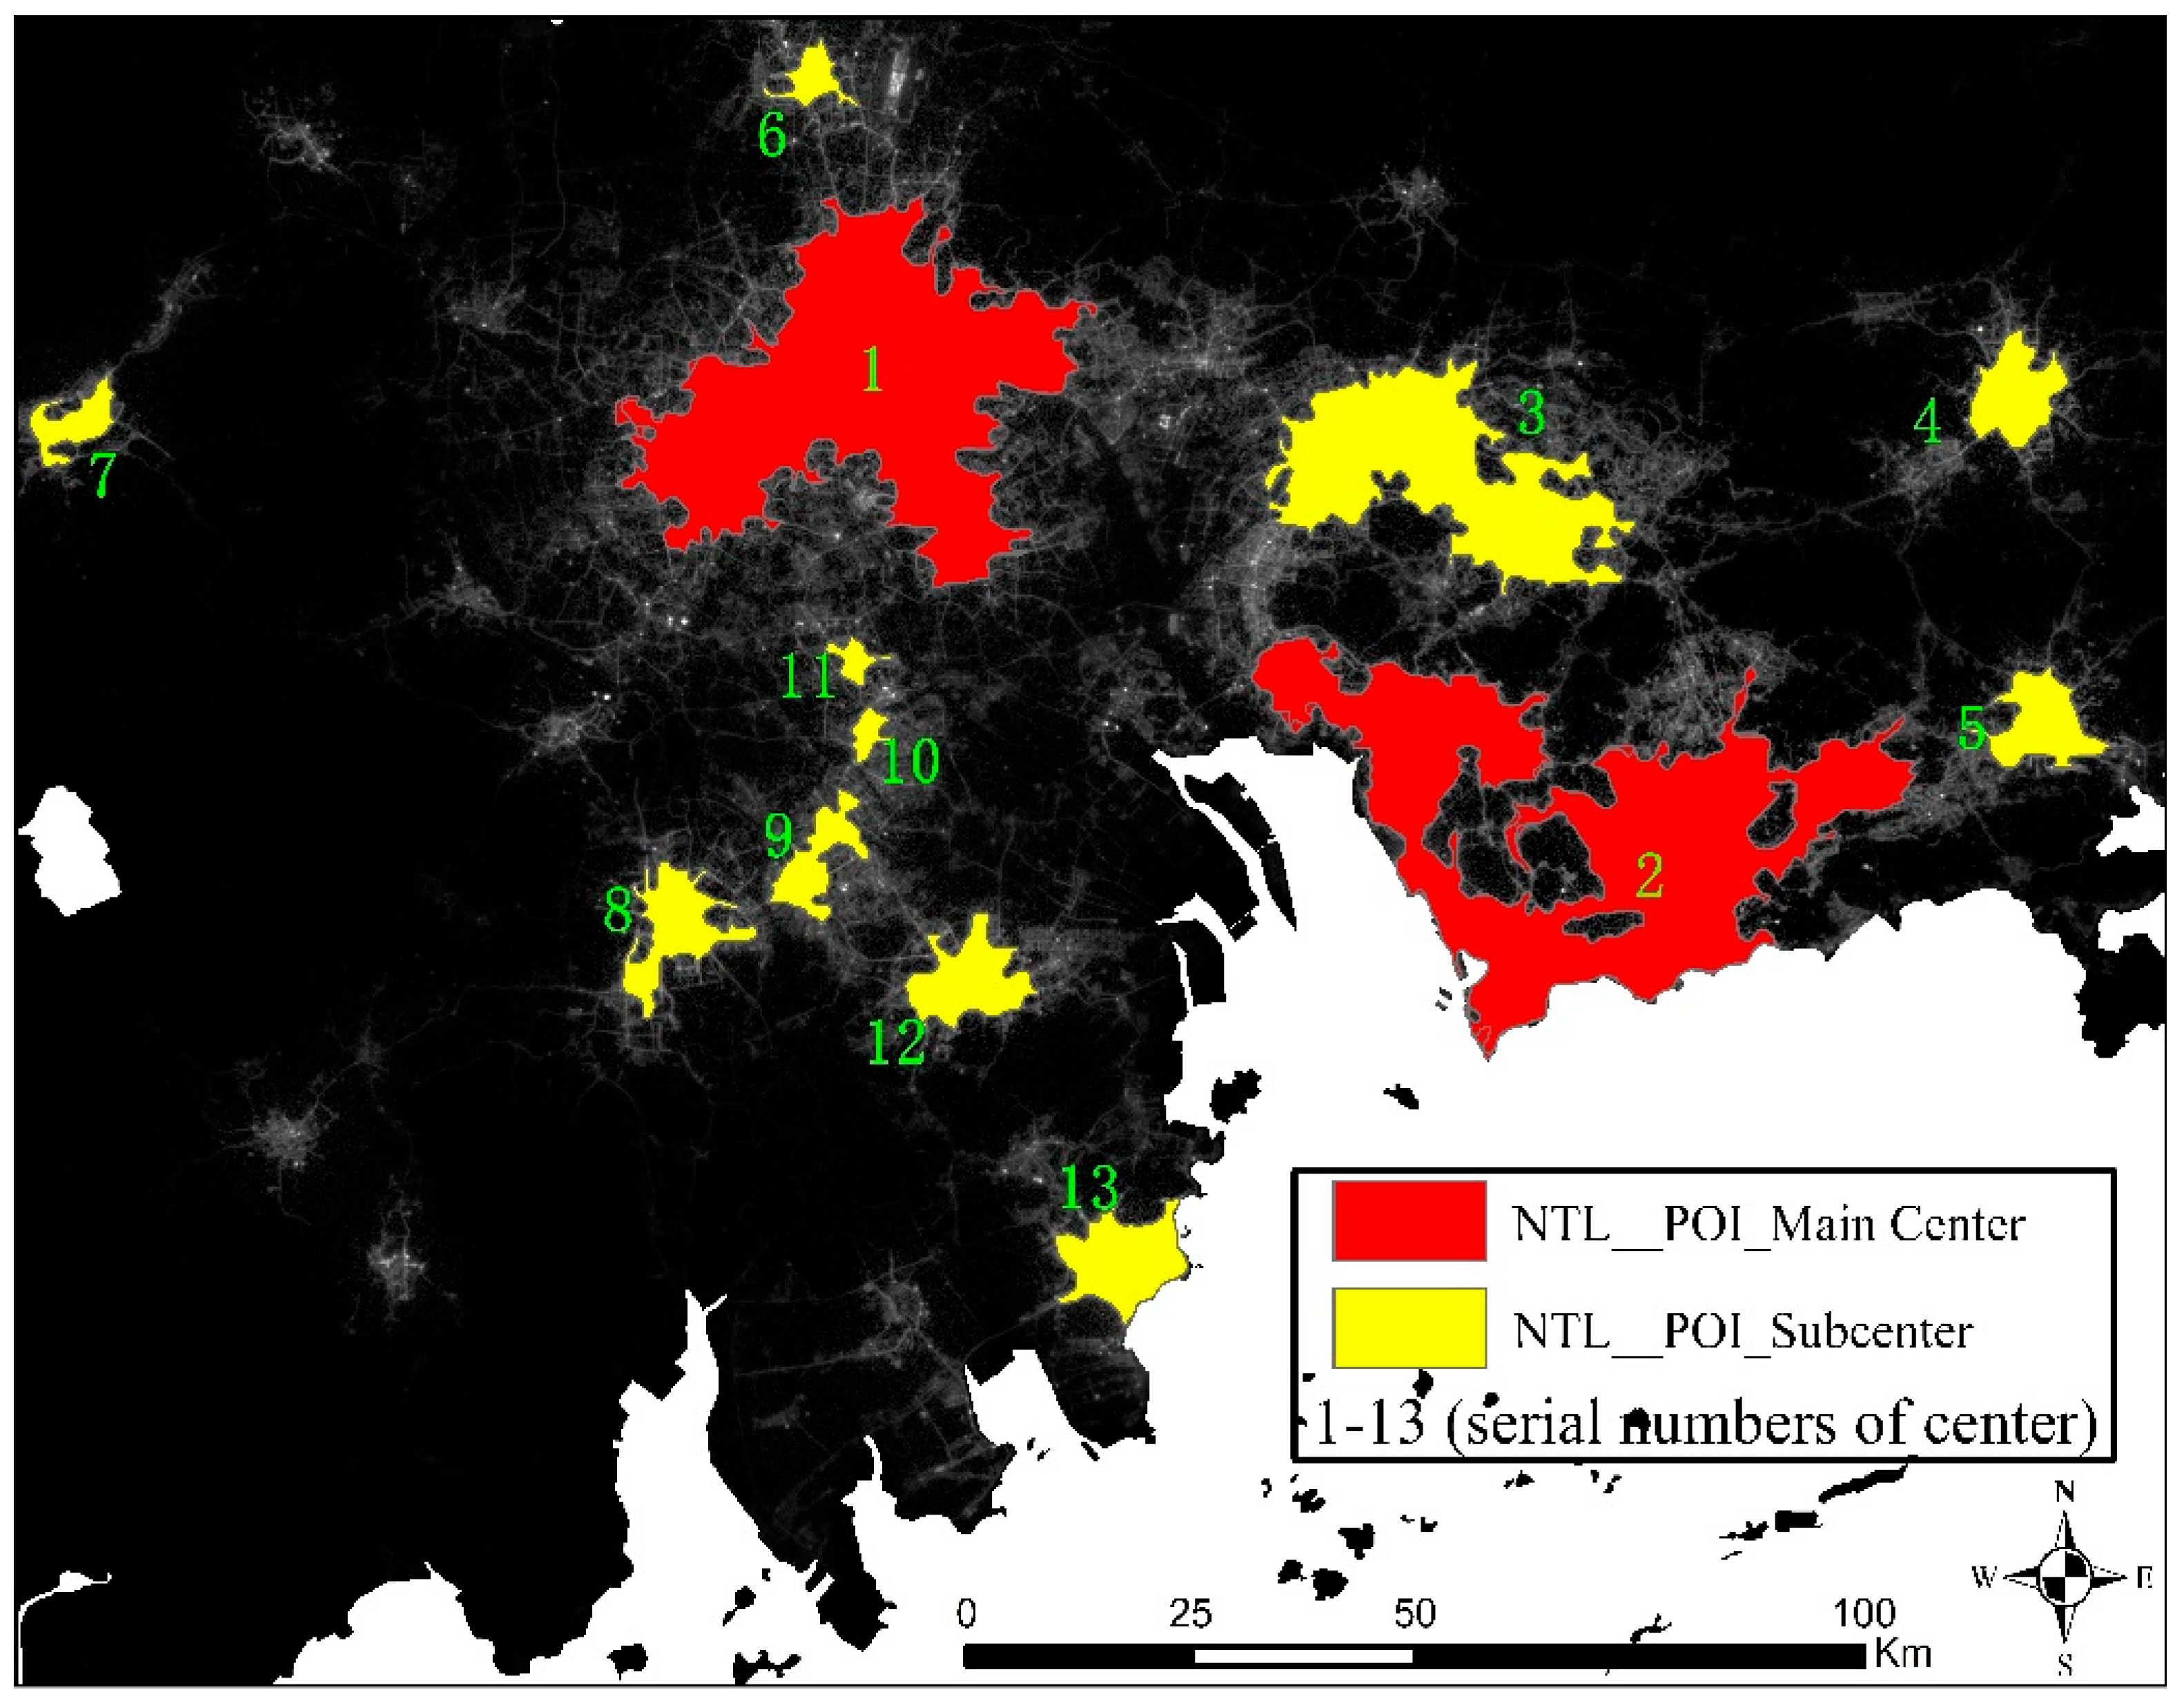
By analyzing the urban main center of the PRD, as identified by LMI Figure 10, two main centers were identified, Guangzhou and Shenzhen, with an area of 1913.36 square kilometers, accounting for 4.53% of the administrative area. Foshan and Dongguan were identified as the main center of the city by LMI, which differs from the main center identified by NTL data, due to the integrations of Guangzhou and Foshan, and Shenzhen and Dongguan. After carrying out the GWR analysis, 11 subcenters were identified besides Guangzhou and Shenzhen. The identified subcenters occupy a total area of 1001.73 square kilometers, accounting for 2.37% of the administrative area. The Shunde subcenter was identified by NP, which differs from the result of the NTL data.
It can be concluded that the main centers and subcenters identified by NP after fusing with POI data were basically the same as those identified by NTL data, with Guangzhou and Shenzhen as the urban main centers and Dongguan and Zhuhai as the subcenters. However, compared with the main centers and subcenters identified by NTL data, the scopes and areas of the main centers and subcenters identified by NP were expanded. Furthermore, there were trends of integration between Guangzhou and Foshan, and Dongguan and Shenzhen. NP further helps identify the development state of urban infrastructure by identifying the main centers and subcenters, which accurately reflects the development of the PRD urban agglomeration.

3.1.3. Polycentric Spatial Structure of Urban Agglomerations Identified by NTL_POI_TMG (NPT)

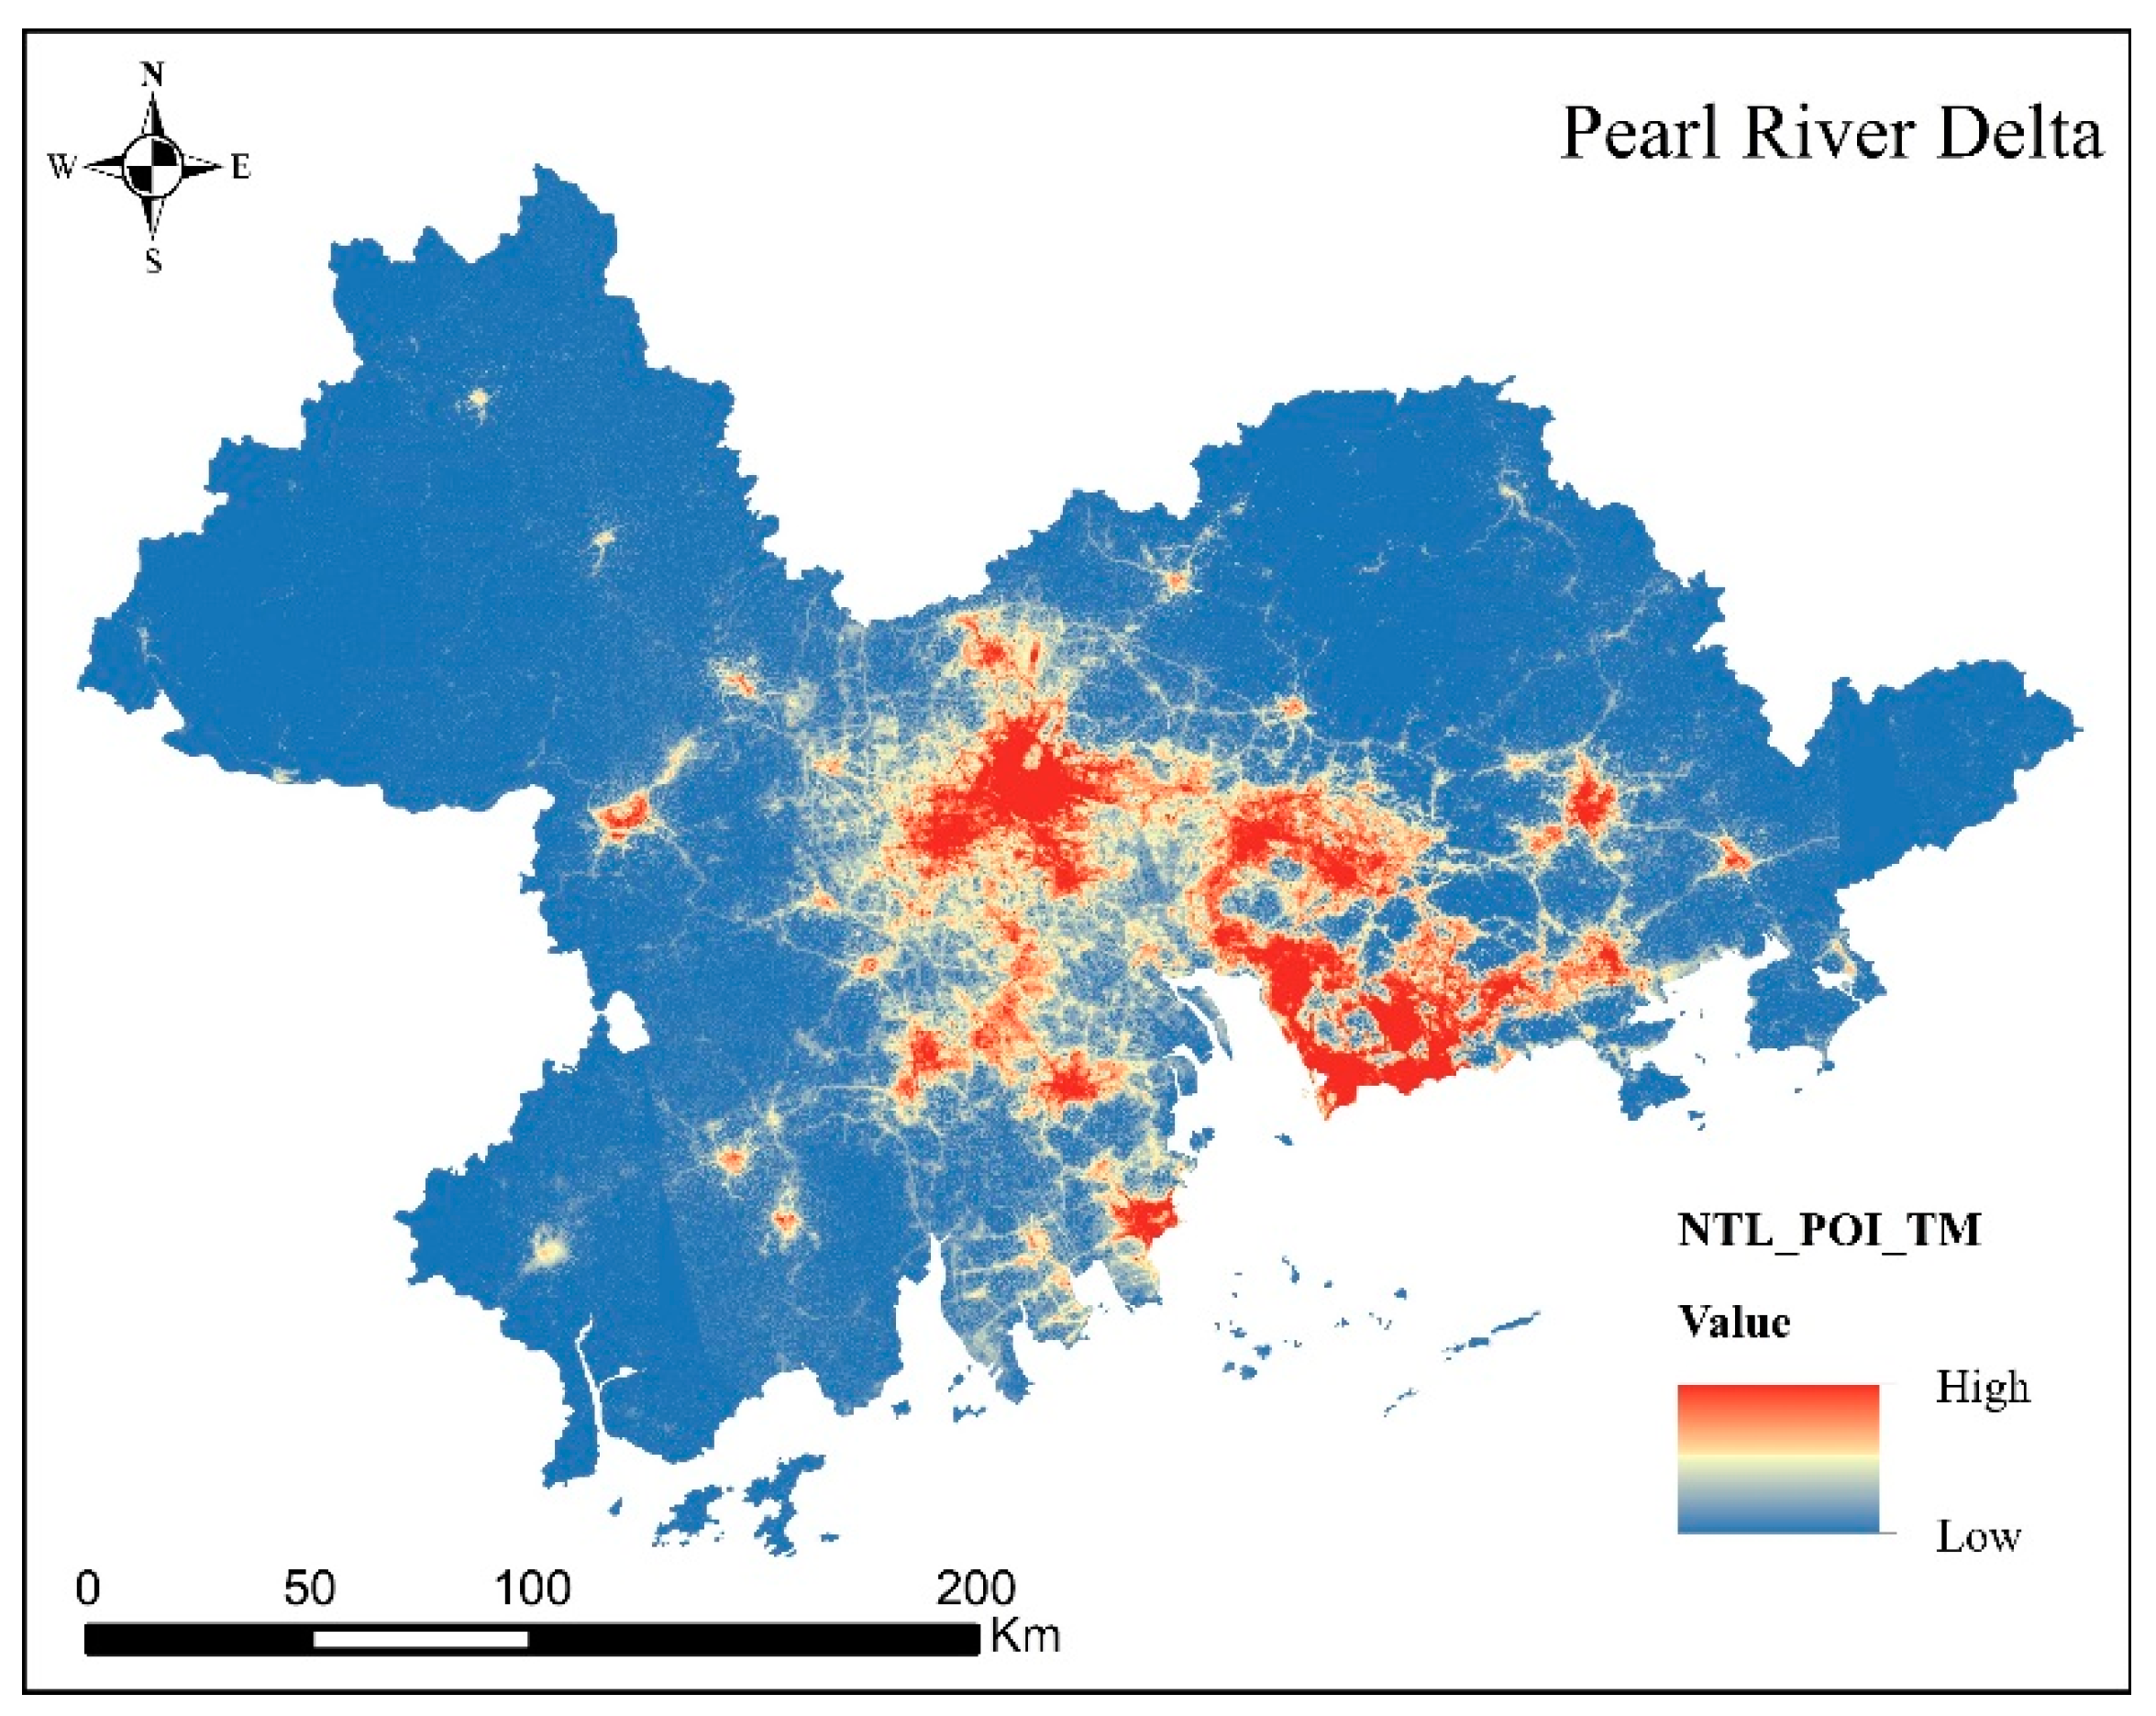
Although both NTL and POI data take urban land use and urban spatial function into consideration, different cities and clusters in urban agglomerations were spatially linked, which was mainly reflected in the exchange and interaction of populations, information, and materials [86]. Therefore, the spatial structures of urban agglomerations cannot be fully reflected by urban land use and urban spatial function alone, and further consideration should be given to the interactions between cities and clusters in urban agglomerations. As can be seen from the coefficient variance diagram of the wavelet transform, Figure 8b, the optimum scale for NTL, POI, and TMG fusion is 7. The fused diagram is shown in Figure 11. Here, the high values were more intensively distributed, and those of Foshan were integrated into those of Guangzhou. In addition, the high values were clearly concentrated in the Airport New City and the eastern coastal area. The central scope of the city can be preliminarily obtained from Figure 11.
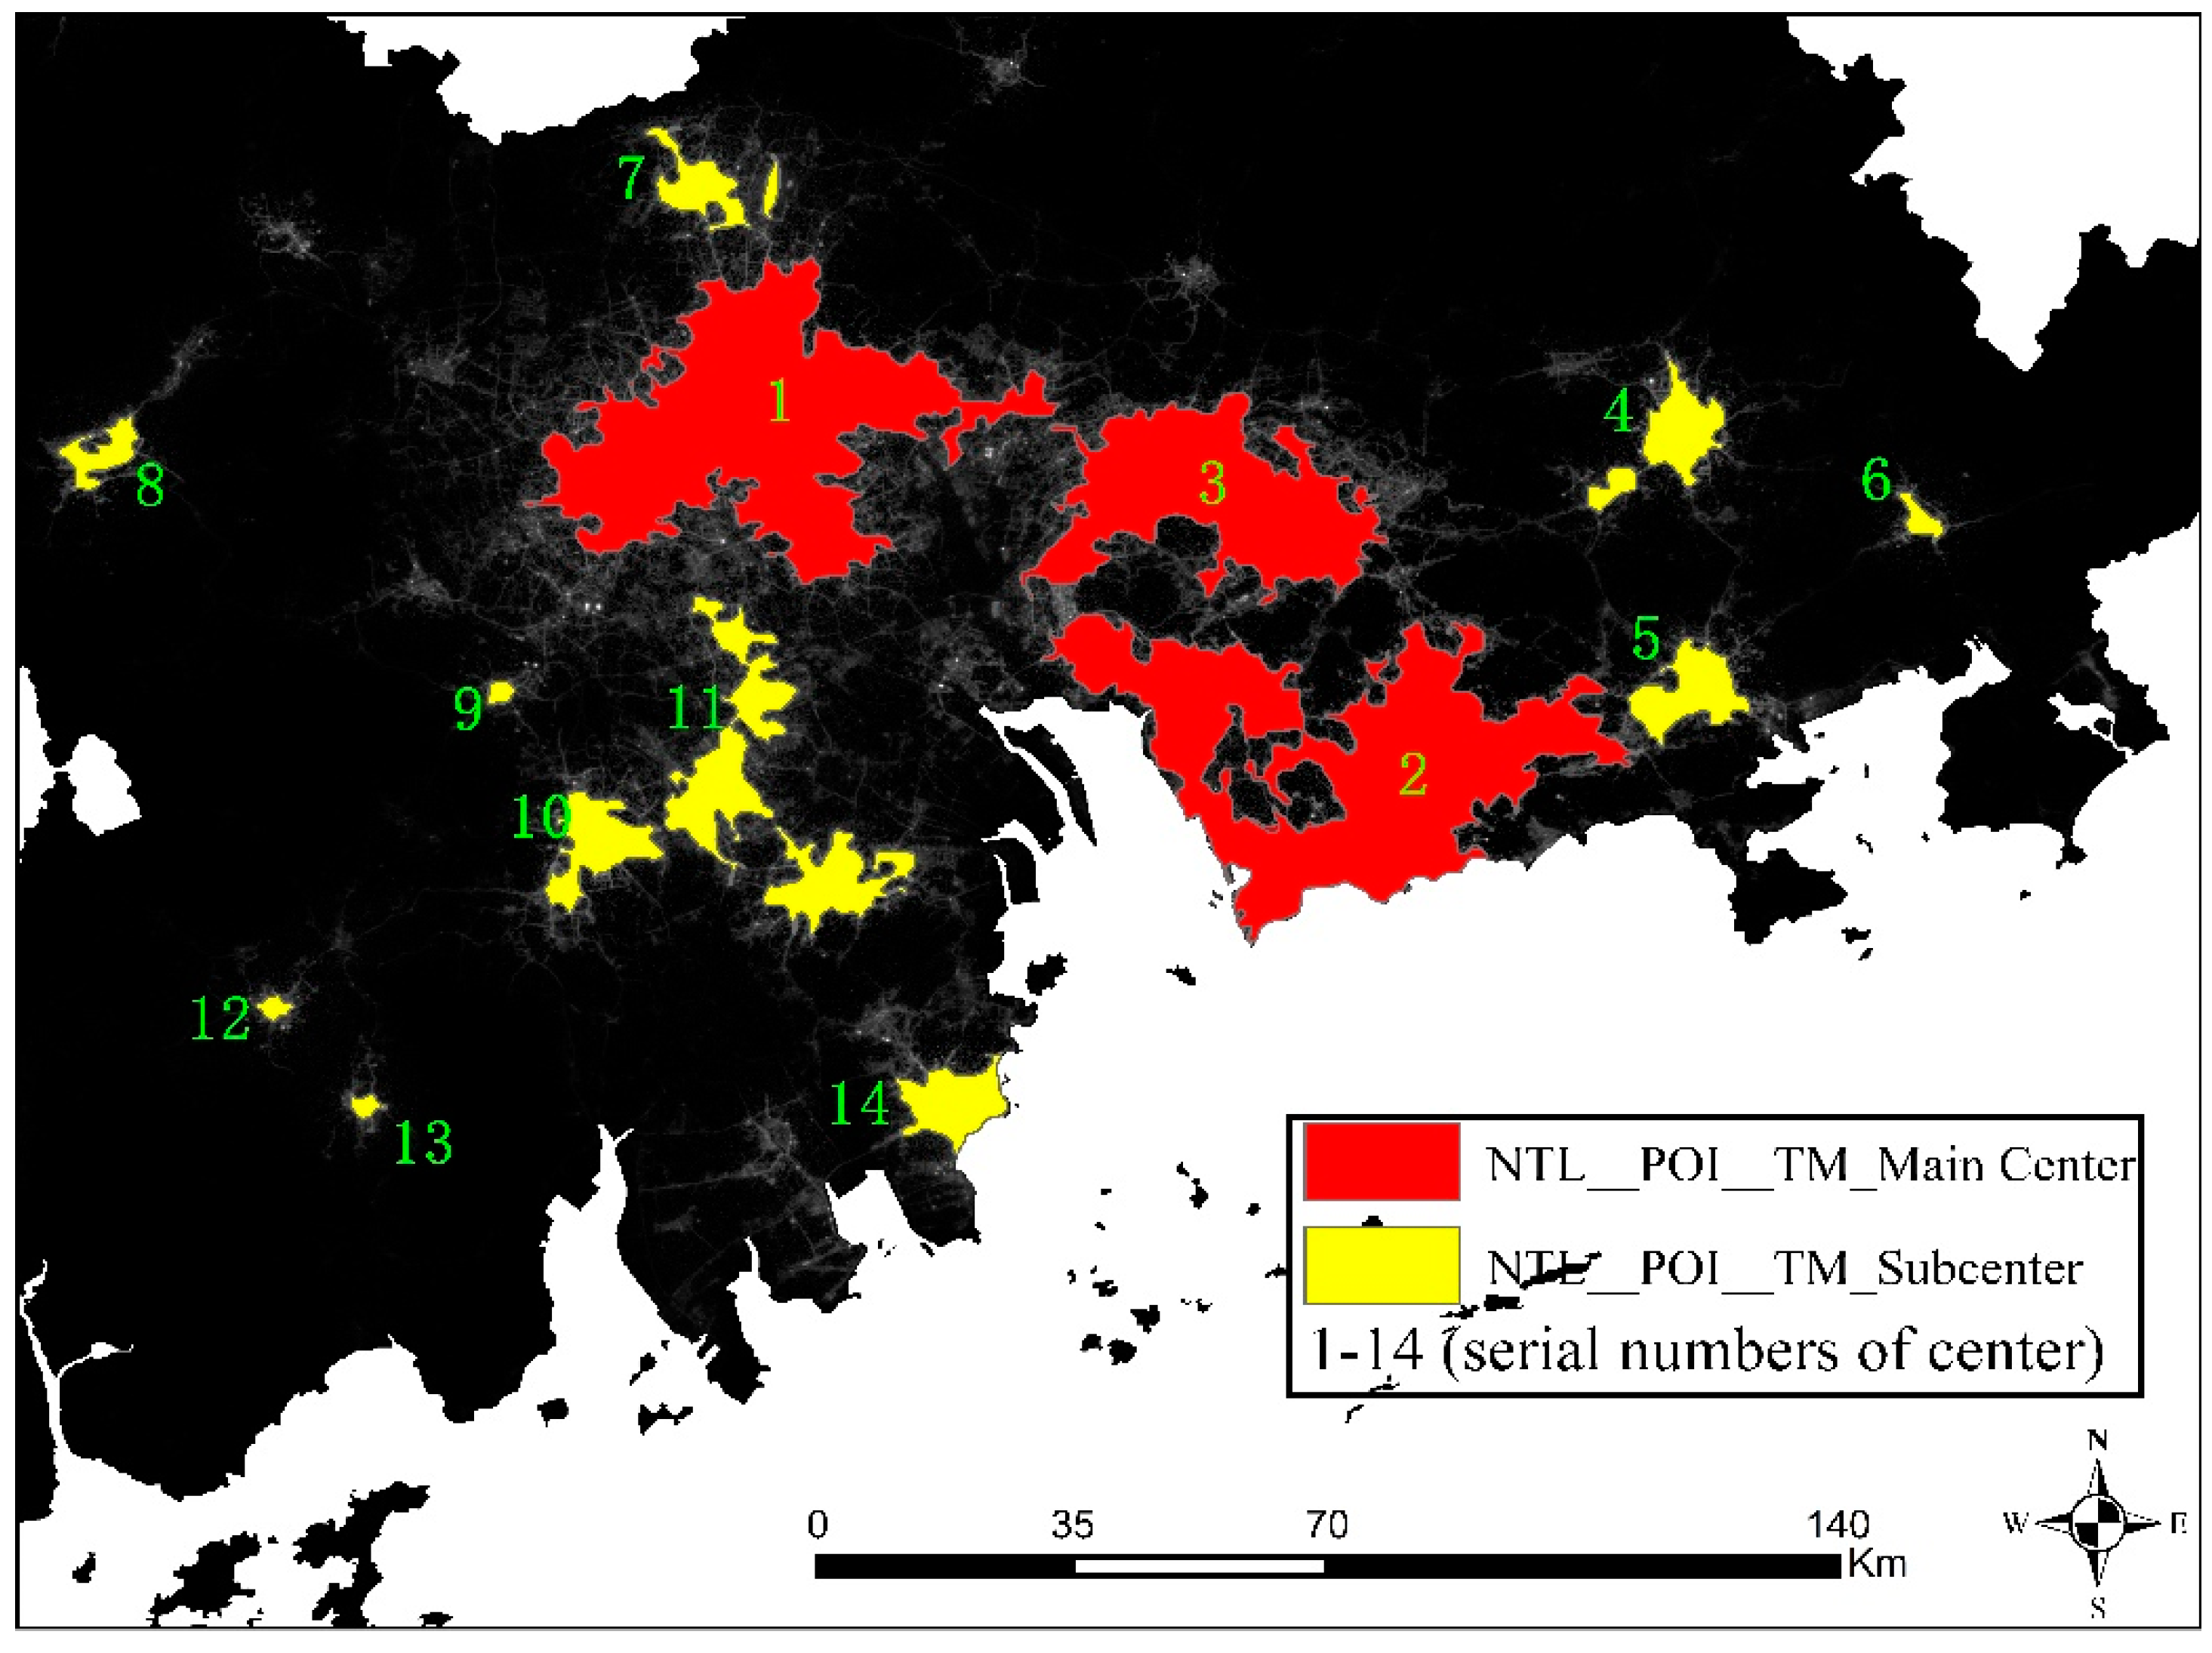
By analyzing the urban main center of the PRD, as identified by LMI after data fusion. Figure 12, three main centers were identified, Guangzhou, Shenzhen, and Dongguan, with an area of 3078.19 square kilometers that accounts for 7.29% of the administrative area. As compared with NP, the NPT data identified one more main center, which was Dongguan, and the integration of Guangzhou and Foshan was increasingly clearer in the latter. After carrying out GWR analysis, 11 subcenters other than Guangzhou, Shenzhen, and Dongguan were identified. The identified subcenters comprise a total area of 935.48 square kilometers, accounting for 2.22% of the administrative area. The NPT data identified one more urban subcenter than the NTL and NP data: Airport New City.
There are significant differences between the main centers and subcenters identified by the fusion of NP and TMG data and those identified by NTL and NP data. This was epitomized by Dongguan, which was previously identified as a subcenter and is now identified as a main center, and Airport New City, which is now identified as a subcenter. In addition, TMG data can show population interactions among cities and urban agglomerations, meaning a larger range of main center and subcenter areas were identified by NPT. Guangzhou and Shenzhen can thus form a new main center in the middle, sharing the functions of the main center, given their large urban populations. Moreover, a new urban subcenter was also formed in the Airport New City as a result of the significant flow of population.

3.2. Comparison and Evaluation

3.2.1. Competitive Trial

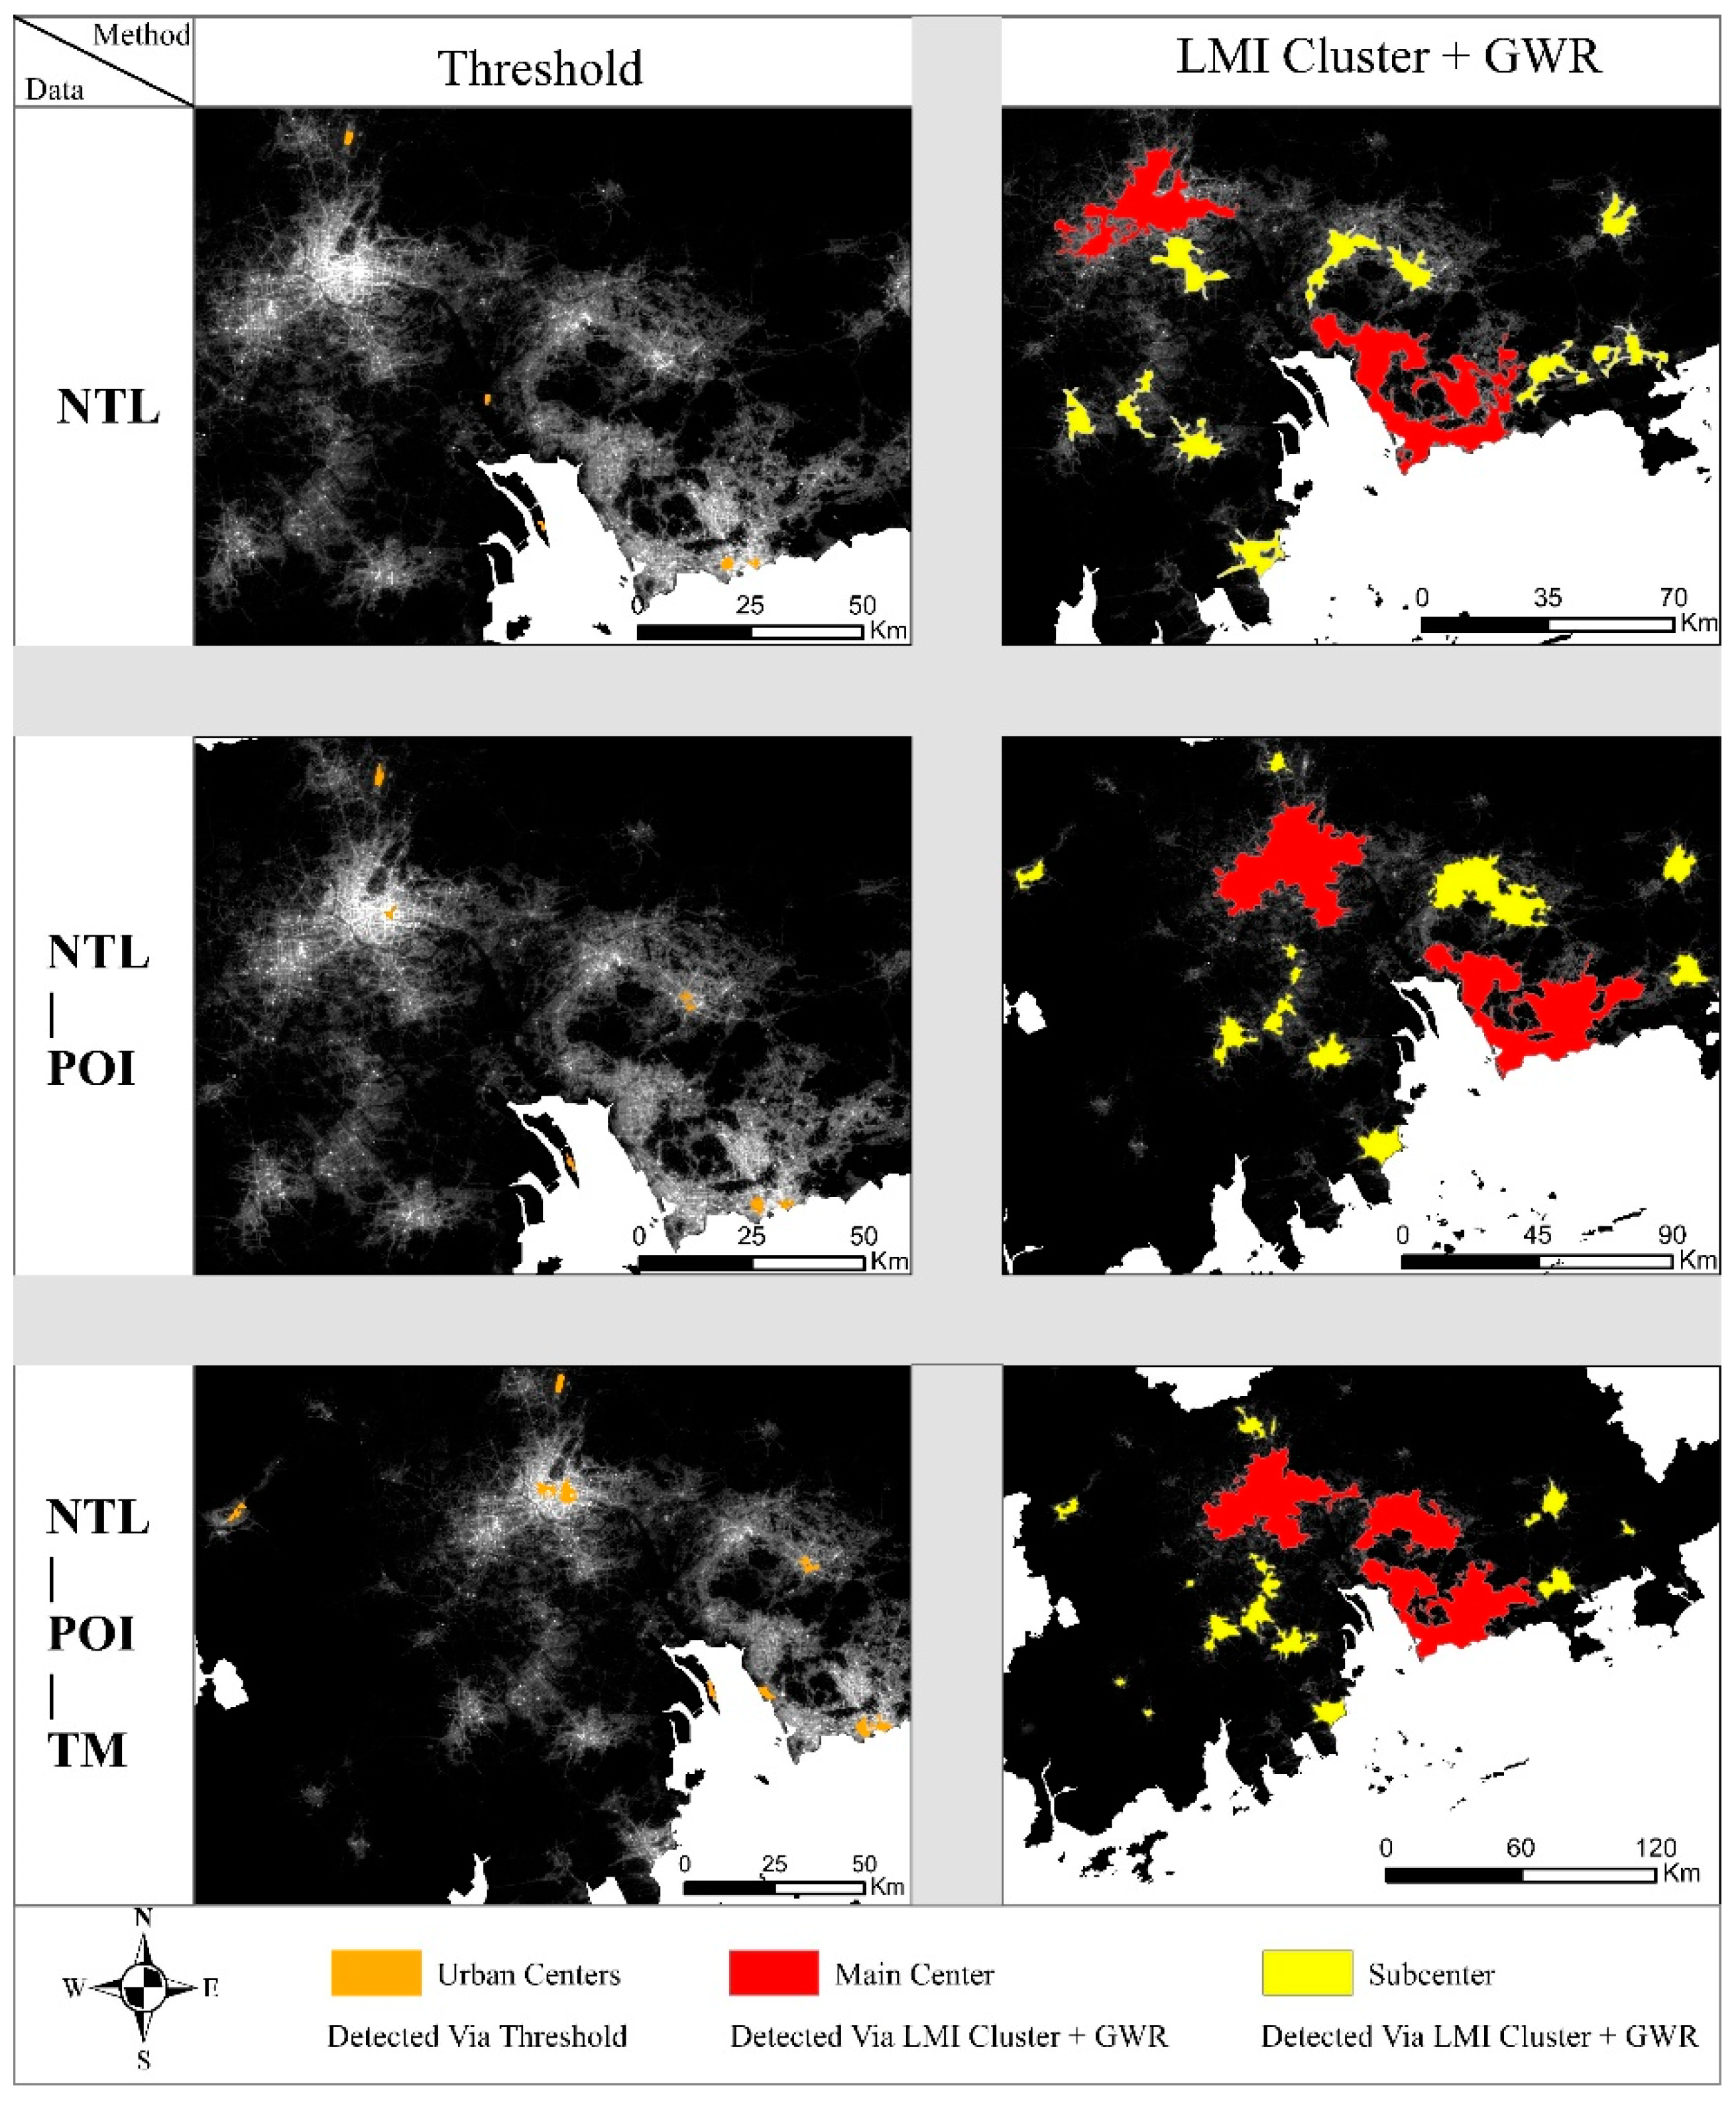
In order to test the accuracy of this study, the polycentric spatial structure identified by the threshold method was compared with that obtained by this study [87]. The threshold method refers to the absolute threshold method and the relative threshold method. The relative threshold method generally selects a unit high value greater than 90% in the study area as the threshold value, and the highest 10% of the area obtained was defined as the urban main center [20]. Therefore, compared with the absolute threshold method, the relative threshold method has the advantages of simpler operation and greater objectivity [88]. Comparison results of the polycentric spatial structure identified via relative thresholds in this study are shown in Figure 13.
By analyzing Figure 13, we see that the polycentric spatial structure identified by the relative threshold method with different data sets not only fails to distinguish the main center from the subcenter, but also has a small range and unclear boundary. Furthermore, since the different data sets all have the basic attributes of NTL data, the urban centers identified by the relative threshold method are primarily airports and ports. As a result, the selected high value of 10% immediately identifies the area with the highest nighttime light value as the urban center and cannot accurately identify the urban polycenter.
By comparing the results for the urban polycentric spatial structure identified by LMI and GWR with those identified with different data sets, we see that, although different data sets can all identify the main centers and subcenters, the identified centers differ significantly. For example, the boundary outline of the main center identified using NTL data is not complete, with clear jagged sections. Moreover, part of the urban core area is not included in the urban main area, and although the boundary outline of the polycentric spatial structure identified by NP was effectively revised, and some regions such as Guangzhou, Foshan, Shenzhen, and Dongguan have shown trends of integration, only the polycentric urban spatial structure identified by NPT was relatively complete, in terms of both the central boundary contour and the coverage range. Furthermore, the polycentric spatial structure identified by NPT adheres more closely to the actual urban development situation in the PRD in terms of both spatial scope and development trend.
The numbers and areas of the urban main centers and subcenters identified by NTL, NP, and NPT are shown in Table 2. The numbers of main centers identified by different data sets were 2, 2, and 3, and the numbers of subcenters identified by different data sets were 10, 11, and 11, respectively. Among these, the area of the main center identified by NPT was the largest, followed by NP and NTL, while the area of the subcenter identified by NP was the largest, followed by NPT and NTL.
The spatial structures identified by the NTL, NP, and NPT data types were similar. The high values were mainly distributed in the vicinity of Guangzhou, Shenzhen, Dongguan, and Zhuhai, while the high values in other areas were mainly distributed in the urban center, and the low values were mainly distributed in the east and west sides of the PRD. Although the distribution characteristics of the high and low values identified by the three types of data all show a significant downward trend from urban center to rural fringe, the centers identified by different data were very different. For example, since there was only a single light attribute in the NTL data, there were obvious differences in light brightness between the main urban road network and urban areas, resulting in many light holes. Moreover, the fragmentation of inner space in urban agglomerations will affect the identification of urban centers. However, after the fusion of NP and POI data, many light holes emerged in the POI data. The amplification of the density attributed to the POI data narrows the difference between high and low values after the fusion with NTL images, which means the NP images were better equipped to explain the urbanization differences within urban agglomerations. Furthermore, after the fusion of NPT with TMG data, the range of high values within urban agglomerations was greater than that which was derived after NTL and NP were fused. This is because, as a static form of expression, NTL and POI data only reflect the urban land and function, but the communication between different cities and clusters in the urban agglomeration was dynamic. Therefore, the fusion of TMG data greatly strengthens the internal spatial connection within urban agglomerations, which makes the spatial structure of urban agglomerations more dynamic and complete.

3.2.2. Precision Validation

It is very difficult to determine the accuracy of urban polycentric structure identification. In this regard, this study uses the spatial distribution data of the permanent population at the end of 2020 to conduct a consistency test with urban polycentricity. This is because there is a significant correlation between the concentration of permanent population and urban centers, which means that in large cities, urban centers are often also centers of the urban population [89]. The spatial distribution data of permanent populations are derived from statistical data, which are spatialized census data with greater accuracy. A fine spatial pattern of population distribution can be obtained through the grid processing of spatial population distribution data [90]. Consistency tests were carried out between the spatial distributions of permanent-resident populations and the main centers and subcenters identified by LMI and GWR, and the verification results are shown in Table 3.
It can be seen from Table 3 that there were significant differences in the identification accuracies of main centers and subcenters when using different methods. Therefore, compared with the relative threshold method, the accuracy of the LMI and GWR method in identifying polycentric spatial structures is more than 60% better, meaning the LMI+GWR method has a higher accuracy than the threshold method. From the perspective of the spatial distribution accuracy of polycentric cities identified via different data sets, NPT identified main centers and subcenters most accurately, followed by NP, and finally NTL.
To sum up, on the one hand, compared with the threshold method, the LMI+GWR method can identify the urban polycentric spatial structure more accurately. On the other hand, after fusion with POI data, NTL data can improve the integrity of the internal spatial structure of the urban agglomeration, and after continuous fusion with TMG data, NTL data can strengthen the spatial dynamic connection among cities and clusters within the urban agglomeration, which makes the identification of polycentric spatial structures more accurate.

4. Discussion

NTL data are amongst the most important for the study of urban space, and although they can represent its distribution characteristics by reflecting the distribution of high and low values of light brightness, the characteristics of NTL data often make the study results prone to error [44]. Therefore, researchers have tried to solve this problem via data fusion [53]. It has been shown that the fusion of POI and NTL data can have very good effects, where the accuracy of urban polycentric identification can be significantly improved [43]. By analyzing the characteristics of NTL and POI data in urban space, this study further incorporates population dynamics data while taking into account the static space within the urban agglomeration. The main centers and subcenters of the urban agglomeration identified by this study are combined with dynamic and static forces, which provides a significant advantage in identifying the polycentric spatial structure of the city.

4.1. Comparison of Experimental Results and Planning Results

In order to evaluate the effectiveness of the implementation of urban spatial overall planning, this study evaluates the accuracy of the polycentric spatial structure identification results for the PRD urban agglomeration and compares them with the overall planning results of the PRD. The overall planning proposition was to make the PRD urban agglomeration into an innovative and advanced manufacturing center with a world influence, with a spatial pattern of "two regional main centers, one regional subcenter, six provincial main centers and several provincial subcenters". In addition, several regional development axes and poles should be formed.
In total, three main centers and 11 subcenters were identified in the PRD urban agglomeration, with the highest identification accuracy reaching 92.48%. The difference between urban spatial overall planning and the actual development of urban agglomeration can be judged via a comparison with the overall planning of the PRD. It can also be concluded after a comparison that the main centers of the urban agglomeration are Guangzhou and Shenzhen, and the main center of Guangzhou and the subcenter Foshan are developed in an integrated way, forming a regional development circle, which is completely consistent with the overall planning approach. However, although a third main center has been identified in this study, it is described as a subcenter in the planning report. The reason for this is that the regular urban communication between the two main centers of Guangzhou and Shenzhen has resulted in the formation of a new urban center in the middle of the two cities, which adopts the function of the original urban center.
The overall planning report identifies a main center, a subcenter, a third-level center, and a fourth-level center. The main center refers to the main center of the PRD urban agglomeration—Guangzhou and Shenzhen; the subcenter refers to the subcenter—Zhuhai; the third-level center refers to the prefectural-level city of the PRD-Zhongshan, Dongguan, etc.; the fourth-level center is an area with the characteristics of a city center minus those of an urban center in a prefectural-level city. Only the main center and subcenter were identified in this study. After comparing the subcenter identification results obtained in this study with the subcenter, third-level center, and fourth-level center identification results proposed in the overall planning report, we see that the subcenters of the urban agglomeration identified by NPT (using LMI and GWR) in this study included not only all the subcenters in the overall planning report, but also the areas far from the main center in the east and west of the city and the Airport New City, except for the Kaishan subcenter. Therefore, it can be concluded that the polycentric spatial structure identified in this study is consistent with the overall planning report, from the perspective of both the number of identified main centers and subcenters and the distribution range of the centers. The discussion and the comparisons with the overall planning further demonstrate the high accuracy of the polycentric spatial structure identified in this study (Figure 14).

4.2. Study Contribution

The identification and evaluation of a traditional polycentric spatial structure mainly rely on demographic survey data and socioeconomic development data, which are both highly subjective [20]. Furthermore, instead of focusing on the evaluation of identification results and on whether they meet planning requirements, traditional studies pay more attention to the initial acquisition of identification results [91,92]. Generally speaking, there is still a lack of scientific and objective methods for the evaluation of results of urban polycentric space planning. Based on the fusion of NTL data, POI data, and TMG data, this study identifies the polycentric spatial structure of the PRD urban agglomeration, then accurately evaluates the polycentric spatial structure with experimental comparisons and accuracy verifications, and finally compares the evaluation results with the overall plan of the PRD to objectively evaluate whether the urban spatial planning is consistent with the actual development. In conclusion, this study proposes an accurate and reasonable method with which to evaluate the effects of urban spatial planning implementation.
As the spatial development of urban agglomerations includes obvious regional imbalance, one of the purposes of spatial planning of urban agglomerations is to formulate reasonable spatial development policies in order to reduce this imbalance, such as the series of spatial planning policies being carried out by China, including urban integration development, regional development, etc. [93,94]. In the spatial development of urban agglomeration, there is regional developmental inequality between main centers and subcenters. This inequality is manifested in the significant difference between urban agglomeration and urban expansion [95], which makes it difficult to implement policies such as regional development and integrated development. Regional spatial development policies can balance such significant differences, which makes them very important in urban system decision-making and spatial planning [96]. This study further seeks to accurately identify the polycentric spatial structure of the urban agglomeration, and finally compares the results with those of urban agglomeration spatial planning, which is helpful in not only understanding the differences between actual development status and the spatial planning of the PRD urban agglomeration but also makes important practical contributions to the formulation of regional spatial development policies.

4.3. The Deficiencies and Prospects of the Study

There are still some limitations in this study and some possibilities for further research. First of all, as a form of population positioning data obtained via Tencent apps, although Tencent migration data can objectively reflect movement changes in the population over a certain period of time, Tencent migration data cannot reflect everyone’s mobile information, especially those of the elderly and children, given that the popularity of smart phones is not very widespread [45]. Secondly, in the Discussion of this study, although the identification results of polycenters are compared with the results of the overall planning, the planning results only represent a location on a map without containing actual vector information. Therefore, it is necessary to verify the consistency between the vector information obtained by field confirmation, including the boundary, and the identified polycentric spatial structure, in order to further evaluate the accuracy of this study.

5. Conclusions

Polycentric spatial structure is an inevitable phenomenon arising with rapid urban development. In this study, NTL data, POI data, and TMG data were fused to identify the polycentric spatial structure of urban agglomeration. The accuracy of the polycenter identification by NTL data was 79.33%, and the Kappa value was 0.6264. After fusion with POI data, the accuracy of polycentric identification by NTL data became 88.17%, and the Kappa value became 0.7911. After continuous fusion with TMG data, the accuracy of polycentric identification became 92.84%, and the Kappa value became 0.8871. This study further compares the results identified here with the results identified by the relative threshold method and finally discusses and compares with the overall planning, which verifies the correctness of this study, and makes the identification and evaluation of polycentric urban spatial structure more objective. Therefore, the study method can also be extended to other rapidly developing urban spatial structures. In general, this study concludes a theoretical approach that can effectively evaluate the polycentric spatial structure of urban agglomerations through experimental demonstration and analysis, and since this theoretical approach can compare the difference between the actual development of urban agglomerations and the planning scheme, which not only plays a significant role in promoting the research on the spatial structure of urban agglomerations, but also provides a new method and path for the research on the spatial structure of urban agglomerations.
The solution to the problem of unbalanced spatial development within urban agglomerations is essentially a spatial strategy of urban planning, which involves optimizing the allocation of various elements of urban agglomerations. Spatial balance in development is an important part of the high-quality development of urban agglomerations and the formulation of a regional spatial development strategy. By comparing the evaluated polycentric spatial structure of the PRD urban agglomeration with the existing overall planning, it can be found that although the implementation effect of the overall planning is good, the government still needs to strengthen the establishment of the eastern and western regions with weak urban development strength in the agglomeration thus as to better complete the development strategy of the polycentric urban agglomeration mentioned in the overall planning. Last but not least, by discussing the fusion of multi-source big data to identify the urban agglomeration polycentric spatial structure that develops with rapid urbanization, this study identifies the distribution characteristics of polycentric spatial structure by combining dynamic with static urban space. This has important practical value when evaluating the results of urban planning and further formulating reasonable regional spatial development policies for the efficient development of urban agglomerations.

Author Contributions

Conceptualization, X.H.; methodology, X.H.; software, X.H.; validation, C.Z. and Y.C.; formal analysis, Y.C.; investigation, Y.C.; resources, C.Z.; data curation, X.H.; writing—original draft preparation, X.H. and C.Z.; writing—review and editing, X.H.; visualization, Y.C. All authors have read and agreed to the published version of the manuscript.

Funding

This research received no external funding.

Institutional Review Board Statement

Not applicable.

Informed Consent Statement

Not applicable.

Data Availability Statement

Data disclosure access link: DOI: 10.5281/zenodo.4890100 (accessed on 8 June 2021).

Acknowledgments

Thanks go to all the editors and commenters.

Conflicts of Interest

The authors declare no conflict of interest.

References

  1. Chen, M.; Liu, W.; Tao, X. Evolution and assessment on China’s urbanization 1960–2010: Under-urbanization or over-urbanization? Habitat Int. 2013, 38, 25–33. [Google Scholar] [CrossRef]
  2. Zeng, H.; Yan, C.; Huang, W.; Lin, Q.; Yu, L.; Qiu, G. A case study on the relationship between urbanization level and water use efficiency in the pearl river delta urban agglomeration. Beijing Da Xue Xue Bao 2020, 56, 561–570. [Google Scholar]
  3. Li, L.; Zhu, Y. The Impact of China’s Urbanization Level on Household Consumption. Rev. Cercet. Interv. Sociala 2021, 72, 378–397. [Google Scholar] [CrossRef]
  4. Li, Y. New Actors in the Old Hierarchies: Alliances for Low-Carbon Urban Development in Shenzhen, China. J. Plan. Educ. Res. 2021. [Google Scholar] [CrossRef]
  5. Wang, X.R.; Hui, E.C.M.; Sun, J.X. Population migration, urbanization and housing prices: Evidence from the cities in China. Habitat Int. 2017, 66, 49–56. [Google Scholar] [CrossRef]
  6. Wu, L. Correlation between Population Migration and Regional Planning Based on Urbanization of Coastal Cities. J. Coast. Res. 2020, 110, 50–53. [Google Scholar] [CrossRef]
  7. Hu, D.; Meng, Q.; Zhang, L.; Zhang, Y. Spatial quantitative analysis of the potential driving factors of land surface temperature in different “Centers” of polycentric cities: A case study in Tianjin, China. Sci. Total Environ. 2019, 706, 135244. [Google Scholar] [CrossRef] [PubMed]
  8. Yue, W.; Qiu, S.; Xu, H.; Xu, L.; Zhang, L. Polycentric urban development and urban thermal environment: A case of Hangzhou, China. Landsc. Urban Plan. 2019, 189, 58–70. [Google Scholar] [CrossRef]
  9. Zou, Y.; Lu, Y.; Cheng, Y. The impact of polycentric development on regional gap of energy efficiency: A Chinese provincial perspective. J. Clean. Prod. 2019, 224, 838–851. [Google Scholar] [CrossRef]
  10. McMillen, D.P.; McDonald, J.F. A nonparametric analysis of employment density in a polycentric city. J. Reg. Sci. 1997, 37, 591–612. [Google Scholar] [CrossRef]
  11. Nagel, M.; Stark, M.; Satoh, K.; Schmitt, M.; Kaip, E. Diversity in collaboration: Networks in urban climate change governance. Urban. Clim. 2019, 29, 100502. [Google Scholar] [CrossRef]
  12. Kumar, S.; Kumar, S.; Gupta, B. Urban health: Needs urgent attention. Indian J. Public Health 2018, 62, 214. [Google Scholar] [CrossRef]
  13. Yew, C.P. Pseudo-urbanization? Competitive government behavior and urban sprawl in China. J. Contemp. China 2012, 21, 281–298. [Google Scholar] [CrossRef]
  14. Liu, Y.; Li, Z.; Jin, J. Pseudo-urbanization or Real Urbanization? Urban China’s Mergence of Administrative Regions and Its Effects: A Case Study of Zhongshan City, Guangdong Province. China Rev. 2014, 14, 37–59. [Google Scholar]
  15. Randell, H.F.; VanWey, L.K. Networks versus need: Drivers of urban out-migration in the Brazilian Amazon. Popul. Res. Policy Rev. 2014, 33, 915–936. [Google Scholar] [CrossRef] [PubMed]
  16. Liu, W.; Hou, Q.; Xie, Z.; Mai, X. Urban Network and Regions in China: An Analysis of Daily Migration with Complex Networks Model. Sustainability 2020, 12, 3208. [Google Scholar] [CrossRef] [Green Version]
  17. Lee, H.; Roh, J.; Jung, J.H.; Jang, W. Network analysis of urban-to-rural migration. Korean J. Appl. Stat. 2016, 29, 487–503. [Google Scholar] [CrossRef]
  18. Li, G.; Li, F. Urban sprawl in China: Differences and socioeconomic drivers. Sci. Total Environ. 2019, 673, 367–377. [Google Scholar] [CrossRef]
  19. Meijers, E. Polycentric Urban Regions and the Quest for Synergy: Is a Network of Cities More than the Sum of the Parts? Urban. Stud. 2005, 42, 765–781. [Google Scholar] [CrossRef]
  20. Liu, X.; Wang, M. How polycentric is urban China and why? A case study of 318 cities. Landsc. Urban Plan. 2016, 151, 10–20. [Google Scholar] [CrossRef]
  21. Taubenböck, H.; Standfuß, I.; Wurm, M.; Krehl, A.; Siedentop, S. Measuring morphological polycentricity—A comparative analysis of urban mass concentrations using remote sensing data. Comput. Environ. Urban Syst. 2017, 64, 42–56. [Google Scholar] [CrossRef]
  22. Yu, L.Y.; Xie, J.B.; Zhang, Z.Z. Study on the Siphon Effect of the Develotipment of Agricultural Electronic Commerce Industry among Regions. Appl. Eng. Agric. 2021, 37, 743–749. [Google Scholar]
  23. Niu, F.; Xin, Z.; Sun, D. Urban land use effects of high-speed railway network in China: A spatial spillover perspective. Land Use Policy 2021, 105, 105417. [Google Scholar] [CrossRef]
  24. Yang, J.; Song, G.; Lin, J. Measuring Spatial Structure of China’s Megaregions. J. Urban Plan. Dev. 2015, 141, 04014021. [Google Scholar] [CrossRef] [Green Version]
  25. Xie, Z.; Ye, X.; Zheng, Z.; Li, D.; Sun, L.; Li, R.; Benya, S. Modeling Polycentric Urbanization Using Multisource Big Geospatial Data. Remote Sens. 2019, 11, 310. [Google Scholar] [CrossRef] [Green Version]
  26. McMillen, D.P. Nonparametric employment subcenter identification. J. Urban Econ. 2001, 50, 448–473. [Google Scholar] [CrossRef]
  27. Redfearn, C.L. The topography of metropolitan employment: Identifying centers of employment in a polycentric urban area. J. Urban Econ. 2007, 61, 519–541. [Google Scholar] [CrossRef]
  28. Rao, Y.; Yang, J.; Dai, D.; Wu, K.; He, Q. Urban growth pattern and commuting efficiency: Empirical evidence from 100 Chinese cities. J. Clean. Prod. 2021, 302, 126994. [Google Scholar] [CrossRef]
  29. Zhang, H.; Chen, B.; Sun, Z.; Bao, Z. Landscape perception and recreation needs in urban green space in Fuyang, Hangzhou, China. Urban For. Urban Green. 2013, 12, 44–52. [Google Scholar] [CrossRef]
  30. Zhang, J.; Yuan, X.; Tan, X.; Zhang, X. Delineation of the Urban-Rural Boundary through Data Fusion: Applications to Improve Urban and Rural Environments and Promote Intensive and Healthy Urban Development. Int. J. Environ. Res. Public Health 2021, 18, 7180. [Google Scholar] [CrossRef] [PubMed]
  31. Sá Marques, T.; Saraiva, M.; Ribeiro, D.; Amante, A.; Silva, D.; Melo, P. Accessibility to services of general interest in polycentric urban system planning: The case of Portugal. Eur. Plan. Stud. 2020, 28, 1068–1094. [Google Scholar] [CrossRef]
  32. He, X.; Zhou, C.; Zhang, J.; Yuan, X. Using Wavelet Transforms to Fuse Nighttime Light Data and POI Big Data to Extract Urban Built-Up Areas. Remote Sens. 2020, 12, 3887. [Google Scholar] [CrossRef]
  33. Wu, R.; Li, Z.; Wang, S. The varying driving forces of urban land expansion in China: Insights from a spatial-temporal analysis. Sci. Total Environ. 2020, 766, 142591. [Google Scholar] [CrossRef] [PubMed]
  34. Salvati, L. Planning for Sustainable Land-Use Changes: Indications from an Assessment of Soil Consumption in a Polycentric Region. J. Urban Plan. Dev. 2014, 140, 05014002. [Google Scholar] [CrossRef]
  35. Hou, Y. Polycentric urban form and non-work travel in Singapore: A focus on seniors. Transp. Res. Part D Transp. Environ. 2019, 73, 245–275. [Google Scholar] [CrossRef]
  36. Crosato, E.; Prokopenko, M.; Harré, M.S. The Polycentric Dynamics of Melbourne and Sydney: Suburb attractiveness divides a city at the home ownership level. Proc. R. Soc. A Math. Phys. Eng. Sci. 2021, 477, 20200514. [Google Scholar] [CrossRef]
  37. McMillen, D.P. The return of centralization to Chicago: Using repeat sales to identify changes in house price distance gradients. Reg. Sci. Urban Econ. 2003, 33, 287–304. [Google Scholar] [CrossRef]
  38. Liu, X.; Derudder, B.; Wang, M. Polycentric urban development in China: A multi-scale analysis. Environ. Plan. B Urban Anal. City Sci. 2017, 45, 953–972. [Google Scholar] [CrossRef]
  39. McMillen, D.P. Identifying sub-centres using contiguity matrices. Urban Stud. 2003, 40, 57–69. [Google Scholar] [CrossRef]
  40. McMillen, D.P. Employment densities, spatial autocorrelation, and subcenters in large metropolitan areas. J. Reg. Sci. 2004, 44, 225–244. [Google Scholar] [CrossRef]
  41. Riguelle, F.; Thomas, I.; Verhetsel, A. Measuring urban polycentrism: A European case study and its implications. J. Econ. Geogr. 2007, 7, 193–215. [Google Scholar] [CrossRef]
  42. Garcia-López, M.À. Population suburbanization in Barcelona, 1991–2005: Is its spatial structure changing? J. Hous. Econ. 2010, 19, 119–132. [Google Scholar] [CrossRef]
  43. Lou, G.; Chen, Q.; He, K.; Zhou, Y.; Shi, Z. Using Nighttime Light Data and POI Big Data to Detect the Urban Centers of Hangzhou. Remote Sens. 2019, 11, 1821. [Google Scholar] [CrossRef] [Green Version]
  44. Elvidge, C.D.; Baugh, K.E.; Dietz, J.B.; Bland, T.; Sutton, P.C.; Kroehl, H.W. Radiance calibration of DMSP-OLS low-light imaging data of human settlements. Remote Sens. Environ. 1999, 68, 77–88. [Google Scholar] [CrossRef]
  45. Sun, L.; Tang, L.; Shao, G.; Qiu, Q.; Lan, T.; Shao, J. A Machine Learning-Based Classification System for Urban Built-Up Areas Using Multiple Classifiers and Data Sources. Remote Sens. 2019, 12, 91. [Google Scholar] [CrossRef] [Green Version]
  46. Hermosilla, T.; Palomar-Vazquez, J.; Balaguer-Beser, A.; Balsa-Barreiro, J.; Ruiz, L.A. Using street based metrics to characterize urban typologies. Comput. Environ. Urban Syst. 2014, 44, 68–79. [Google Scholar] [CrossRef] [Green Version]
  47. Mathews, A.J.; Frazier, A.E.; Nghiem, S.V.; Neumann, G.; Zhao, Y. Satellite scatterometer estimation of urban built-up volume: Validation with airborne lidar data. Int. J. Appl. Earth Obs. Geoinf. 2019, 77, 100–107. [Google Scholar] [CrossRef]
  48. Jun, Z.; Xiao-Die, Y.; Han, L. The Extraction of Urban Built-Up Areas by Integrating Night-Time Light and POI Data—A Case Study of Kunming, China. IEEE Access 2021, 9, 22417–22429. [Google Scholar] [CrossRef]
  49. Liu, H.; Luo, N.; Hu, C. Detection of County Economic Development Using LJ1-01 Nighttime Light Imagery: A Comparison with NPP-VIIRS Data. Sensors 2020, 20, 6633. [Google Scholar] [CrossRef]
  50. Zhang, X.; Li, P. A temperature and vegetation adjusted NTL urban index for urban area mapping and analysis. ISPRS J. Photogramm. Remote Sens. 2018, 135, 93–111. [Google Scholar] [CrossRef]
  51. Liu, Y.; Yang, Y.; Jing, W.; Yao, L.; Yue, X.; Zhao, X. A New Urban Index for Expressing Inner-City Patterns Based on MODIS LST and EVI Regulated DMSP/OLS NTL. Remote Sens. 2017, 9, 777. [Google Scholar] [CrossRef] [Green Version]
  52. Guo, L.; Deng, X.; Liu, Y.; He, H.; Lin, H.; Qiu, G.; Yang, W. Extraction of Dense Urban Buildings from Photogrammetric and LiDAR Point Clouds. IEEE Access 2021, 9, 111823–111832. [Google Scholar] [CrossRef]
  53. Liu, J.; Deng, Y.; Wang, Y.; Huang, H.; Du, Q.; Ren, F. Urban Nighttime Leisure Space Mapping with Nighttime Light Images and POI Data. Remote Sens. 2020, 12, 541. [Google Scholar] [CrossRef] [Green Version]
  54. Song, J.; Tong, X.; Wang, L.; Zhao, C.; Prishchepov, A. Monitoring finer-scale population density in urban functional zones: A remote sensing data fusion approach. Landsc. Urban Plan. 2019, 190, 103580. [Google Scholar] [CrossRef]
  55. Lu, C.; Pang, M.; Zhang, Y.; Li, H.; Lu, C.; Tang, X.; Cheng, W. Mapping Urban Spatial Structure Based on POI (Point of Interest) Data: A Case Study of the Central City of Lanzhou, China. ISPRS Int. J. Geo-Inf. 2020, 9, 92. [Google Scholar] [CrossRef] [Green Version]
  56. Zikirya, B.; He, X.; Li, M.; Zhou, C. Urban Food Takeaway Vitality: A New Technique to Assess Urban Vitality. Int. J. Environ. Res. Public Health 2021, 18, 3578. [Google Scholar] [CrossRef]
  57. Kamw, F.; Al-Dohuki, S.; Zhao, Y.; Eynon, T.; Sheets, D.; Yang, J.; Ye, X.; Chen, W. Urban Structure Accessibility Modeling and Visualization for Joint Spatiotemporal Constraints. IEEE Trans. Intell. Transp. Syst. 2019, 21, 104–116. [Google Scholar] [CrossRef]
  58. Li, F.; Yan, Q.; Bian, Z.; Liu, B.; Wu, Z. A POI and LST Adjusted NTL Urban Index for Urban Built-Up Area Extraction. Sensors 2020, 20, 2918. [Google Scholar] [CrossRef]
  59. He, X.; Zhou, C.; Wang, Y.; Yuan, X. Risk Assessment and Prediction of COVID-19 Based on Epidemiological Data from Spatiotemporal Geography. Front. Environ. Sci. 2021, 9, 634156. [Google Scholar] [CrossRef]
  60. Wang, Z.; Wang, H.; Qin, F.; Han, Z.; Miao, C. Mapping an Urban Boundary Based on Multi-Temporal Sentinel-2 and POI Data: A Case Study of Zhengzhou City. Remote Sens. 2020, 12, 4103. [Google Scholar] [CrossRef]
  61. Li, L.; Zhang, Y.; Liu, L.; Wang, Z.; Zhang, H.; Li, S.; Ding, M. Mapping Changing Population Distribution on the Qinghai–Tibet Plateau since 2000 with Multi-Temporal Remote Sensing and Point-of-Interest Data. Remote Sens. 2020, 12, 4059. [Google Scholar] [CrossRef]
  62. Wu, K.; Zhang, H.; Wang, Y.; Wu, Q.; Ye, Y. Identification and spatial pattern of Guangzhou multi-type commercial center. Progr. Geogr. 2016, 35, 963–974. [Google Scholar]
  63. Guo, J.; Lv, Y.; Shen, T. Urban Spatial structure based on point pattern analysis—Taking Beijing metropolitan area as a case. Econ. Geogr. 2015, 35, 68–74. [Google Scholar]
  64. Chen, Y.; Yue, W.; La Rosa, D. Which communities have better accessibility to green space? An investigation into environmental inequality using big data. Landsc. Urban Plan. 2020, 204, 103919. [Google Scholar] [CrossRef]
  65. Williams, S.; Xu, W.; Bin Tan, S.; Foster, M.J.; Chen, C. Ghost cities of China: Identifying urban vacancy through social media data. Cities 2019, 94, 275–285. [Google Scholar] [CrossRef]
  66. Chen, J.; Guo, X.; Pan, H.; Zhong, S. What determines city’s resilience against epidemic outbreak: Evidence from China’s COVID-19 experience. Sustain. Cities Soc. 2021, 70, 102892. [Google Scholar] [CrossRef] [PubMed]
  67. Wang, R.; Ji, C.; Jiang, Z.; Wu, Y.; Yin, L.; Li, Y. A Short-Term Prediction Model at the Early Stage of the COVID-19 Pandemic Based on Multisource Urban Data. IEEE Trans. Comput. Soc. Syst. 2021, 8, 938–945. [Google Scholar] [CrossRef]
  68. He, X.; Zhang, Z.; Yang, Z. Extraction of urban built-up area based on the fusion of night-time light data and point of interest data. R. Soc. Open Sci. 2021, 8, 210838. [Google Scholar] [PubMed]
  69. He, X.; Yuan, X.; Zhang, D.; Zhang, R.; Li, M.; Zhou, C. Delineation of Urban Agglomeration Boundary Based on Multisource Big Data Fusion—A Case Study of Guangdong–Hong Kong–Macao Greater Bay Area (GBA). Remote Sens. 2021, 13, 1801. [Google Scholar] [CrossRef]
  70. Yue, W.; Chen, Y.; Thy, P.T.M.; Fan, P.; Liu, Y.; Zhang, W. Identifying urban vitality in metropolitan areas of developing countries from a comparative perspective: Ho Chi Minh City versus Shanghai. Sustain. Cities Soc. 2020, 65, 102609. [Google Scholar] [CrossRef]
  71. Xu, Q.; Yang, R.; Zhuang, D.; Lu, Z. Spatial gradient differences of ecosystem services supply and demand in the Pearl River Delta region. J. Clean. Prod. 2020, 279, 123849. [Google Scholar] [CrossRef]
  72. Inoue, K.; Asami, T.; Shibata, T.; Furumai, H.; Katayama, H. Spatial and temporal profiles of enteric viruses in the coastal waters of Tokyo Bay during and after a series of rainfall events. Sci. Total Environ. 2020, 727, 138502. [Google Scholar] [CrossRef]
  73. Li, J.; Ouyang, X.; Zhu, X. Land space simulation of urban agglomerations from the perspective of the symbiosis of urban development and ecological protection: A case study of Changsha-Zhuzhou-Xiangtan urban agglomeration. Ecol. Indic. 2021, 126, 107669. [Google Scholar] [CrossRef]
  74. Wang, Y.; Shen, Z. Comparing Luojia 1-01 and VIIRS Nighttime Light Data in Detecting Urban Spatial Structure Using a Threshold-Based Kernel Density Estimation. Remote Sens. 2021, 13, 1574. [Google Scholar] [CrossRef]
  75. Zhang, J.; Yuan, X. COVID-19 Risk Assessment: Contributing to Maintaining Urban Public Health Security and Achieving Sustainable Urban Development. Sustainability 2021, 13, 4208. [Google Scholar] [CrossRef]
  76. Menaka, D.; Suresh, L.P.; Premkumar, S.S. Wavelet transform-based land cover classification of satellite images. In Artificial Intelligence and Evolutionary Algorithms in Engineering Systems; Springer: New Delhi, India, 2015; pp. 845–854. [Google Scholar]
  77. Huang, X.; Zhang, L. A multiscale urban complexity index based on 3D wavelet transform for spectral–spatial feature extraction and classification: An evaluation on the 8-channel WorldView-2 imagery. Int. J. Remote Sens. 2011, 33, 2641–2656. [Google Scholar] [CrossRef]
  78. Li, Y.; Derudder, B. Dynamics in the polycentric development of chinese cities, 2001–2016. Urban. Geogr. 2020, 42, 1–21. [Google Scholar] [CrossRef]
  79. Fuentes, C.M.; Hernández, V. The Spatial Evolution of Employment Subcenters in Ciudad Juárez, Chihuahua (1994–2004): An Analysis Using Global and Local Spatial Autocorrelation Indicators. Estud. Demográficos Urbanos 2015, 30, 433–467. [Google Scholar] [CrossRef]
  80. Deng, Y.; Liu, J.; Luo, A. Detecting Urban Polycentric Structure from POI Data. ISPRS Int. J. Geo-Inf. 2019, 8, 283. [Google Scholar] [CrossRef] [Green Version]
  81. Peng, J.; Hu, Y.; Liu, Y.; Ma, J.; Zhao, S. A new approach for urban-rural fringe identification: Integrating impervious surface area and spatial continuous wavelet transform. Landsc. Urban Plan. 2018, 175, 72–79. [Google Scholar] [CrossRef]
  82. Anselin, L. Local Indicators of Spatial Association-LISA. Geogr. Anal. 2010, 27, 93–115. [Google Scholar] [CrossRef]
  83. Zhou, Y.; Chen, J.; Guo, Q.; Cao, R.; Zhu, X. Restoration of Information Obscured by Mountainous Shadows Through Landsat TM/ETM+ Images without the Use of DEM Data: A New Method. IEEE Trans. Geosci. Remote. Sens. 2013, 52, 313–328. [Google Scholar] [CrossRef]
  84. Guobin, C.; Sun, Z.; Zhang, L. Road Identification Algorithm for Remote Sensing Images Based on Wavelet Transform and Recursive Operator. IEEE Access 2020, 8, 141824–141837. [Google Scholar] [CrossRef]
  85. Jiao, M.; Wang, Y.; Hu, M.; Xia, B. Spatial deconstruction and differentiation analysis of early warning for ecological security in the Pearl River Delta, China. Sustain. Cities Soc. 2020, 64, 102557. [Google Scholar] [CrossRef]
  86. Zhao, Y.; Zhang, G.; Zhao, H. Spatial Network Structures of Urban Agglomeration Based on the Improved Gravity Model: A Case Study in China’s Two Urban Agglomerations. Complexity 2021, 2021, 6651444. [Google Scholar] [CrossRef]
  87. Small, C.; Pozzi, F.; Elvidge, C. Spatial analysis of global urban extent from DMSP-OLS night lights. Remote Sens. Environ. 2005, 96, 277–291. [Google Scholar] [CrossRef]
  88. Li, S.; Sun, Z.; Wang, Y.; Wang, Y. Understanding Urban Growth in Beijing-Tianjin-Hebei Region over the Past 100 Years Using Old Maps and Landsat Data. Remote Sens. 2021, 13, 3264. [Google Scholar] [CrossRef]
  89. Shi, Y.; Liu, D. Excessive Urbanization and Rejuvenation in the Metropolitan City Center in Shanghai, China. J. Urban Plan. Dev. 2018, 144, 05018020. [Google Scholar] [CrossRef]
  90. Xu, R.; Yang, G.; Qu, Z.; Chen, Y.; Liu, J.; Shang, L.; Liu, S.; Ge, Y.; Chang, J. City components–area relationship and diversity pattern: Towards a better understanding of urban structure. Sustain. Cities Soc. 2020, 60, 102272. [Google Scholar] [CrossRef]
  91. Li, X. Recognition of Urban Polycentric Structure Based on Spatial Aggregation Characteristics of POI Elements: A Case of Zhengzhou City. Beijing Da Xue Xue Bao 2020, 56, 692–702. [Google Scholar]
  92. Ma, M.; Lang, Q.; Yang, H.; Shi, K.; Ge, W. Identification of Polycentric Cities in China Based on NPP-VIIRS Nighttime Light Data. Remote Sens. 2020, 12, 3248. [Google Scholar] [CrossRef]
  93. Cao, J. Measurement of urban integration degree of urban agglomeration under the background of regional integration: A case of Nanjing, Zhenjiang and Yangzhou. Int. J. Electr. Eng. Educ. 2020. [Google Scholar] [CrossRef]
  94. Feng, R.; Wang, F.; Wang, K.; Xu, S. Quantifying influences of anthropogenic-natural factors on ecological land evolution in mega-urban agglomeration: A case study of Guangdong-Hong Kong-Macao greater Bay area. J. Clean. Prod. 2020, 283, 125304. [Google Scholar] [CrossRef]
  95. Zheng, W.; Kuang, A.; Liu, Z.; Wang, X. Analysing the spatial structure of urban growth across the Yangtze River Middle reaches urban agglomeration in China using NPP-VIIRS night-time lights data. GeoJournal 2021, 86, 1–18. [Google Scholar] [CrossRef]
  96. Zhang, Z.; Wang, B.; Buyantuev, A.; He, X.; Gao, W.; Wang, Y.; Wang, Y.; Yang, D.; Yang, Z. Urban agglomeration of Kunming and Yuxi cities in Yunnan, China: The relative importance of government policy drivers and environmental constraints. Landsc. Ecol. 2019, 34, 663–679. [Google Scholar] [CrossRef]
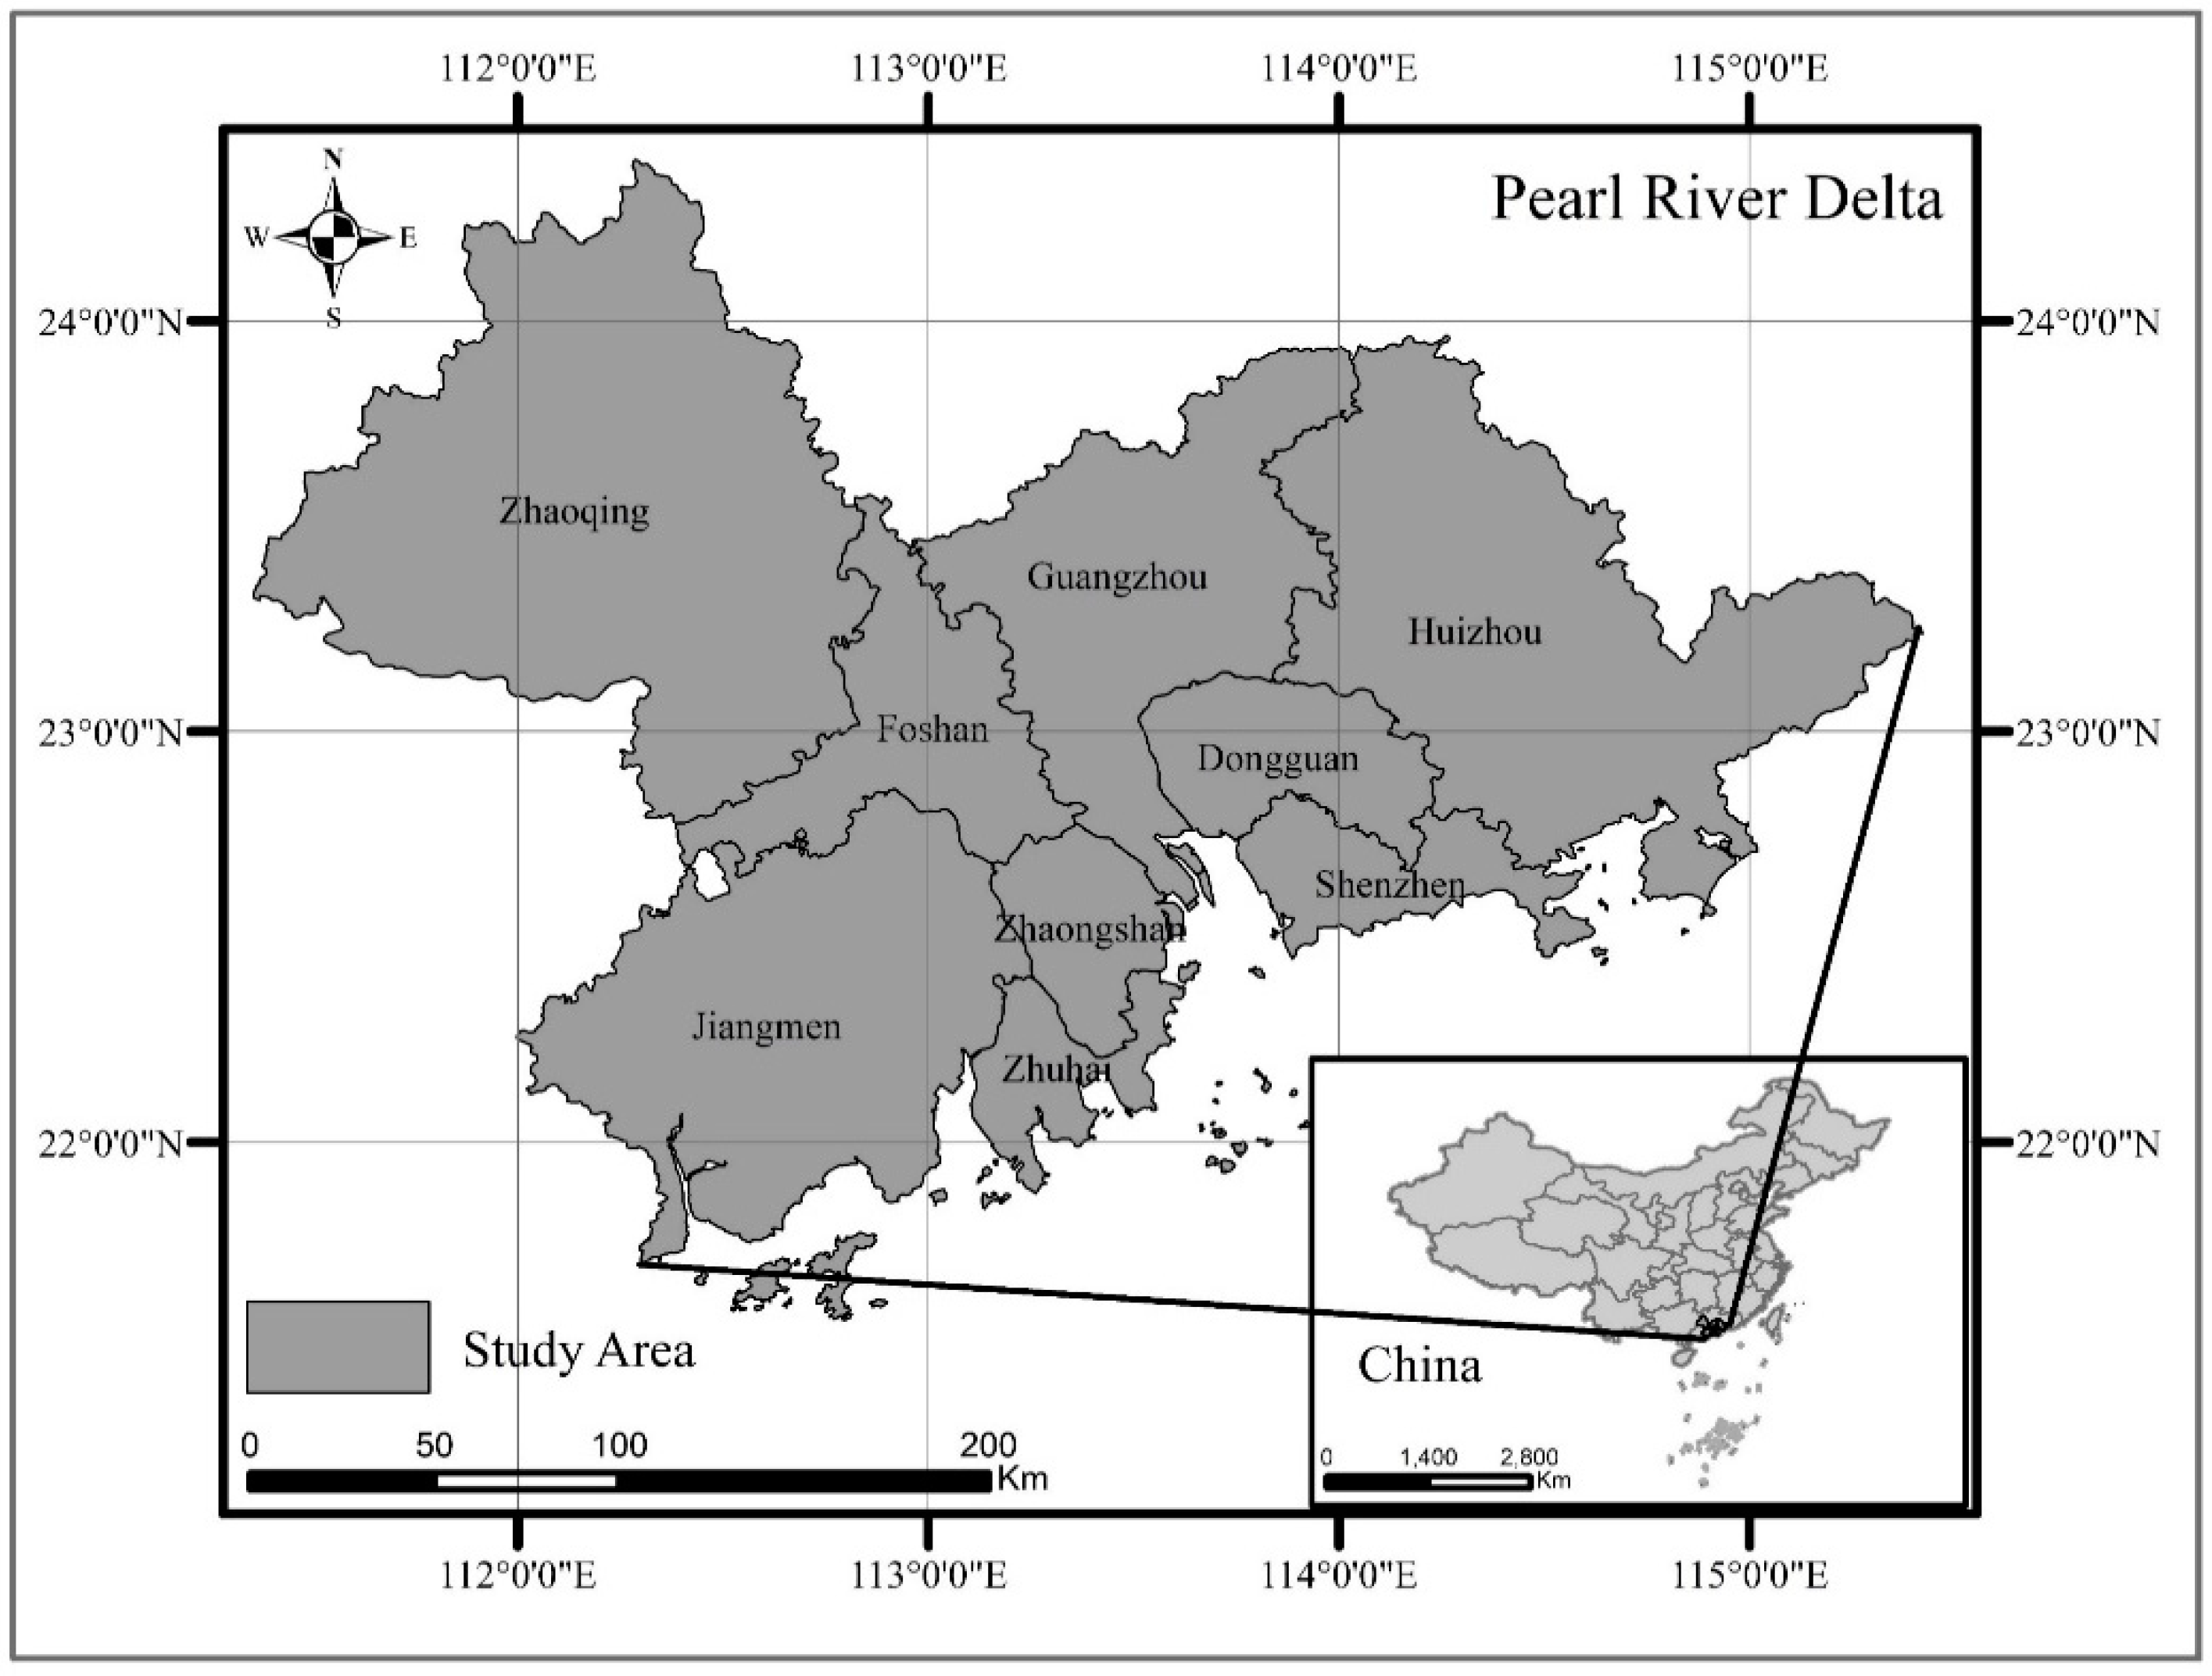
Figure 1. PRD urban agglomeration.
Remotesensing 13 03639 g001
Figure 2. Pre-processing NTL data of urban agglomerations in PRD.
Remotesensing 13 03639 g002
Figure 3. The density distribution of POI data in the PRD urban agglomeration.
Remotesensing 13 03639 g003
Figure 4. Population changes in PRD urban agglomeration.
Remotesensing 13 03639 g004
Figure 5. Population grid data of PRD urban agglomeration.
Remotesensing 13 03639 g005
Figure 6. Structure analysis diagram.
Remotesensing 13 03639 g006
Figure 7. Main and subcenters of PRD identified by NTL data.
Remotesensing 13 03639 g007
Figure 8. Variance diagram of wavelet coefficients ((a) is the variance diagram of wavelet coefficients of NTL_POI, and (b) is the variance diagram of wavelet coefficients of NTL_POI_TMG).
Remotesensing 13 03639 g008
Figure 9. Fusion results of NTL data and POI data in PRD.
Remotesensing 13 03639 g009
Figure 10. The urban main center and subcenter of PRD, identified by NP.
Remotesensing 13 03639 g010
Figure 11. Fusion results of NTL, POI, and TMG data in PRD.
Remotesensing 13 03639 g011
Figure 12. The main centers and subcenters identified by NPT.
Remotesensing 13 03639 g012
Figure 13. Comparison of urban polycenter results identified by different data and methods (the orange part represents the urban center identified by the relative threshold, the red part represents the main center identified by LMI, and the yellow part represents the city subcenter identified by GWR).
Remotesensing 13 03639 g013
Figure 14. Discussion and comparison of experimental results and overall planning.
Remotesensing 13 03639 g014
Table 1. Data description.
DataSpatialData SourcesDate
Luojia-01130 × 130 mhttp://59.175.109.173:8888/index.html2018.10–2019.03
POI Density100 × 100 mwww.amap.com2020.12
Tencent Migration30 × 30 mwww.amap.com2020.01–2020.12
Population Distribution
PRD Overal lPlanning
100 × 100 m
PRD
http://www.geodata.cn/
http://www.scio.gov.cn/ztk/xwfb/52/9/Document/1057059/1057059.htm
2020.12
2020.12
Table 2. Comparison of main centers and subcenters.
Main Centers (km²)Area/%Number of Main MentersSubcenters (km²)Area/%Number of Subcenters
NTL1118.142.65%2686.291.63%10
NP1913.364.53%21001.732.37%11
NPT3078.197.29%3935.482.22%11
Table 3. Confusion matrix.
DataRelative ThresholdLMI+GWR
OAKappaOAKappa
NTL16.38%0.01879.33%0.6264
NP18.48%0.03388.17%0.7911
NPT19.72%0.03792.48%0.8871
Publisher’s Note: MDPI stays neutral with regard to jurisdictional claims in published maps and institutional affiliations.