Abstract
Inner Mongolia in China is a typically arid and semi-arid region with vegetation prominently affected by global warming and human activities. Therefore, investigating the past and future vegetation change and its impact mechanism is important for assessing the stability of the ecosystem and the ecological policy formulation. Vegetation changes, sustainability characteristics, and the mechanism of natural and anthropogenic effects in Inner Mongolia during 2000–2019 were examined using moderate resolution imaging spectroradiometer normalized difference vegetation index (NDVI) data. Theil–Sen trend analysis, Mann–Kendall method, and the coefficient of variation method were used to analyze the spatiotemporal variability characteristics and sustained stability of the NDVI. Furthermore, a trend estimation method based on a Seasonal Trend Model (STM), and the Hurst index was used to analyze breakpoints and change trends, and predict the likely future direction of vegetation, respectively. Additionally, the mechanisms of the compound influence of natural and anthropogenic activities on the vegetation dynamics in Inner Mongolia were explored using a Geodetector Model. The results show that the NDVI of Inner Mongolia shows an upward trend with a rate of 0.0028/year (p < 0.05) from 2000 to 2019. Spatially, the NDVI values showed a decreasing trend from the northeast to the southwest, and the interannual variation fluctuated widely, with coefficients of variation greater than 0.15, for which the high-value areas were in the territory of the Alxa League. The areas with increased, decreased, and stable vegetation patterns were approximately equal in size, in which the improved areas were mainly distributed in the northeastern part of Inner Mongolia, the stable and unchanged areas were mostly in the desert, and the degraded areas were mainly in the central-eastern part of Inner Mongolia, it shows a trend of progressive degradation from east to west. Breakpoints in the vegetation dynamics occurred mainly in the northwestern part of Inner Mongolia and the northeastern part of Hulunbuir, most of which occurred during 2011–2014. The future NDVI trend in Inner Mongolia shows an increasing trend in most areas, with only approximately 10% of the areas showing a decreasing trend. Considering the drivers of the NDVI, we observed annual precipitation, soil type, mean annual temperature, and land use type to be the main driving factors in Inner Mongolia. Annual precipitation was the first dominant factor, and when these four dominant factors interacted to influence vegetation change, they all showed interactive enhancement relationships. The results of this study will assist in understanding the influence of natural elements and human activities on vegetation changes and their driving mechanisms, while providing a scientific basis for the rational and effective protection of the ecological environment in Inner Mongolia.
1. Introduction
Vegetation is an important component of ecosystems and plays a key role in the carbon cycle [1,2,3]. Distinctive interannual and seasonal variations have been observed while studying vegetation trends [2,4,5]. Vegetation indices can provide substantial information on terrestrial vegetation; they are often used as an important parameter in characterizing surface vegetation for environmental quality assessments. Furthermore, vegetation indices are important for studying the hydrology, ecology, and regional changes [6,7]. Numerous studies have shown that the normalized difference vegetation index (NDVI) correlates well with the biomass and leaf area indices, allowing a good representation of the surface vegetation coverage. This can be used to effectively characterize vegetation activity and productivity and is suitable for representing changes in surface vegetation cover [1,8,9,10]. With recent advancements in remote sensing technology, moderate resolution imaging spectroradiometer (MODIS) NDVI has become the primary data source for large-scale vegetation cover research because of its advantageous characteristics, such as high quality, wide areal coverage, high temporal resolution, and accessibility [11,12,13].
Currently, researchers mostly focus on the study of the overall trend of NDVI. Sen’s slope is often used for quantifying the overall trend of the NDVI time series, as it is a non-parametric method that is less sensitive to outliers and skewed distributions [14]. However, this method can only be used to estimate the magnitude of NDVI changes and cannot determine the significance of the slope, so the results lack statistical significance. Therefore, researchers are increasingly applying the Mann–Kendall test to assess the significance of monotonic trends (linear or nonlinear) using a combination of Mann–Kendall test and Sen’s slope algorithm for time series with outliers, to simultaneously assess and quantify monotonic interannual trends. This strategy is more robust than using parametric statistics, such as ordinary least squares. Therefore, the Mann–Kendall method is well suited to examine trends in vegetation [15,16]. However, only studying the interannual variations in NDVI can ignore the changes in the details of NDVI time series, and for a detailed description of NDVI changes, the ephemeral disturbances that occur in a time series need to be assessed [17]. Several methods have been proposed to detect sudden changes in vegetation, including the Landsat-based detection of trends in disturbance and recovery [18], breaks for additive season and trend (BFAST) [19], vegetation change tracker [20], and the detection of breakpoints and estimation of segments in trend methods. Due to the diversity and uncertainty of vegetation change, only high-frequency time series can describe the entire process of vegetation change in a short time interval [21,22]. Therefore, only change detection with dense satellite time series data can meet the requirements for the dynamic monitoring of vegetation cover changes [7]. A trend estimation method based on seasonal trend model (STM), originating from BFAST, considers the seasonality and noise of the NDVI time series. Therefore, it allows changes in the phenological cycle, as well as long-term NDVI trends, to be detected, distinguished, and quantified [23,24,25]. Therefore, it has received wide attention in the analysis of mutations that occur in a time series, and researchers are increasingly using this method for trend and breakpoint analysis of NDVI time series, time series smoothing and interpolation, and surface phenology analysis [25,26,27]. In this study, trends in the NDVI time series were explored using a combination of methods, analyzing both overall and mutational details.
Vegetation trends need to be fully characterized to provide information for decision making. Therefore, the Hurst index estimated by the R/S method was introduced to predict the future trend of vegetation in order to understand whether the vegetation trend has long-range memory. The R/S method provides specific information on correlation and persistence and is an effective index for studying complex processes such as vegetation time series [28,29]. Combining R/S and trend methods for future trend studies can provide insights into the continuity and future direction of vegetation change trends. Multiple researchers have introduced STM, Sen’s slope, the Mann–Kendall test, and the Hurst index for studying changes in NDVI [30,31,32]. However, for the Inner Mongolia region, human activities such as national ecological projects, changes in grazing practices, and accelerated urbanization, together with the impact of climate change on vegetation cover, are all non-negligible factors for the spatial heterogeneity of NDVI [33,34,35]. Therefore, it would be too simple to explore only the spatial and temporal variations in NDVI.
In recent years, the ecological problems in Inner Mongolia have become increasingly severe [36,37]. As an important ecological barrier in the northern region of China, the ecological condition in Inner Mongolia has an important impact in North China, and exploring the driving mechanism of vegetation change is an important prerequisite for solving ecological problems. Climate change and human activities are the main mechanisms studied in vegetation research [38,39]. The Fifth Assessment Report of the Intergovernmental Panel on Climate Change states that many aspects of vegetation phenology, composition, and productivity have been affected by global warming over the past 30 years [40,41,42]. Many studies have attempted to quantify the relationship between vegetation indices and meteorological factors, but most focused on linear relationships and only on two factors, temperature and precipitation, leading to inadequate conclusions and failing to quantify the contribution and interactions of the drivers of vegetation change [43,44]. Additionally, the impact of human activities on vegetation cannot be ignored. Attempts have been made to study this using residual analysis, but this method is crude, allowing the quantification of the overall impact of human activities, but being unable to identify the human activity factor that is specifically responsible. In addition to the methods mentioned above, multiple linear regression methods [43], structural equation models [45], random forest models [46], and other methods have been introduced to study the effects of human activities and meteorological elements on NDVI. However, the influence mechanisms of vegetation are complex and diverse, and it is not sufficient to study complex multivariate nonlinear relationships using simple linear correlations. In order to obtain more objective and accurate evaluation results, we detected NDVI spatial differentiation and related drivers from a multivariate spatial perspective, using a Geodetector approach that can avoid the interference of subjective factors [47,48]. We also explored the potential and interactive effects of anthropogenic and natural factors on vegetation growth.
The Inner Mongolia region is located in the northern frontier of China, with a vast territory, high terrain, and complex and diverse landscapes, and is one of the most sensitive regions in the world to external environmental changes due to its arid and semi-arid climate [49]. Over the past 40 years, temperatures in the region have risen much faster than the global average, and the rapid rise in temperature and dramatic reduction in precipitation have exacerbated the degradation of vegetation [50,51]. In addition, since 2000, the region has entered a phase of rapid socioeconomic development, and climate change and human activities are rapidly restructuring the structure and function of vegetation systems at all levels and simultaneously affecting the ecology and future sustainability of the region [52]. However, current studies on the driving mechanisms of vegetation growth focus on natural factors, and anthropogenic factors are often neglected. Therefore, in this study, we use the Geodetector model combined with geospatial data and climate and human activity factor data, for a comprehensive investigation of the mechanisms that influence NDVI spatial patterns. DEM, slope and land type, and precipitation and temperature data were selected for analyzing the driving factors, after considering the special topographic and climatic conditions of the Inner Mongolia region [53]. In terms of anthropogenic factors, the impact of human activities on the ecological environment is becoming more and more complex as urbanization accelerates, and we chose GDP, land use type, and population data to explore this aspect [54]. In addition, as Inner Mongolia is a major livestock province in China, the impact of grazing intensity on vegetation change should not be neglected. We chose the number of livestock as a representative driver to examine its influence [55].
Overall, the objectives of this study were: (1) To study the interannual variations of the NDVI characteristics during 2000–2019 for each vegetation type in Inner Mongolia using time series analyses and Mann–Kendall tests; (2) to assess the NDVI stability over the last 20 years in Inner Mongolia by calculating the coefficient of variation; (3) to detect breakpoints in the NDVI at the pixel scale using the STM method and to conduct a trend analysis at each stage; (4) to predict future trends in vegetation dynamics in Inner Mongolia using the Hurst exponent and R/S analysis; and (5) to quantify the mechanisms of single and compound influences of natural and anthropogenic factors on the NDVI using Geodetector. The results of this study can provide a basis for understanding vegetation trends and ecosystem evolution and for predicting the future direction of vegetation growth in Inner Mongolia. These results are of great theoretical and practical significance for guiding future ecological conservation policies and managing the effects of climatic and anthropogenic factors on vegetation growth in Inner Mongolia.
2. Materials and methods
2.1. Study Area
The Inner Mongolia Autonomous Region is in the northern borderlands of China, between 7°12′ and 126°04′ E and 37°24′ and 53°23′ N. With a total area of 118.3 km2, it is the third largest province in China, accounting for 12.3% of the country’s total land area. The area predominantly experiences a temperate continental monsoon climate, with marked regional and seasonal differences. Precipitation decreases from the northeast to the southwest, exhibiting marked gradient differences. The average annual temperature increases from the northeast to the southwest [56]. There is a rich variety of soil types that are distributed from east to west as black soil, dark brown loam, black calcareous soil, chestnut calcareous soil, brown loam, gray calcareous soil, sandy soil, and gray desert soil [57]. The vegetation types include forest, grassland, and desert in the order of decreasing precipitation from east to west, with three sub-categories of grassland vegetation: Meadow grassland, typical grassland, and desert grassland, depending on the climatic zone [58] (Figure 1).
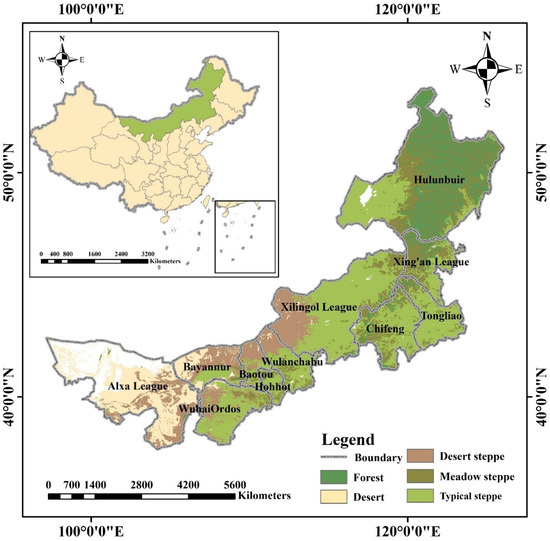
Figure 1.
Study area, and the different vegetation and steppe types in Inner Mongolia.
2.2. Data Sources
The data used in this research (Table 1) were pre-processed to meet the accuracy requirements of the research and for consistency between different data sources. MODIS reprojection tool (MRT) was used to pre-process the NDVI data. Analysis included reprojection, stitching, and format conversion, while the original HDF format was transformed into the ArcGIS editable TIFF file, and its coordinate system and projection were defined. Furthermore, MATLAB was used to remove outliers through the maximum value synthesis method to obtain the optimal NDVI raster. The meteorological data was interpolated to monthly scale spatial data using Albers projection and Kriging interpolation, before being synthesized into annual precipitation and annual mean temperature spatial data at the monthly scale using Raster Calculator. Finally, the data were masked using the administrative boundaries of the Inner Mongolia region.

Table 1.
Sources of dataset.
We also used livestock data from 2010 [59], gross domestic product (GDP) data, and human population (POP) data to represent different anthropogenic factors. Specific information is shown in Table 1 and Figure 2.
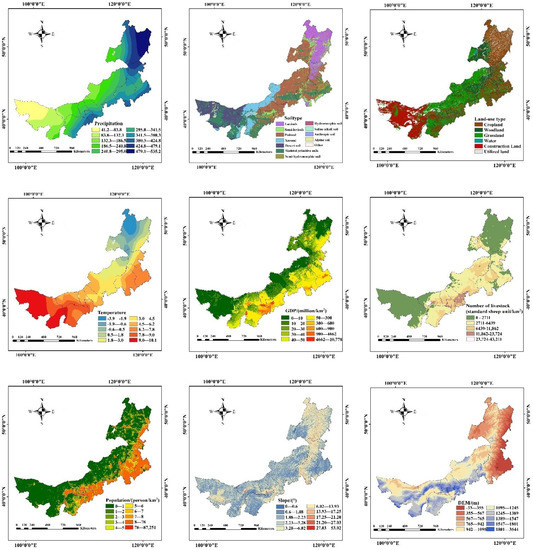
Figure 2.
NDVI drivers and spatial distribution in Inner Mongolia.
2.3. Methods
2.3.1. Spatial Trend Analysis Methods
The combination of the Theil–Sen trend analysis and the Mann–Kendall test does not require the data to follow a certain distribution when analyzing trends over a time series. Furthermore, the combination is more resistant to data errors and the results from the significance level test are more scientifically reliable than other research methods [29].
Theil–Sen trend analysis is a very reliable non-parametric statistical calculation method that is computationally efficient, insensitive to measurement errors and outlier data, and is often used in the trend analysis of long time series. This is calculated as follows:
where NDVIj and NDVIi are the NDVI values of a certain pixel in years j and i, respectively. In this study, 2019 ≥ j ≥ i ≥ 2000. Additionally, the median represented here is the median of the requested series. When β is greater than 0, an increasing trend is observed in the NDVI and when β is less than 0, the NDVI presents a decreasing trend. When β is equal to 0, the NDVI is stable.
The Mann–Kendall method is a non-parametric statistical test that was originally proposed by Mann in 1945 and further refined by Kendall and Sneyers. It is advantageous as it does not require normally distributed measurements or a linear trend and remains unaffected by missing values or outliers. It is widely used for the trend significance testing of long-series data [61]. The Mann–Kendall statistic S is calculated for the time series {NDVIi} as follows:
where n is the length of the time series, and sgn is the sign function, defined as:
When n ≥ 8, S follows a normal distribution with a mean of zero and a variance of:
The standardization of S is as follows:
where Zc is the statistic normalized by the Mann–Kendall test and follows a normal distribution. When β = 0, there is no monotonic trend in the study series when the null hypothesis holds and is combined with Theil–Sen trend analysis. Conversely, when the null hypothesis does not hold, there is significant variation in the analyzed series at the alpha level if the absolute value of Zc is greater than the standard normal distribution. This study tested the significance of trends in NDVI time series at a confidence level of α = 0.05.
Additionally, the NDVI values for each pixel in the study area during 2000–2019 were subjected to Theil–Sen trend analysis to obtain the spatial distribution of the trend values. If β > 0, the annual average NDVI of the pixel shows an increasing trend, whereas if β < 0, the annual average NDVI of the pixel shows a decreasing trend. Because there is essentially no region where β is strictly equal to 0, the interval between −0.001 and 0.001 was classified as stable and constant in this research, based on the actual situation of β. The results of the Mann–Kendall test, at a confidence level of 0.05, were classified as significant (|Zc| > 1.96) or insignificant changes (|Zc| ≤ 1.96).
In this study, areas with a multi-year average NDVI of less than 0.08 were considered to be unvegetated and were excluded [62].
2.3.2. Coefficient of Variation
The coefficient of variation (Cv) is a statistical index that describes the ratio of a variable relative to its mean, and is regarded as a useful indicator of interannual variability in an ecosystem. Specifically, a lower Cv value indicates a lower fluctuation and greater stability of the vegetation, while a higher Cv value indicates less stable vegetation. The calculation is as follows:
where NDVIi is the NDVI value in year i and is the average NDVI value from February 2000 to December 2019.
In this study, the stability of the interannual variation of the NDVI in Inner Mongolia was expressed using Cv to indicate the fluctuation of NDVI in each region over a 20 year period. The Cv of the NDVI in Inner Mongolia during 2000–2019 was calculated pixel-by-pixel.
2.3.3. Trend Estimation Based on Seasonal Trend Model
The STM is based on the BFAST and the classical additive decomposition model, which constructs estimation methods for trends and breakpoints [63,64]. A segmented linear trend and seasonal regression model of NDVI during 2000–2019 to explain the NDVI value y at moment t can be expressed as:
where α1 is the intercept, α2 is the slope of the trend, γ is the amplitude, δ is the phase of the k harmonic term, ε is the residual error, and f is the number of observations per year. The parameters α1 and α2 were estimated using an ordinary least squares regression, wherein the derived time series segments were considered as categorical interaction terms with a trend slope of α2. The significance of the trend in each segment was estimated using a t-test for the interaction parameter of the regression between the time series segment and α2.
The presence of breakpoints can, under certain circumstances, indicate a shift in the mechanism of influence on the time series. Therefore, if breakpoints are not considered, the results of the trend analysis may lead to a misjudgment of the factors that influence vegetation changes in Inner Mongolia [65,66]. Therefore, in this study, the times at which breakpoints occurred were used as time splitting points, at which the time series was split into two subseries; before and after the breakpoint. Then, the time trends and significance levels of the subseries were monitored separately to obtain accurate conclusions regarding the fluctuations in vegetation trends in Inner Mongolia during 2000–2019.
2.3.4. Hurst Exponent and R/S Analysis
The Hurst exponent and R/S analysis have developed a fractal theory for studying time series and have been widely used in the research of urban environmental change, climate change, population, and economic development [67,68]. R/S analysis can be used to predict future trends in vegetation cover, wherein the main principle is to construct a time series that defines an average series , for any positive integer τ ≥ 1. First, the mean sequence must be defined:
Cumulative deviation:
The range:
Standard deviation:
For , if there is a relationship as follows:
where H is the Hurst index. According to the value of , H can be obtained using least squares fitting (Equation (8)) in a double logarithmic coordinate system. The H value provides information on whether the sequence is completely random or if it follows a trend. Furthermore, trends can be expressed as persistent or anti-persistent. Overall, indicates that vegetation change is random, indicates that vegetation change is sustainable, and indicates that future vegetation trend is expected to be the opposite of that in the past.
2.3.5. GeoDetector Model
GeoDetector is a statistical method used to explore spatial differentiation and quantify drivers [69]. In this study, four detector tools of the geographical detector model were used to quantify the drivers of NDVI in Inner Mongolia.
The dependent variable Y is the NDVI value for Inner Mongolia and the independent variable X includes natural and social drivers.
(1) The factor detector focuses on exploring the spatial heterogeneity of the dependent variable Y and the extent to which the independent variable X explains the spatial heterogeneity of Y. The expressions are:
where q represents the explanatory power of the metric factors on Y. Specifically, a larger q indicates that the explanatory power of each metric factor is stronger, indicating that it has more influence on the spatial distribution of the NDVI, and the range of q values is {0,1}. Note that h = 1, 2 …, L is the classification or partition of Y or X; Nh and N represent the number of cells in layer h and the entire area, respectively; and are the variances of layer h and the entire area, respectively; and SSW and SST are the sum of the within-layer variance and total variance of the entire area, respectively.
(2) An ecological detector was used to determine if a significant difference existed between the effects of two drivers on the spatial distribution of the dependent variable, as measured by the F-statistic:
where Nx1 and Nx2 denote the sample sizes of the two drivers, and SSWx1 and SSWx2 denote the sum of the within-layer variance for the stratum formed by the two drivers.
(3) An interaction detector was used to identify interactions between the different drivers by assessing whether the explanatory power of factors X1 and X2 increases or decreases for the dependent variable Y when they function together [70]. It is also possible that the effects of these factors on the dependent variables were independent. The results of this assessment were obtained by comparing the q-values q(X1) and q(X2) for the two factors on Y, with the q-values on Y after the interaction between the two factors.
(4) A risk detector was used to detect the appropriate extent or type of vegetation cover impact by different drivers, and uses the t-statistic as follows:
where is the mean value of the NDVI attributes in sub-region h, nh is the number of samples in sub-region h, and Var denotes variance.
GeoDetector was used to analyze variables that must be discretized for continuous types of data. Additionally, the natural intermittency grading method was used to maximize the differences between the groups. This method considers the large latitudinal span of Inner Mongolia, the diverse climate, temperature, soil, etc., and examines the representativeness, typicality, and scientificity of various driving factors. Nine representative and available datasets were selected as drivers for exploring the distribution and changes in the NDVI in Inner Mongolia, including five natural factors: Precipitation, temperature, elevation, soil type, and slope; and four social factors: Population, GDP, land use type, and livestock density. Based on the closest distance method, the average NDVI and nine drivers during 2000–2019 were resampled using ArcGIS 10.6, and the spatial resolution of the raster data was unified to 10 × 10 km. The natural breakpoint method was used to discretize the continuous driver data, and the spatial distribution is shown in Figure 2.
3. Results
3.1. NDVI Temporal Annual Variation Characteristics
To study the annual changes in the NDVI during 2000–2019 in Inner Mongolia, a time series analysis of the vegetation cover was conducted for each year (Figure 3). The results showed that the annual NDVI values in Inner Mongolia fluctuated upward from 0.42 to 0.51 between 2000 and 2019, at a growth rate of 0.0028/year (p < 0.05) and a multi-year average of 0.46. The NDVI fluctuated less throughout Inner Mongolia considering interannual variation, with the maximum NDVI of 0.51 recorded in 2018, and the minimum of 0.42 recorded in 2001.
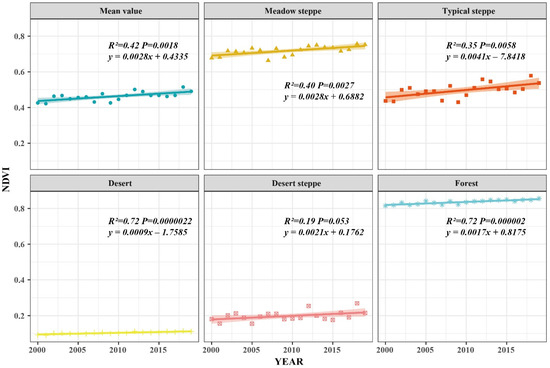
Figure 3.
Interannual variation of NDVI by vegetation types in Inner Mongolia from 2000 to 2019.
Considering each vegetation type as a unit, forest had the highest mean NDVI value of 0.83, which fluctuated moderately, with a maximum NDVI value of 0.85 occurring in 2019 and a minimum of 0.81 in 2000. The difference between the annual maximum (0.75) and minimum (0.66) values of the NDVI for the meadow steppe was 0.09. The fluctuating trends were similar to those of typical steppe, with the maximum and minimum values occurring in 2018 and 2007, respectively. Meanwhile, the typical steppe NDVI values showed an overall increasing trend over the 20 year period, with NDVI values decreasing from 2000 to 2009, reaching a minimum value of 0.42 in 2009, and then increasing for three consecutive years. Relatively large fluctuations were observed from 2010 to 2013, reaching a maximum value of 0.57 in 2018. The NDVI value for the desert steppe was relatively low at 0.19, with a peak of 0.25 in 2012. It is noteworthy that the desert had the lowest NDVI value of 0.1 and the value fluctuated the least.
3.2. Spatial Variability of NDVI
3.2.1. Spatial Distribution and Trend Analysis of NDVI
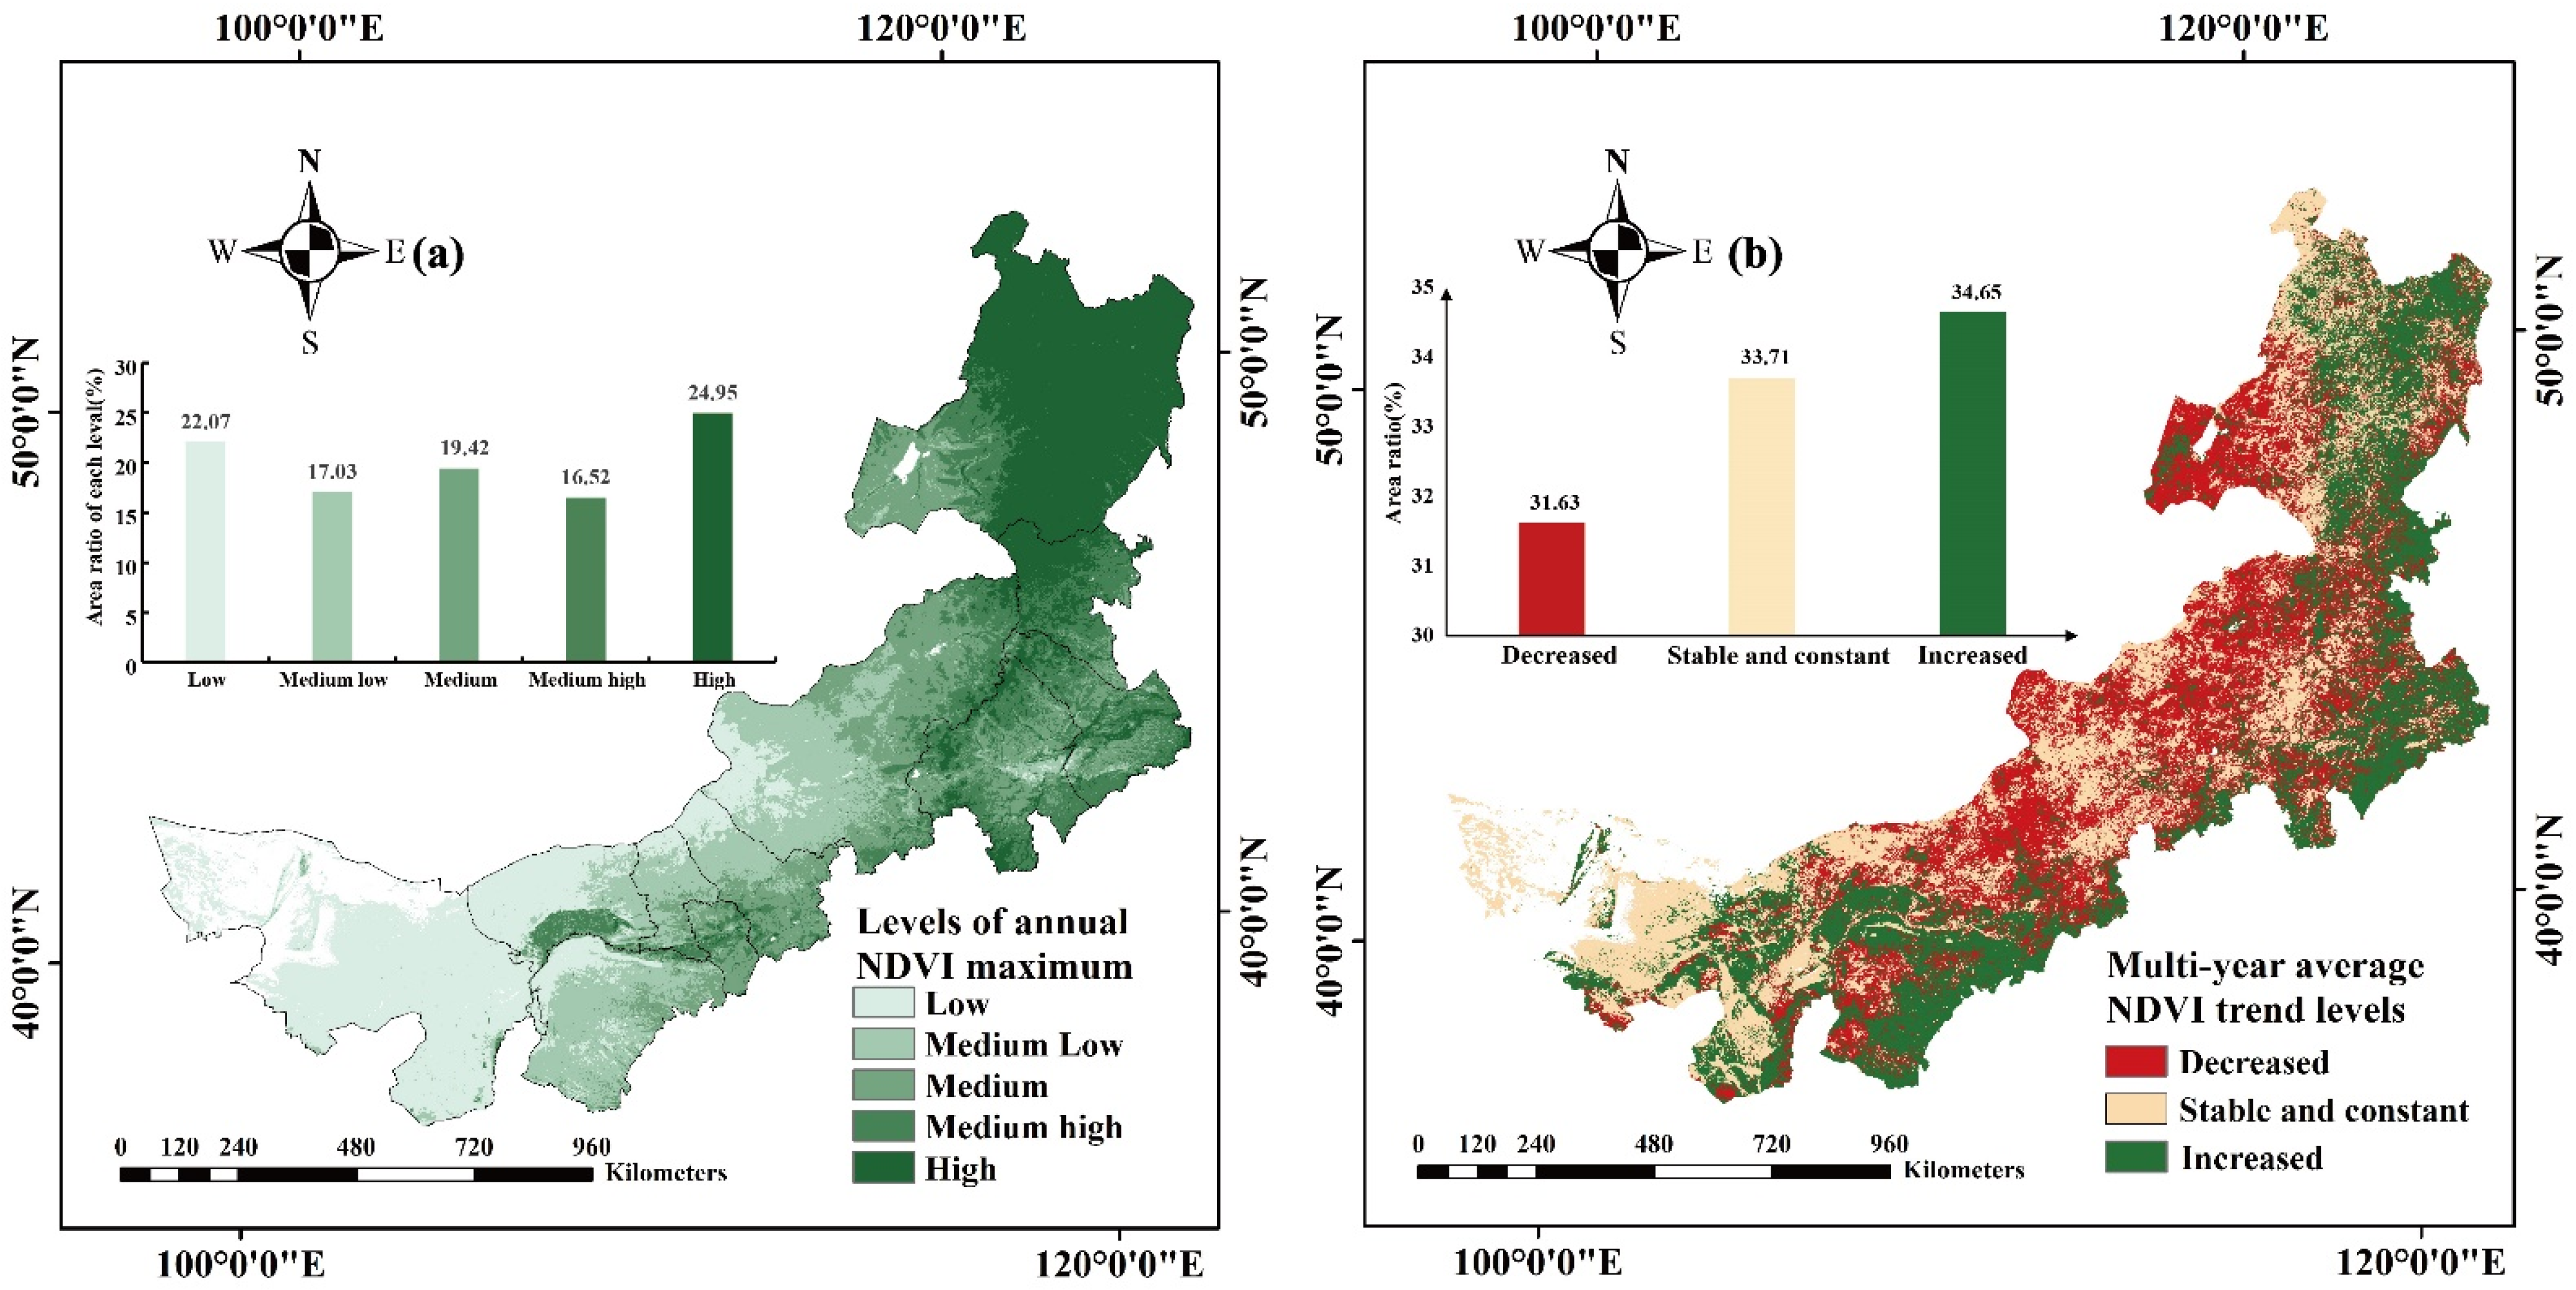
The remaining regions were classified into five levels using the equal spacing method in ArcGIS 10.6, into low (0.08–0.25), medium-low (0.25–0.41), medium (0.41–0.58), medium-high (0.58–0.75), and high (0.75–0.92) vegetation cover (Figure 4a) [29]. From the spatial distribution of NDVI levels, the high vegetation cover (0.75–0.92) area was the largest, accounting for 24.95% of the total area. Influenced by the large east-west span of Inner Mongolia, diverse and complex topography, large vertical differences in vegetation growth, and the complex spatial distribution, the NDVI gradually decreased from east to west from a regional perspective. Hulunbuir, the Xing’an League, Tongliao, and Chifeng, locations with forests and typical steppes, recorded high NDVI values, while areas with NDVI values less than 0.41 were mainly in the western Alxa League, Ordos, and Bayannur areas, where the vegetation cover types largely consist of desert and desert steppe.
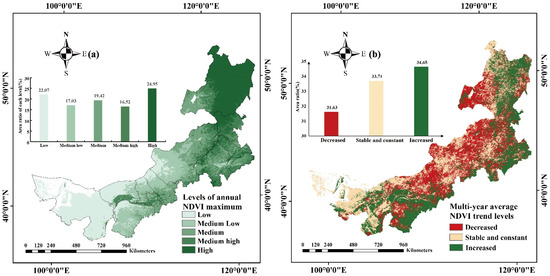
Figure 4.
Spatial trends distributions of NDVI in Inner Mongolia from 2000 to 2019. (a) levels of annual NDVI maximum, (b) Multi-year average NDVI trend levels.
Figure 4b shows the results of the Sen’s slope and Mann–Kendall test for annual NDVI. Referring to the grading method of Lu Hao et al. [71], we identified three trend types, “increased,” “stable and constant,” and “decreased.” Increased and decreased represent areas where the rising and falling NDVI trends pass the 0.05 significance level in the Mann–Kendall test, respectively, and we classified the remaining areas with NDVI trends that did not pass the 0.05 significance level into stable and constant. Area increasing NDVI were larger than those with decreasing NDVI, which is 34.65%, while 33.71% of the regions showed stable and constant NDVI. Increased and decreased NDVI mostly occur in eastern Hulunbeier, Xing’an Meng, Tongliao, southern Erdos, and southeastern Chifeng. The areas with stable and constant NDVI were mainly located in Alxa League. Finally, areas where NDVI decreased significantly were concentrated in Baotou, Hohhot, Ulanqab, Xilingol league, and the western part of Hulunbuir.
3.2.2. NDVI Stability Analysis
In terms of the area occupied by each type of variation level, low fluctuation areas > medium-low fluctuation areas > high fluctuation areas > medium fluctuation areas > medium-high fluctuation areas. As shown in Figure 5, areas with large fluctuations in NDVI accounted for 27.2% or the entire area, and were mainly distributed in Xilingol league, parts of Ulanqab and Baotou, and Alxa league. This is due to the sparse precipitation and poor soils in these areas. The corresponding vegetation types are mainly grasslands, deserts, or transition areas between grasslands and deserts. These have fragile ecological environments and vegetation cover that is vulnerable to external influences. Areas with low NDVI fluctuations accounted for 61.7% of the total area, mainly distributed in Hulunbuir, the Xing’an League, Tongliao, and Chifeng, with the vegetation types of forest, typical steppe, and meadow steppe. Fluctuation of NDVI in the Xilingol League, where typical steppes are distributed, was also low, which may be related to the good ecological environmental conditions of its forest and grassland areas; these are not easily influenced by external forces [1]. Additionally, the amplitude of fluctuations in grassland areas was greater than that in forest areas, which may be attributed to the grassland areas being under high pressure from population and livestock, and more strongly disturbed by human activities than forest areas.
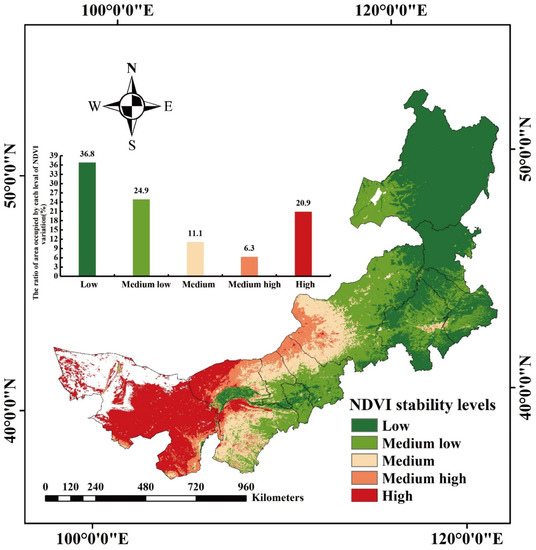
Figure 5.
Spatial distribution of NDVI stability levels in Inner Mongolia from 2000 to 2019.
3.2.3. Evaluation of Estimated Breakpoints and Trends
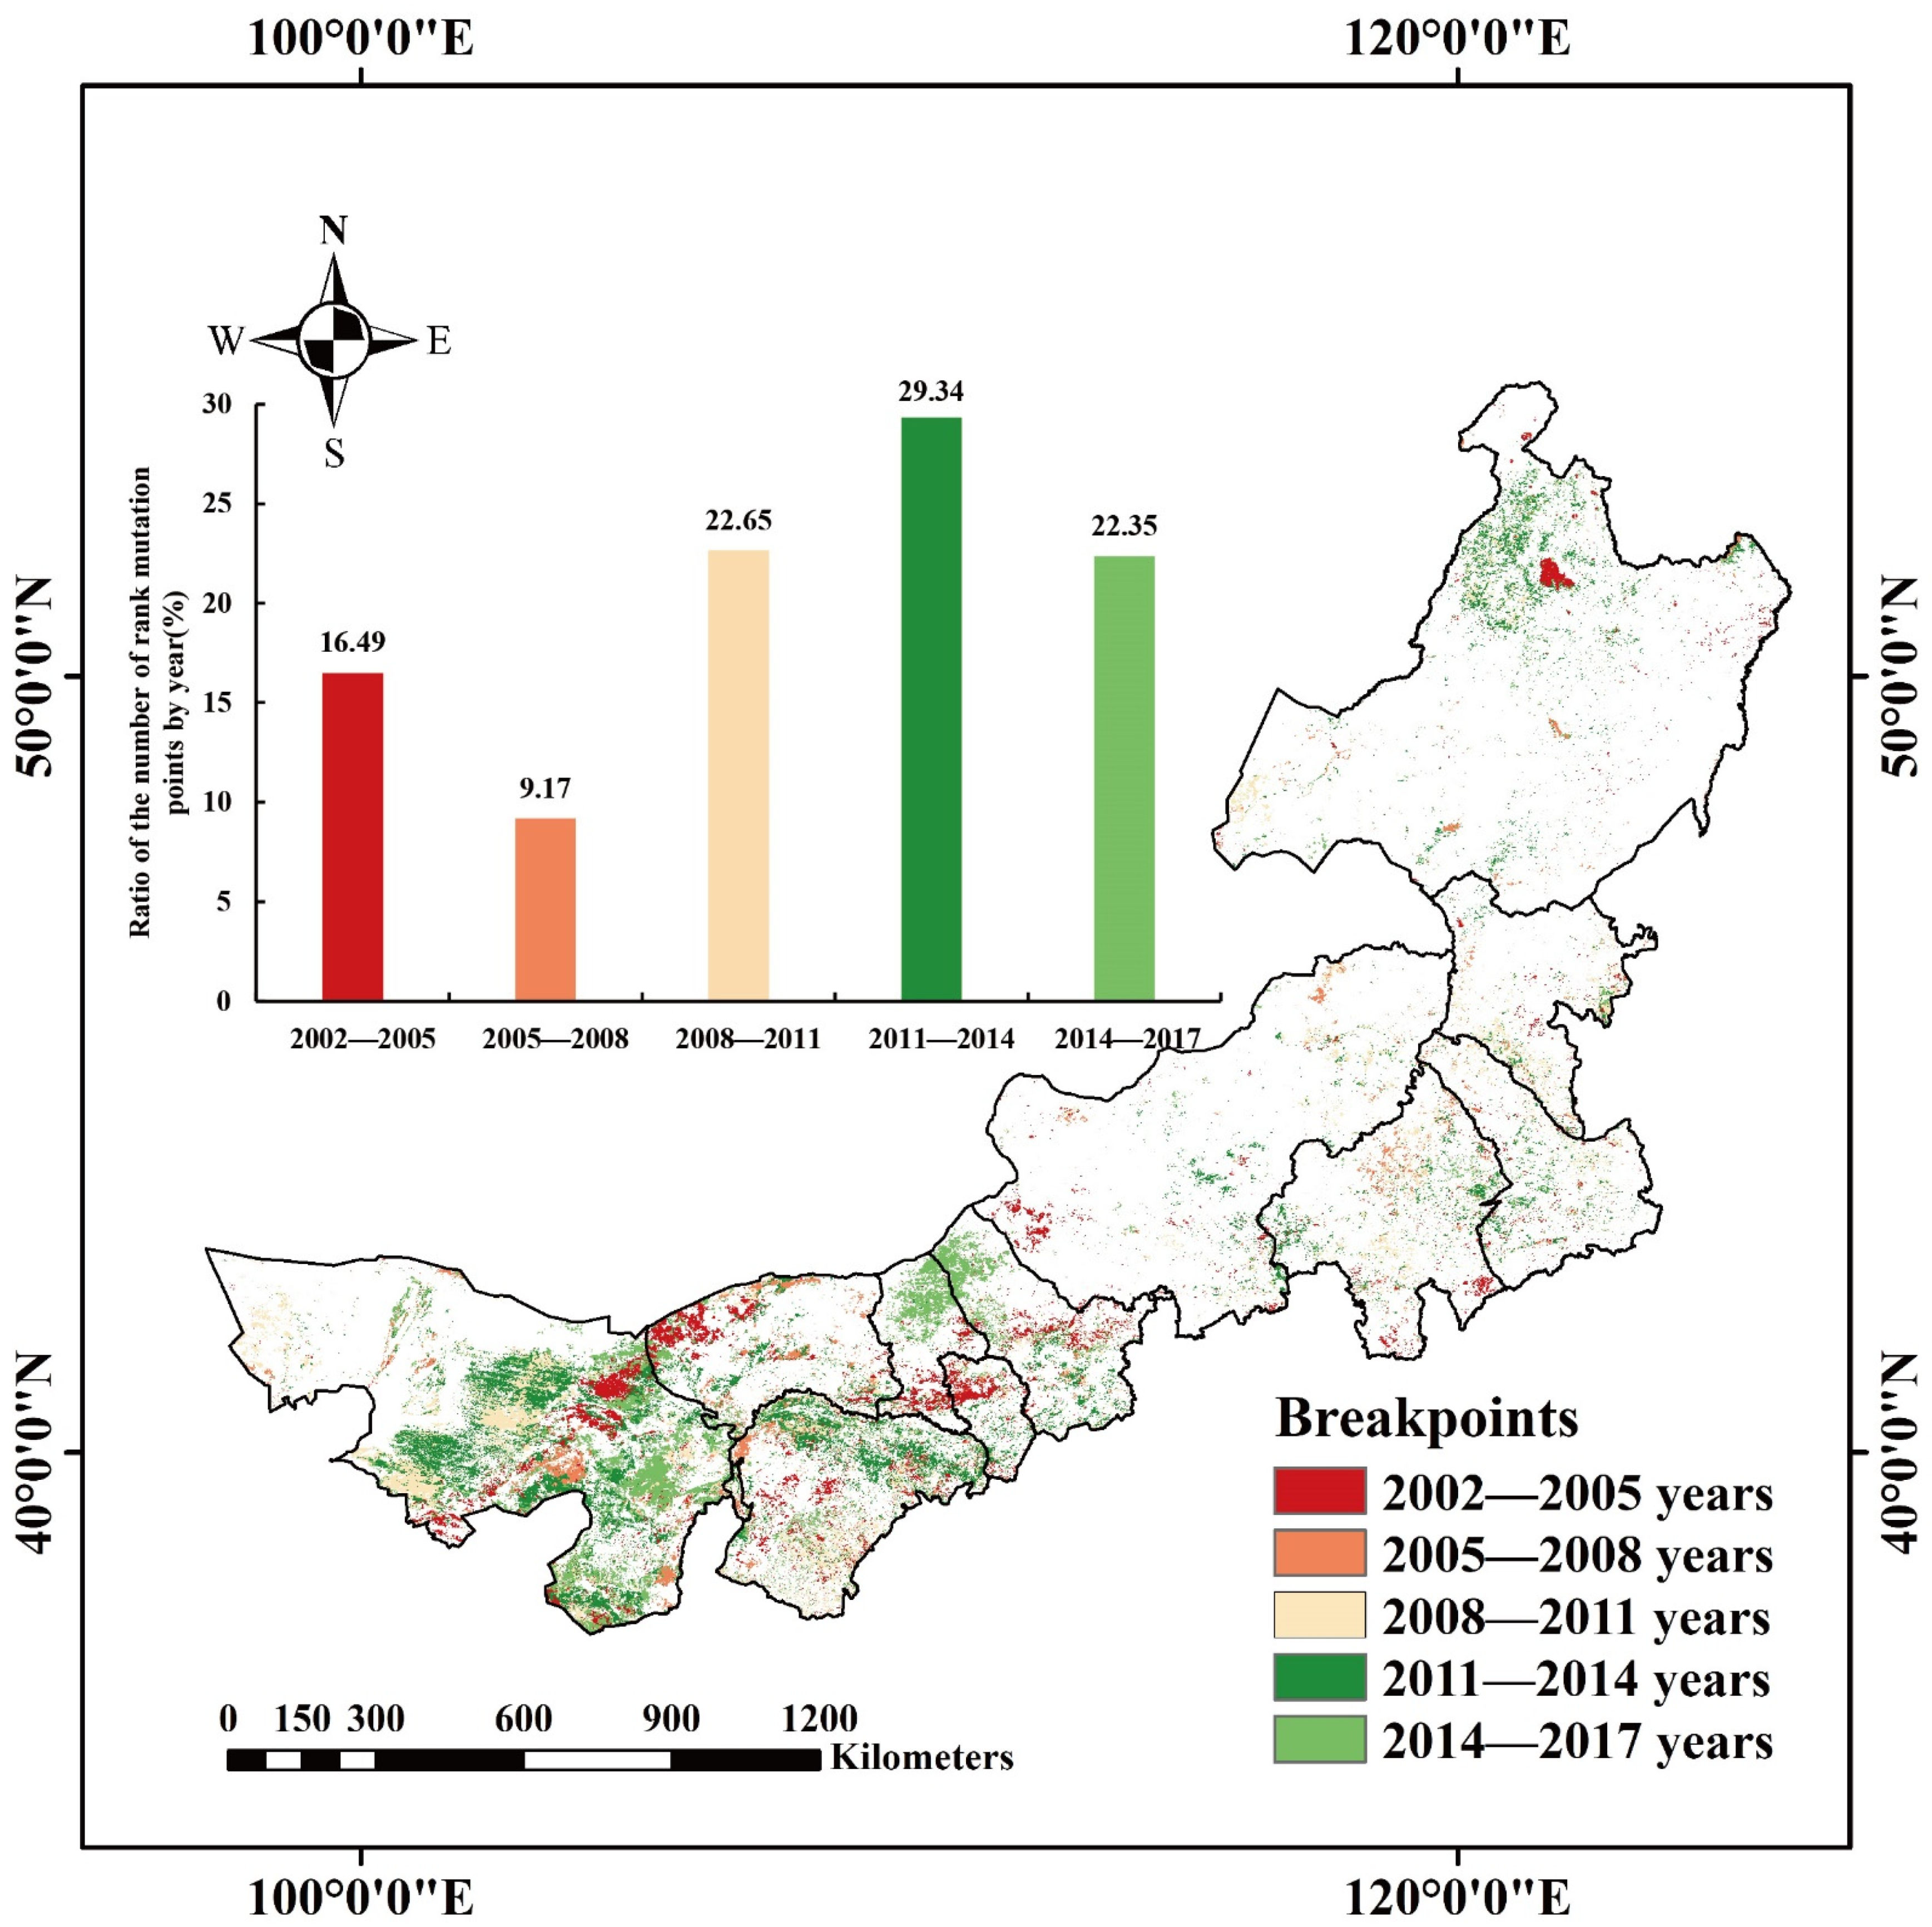
STM was applied to the NDVI sequences in Inner Mongolia, and the number of breakpoints and trend changes before and after the mutations and corresponding significance levels were calculated (Figure 6 and Figure 7). Considering the variations, approximately 16.49% of breakpoints occurred during 2002–2005, mainly in Genhe, Hulunbuir, the central Alxa League, southern Baotou, Bayannur, and northwestern Hohhot. Approximately 9.17% of the breakpoints were observed during 2005–2008, concentrated in the Alxa Right Banner and the northwestern part of Erdos. However, most of the pixels mutated during 2008–2011, distributed in the territory of the Alxa League. Finally, the largest number of pixels mutated during 2011–2014, accounting for 29.34% of all breakpoints, most of which were distributed in the areas of the Alxa League and Ordos, as well as a small part in the northeast of Hulunbuir. The remaining 22.35% of the pixels mutated during 2014–2017 and were concentrated in the southeastern part of the Alxa League, Baotou, and the northern part of Wulanchabu.

Figure 6.
Spatial distribution for breakpoints years of NDVI in Inner Mongolia during 2000–2019.
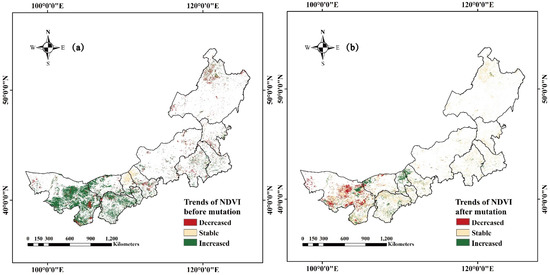
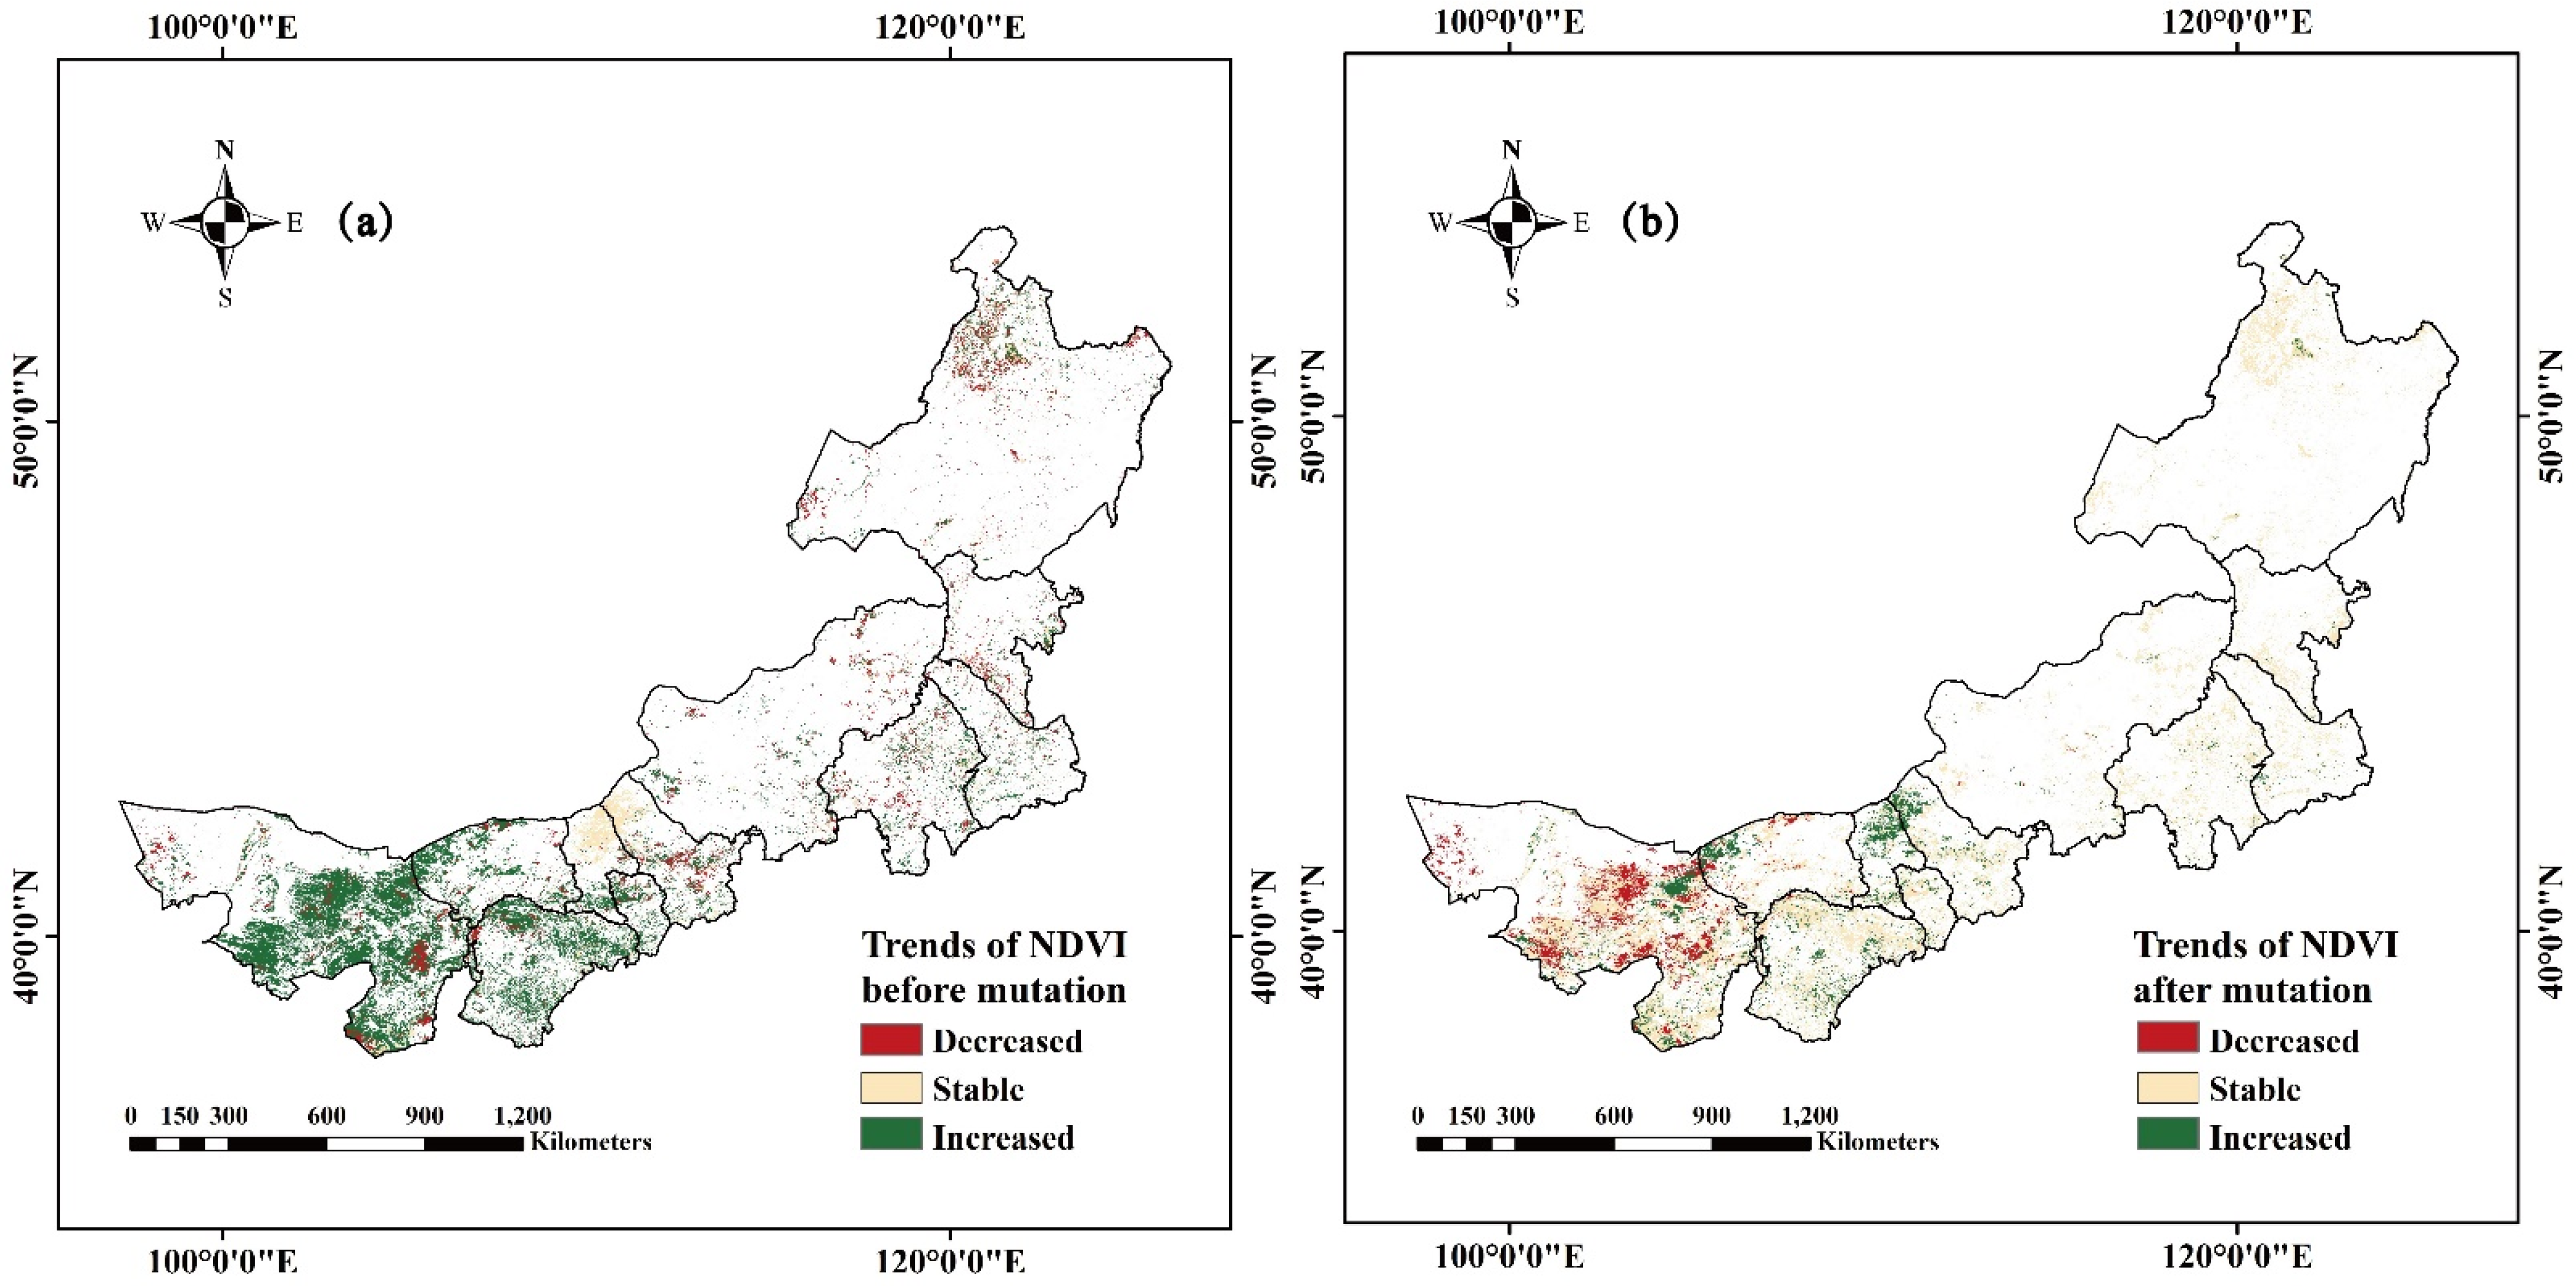
Figure 7.
Spatial distributions of trends before and after mutation in Inner Mongolia during 2000–2019. (a) trends of NDVI before mutation, (b) trends of NDVI after mutation.
According to the trends and the significance of changes before and after the mutations, we divided the trends into three levels of “increased,” “stable,” and “decreased.” The vegetation changes in the southeastern part of Alxa League, northwestern part of Bayannur, and most parts of Ordos before the mutation showed a significant upward trend. An obvious decreasing trend was observed in the south-central and eastern part of Alxa Left Banner, the south-central part of Ulanqab, Erguna, and Genhe of Hulunbeier, while the vegetation in the areas along the northwestern border of Baotou and Ulanqab showed a stable NDVI. Meanwhile, the areas with significantly increasing vegetation trends after the mutation occurred in the northern part of Alxa League, the northwestern part of Bayannur, and the border areas of Baotou and Ulanqab. The areas with significantly decreasing trends were in the central and eastern parts of Alxa League. Northwestern Hulunbeier, northern Hohhot, southern Ordos, and northwestern Bayannur, as well as small areas in Xing’an League, Tongliao, and Chifeng showed stable NDVI trends after mutation.
The spatial distribution of NDVI trends before and after the mutation shows obvious variability. For example, most pixels in the south-central region of Alxa League showed a significant increasing trend before an abrupt change to a decreasing trend after the mutation. Meanwhile, the NDVI values at the borders of Baotou and Ulanqab changed from a stable trend to an obvious increasing trend after the mutation, and the NDVI trends in most of the central-eastern parts of Inner Mongolia, which originally showed obvious decreases, gradually stabilized after the mutation. The occurrence of breakpoint years and the differences in the trends before, and after, the mutation may indicate changes in the potential influence mechanisms of NDVI in Inner Mongolia.
3.3. Future NDVI Trends
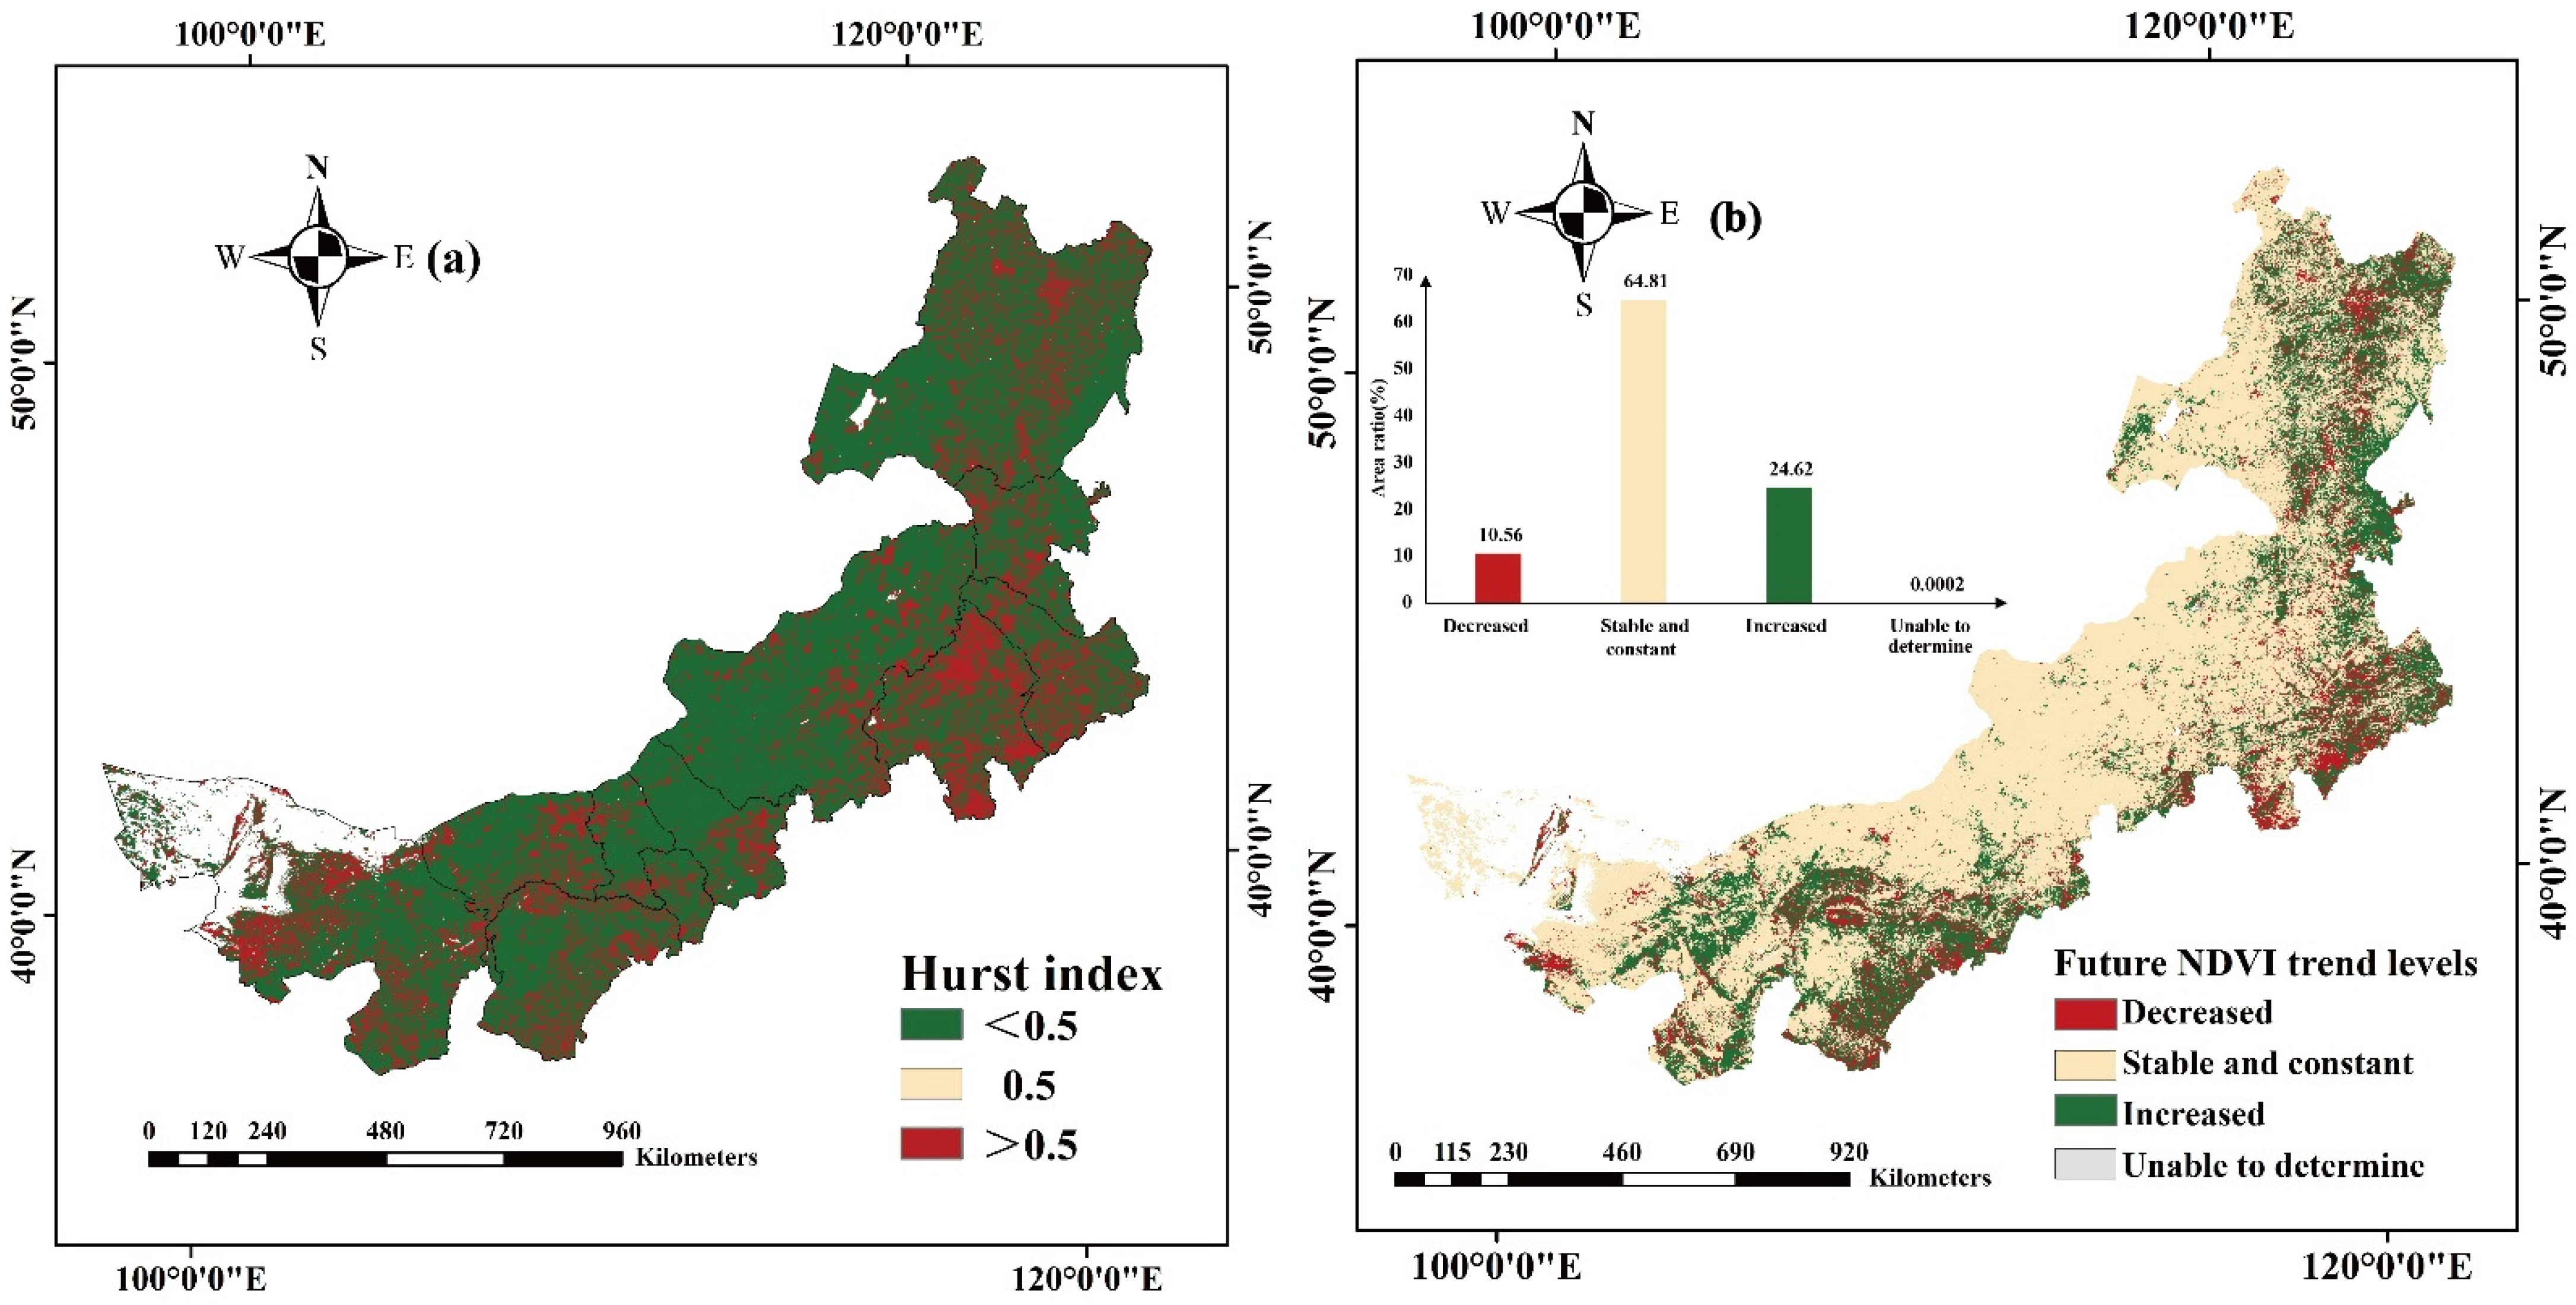
In this study, the Hurst index values for annual NDVI data were calculated on a pixel-by-pixel basis using MATLAB (Figure 8a). The Hurst index of NDVI in Inner Mongolia is low, with maximum, minimum, and mean values of 0.93, 0.09 and 0.44, respectively. The proportion of areas with a Hurst index less than 0.5 was 74.91%, while that of areas greater than 0.5 was 25.08%, indicating that the reversal of the vegetation trend in the future is likely in most areas of Inner Mongolia. This indicates that future changes will be the opposite to those in the present. Furthermore, the Hurst values are low in the border areas between Inner Mongolia and Mongolia and relatively high in other areas. Additionally, the areas with a Hurst index greater than 0.5 are concentrated in the south of Chifeng, Xilingol League, and Alxa League.

Figure 8.
Spatial distribution of the Hurst index and future NDVI trend levels in Inner Mongolia during 2000–2019. (a) Hurst index, (b) Future NDVI trend levels.
The Sen’s slope and Mann–Kendall test can gradually quantify trends in the NDVI, and the Hurst index can be used to qualitatively predict whether future trends will be similar to those at present. However, neither of these methods can predict future increases or decreases in trends. The NDVI trends were coupled with the Hurst index classification results to obtain the spatial distribution of future changes of vegetation cover in Inner Mongolia (Figure 8b), and the future change trends were classified into the following four levels: “increased,” “constant,” “decreased,” and “unable to determine,” which were used to provide reasonable predictions of future vegetation change trends. Where “increased” and “decreased” represent predicted increases and decreases in future NDVI trends passing the 0.05 significance level in the Mann-Kendall test, respectively. The remaining NDVI trends that did not pass the 0.05 significance level, as well as the areas that were unchanged were notes as constant. The results showed that the area with stable and constant NDVI was the largest. Areas with increased NDVI in Inner Mongolia are larger than areas with decreased NDVI. Increased areas account for approximately 24.62% of the total area and are mainly located in Hulunbeier, Xing’an League, eastern Tongliao, and south-central Alxa League, which may be due to the large-scale ecological management and soil and water conservation and afforestation policies in these areas. Meanwhile, decreased areas, which account for about 10.56% of the total area of Inner Mongolia, are concentrated in the southern part of Inner Mongolia, which is mainly arable land and highly influenced by human activities. In addition, the Wuliang Suhai area in Bayannur, located in the lower reaches of the Yellow River, has experienced vegetation degradation due to increasing ecological pollution [72]. The areas with stable and constant future trends of NDVI accounted for 64.81% of the total area and were distributed throughout the region. In the areas with stable and constant NDVI levels, areas with positive Sen’s slope values and p > 0.05 are the largest. This indicates that areas with increasing NDVI in Inner Mongolia will increase more areas with decreasing NDVI in the future.
3.4. Geographical Detection Model for NDVI Drivers
3.4.1. Driving Factor Impact
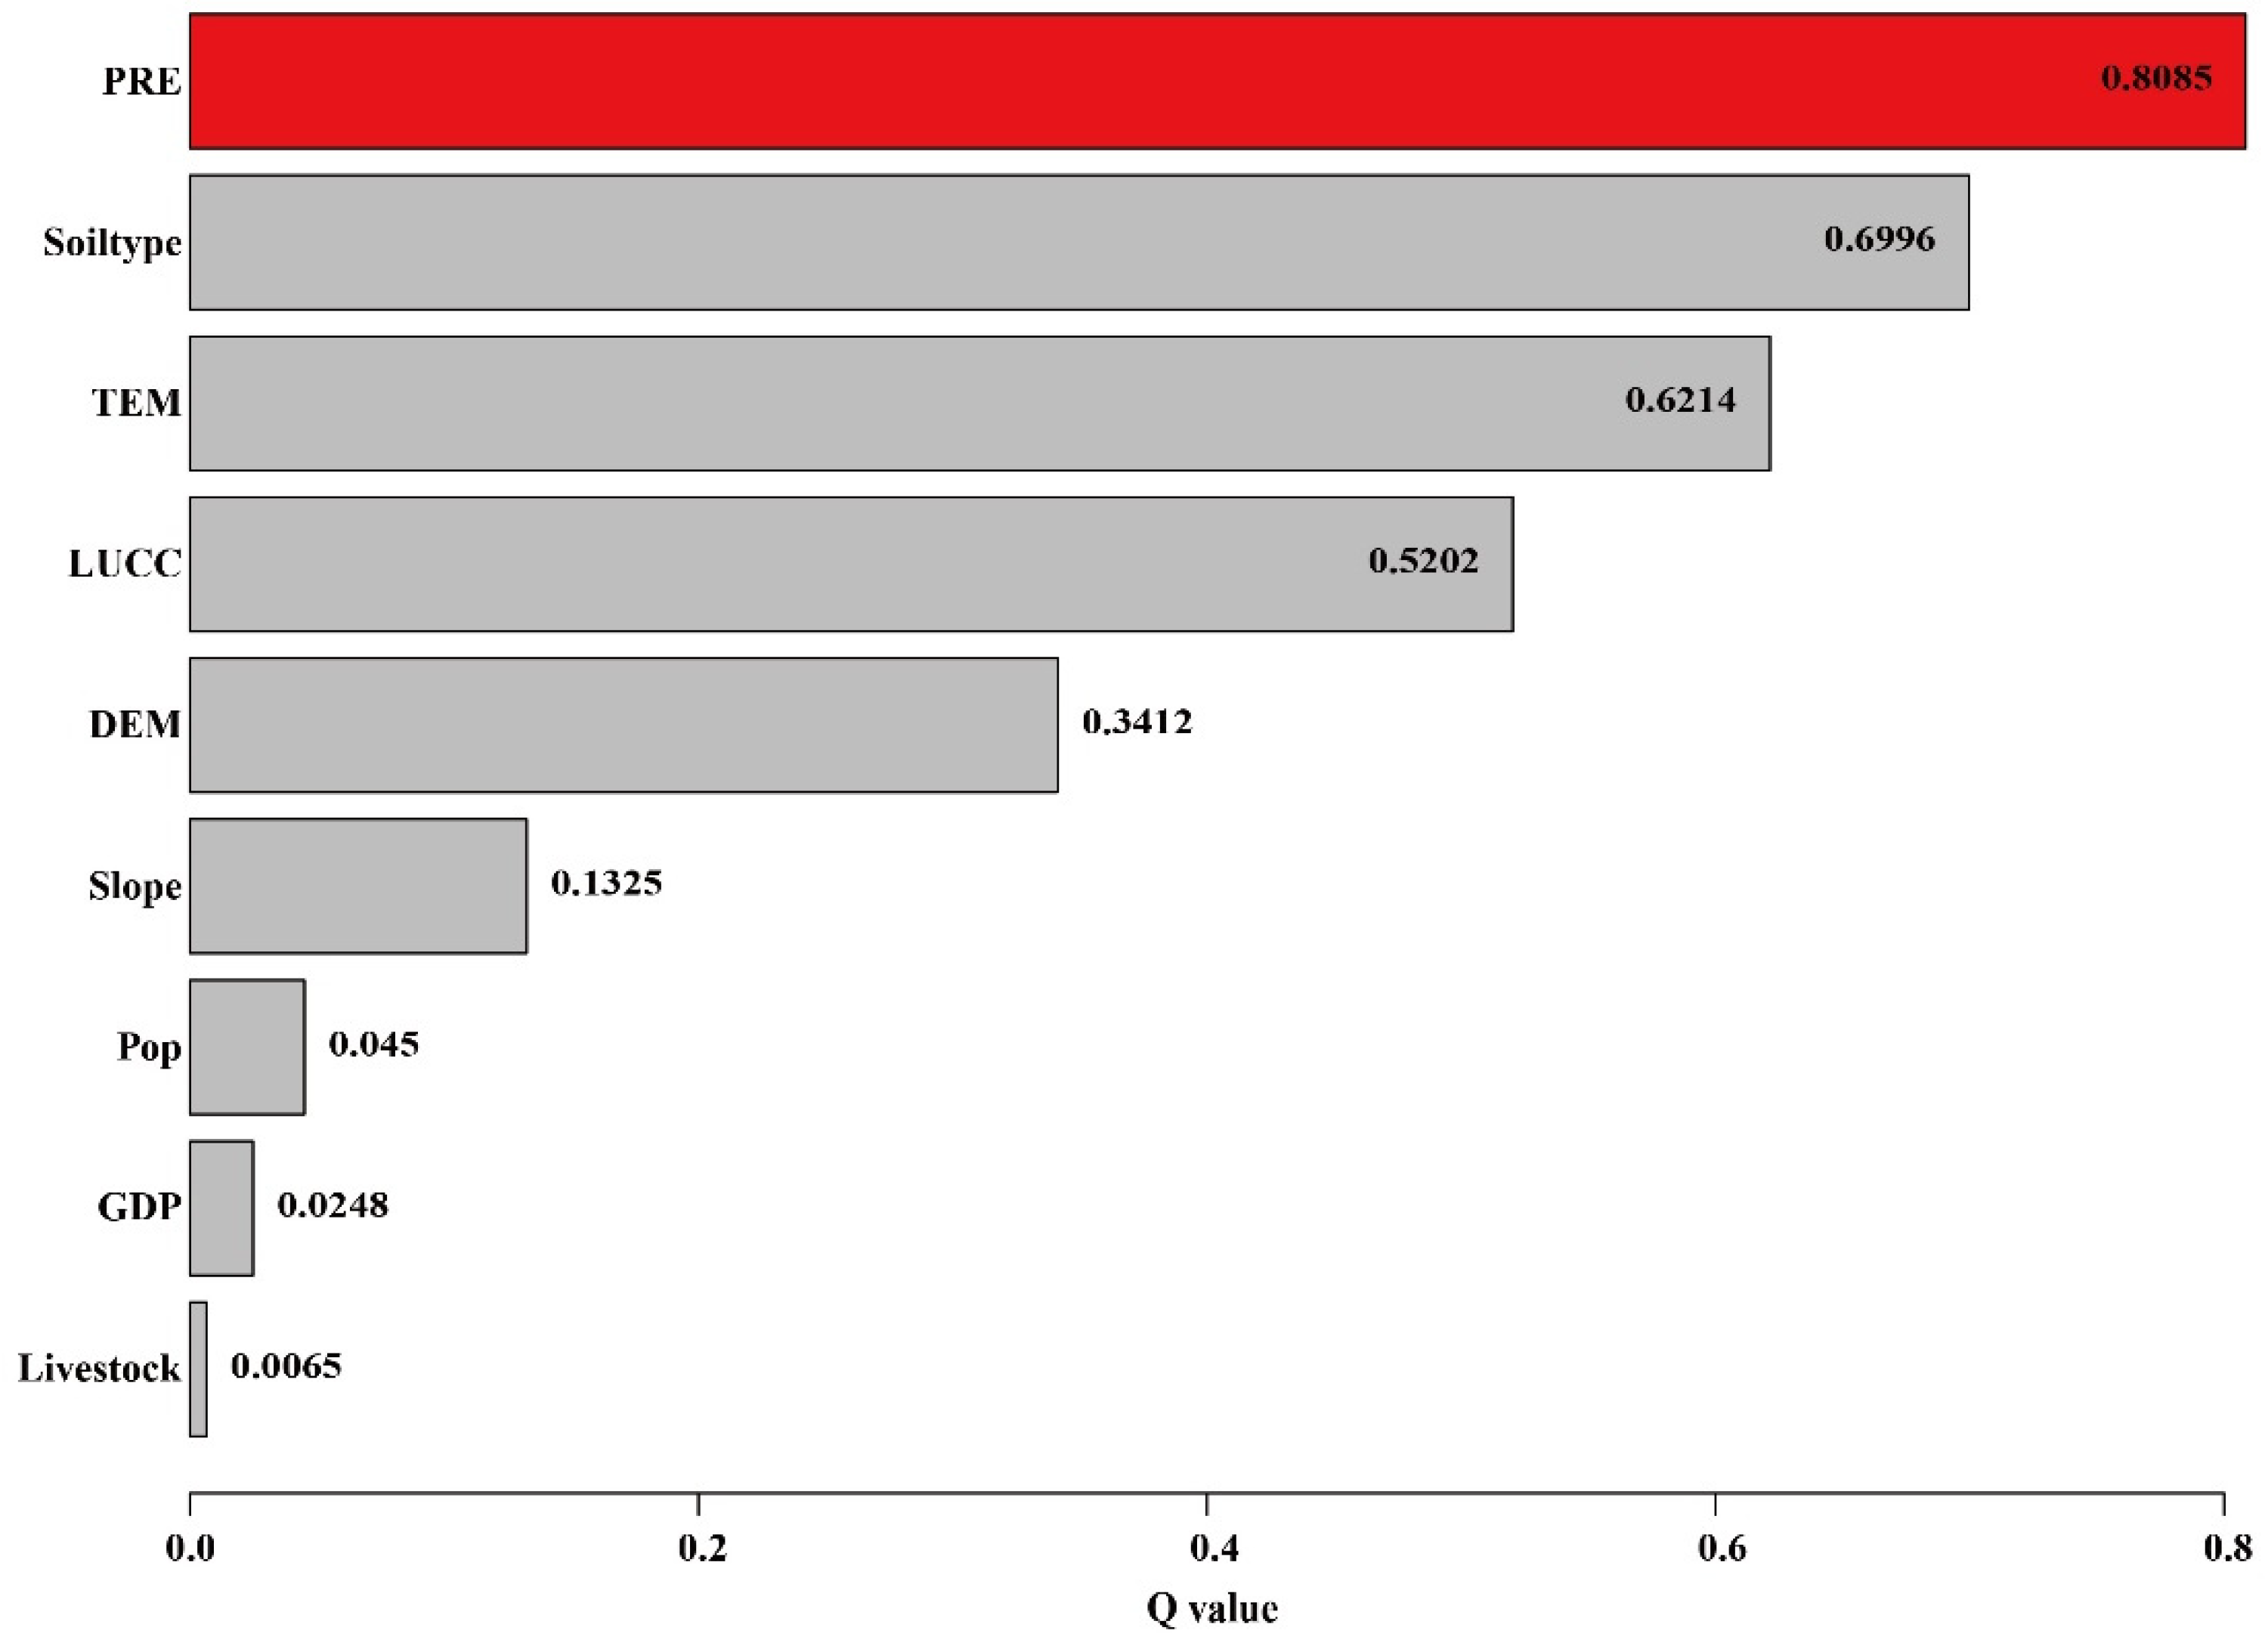
The results of the factor detector reflect the influence of the magnitude of each driver on the NDVI in Inner Mongolia, as expressed by the q value of each driver (Figure 9). Specifically, higher q values indicate a greater influence on the NDVI. As shown in Figure 9, the q value of the total annual precipitation is the largest, reaching 0.81, followed by that of soil type, mean annual temperature, and land use type, all of which have a significant influence greater than 0.5. This indicates that total annual precipitation was the dominant factor of NDVI change in Inner Mongolia during 2000–2019, followed by soil type. Among the factors with an influence below 0.5, the influence of natural factors is higher than that of social factors, in the following order: DEM > slope > population > GDP > livestock density. DEM has a significant influence of 0.34, and the slope has an average influence of 0.13 on the NDVI. The other three drivers had q-values below 0.1, indicating that they did not have a substantial influence on the NDVI.

Figure 9.
Factor detector results for each factor of the NDVI in Inner Mongolia during 2000–2019.
3.4.2. Appropriate Range of Different Driving Factors
The most suitable range or type of vegetation growth in Inner Mongolia for each factor was analyzed using the risk detector method, and the results of each factor passed the statistical test at 95% confidence (Figure 10). Among the findings, total annual precipitation, which was the most influential driver of the NDVI in Inner Mongolia, showed a positive correlation with the NDVI, and the mean value of the NDVI reached a maximum when the total annual precipitation was 452–535 mm. The areas with the highest precipitation are mainly located in Hulunbuir and the Xing’an League in northeastern Inner Mongolia, where forests and typical steppe are present; these areas had the highest vegetation cover in Inner Mongolia. This indicates that arid and semi-arid areas are more sensitive to changes in precipitation conditions, and that increased precipitation has a more pronounced effect on the growth of forests and typical steppe landscapes [73,74]. As grassland forest areas with high vegetation cover in Inner Mongolia are widely distributed with luvisols, which have high soil fertility and are suitable for forestry, the mean NDVI values were the highest in areas with luvisols. Moreover, an increase in temperature stimulates the growth of vegetation, but also leads to a decrease in soil moisture, negatively impacting vegetation growth. Therefore, the annual mean temperature in Inner Mongolia is negatively correlated with NDVI, and the overall annual mean temperature in Inner Mongolia ranges from −3.7 to 11.2 °C, while the most suitable mean temperature range for vegetation growth is within this range. The mean NDVI value is the highest in Inner Mongolia. The mean NDVI of vegetation fluctuates with DEM and slope, wherein the highest mean NDVI values occur at a DEM of 505–840 m and a slope of 15–21°. Among social drivers, the implementation of ecological restoration projects in recent years played an important role in the recovery of vegetation in Inner Mongolia, while population, GDP, and livestock are unevenly distributed in a few areas, occupying a small proportion of the area, thereby having a low overall impact on vegetation growth.
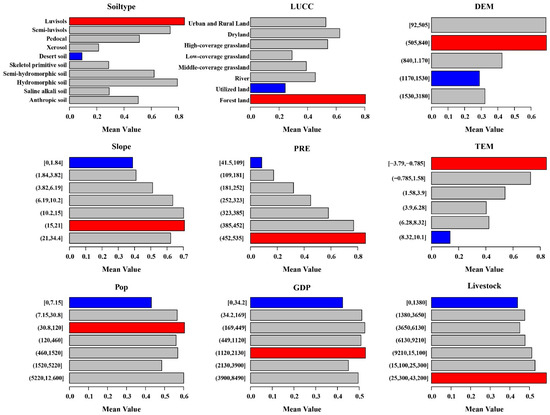
Figure 10.
Risk detector results for each factor of the NDVI in Inner Mongolia from 2000 to 2019.
3.4.3. Driving Factor Interactions
The spatial pattern of the NDVI changes in Inner Mongolia is not influenced by a single factor, but rather by a combination of drivers. Therefore, interaction detectors were used to detect the interrelationships between different drivers that affect NDVI changes in vegetation (Figure 11). The results show that the interactions between different drivers are all bi-variable or non-linear enhancements, with most being bi-variable enhancements. There were no cases wherein the drivers were independent or weakened. As previously discussed, soil moisture and temperature have an important compounding effect on vegetation growth through a strong coupling of land and atmosphere [75]. Therefore, the coupling of precipitation and temperature plays an important role in vegetation growth because of the increased evapotranspiration caused by global warming [76]. The results of the interaction detectors in this study also reflect the influence of the interactions between the factors, whereof total annual precipitation, mean annual temperature, and soil type had greater influences, and most exhibited bi-variable enhancements. The interaction between mean annual temperature and total annual precipitation (Q value = 0.881) specifically had the greatest influence on the spatial distribution of the NDVI, for which the influence of the social and natural factors, especially land use type, livestock density, and soil type factors, increased significantly. The influence of social and natural factors, especially land use type and livestock density, increased significantly with the soil type factor, whereas the population and GDP factors, which were the least influential, showed mostly non-linear enhancements with the natural factors.
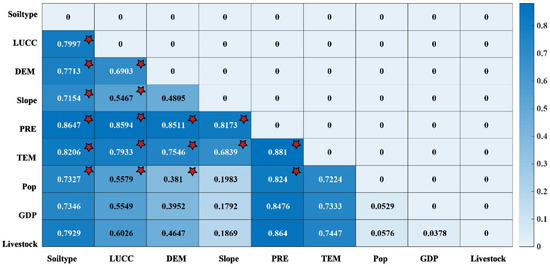
Figure 11.
Interaction detector results between factors and mean NDVI in Inner Mongolia from 2000 to 2019. Note: positions marked with red stars in the figure represent a bi-variable enhancement of the interaction between two different interaction factors, and non-marked positions represent a non-linear enhancement of the interaction between two different interaction factors).
3.4.4. Differences in Influence for Drivers on the NDVI
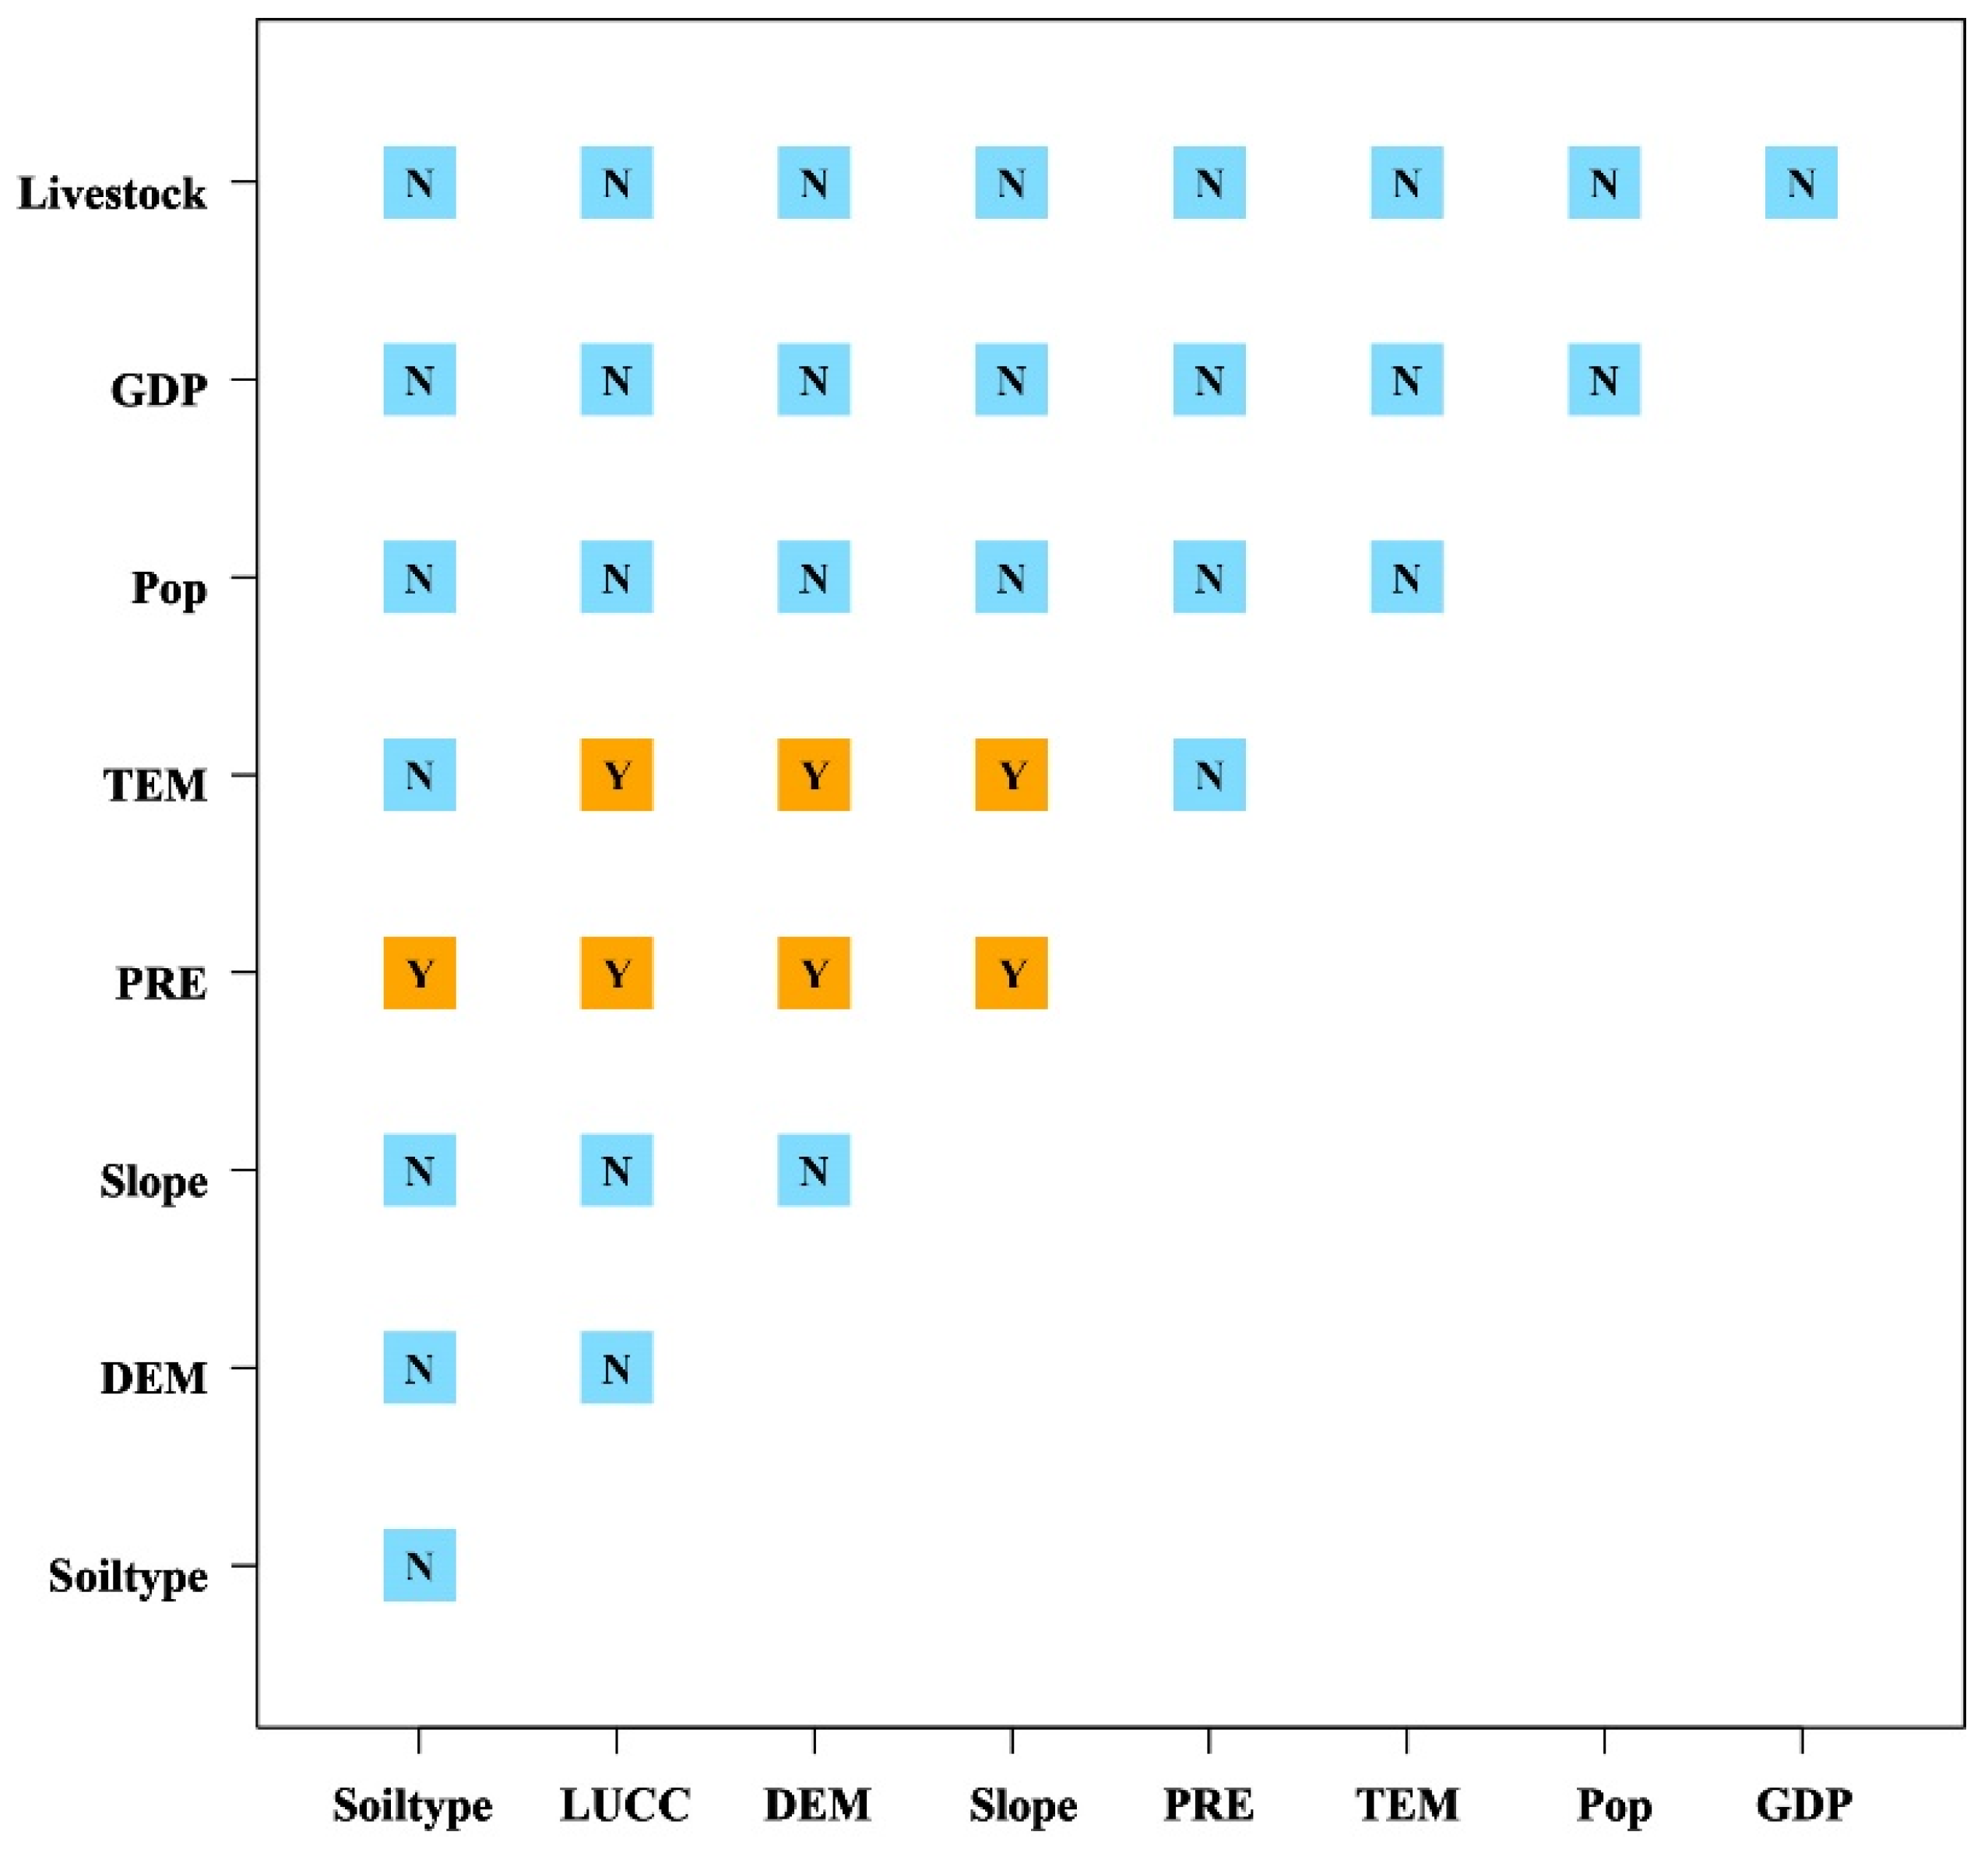
The ecological detector can reflect significant differences in the effect of factors on the spatial distribution of NDVI. This can further verify the dominant influencing factors and evaluate the variability of their mechanisms of action. The results of the ecological probe (Figure 12) show that meteorological factors, land use type, elevation, and slope all had significantly different effects, indicating that although these factors play dominant roles in the NDVI, they have different mechanisms for their effects on vegetation growth. Specifically, precipitation and soil type exhibit significant differences in their effects on the NDVI, wherein the effect of soil type on vegetation growth is significant in areas where precipitation is the main driver. Other factors, such as temperature and soil type, do not show significant differences in their effect on vegetation, because while increased temperature enhances photosynthesis, it also leads to faster transpiration by leaves and increased evapotranspiration, thereby reducing soil moisture and inhibiting vegetation growth [75,77]. The NDVI values within the different landscape types did not vary significantly according to landscape changes, and the elevation and slope were not the main factors contributing to the spatial variation in NDVI.

Figure 12.
Ecological detector results for each factor of the NDVI in Inner Mongolia from 2000 to 2019. Note: positions marked with Y in the figure indicate significant differences in the influence of each factor on the spatial distribution of vegetation NDVI, with different influence mechanisms; positions marked with N indicate the lack of significant differences in the influence mechanisms of the two factors on the spatial distribution of NDVI.
4. Discussion
The NDVI values in Inner Mongolia indicated a generally decreasing trend before 2009, and then increasing, which is consistent with the results of existing studies [78]. Additionally, the sudden change in NDVI in the central part of Genhe city in Hulunbeier between 2002 and 2005 may be attributed to the frequent grassland fire events in the forest areas of Inner Mongolia during this period [79]. Most of the remaining areas north of central Inner Mongolia mutated between 2008 and 2014, and vegetation showed an increased trend after the mutations. This may be attributed to the positive effect of the “Fifth Phase of the Three-Northern Shelter Forest Program” [80]. The breakpoints in the northern parts of Baotou and Wulanchabu occurred between 2014 and 2017. This may be attributed to the government of Baotou that began artificial restoration and the development of heavily polluted mining areas in 2011, for which physical separation and remediation methods were used to remove heavy metals in the soil to comply with the National Environmental Quality Standards for Soil in China [81,82]. Additionally, vegetation in the Siziwang Banner area increased because of the combined effect of increased precipitation and reduced anthropogenic grazing [44]. In the northwestern regions of Ordos, Bayannur, and the Alxa League, the vegetation deteriorated to varying degrees owing to a combination of natural and human factors, such as reduced precipitation, overgrazing, and human reclamation of land. Vegetation around water bodies showed a small improvement. For example, Moon Lake and the surrounding areas of the Alxa League transitioned from a significant decrease to an increase in NDVI before, and after the mutation, respectively [83].
The average temperature in Inner Mongolia increased and precipitation decreased from 2000 to 2009, leading to increased drought in Inner Mongolia and inhibiting vegetation growth [49]. The influence of precipitation on vegetation in Inner Mongolia mainly occurred in areas where agricultural vegetation and grasslands are distributed. Conversely, the effect of precipitation is less than that of temperature in forests, probably because agricultural vegetation and grasslands are more sensitive to changes in precipitation. The influence of natural factors is also reflected in the vegetation breakpoint years and the changes in their trends before and after the breakpoints. The cumulative effect of precipitation and soil moisture on desert steppe and desert areas in the northwest is more pronounced and lasts longer than that in other areas because of their fragile ecological environment. This makes them less adaptable to changes in external natural conditions. Additionally, the increased frequency and intensity of extreme climatic events, such as droughts and high-temperature heat waves, can lead to significant changes in vegetation cover [77,84]. Soil types in Inner Mongolia are distributed from northeast to southwest in the order of black soil, dark brown loam, black calcium soil, chestnut calcium soil, brown loam, black kiln soil, gray calcium soil, wind-sand soil, and gray-brown desert soil, and the stability of vegetation growth varies greatly among different soil types. Black and blackish-chestnut soils in the central and northeastern parts of the country have high contents of organic matter, strong water retention properties, and good natural conditions, which are conducive to the growth of vegetation. The stability of vegetation in this area is correspondingly high, with the occurrence of fewer breakpoints. Meanwhile, the eolian sandy soil in the northwest gray desert zone has low soil fertility and poor soil texture, making it susceptible to changes in external conditions. Therefore, this is the main area where sudden changes in vegetation occur and the vegetation is less stable [10].
Inner Mongolia is one of the regions currently experiencing significant environmental changes as a result of tremendous economic development, including changes and intensification of grazing systems and increased intensity of external anthropogenic activities, such as agricultural production. In this study, we highlighted the contribution of anthropogenic factors to vegetation growth, and found that land use types strongly influence vegetation in Inner Mongolia. The impact of human activities is more spatially concentrated, with human activities leading to changes in land-use types and shifts in land-use types affecting the growth of vegetation. This leads to the spatial differentiation of vegetation, as evidenced by the effects of policy implementation, such as returning farmland to forest and grazing bans. Since the late 1990s, the Chinese central and local governments have implemented and introduced large-scale ecological restoration projects, including the “Returning Farmland to Forests Project,” the “Returning Grassland to Grass Ecological Project in Northern China,” and the “National Ecological Protection.” These programs have had a positive impact on vegetation growth in Inner Mongolia owing to the implementation of specific measures to protect grasslands and vegetation through rotational grazing, grazing bans, and converting pasturelands to croplands.
NDVI is the most widely used observation method for vegetation. NDVI is a good proxy for vegetation density parameters such as leaf area index (LAI), vegetation cover (FVC), and absorbed photosynthetically active radiation (fAPAR). However, NDVI has two major limitations in characterizing biomass and productivity. First, the relationship between NDVI and green biomass is non-linear and can be saturated in areas with high vegetation cover. The second limitation is that NDVI mainly reflects vegetation greenness rather than photosynthesis itself. However, total primary productivity (GPP) can decline without any reduction in LAI or chlorophyll. Combining the shortcomings of NDVI, a new vegetation index, kNDVI, was proposed by applying the theory of nuclear methods to NDVI, using machine learning. The kNDVI correlated with GPP similarly or better than other indices globally. kNDVI correlated with SIF better than other indices in general and in all biomes, especially in deciduous broadleaf forests and for herbaceous and cultivated crops. The correlations of kNDVI were higher in nearly all cases (e.g., Spearman correlation, distance correlation), thus confirming the advantage of kNDVI over other indices. Using the kNDVI index in future studies on vegetation will increase the significance of geo-monitoring and terrestrial biosphere studies [85].
The use of MODIS NDVI data as the only input in this study may reduce the accuracy of the vegetation breakpoint results. This limitation can be addressed in future studies by incorporating data sources with higher temporal resolution and finer spatial resolution. For example, the data provided by the GF-1 and Sentinel-2 satellite multispectral scanners could be combined into more comprehensive driving force data. The spatial pattern driving mechanism of vegetation change should be further explored in conjunction with climate change and ecological protection policies, to provide more scientific data support for improving the ecological environment in Inner Mongolia.
5. Conclusions
Considering Inner Mongolia as the study area, and MODIS-NDVI, total annual precipitation, DEM, mean annual temperature, and data on nine other drivers, this study explored the spatiotemporal characteristics and drivers of NDVI change in Inner Mongolia using spatiotemporal abrupt change and trend analyses, significance tests, the Hurst index, and the GeoDetector model. The spatiotemporal evolution of the vegetation in Inner Mongolia was characterized, and the trend of breakpoints was used to predict the possible future direction of NDVI change, revealing the driving mechanisms and dominant drivers of the NDVI. The detailed conclusions are as follows:
- Considering the temporal trends in NDVI, the NDVI values in 2000–2019 in Inner Mongolia show an overall increasing trend in the range of 0.42–0.51, with small fluctuations and a growth rate of 0.0028/year (p < 0.05). Considering the spatial trends in NDVI, the values in Inner Mongolia showed an overall gradually decreasing trend from east to west. During the past 20 years, areas with increased vegetation have been mainly located in the northeastern part of Inner Mongolia and in the western part of Erdos, and the majority of the stable and unchanging vegetation areas are located in the Gobi Desert region in the northwestern part of the Alxa League. Meanwhile, vegetation mainly decreased in the east-central part of Inner Mongolia. Furthermore, the overall decreasing trend increased from east to west. The Hurst Index analysis suggested that future changes will be opposite to those in the present. According to the NDVI trends overlaid with the Hurst Index classification results, areas with increasing vegetation are predicted to be larger those with decreasing vegetation.
- The overall fluctuation in the NDVI in Inner Mongolia during the study period was small. The largest proportion of regions with Cv values in the range of 0.2–0.3 were distributed in Hulunbuir, Xing’an League, Chifeng, and Tongliao in northeastern Inner Mongolia. The Cv and NDVI fluctuations were the greatest in the westernmost part of Inner Mongolia, indicating a fragile ecological environment and unstable ecological conditions in the Alxa League. The breakpoints of NDVI in Inner Mongolia in 2000–2019 were mainly distributed in the northwestern region bounded by Ulanqab and northern Hulunbuir, with the highest proportion in 2011–2014. The trend of NDVI in western Inner Mongolia mostly changed from increasing to decreasing before and after the mutation, while the trend of NDVI in the northeastern region gradually stabilized after the mutation.
- Precipitation, soil type, temperature, and land use type were the main driving factors of NDVI changes in Inner Mongolia, with precipitation being the most influential factor. Therefore, areas with the highest total annual precipitation had the most significant impact on NDVI changes, and the soil and land use types with the largest areas in Inner Mongolia had significant impacts on the NDVI. Nevertheless, the interactions between factors exhibited mostly bi-variable enhancements. Although meteorological, land use type, and topography factors dominantly influenced vegetation growth, their mechanisms of influence showed significant differences.
Author Contributions
Y.K.: conceptualization, methodology, writing—original draft. E.G.: Conceptualization, Supervision, Inspection. Y.W.: Review, editing. Y.B. (Yulong Bao): Investigation, Validation. Y.B. (Yuhai Bao): Investigation, validation. N.M.: Investigation. All authors have read and agreed to the published version of the manuscript.
Funding
The project was supported by the Natural Science Foundation of Inner Mongolia Autonomous Region of China (2020LH04003), the National Natural Science Foundation of China (41807507), The Key Program of National Natural Science Foundation of China (61631011), High-level introduction of talent research start-up fund in Inner Mongolia Normal University (2018YJRC008 and 2019YJRC003). Research Program of science and technology at Universities of Inner Mongolia Autonomous Region (NJZY21542). The Special Fund of Inner Mongolia Autonomous region for the transformation of scientific and technological achievements (2019GG015).
Institutional Review Board Statement
Not applicable.
Informed Consent Statement
Not applicable.
Data Availability Statement
Not applicable.
Acknowledgments
The authors would like to thank the Editors and the anonymous reviewers for their crucial comments, which improved the quality of this paper. We thank the community of the R statistical software for providing a wealth of functionality. The methods described in this article are available as R package under the GNU General Public License on http://greenbrown.r-forge.r-project.org/ and https://cran.r-project.org/web/packages/GD/ (accessed date: 6 January 2021).
Conflicts of Interest
The authors declare no conflict of interest.
References
- Guo, E.L.; Wang, Y.F.; Wang, C.L.; Sun, Z.Y.; Bao, Y.L.; Naren, M.D.L.; Buren, J.R.G.L.; Bao, Y.H.; Li, H. NDVI Indicates Long-Term Dynamics of Vegetation and Its Driving Forces from Climatic and Anthropogenic Factors in Mongolian Plateau. Remote Sens. 2021, 13, 688. [Google Scholar] [CrossRef]
- Gottfried, M.; Pauli, H.; Futschik, A.; Akhalkatsi, M.; Barančok, P.; Benito Alonso, J.L.; Coldea, G.; Dick, J.; Erschbamer, B.; Fernández Calzado, M.A.R.; et al. Continent-wide response of mountain vegetation to cli-mate change. Nat. Clim. Chang. 2012, 2, 111–115. [Google Scholar] [CrossRef]
- Liu, R.; Shang, R.; Liu, Y.; Lu, X. Global evaluation of gap-filling approaches for seasonal NDVI with con-sidering vegetation growth trajectory, protection of key point, noise resistance and curve stability. Remote Sens. Environ. 2017, 189, 164–179. [Google Scholar] [CrossRef] [Green Version]
- Pan, N.Q.; Feng, X.M.; Fu, B.J.; Wang, S.A.; Ji, F.; Pan, S.F. Increasing global vegetation browning hidden in over-all vegetation greening: Insights from time-varying trends. Remote Sens. Environ. 2018, 214, 59–72. [Google Scholar] [CrossRef]
- Piao, S.L.; Yin, G.D.; Tan, J.G.; Cheng, L.; Huang, M.T.; Li, Y.; Liu, R.G.; Mao, J.F.; Myneni, R.B.; Peng, S.S.; et al. Detection and attribution of vegetation greening trend in China over the last 30 years. Glob. Chang. Biol. 2015, 21, 1601–1609. [Google Scholar] [CrossRef] [PubMed]
- Kaufmann, R.K.; Zhou, L.; Tucker, C.J.; Slayback, D.; Shabanov, N.V.; Myneni, R.B. Variations in northern vege-tation activity inferred from satellite data of vegetation index during 1981 to 1999. J. Geophys. Res. Atmos. 2002, 107, 1–7. [Google Scholar]
- Forkel, M.; Carvalhais, N.; Verbesselt, J.; Mahecha, M.; Neigh, C.; Reichstein, M. Trend Change Detection in NDVI Time Series: Effects of Inter-Annual Variability and Methodology. Remote Sens. 2013, 5, 2113–2144. [Google Scholar] [CrossRef] [Green Version]
- Gutman, G.; Ignatov, A. The derivation of the green vegetation fraction from NOAA/AVHRR data for use in numerical weather prediction models. Int. J. Remote Sens. 1998, 19, 1533–1543. [Google Scholar] [CrossRef]
- Baret, F.; Guyot, G. Potentials and limits of vegetation indices for LAI and APAR assessment. Remote Sens. Environ. 1991, 35, 161–173. [Google Scholar] [CrossRef]
- Zhou, X.; Yamaguchi, Y.; Arjasakusuma, S. Distinguishing the vegetation dynamics induced by anthro-pogenic factors using vegetation optical depth and AVHRR NDVI: A cross-border study on the Mongolian Plateau. Sci. Total Environ. 2018, 616, 730–743. [Google Scholar] [CrossRef]
- Anyamba, A.; Tucker, C.J. Analysis of Sahelian vegetation dynamics using NOAA-AVHRR NDVI data from 1981–2003. J. Arid Environ. 2005, 63, 596–614. [Google Scholar] [CrossRef]
- Fensholt, R.; Proud, S.R. Evaluation of Earth Observation based global long term vegetation trends—Com-paring GIMMS and MODIS global NDVI time series. Remote Sens. Environ. 2012, 119, 131–147. [Google Scholar] [CrossRef]
- Rigina, O.; Rasmussen, M.S. Using trend line and principal component analysis to study vegetation changes in Senegal 1986—1999 from AVHRR NDVI 8 km data. Geogr. Tidsskr. -Dan. J. Geogr. 2003, 103, 31–42. [Google Scholar] [CrossRef]
- Sen, Z. Innovative trend analysis methodology. J. Hydrol. Eng. 2011, 17, 1042–1046. [Google Scholar] [CrossRef]
- Gocic, M.; Trajkovic, S. Analysis of changes in meteorological variables using Mann-Kendall and Sen’s slope estimator statistical tests in Serbia. Glob. Planet. Chang. 2013, 100, 172–182. [Google Scholar] [CrossRef]
- Alcaraz-Segura, D.; Chuvieco, E.; Epstein, H.E.; Kasischke, E.S.; Trishchenko, A. Debating the greening vs. browning of the North American boreal forest: Differences between satellite datasets. Glob. Chang. Biol. 2010, 16, 760–770. [Google Scholar] [CrossRef]
- Dan, W.; Nathan, J.M.; Kyla, M.D. Persistent Vegetation Greening and Browning Trends Related to Natural and Human Activities in the Mount Elgon Ecosystem. Remote. Sens. 2020, 12, 2113. [Google Scholar]
- Kennedy, R.E.; Yang, Z.; Cohen, W.B. Detecting trends in forest disturbance and recovery using yearly Landsat time series: 1. LandTrendr—Temporal segmentation algorithms. Remote Sens. Environ. 2010, 114, 2897–2910. [Google Scholar] [CrossRef]
- Verbesselt, J.; Hyndman, R.; Newnham, G.; Culvenor, D. Detecting trend and seasonal changes in satellite image time series. Remote Sens. Environ. 2010, 114, 106–115. [Google Scholar] [CrossRef]
- Huang, C.; Goward, S.N.; Masek, J.G.; Thomas, N.; Zhu, Z.; Vogelmann, J.E. An automated approach for recon-structing recent forest disturbance history using dense Landsat time series stacks. Remote Sens. Environ. 2010, 114, 183–198. [Google Scholar] [CrossRef]
- de Jong, R.; de Bruin, S.; de Wit, A.; Schaepman, M.E.; Dent, D.L. Analysis of monotonic greening and browning trends from global NDVI time-series. Remote Sens. Environ. 2011, 115, 692–702. [Google Scholar] [CrossRef] [Green Version]
- Mahecha, M.D.; Fürst, L.M.; Gobron, N.; Lange, H. Identifying multiple spatiotemporal patterns: A refined view on terrestrial photosynthetic activity. Pattern Recogn. Lett. 2010, 31, 2309–2317. [Google Scholar] [CrossRef]
- Eastman, J.; Sangermano, F.; Machado, E.; Rogan, J.; Anyamba, A. Global Trends in Seasonality of Normalized Difference Vegetation Index (NDVI), 1982–2011. Remote Sens. 2013, 5, 4799–4818. [Google Scholar] [CrossRef] [Green Version]
- Wu, Z.; Schneider, E.K.; Kirtman, B.P.; Sarachik, E.S.; Huang, N.E.; Tucker, C.J. The modulated annual cycle: An alternative reference frame for climate anomalies. Clim. Dyn. 2008, 31, 823–841. [Google Scholar] [CrossRef] [Green Version]
- Forkel, M.; Migliavacca, M.; Thonicke, K.; Reichstein, M.; Schaphoff, S.; Weber, U.; Carvalhais, N. Co-dominant water control on global interannual variability and trends in land surface phenology and greenness. Glob. Chang. Biol. 2015, 21, 3414–3435. [Google Scholar] [CrossRef]
- Beurs, K.; Henebry, G.M. A land surface phenology assessment of the northern polar regions using MODIS reflectance time series. Can. J. Remote Sens. 2010, 36, S87–S110. [Google Scholar] [CrossRef]
- Tong, S.Q.; Zhang, J.Q.; Bao, Y.H.; Lai, Q.; Lian, X.; Li, N.; Bao, Y.B. Analyzing vegetation dynamic trend on the Mongolian Plateau based on the Hurst exponent and influencing factors from 1982–2013. J. Geogr. Sci. 2018, 28, 595–610. [Google Scholar] [CrossRef] [Green Version]
- Rivas-Tabares, D.A.; Saa-Requejo, A.; Martín-Sotoca, J.J.; Tarquis, A.M. Multiscaling NDVI Series Analysis of Rainfed Cereal in Central Spain. Remote. Sens. 2021, 13, 568. [Google Scholar] [CrossRef]
- Wang, F.; Shao, W.; Yu, H.; Kan, G.; He, X.; Zhang, D.; Ren, M.; Wang, G. Re-evaluation of the Power of the Mann-Kendall Test for Detecting Monotonic Trends in Hydrometeorological Time Series. Front. Earth Sci. 2020, 8, 14. [Google Scholar] [CrossRef]
- Wang, B.; Xu, G.; Li, P.; Li, Z.; Zhang, Y.; Cheng, Y.; Jia, L.; Zhang, J. Vegetation dynamics and their relationships with climatic factors in the Qinling Mountains of China. Ecol. Indic. 2020, 108, 105719. [Google Scholar] [CrossRef]
- Rhif, M.; Ben Abbes, A.; Martinez, B.; Farah, I.R. An improved trend vegetation analysis for non-stationary NDVI time series based on wavelet transform. Environ. Sci. Pollut. Res. 2020, 28, 1–11. [Google Scholar] [CrossRef]
- Song, L.; Pan, Y.; Gong, J.; Li, X.; Liu, M.; Yang, B.; Zhang, Z.; Baoyin, T. Physiology of Leymus chinensis under seasonal grazing: Implications for the development of sustainable grazing in a temperate grassland of Inner Mongolia. J. Environ. Manage. 2020, 271, 110984. [Google Scholar] [CrossRef]
- Tian, H.; Cao, C.; Chen, W.; Bao, S.; Yang, B.; Myneni, R.B. Response of vegetation activity dynamic to climatic change and ecological restoration programs in Inner Mongolia from 2000 to 2012. Ecol. Eng. 2015, 82, 276–289. [Google Scholar] [CrossRef]
- Wang, L.; Xiao, Y.; Rao, E.; Jiang, L.; Xiao, Y.; Ouyang, Z. An Assessment of the Impact of Urbanization on Soil Erosion in Inner Mongolia. Int. J. Environ. Res. Pub. Healthy 2018, 15, 550. [Google Scholar] [CrossRef] [Green Version]
- Liu, M.; Dries, L.; Heijman, W.; Huang, J.; Zhu, X.; Hu, Y.; Chen, H. The Impact of Ecological Construction Programs on Grassland Conservation in Inner Mongolia, China. Land Degrad. Dev. 2018, 29, 326–336. [Google Scholar] [CrossRef] [Green Version]
- Yu, Q.; Yue, D.; Wang, Y.; Kai, S.; Fang, M.; Ma, H.; Zhang, Q.; Huang, Y. Optimization of ecological node layout and stability analysis of ecological network in desert oasis: A typical case study of ecological fragile zone located at Deng Kou County(Inner Mongolia). Ecol. Indic. 2018, 84, 304–318. [Google Scholar] [CrossRef]
- He, D.; Huang, X.; Tian, Q.; Zhang, Z. Changes in Vegetation Growth Dynamics and Relations with Climate in Inner Mongolia under More Strict Multiple Pre-Processing (2000–2018). Sustainability 2020, 12, 2534. [Google Scholar] [CrossRef] [Green Version]
- Wang, W.; Liu, R.; Gan, F.; Zhou, P.; Zhang, X.; Ding, L. Monitoring and Evaluating Restoration Vegetation Status in Mine Region Using Remote Sensing Data: Case Study in Inner Mongolia, China. Remote. Sens. 2021, 13, 1350. [Google Scholar] [CrossRef]
- Allen, S.K.; Plattner, G.K.; Nauels, A.; Xia, Y.; Stocker, T.F. Carbon and Other Biogeochemical Cycles: Climate Change 2013: The Physical Science Basis. Contribution of Working Group I to the Fifth Assessment Report of the Intergovernmental Panel on Climate Change Change. Comput. Geom. 2007, 18, 95–123. [Google Scholar]
- Liu, Z.; Wu, C.; Liu, Y.; Wang, X.; Ge, Q. Spring green-up date derived from GIMMS3g and SPOT-VGT NDVI of winter wheat cropland in the North China Plain. ISPRS J. Photogramm. Remote Sens. 2017, 130, 81–91. [Google Scholar] [CrossRef]
- Tsvetsinskaya, E.A.; Mearns, L.O.; Mavromatis, T.; Gao, W.; Mcdaniel, L.; Downton, M.W. The Effect of Spatial Scale of Climatic Change Scenarios on Simulated Maize, Winter Wheat, and Rice Production in the Southeast-ern United States. Clim. Chang. 2003, 60, 37–72. [Google Scholar] [CrossRef]
- Sun, B.; Li, Z.; Gao, W.; Zhang, Y.; Gao, Z.; Song, Z.; Qin, P.; Tian, X. Identification and assessment of the factors driving vegetation degradation/regeneration in drylands using synthetic high spatiotemporal remote sensing Data—A case study in Zhenglanqi, Inner Mongolia, China. Ecol. Indic. 2019, 107, 105614. [Google Scholar] [CrossRef]
- Li, C.; Wang, J.; Yin, S.; Bao, Y.; Li, Y.; Yu, S. Drought hazard assessment and possible adaptation options for typical steppe grassland in Xilingol League, Inner Mongolia, China. Theor. Appl. Climatol. 2019, 136, 1339–1346. [Google Scholar] [CrossRef]
- Li, T.; Lü, Y.; Fu, B.; Comber, A.J.; Harris, P.; Wu, L. Gauging policy-driven large-scale vegetation restoration programmes under a changing environment: Their effectiveness and socio-economic relationships. Sci. Total Environ. 2017, s607–s608, 911–919. [Google Scholar] [CrossRef] [Green Version]
- Osco, L.P.; Ramos, A.P.M.; Pereira, D.R.; Moriya, É.A.S.; Imai, N.N.; Matsubara, E.T.; Estrabis, N.; de Souza, M.; Junior, J.M.; Gonçalves, W.N.; et al. Predicting Canopy Nitrogen Content in Citrus-Trees Using Random Forest Algorithm Associated to Spectral Vegetation Indices from UAV-Imagery. Remote Sens. 2019, 11, 2925. [Google Scholar] [CrossRef] [Green Version]
- Liu, Y.; Zhang, W.; Zhang, Z.; Xu, Q.; Li, W. Risk Factor Detection and Landslide Susceptibility Mapping Using Geo-Detector and Random Forest Models: The 2018 Hokkaido Eastern Iburi Earthquake. Remote Sens. 2021, 13, 1157. [Google Scholar] [CrossRef]
- Zhao, Y.; Liu, L.; Kang, S.; Ao, Y.; Han, L.; Ma, C. Quantitative Analysis of Factors Influencing Spatial Distribution of Soil Erosion Based on Geo-Detector Model under Diverse Geomorphological Types. Land 2021, 10, 604. [Google Scholar] [CrossRef]
- Liu, X.X.; Tian, Z.X.; Zhang, A.B.; Zhao, A.Z.; Liu, H.X. Impacts of Climate on Spatiotemporal Variations in Vegetation NDVI from 1982–2015 in Inner Mongolia, China. Sustainability 2019, 11, 768. [Google Scholar] [CrossRef] [Green Version]
- Yao, J.; Chen, Y.; Zhao, Y.; Mao, W.; Xu, X.; Liu, Y.; Yang, Q. Response of vegetation NDVI to climatic extremes in the arid region of Central Asia: A case study in Xinjiang, China. Theor. Appl. Climatol. 2018, 131, 1503–1515. [Google Scholar] [CrossRef]
- Pei, F.; Zhou, Y.; Xia, Y. Application of Normalized Difference Vegetation Index (NDVI) for the Detection of Extreme Precipitation Change. Forests 2021, 12, 594. [Google Scholar] [CrossRef]
- Lu, Q.; Zhao, D.; Wu, S.; Dai, E.; Gao, J. Using the NDVI to analyze trends and stability of grassland vegetation cover in Inner Mongolia. Theor. Appl. Climatol. 2019, 135, 1629–1640. [Google Scholar] [CrossRef]
- Yao, M.; Rui, J.; Niu, H.; Heděnec, P.; Li, J.; He, Z.; Wang, J.; Cao, W.; Li, X. The differentiation of soil bacterial communities along a precipitation and temperature gradient in the eastern Inner Mongolia steppe. Catena 2017, 152, 47–56. [Google Scholar] [CrossRef]
- Tong, S.; Dong, Z.; Zhang, J.; Bao, Y.; Guna, A.; Bao, Y. Spatiotemporal Variations of Land Use/Cover Changes in Inner Mongolia (China) during 1980–2015. Sustainability 2018, 10, 4730. [Google Scholar] [CrossRef] [Green Version]
- Crook, D.R.; Robinson, B.E.; Li, P. The Impact of Snowstorms, Droughts and Locust Outbreaks on Livestock Production in Inner Mongolia: Anticipation and Adaptation to Environmental Shocks. Ecol. Econ. 2020, 177, 106761. [Google Scholar] [CrossRef]
- Guo, L.H.; Zuo, L.Y.; Gao, J.B.; Jiang, Y.; Zhang, Y.L.; Ma, S.C.; Zou, Y.F.; Wu, S.H. Revealing the Fin-gerprint of Climate Change in Interannual NDVI Variability among Biomes in Inner Mongolia, China. Remote Sens. 2020, 12, 1332. [Google Scholar] [CrossRef] [Green Version]
- Wang, Y.F.; Liu, G.X.; Guo, E.L. Spatial distribution and temporal variation of drought in Inner Mongolia during 1901–2014 using Standardized Precipitation Evapotranspiration Index. Sci. Total Environ. 2019, 654, 850–862. [Google Scholar] [CrossRef]
- Pei, Z.F.; Fang, S.B.; Yang, W.N.; Wang, L.; Wu, M.Y.; Zhang, Q.F.; Han, W.; Khoi, D.N. The Relationship between NDVI and Climate Factors at Different Monthly Time Scales: A Case Study of Grasslands in Inner Mongolia, China (1982–2015). Sustainability 2019, 11, 7243. [Google Scholar] [CrossRef] [Green Version]
- Gilbert, M.; Nicolas, G.; Cinardi, G.; Van Boeckel, T.P.; Vanwambeke, S.O.; Wint, G.R.W.; Robinson, T.P. Global distribution data for cattle, buffaloes, horses, sheep, goats, pigs, chickens and ducks in 2010. Sci. Data 2018, 5, 180227. [Google Scholar] [CrossRef] [Green Version]
- Liu, H.; Jiang, D.; Yang, X.; Luo, C. Spatialization Approach to 1km Grid GDP Supported by Remote Sensing. Geo-Inf. Sci. 2005, 7, 120–123. [Google Scholar]
- Tucker, C.J.; Newcomb, W.W.; Los, S.O.; Prince, S.D. Mean and inter-year variation of growing-season normal-ized difference vegetation index for the Sahel 1981-1989. Int. J. Remote. Sens. 1991, 12, 1133–1135. [Google Scholar] [CrossRef]
- Bao, G.; Jin, H.; Tong, S.Q.; Chen, J.Q.; Huang, X.J.; Bao, Y.H.; Shao, C.L.; Mandakh, U.; Chopping, M.; Du, L.T. Autumn Phenology and Its Covariation with Climate, Spring Phenology and Annual Peak Growth on the Mongolian Plateau. Agr. For. Meteorol. 2021, 298, 108312. [Google Scholar] [CrossRef]
- Verbesselt, J.; Zeileis, A.; Herold, M. Near real-time disturbance detection using satellite image time series. Remote Sens. Environ. 2012, 123, 98–108. [Google Scholar] [CrossRef]
- Verbesselt, J.; Hyndman, R.; Zeileis, A.; Culvenor, D. Phenological change detection while accounting for abrupt and gradual trends in satellite image time series. Remote Sens. Environ. 2010, 114, 2970–2980. [Google Scholar] [CrossRef] [Green Version]
- Gu, X.H.; Zhang, Q.; Wang, Z.Z. Evaluation on Stationarity Assumption of Annual Maximum Peak Flows dur-ing 1951-2010 in the Pearl River Basin. J. Nat. Resour. 2015, 30, 824–835. [Google Scholar]
- Villarini, G.; Smith, J.A.; Baeck, M.L.; Vitolo, R.; Stephenson, D.B.; Krajewski, W.F. On the frequency of heavy rainfall for the Midwest of the United States. J. Hydrol. 2011, 400, 103–120. [Google Scholar] [CrossRef]
- Chang, Z.; Gong, H.; Zhang, J.; Chen, M. Correlation Analysis on Interferometric Coherence Degree and Proba-bility of Residue Occurrence in Interferogram. IEEE Sens. J. 2014, 14, 2369–2375. [Google Scholar] [CrossRef]
- Wessels, K.J.; Prince, S.D.; Malherbe, J.; Small, J.; Frost, P.E.; Vanzyl, D. Can human-induced land deg-radation be distinguished from the effects of rainfall variability? A case study in South Africa. J. Arid Environ. 2007, 68, 271–297. [Google Scholar] [CrossRef]
- Song, Y.Z.; Wang, J.F.; Ge, Y.; Xu, C.D. An optimal parameters-based geographical detector model enhances geographic characteristics of explanatory variables for spatial heterogeneity analysis: Cases with dif-ferent types of spatial data. GISci. Remote Sens. 2020, 57, 593–610. [Google Scholar] [CrossRef]
- Hu, Y.; Wang, J.; Li, X.; Dan, R.; Zhu, J.; Mohamed, N.A. Geographical Detector-Based Risk Assessment of the Under-Five Mortality in the 2008 Wenchuan Earthquake, China. PLoS ONE 2011, 6, e21427. [Google Scholar] [CrossRef] [Green Version]
- Hao, L.; Pan, C.; Fang, D.; Zhang, X.; Zhou, D.; Liu, P.; Liu, Y.; Sun, G. Quantifying the effects of over-grazing on mountainous watershed vegetation dynamics under a changing climate. Sci. Total Environ. 2018, 639, 1408–1420. [Google Scholar] [CrossRef]
- Chen, X.; Li, X.; Yang, J. The spatial and temporal dynamics of phytoplankton community and their correlation with environmental factors in Wuliangsuhai Lake, China. Arab. J. Geosci. 2021, 14, 713. [Google Scholar] [CrossRef]
- Meng, X.; Gao, X.; Li, S.; Lei, J. Spatial and Temporal Characteristics of Vegetation NDVI Changes and the Driving Forces in Mongolia during 1982–2015. Remote Sens. 2020, 12, 603. [Google Scholar] [CrossRef] [Green Version]
- Meng, M.; Huang, N.; Wu, M.; Pei, J.; Wang, J.; Niu, Z. Vegetation change in response to climate factors and human activities on the Mongolian Plateau. PeerJ 2019, 7, e7735. [Google Scholar] [CrossRef]
- Liu, L.; Gudmundsson, L.; Hauser, M.; Qin, D.; Li, S.; Seneviratne, S.I. Soil moisture dominates dryness stress on ecosystem production globally. Nat. Commun. 2020, 11, 1–9. [Google Scholar]
- Wang, M.; Wang, S.; Zhao, J.; Ju, W.; Hao, Z. Global positive gross primary productivity extremes and climate contributions during 1982–2016. Sci. Total Environ. 2021, 774, 145703. [Google Scholar] [CrossRef]
- Sippel, S.; Reichstein, M.; Ma, X.; Mahecha, M.D.; Lange, H.; Flach, M.; Frank, D. Drought, Heat, and the Carbon Cycle: A Review. Curr. Clim. Chang. Rep. 2018, 4, 266–286. [Google Scholar]
- Yu, H.; Wiegand, T.; Yang, X.H.; Ci, L.J. The impact of fire and density-dependent mortality on the spatial pat-terns of a pine forest in the Hulun Buir sandland, Inner Mongolia, China. Forest Ecol. Manag. 2009, 257, 2098–2107. [Google Scholar] [CrossRef]
- Qiu, B.W.; Gong, C.; Tang, Z.H.; Lu, D.F.; Wang, Z.Z.; Chen, C.C. Assessing the Three-North Shelter Forest Program in China by a novel framework for characterizing vegetation changes. ISPRS J. Photogramm. 2017, 133, 75–88. [Google Scholar] [CrossRef]
- Pan, Y.X.; Li, H.T. Investigating Heavy Metal Pollution in Mining Brownfield and Its Policy Implications: A Case Study of the Bayan Obo Rare Earth Mine, Inner Mongolia, China. Environ. Manag. 2016, 57, 879–893. [Google Scholar] [CrossRef]
- Li, P.; Liu, J.; Ma, H. An Empirical Study of Alxa League Energy Consumption and Environmental Pollu-tion in China. J. Manag. Strategy 2015, 6, 21. [Google Scholar] [CrossRef]
- Hao, Z.; Li, W.; Singh, V.P.; Xia, Y.; Zhang, X.; Hao, F. Impact of dependence changes on the likelihood of hot extremes under drought conditions in the United States. J. Hydrol. 2020, 581, 124410. [Google Scholar] [CrossRef]
- Ding, Y.; Xu, J.; Wang, X.; Peng, X.; Cai, H. Spatial and temporal effects of drought on Chinese vegetation under different coverage levels. Sci. Total Environ. 2020, 716, 137166. [Google Scholar] [CrossRef] [PubMed]
- Barthold, F.K.; Wiesmeier, M.; Breuer, L.; Frede, H.G.; Wu, J.; Blank, F.B. Land use and climate control the spatial distribution of soil types in the grasslands of Inner Mongolia. J. Arid Environ. 2013, 88, 194–205. [Google Scholar] [CrossRef]
- Hu, Y.F.; Nacun, B.T. An Analysis of Land-Use Change and Grassland Degradation from a Policy Perspective in Inner Mongolia, China, 1990–2015. Sustainability 2018, 10, 4048. [Google Scholar] [CrossRef] [Green Version]
- Camps-Valls, G.; Campos-Taberner, M.; Moreno-Martínez, L.; Walther, S.; Duveiller, G.; Cescatti, A.; Mahecha, M.D.; Muoz-Marí, J.; García-Haro, F.J.; Guanter, L. A unified vegetation index for quantifying the terrestrial biosphere. Sci. Adv. 2021, 7, eabc7447. [Google Scholar] [CrossRef]


Publisher’s Note: MDPI stays neutral with regard to jurisdictional claims in published maps and institutional affiliations. |
© 2021 by the authors. Licensee MDPI, Basel, Switzerland. This article is an open access article distributed under the terms and conditions of the Creative Commons Attribution (CC BY) license (https://creativecommons.org/licenses/by/4.0/).