
‘The Best of Two Worlds’—Combining Classifier Fusion and Ecological Models to Map and Explain Landscape Invasion by an Alien Shrub

 , , ,
, , ,
Abstract
:1. Introduction
2. Materials and Methods
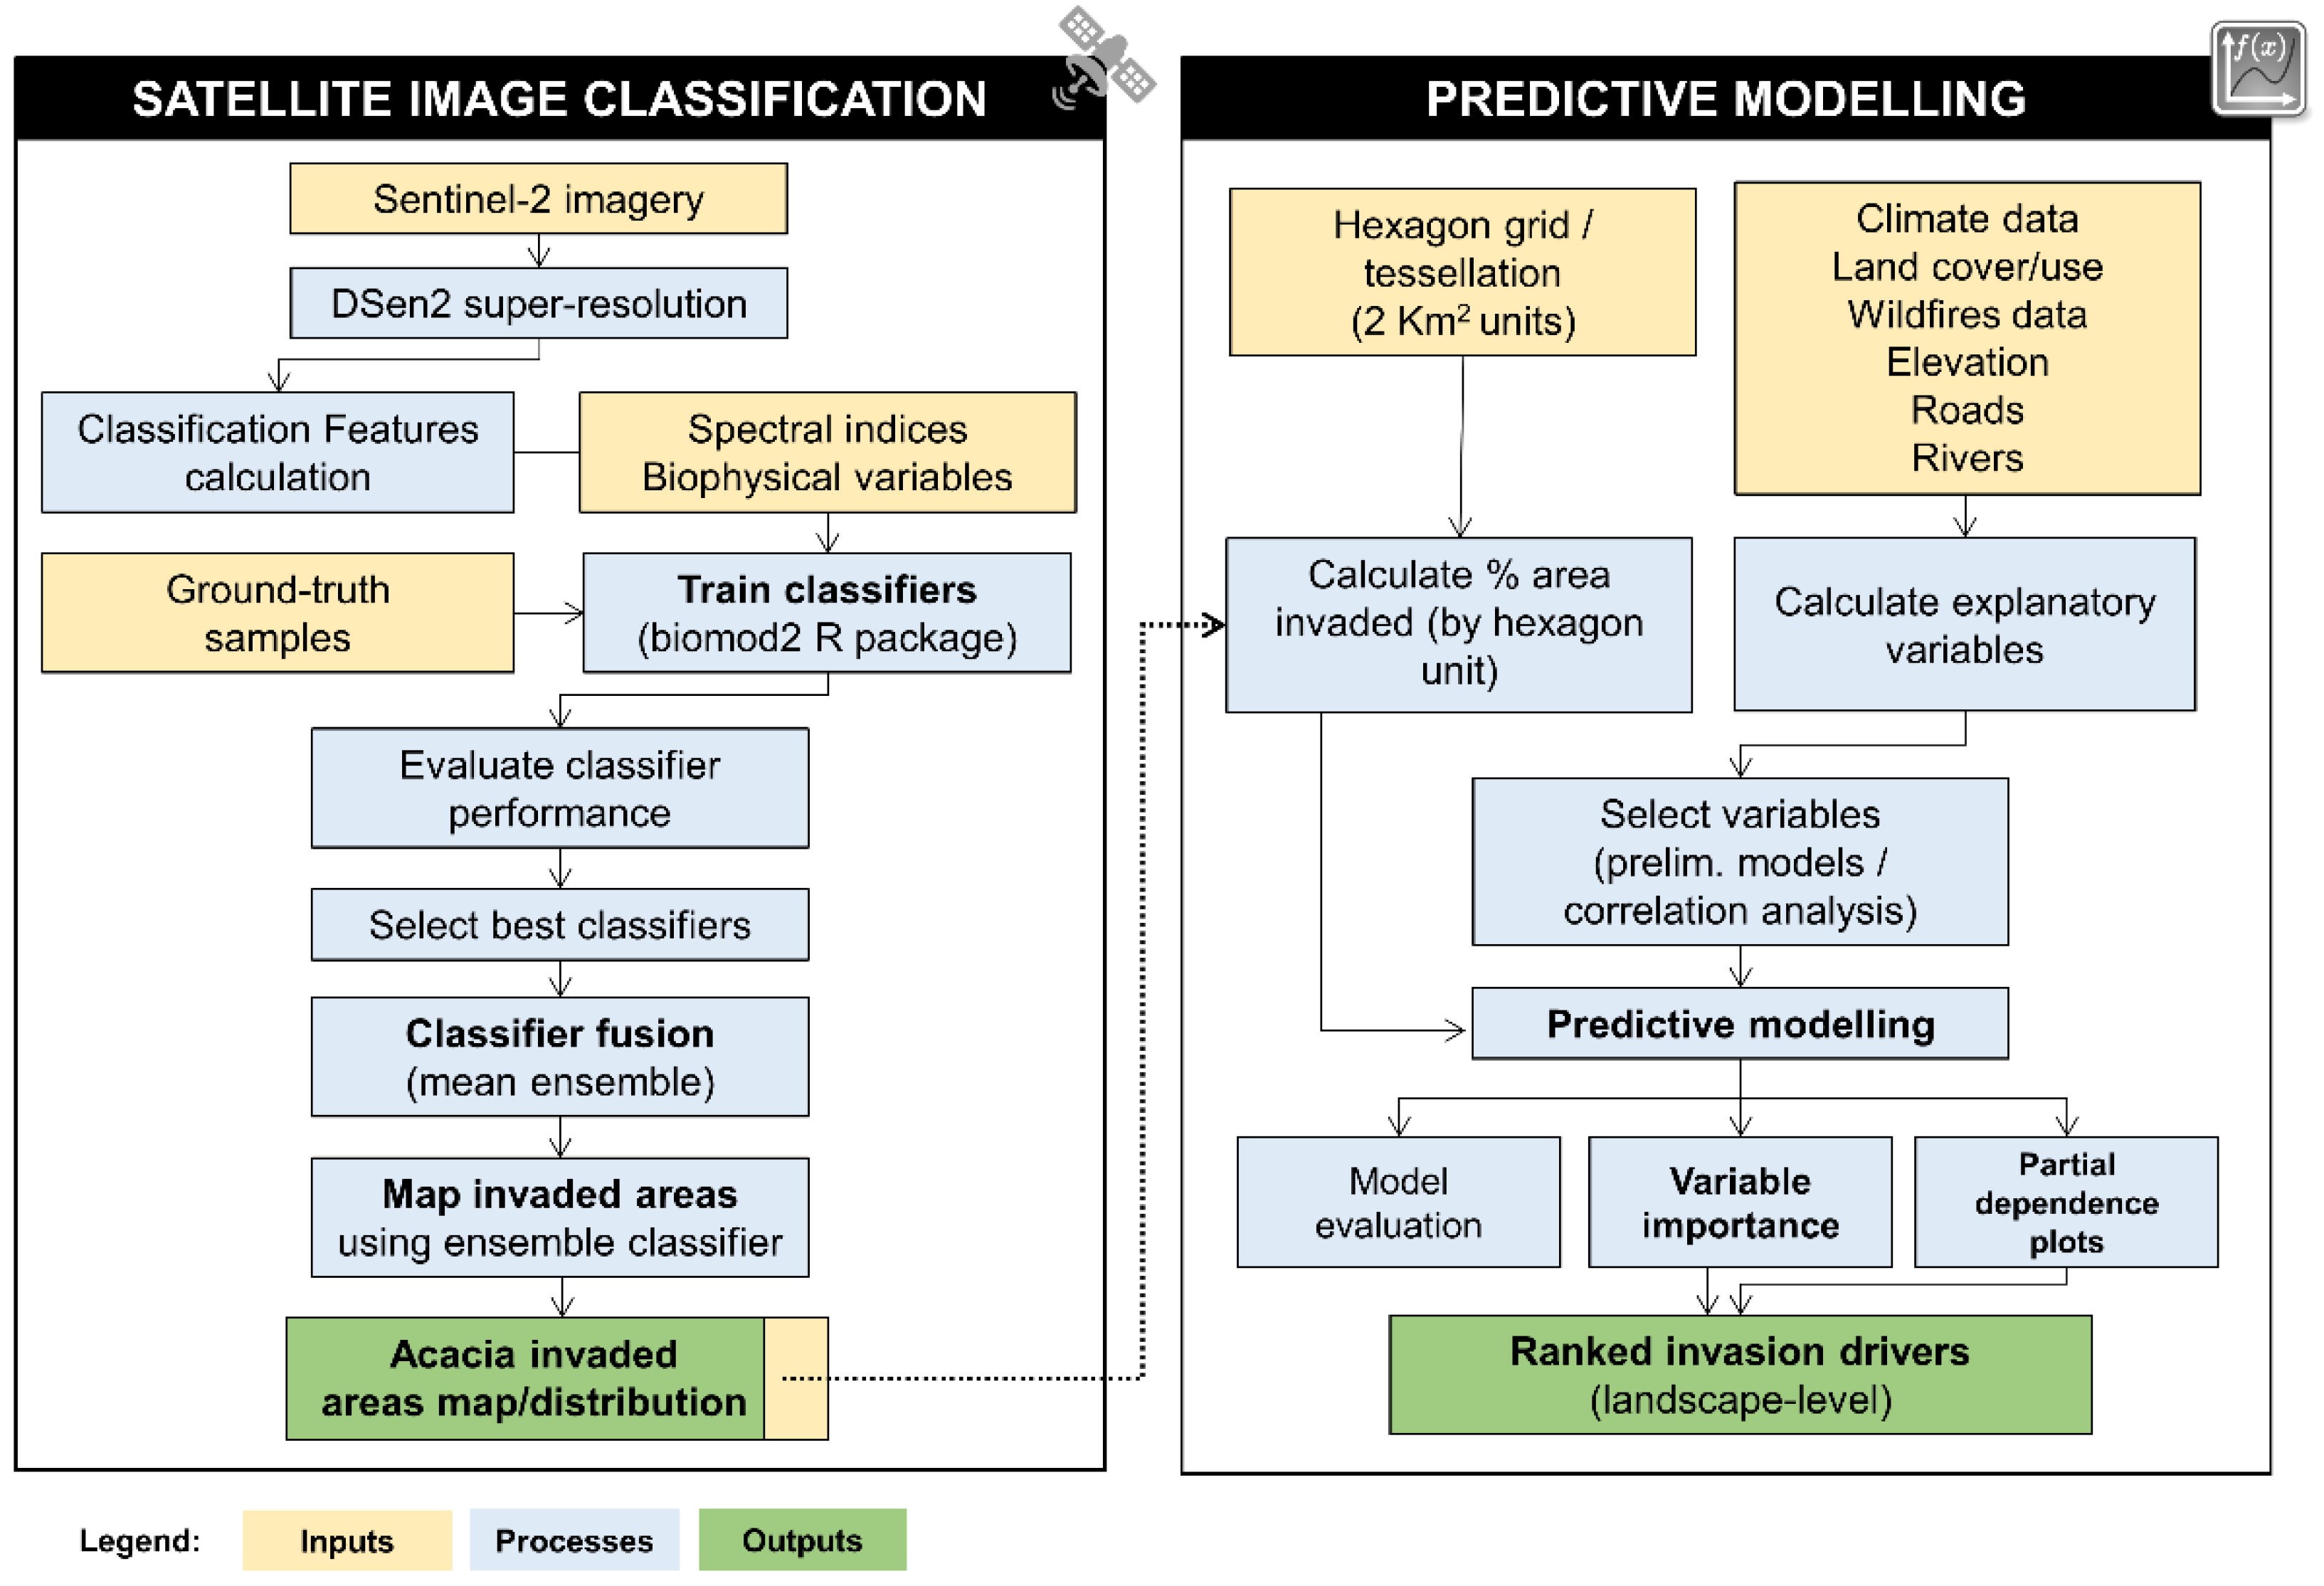
2.1. General Workflow
2.2. Target Species
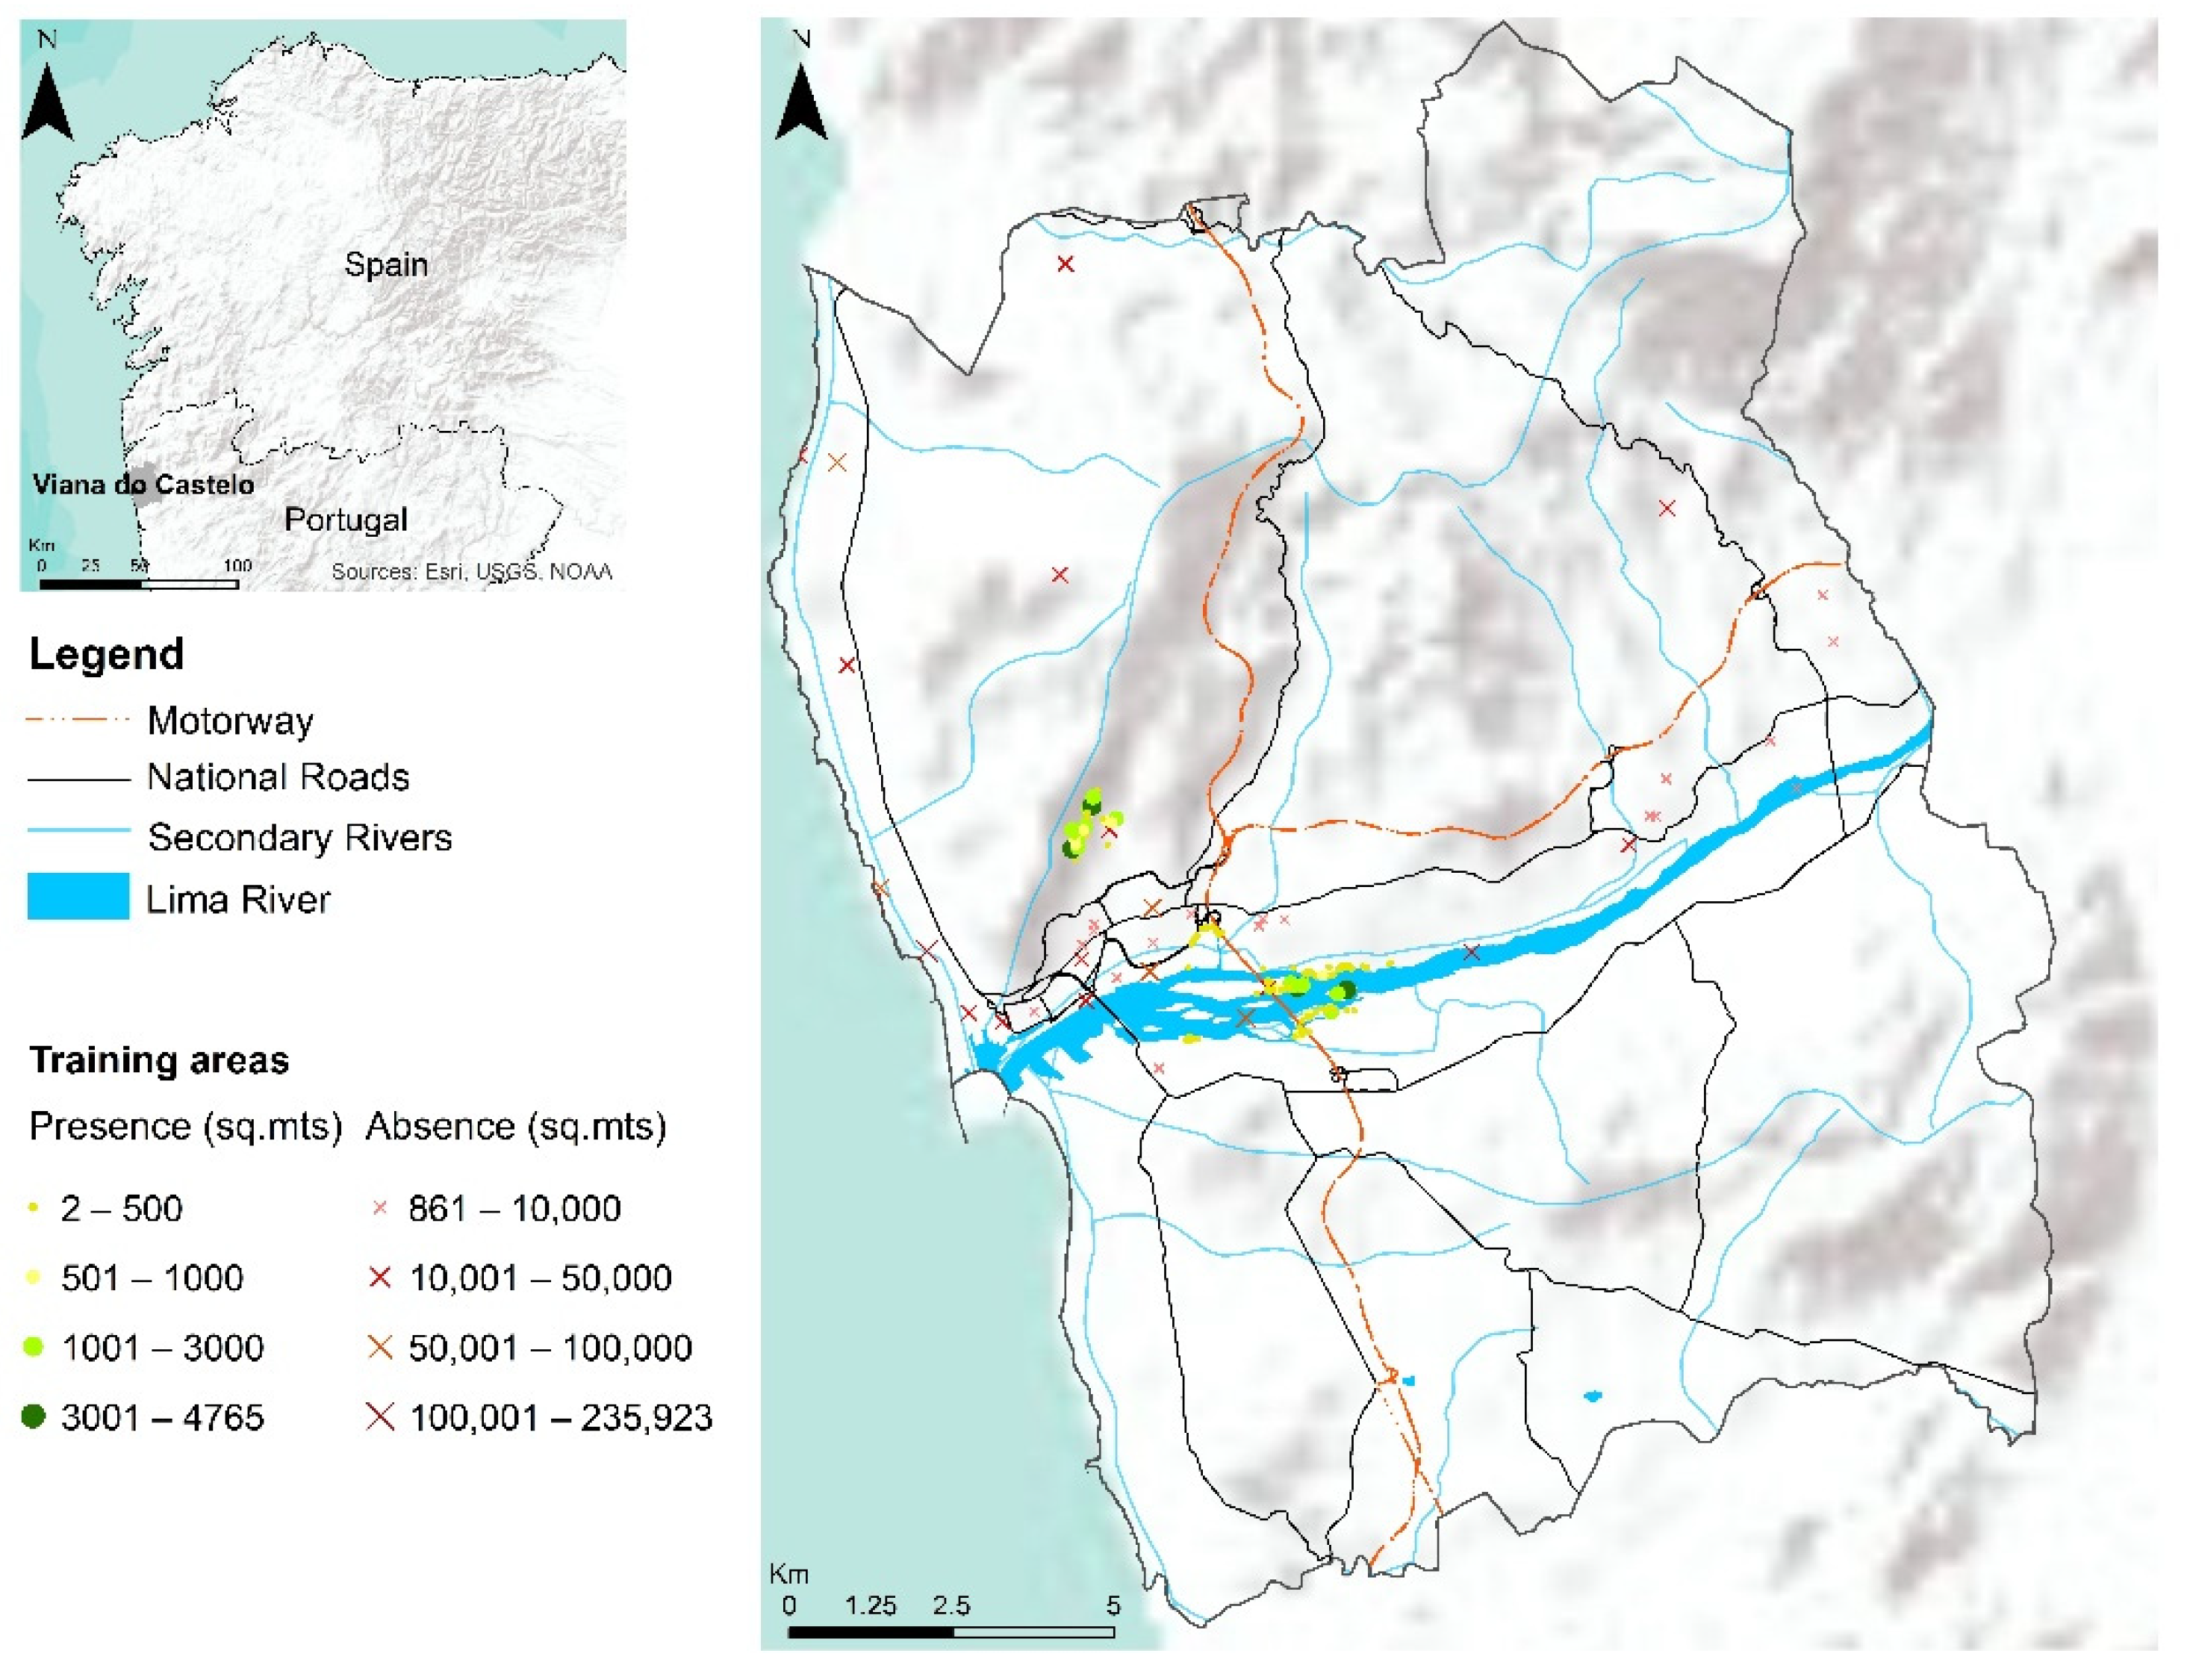
2.3. Study Area
2.4. Occurrence Data
2.5. Satellite Remote Sensing Data
2.6. Biomod2 Multi-Algorithm Supervised Classification Training and Evaluation
2.7. Variable Reduction and Importance Calculation
2.8. Classifier Fusion Ensemble
2.9. Assessing the Invasion Drivers of A. longifolia at the Landscape Level through Predictive Modelling
3. Results
3.1. Partial and Ensemble Fusion Classification Performance
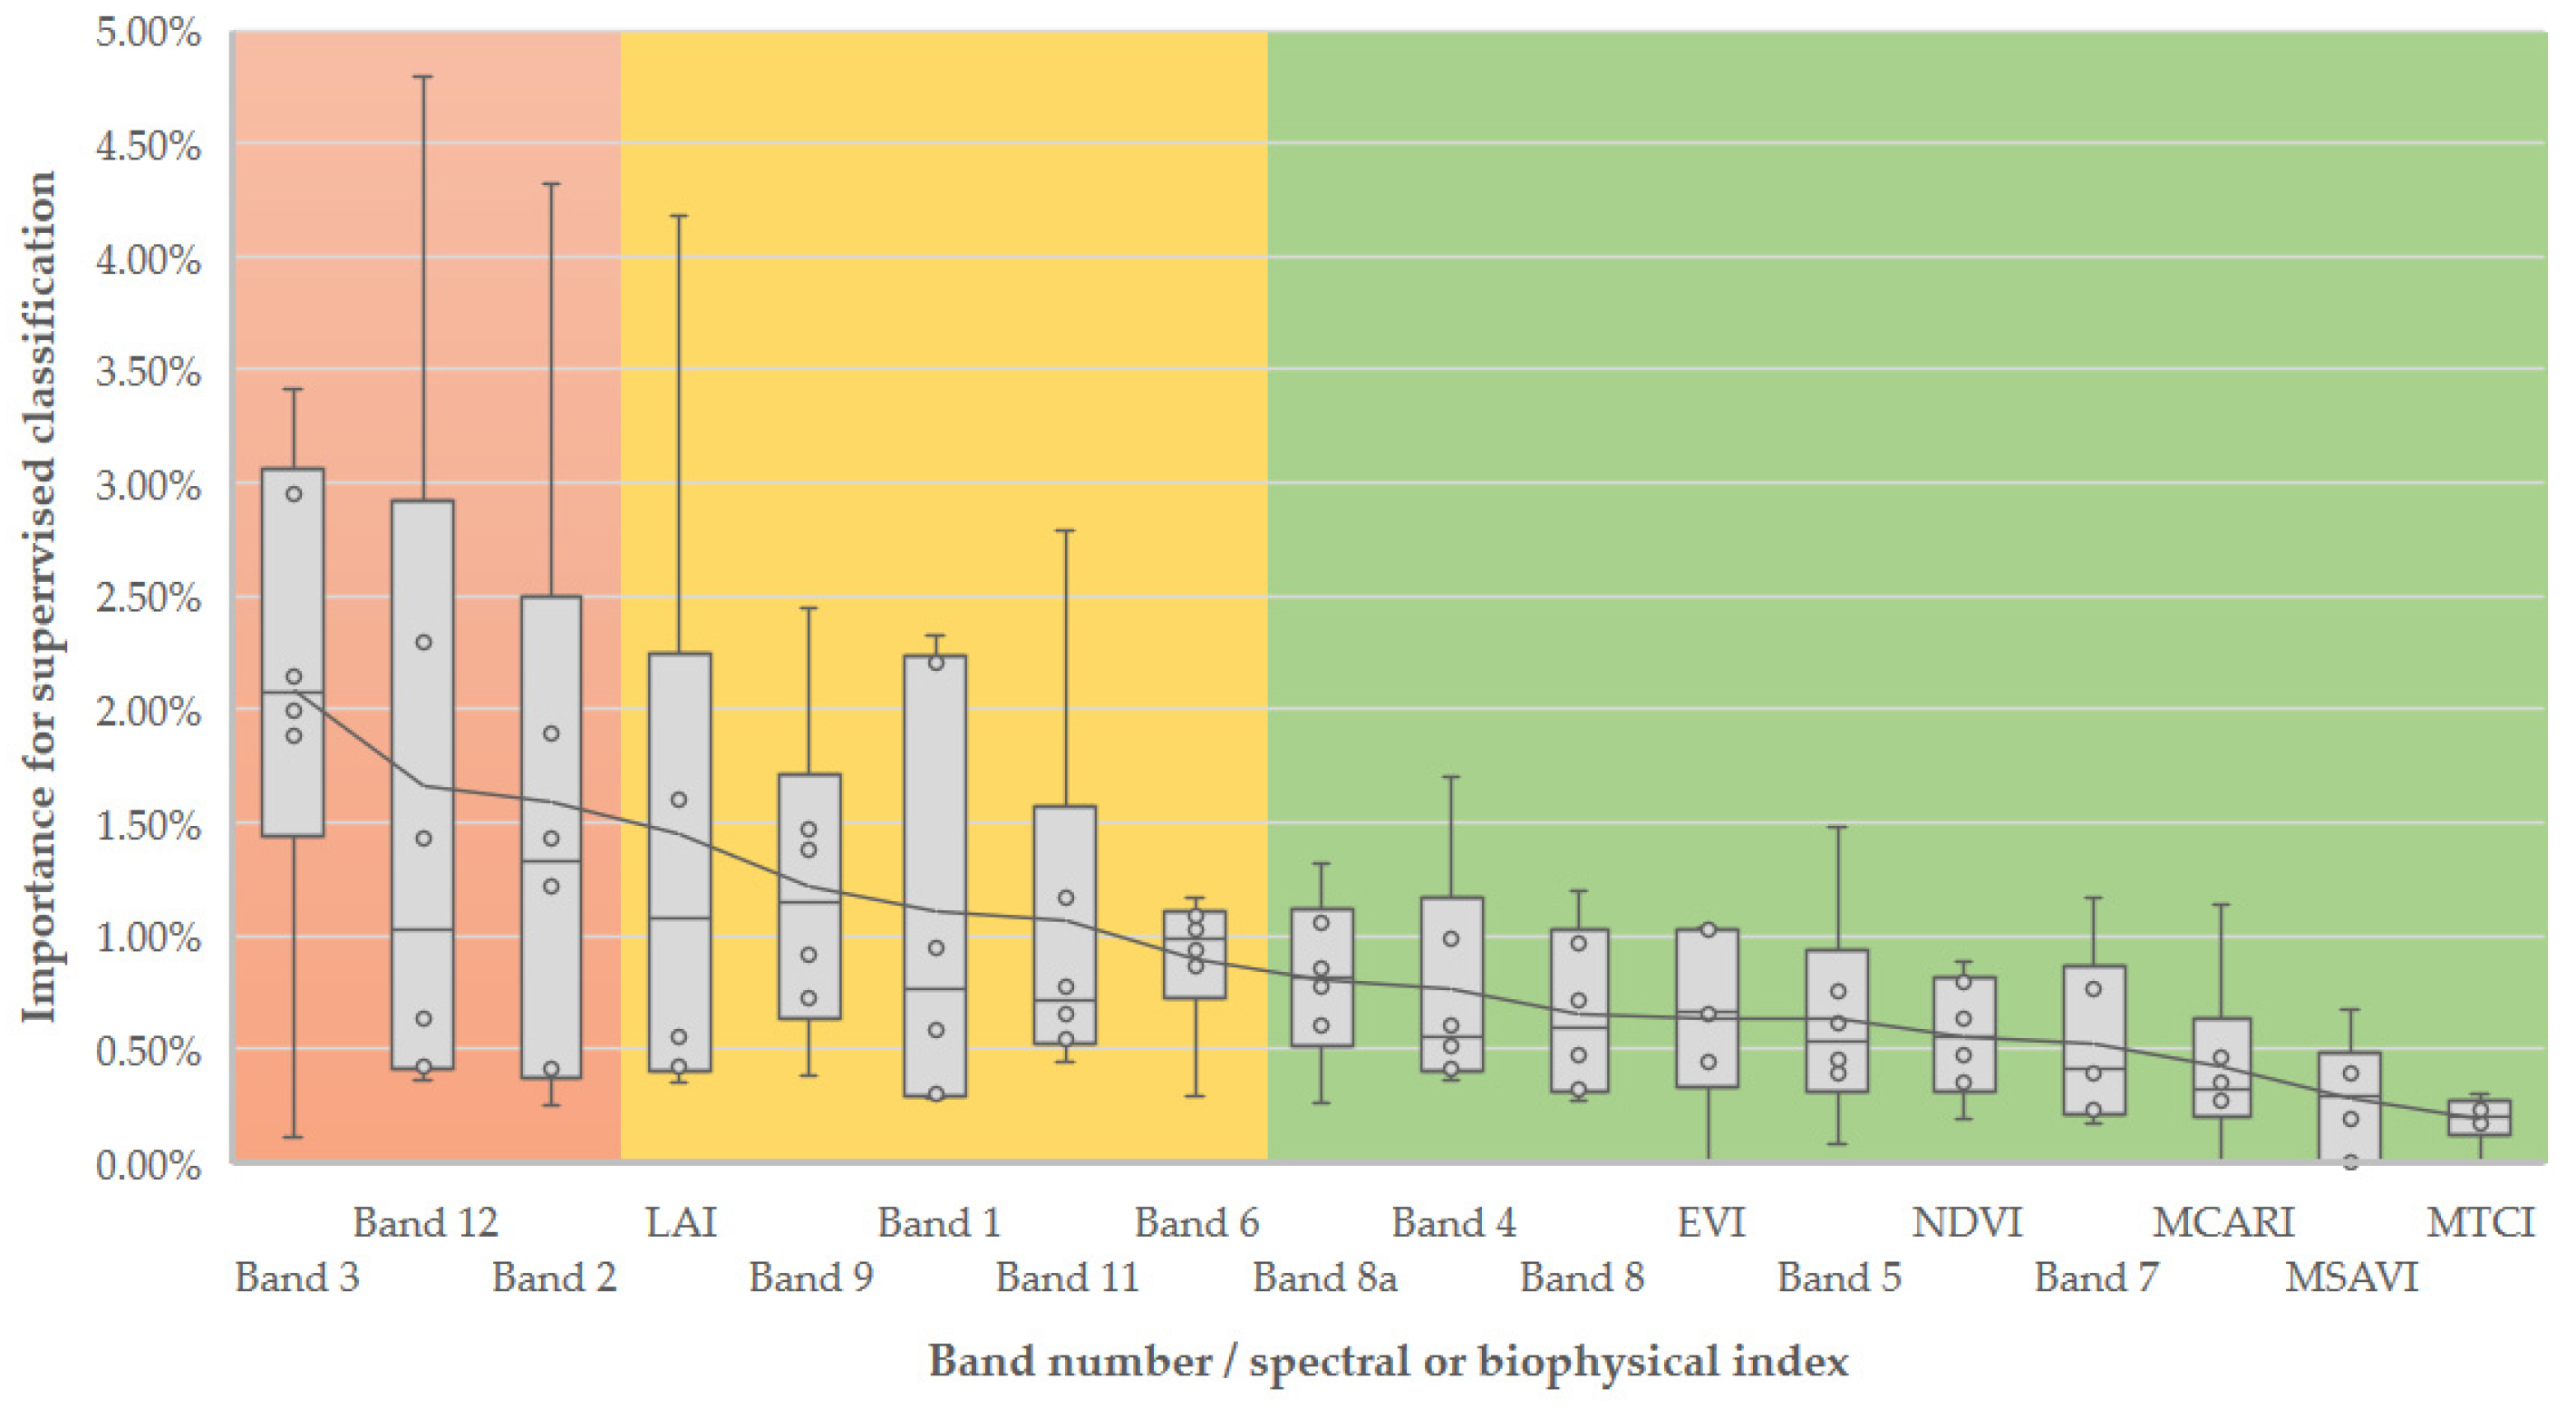
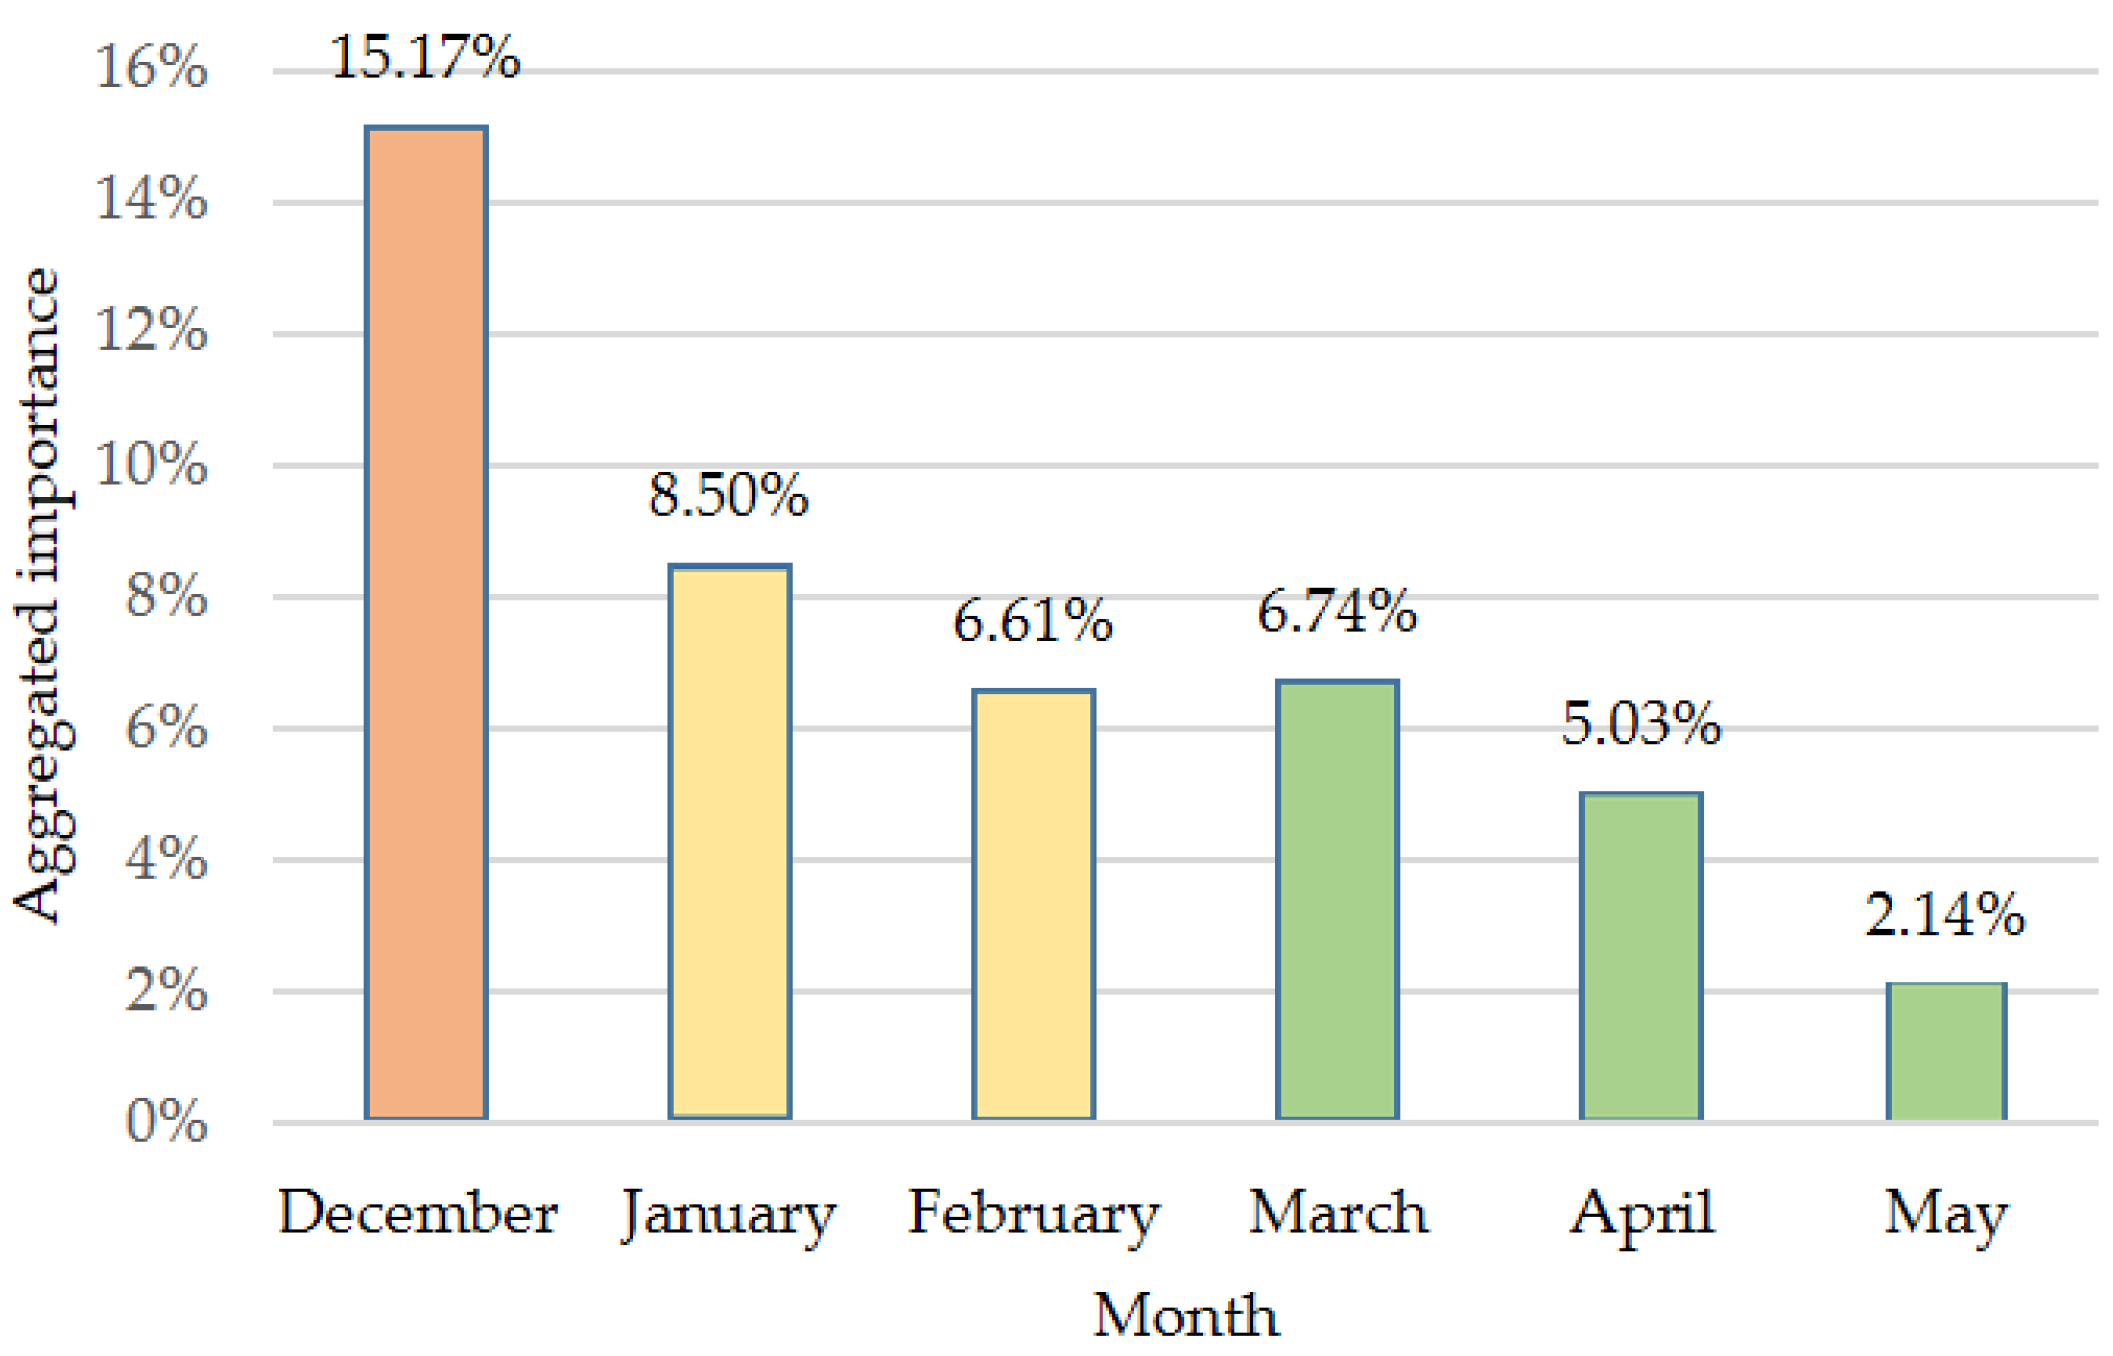
3.2. Feature Importance in Image Classification
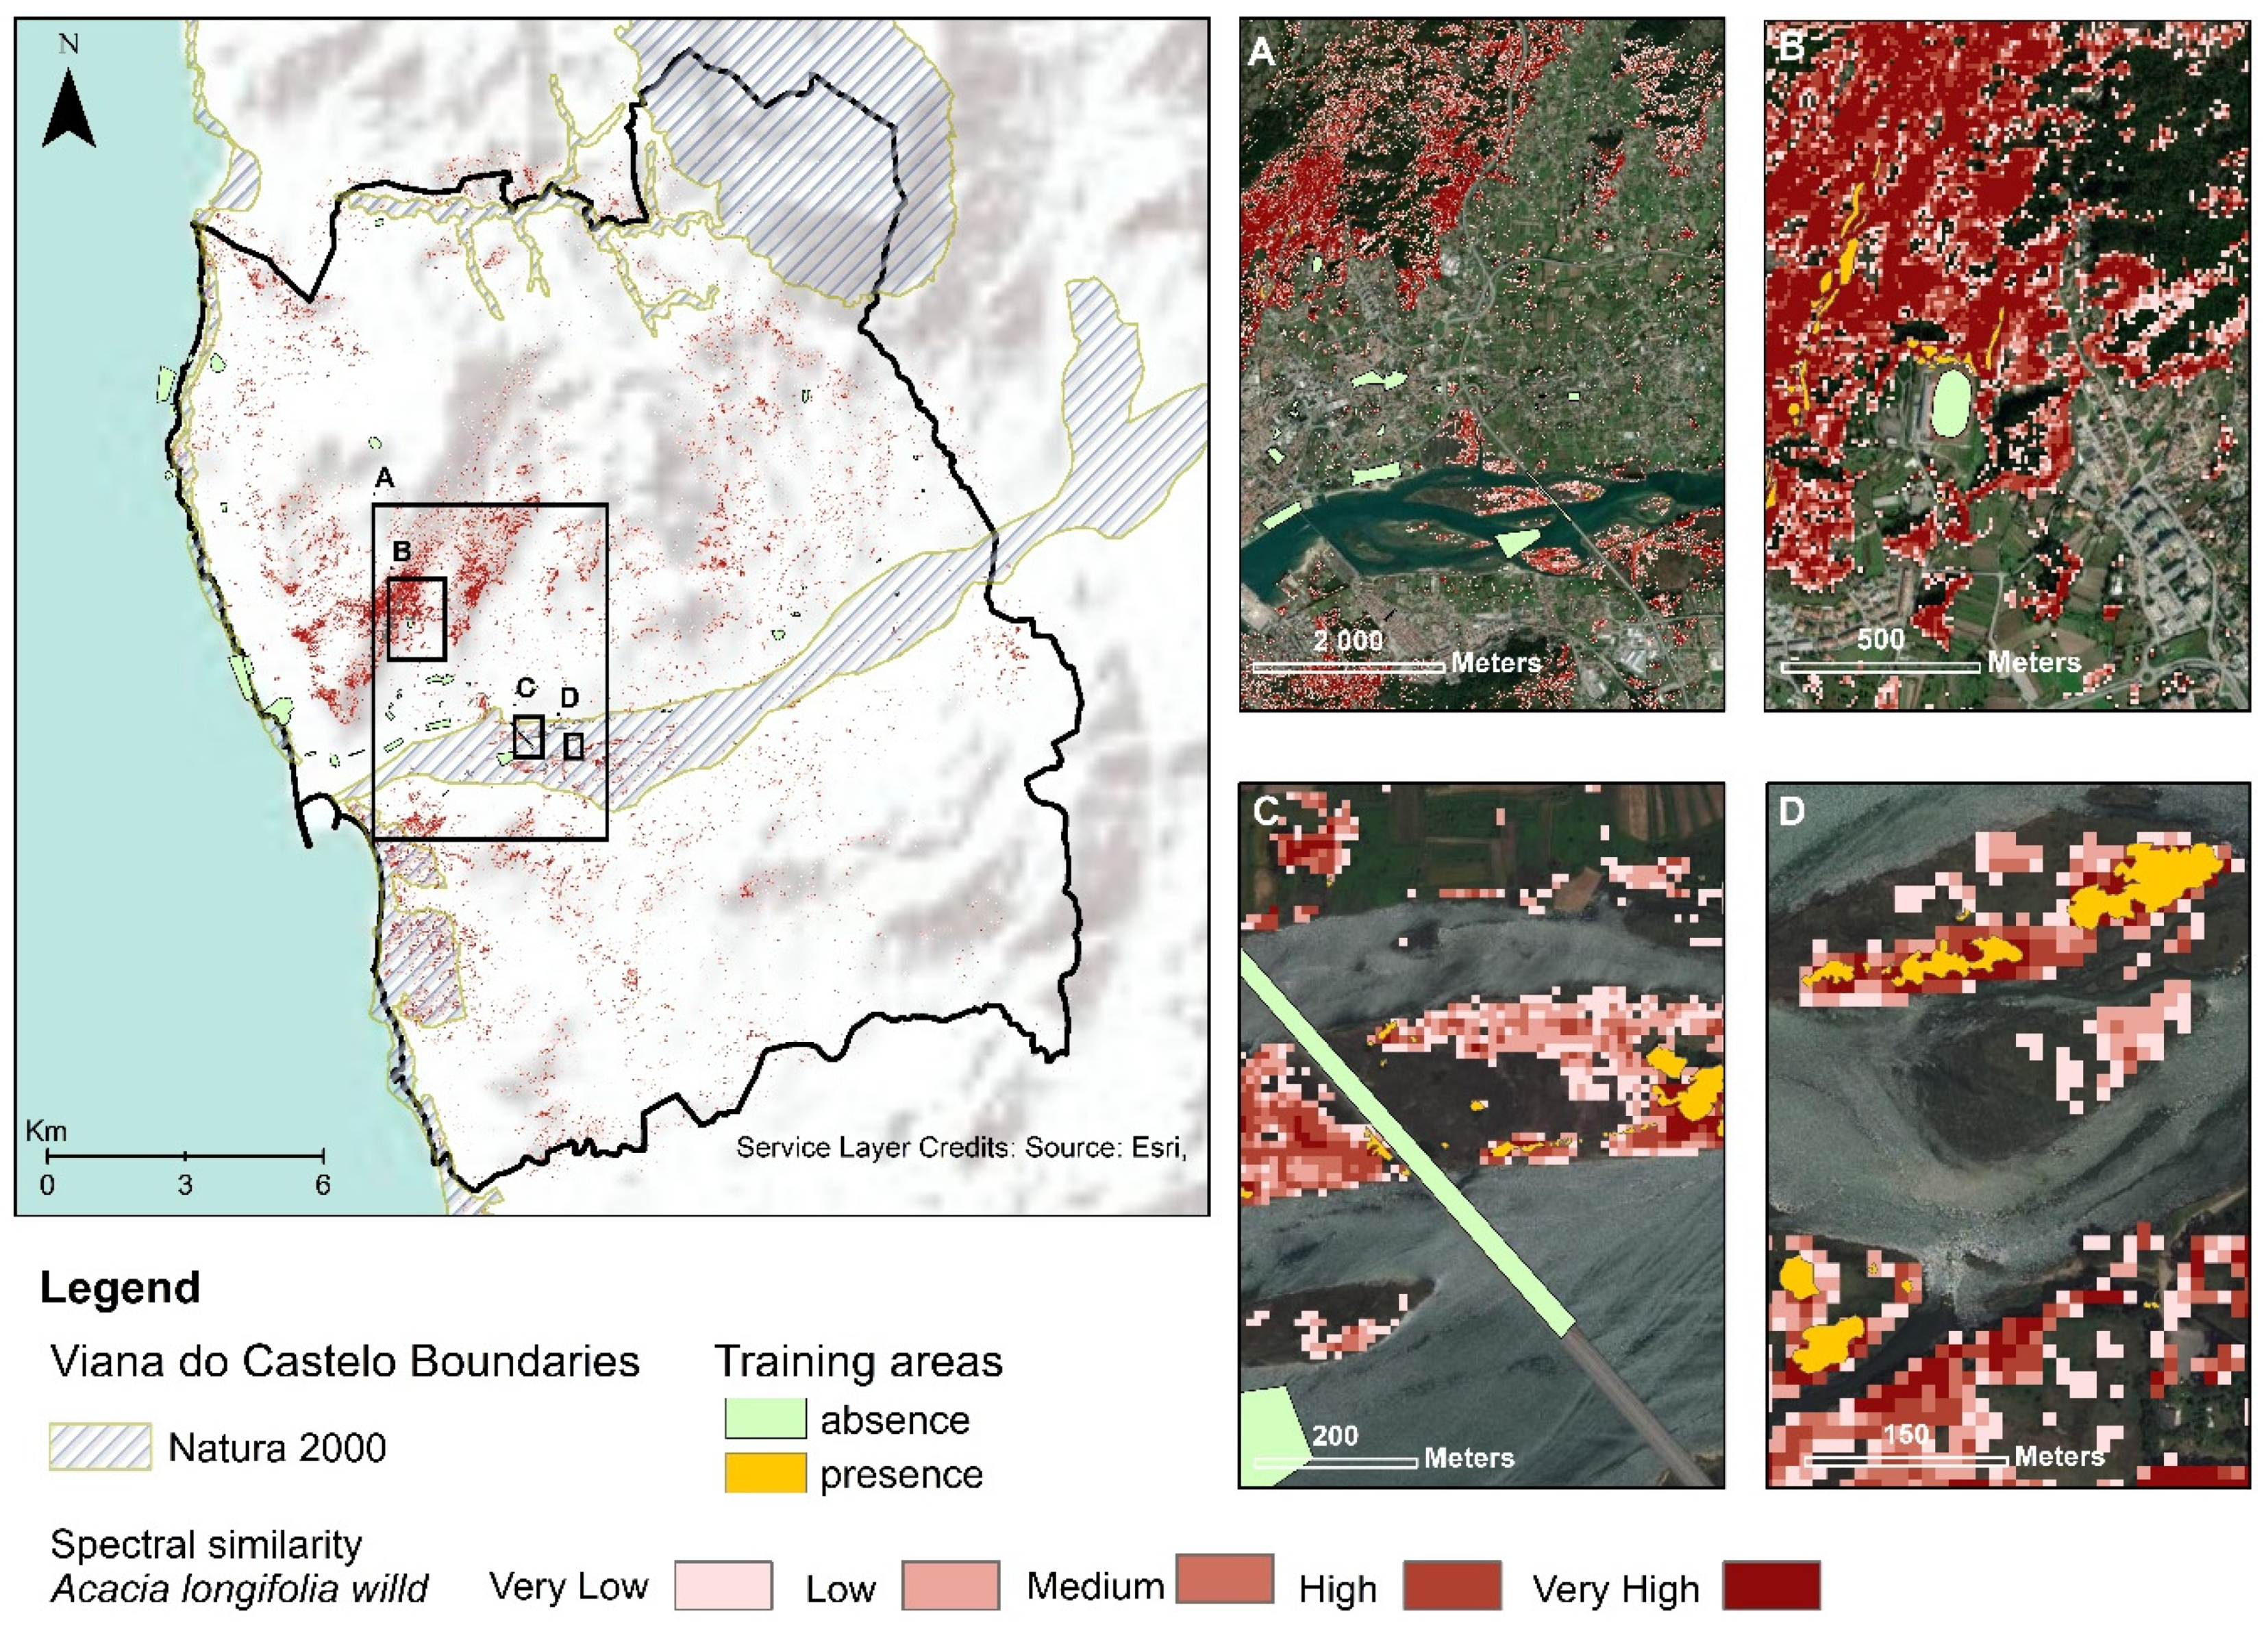
3.3. Acacia Longifolia Mapping
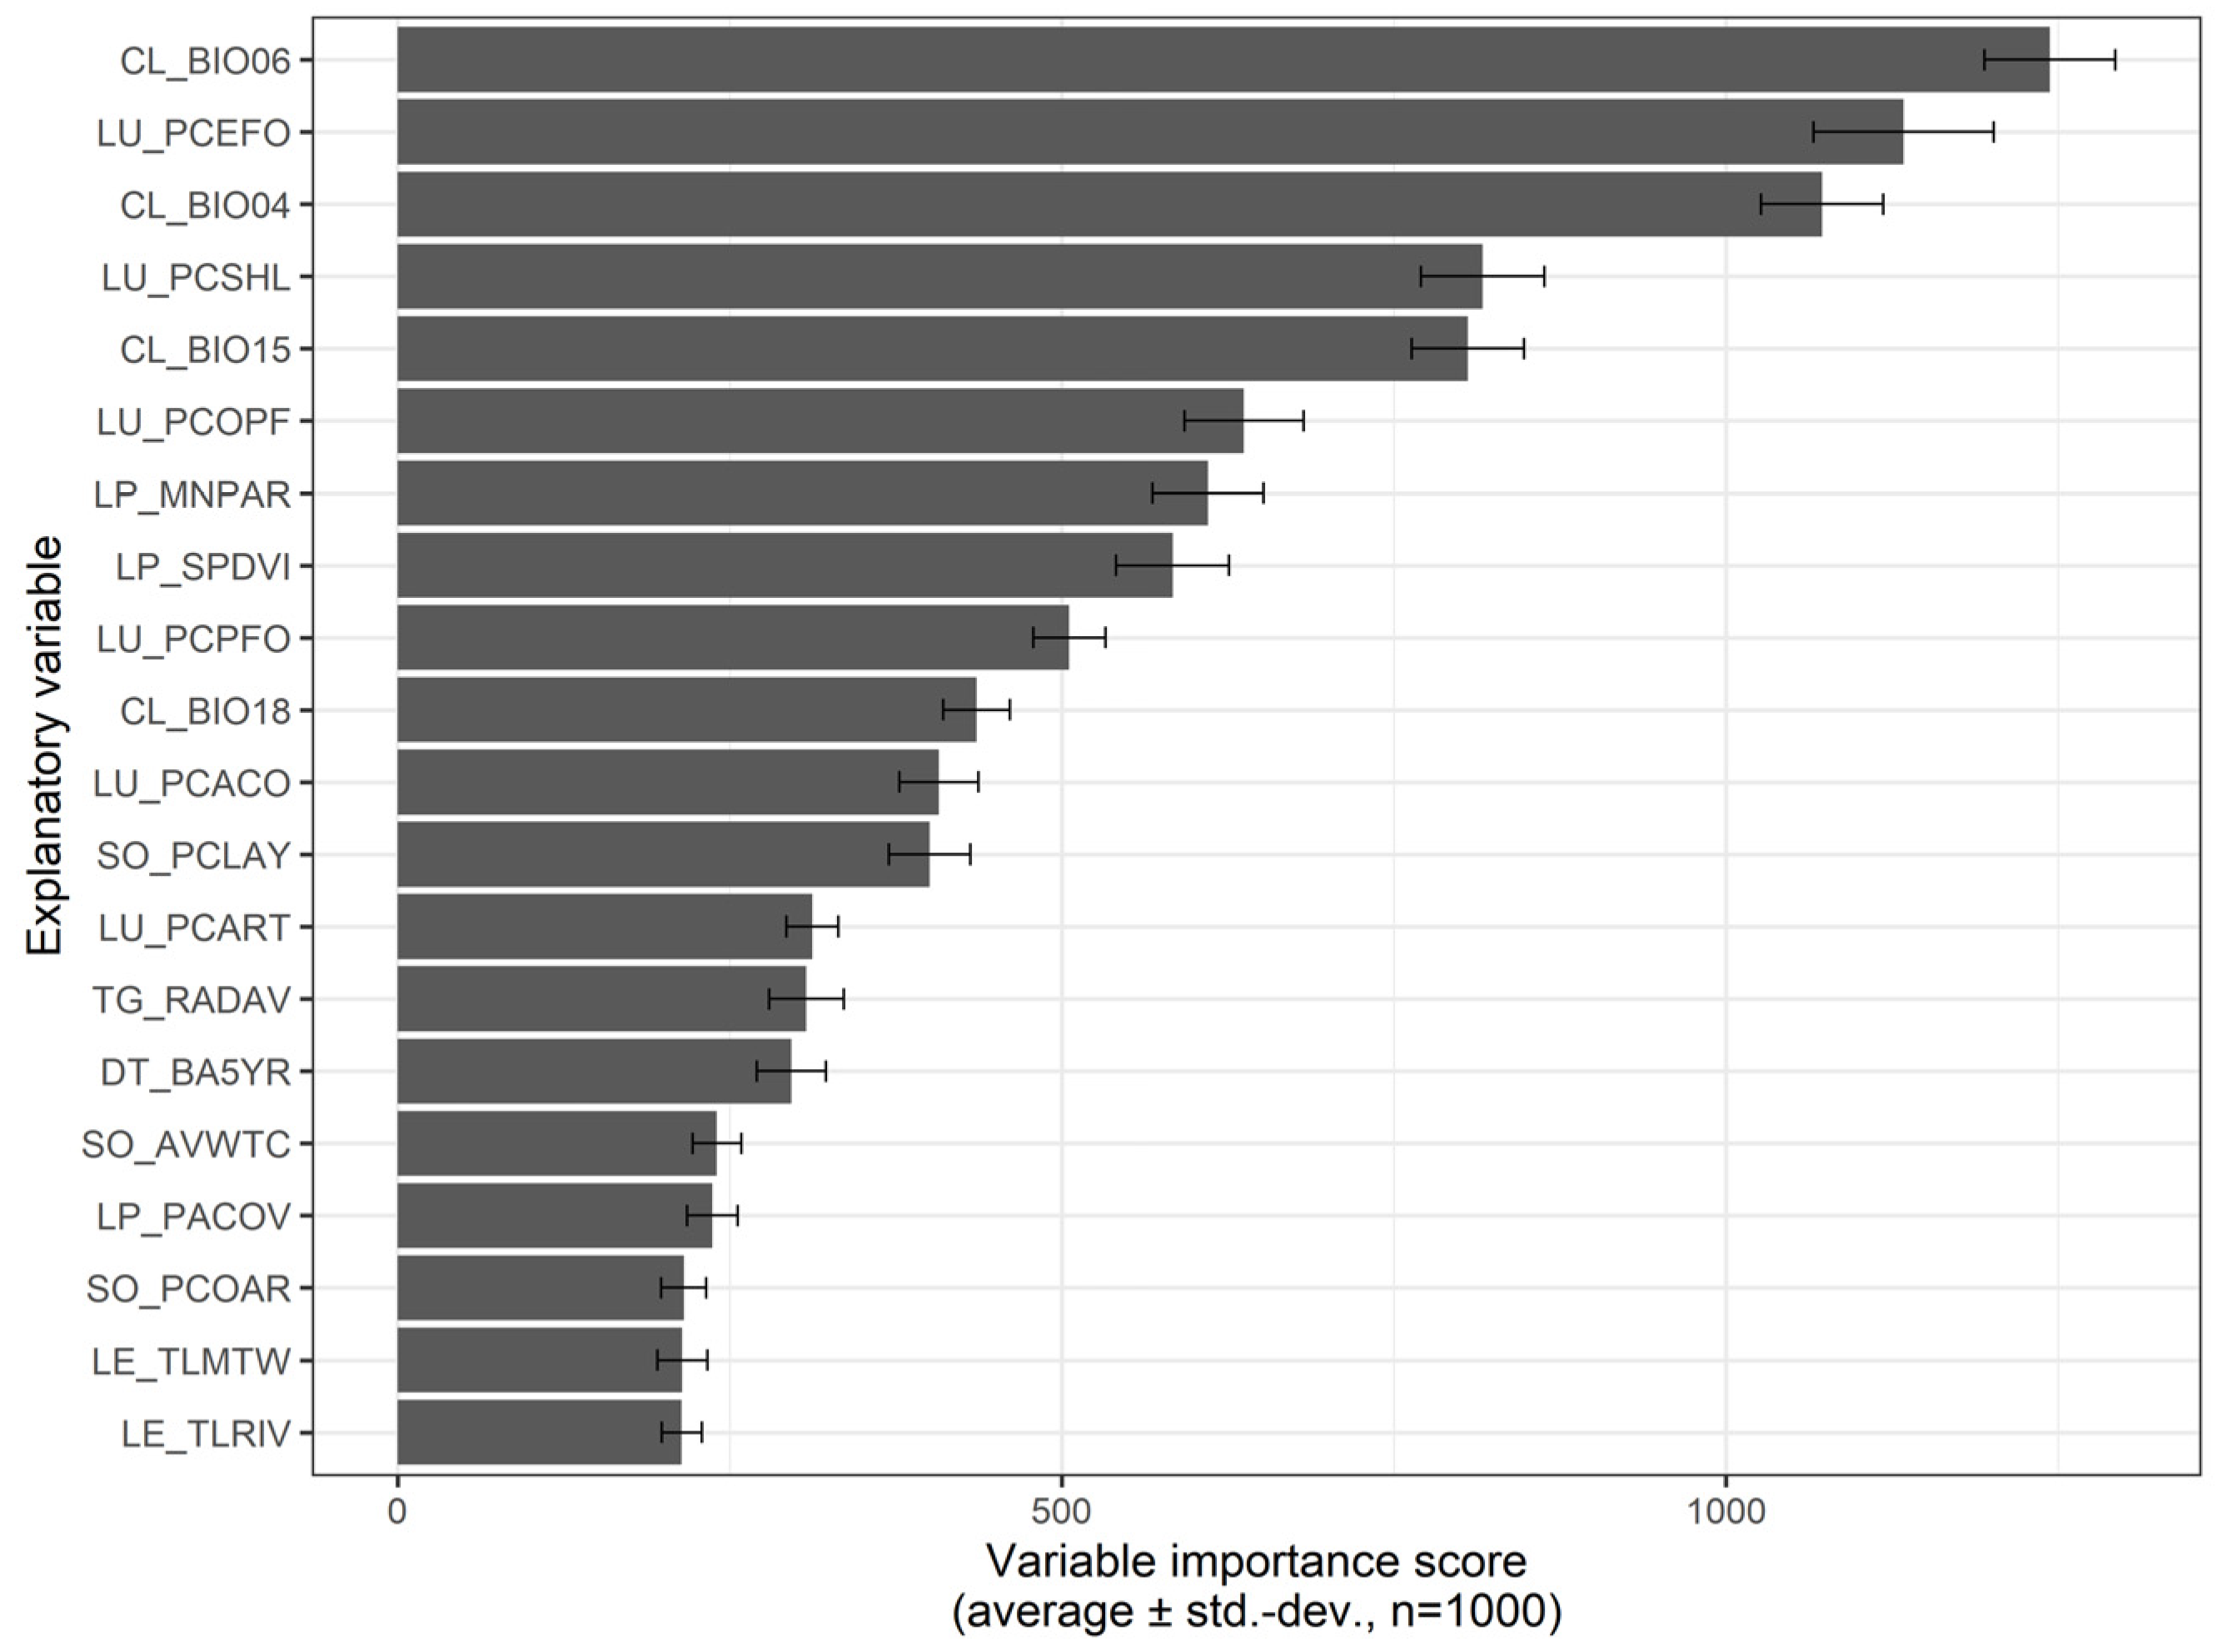
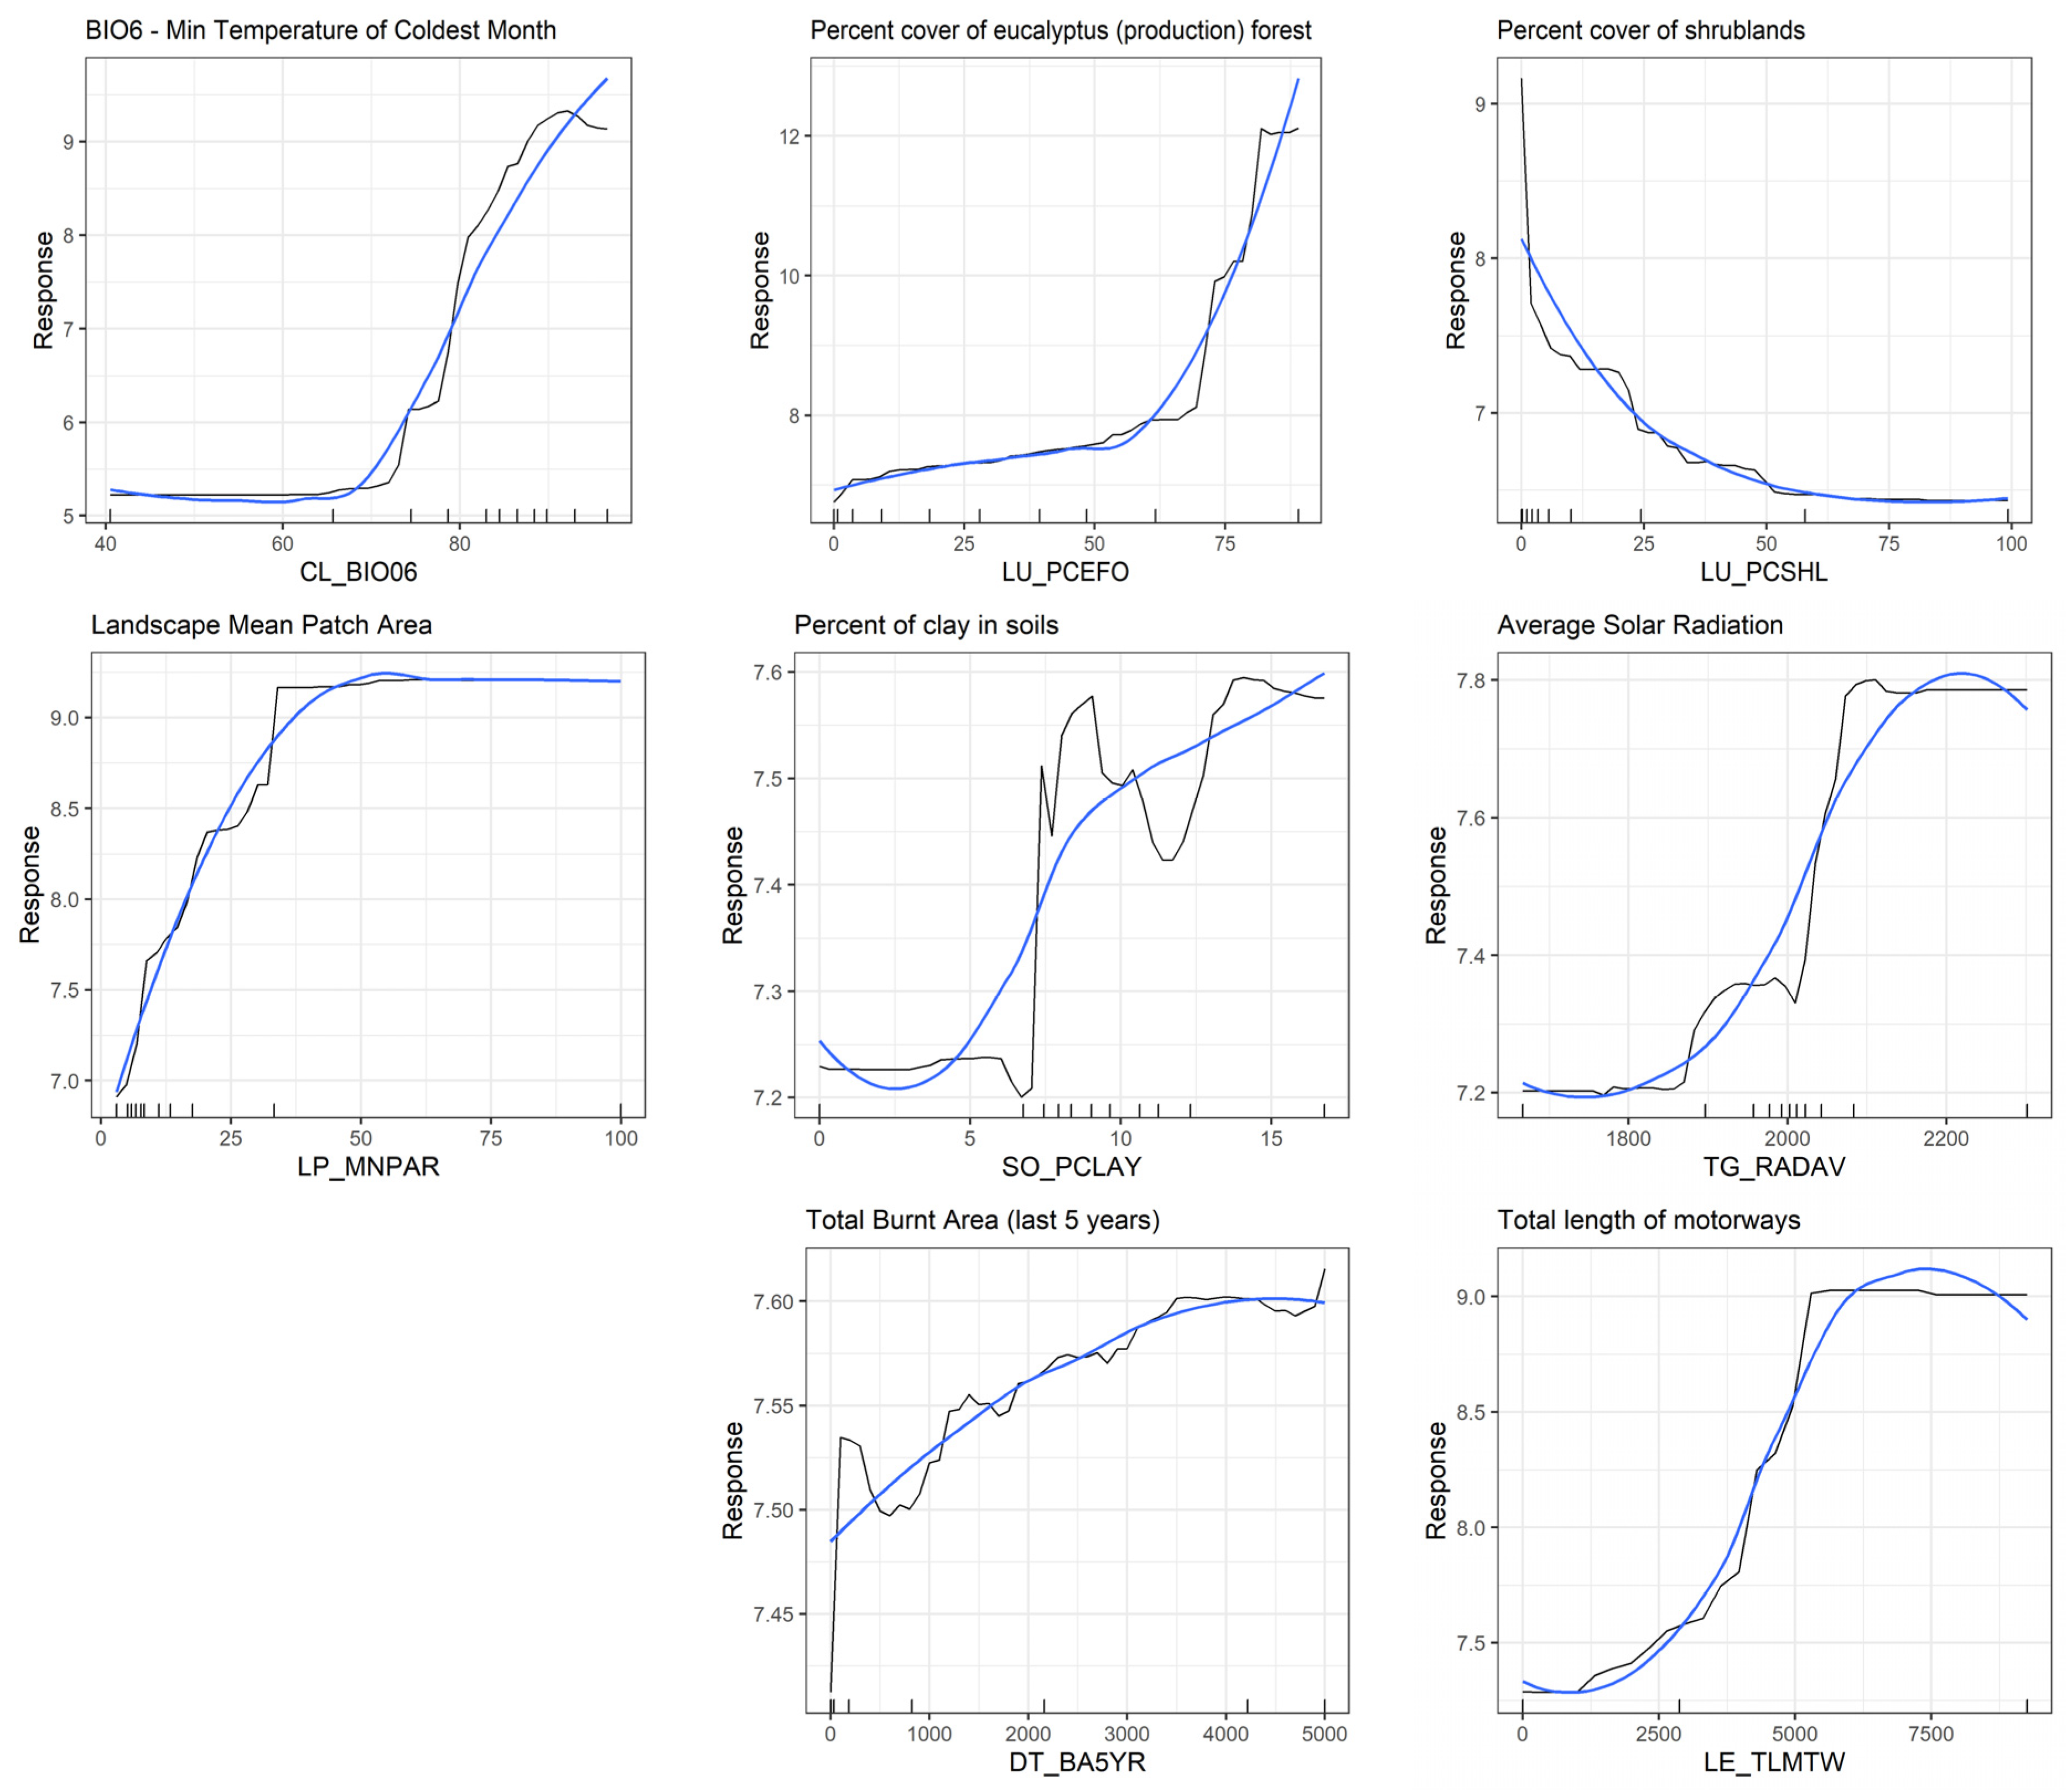
3.4. Predictive Modelling—Landscape-Level Drivers of A. longifolia Invasion
4. Discussion
4.1. Multispectral Remote Sensing Imagery and Data Fusion Techniques through biomod2 for A. longifolia Detection
4.2. Landscape Patterns and Drivers of Acacia longifolia Distribution
4.3. Applications in Invasion Management and Control
4.4. Future Improvements to the Methodology
5. Conclusions
Supplementary Materials
Author Contributions
Funding
Institutional Review Board Statement
Informed Consent Statement
Data Availability Statement
Acknowledgments
Conflicts of Interest
Appendix A

| Month/Spectral Band/Index | Average Variable Importance Score | Importance Score Standard Deviation | % Relative Importance |
|---|---|---|---|
| December_b12 | 0.137 | 0.206 | 4.79 |
| January_b2 | 0.124 | 0.109 | 4.32 |
| January_lai | 0.120 | 0.183 | 4.18 |
| April_b3 | 0.098 | 0.131 | 3.41 |
| March_b3 | 0.084 | 0.162 | 2.94 |
| December_b11 | 0.079 | 0.131 | 2.78 |
| February_b9 | 0.070 | 0.133 | 2.44 |
| December_b1 | 0.066 | 0.084 | 2.32 |
| February_b12 | 0.065 | 0.132 | 2.29 |
| March_b1 | 0.063 | 0.117 | 2.20 |
| May_b3 | 0.061 | 0.127 | 2.14 |
| December_b3 | 0.057 | 0.104 | 1.99 |
| April_b2 | 0.054 | 0.065 | 1.89 |
| February_b3 | 0.054 | 0.086 | 1.88 |
| December_b4 | 0.048 | 0.075 | 1.69 |
| March_lai | 0.046 | 0.090 | 1.60 |
| December_lai | 0.045 | 0.097 | 1.60 |
Appendix B
| Type | Acronym | Variable Description | Data Source |
|---|---|---|---|
| Climate | CL_BIO01 | Annual Mean Temperature | CHELSA Climate data v-1.2 (URL: https://chelsa-climate.org/, access date: 6 December 2020, spatial resolution: ~1 Km2, reference period: 1979–2013) |
| CL_BIO02 | Mean Diurnal Range (Mean of monthly (maximum temperature–minimum temperature)) | ||
| CL_BIO03 | Isothermality (CL_BIO2/CL_BIO7) (×100) | ||
| CL_BIO04 | Temperature Seasonality (standard deviation × 100) | ||
| CL_BIO05 | Maximum Temperature of Warmest Month | ||
| CL_BIO06 | Minimum Temperature of Coldest Month | ||
| CL_BIO07 | Temperature Annual Range (CL_BIO5–CL_BIO6) | ||
| CL_BIO08 | Mean Temperature of Wettest Quarter | ||
| CL_BIO09 | Mean Temperature of Driest Quarter | ||
| CL_BIO10 | Mean Temperature of Warmest Quarter | ||
| CL_BIO11 | Mean Temperature of Coldest Quarter | ||
| CL_BIO12 | Annual Precipitation | ||
| CL_BIO13 | Precipitation of Wettest Month | ||
| CL_BIO14 | Precipitation of Driest Month | ||
| CL_BIO15 | Precipitation Seasonality (Coefficient of Variation) | ||
| CL_BIO16 | Precipitation of Wettest Quarter | ||
| CL_BIO17 | Precipitation of Driest Quarter | ||
| CL_BIO18 | Precipitation of Warmest Quarter | ||
| CL_BIO19 | Precipitation of Coldest Quarter | ||
| Disturbance | DT_BA10YR | Total Burnt Area (last 10 years) | Burnt Areas Dataset for Mainland Portugal (URL: https://geocatalogo.icnf.pt/, access date: 6 December 2020, spatial resolution: ~1 ha, reference period: 2000–2019) |
| DT_BA20YR | Total Burnt Area (last 20 years) | ||
| DT_BA5YR | Total Burnt Area (last 5 years) | ||
| Land use | LU_PCPCO | Percent cover of permanent crops | Land Cover Map for Portugal (URL: http://mapas.dgterritorio.pt, access date: 11 December 2020: spatial resolution: ~100 m, reference year: 2018) |
| LU_PCACO | Percent cover of annual crops | ||
| LU_PCPAC | Percent cover of permanent and annual crops | ||
| LU_PCNFO | Percent cover of native forests | ||
| LU_PCEFO | Percent cover of eucalyptus (production) forest | ||
| LU_PCPFO | Percent cover of maritime-pine (production) forest | ||
| LU_PCSHL | Percent cover of shrublands | ||
| LU_PCAFM | Percent cover of complex agroforestry mosaics | ||
| LU_PCOPF | Percent cover of other production forests | ||
| LU_PCPAS | Percent cover of pasturelands | ||
| LU_PCWET | Percent cover of wetlands | ||
| LU_PCBSD | Percent cover of beaches and sand dunes | ||
| LU_PCRRL | Percent cover of roads and rails | ||
| LU_PCBRS | Percent cover of bare rock surfaces | ||
| LU_PCWTS | Percent cover of water surfaces | ||
| LU_PCART | Percent cover of artificial/urban areas | ||
| LU_PCSPV | Percent cover of sparsely vegetated areas | ||
| Landscape pattern/configuration and heterogeneity | LP_MNPAR | Landscape Mean Patch Area | |
| LP_PACOV | Landscape Patch Area Coefficient of variation | ||
| LP_LAPAI | Landscape Largest Patch Index | ||
| LP_SHDVI | Landscape Shannon Diversity | ||
| LP_SPDVI | Landscape Simpson Diversity | ||
| LP_PASTD | Landscape Patch Area Standard-deviation | ||
| Linear elements | LE_EDGDN | Landscape edge density | |
| LE_TLRIV | Total length of rivers | European River Catchment Database (URL: https://www.eea.europa.eu, access date: 6 December 2020: spatial resolution: 100 m, reference year: 2007) | |
| LE_TLROD | Total length of all road types | Open Street Map (URL: https://download.geofabrik.de/europe/portugal.html, access date: 6 December 2020: reference year: 2020) | |
| LE_TLMTW | Total length of motorways | ||
| Soil properties | SO_AVWTC | Available water content | Topsoil physical properties for Europe (URL: https://esdac.jrc.ec.europa.eu, access date: 6 December 2020: spatial resolution: 500 m, reference year: 2009) |
| SO_BULKD | Bulk Density | ||
| SO_PCLAY | Percent of clay in soils | ||
| SO_PCOAR | Percent of coarse elements in soils | ||
| SO_PSAND | Percent of sand in soils | ||
| SO_PSILT | Percent of silt in soils | ||
| Topography/Geomorphology | TG_SLOPE | Slope (%) | SRTM v-4.1 (URL: https://srtm.csi.cgiar.org/, access date: 6 December 2020: spatial resolution: 90 m, reference year: 2008) |
| TG_RADAV | Average Solar Radiation | ||
| TG_TORGI | Topographic Ruggedness Index | ||
| TG_TOWTI | Topographic Wetness Index |
References
- Vaz, A.S.; Kueffer, C.; Kull, C.A.; Richardson, D.M.; Vicente, J.R.; Kühn, I.; Schroter, M.; Hauck, J.; Bonn, A.; Honrado, J. Integrating ecosystem services and disservices: Insights from plant invasions. Ecosyst. Serv. 2017, 23, 94–107. [Google Scholar] [CrossRef] [Green Version]
- Hulme, P.E.; Brundu, G.; Carboni, M.; Dehnen-Schmutz, K.; Dullinger, S.; Early, R.; Essl, F.; Gonzalez-Moreno, P.; Groom, Q.J.; Kueffer, C. Integrating invasive species policies across ornamental horticulture supply chains to prevent plant invasions. J. Appl. Ecol. 2018, 55, 92–98. [Google Scholar] [CrossRef]
- Peerbhay, K.; Mutanga, O.; Lottering, R.; Bangamwabo, V.; Ismail, R. Detecting bugweed (Solanum mauritianum) abundance in plantation forestry using multisource remote sensing. ISPRS J. Photogramm. Remote Sens. 2016, 121, 167–176. [Google Scholar] [CrossRef]
- McGeoch, M.A.; Genovesi, P.; Bellingham, P.J.; Costello, M.J.; McGrannachan, C.; Sheppard, A. Prioritizing species, pathways, and sites to achieve conservation targets for biological invasion. Biol. Invasions 2016, 18, 299–314. [Google Scholar] [CrossRef] [Green Version]
- Brooks, M.L. Effects of Land Management Practices on Plant Invasions in Wildland Areas. In Biological Invasions; Springer: Berlin/Heidelberg, Germany, 2007; pp. 147–162. [Google Scholar]
- Pyšek, P.; Richardson, D.M. Invasive Species, Environmental Change and Management, and Health. Annu. Rev. Environ. Resour. 2010, 35, 25–55. [Google Scholar] [CrossRef] [Green Version]
- Milanović, M.; Knapp, S.; Pyšek, P.; Kühn, I. Linking traits of invasive plants with ecosystem services and disservices. Ecosyst. Serv. 2020, 42, 101072. [Google Scholar] [CrossRef]
- Vicente, J.; Alves, P.; Randin, C.; Guisan, A.; Honrado, J. What drives invasibility? A multi-model inference test and spatial modelling of alien plant species richness patterns in northern Portugal. Ecography 2010, 33, 1081–1092. [Google Scholar] [CrossRef]
- Vicente, J.R.; Pereira, H.M.; Randin, C.F.; Goncalves, J.; Lomba, A.; Alves, P.; Metzger, J.; Cezar, M.; Guisan, A.; Honrado, J. Environment and dispersal paths override life strategies and residence time in determining regional patterns of invasion by alien plants. Perspect. Plant Ecol. Evol. Syst. 2014, 16, 1–10. [Google Scholar] [CrossRef]
- Souza-Alonso, P.; Rodríguez, J.; González, L.; Lorenzo, P. Here to stay. Recent advances and perspectives about Acacia invasion in Mediterranean areas. Ann. For. Sci. 2017, 74, 55. [Google Scholar] [CrossRef] [Green Version]
- Marchante, E.; Marchante, H. Engaging Society to Fight Invasive Alien Plants in Portugal—One of the Main Threats to Biodiversity. In World Sustainability Series; Springer: Berlin/Heidelberg, Germany, 2016; pp. 107–122. [Google Scholar]
- Nunes, L.R.; Meireles, C.I.R.; CJ, P.; NMC, A.R. Propagation Model of Invasive Species: Road Systems as Dispersion Facilitators. Res. Ecol. 2019, 2, 12–19. [Google Scholar] [CrossRef]
- Alvarez-Taboada, F.; Paredes, C.; Julián-Pelaz, J. Mapping of the Invasive Species Hakea sericea Using Unmanned Aerial Vehicle (UAV) and WorldView-2 Imagery and an Object-Oriented Approach. Remote Sens. 2017, 9, 913. [Google Scholar] [CrossRef] [Green Version]
- Royimani, L.; Mutanga, O.; Odindi, J.; Dube, T.; Matongera, T.N. Advancements in satellite remote sensing for mapping and monitoring of alien invasive plant species (AIPs). Phys. Chem. Earth Parts A/B/C 2019, 112, 237–245. [Google Scholar] [CrossRef]
- Masemola, C.; Cho, M.A.; Ramoelo, A. Assessing the Effect of Seasonality on Leaf and Canopy Spectra for the Discrimination of an Alien Tree Species, Acacia Mearnsii, from Co-Occurring Native Species Using Parametric and Nonparametric Classifiers. IEEE Trans. Geosci. Remote Sens. 2019, 57, 5853–5867. [Google Scholar] [CrossRef]
- Thuiller, W.; Lafourcade, B.; Engler, R.; Araújo, M.B. BIOMOD—A platform for ensemble forecasting of species distributions. Ecography 2009, 32, 369–373. [Google Scholar] [CrossRef]
- Thuiller, W.; Georges, D.; Robin, E.; Breiner, F.; Engler, R.; Breiner, F. Package ‘biomod2’. Ensemble Platform for Species Distribution Modeling. 2020. Available online: https://cran.r-project.org/web/packages/biomod2/biomod2.pdf (accessed on 10 August 2021).
- Elith, J.; Leathwick, J.R. Species Distribution Models: Ecological Explanation and Prediction Across Space and Time. Annu. Rev. Ecol. Evol. Syst. 2009, 40, 677–697. [Google Scholar] [CrossRef]
- Guisan, A.; Tingley, R.; Baumgartner, J.B.; Naujokaitis-Lewis, I.; Sutcliffe, P.R.; Tulloch, A.I.; Regan, T.J.; Brotons, L.; McDonald-Madden, E.; Mantyka-Pringle, C.; et al. Predicting species distributions for conservation decisions. Ecol. Lett. 2013, 16, 1424–1435. [Google Scholar] [CrossRef]
- Barbosa, A.M.; Real, R.; Vargas, J.M. Use of Coarse-Resolution Models of Species’ Distributions to Guide Local Conservation Inferences. Conserv. Biol. 2010, 24, 1378–1387. [Google Scholar] [CrossRef]
- Hao, T.; Elith, J.; Guillera-Arroita, G.; Lahoz-Monfort, J.J. A review of evidence about use and performance of species distribution modelling ensembles like BIOMOD. Divers. Distrib. 2019, 25, 839–852. [Google Scholar] [CrossRef]
- Löw, F.; Conrad, C.; Michel, U. Decision fusion and non-parametric classifiers for land use mapping using multi-temporal RapidEye data. ISPRS J. Photogramm. Remote Sens. 2015, 108, 191–204. [Google Scholar] [CrossRef]
- Fernandes, R.F.; Vicente, J.R.; Georges, D.; Alves, P.; Thuiller, W.; Honrado, J.P. A novel downscaling approach to predict plant invasions and improve local conservation actions. Biol. Invasions 2014, 16, 2577–2590. [Google Scholar] [CrossRef]
- Huang, C.; Asner, G. Applications of Remote Sensing to Alien Invasive Plant Studies. Sensors 2009, 9, 4869–4889. [Google Scholar] [CrossRef] [Green Version]
- Vicente, J.; Randin, C.F.; Gonçalves, J.; Metzger, M.J.; Lomba, Â.; Honrado, J.; Guisan, A. Where will conflicts between alien and rare species occur after climate and land-use change? A test with a novel combined modelling approach. Biol. Invasions 2011, 13, 1209–1227. [Google Scholar] [CrossRef]
- Shmueli, G. To Explain or to Predict? Stat. Sci. 2010, 25, 289–310. [Google Scholar] [CrossRef]
- Monteiro, A.T.; Gonçalves, J.; Fernandes, R.F.; Alves, S.; Marcos, B.; Lucas, R.; Teodoro, A.C.; Honrado, J. Estimating Invasion Success by Non-Native Trees in a National Park Combining WorldView-2 Very High Resolution Satellite Data and Species Distribution Models. Diversity 2017, 9, 6. [Google Scholar] [CrossRef] [Green Version]
- Le Maitre, D.C.; Gaertner, M.; Marchante, E.; Ens, E.J.; Holmes, P.M.; Pauchard, A.; O’Farrell, P.J.; Rogers, A.M.; Blanchard, R.; Blignaut, J.; et al. Impacts of invasive Australian acacias: Implications for management and restoration. Divers. Distrib. 2011, 17, 1015–1029. [Google Scholar] [CrossRef]
- Shamsbiranvand, M.-H.; Khodadadi, A.; Assarehzadegan, M.-A.; Borsi, S.H.; Amini, A. Immunochemical Characterization of Acacia Pollen Allergens and Evaluation of Cross-Reactivity Pattern with the Common Allergenic Pollens. J. Allergy 2014, 2014, 409056. [Google Scholar] [CrossRef] [Green Version]
- Irian, S.; Majd, A.; Hoseinizadeh, A.; Jonubi, P. A study on the allergenicity and ontogeny of Acacia farnesiana pollen grains in guinea pigs. Aerobiologia 2013, 29, 21–29. [Google Scholar] [CrossRef]
- Mkunyana, Y.P.; Mazvimavi, D.; Dzikiti, S.; Ntshidi, Z. A comparative assessment of water use by Acacia longifolia invasions occurring on hillslopes and riparian zones in the Cape Agulhas region of South Africa. Phys. Chem. Earth Parts A/B/C 2019, 112, 255–264. [Google Scholar] [CrossRef]
- Lazzaro, L.; Giuliani, C.; Fabiani, A.; Agnelli, A.E.; Pastorelli, R.; Lagomarsino, A.; Benesperi, R.; Calamassi, R.; Foggi, B. Soil and plant changing after invasion: The case of Acacia dealbata in a Mediterranean ecosystem. Sci. Total Environ. 2014, 497, 491–498. [Google Scholar] [CrossRef]
- Marchante, E.; Kjøller, A.; Struwe, S.; Freitas, H. Short- and long-term impacts of Acacia longifolia invasion on the belowground processes of a Mediterranean coastal dune ecosystem. Appl. Soil Ecol. 2008, 40, 210–217. [Google Scholar] [CrossRef] [Green Version]
- Rascher, K.G.; Große-Stoltenberg, A.; Máguas, C.; Werner, C. Understory Invasion by Acacia longifolia Alters the Water Balance and Carbon Gain of a Mediterranean Pine Forest. Ecosystems 2011, 14, 904–919. [Google Scholar] [CrossRef]
- Rascher, K.G.; Große-Stoltenberg, A.; Máguas, C.; Meira-Neto, J.A.A.; Werner, C. Acacia longifolia invasion impacts vegetation structure and regeneration dynamics in open dunes and pine forests. Biol. Invasions 2011, 13, 1099–1113. [Google Scholar] [CrossRef]
- Fernandes, M.M. Acácias e geografia histórica: Rotas de um percurso. Cad. Curso Doutor. Geogr. 2012, 4, 23–40. [Google Scholar]
- Vicente, J.R.; Fernandes, R.F.; Randin, C.F.; Broennimann, O.; Gonçalves, J.; Marcos, B.; Pocas, I.; Alves, P.; Guisan, A.; Honrado, J.P. Will climate change drive alien invasive plants into areas of high protection value? An improved model-based regional assessment to prioritise the management of invasions. J. Environ. Manag. 2013, 131, 185–195. [Google Scholar] [CrossRef] [PubMed]
- Santos, M.; Freitas, R.; Crespí, A.L.; Hughes, S.J.; Cabral, J.A. Predicting trends of invasive plants richness using local socio-economic data: An application in North Portugal. Environ. Res. 2011, 111, 960–966. [Google Scholar] [CrossRef]
- De Sá, N.C.; Marchante, H.; Marchante, E.; Cabral, J.A.; Honrado, J.P.; Vicente, J.R. Can citizen science data guide the surveillance of invasive plants? A model-based test with Acacia trees in Portugal. Biol. Invasions 2019, 21, 2127–2141. [Google Scholar] [CrossRef]
- Estado do Ordenamento do Território—Câmara Municipal de Viana do Castelo. 2019. Available online: http://www.cm-viana-castelo.pt/pt/estado-do-ordenamento-do-territorio (accessed on 29 June 2020).
- Große-Stoltenberg, A.; Hellmann, C.; Thiele, J.; Werner, C.; Oldeland, J. Early detection of GPP-related regime shifts after plant invasion by integrating imaging spectroscopy with airborne LiDAR. Remote Sens. Environ. 2018, 209, 780–792. [Google Scholar] [CrossRef]
- Barbet-Massin, M.; Jiguet, F.; Albert, C.H.; Thuiller, W. Selecting pseudo-absences for species distribution models: How, where and how many? Methods Ecol. Evol. 2012, 3, 327–338. [Google Scholar] [CrossRef]
- Main-Knorn, M.; Pflug, B.; Louis, J.; Debaecker, V.; Müller-Wilm, U.; Gascon, F. Sen2Cor for Sentinel-2. In Image and Signal Processing for Remote Sensing XXIII; SPIE Remote Sensing: Warsaw, Poland, 2017; p. 10427. [Google Scholar]
- Lanaras, C.; Bioucas-Dias, J.; Galliani, S.; Baltsavias, E.; Schindler, K. Super-resolution of Sentinel-2 images: Learning a globally applicable deep neural network. ISPRS J. Photogramm. Remote Sens. 2018, 146, 305–319. [Google Scholar] [CrossRef] [Green Version]
- Henrich, V.; Jung, A.; Götze, C.; Sandow, C.; Thürkow, D.; Gläßer, C. Development of an Online Indices Database: Motivation, Concept and Implementation. In Proceedings of the 6th EARSeL Imaging Spectroscopy SIG Workshop Innovative Tool for Scientific and Commercial Environment Applications, Tel Aviv, Israe, 16–19 March 2009; pp. 16–18. [Google Scholar]
- Wilfong, B.N.; Gorchov, D.L.; Henry, M.C. Detecting an Invasive Shrub in Deciduous Forest Understories using Remote Sensing. Weed Sci. 2009, 57, 512–520. [Google Scholar] [CrossRef]
- Savage, S.L.; Lawrence, R.L. Vegetation Dynamics in Yellowstone’s Northern Range: 1985 to 1999. Photogramm. Eng. Remote Sens. 2010, 76, 547–556. [Google Scholar] [CrossRef]
- Underwood, E. Mapping nonnative plants using hyperspectral imagery. Remote Sens. Environ. 2003, 86, 150–161. [Google Scholar] [CrossRef]
- Ai, J.; Gao, W.; Shi, R.; Zhang, C.; Sun, Z.; Chen, W.; Liu, C.; Zeng, Y. In Situ Hyperspectral Data Analysis for Canopy Chlorophyll Content Estimation of an Invasive Species Spartina Alterniflora based on PROSAIL Canopy Radiative Transfer Model. In Remote Sensing and Modeling of Ecosystems for Sustainability XII; SPIE Optical Engineering: San Diego, CA, USA, 2015; Volume 9610, p. 961007. [Google Scholar]
- Main, R.; Cho, M.A.; Mathieu, R.; O’Kennedy, M.M.; Ramoelo, A.; Koch, S. An investigation into robust spectral indices for leaf chlorophyll estimation. ISPRS J. Photogramm. Remote Sens. 2011, 66, 751–761. [Google Scholar] [CrossRef]
- Qi, J.; Chehbouni, A.; Huete, A.R.; Kerr, Y.H.; Sorooshian, S. A modified soil adjusted vegetation index. Remote Sens. Environ. 1994, 48, 119–126. [Google Scholar] [CrossRef]
- Masemola, C.; Cho, M.A.; Ramoelo, A. Towards a semi-automated mapping of Australia native invasive alien Acacia trees using Sentinel-2 and radiative transfer models in South Africa. ISPRS J. Photogramm. Remote Sens. 2020, 166, 153–168. [Google Scholar] [CrossRef]
- Gómez, C.; White, J.C.; Wulder, M.A. Optical remotely sensed time series data for land cover classification: A review. ISPRS J. Photogramm. Remote Sens. 2016, 116, 55–72. [Google Scholar] [CrossRef] [Green Version]
- Liu, C.; Berry, P.M.; Dawson, T.P.; Pearson, R.G. Selecting thresholds of occurrence in the prediction of species distributions. Ecography 2005, 28, 385–393. [Google Scholar] [CrossRef]
- Gormley, A.M.; Forsyth, D.M.; Griffioen, P.; Lindeman, M.; Ramsey, D.S.; Scroggie, M.P.; Woodford, L. Using presence-only and presence-absence data to estimate the current and potential distributions of established invasive species. J. Appl. Ecol. 2011, 48, 25–34. [Google Scholar] [CrossRef] [Green Version]
- Allouche, O.; Tsoar, A.; Kadmon, R. Assessing the accuracy of species distribution models: Prevalence, kappa and the true skill statistic (TSS). J. Appl. Ecol. 2006, 43, 1223–1232. [Google Scholar] [CrossRef]
- Breiman, L. Random forests. Mach. Learn. 2001, 45, 5–32. [Google Scholar] [CrossRef] [Green Version]
- Kuhn, M.; Johnson, K. Applied Predictive Modeling; Springer: New York, NY, USA, 2013. [Google Scholar]
- Greenwell, B.M. pdp: An R package for constructing partial dependence plots. R J. 2017, 9, 421–436. [Google Scholar] [CrossRef] [Green Version]
- Bolch, E.A.; Santos, M.J.; Ade, C.; Khanna, S.; Basinger, N.T.; Reader, M.O.; Hestir, E.L. Remote Detection of Invasive Alien Species. In Remote Sensing of Plant Biodiversity; Springer International Publishing: Cham, Switzerland, 2020; pp. 267–307. [Google Scholar]
- Rocchini, D.; Andreo, V.; Förster, M.; Garzon-Lopez, C.X.; Gutierrez, A.P.; Gillespie, T.W.; Hauffe, H.C.; He, K.S.; Kleinschmit, B.; Mairota, P.; et al. Potential of remote sensing to predict species invasions: A modelling perspective. Prog. Phys. Geogr. 2015, 39, 283–309. [Google Scholar] [CrossRef] [Green Version]
- Rocchini, D.; Petras, V.; Petrasova, A.; Horning, N.; Furtkevicova, L.; Neteler, M.; Leutner, B.; Wegmann, M. Open data and open source for remote sensing training in ecology. Ecol. Inform. 2017, 40, 57–61. [Google Scholar] [CrossRef]
- Sulik, J.J.; Long, D.S. Spectral indices for yellow canola flowers. Int. J. Remote Sens. 2015, 36, 2751–2765. [Google Scholar] [CrossRef]
- Mahmud, M.R.; Numata, S.; Hosaka, T. Mapping an invasive goldenrod of Solidago altissima in urban landscape of Japan using multi-scale remote sensing and knowledge-based classification. Ecol. Indic. 2020, 111, 105975. [Google Scholar] [CrossRef]
- Misra, G.; Cawkwell, F.; Wingler, A. Status of Phenological Research Using Sentinel-2 Data: A Review. Remote Sens. 2020, 12, 2760. [Google Scholar] [CrossRef]
- Wang, B.; Jia, K.; Liang, S.; Xie, X.; Wei, X.; Zhao, X.; Yao, Y.; Zhang, X. Assessment of Sentinel-2 MSI Spectral Band Reflectances for Estimating Fractional Vegetation Cover. Remote Sens. 2018, 10, 1927. [Google Scholar] [CrossRef] [Green Version]
- Pino, J.; Font, X.; Carbó, J.; Jové, M.; Pallarès, L. Large-scale correlates of alien plant invasion in Catalonia (NE of Spain). Biol. Conserv. 2005, 122, 339–350. [Google Scholar] [CrossRef]
- Vicente, J.R.; Kueffer, C.; Richardson, D.M.; Vaz, A.S.; Cabral, J.A.; Hui, C.; Araujo, M.B.; Kuhn, I.; Kull, C.A.; Verburg, P.H.; et al. Different environmental drivers of alien tree invasion affect different life-stages and operate at different spatial scales. For. Ecol. Manag. 2019, 433, 263–275. [Google Scholar] [CrossRef]
- Proença, V.M.; Pereira, H.M.; Guilherme, J.; Vicente, L. Plant and bird diversity in natural forests and in native and exotic plantations in NW Portugal. Acta Oecol. 2010, 36, 219–226. [Google Scholar] [CrossRef]
- Becerra, P.I.; Catford, J.A.; Luce McLeod, M.; Andonian, K.; Aschehoug, E.T.; Montesinos, D.; Callaway, R.M. Inhibitory effects of Eucalyptus globulus on understorey plant growth and species richness are greater in non-native regions. Glob. Ecol. Biogeogr. 2018, 27, 68–76. [Google Scholar] [CrossRef]
- Hernández, L.; Fernández, J.M.; Cañellas, I.; de la Cueva, A.V. Assessing spatio-temporal rates, patterns and determinants of biological invasions in forest ecosystems. The case of Acacia species in NW Spain. For. Ecol. Manag. 2014, 329, 206–213. [Google Scholar] [CrossRef] [Green Version]
- Lorenzo, P.; González, L.; Reigosa, M.J. The genus Acacia as invader: The characteristic case of Acacia dealbata Link in Europe. Ann. For. Sci. 2010, 67, 101. [Google Scholar] [CrossRef] [Green Version]
- Sebert-Cuvillier, E.; Simon-Goyheneche, V.; Paccaut, F.; Chabrerie, O.; Goubet, O.; Decocq, G. Spatial spread of an alien tree species in a heterogeneous forest landscape: A spatially realistic simulation model. Landsc. Ecol. 2008, 23, 787–801. [Google Scholar] [CrossRef]
- With, K.A. The Landscape Ecology of Invasive Spread. Conserv. Biol. 2002, 16, 1192–1203. [Google Scholar] [CrossRef] [Green Version]
- Guillerme, S.; Barcet, H.; de Munnik, N.; Maire, E.; Marais-Sicre, C. Evolution of traditional agroforestry landscapes and development of invasive species: Lessons from the Pyrenees (France). Sustain. Sci. 2020, 15, 1285–1299. [Google Scholar] [CrossRef]
- Alston, K.P.; Richardson, D.M. The roles of habitat features, disturbance, and distance from putative source populations in structuring alien plant invasions at the urban/wildland interface on the Cape Peninsula, South Africa. Biol. Conserv. 2006, 132, 183–198. [Google Scholar] [CrossRef]
- Marchante, H.; Marchante, E.; Freitas, H.; Hoffmann, J.H. Temporal changes in the impacts on plant communities of an invasive alien tree, Acacia longifolia. Plant Ecol. 2015, 216, 1481–1498. [Google Scholar] [CrossRef]
- Castro-Díez, P.; Alonso, Á.; Saldaña-López, A.; Granda, E. Effects of widespread non-native trees on regulating ecosystem services. Sci. Total Environ. 2021, 778, 146141. [Google Scholar] [CrossRef]
- Moore, J.C. Predicting tipping points in complex environmental systems. Proc. Natl. Acad. Sci. USA 2018, 115, 635–636. [Google Scholar] [CrossRef] [PubMed] [Green Version]
- Heringer, G.; Thiele, J.; do Amaral, C.H.; Meira-Neto, J.A.A.; Matos, F.A.R.; Lehmann, J.R.K.; Buttschardt, T.K.; Neri, A.V. Acacia invasion is facilitated by landscape permeability: The role of habitat degradation and road networks. Appl. Veg. Sci. 2020, 23, 598–609. [Google Scholar] [CrossRef]
- Sánchez-Ortiz, K.; Taylor, K.J.; De Palma, A.; Essl, F.; Dawson, W.; Kreft, H.; Pergl, J.; Pysek, P.; Kleunen, M.V.; Weigelt, P.; et al. Effects of land-use change and related pressures on alien and native subsets of island communities. PLoS ONE 2020, 15, e0227169. [Google Scholar] [CrossRef] [PubMed]
- Brito, L.M.; Reis, M.; Mourão, I.; Coutinho, J. Use of Acacia Waste Compost as an Alternative Component for Horticultural Substrates. Commun. Soil Sci. Plant Anal. 2015, 46, 1814–1826. [Google Scholar] [CrossRef]
- Nunes, L.J.R.; Raposo, M.A.M.; Meireles, C.I.R.; Gomes, C.J.P.; Ribeiro, N.M.C.A. Control of Invasive Forest Species through the Creation of a Value Chain: Acacia dealbata Biomass Recovery. Environments 2020, 7, 39. [Google Scholar] [CrossRef]
- Barnes, M.A.; Deines, A.M.; Gentile, R.M.; Grieneisen, L.E. Adapting to Invasions in a Changing World: Invasive Species as an Economic Resource. In Invasive Species and Global Climate Change; CAB International: Wallingford, UK, 2014; pp. 326–344. [Google Scholar]
- Nuñez, M.A.; Kuebbing, S.; Dimarco, R.D.; Simberloff, D. Invasive Species: To eat or not to eat, that is the question. Conserv. Lett. 2012, 5, 334–341. [Google Scholar] [CrossRef]
- Guisan, A.; Broennimann, O.; Engler, R.; Vust, M.; Yoccoz, N.G.; Lehmann, A.; Zimmermann, N.E. Using Niche-Based Models to Improve the Sampling of Rare Species. Conserv. Biol. 2006, 20, 501–511. [Google Scholar] [CrossRef]


| Index | Explanation | Specific Formula |
|---|---|---|
| NDVI | Enhances vegetation differences photosynthetically [46] | |
| EVI | Distinguish differences in the canopy structure, architecture, and physiognomy [47,48] | |
| MCARI | A measure of the leaf chlorophyll content enhancing vegetation differences [49] | |
| MTCI | Enhances vegetation senescence and water/nutritional stress [50] | |
| MSAVI 2 | Retrieves information about vegetation dynamics and reduced the soil background variations [51] | |
| LAI | Measure for the total area of leaves per unit ground area [52] | S2 SNAP Toolbox biophysical processor. |
| Environmental Factors | Driver Description | Acronym |
|---|---|---|
| (Bio)Climate | Annual Mean Temperature | CL_BIO01 |
| Mean Diurnal Range | CL_BIO02 | |
| Isothermality | CL_BIO03 | |
| Temperature Seasonality | CL_BIO04 | |
| Maximum Temperature of Warmest Month | CL_BIO05 | |
| Minimum Temperature of Coldest Month | CL_BIO06 | |
| Temperature Annual Range | CL_BIO07 | |
| Mean Temperature of Wettest Quarter | CL_BIO08 | |
| Mean Temperature of Driest Quarter | CL_BIO09 | |
| Mean Temperature of Warmest Quarter | CL_BIO10 | |
| Mean Temperature of Coldest Quarter | CL_BIO11 | |
| Annual Precipitation | CL_BIO12 | |
| Precipitation of Wettest Month | CL_BIO13 | |
| Precipitation of Driest Month | CL_BIO14 | |
| Precipitation Seasonality | CL_BIO15 | |
| Precipitation of Wettest Quarter | CL_BIO16 | |
| Precipitation of Driest Quarter | CL_BIO17 | |
| Precipitation of Warmest Quarter | CL_BIO18 | |
| Precipitation of Coldest Quarter | CL_BIO19 | |
| Disturbance | Total Burnt Area (last 10 years) | DT_BA10YR |
| Total Burnt Area (last 20 years) | DT_BA20YR | |
| Total Burnt Area (last 5 years) | DT_BA5YR | |
| Land use | Percent of permanent crops | LU_PCPCO |
| Percent of annual crops | LU_PCACO | |
| Percent of permanent and annual crops | LU_PCPAC | |
| Percent of native forests | LU_PCNFO | |
| Percent of eucalyptus (production) forest | LU_PCEFO | |
| Percent of maritime-pine (production) forest | LU_PCPFO | |
| Percent of shrublands | LU_PCSHL | |
| Percent of complex agroforestry mosaics | LU_PCAFM | |
| Percent of other production forests | LU_PCOPF | |
| Percent of pasturelands | LU_PCPAS | |
| Percent of wetlands | LU_PCWET | |
| Percent of beaches and sand dunes | LU_PCBSD | |
| Percent of roads and rails | LU_PCRRL | |
| Percent of bare rock surfaces | LU_PCBRS | |
| Percent of water surfaces | LU_PCWTS | |
| Percent of artificial/urban areas | LU_PCART | |
| Percent of sparsely vegetated areas | LU_PCSPV | |
| Landscape pattern/configuration and heterogeneity | Landscape Mean Patch Area | LP_MNPAR |
| Landscape Patch Area Coefficient of variation | LP_PACOV | |
| Landscape Largest Patch Index | LP_LAPAI | |
| Landscape Shannon Diversity | LP_SHDVI | |
| Landscape Simpson Diversity | LP_SPDVI | |
| Landscape Patch Area Standard-deviation | LP_PASTD | |
| Linear elements | Landscape edge density | LE_EDGDN |
| Total length of rivers | LE_TLRIV | |
| Total length of all road types | LE_TLROD | |
| Total length of motorways | LE_TLMTW | |
| Soil properties | Available water content | SO_AVWTC |
| Bulk Density | SO_BULKD | |
| Percent of clay in soils | SO_PCLAY | |
| Percent of coarse elements in soils | SO_PCOAR | |
| Percent of sand in soils | SO_PSAND | |
| Percent of silt in soils | SO_PSILT | |
| Topography/Geomorphology | Slope (%) | TG_SLOPE |
| Average Solar Radiation | TG_RADAV | |
| Topographic Ruggedness Index | TG_TORGI | |
| Topographic Wetness Index | TG_TOWTI |
| TSS | ROC | KAPPA | ||||
|---|---|---|---|---|---|---|
| Classification Algorithm | Average | Standard Deviation | Average | Standard Deviation | Average | Standard Deviation |
| GBM | 0.799 | 0.042 | 0.953 | 0.014 | 0.796 | 0.042 |
| RF | 0.824 | 0.043 | 0.962 | 0.012 | 0.823 | 0.043 |
| CTA | 0.715 | 0.045 | 0.886 | 0.027 | 0.715 | 0.045 |
| GLM | 0.789 | 0.068 | 0.928 | 0.051 | 0.800 | 0.069 |
| FDA | 0.827 | 0.030 | 0.964 | 0.009 | 0.831 | 0.030 |
| ANN | 0.640 | 0.057 | 0.859 | 0.033 | 0.646 | 0.057 |
| MAX | 0.726 | 0.045 | 0.890 | 0.025 | 0.731 | 0.045 |
| GAM | 0.843 | 0.031 | 0.965 | 0.011 | 0.846 | 0.030 |
| Evaluation Metric | Evaluation Metric Value (Test) | Cutoff Threshold | Sensitivity | Specificity |
|---|---|---|---|---|
| TSS | 0.895 | 539 | 96.0 | 93.4 |
| ROC | 0.988 | 544 | 96.0 | 93.5 |
| KAPPA | 0.857 | 724 | 88.7 | 96.7 |
Publisher’s Note: MDPI stays neutral with regard to jurisdictional claims in published maps and institutional affiliations. |
© 2021 by the authors. Licensee MDPI, Basel, Switzerland. This article is an open access article distributed under the terms and conditions of the Creative Commons Attribution (CC BY) license (https://creativecommons.org/licenses/by/4.0/).
Share and Cite
Mouta, N.; Silva, R.; Pais, S.; Alonso, J.M.; Gonçalves, J.F.; Honrado, J.; Vicente, J.R. ‘The Best of Two Worlds’—Combining Classifier Fusion and Ecological Models to Map and Explain Landscape Invasion by an Alien Shrub. Remote Sens. 2021, 13, 3287. https://doi.org/10.3390/rs13163287
Mouta N, Silva R, Pais S, Alonso JM, Gonçalves JF, Honrado J, Vicente JR. ‘The Best of Two Worlds’—Combining Classifier Fusion and Ecological Models to Map and Explain Landscape Invasion by an Alien Shrub. Remote Sensing. 2021; 13(16):3287. https://doi.org/10.3390/rs13163287
Chicago/Turabian StyleMouta, Nuno, Renato Silva, Silvana Pais, Joaquim M. Alonso, João F. Gonçalves, João Honrado, and Joana R. Vicente. 2021. "‘The Best of Two Worlds’—Combining Classifier Fusion and Ecological Models to Map and Explain Landscape Invasion by an Alien Shrub" Remote Sensing 13, no. 16: 3287. https://doi.org/10.3390/rs13163287
APA StyleMouta, N., Silva, R., Pais, S., Alonso, J. M., Gonçalves, J. F., Honrado, J., & Vicente, J. R. (2021). ‘The Best of Two Worlds’—Combining Classifier Fusion and Ecological Models to Map and Explain Landscape Invasion by an Alien Shrub. Remote Sensing, 13(16), 3287. https://doi.org/10.3390/rs13163287