Article

Monitoring Tamarix Changes Using WorldView-2 Satellite Imagery in Grand Canyon National Park, Arizona

1
School of Informatics, Computing, and Cyber Systems, Northern Arizona University, 1295 Knowles Dr, Flagstaff, AZ 86011, USA
2
U.S. Geological Survey, Southwest Biological Sciences Center, Grand Canyon Monitoring and Research Center, 2255 N Gemini Dr, Flagstaff, AZ 86001, USA
3
Colorado Plateau Research Station, Northern Arizona University, 525 S. Beaver St., Flagstaff, AZ 86011, USA
4
Jamison Research, 277 ½ S. 300 E., Moab, UT 84532, USA
*
Author to whom correspondence should be addressed.
Remote Sens. 2021, 13(5), 958; https://doi.org/10.3390/rs13050958
Submission received: 20 January 2021 / Revised: 2 March 2021 / Accepted: 3 March 2021 / Published: 4 March 2021
(This article belongs to the Special Issue Remote Sensing of Invasive Species)

Abstract

:
Remote sensing methods are commonly used to monitor the invasive riparian shrub tamarisk (Tamarix spp.) and its response to the northern tamarisk beetle (D. carinulata), a specialized herbivore introduced as a biocontrol agent to control tamarisk in the Southwest USA in 2001. We use a Spectral Angle Mapper (SAM) supervised classification method with WorldView-2 (2 m spatial resolution) multispectral images from May and August of 2019 to map healthy tamarisk, canopy dieback, and defoliated tamarisk over a 48 km segment of the Colorado River in the topographically complex Grand Canyon National Park, where coarse-resolution satellite images are of limited use. The classifications in May and August produced overall accuracies of 80.0% and 83.1%, respectively. Seasonal change detection between May and August 2019 indicated that 47.5% of the healthy tamarisk detected in May 2019 had been defoliated by August 2019 within the WorldView-2 image extent. When compared to a previously published tamarisk map from 2009, derived from multispectral aerial imagery, we found that 29.5% of healthy tamarisk canopy declined between 2009 and 2019. This implies that tamarisk beetle impacts are continuing to accumulate even though land managers have noted the presence of the beetles in this reach of the river for 7 years since 2012.

Graphical Abstract

1. Introduction

Tamarisk (Tamarix spp.) is an invasive, Eurasian shrub that has substantially altered riparian ecosystems throughout the Southwestern United States. In the early 1820s, it was introduced to the United States for ornamental purposes [1,2] and four species (T. ramossisima, T. chinensis, T. parviflora, and T. aphylla) have since become invasive throughout arid Southwestern riparian riverbanks and floodplains [2]. Invasion of tamarisk has been aided by the initialization of regulated flow regimes and lowered abundance of native vegetation along floodplains due to dams built along riparian corridors throughout the western US [1].
Tamarisk can decrease groundwater supply [3] and alter hydrologic processes. Estimates produced nearly two decades ago indicated a potential cost of this in the Western US to be 1.4–3.0 billion m3 of water per year [4], although tamarisk has since been shown to have low to moderate rates of water use relative to native species depending on stand age, leaf area, density, and access to groundwater [3,5,6,7,8]. Tamarisk can procure groundwater and lower the water table via a deep tap root [3], transformation of soil chemistry via soil salinization and disruption of mycorrhiza mutualisms [9], and high rates of seed production [10]. Tamarisk also has physiological traits that allow it to thrive in disturbed environments [11]. Additionally, rapid hybridization of T. ramosissima and T. chinensis in the US has increased the genetic variability of this hybrid, potentially increasing fitness of it in US riparian corridors [12]. Tamarisk is abundant along the Colorado River [13,14,15,16], which provides water and hydroelectric power for millions of people in the western USA [17].
Various restoration efforts have been conducted [1] to control tamarisk, leading to the use of the tamarisk beetle (Diorhabda carinulata) as a biocontrol agent [2,18]. The tamarisk beetle was introduced in May, 2001 in Wyoming, Colorado, Utah, Nevada, California, and Texas [2,18]. The beetle defoliates tamarisk repeatedly throughout seasons and years, sometimes leading to the shrub’s mortality. The beetle is now found throughout much of the range of introduced tamarisk in the United States [19]. As the tamarisk beetle migrates to new regions throughout the southwestern US, it assimilates into arthropod food webs [20] and reduces tamarisk abundance. Tamarisk is the only successful plant host for tamarisk beetles in the Southwestern United States [2,21,22].
The first generation of larvae, typically occurring in April and May, has the smallest population, and a minimal impact on tamarisk [23], but defoliation is more prevalent in the months of July and August when larval numbers increase [24,25]. Repeated defoliation by the tamarisk beetle leads to varying levels of canopy dieback due to nutrient and energy depletion [26,27].
The tamarisk beetle has a notable impact on the surrounding ecological systems. Beetle defoliation decreases tamarisk evapotranspiration by 14–18% and this has a wider impact when measured at the river reach level [3,6,25]. Defoliation also reduces daily groundwater fluctuations by 25% [3,25,28]. Arthropod studies show that other, less consequential herbivores of tamarisk, such as the tamarisk leafhopper (Opsius stactogalus) decline upon the arrival of the tamarisk beetle [29]. Defoliation decreases habitat availability for herpetofauna [30] and nesting bird populations, including the endangered Southwestern Willow flycatcher (Empidonax traillii extimus) [31,32]. These issues have motivated scientists and land managers to study the relationship between tamarisk and the beetle, and to document occurrences of these species on a landscape scale. Using satellite remote sensing images, our objective was to map and estimate the impacts of the tamarisk beetle on tamarisk health and canopy dieback.
Remote sensing provides a means to study phenological patterns over large spatial and temporal scales. Along the Colorado River in Grand Canyon, the United States Geological Survey (USGS), National Park Service (NPS), Bureau of Reclamation (BOR), and others have been working to understand tamarisk population dynamics and phenology, especially in response to the beetle, and to map its distribution to guide tamarisk treatment efforts. Previous studies created tamarisk maps in Grand Canyon [14,16] using airborne data because spatially variable solar illumination and shadowing in the deep, dark, and winding canyon topography limits satellite data use including MODIS, Landsat, and Sentinel. The spatial resolution of those satellite sensors is not sufficient to resolve land cover types along the river channel at the bottom of the narrow canyon. In other river corridors throughout the southwestern US [33,34,35,36], tamarisk has been mapped using combinations of satellite sensors and seasonal variations in the spectral signature of tamarisk: images from summertime [14,16,33,37], end of growing season [35,36], or winter [34]. In Grand Canyon, high spatial resolution multispectral commercial satellite sensors such as the 2-m resolution WorldView suite may be useful, but have not been evaluated in the setting.
Defoliation and mortality from the tamarisk beetle produces a mosaic and a spectral mixture of multiple classes of tamarisk during the growing season, including green, healthy foliage, brown foliage, and bare branches resulting from either leaf drop or mortality. The mixing presents a challenge, but also a unique opportunity to classify these different stages of tamarisk in a single image. Previous studies have classified tamarisk defoliation or canopy dieback by detecting changes in Normalized Difference Vegetation Index (NDVI) [14,16,38,39] or Enhanced Vegetation Index (EVI) [6,40,41], or by detecting changes in supervised classifications [41]. However, we are aware of no studies that have taken advantage of supervised classification methods to discern these different stages of tamarisk within a single growing season.
Our study goal was to separately classify three varying stages of tamarisk: (1) healthy tamarisk, (2) canopy dieback, and (3) defoliated tamarisk using the WorldView-2 multispectral satellite sensor with 2 m spatial resolution between 18 May 2019 and 2 August 2019. We hypothesized that the Worldview-2 classification would accurately detect tamarisk distribution, canopy dieback, and defoliation and provide a valuable data source for continued tamarisk monitoring. Canopy dieback in our study is defined as repeated observation of no green foliage on tamarisk, where tamarisk canopy does not appear to recover to a healthy state between observation dates.

2. Materials and Methods

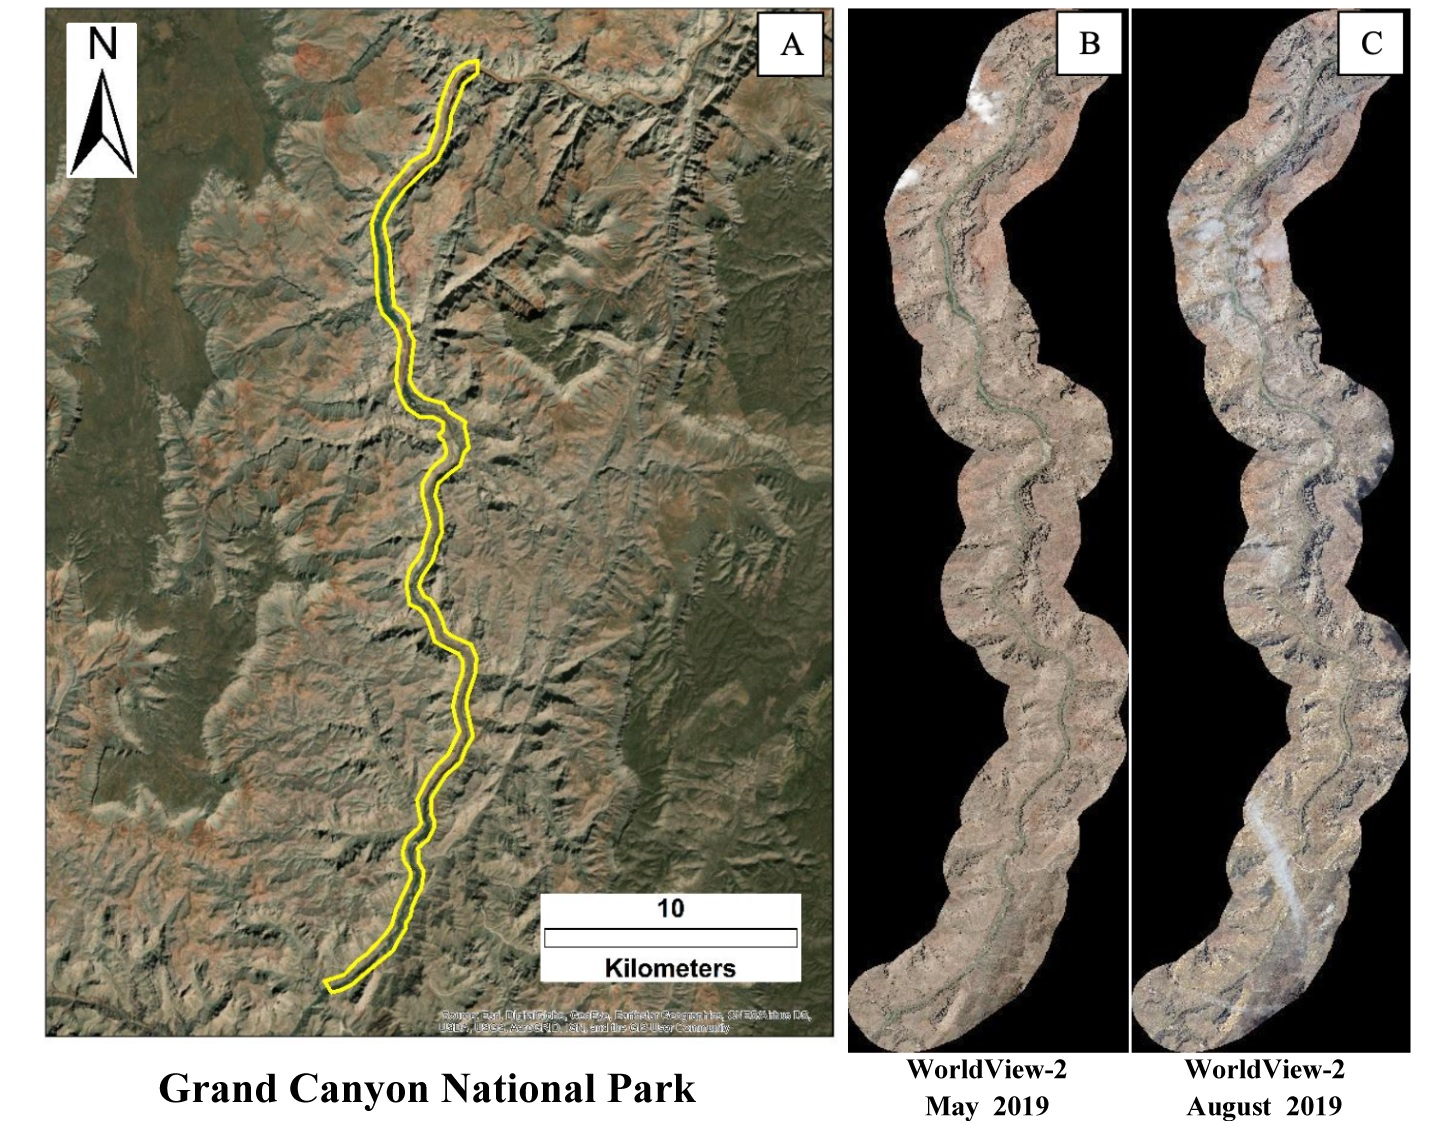
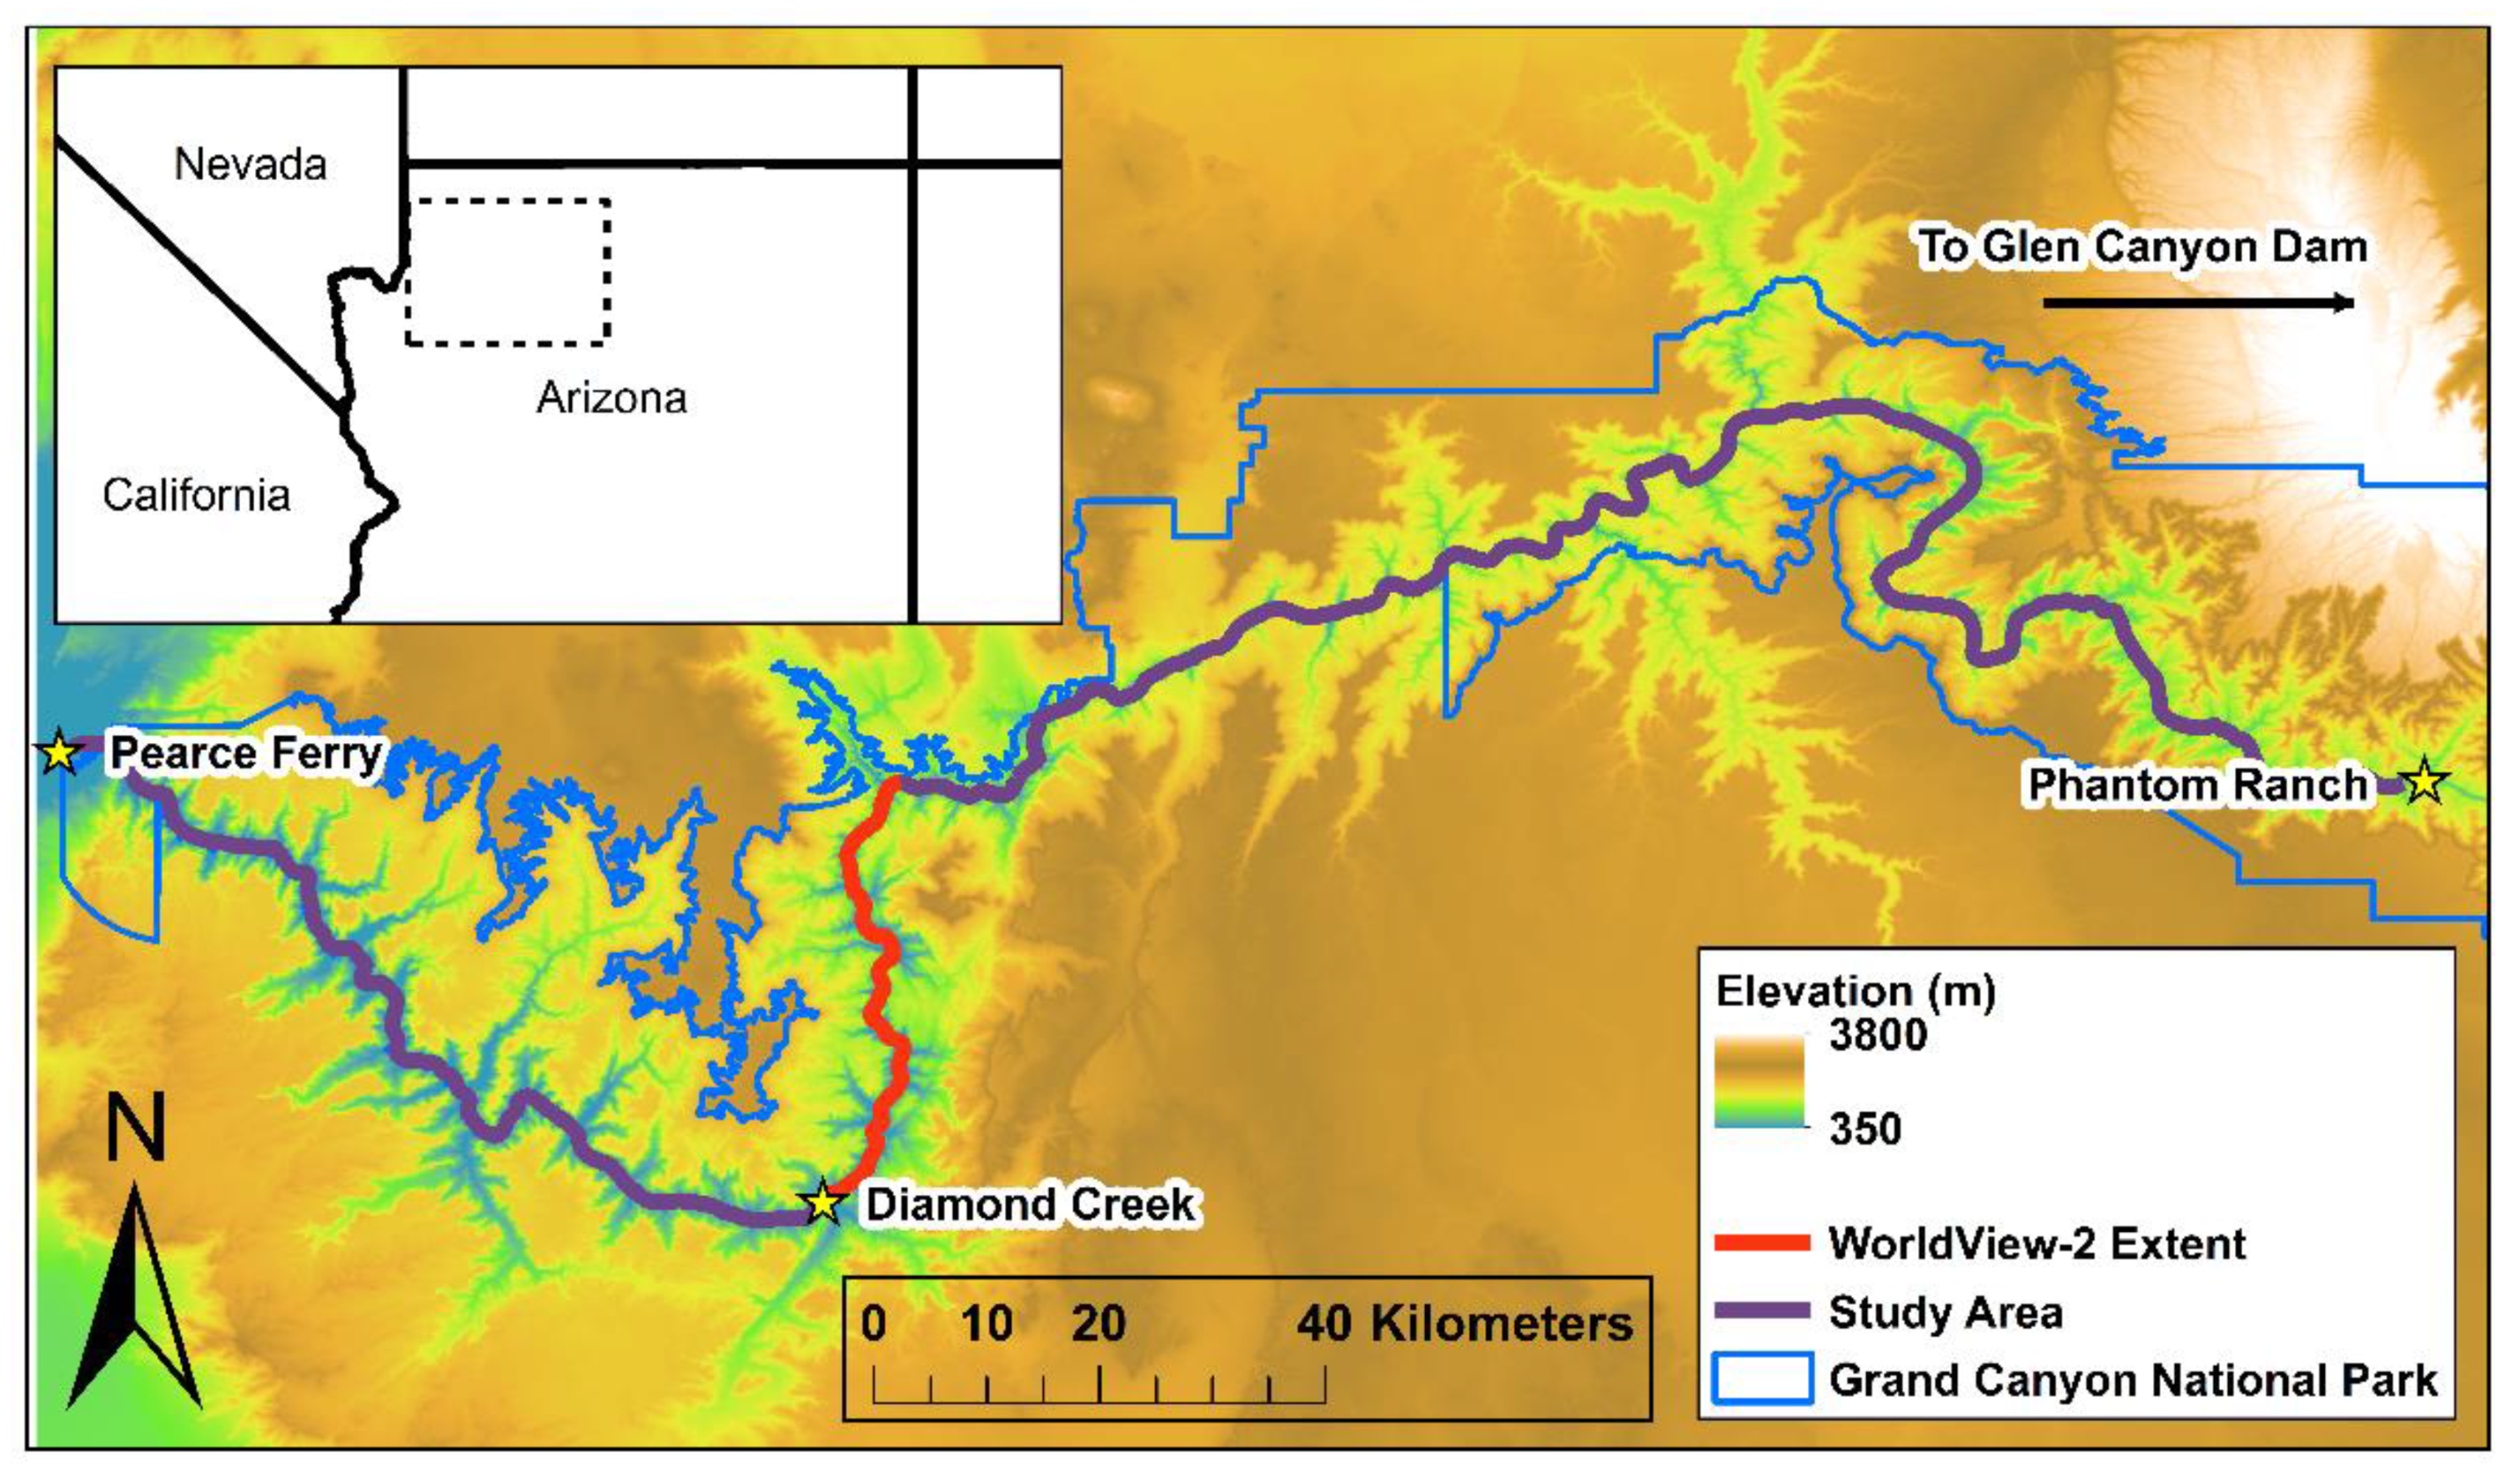
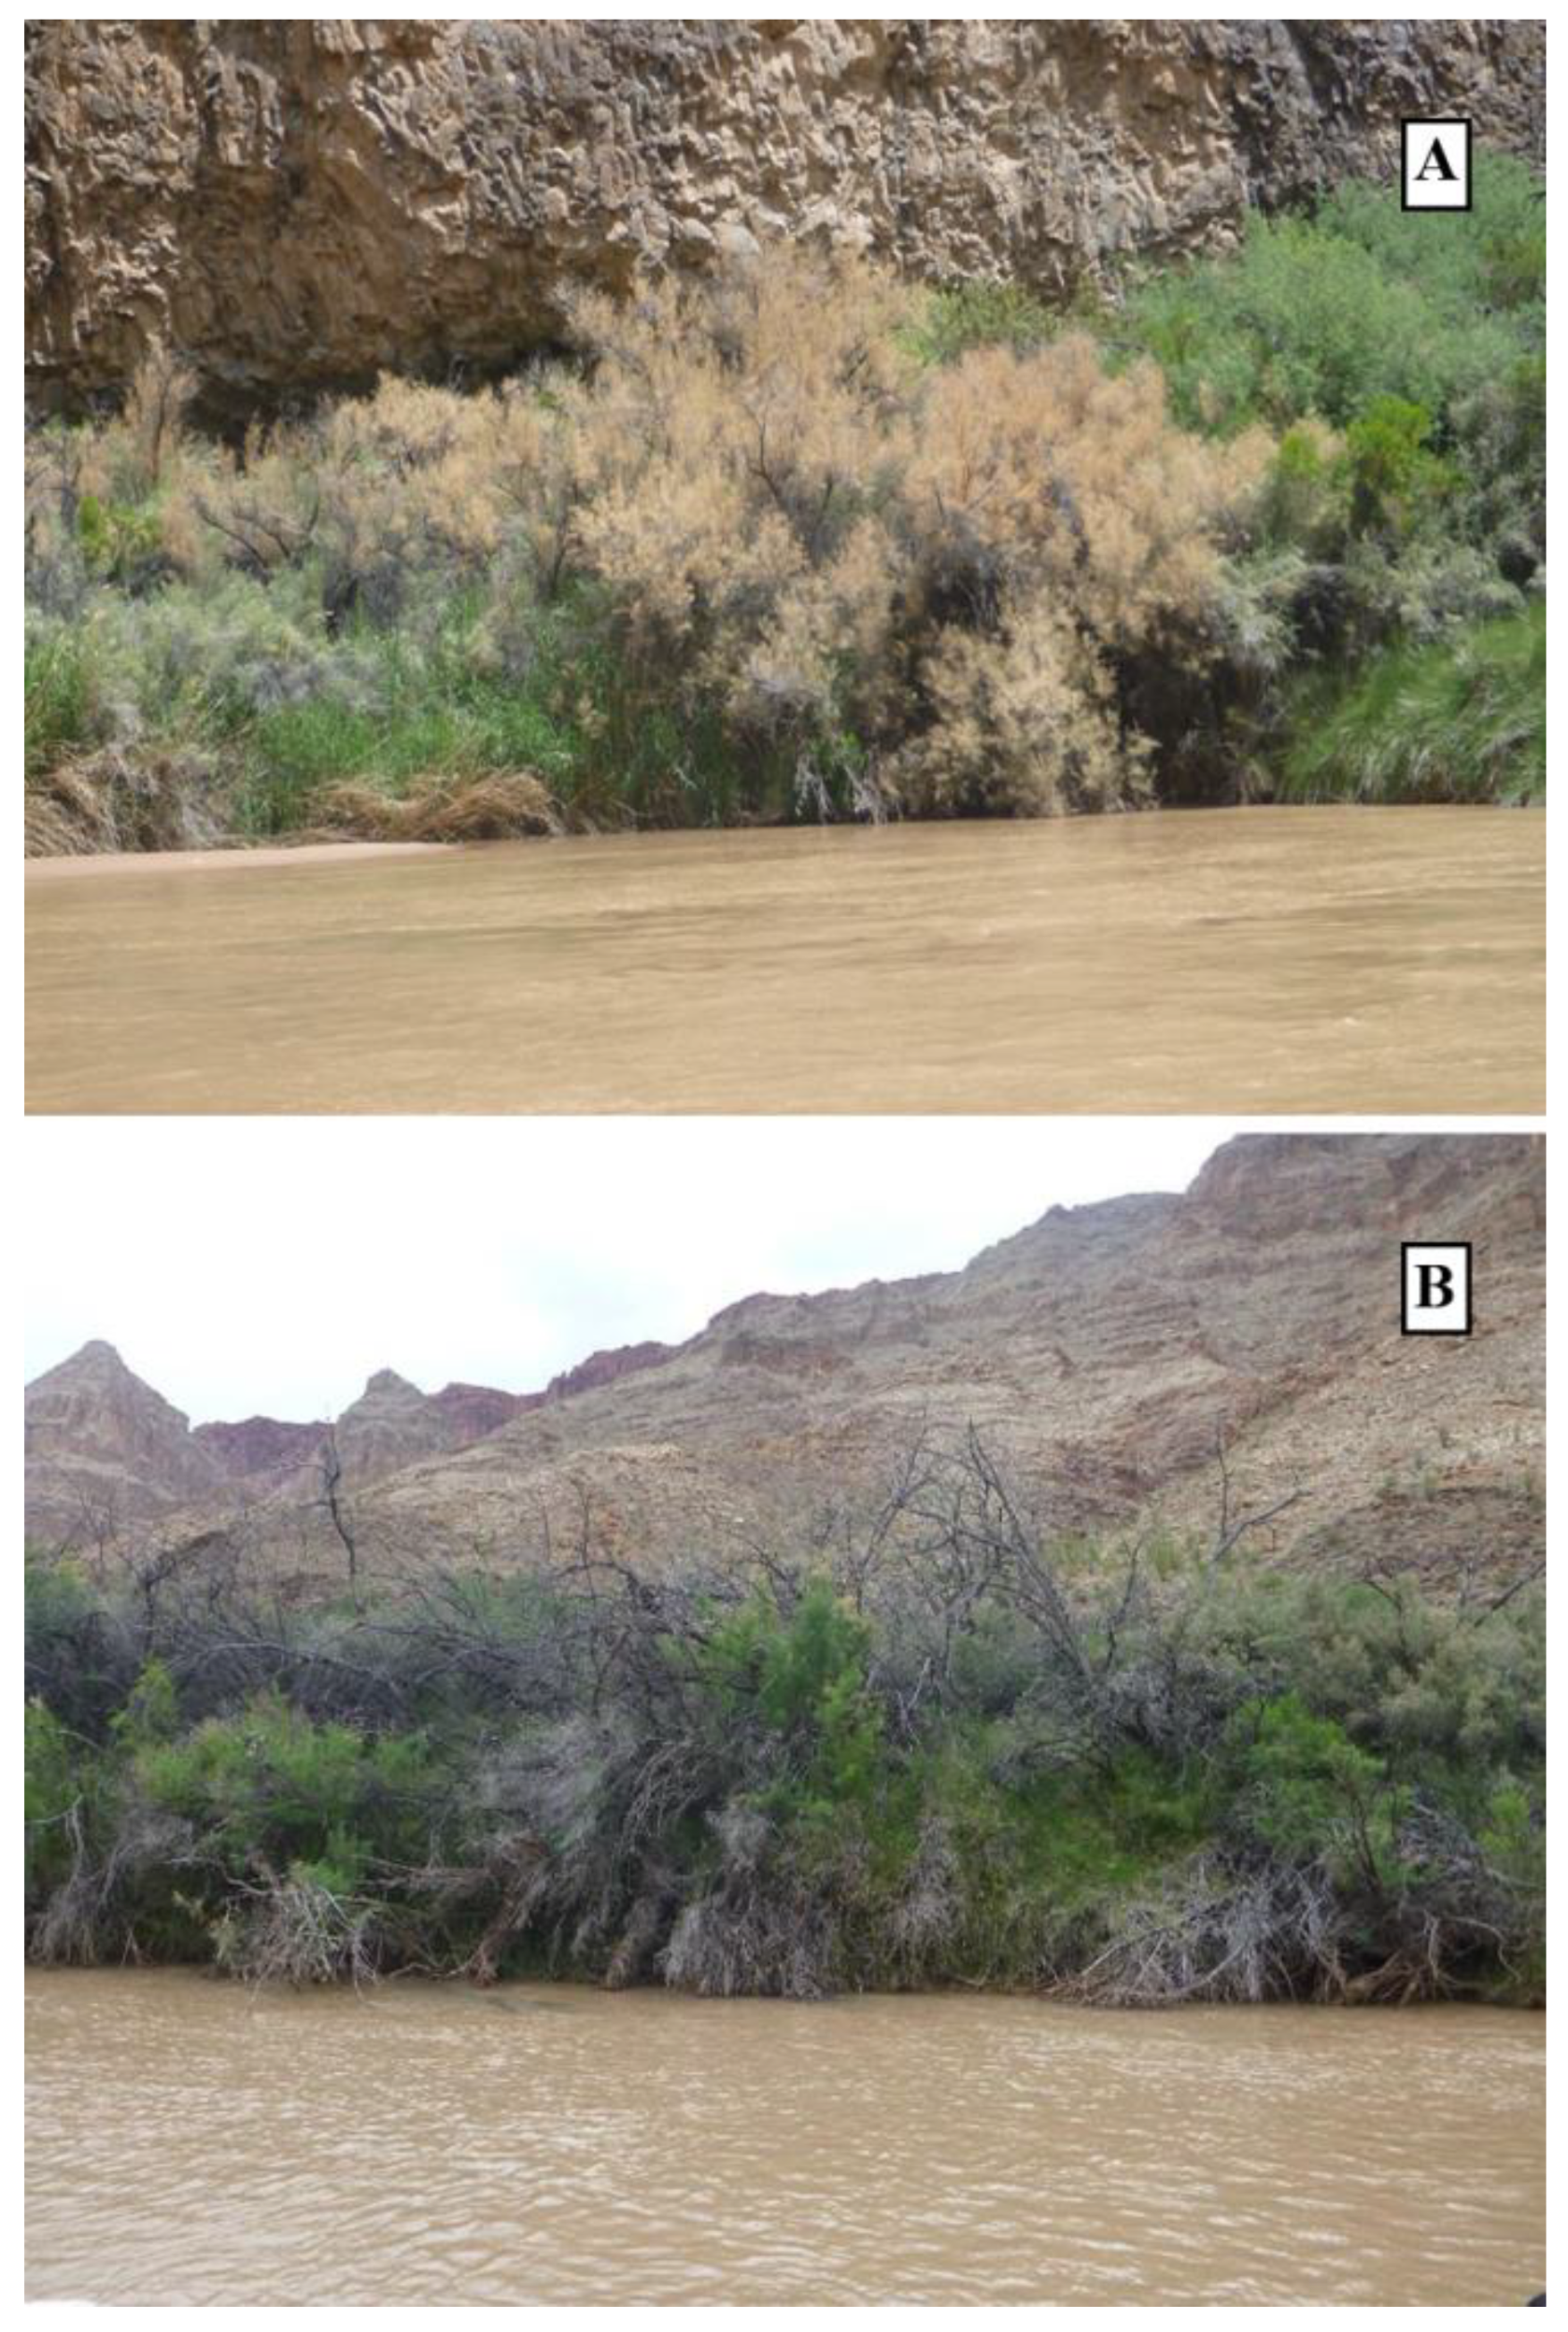
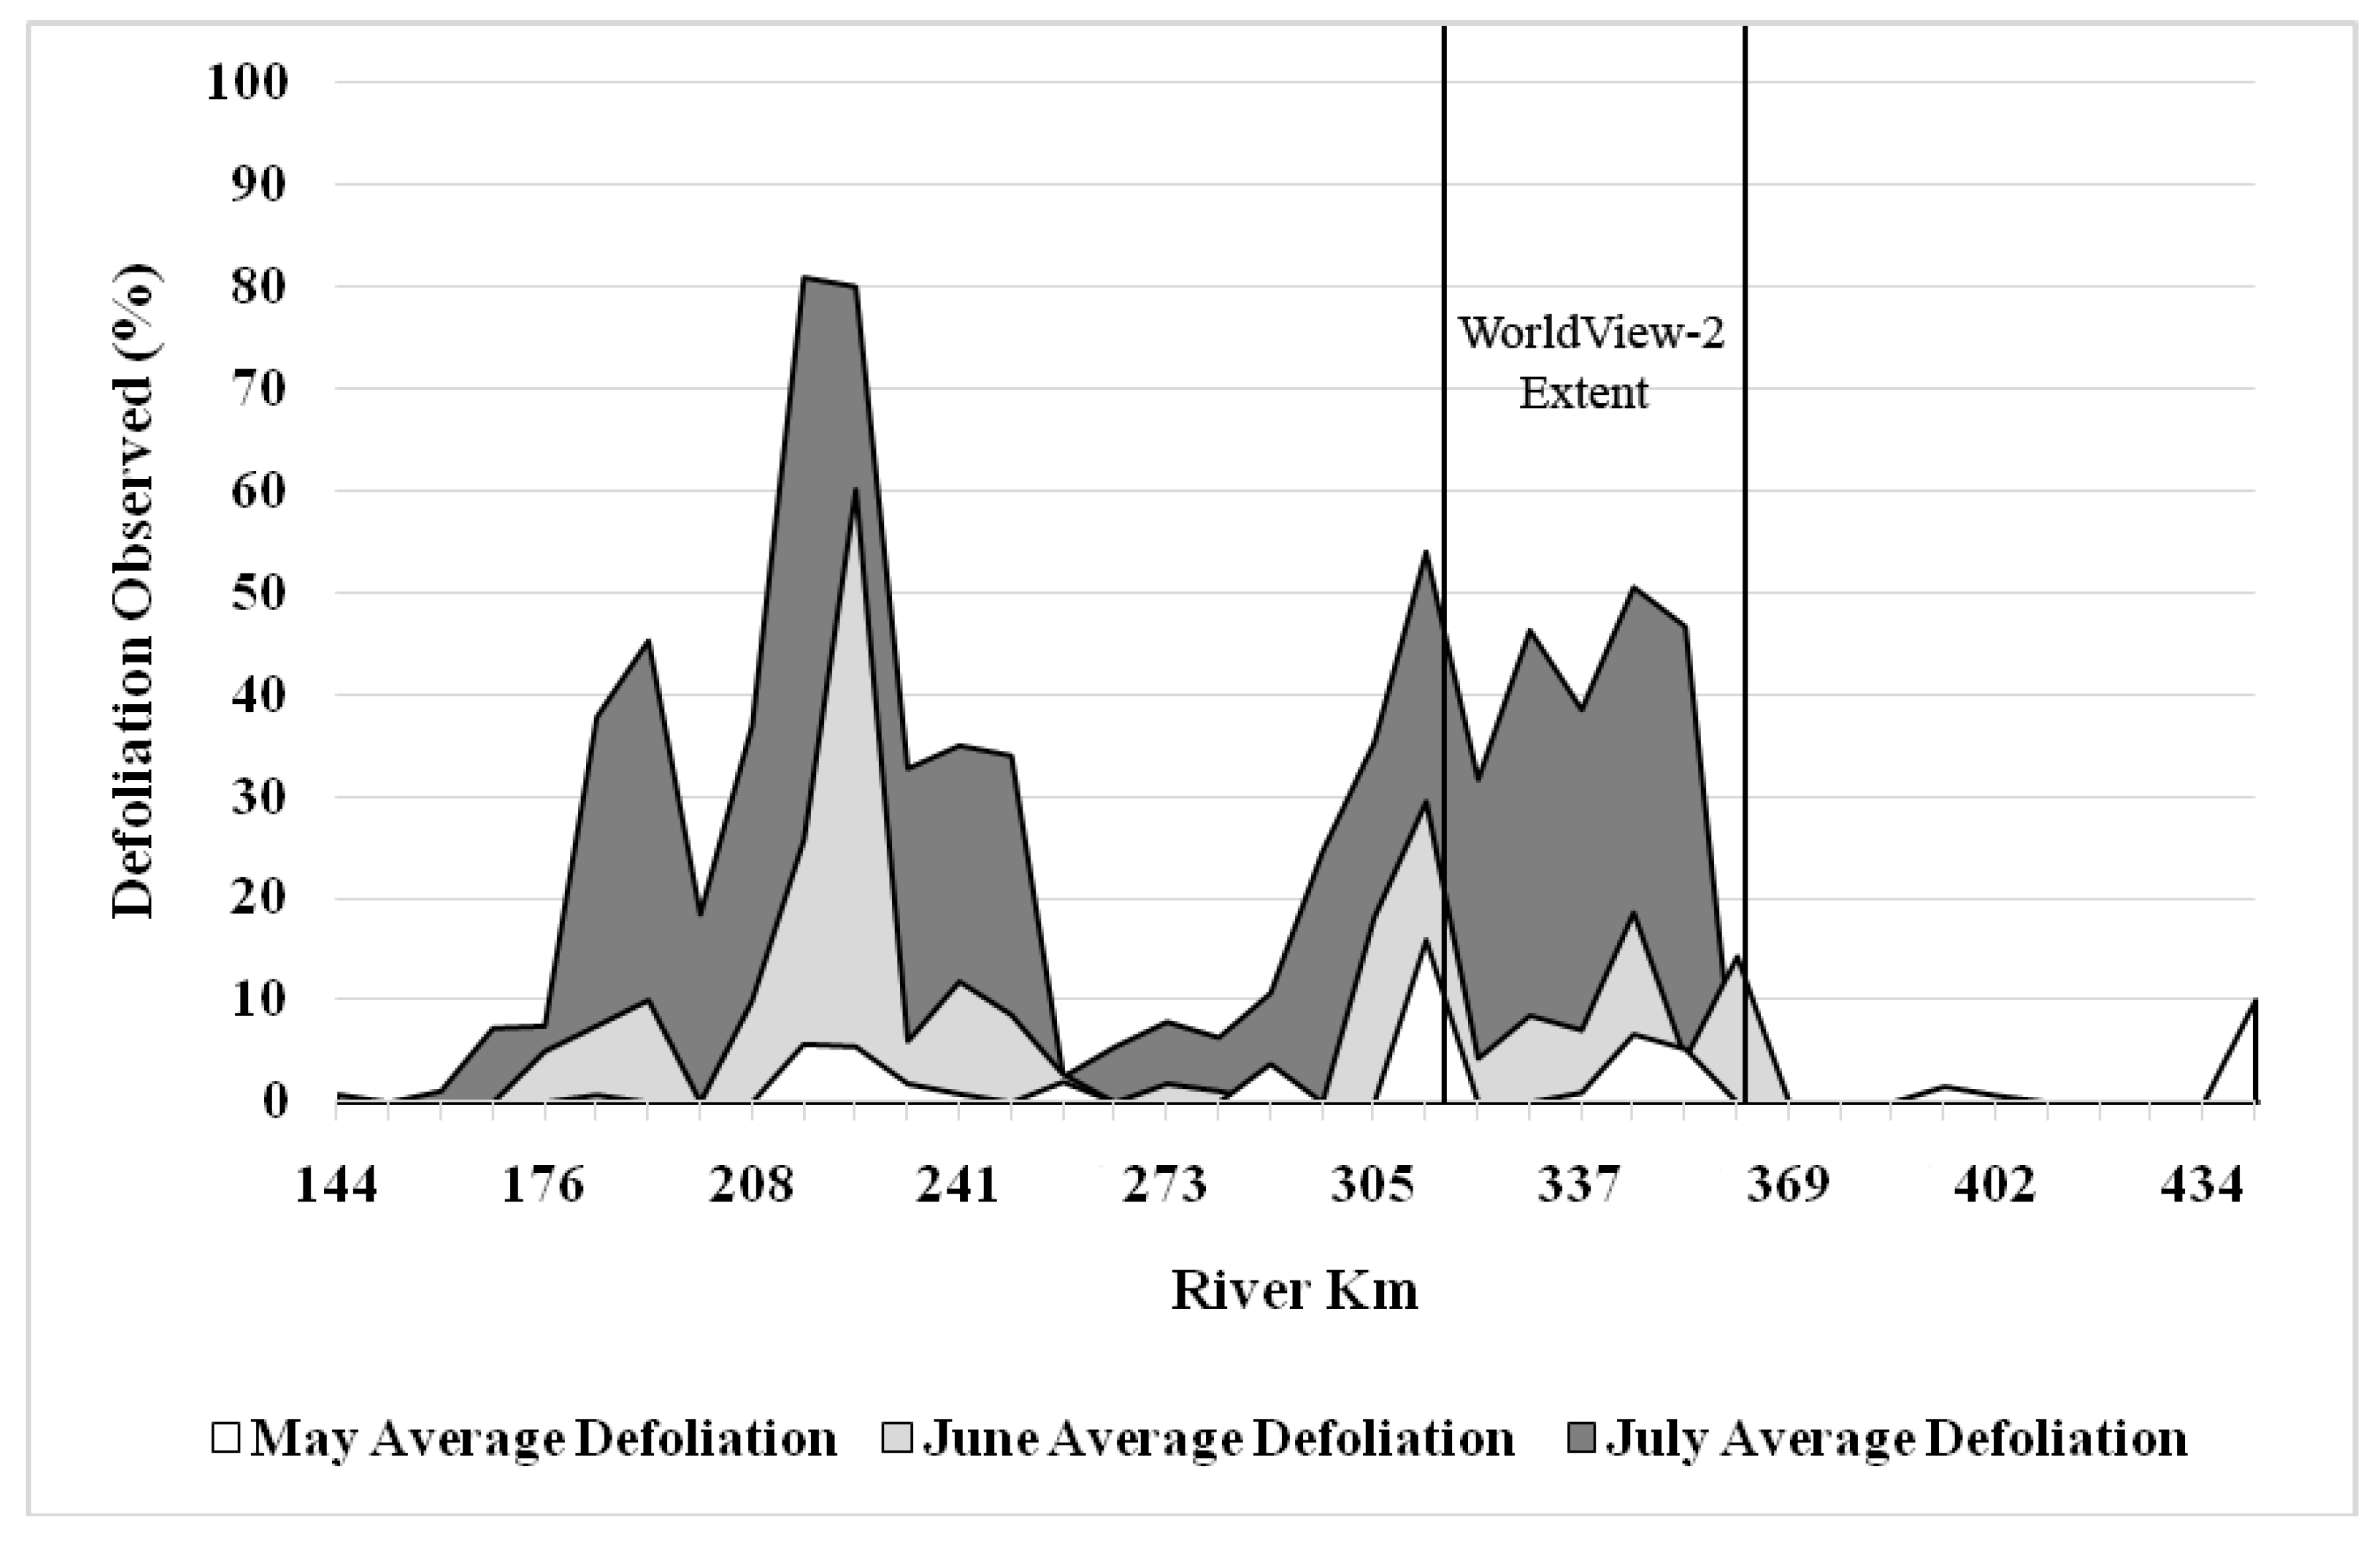
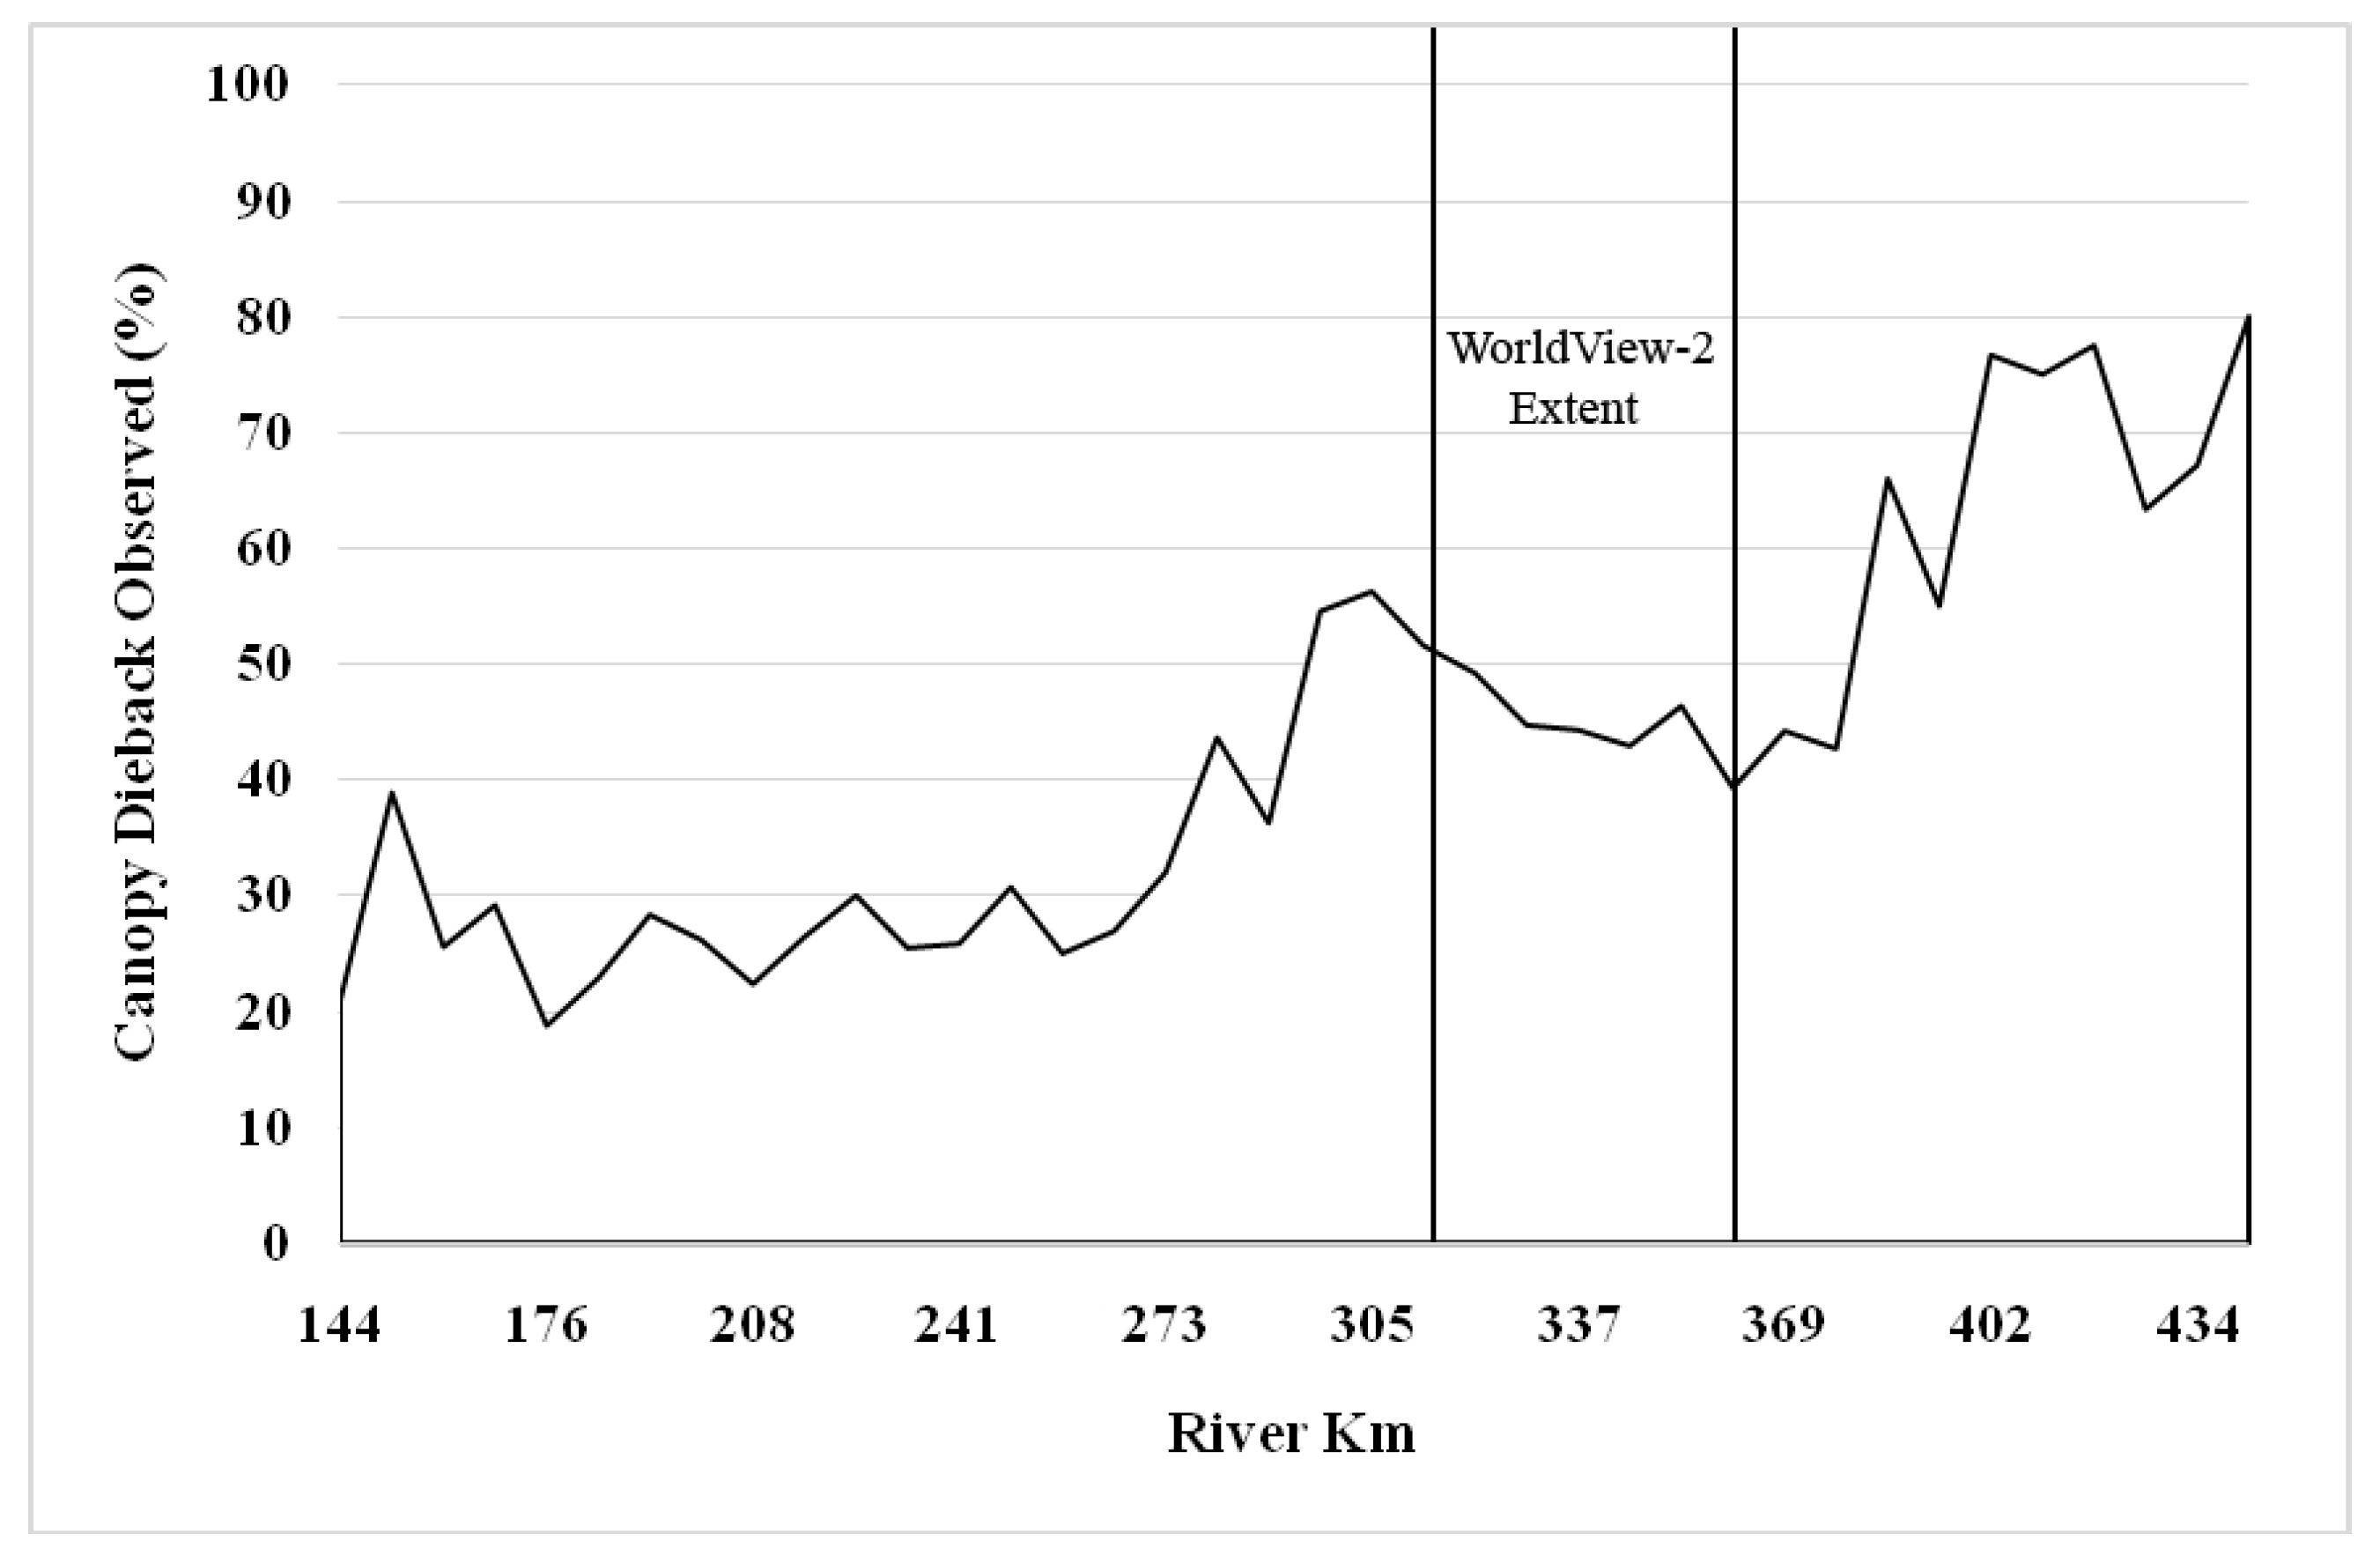
2.1. Field Observations

This study was conducted along a 48.5 km reach of the Colorado River within Grand Canyon National Park, Arizona, United States (Figure 1). While the tamarisk beetle first appeared in Grand Canyon in 2009, they were not detected in our study reach until 2012. Field data were collected repeatedly for this study during one trip taken down the river each month from 16 to 30 May, from 13 to 22 June, and from 8 to 17 July 2019. Observations were made about every 0.4 river km at tamarisk stands with total canopy area greater than approximately 16 m2.
Ground-based observations were made using methods of Jamison et al. [24]. At tamarisk stands or continuous clusters of tamarisk with total canopy area greater than 16 m2, canopy dieback was visually estimated in 10 percent increments (e.g., 0–10%, 10–20%, etc.) by comparing the proportion of dead branches to all branches. Once percent of dead branches was recorded, the proportion of live–but defoliated–branches to all living branches was estimated and recorded, in 10 percent increments as well. Defoliated tamarisk can be identified by brown leaves, or red stems, which would normally be covered in green foliage during the growing season from April through October. Dead branches can be further distinguished from defoliated branches based on their silver color (Figure 2), whereas defoliated stems after leaf drop are a reddish color [27].
Field-based spectral signatures were also collected using an ASD Fieldspec 3 (https://www.malvernpanalytical.com/en accessed on 10 May 2019) for tamarisk as well as riparian shrub species that commonly grow adjacent to tamarisk in Grand Canyon: seepwillow (Baccharis spp.), arrowweed (Pluchea sericea), acacia (Acacia greggii), and mesquite (Prosopis glandulosa). Field spectra of tamarisk were taken of pure green and healthy foliage, as well as varying levels of canopy dieback, including pure dead branches, and mixed healthy foliage and dead branches. Each spectrum was an average of 10 scans acquired at the canopy-level close to solar noon.

2.2. WorldView-2 Satellite Images and Analysis

WorldView-2 images were acquired for the reach of the river that extends from Parashant Creek at river km 315 to the Diamond Creek at river km 363 (Figure 1). River kilometers correspond to the river distance downstream the Colorado River from Lees Ferry, AZ, a standardized distance system used by researchers focused on the Grand Canyon (https://www.usgs.gov/centers/sbsc/gcmrc accessed on 10 May 2019). Worldview-2 is a commercial satellite that collects data in eight spectral bands. Two WorldView-2 images were used in this study: one image acquired 18 May 2019, and a second acquired 2 August 2019. The May 2019 image was acquired during the time ground-based observations were taken in that month. The August 2019 image was acquired 10 days after the last ground-based observations were taken in July, and corresponds with seasonal patterns of highest defoliation, which are expected to be similar to what was observed in July.
Image pixels were offset between the two 2019 WorldView-2 images. The May 2019 image was, therefore, coregistered to the August 2019 image and then both images were registered to the May 2013 USGS 20 cm resolution aerial imagery [42,43]. This coregistration allowed for direct comparison between the WorldView-2 images and USGS 20 cm imagery, which was used by Bedford et al. [13,14] to generate a 2013 tamarisk map of the Grand Canyon. The same area of small cloud was masked out from both images.
Both WorldView-2 images were classified using the Spectral Angle Mapper (SAM) supervised classification algorithm [44] to map three target classes: (1) healthy tamarisk, (2) canopy dieback, and (3) defoliated tamarisk. The classifications were trained using four canopy-level spectra from the ASD field spectra collected in May 2019: (1) healthy tamarisk leaf spectra, (2) canopy dieback spectra, (3) mixed healthy leaf and canopy dieback spectra, and (4) defoliated tamarisk spectra. A fifth image-derived training spectra for bare ground (N = 100 pixels) was used to accurately separate canopy dieback from bare ground, since it was found that these two endmembers have similar spectra. The original ASD spectra were collected in 1250 spectral bands from 350 to 2500 nm, which were subset to match the center of the wider bandwidths of the eight spectral bands in the WorldView-2 image (Figure 3).
Five training classes were classified using the five spectra described above (Table 1). Subsequently, the bare ground class was deleted, and the mixed healthy and dead branch and canopy dieback classes were combined into a single, canopy dieback class. Those post-processing steps produced a 3-class classification map, which we edited manually to omit extra canopy dieback that was misclassified as bare ground. Finally, a sieve operation was used to improve the final 3-class classification map by reducing spurious individual pixels within groupings of each class. The post-processing steps were performed because of the applied nature of the science, where our goal is to provide resource managers such as the National Park Service with maps that are as correct as possible without obvious misclassifications that can be fixed through these post-processing methods.
When using the ground-based observations from May to train the image classification for May 2019, we had multiple locations that could be used for the three target classes: (1) healthy tamarisk, (2) canopy dieback, and (3) defoliated tamarisk. However, when using the ground-based observations from August to train the August 2019 image classification, it was not possible to accurately discern defoliated tamarisk from tamarisk canopy dieback owing to pixels in which these endmembers were mixed. Therefore, the defoliated tamarisk and canopy dieback classes were combined into a single class for August to create a final classification map representing only two classes: (1) healthy tamarisk, and (2) “beetle-impacted” tamarisk.

2.3. Accuracy Assessment

To assess the accuracy of these maps, the ground-based observations were converted to a binary format based on thresholds described below for each of the SAM target classes. The SAM target classes for the May classification were healthy tamarisk, canopy dieback, and defoliated tamarisk. The SAM target classes for the August classification were healthy tamarisk and beetle-impacted tamarisk. For May, canopy dieback was defined as >50% dead branches, defoliation was defined as >50% defoliated branches, and healthy tamarisk was defined as >90% healthy tamarisk branches. For August, beetle-impacted tamarisk was defined as >50% defoliation, and healthy tamarisk was defined as >90% healthy tamarisk branches. Applying these parameters to the ground observation data, we identified 57 healthy tamarisk samples, 45 canopy dieback samples, and three defoliated tamarisk samples in May (Table 2), and 17 healthy tamarisk samples and 48 beetle-impacted tamarisk samples in August (Table 3).

2.4. Change Detection

We then detected changes between the two classification maps to determine where healthy tamarisk changed to the beetle-impacted tamarisk class between May and August of 2019. We also compared our data to that of Bedford et al. [13,14]. Using airborne data, Bedford et al. [13,14] created a 2009 healthy tamarisk map and a 2013 beetle-impacted map of our study area. The 2009 healthy tamarisk map was generated before tamarisk beetle activity in Grand Canyon, while the 2013 beetle-impacted map was the result of a change detection between May 2009 and May 2013 [13,14]. Both aerial images were from late May, so the 2013 aerial image could have contained canopy dieback and some seasonal defoliation. We compared the 2009 healthy tamarisk map and the 2013 beetle-impacted map with our May, 2019 WorldView-2 map to determine: (1) how much tamarisk mapped in 2009 has died back, and (2) how spatial patterns and distribution of canopy dieback have changed since 2013. The overall accuracy in the 2009 map [13,14] ranged from 70% to 79% in the three map quads that overlap our WorldView-2 images.
The May, 2019 WorldView-2 classification map was clipped to the Bedford et al. [13,14] extent of tamarisk to ensure that the spatial extent of comparison was the same between the datasets. The Bedford et al. [13,14] maps were resampled to match the spatial resolution of the WorldView-2 classification map, and changes were detected between the compared images. Tamarisk pixels that changed from healthy in 2009 or 2013 to dead branches in 2019 were identified as tamarisk canopy dieback between these years. Pixels that changed from beetle-impacted tamarisk to healthy tamarisk between 2013 and 2019 were identified as having recovered between these years, either from a state of canopy dieback or seasonal defoliation in 2013. The area without change was also reported for each of these two change detections.

3. Results

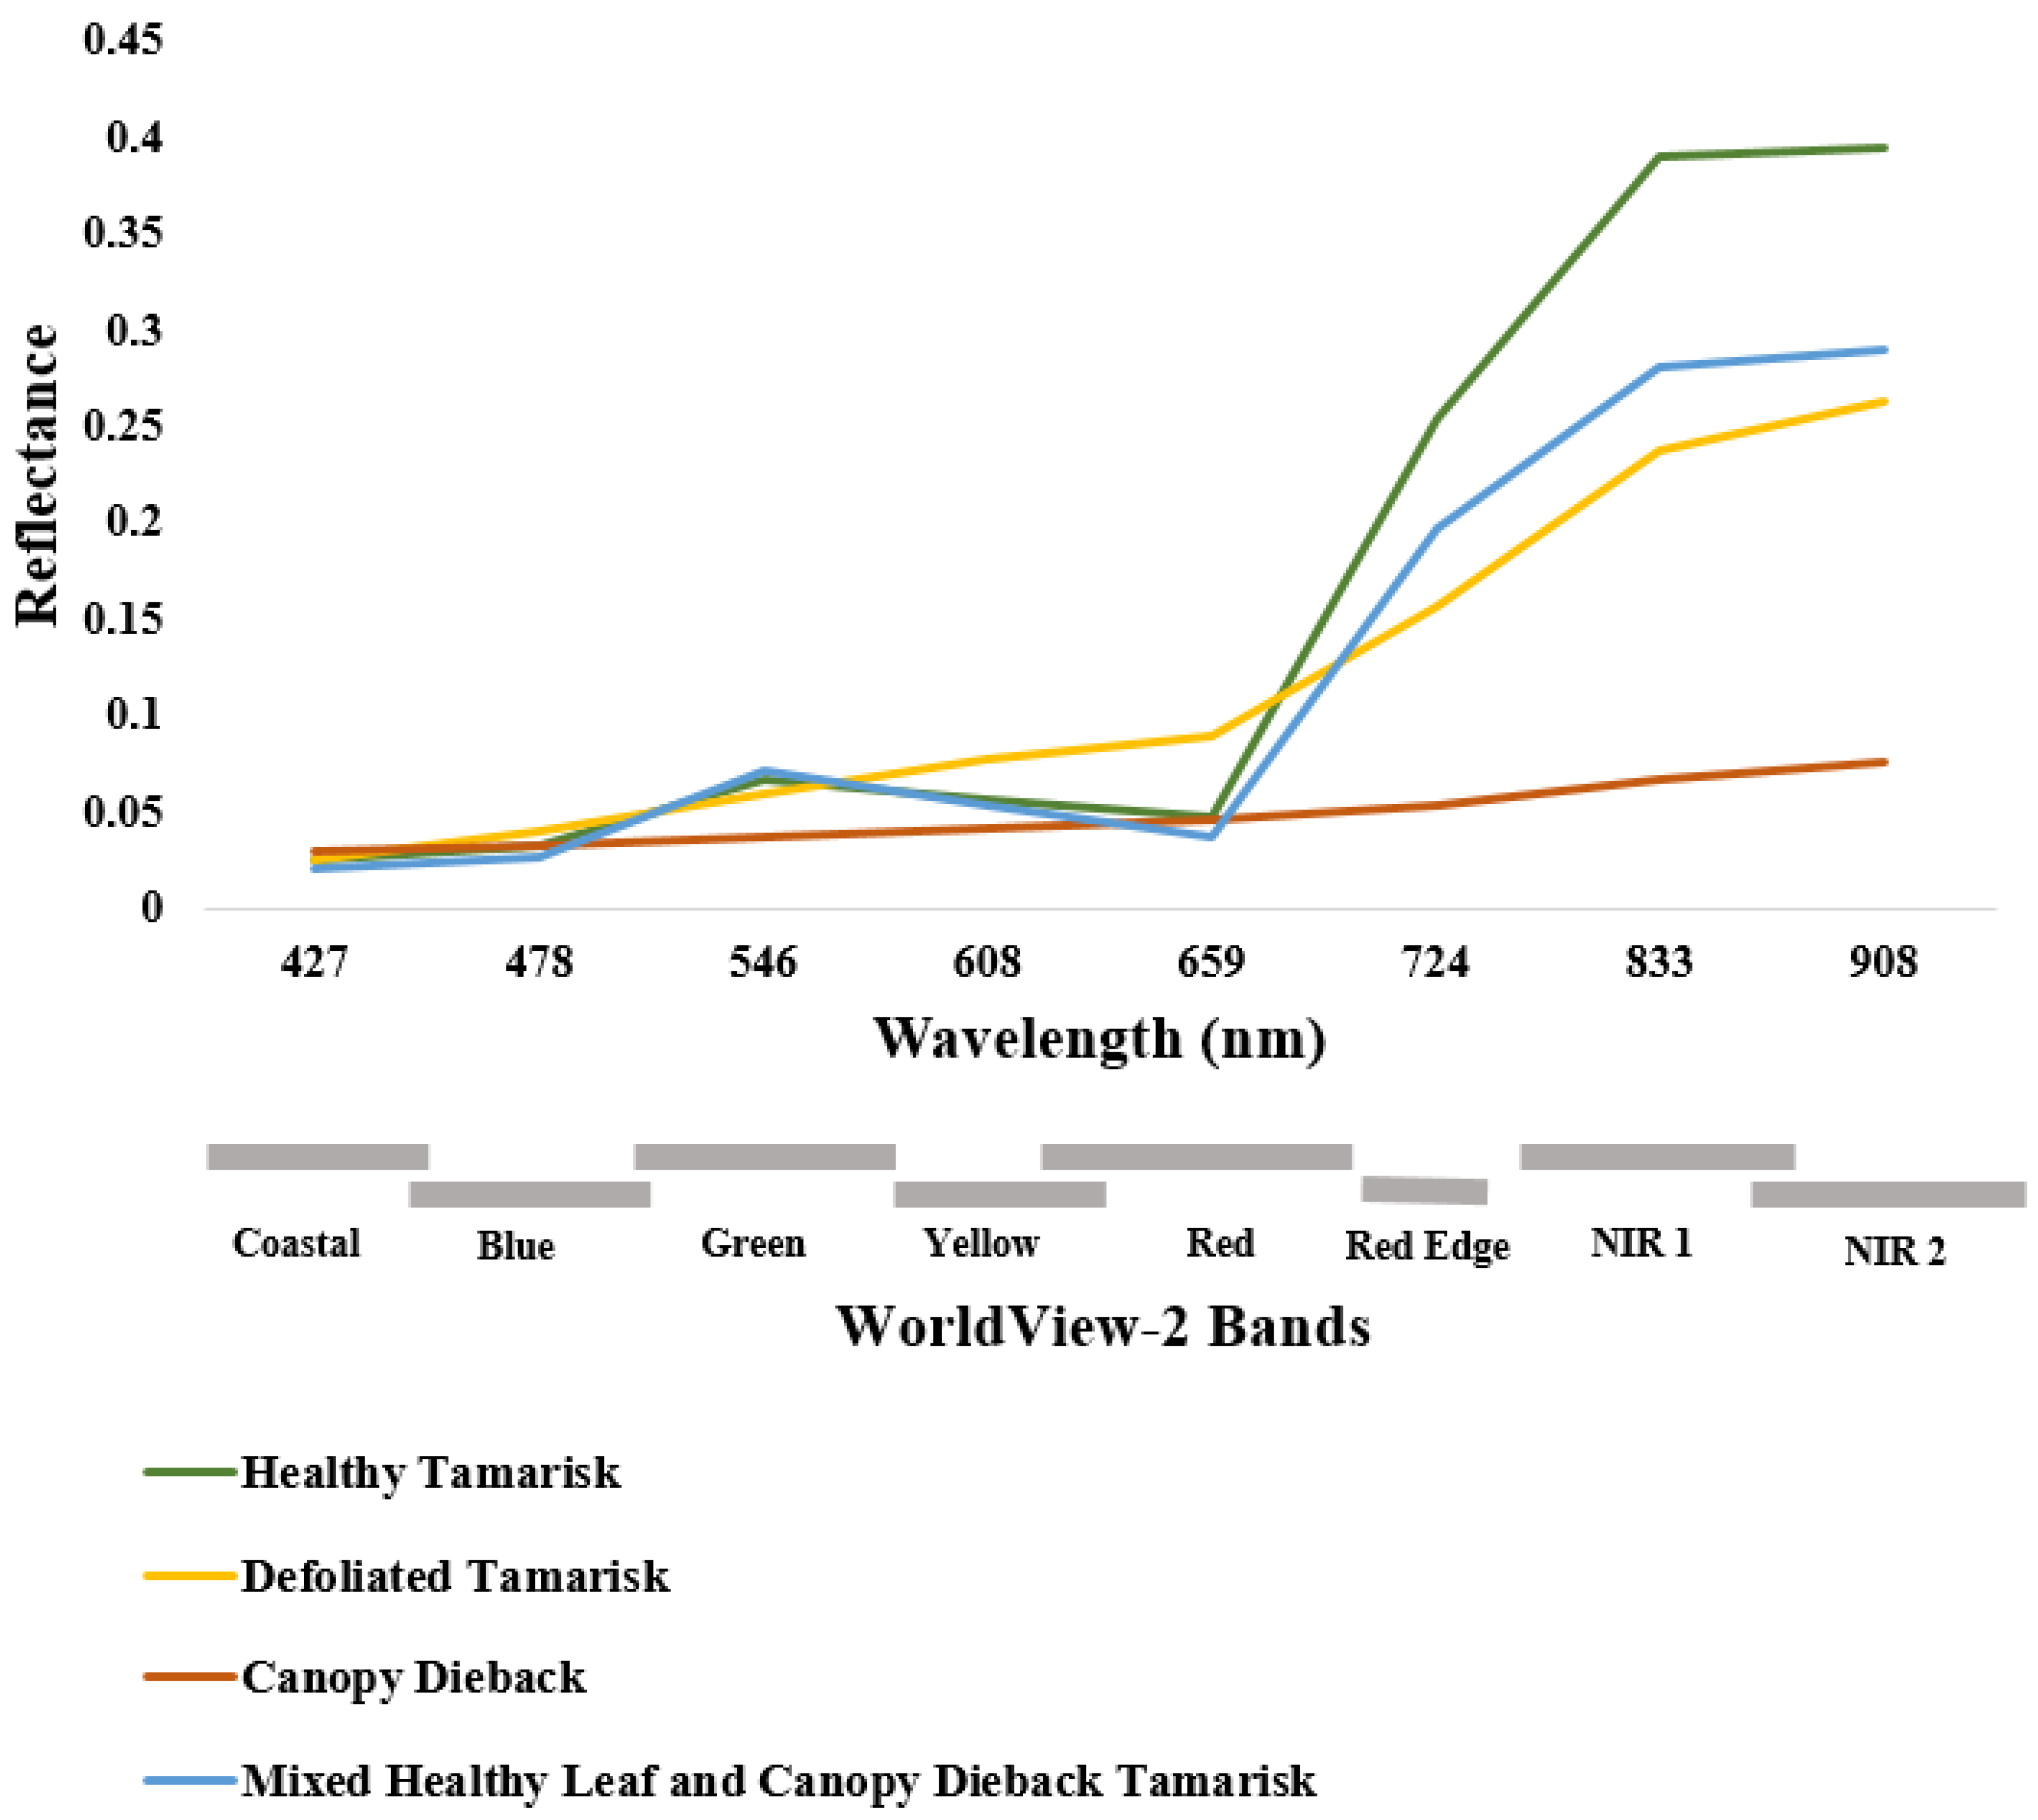
3.1. Tamarisk Detection

Field-based defoliation and canopy dieback observations were collected at a total of 475 locations between river km 144 (Pipe Creek)–363.5 (Diamond Creek) in May, June, and July 2019. An additional 162 locations from Diamond Creek to river km 450.6 (Pearce Ferry) were collected in May 2019. Defoliation of tamarisk by the tamarisk beetle increased each month from May through July and spread up- and down-river from areas showing defoliation in previous months (Figure 4). In May 2019, defoliation was only observed at a few locations. In June, the number of defoliation observations increased, as did the average proportion of defoliated branches in each observation. In July, defoliation of tamarisk by the beetle was observed almost everywhere at a higher proportion per tamarisk stand.
Canopy dieback was observed to some degree almost everywhere along the study reach, with only small patches of tamarisk with 0% dieback (Figure 5). Tamarisk canopy dieback from previous events and prior years was most easily observed in May 2019 both on the ground and in the imagery, when the lack of tamarisk beetle defoliation reduced the need to discern defoliated branches from dead branches.
The ground-based ASD hyperspectral data clearly indicate distinct spectra for tamarisk compared to the other common vegetation species. Healthy, green tamarisk would be most likely to be misclassified as arrowweed, since the near-infrared region of each endmember’s spectra peaks with reflectance at about 0.4. However, each of the other species has spectra that is highly discernible from tamarisk. Furthermore, the field-based hyperspectral spectra indicate unique spectral signatures for varying tamarisk conditions. Compared to the healthy, green tamarisk, the canopy dieback spectra has less variability, and lower reflectance across all spectral bands.
The May, 2019 WorldView-2 image classification had an overall accuracy of 80.0% (Table 2). The healthy tamarisk class had producer’s and user’s accuracies of 87.7% and 78.1%, owing to errors of omission and commission, respectively (Table 2). The canopy dieback class had producer’s and user’s accuracies of 71.1% and 81.1%, respectively (Table 2). The defoliated tamarisk class had producer’s and user’s accuracies of 66.7% and 100.0%, respectively (Table 2). We estimate that the post-processing steps improved the accuracies by 10–15% and were especially important for this class due to the mixing with bare ground. The August 2019 WorldView-2 image classification had an overall accuracy of 83.1% (Table 3). The defoliated (beetle-impacted) tamarisk class had a producer’s and user’s accuracies of 85.4% and 91.1%, respectively (Table 3). The healthy tamarisk class had producer’s and user’s accuracies of 76.5% and 65.0%, respectively (Table 3), with the lower user’s accuracy possibly due to spectral mixing of green tamarisk with defoliated tamarisk later in the growing season.

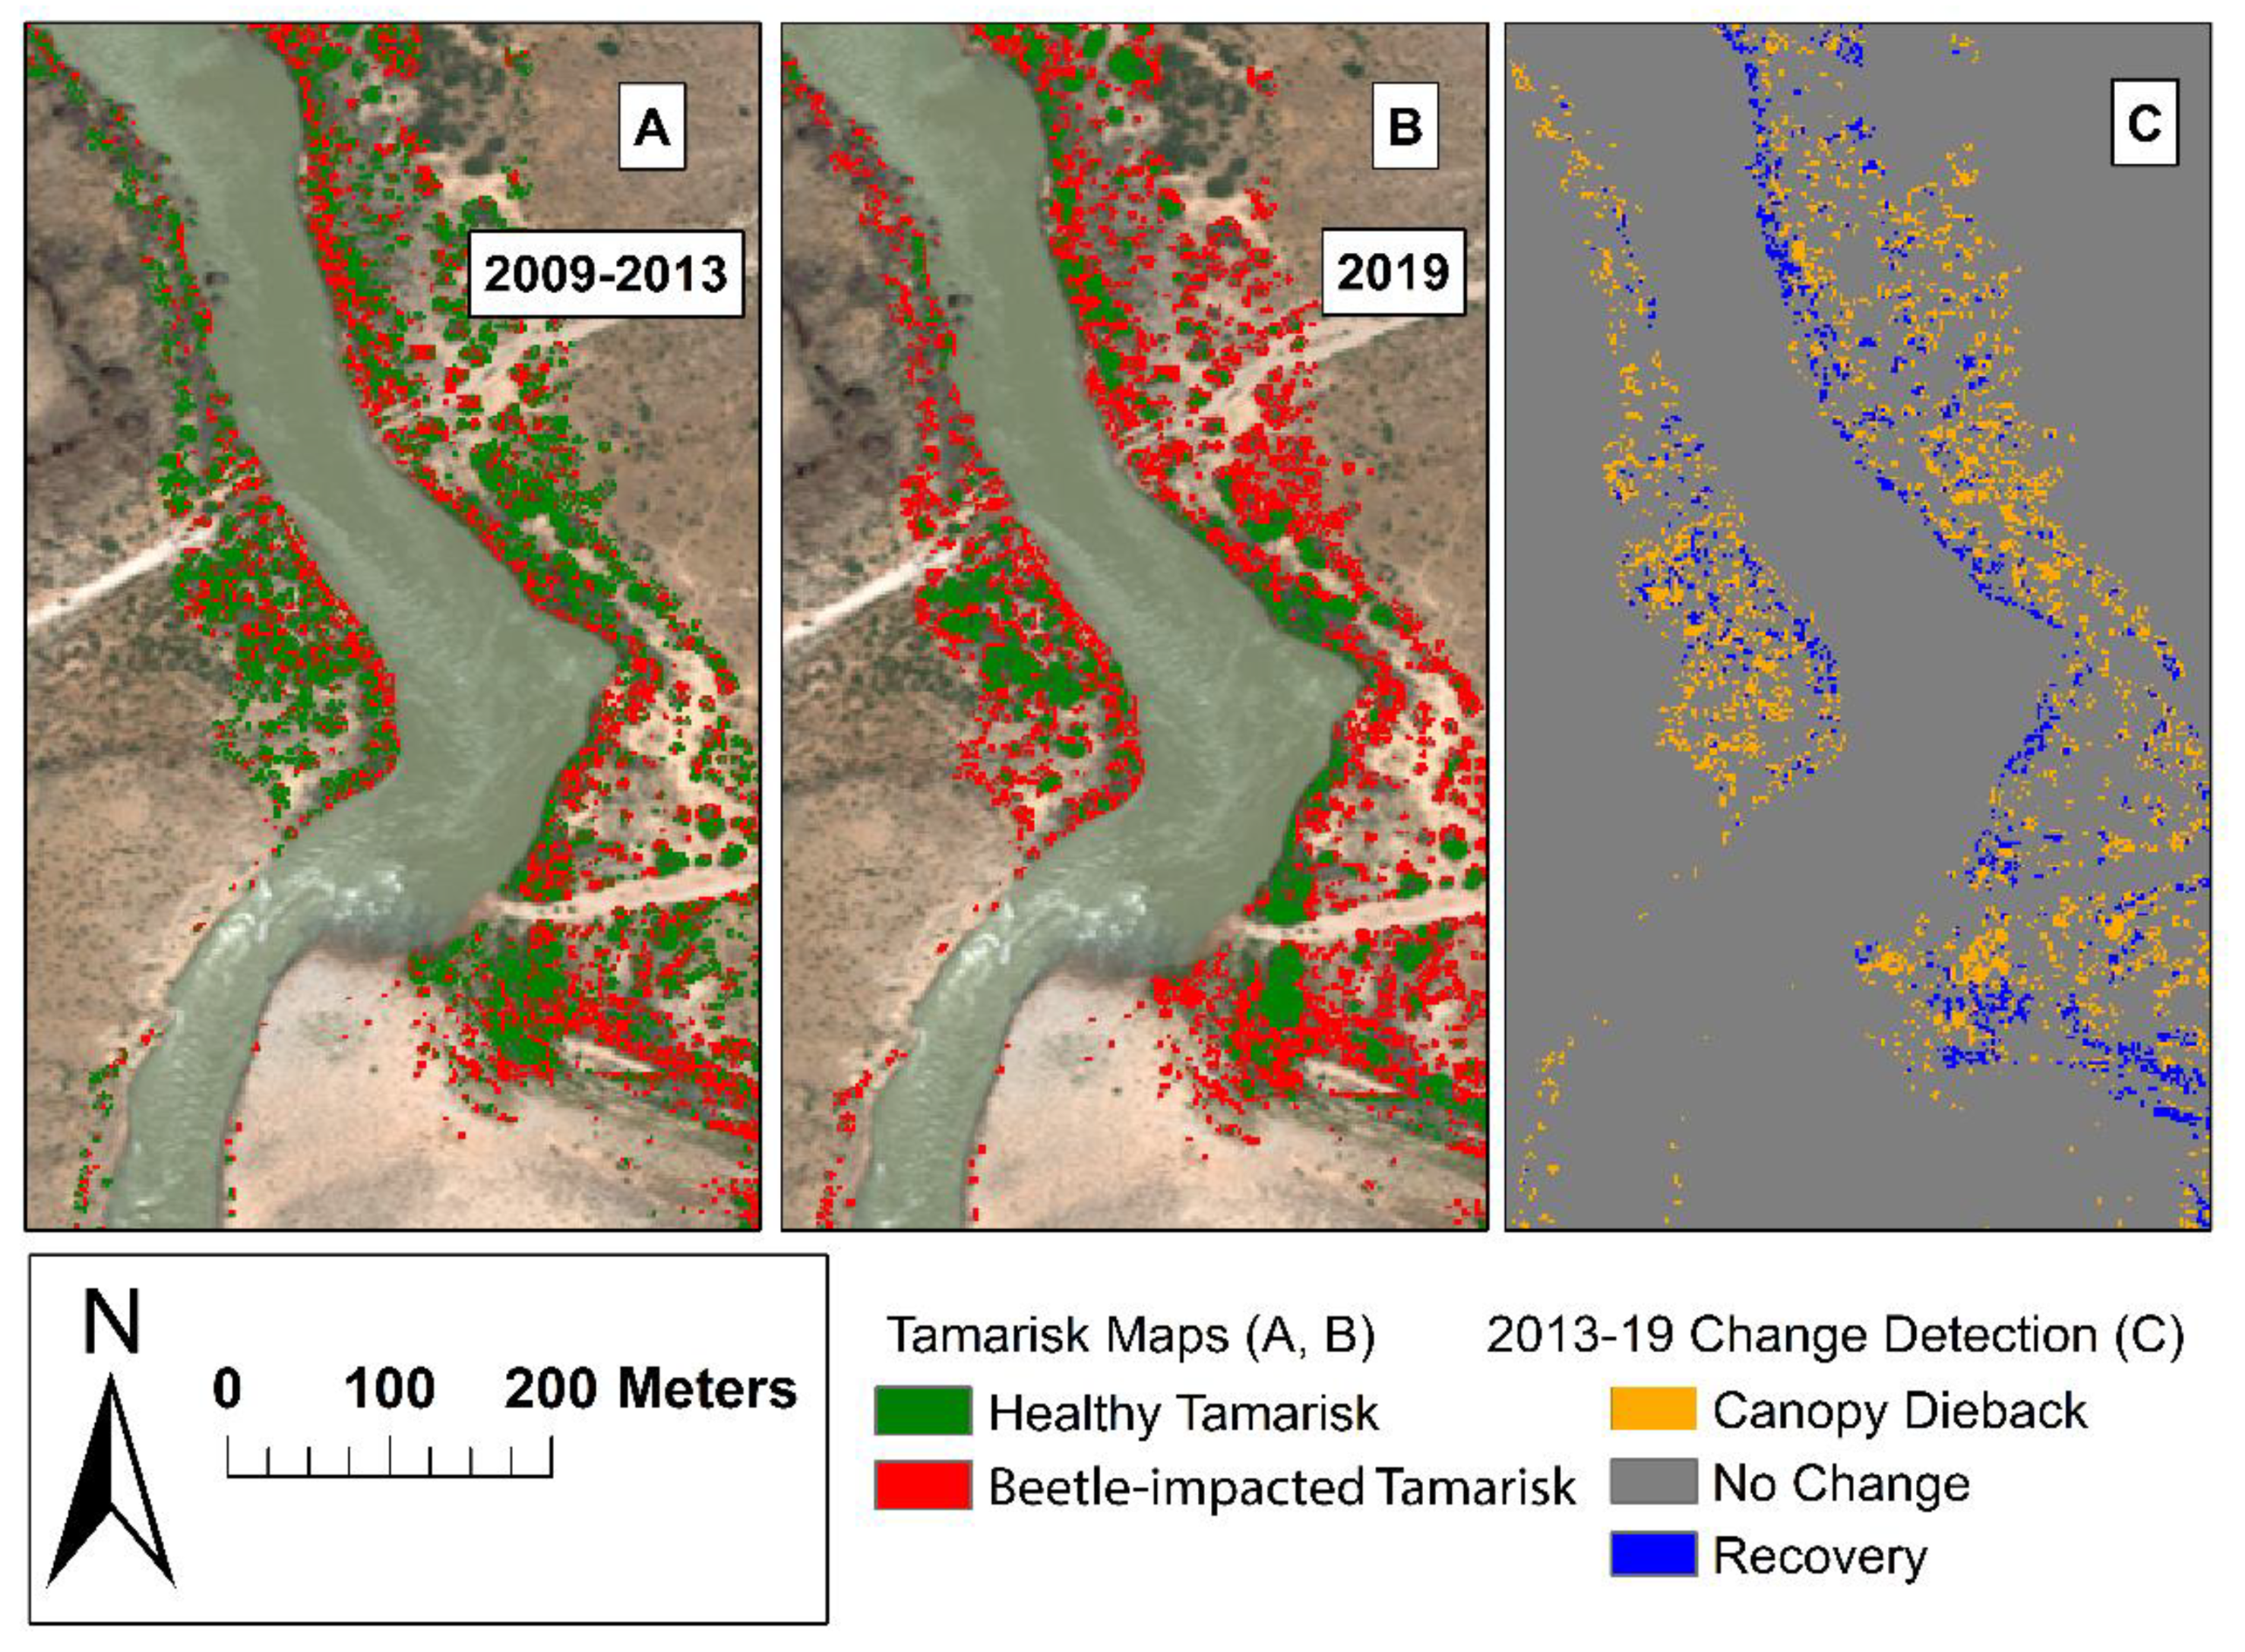
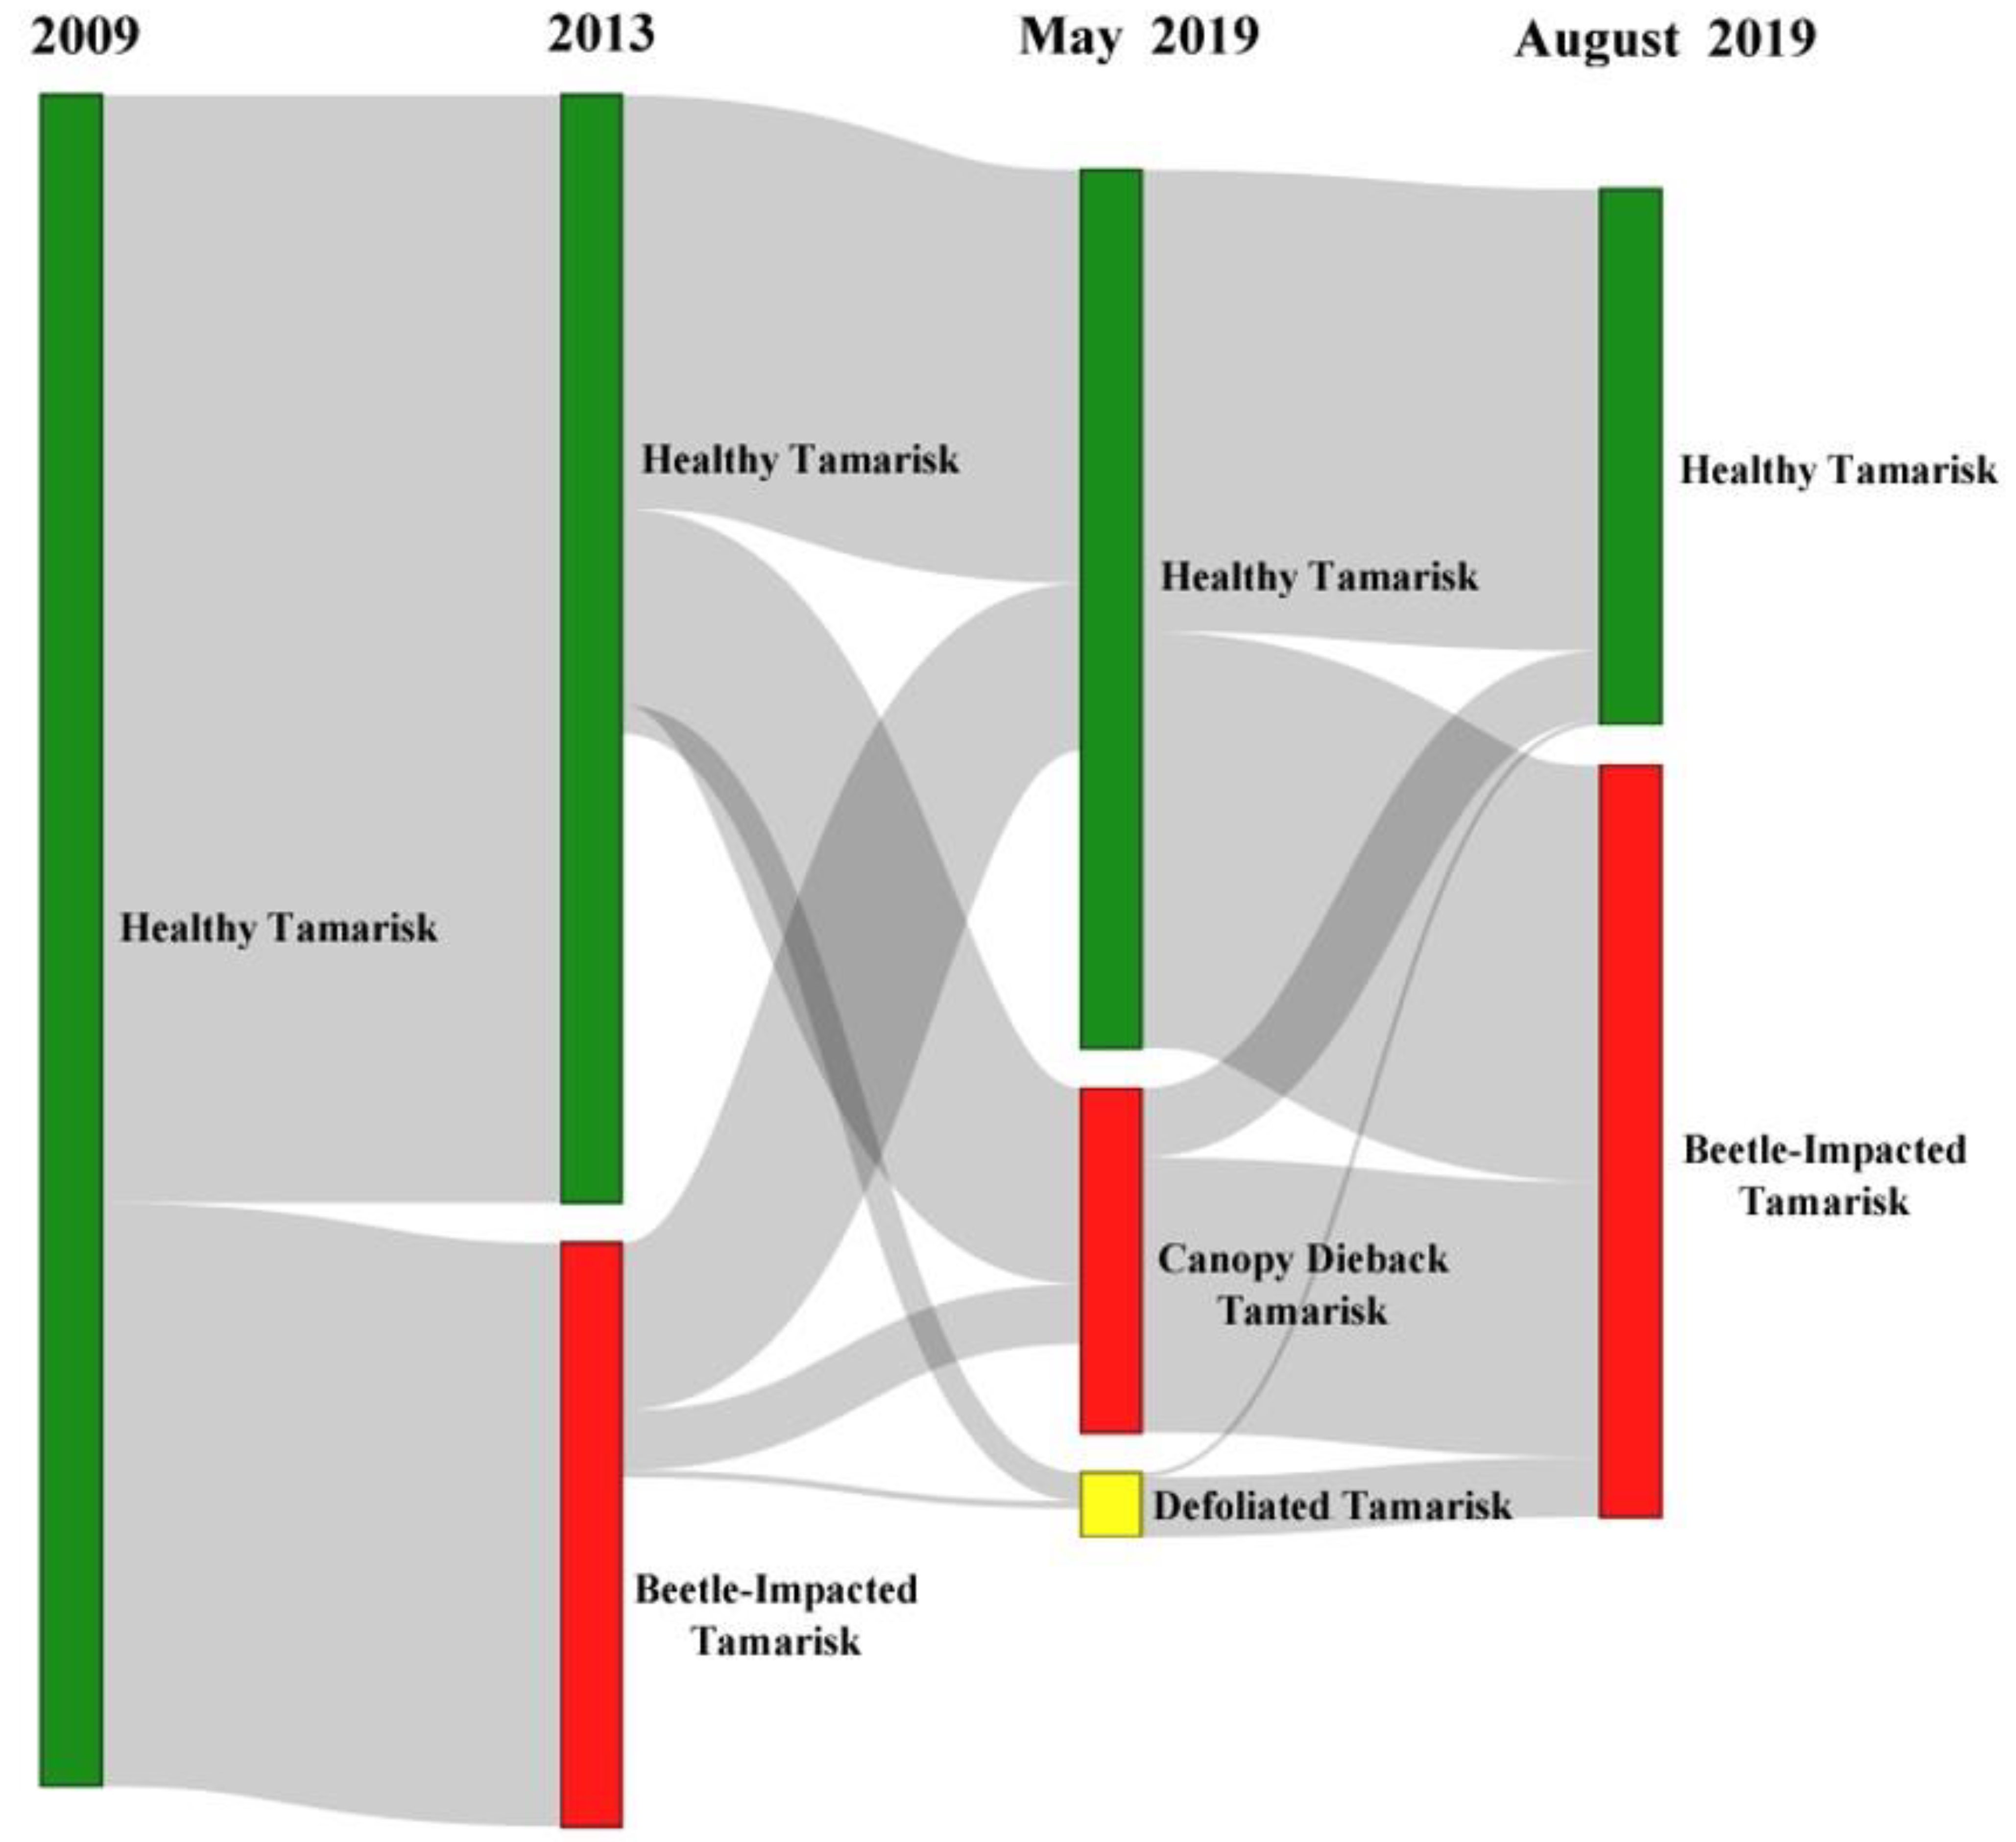
3.2. Change Detection

In May, 2019, the SAM classification detected 43.6 ha of healthy tamarisk, 18.2 ha of canopy dieback, and 2.9 ha of defoliated tamarisk within the WorldView-2 study reach. The detected tamarisk amounted to 64.1% of the known total vegetated area within the study reach from Durning et al. [45]. In August 2019, 20.4 ha of healthy tamarisk and 39.7 ha of beetle-impacted tamarisk were detected, which amounted to 59.5% of the total vegetated area [45]. After applying a matching cloud mask from August to both images, May detections increased to 36.7 ha of healthy tamarisk, 14.4 ha of canopy dieback, and 2.7 ha of defoliated tamarisk, resulting in a total of 53.8 ha of tamarisk detected. August detections increased to 19.1 ha of healthy tamarisk and 35.6 ha of beetle-impacted tamarisk after applying the mask, resulting in a total of 54.7 ha of tamarisk detected.
We found that 17.4 ha (47.5%) of the healthy tamarisk detected in May 2019 was classified as beetle-impacted by August, 2019 within our WorldView-2 study reach. As dieback is a slower process than defoliation, we interpret this measure as an estimate of defoliation that occurred during this period. Of the 2.7 ha of defoliated tamarisk mapped in May, 7.4% (0.2 ha) had recovered by August, and the other 92.6% (2.5 ha) remained defoliated. Of the 14.4 ha of canopy dieback mapped in May, 20.1% (2.9 ha) changed to healthy tamarisk in August, which indicates potential error within this classification scheme, reflected in the 71.1% producer’s accuracy for the canopy dieback class.
The change detection between the Bedford et al. [13,14] classifications and the May 2019 WorldView-2 classification (Figure 6) indicated 52.7% tamarisk area agreement, where tamarisk was present in both maps, or 34.1 ha of the May, 2019 classification. The 2009–2019 and 2013–2019 changes were, therefore, estimated only within the areas of agreement. The 2009–2019 change detection indicated that 29.5% (10.1 ha) of the healthy tamarisk detected in 2009 exhibited canopy dieback by May, 2019, and 3.9% (1.3 ha) of healthy tamarisk detected in 2009 were defoliated in May, 2019. We found that 52.5% (19.3 ha) of healthy tamarisk mapped in 2009 were not found to be beetle impacted by August 2019, whereas the remaining 47.5% were impacted by either defoliation or canopy dieback.
The 2013–2019 comparisons found that 30.7% (8.2 ha) of the healthy tamarisk detected in 2013 were detected as canopy dieback in 2019, and 71.5% (7.0 ha) of the beetle-impacted tamarisk detected in 2013 were detected as healthy tamarisk in 2019. A total of 64.9% (17.3 ha) of the healthy tamarisk found in 2013 did not change by 2019, and 28.5% (2.8 ha) of the beetle-impacted tamarisk did not change between 2013 and 2019 (i.e., it was classified as canopy dieback or defoliated in 2019).
Figure 7 illustrates all of the changes summarized above that were observed from 2009 to 2013 to May and August 2019.

4. Discussion

4.1. WorldView-2 Image Classification of Tamarisk Distribution, Canopy Dieback, and Defoliation

The WorldView-2 image classifications had high accuracies in detecting tamarisk distribution and beetle impacts for 2019 within the 48 km river stretch of Grand Canyon National Park. Our results indicate that the high spatial resolution (2 m) of the WorldView-2 image is appropriate for mapping tamarisk distribution in the Grand Canyon, despite the inherent challenges associated with remote sensing, particularly from satellite sensors, in deep canyon topography. Having a reliable satellite sensor for such challenging study areas allows for rapid analysis of landscape changes over tens of km of riparian corridor, where biodiversity, phenologic patterns, and land cover types can be dynamic.
The overall accuracies of the May and August WorldView-2 image classifications are comparable to the overall accuracy of 74% achieved by Bedford et al. [13,14]. The reach of the river covered by the Worldview imagery is within a segment of Grand Canyon that is oriented North–South and is relatively wide. Remote sensing with Worldview might be more challenging in more sinuous and narrow segments of Grand Canyon. Our classification accuracies are also comparable to the accuracies reported by Narumalani et al. [36], who achieved 83% accuracy using SAM in Lake Meredith, Texas. However, other studies report higher accuracies than observed in our study likely due to the wider riparian corridors and larger tamarisk stands found at their study sites using airborne images and Quickbird and Landsat satellite data [33,34,35].
The lowest accuracies in the WorldView-2 maps were in the producer’s accuracy of defoliated tamarisk in May and the user’s accuracy for healthy tamarisk in August. The lower user’s accuracy in August could be the result of mixing of healthy tamarisk foliage with defoliated tamarisk that occurred within the same pixels, whereas the converse might be an explanation for the low producer’s accuracy in May. The low producer’s accuracy in May might also be the result of mixing of green understory vegetation beneath defoliated tamarisk canopies. The sample size for defoliated tamarisk in May was very small because there is typically not as much tamarisk beetle activity at that time of year compared to later in the summer; owing to the small number of observations, the accuracy measure for this class might not be reliable.
Some nuances associated with the ground-based observation and classification methods might have impacted the accuracies of the WorldView-2 classifications. The defoliation observations were made 8–9 days apart between ground-based and image-based detections allowing for defoliation levels to potentially change. Additionally, the mismatch in classification levels between the ground-based and WorldView-2 image-derived methods introduced more room for error than using discrete training data representing a single class, collected in the field via GPS and translated to training and validation pixels. Furthermore, the 52.7% agreement in tamarisk detection between the WorldView-2 map and the 2009 supervised classification map can be attributed to the fact that the 2009 data comprised USGS aerial imagery rather than a consistent satellite image source. Such differences in spatial resolution can result in varying rates of detection and different area estimates of invasive species in remote sensing efforts [46,47]. Furthermore, the 2009 aerial image used for Mahalanobis supervised classification by Bedford et al. [13,14] had 100 times finer resolution than the WorldView-2 imagery, allowing for detection of shrubs throughout the study area that were smaller and covered less than a single WorldView-2 pixel. An advantage of using imagery with resolution as high as 20 cm [13,14,48] is that different plant species can sometimes be identified by visual analysis of the imagery, allowing for more control over post-classification processing and manual cleaning of non-target species.
This study also highlights the importance of using multiple images to tease out seasonal patterns of tamarisk defoliation. It was difficult to separate the canopy dieback class from the defoliated tamarisk class in a single image due to mixing of these classes within a 2 m pixel in August, when there was greater defoliation to potentially mix with other classes, compared to the May image. Combining the canopy dieback and defoliated tamarisk classes in August eliminated the possibility of discerning canopy dieback from defoliation in a single image, leading to a classification of healthy versus “beetle-impacted” tamarisk, as was done in Sankey et al. [16] and Bedford et al. [13,14]. The changes detected between May and August 2019 were useful for measuring defoliation within the growing season, because they take advantage of the healthy-tamarisk and dieback classes in May from a time when little seasonal defoliation was observed. This approach can be useful for land managers in monitoring these phenomena remotely and across large landscapes.

4.2. Seasonal and Multi-Year Change Detection

The 2019 WorldView-2 classification maps were used to detect seasonal changes over a single growing season as well as to estimate multi-year changes in tamarisk since 2009. First, the May to August 2019 change detections indicated that 47.5% of the healthy tamarisk in May were defoliated by August, which suggests significant defoliation by the beetle had occurred within this stretch over the growing season (Figure 7). Second, the 2009–2019 change detection indicated that 29.5% of the healthy tamarisk classified in 2009 had experienced canopy dieback by May 2019, while 66.6% remained healthy (the remainder were defoliated). Similarly, the 2013 to 2019 change detection found 64.9% of the healthy tamarisk in 2013 were still healthy by May 2019 (Figure 7), and 28.5% of the beetle-impacted tamarisk (i.e., defoliated or with dieback) in 2013 was still impacted in May 2019. The tamarisk that changed from beetle-impacted back to healthy tamarisk from 2013 to 2019 (Figure 7) were possibly either the result of tamarisk recovering new canopies after being defoliated, or growing new canopies within the dieback during periods where defoliation pressure was low in the years between maps, or possibly from new growth from plant species with similar spectral signatures like arrowweed. Previous studies have shown that the impacts of the tamarisk beetle are the greatest within the first years following the introduction of the beetle to a new environment [43]. Between 2009–2013, Bedford et al. [13,14] detected 15% of the canopy to have died back or been defoliated within the 48 km river stretch of the WorldView-2 imagery, whereas in 2019 we found 29.5% of the canopy was classified as dieback. This implies that tamarisk beetle impacts are continuing to accumulate despite beetles being present in the study reach for 7 years.
In other river systems of the SW USA, Jarchow et al. [28] and Snyder & Scott [7] have shown declines in growing season tamarisk canopy greenness measured with NDVI from moderate resolution satellites during the first 2 to 10 years after introduction of the tamarisk beetle. Jarchow et al. [28] and Snyder & Scott [7] found that the declines in greenness correlated with decreases in ET and decreases in overall riparian ecosystem health, but also determined that in many but not all of the river reaches examined, tamarisk greenness, ET, and LAI recovered to pre-beetle levels within a decade. It remains an open question as to how tamarisk will recover in the long-term from beetle impacts in our study reach of the Grand Canyon. Kasprak et al. [49] recently used habitat suitability models developed by Butterfield et al. [50] to show that much of the unvegetated riparian habitat in Grand Canyon is currently suitable for colonization and expansion of tamarisk, but the modelling did not explicitly incorporate effects of, or feedbacks between, the tamarisk beetle and tamarisk.

4.3. Ecological Implications

Our multi-year comparison maps can be used by land managers to determine where tamarisk defoliation and canopy dieback are observed due to the tamarisk beetle, and where restoration efforts thus could be focused across a large landscape. Both tamarisk defoliation and canopy dieback have important implications for wildlife. For example, leaf loss of tamarisk reduces habitat for songbirds including the endangered Southwestern Willow Flycatcher [31,32], and other riparian nesting birds [51]. Herpetofauna that use the understory as habitat can also be negatively impacted by defoliation when alternative habitat is not available [30]. Groups like the USDA Animal and Plant Health Inspection Service (APHIS) Technical Advisory Group for Biological Control Agents of Weeds, or RiversEdge West, who communicate science to the public, provide guidance to researchers, or review petitions for biocontrol of weeds in the US, could potentially use these data to help inform future biocontrol efforts.
Changes in tamarisk and landscape-scale dynamics as illustrated in Figure 7 also directly influence plant cover and species richness [52,53,54]. Tamarisk abundance and cover decreases following tamarisk beetle defoliation and canopy dieback and can result in regeneration of other plant species [55]. Some increase in native plant cover following tamarisk removal or dieback is attributed to replacement by arrowweed in other river systems [53,54], which was also documented in our field observations along the Colorado River in Grand Canyon. González et al. [54] found that tamarisk in the southwestern U.S. is often replaced by secondary invasions of noxious weeds, including Russian knapweed (Acroptilon repens), cheatgrass (Bromus tectorum), summer cypress (Bassia scoparia), and prickly Russian thistle (Salsola tragus), though the success of each weed depends on if control measures are taken. Many of those same weeds occur in Grand Canyon, and thus as tamarisk cover is lost through canopy dieback in Grand Canyon, the replacement of tamarisk with native shrub species that perform similar ecological functions might be important for maintaining ecosystem health.

4.4. Implications for Future Remote Sensing Research

Bedford et al. [13,14] demonstrated the utility of 20-cm pixel resolution four-band imagery acquired from a multi-spectral sensor onboard a fixed-wing aircraft to accurately classify healthy tamarisk and beetle-impacted tamarisk, and detect changes over time in those classes along the Colorado River in Grand Canyon. Other invasive species studies across North America have used hyperspectral data such as AVIRIS imagery with 20 m resolution and 224 bands and HyMap imagery with 3.5 m resolution and 126 bands [56,57,58,59,60,61]. However, hyperspectral imagery can be expensive to acquire and tends to cover small spatial extents. Even multispectral, airborne images are not acquired frequently in Grand Canyon (e.g., annually or intra-annually) because they are also expensive and logistically challenging. In this study, we show that 2-m resolution multispectral satellite imagery, which is available at much greater temporal frequency, can be used to detect intra-annual seasonal changes in tamarisk owing to the tamarisk beetle by detecting the inherent spectral differences between healthy tamarisk, defoliated tamarisk, and tamarisk canopy dieback. In other arid and semi-arid environments around the world without the very steep topography, coarser resolution, multi-temporal satellite data such as Landsat have been used to similarly leverage the seasonal variability in invasive species detection [62].
A potential improvement on our methods would be to incorporate plant height estimates from lidar or photogrammetry along with the spectra in the classification to improve accuracies. Other studies have demonstrated that lidar-derived topographic data and unmanned aerial vehicle (UAV)-based photogrammetry-derived vegetation height data can be integrated with high resolution multispectral images to better detect invasive species distribution and estimate expansion rates [46,63,64]. We did not have lidar data for plant height or topography for this reach of the river, though Sankey et al. [16] were able to use that approach with lidar and multispectral imagery to detect tamarisk beetle impacts along the Colorado River in Glen Canyon, Arizona.

5. Conclusions

Using high spatial resolution WorldView-2 imagery from 18 May 2019 and 2 August 2019, we classified tamarisk distribution in the topographically complex study area of Grand Canyon National Park and demonstrate tamarisk beetle impacts in the park since 2009. A strength of our approach was that the 2019 WorldView-2 image classifications could be compared with previously published maps derived from aerial multispectral imagery acquired in 2009 and 2013. Taken together, our long-term results show that tamarisk beetle impacts are continuing to accumulate even though land managers have noted the presence of the beetles in the park since 2009 and specifically in the study reach of the river for 7 years since 2012. Our methods and maps [65] provide a valuable tool for land managers to track defoliation and canopy dieback of tamarisk from the tamarisk beetle over the region. These data can help determine what restoration efforts are needed in different areas. In areas where tamarisk is not being defoliated or killed by the beetle, thinning and other treatments could be preferred, while areas with high levels of mortality could require the removal of dead shrubs. This study is the first known effort of mapping decadal-scale tamarisk canopy dieback and seasonal-scale defoliation in the Grand Canyon with satellite remote sensing, setting the stage for future studies to conduct spatial analysis of defoliation, dieback, and eventual multi-year tamarisk mortality in Grand Canyon National Park. Further research and monitoring will provide useful insights regarding how the impacts of the beetle on tamarisk will affect this iconic riparian corridor.

Author Contributions

Conceptualization, J.B.S., T.S.; Formal analysis, N.B.; Writing-original draft preparation, N.B., T.S.; Writing—review and editing, J.B.S., M.J., L.J. All authors have read and agreed to the published version of the manuscript.

Funding

This work was supported by funding from the U.S. Bureau of Reclamation as part of the Glen Canyon Dam Adaptive Management Program. The United States Geological Survey (USGS) Grand Canyon Monitoring and Research Center purchased the WorldView-2 satellite imagery. Graduate student Nathaniel Bransky received funding from the Northern Arizona University School of Informatics, Computing, and Cyber Systems, and the University of Arizona Water Resources Research Center 104(b).

Institutional Review Board Statement

Not applicable.

Informed Consent Statement

Not applicable.

Data Availability Statement

The data produced in this study is available at: Bransky, N.D.; Sankey, T.T.; Sankey, J.B. Northern Tamarisk Beetle Impact and Classification Maps, Grand Canyon National Park, Arizona; U.S. Geological Survey data release; U.S. Geological Survey: Reston, VA, USA, 2021; doi:10.5066/P9WUMM1P.

Acknowledgments

We thank the USGS Grand Canyon Monitoring and Research Center and Grand Canyon Youth for providing logistics necessary for multi-day fieldwork completed in summer 2019 for this research. Research was conducted with permission from Grand Canyon National Park. We thank Pamela Nagler (USGS) and Brad Butterfield (NAU) for providing helpful reviews of a previous version of the manuscript. The data produced in this study are available at: Bransky, N.D., Sankey, T.T., and Sankey, J.B., 2021, Northern tamarisk beetle impact and classification maps, Grand Canyon National Park, Arizona: U.S. Geological Survey data release, https://doi.org/10.5066/P9WUMM1P accessed on 1 January 2021. This manuscript is submitted for publication with the understanding that the US Government is authorized to reproduce and distribute reprints for Governmental purposes. Any use of trade, product, or firm names is for descriptive purposes only and does not imply endorsement by the US Government.

Conflicts of Interest

The authors declare no conflict of interest.

References

  1. Brock, J.H. Tamarix spp. (Salt Cedar), an invasive exotic woody plant in arid and semi-arid riparian habitats of Western USA. In Ecology and Management of Invasive Riverside Plants; de Waal, L.C., Child, L.E., Wade, P.M., Brock, J.H., Eds.; John Wiley & Sons Ltd.: Hoboken, NJ, USA, 1994; pp. 27–43. [Google Scholar]
  2. Deloach, C.; A Lewis, P.; Herr, J.C.; I Carruthers, R.; Tracy, J.L.; Johnson, J. Host specificity of the leaf beetle, Diorhabda elongata deserticola (Coleoptera: Chrysomelidae) from Asia, a biological control agent for saltcedars (Tamarix: Tamaricaceae) in the Western United States. Biol. Control 2003, 27, 117–147. [Google Scholar] [CrossRef] [Green Version]
  3. Sueki, S.; Acharya, K.; Huntington, J.; Liebert, R.; Healey, J.; Jasoni, R.; Young, M. Defoliation effects of Diorhabda carinulata on tamarisk evapotranspiration and groundwater levels. Ecohydrology 2015, 8, 1560–1571. [Google Scholar] [CrossRef]
  4. Zavaleta, E. The Economic Value of Controlling an Invasive Shrub. J. Hum. Environ. 2000, 29, 462–467. [Google Scholar] [CrossRef]
  5. Liebert, R.; Huntington, J.; Morton, C.; Sueki, S.; Acharya, K. Reduced evapotranspiration from leaf beetle induced tamarisk defoliation in the Lower Virgin River using satellite-based energy balance. Ecohydrology 2015, 9, 179–193. [Google Scholar] [CrossRef]
  6. Nagler, P.L.; Barreto-Muñoz, A.; Chavoshi Borujeni, S.; Jarchow, C.J.; Gómez-Sapiens, M.M.; Nouri, H.; Herrmann, S.M.; Didan, K. Ecohydrological responses to surface flow across borders: Two decades of changes in vegetation greenness and water use in the riparian corridor of the Colorado River delta. Hydrol. Process. 2020, 34, 4851–4883. [Google Scholar] [CrossRef]
  7. Snyder, K.A.; Scott, R.L. Longer term effects of biological control on tamarisk evapotranspiration and carbon dioxide exchange. Hydrol. Process. 2020, 34, 223–236. [Google Scholar] [CrossRef]
  8. Owens, M.K.; Moore, G.W. Saltcedar Water Use: Realistic and Unrealistic Expectations. Rangel. Ecol. Manag. 2007, 60, 553–557. [Google Scholar] [CrossRef]
  9. Meinhardt, K.A.; Gehring, C.A. Disrupting mycorrhizal mutualisms: A potential mechanism by which exotic tamarisk outcompetes native cottonwoods. Ecol. Appl. 2012, 22, 532–549. [Google Scholar] [CrossRef]
  10. Merkel, D.L.; Hopkins, H.H. Life History of Salt Cedar (Tamarix gallica L.). Trans. Kansas Acad. Sci. 1957, 60, 360–369. [Google Scholar] [CrossRef]
  11. Glenn, E.P.; Nagler, P.L. Comparative ecophysiology of Tamarix ramosissima and native trees in western U.S. riparian zones. J. Arid. Environ. 2005, 61, 419–446. [Google Scholar] [CrossRef]
  12. Gaskin, J.F.; Schaal, B.A. Hybrid Tamarix widespread in U.S. invasion and undetected in native Asian range. Proc. Natl. Acad. Sci. USA 2002, 99, 11256–11259. [Google Scholar] [CrossRef] [PubMed] [Green Version]
  13. Bedford, A.; Sankey, T.T.; Sankey, J.B.; Durning, L.; Ralston, B.E. Remote sensing of tamarisk beetle (Diorhabda carinulata) impacts along 412 km of the Colorado River in the Grand Canyon, Arizona, USA. Ecol. Indic. 2018, 89, 365–375. [Google Scholar] [CrossRef]
  14. Bedford, A.; Sankey, T.T.; Sankey, J.B.; Durning, L.E.; Ralston, B.E. Remote Sensing Derived Maps of Tamarisk (2009) and Beetle Impacts (2013) along 412 km of the Colorado River in the Grand Canyon, Arizona; U.S. Geological Survey data release; U.S. Geological Survey: Flagstaff, AZ, USA, 2018. [CrossRef]
  15. Nagler, P.L.; Nguyen, U.; Bateman, H.L.; Jarchow, C.J.; Glenn, E.P.; Waugh, W.J.; Van Riper, C., III. Northern tamarisk beetle (Diorhabda carinulata) and tamarisk (Tamarix spp.) interactions in the Colorado River basin. Restor. Ecol. 2018, 26, 348–359. [Google Scholar] [CrossRef]
  16. Sankey, T.T.; Sankey, J.B.; Horne, R.; Bedford, A. Remote Sensing of Tamarisk Biomass, Insect Herbivory, and Defoliation: Novel Methods in the Grand Canyon Region, Arizona. Photogramm. Eng. Remote. Sens. 2016, 82, 645–652. [Google Scholar] [CrossRef]
  17. Hennessy, M. Colorado River Water Rights: Property Rights in Transition. Univ. Chic. Law Rev. 2004, 71, 1661–1687. [Google Scholar]
  18. DeLoach, C.J.; Carruthers, R.I.; Dudley, T.L.; Eberts, D.; Kazmer, D.J.; Knutson, A.E.; Bean, D.W.; Knight, J.; Lewis, P.A.; Milbrath, L.R.; et al. First results for control of saltcedar (Tamarix spp.) in the open field in the western United States. In Proceedings of the XI International Symposium on Biological Control of Weeds, Entomology, Canberra, Australia, 27 April–2 May 2003; Cullen, W., Briese, D.T., Kriticos, D.J., Lonsdale, W.M., Morin, L., Scott, J.K., Eds.; 2004; pp. 505–513. [Google Scholar]
  19. RiversEdge West Yearly Distribution (2007–2019) of Tamarisk Beetle (Diorhabda spp.). Available online: https://riversedgewest.org/sites/default/files/files/2019_Annual_Map_New_Color.pdf (accessed on 5 May 2020).
  20. Berro, A.M.; Evans, S.; Ferguson, E.M.; Royer, T.A. Acceptability of Diorhabda carinulata, an Introduced Biological Control Agent ofTamarix, as Prey for Selected Resident Native Arthropod Predators. Southwest. Èntomologist 2017, 42, 665–676. [Google Scholar] [CrossRef]
  21. Moran, P.J.; Deloach, C.J.; Dudley, T.L.; Sanabria, J. Open field host selection and behavior by tamarisk beetles (Diorhabda spp.) (Coleoptera: Chrysomelidae) in biological control of exotic saltcedars (Tamarix spp.) and risks to non-target athel (T. aphylla) and native Frankenia spp. Biol. Control 2009, 50, 243–261. [Google Scholar] [CrossRef] [Green Version]
  22. Bloodworth, B.; Shafroth, P.; Sher, A.; Manners, R.; Bean, D.; Johnson, M.J.; Hinojosa-Huerta, O. Tamarisk Beetle (Diorhabda spp.) in the Colorado River Basin: Synthesis of an Expert Panel Forum; Scientific and Technical Report no 1; Colorado Mesa University, Ruth Powell Hutchins Water Center: Grand Junction, CO, USA, 2016; 19p, Available online: https://riversedgewest.org/sites/default/files/files/Tamarisk_Beetle_Expert_Panel_Report.pdf (accessed on 5 May 2020).
  23. A Lewis, P.; Deloach, C.; E Knutson, A.; Tracy, J.L.; O Robbins, T. Biology of Diorhabda elongata deserticola (Coleoptera: Chrysomelidae), an Asian leaf beetle for biological control of saltcedars (Tamarix spp.) in the United States. Biol. Control 2003, 27. [Google Scholar] [CrossRef] [Green Version]
  24. Jamison, L.R.; Johnson, M.J.; Bean, D.W.; Van Riper, C. Phenology and Abundance of Northern Tamarisk Beetle, Diorhabda carinulata Affecting Defoliation of Tamarix. Southwest. Èntomologist 2018, 43, 571–584. [Google Scholar] [CrossRef]
  25. Nagler, P.L.; Brown, T.; Hultine, K.R.; Van Riper, C.; Bean, D.W.; Dennison, P.E.; Murray, R.S.; Glenn, E.P. Regional scale impacts of Tamarix leaf beetles (Diorhabda carinulata) on the water availability of western U.S. rivers as determined by multi-scale remote sensing methods. Remote. Sens. Environ. 2012, 118, 227–240. [Google Scholar] [CrossRef]
  26. Dudley, T.L.; Bean, D.W. Tamarisk biocontrol, endangered species effects and resolution of conflict through riparian res-toration. Biol. Control 2012, 57, 331–347. [Google Scholar]
  27. Kennard, D.; Louden, N.; Gemoets, D.; Ortega, S.; González, E.; Bean, D.; Cunningham, P.; Johnson, T.; Rosen, K.; Stahlke, A. Tamarix dieback and vegetation patterns following release of the northern tamarisk beetle (Diorhabda carinulata) in western Colorado. Biol. Control 2016, 101, 114–122. [Google Scholar] [CrossRef] [Green Version]
  28. Jarchow, C.J.; Waugh, W.J.; Didan, K.; Barreto-Muñoz, A.; Herrmann, S.; Nagler, P.L. Vegetation-groundwater dynamics at a former uranium mill site following invasion of a biocontrol agent: A time series analysis of Landsat normalized difference vegetation index data. Hydrol. Process. 2020, 34, 2739–2749. [Google Scholar] [CrossRef]
  29. Eckberg, J.R.; Rice, N.A. Northern tamarisk beetle (Diorhabda Carinulata) effects on established tamarisk-feeding inverte-brate populations along the Las Vegas Wash, Clark County, Nevada. Southwest. Nat. 2016, 61, 101–107. [Google Scholar] [CrossRef]
  30. Bateman, H.L.; Merritt, D.M.; Glenn, E.P.; Nagler, P.L. Indirect effects of biocontrol of an invasive riparian plant (Tamarix) alters habitat and reduces herpetofauna abundance. Biol. Invasions 2015, 17, 87–97. [Google Scholar] [CrossRef]
  31. Hatten, J. A Satellite Model of Southwestern Willow Flycatcher (Empidonax traillii extimus) Breeding Habitat and a Simulation of Potential Effects of Tamarisk Leaf Beetles (Diorhabda spp.), Southwestern United States; U.S. Geological Survey Open-File Report 2016—1120; U.S. Geological Survey: Reston, VA, USA, 2016; 99p. [CrossRef] [Green Version]
  32. Paxton, E.H.; Theimer, T.C.; Sogge, M.K. Tamarisk Biocontrol Using Tamarisk Beetles: Potential Consequences for Riparian Birds in the Southwestern United States. Condor 2011, 113, 255–265. [Google Scholar] [CrossRef]
  33. Carter, G.A.; Lucas, K.L.; Blossom, G.A.; Lassitter, C.L.; Holiday, D.M.; Mooneyhan, D.S.; Fastring, D.R.; Holcombe, T.R.; Griffith, J.A. Remote Sensing and Mapping of Tamarisk along the Colorado River, USA: A Comparative Use of Summer-Acquired Hyperion, Thematic Mapper and QuickBird Data. Remote. Sens. 2009, 1, 318–329. [Google Scholar] [CrossRef] [Green Version]
  34. Groeneveld, D.P.; Watson, R.P. Near-infrared discrimination of leafless saltcedar in wintertime Landsat TM. Int. J. Remote Sens. 2008, 29, 3577–3588. [Google Scholar] [CrossRef]
  35. Ji, W.; Wang, L. Phenology-guided saltcedar (Tamarix spp.) mapping using Landsat TM images in western U.S. Remote Sens. Environ. 2016, 173, 29–38. [Google Scholar] [CrossRef]
  36. Narumalani, S.; Mishra, D.R.; Burkholder, J.; Merani, P.B.; Willson, G. A Comparative Evaluation of ISODATA and Spectral Angle Mapping for the Detection of Saltcedar Using Airborne Hyperspectral Imagery. Geocarto Int. 2006, 21, 59–66. [Google Scholar] [CrossRef]
  37. Ge, S.; Carruthers, R.; Gong, P.; Herrera, A. Texture Analysis for Mapping Tamarix parviflora Using Aerial Photographs along the Cache Creek, California. Environ. Monit. Assess. 2004, 114, 65–83. [Google Scholar] [CrossRef]
  38. Nagler, P.L.; Pearlstein, S.; Glenn, E.P.; Brown, T.B.; Bateman, H.L.; Bean, D.W.; Hultine, K.R. Rapid dispersal of saltcedar (Tamarix spp.) biocontrol beetles (Diorhabda carinulata) on a desert river detected by phenocams, MODIS imagery and ground observations. Remote. Sens. Environ. 2014, 140, 206–219. [Google Scholar] [CrossRef]
  39. Snyder, K.A.; Scott, R.L.; McGwire, K. Multiple year effects of a biological control agent (Diorhabda carinulata) on Tamarix (saltcedar) ecosystem exchanges of carbon dioxide and water. Agric. For. Meteorol. 2012, 146, 161–169. [Google Scholar] [CrossRef]
  40. Dennison, P.E.; Nagler, P.L.; Hultine, K.R.; Glenn, E.P.; Ehleringer, J.R. Remote monitoring of tamarisk defoliation and evapo-transpiration following saltcedar leaf beetle attack. Remote Sens. Environ. 2009, 113, 1462–1472. [Google Scholar] [CrossRef]
  41. Ji, W.; Wang, L.; Knutson, A.E. Detection of the spatiotemporal patterns of beetle-induced tamarisk ( Tamarix spp.) defoliation along the Lower Rio Grande using Landsat TM images. Remote Sens. Environ. 2017, 193, 76–85. [Google Scholar] [CrossRef]
  42. Durning, L.E.; Sankey, J.B.; Davis, P.A.; Sankey, T.T. Four-Band Image Mosaic of the Colorado River Corridor Downstream of Glen Canyon Dam in Arizona, Derived from the May 2013 Airborne Image Acquisition; U.S. Geological Survey Data Series 1027; U.S. Geological Survey: Reston, VA, USA, 2016. [CrossRef]
  43. Durning, L.E.; Sankey, J.B.; Davis, P.A.; Sankey, T.T. Four Band Image Mosaic of the Colorado River Corridor in Arizona—2013, including Accuracy Assessment Data; U.S. Geological Survey data release; U.S. Geological Survey: Reston, VA, USA, 2016. [CrossRef]
  44. Kruse, F.A.; Lefkoff, A.B.; Boardman, J.B.; Heidebrecht, K.B.; Shapiro, A.T.; Barloon, P.J.; Goetz, A.F.H. The Spectral Image Processing System (SIPS)—Interactive Visualization and Analysis of Imaging spectrometer Data. Remote Sens. Environ. 1993, 44, 145–163. [Google Scholar] [CrossRef]
  45. Durning, L.E.; Sankey, J.B.; Chain, G.R.; Sankey, T.T. Riparian Vegetation Classification of the Colorado River Corridor, Grand Canyon, Arizona, 2013—Data; U.S. Geological Survey data release; U.S. Geological Survey: Reston, VA, USA, 2017. [CrossRef]
  46. Elkind, K.; Sankey, T.T.; Munson, S.M.; Aslan, C.E. Invasive buffelgrass detection using high-resolution satellite and UAV imagery on Google Earth Engine. Remote Sens. Ecol. Conserv. 2019. [Google Scholar] [CrossRef]
  47. Sankey, T.; Dickson, B.; Sesnie, S.; Wang, O.; Olsson, A.; Zachmann, L. WorldView-2 High Spatial Resolution Improves Desert Invasive Plant Detection. Photogramm. Eng. Remote Sens. 2014, 80, 885–893. [Google Scholar] [CrossRef]
  48. Durning, L.E.; Sankey, J.B.; Bedford, A.; Sankey, T.T. Riparian Species Vegetation Classification Data for the Colorado River within Grand Canyon Derived from 2013 Airborne Imagery; U.S. Geological Survey data release; U.S. Geological Survey: Reston, VA, USA, 2018. [CrossRef]
  49. Kasprak, A.; Sankey, J.B.; Butterfield, B.J. Future regulated flows of the Colorado River in Grand Canyon foretell decreased areal extent of sediment and increases in riparian vegetation. Environ. Res. Lett. 2021, 16, 014029. [Google Scholar] [CrossRef]
  50. Butterfield, B.J.; Palmquist, E.; Ralston, B. Hydrological regime and climate interactively shape riparian vegetation composition along the Colorado River, Grand Canyon. Appl. Veg. Sci. 2018, 21, 572–583. [Google Scholar] [CrossRef]
  51. Darrah, A.J.; van Riper, C. Riparian bird density decline in response to biocontrol of Tamarix from riparian ecosystems along the Dolores River in SW Colorado, USA. Biol. Invasions 2018, 20, 709–720. [Google Scholar] [CrossRef]
  52. Harms, R.S.; Hiebert, R.D. Vegetation Response Following Invasive Tamarisk (Tamarix spp.) Removal and Implications for Riparian Restoration. Restor. Ecol. 2006, 14, 461–472. [Google Scholar] [CrossRef]
  53. Ostoja, S.M.; Brooks, M.L.; Dudley, T.; Lee, S.R. Short-Term Vegetation Response Following Mechanical Control of Saltcedar (Tamarix spp.) on the Virgin River, Nevada, USA. Invasive Plant Sci. Manag. 2014, 7, 310–319. [Google Scholar] [CrossRef] [Green Version]
  54. González, E.; Sher, A.A.; Anderson, R.M.; Bay, R.F.; Bean, D.W.; Bissonnete, G.J.; Cooper, D.J.; Dohrenwend, K.; Eichhorst, K.D.; El Waer, H.; et al. Secondary invasions of noxious weeds associated with control of invasive Tamarix are frequent, idiosyncratic and persistent. Biol. Conserv. 2017, 213, 106–114. [Google Scholar] [CrossRef]
  55. González, E.; Shafroth, P.B.; Lee, S.R.; Ostoja, S.M.; Brooks, M.L. Combined effects of biological control of an invasive shrub and fluvial processes on riparian vegetation dynamics. Biol. Invasions 2020, 22, 2339–2356. [Google Scholar] [CrossRef]
  56. O’Neill, M.; Ustin, S.L.; Hager, S.; Root, R. Mapping the distribution of leafy spurge at Theodore Roosevelt National Park using AVIRIS. In Proceedings of the 9th JPL Airborne Earth Science Workshop, Pasadena, CA, USA, 23–25 February 2000. [Google Scholar]
  57. Root, R.R.; Anderson, G.L.; Hager, S.N.; Brown, K.E.; Dudek, K.B.; Kokaly, R.F. Application of advanced remote sensing and modeling techniques for the detection and management of leafy spurge: Challenges and opportunities. In Proceedings of the 57th Annual Meeting of the Society for Range Management, Salt Lake City, UT, USA, 24–30 January 2004; Society for Range Management: Wichita, KS, USA, 2004. [Google Scholar]
  58. Dudek, K.B.; Root, R.R.; Kokaly, R.F.; Anderson, G.L. Increased spatial and temporal consistency of leafy spurge maps from multidate AVIRIS imagery: A hybrid linear spectral mixture analysis/mixture-tuned matched filtering approach. In Proceedings of the 13th JPL Airborne Earth Science Workshop, Pasadena, CA, USA, 31 March–2 April 2004. [Google Scholar]
  59. Williams, A.P.; Hunt, E. Estimation of leafy spurge cover from hyperspectral imagery using mixture tuned matched filtering. Remote. Sens. Environ. 2002, 82, 446–456. [Google Scholar] [CrossRef]
  60. Glenn, N.F.; Mundt, J.T.; Weber, K.T.; Prather, T.S.; Lass, L.W.; Pettingill, J. Hyperspectral data processing for repeat detection of small infestations of leafy spurge. Remote. Sens. Environ. 2005, 95, 3548–3564. [Google Scholar] [CrossRef]
  61. Noujdina, N.V.; Ustin, S.L. Mapping downy brome (Bromis tectorum) using multidate AVIRIS data. Weed Sci. 2008, 56, 173–179. [Google Scholar] [CrossRef]
  62. Mbaabu, P.R.; Ng, W.-T.; Schaffner, U.; Gichaba, M.; Olago, D.; Choge, S.; Oriaso, S.; Eckert, S. Spatial Evolution of Prosopis Invasion and its Effects on LULC and Livelihoods in Baringo, Kenya. Remote. Sens. 2019, 11, 1217. [Google Scholar] [CrossRef] [Green Version]
  63. Malavasi, M.; Barták, V.; Jucker, T.; Acosta, A.T.R.; Carranza, M.L.; Bazzichetto, M. Strength in Numbers: Combining Multi-Source Remotely Sensed Data to Model Plant Invasions in Coastal Dune Ecosystems. Remote. Sens. 2019, 11, 275. [Google Scholar] [CrossRef] [Green Version]
  64. Martin, F.-M.; Müllerová, J.; Borgniet, L.; Dommanget, F.; Breton, V.; Evette, A. Using Single- and Multi-Date UAV and Satellite Imagery to Accurately Monitor Invasive Knotweed Species. Remote. Sens. 2018, 10, 1662. [Google Scholar] [CrossRef] [Green Version]
  65. Bransky, N.D.; Sankey, T.T.; Sankey, J.B. Northern Tamarisk Beetle Impact and Classification Maps, Grand Canyon National Park, Arizona; U.S. Geological Survey data release; U.S. Geological Survey: Reston, VA, USA, 2021. [CrossRef]
Figure 1. Map of the study area in the Grand Canyon National Park, including the WorldView-2 image extent. Elevation map courtesy of the U.S. Geological Survey National Elevation Dataset.
Remotesensing 13 00958 g001
Figure 2. Defoliated tamarisk at river km 312, river north (Panel A), and tamarisk stand with ~90% canopy dieback at river km 330.4, river north (Panel B).
Remotesensing 13 00958 g002
Figure 3. Ground-based hyperspectral training spectra for the four tamarisk classes, spectrally subset from the ASD Fieldspec 3 spectroradiometer to match the WorldView-2 spectral resolution.
Remotesensing 13 00958 g003
Figure 4. Ground-based estimates of tamarisk defoliation by river km along the Colorado River. River km starts at 0 from Lees Ferry upstream. In June and July, data were not collected downstream of river km 357.6.
Remotesensing 13 00958 g004
Figure 5. Ground-based estimates of tamarisk canopy dieback by river km along the Colorado River. River km 0 starts at Lees Ferry upstream.
Remotesensing 13 00958 g005
Figure 6. Subset of Bedford et al. [13,14] 2009–2013 change detection (A), WorldView-2 2019 SAM classification with healthy tamarisk and beetle-impacted classes (B) and corresponding change detection map (C). In Panel C, “Canopy Dieback” represents healthy tamarisk in the Bedford et al. [13,14] map that had experienced canopy dieback in the 2019 WorldView-2 map, and “Recovery” represents defoliated tamarisk in the Bedford et al. [13,14] map that regrew into healthy tamarisk by 2019.
Remotesensing 13 00958 g006
Figure 7. All change detection results that were observed from 2009 to 2013 to May 2019 to August 2019 (summarized in Section 3.2).
Remotesensing 13 00958 g007
Table 1. Average angle used in radians and degrees for each training class for SAM classification.
SAM Classification Angles
MayAugust
ClassRadiansDegreesRadiansDegrees
Bare Ground0.20411.6980.21312.175
Healthy Tamarisk0.29111.5550.23313.321
Mixed Healthy Leaf and Canopy Dieback Tamarisk0.0915.2040.2076.112
Canopy Dieback0.9543.1040.0502.865
Defoliated Tamarisk0.0693.9400.1005.730
Table 2. Tamarisk classification accuracies in the May, 2019 WorldView-2 map.
Observed Healthy TamariskObserved Canopy DiebackObserved Defoliated TamariskTotalUser’s Accuracy
Classified Healthy Tamarisk501316478.1%
Classified Canopy Dieback73203982.1%
Classified Defoliated Tamarisk0022100.0%
Total57453105
Producer’s Accuracy87.7%71.1%66.7%
Overall Accuracy 80.0%
Table 3. Tamarisk classification accuracies in the August, 2019 WorldView-2 map.
Observed Healthy TamariskObserved Defoliated TamariskTotalUser’s Accuracy
Classified Healthy Tamarisk1372065.0%
Classified Defoliated Tamarisk4414591.1%
Total174865
Producer’s Accuracy76.5%85.4%
Overall Accuracy 83.1%
Publisher’s Note: MDPI stays neutral with regard to jurisdictional claims in published maps and institutional affiliations.

