
Dynamic Cooling Effects of Permanent Urban Green Spaces in Beijing, China

 , , , ,
Abstract
:
1. Introduction
2. Materials and Methods
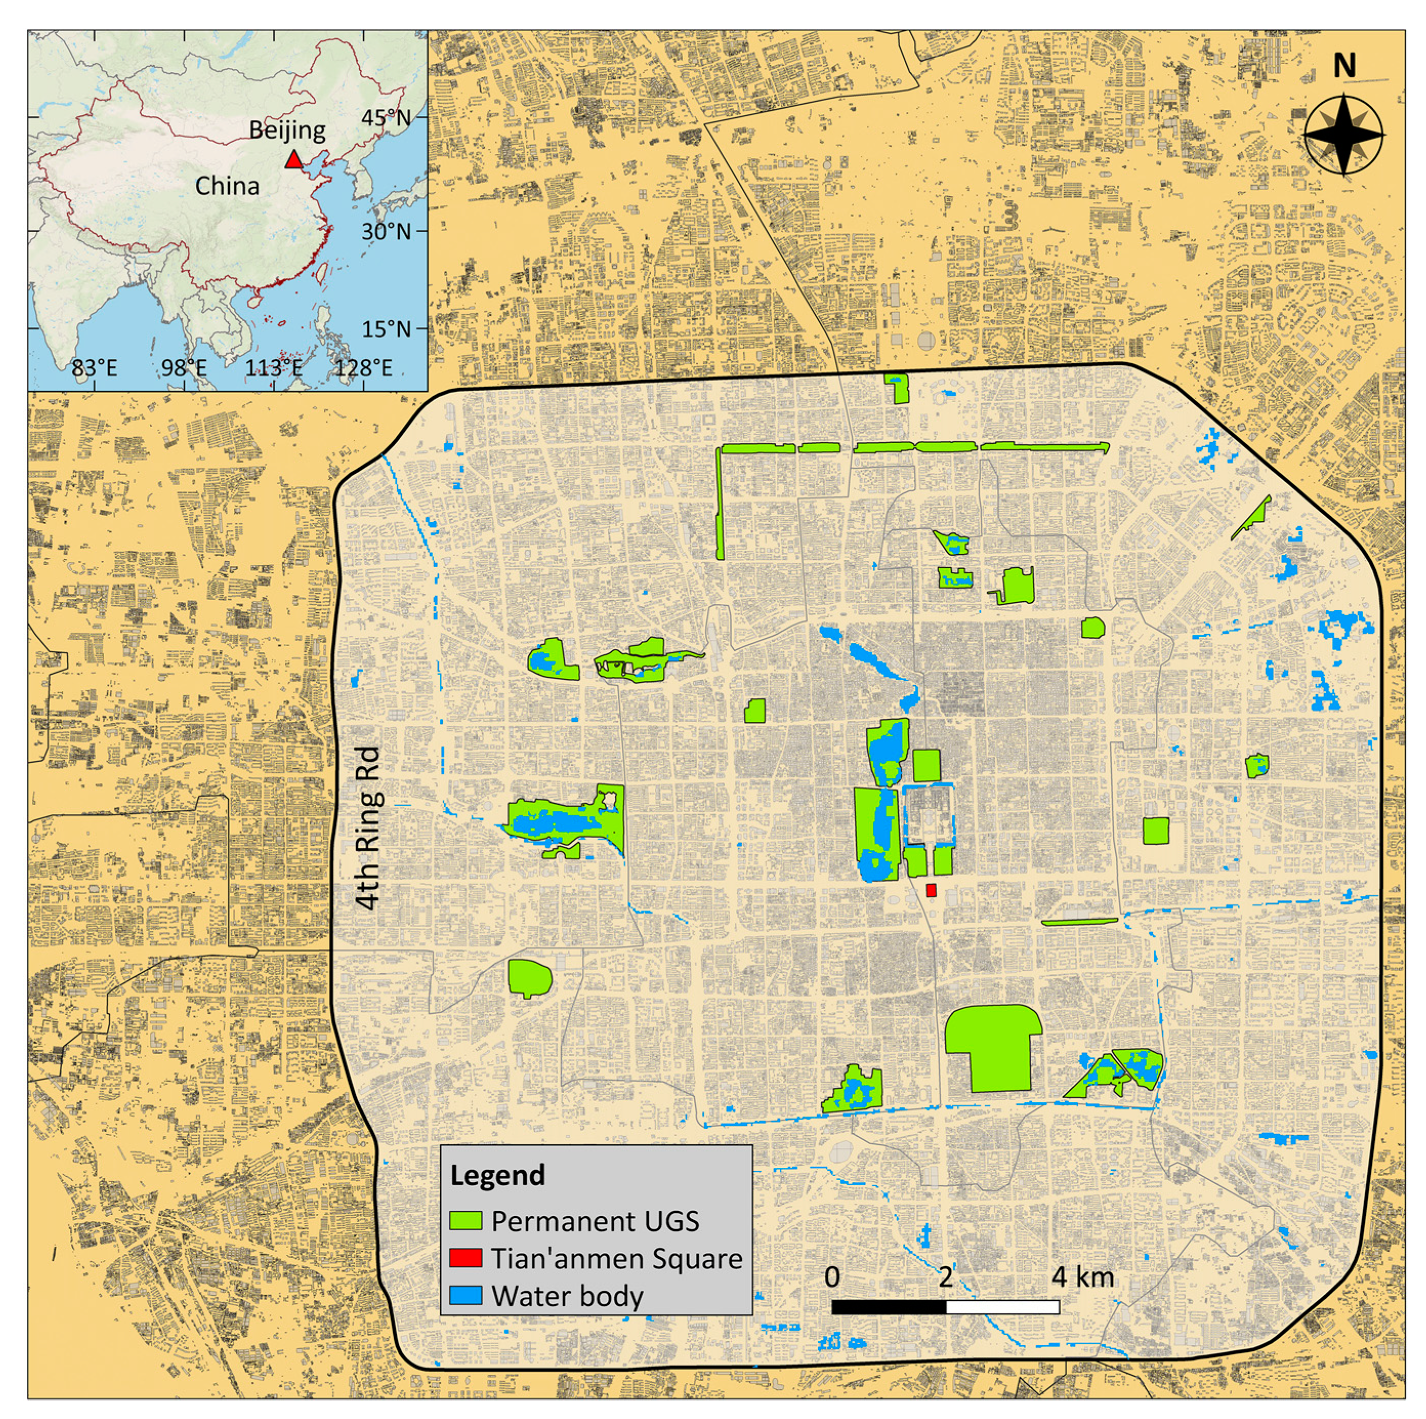
2.1. Study Area
2.2. Overall Workflow
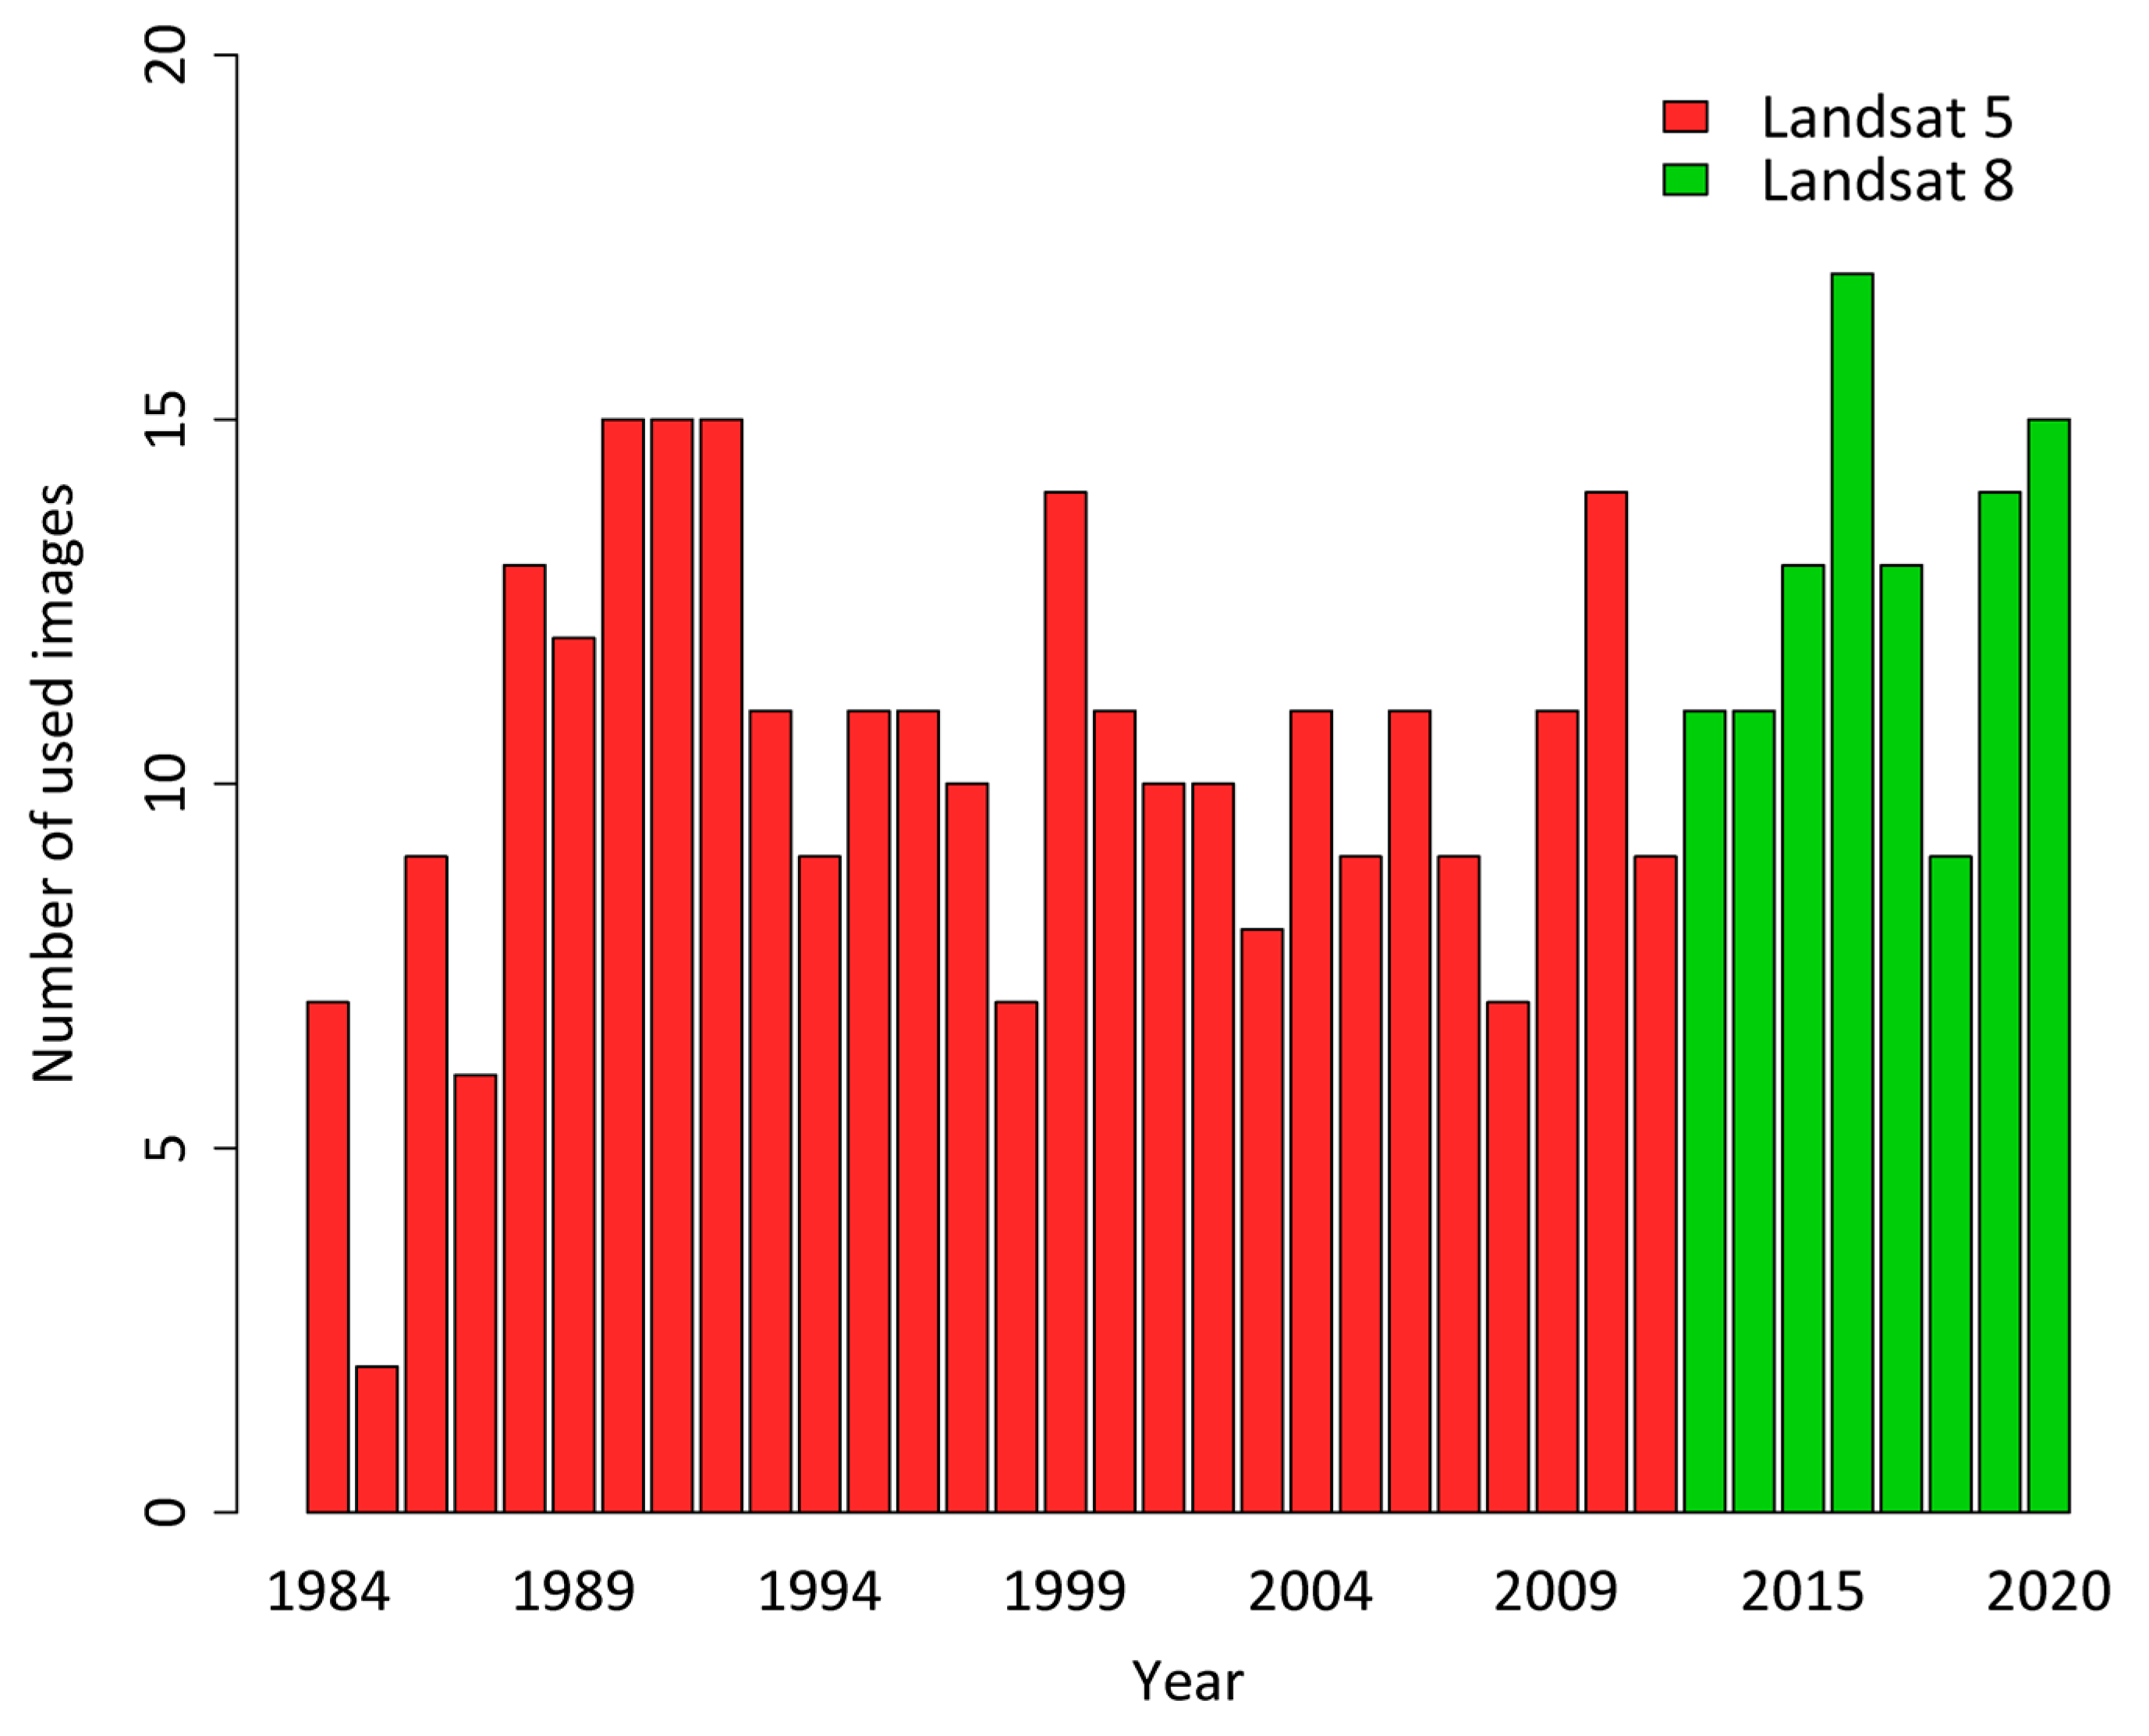
2.3. Landsat Surface Reflectance Collection
2.4. Landsat-Based Surface Parameter Retrieval
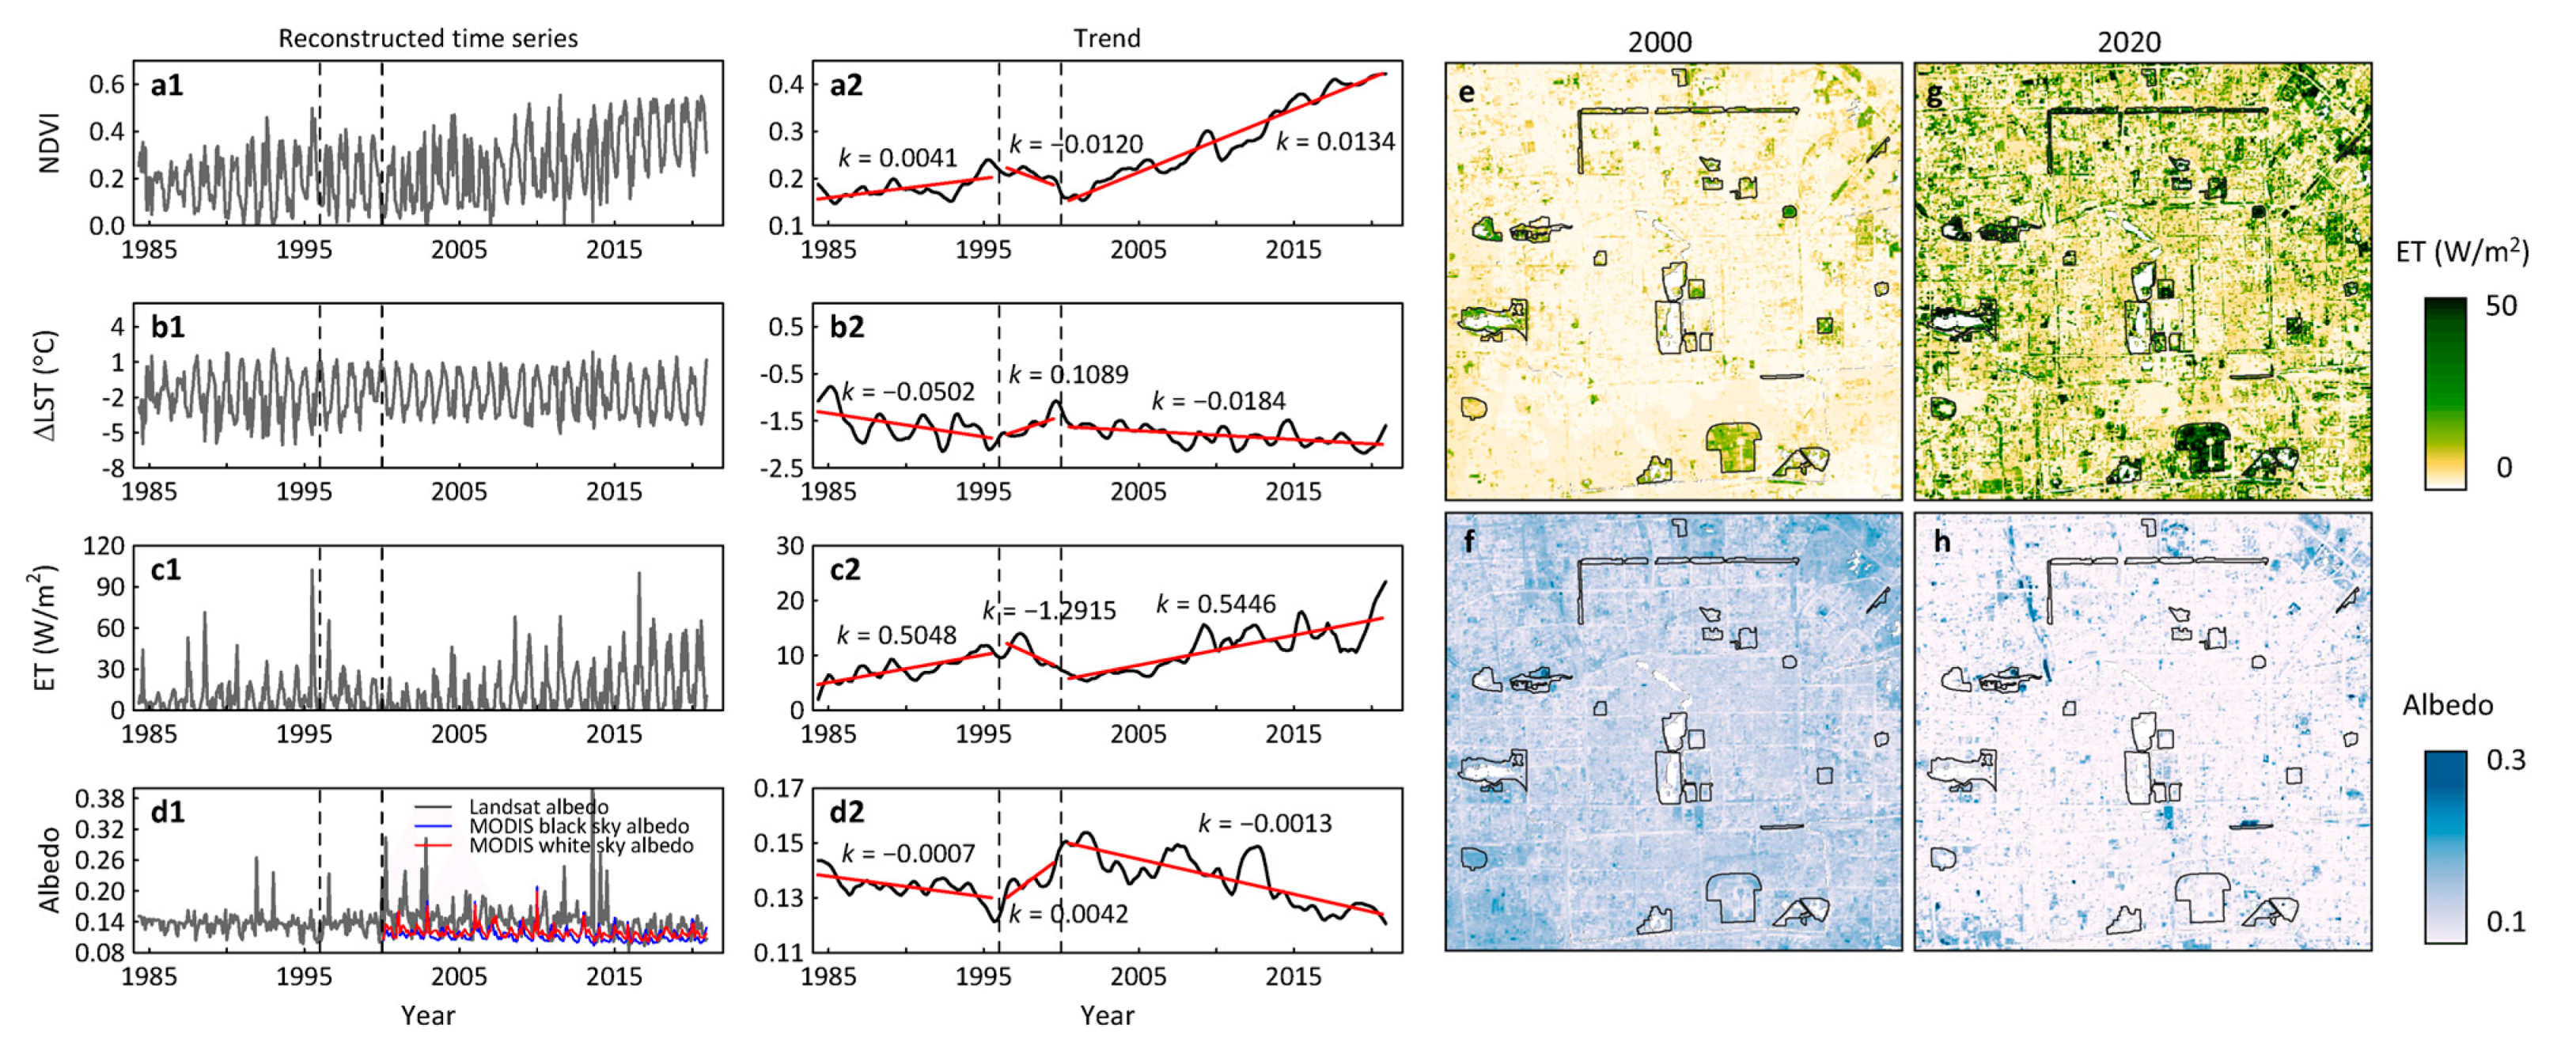
2.4.1. Normalized Difference Vegetation Index
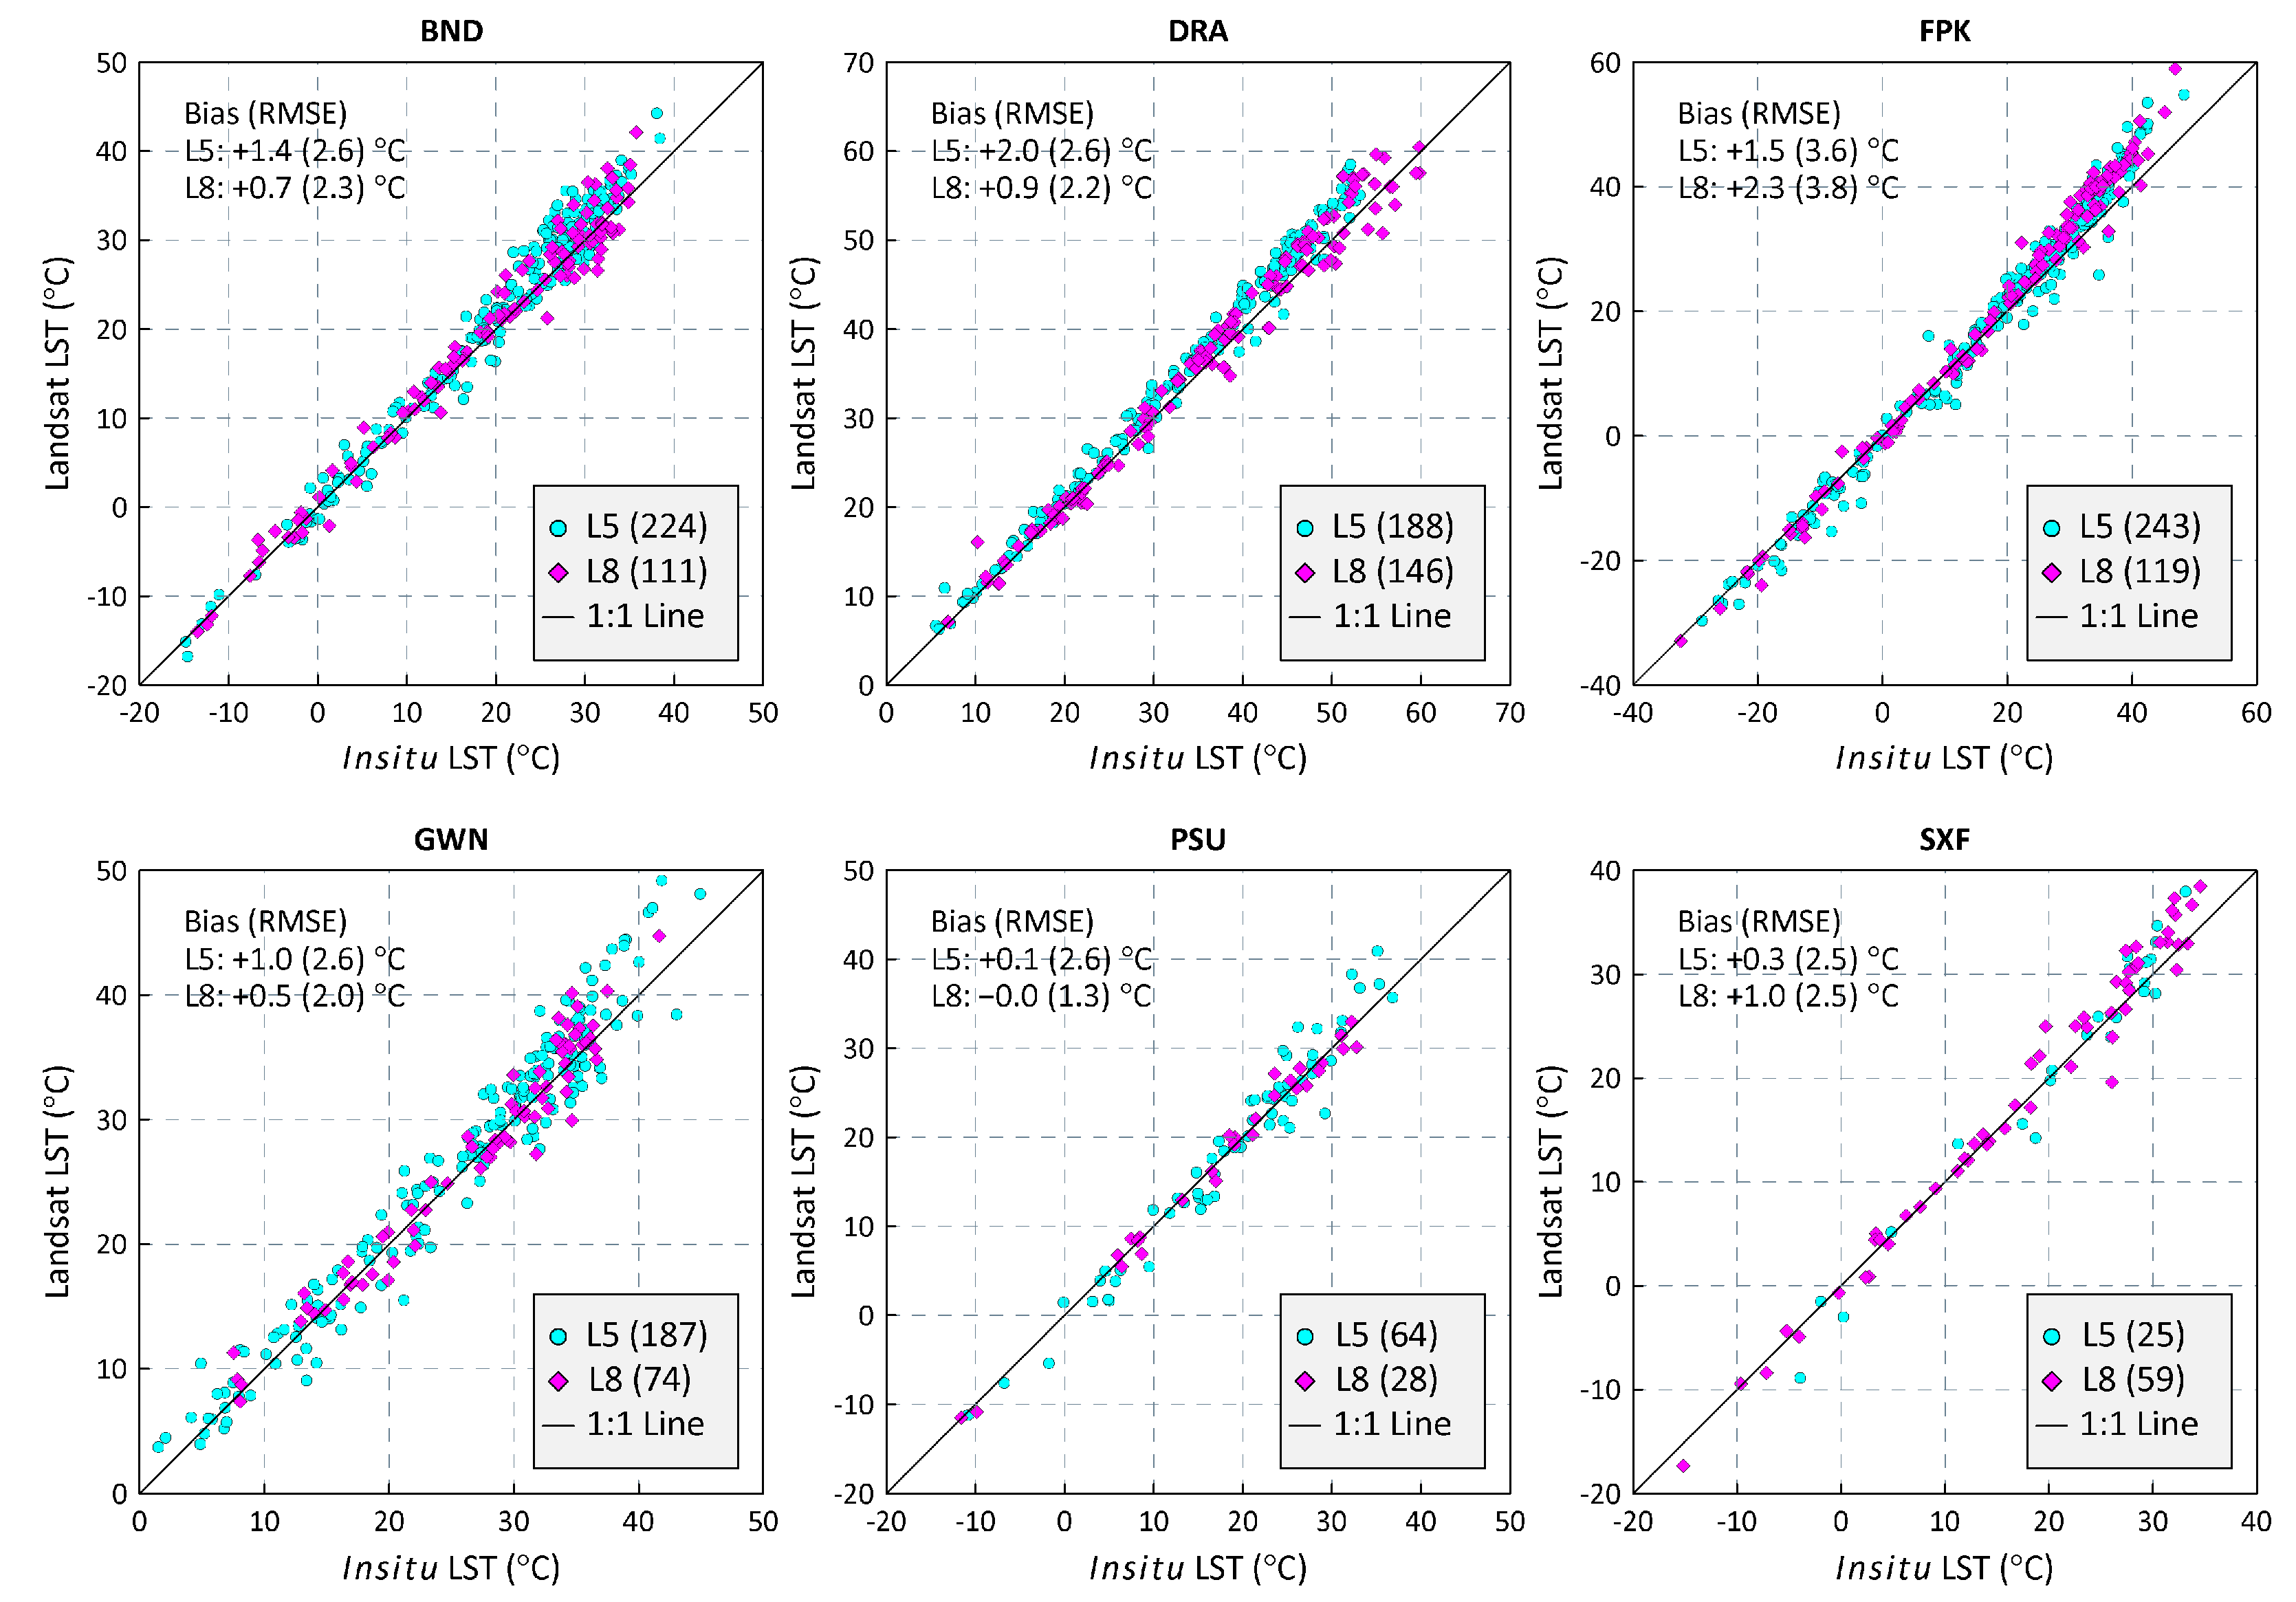
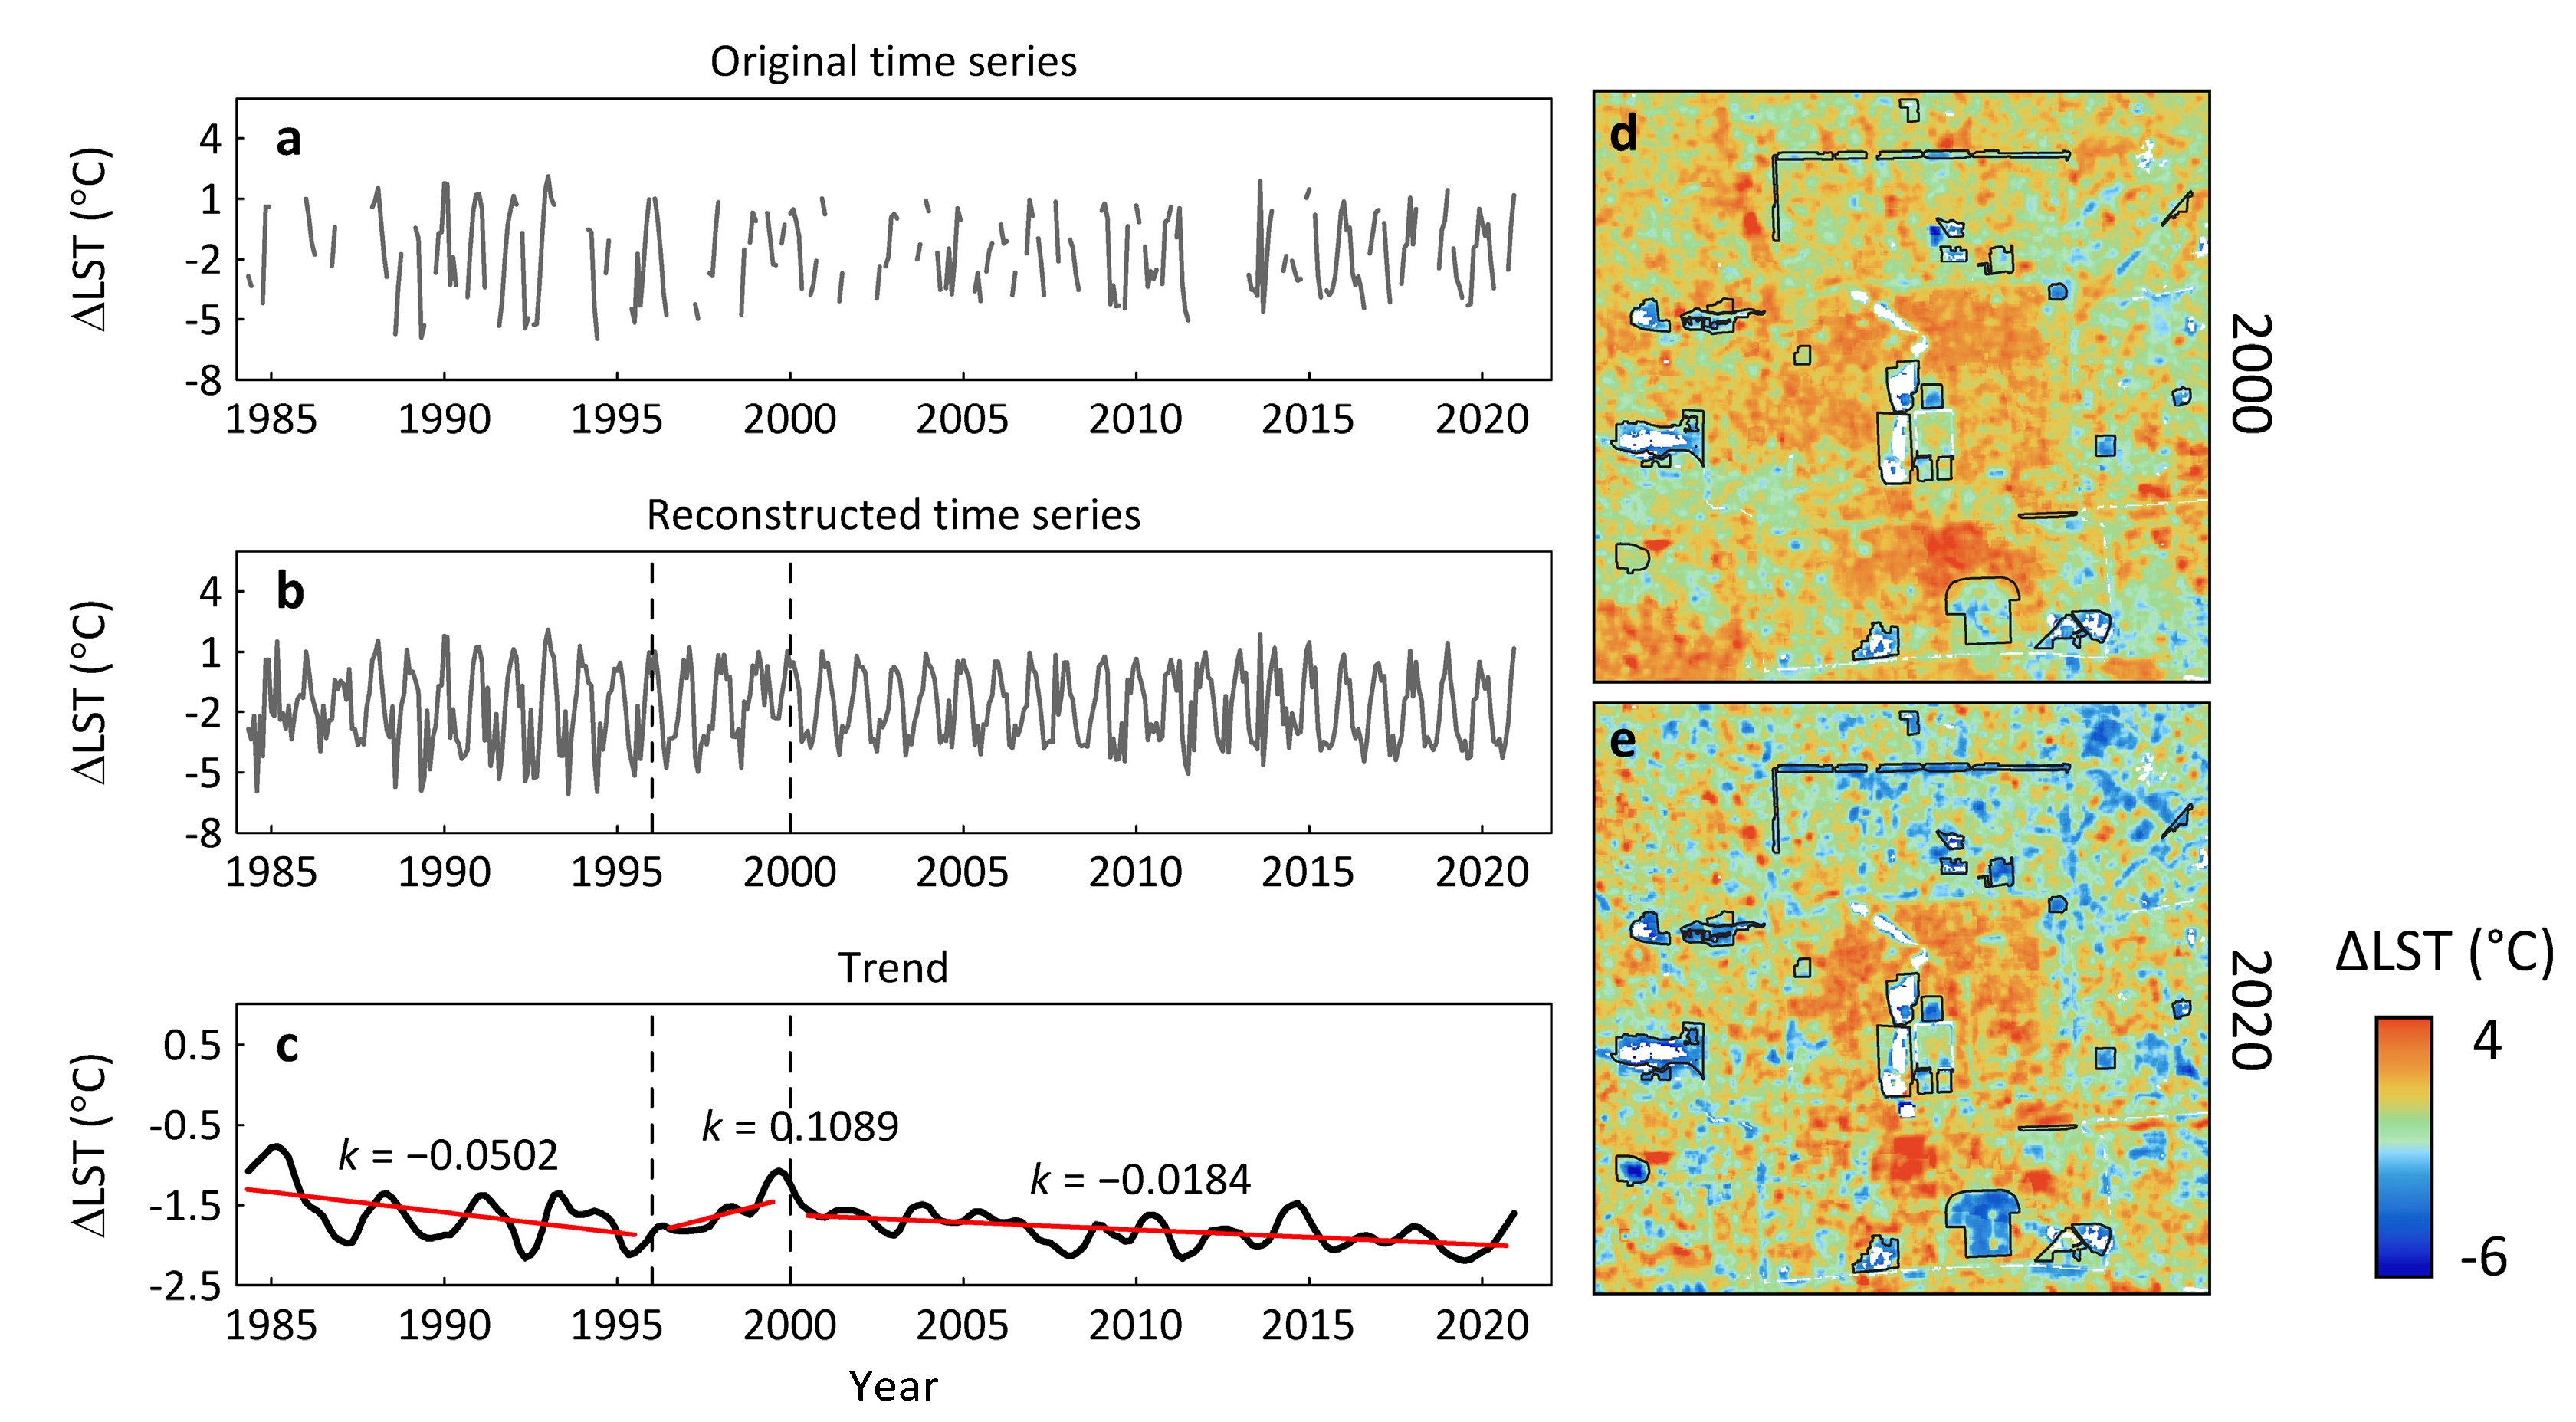
2.4.2. Land Surface Temperature
2.4.3. Evapotranspiration
2.4.4. Albedo
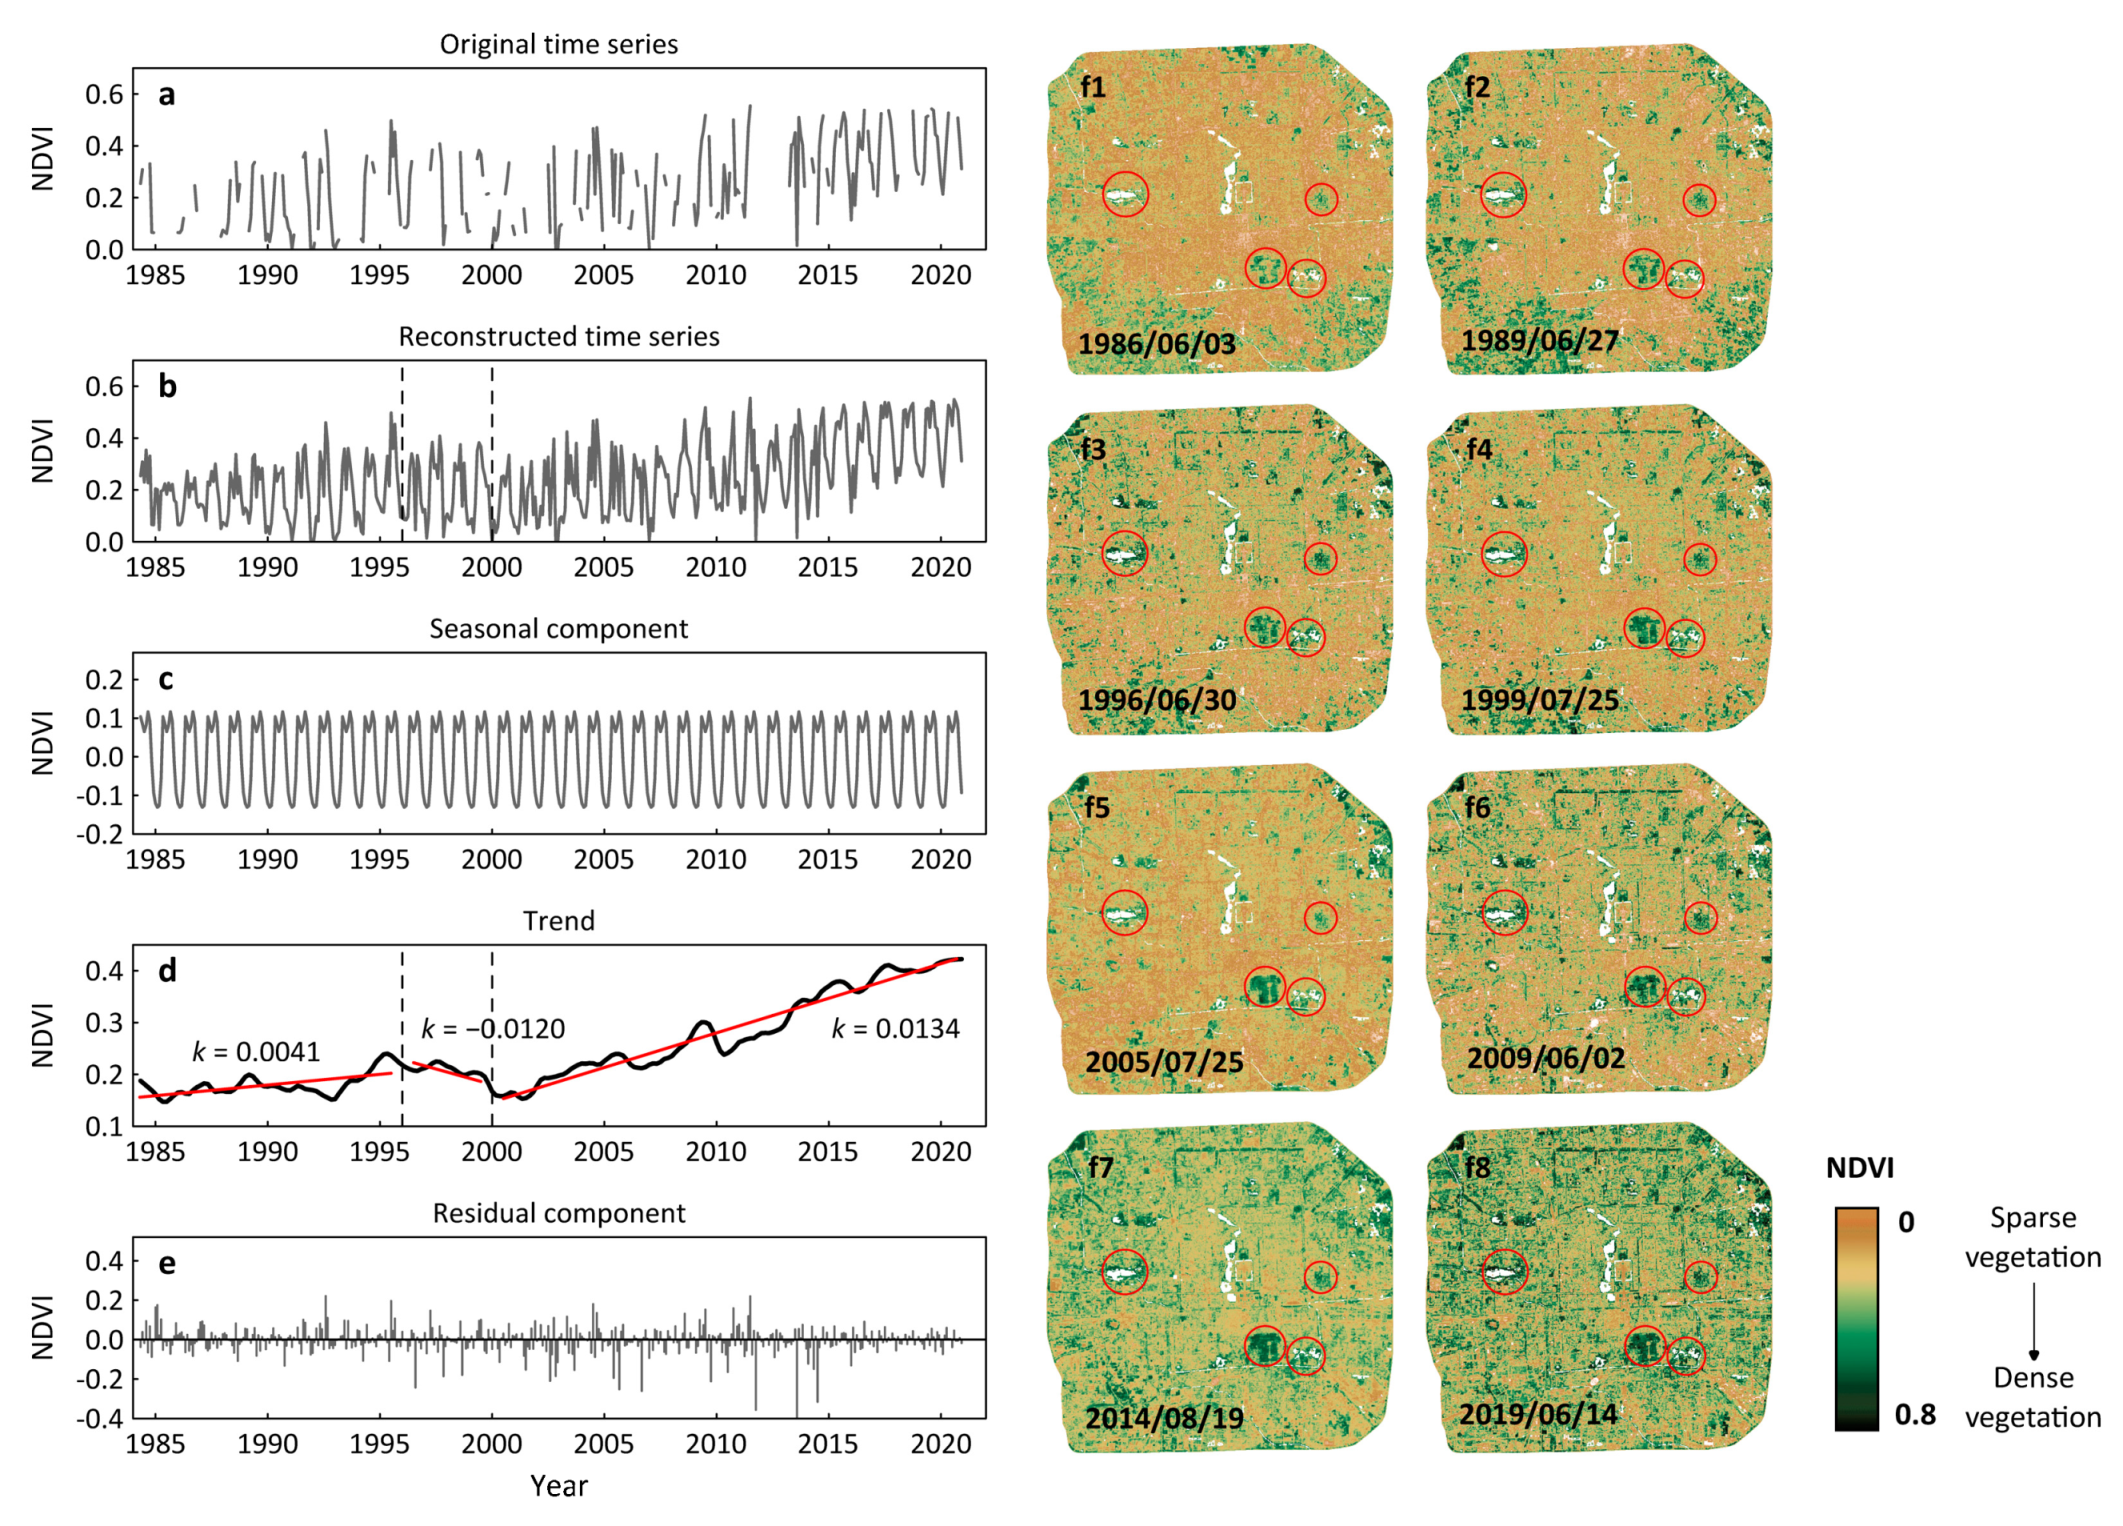
2.5. Surface-Cooling Dynamics and Time Series Analysis
3. Results
3.1. Greenness Dynamics
3.2. Responses of Urban Green Space Surface Cooling to Greening
3.3. Biophysical Mechanisms
4. Discussion
4.1. Greening of Urban Green Spaces
4.2. The Necessity of Dynamic Monitoring of Urban Green Space Cooling Effects
4.3. Limitations and Future Work
5. Conclusions
Author Contributions
Funding
Institutional Review Board Statement
Informed Consent Statement
Data Availability Statement
Acknowledgments
Conflicts of Interest
Appendix A

| Image Id | Date | Path | Row |
|---|---|---|---|
| LT05_L1TP_123032_19840512_20170220_01_T1 | 12 May 1984 | 123 | 32 |
| LT05_L1TP_123032_19840629_20170220_01_T1 | 29 June 1984 | 123 | 32 |
| LT05_L1TP_123032_19840816_20170220_01_T1 | 16 August 1984 | 123 | 32 |
| LT05_L1TP_123032_19841003_20170220_01_T1 | 3 October 1984 | 123 | 32 |
| LT05_L1TP_123032_19841019_20170220_01_T1 | 19 October 1984 | 123 | 32 |
| LT05_L1TP_123032_19841120_20170220_01_T1 | 20 November 1984 | 123 | 32 |
| LT05_L1TP_123032_19841222_20170219_01_T1 | 22 December 1984 | 123 | 32 |
| LT05_L1TP_123032_19850312_20170219_01_T1 | 12 March 1985 | 123 | 32 |
| LT05_L1TP_123032_19851022_20170218_01_T1 | 22 October 1985 | 123 | 32 |
| LT05_L1TP_123032_19860110_20170218_01_T1 | 10 January 1986 | 123 | 32 |
| LT05_L1TP_123032_19860227_20170218_01_T1 | 27 February 1986 | 123 | 32 |
| LT05_L1TP_123032_19860315_20170218_01_T1 | 15 March 1986 | 123 | 32 |
| LT05_L1TP_123032_19860331_20170218_01_T1 | 31 March 1986 | 123 | 32 |
| LT05_L1TP_123032_19860416_20170221_01_T1 | 16 April 1986 | 123 | 32 |
| LT05_L1TP_123032_19860603_20170221_01_T1 | 3 June 1986 | 123 | 32 |
| LT05_L1TP_123032_19861025_20170221_01_T1 | 25 October 1986 | 123 | 32 |
| LT05_L1TP_123032_19861110_20170221_01_T1 | 10 November 1986 | 123 | 32 |
| LT05_L1TP_123032_19861126_20170221_01_T1 | 26 November 1986 | 123 | 32 |
| LT05_L1TP_123032_19870403_20170213_01_T1 | 3 April 1987 | 123 | 32 |
| LT05_L1TP_123032_19870708_20170212_01_T1 | 8 July 1987 | 123 | 32 |
| LT05_L1TP_123032_19870910_20170211_01_T1 | 10 September 1987 | 123 | 32 |
| LT05_L1TP_123032_19870926_20170418_01_T1 | 26 September 1987 | 123 | 32 |
| LT05_L1TP_123032_19871215_20170210_01_T1 | 15 December 1987 | 123 | 32 |
| LT05_L1TP_123032_19871231_20170418_01_T1 | 31 December 1987 | 123 | 32 |
| LT05_L1TP_123032_19880116_20170221_01_T1 | 16 January 1988 | 123 | 32 |
| LT05_L1TP_123032_19880201_20170209_01_T1 | 1 February 1988 | 123 | 32 |
| LT05_L1TP_123032_19880217_20170209_01_T1 | 17 February 1988 | 123 | 32 |
| LT05_L1TP_123032_19880304_20170209_01_T1 | 4 March 1988 | 123 | 32 |
| LT05_L1TP_123032_19880405_20170209_01_T1 | 5 April 1988 | 123 | 32 |
| LT05_L1TP_123032_19880421_20170221_01_T1 | 21 April 1988 | 123 | 32 |
| LT05_L1TP_123032_19880507_20170221_01_T1 | 7 May 1988 | 123 | 32 |
| LT05_L1TP_123032_19880811_20170207_01_T1 | 11 August 1988 | 123 | 32 |
| LT05_L1TP_123032_19880928_20170205_01_T1 | 28 September 1988 | 123 | 32 |
| LT05_L1TP_123032_19881014_20170206_01_T1 | 14 October 1988 | 123 | 32 |
| LT05_L1TP_123032_19881030_20170221_01_T1 | 30 October 1988 | 123 | 32 |
| LT05_L1TP_123032_19881201_20170205_01_T1 | 1 December 1988 | 123 | 32 |
| LT05_L1TP_123032_19881217_20170205_01_T1 | 17 December 1988 | 123 | 32 |
| LT05_L1TP_123032_19890307_20170204_01_T1 | 7 March 1989 | 123 | 32 |
| LT05_L1TP_123032_19890408_20170204_01_T1 | 8 April 1989 | 123 | 32 |
| LT05_L1TP_123032_19890526_20170203_01_T1 | 26 May 1989 | 123 | 32 |
| LT05_L1TP_123032_19890627_20170202_01_T1 | 27 June 1989 | 123 | 32 |
| LT05_L1TP_123032_19890814_20170202_01_T1 | 14 August 1989 | 123 | 32 |
| LT05_L1TP_123032_19890830_20170214_01_T1 | 30 August 1989 | 123 | 32 |
| LT05_L1TP_123032_19891001_20170214_01_T1 | 1 October 1989 | 123 | 32 |
| LT05_L1TP_123032_19891017_20170201_01_T1 | 17 October 1989 | 123 | 32 |
| LT05_L1TP_123032_19891102_20170201_01_T1 | 2 November 1989 | 123 | 32 |
| LT05_L1TP_123032_19891118_20170201_01_T1 | 18 November 1989 | 123 | 32 |
| LT05_L1TP_123032_19891204_20170201_01_T1 | 4 December 1989 | 123 | 32 |
| LT05_L1TP_123032_19891220_20170201_01_T1 | 20 December 1989 | 123 | 32 |
| LT05_L1TP_123032_19900105_20170201_01_T1 | 5 January 1990 | 123 | 32 |
| LT05_L1TP_123032_19900121_20170214_01_T1 | 21 January 1990 | 123 | 32 |
| LT05_L1TP_123032_19900206_20170131_01_T1 | 6 February 1990 | 123 | 32 |
| LT05_L1TP_123032_19900326_20170131_01_T1 | 26 March 1990 | 123 | 32 |
| LT05_L1TP_123032_19900427_20170131_01_T1 | 27 April 1990 | 123 | 32 |
| LT05_L1TP_123032_19900513_20170214_01_T1 | 13 May 1990 | 123 | 32 |
| LT05_L1TP_123032_19900529_20170131_01_T1 | 29 May 1990 | 123 | 32 |
| LT05_L1TP_123032_19900614_20170129_01_T1 | 14 June 1990 | 123 | 32 |
| LT05_L1TP_123032_19900716_20170129_01_T1 | 16 July 1990 | 123 | 32 |
| LT05_L1TP_123032_19900902_20170129_01_T1 | 2 September 1990 | 123 | 32 |
| LT05_L1TP_123032_19900918_20170129_01_T1 | 18 September 1990 | 123 | 32 |
| LT05_L1TP_123032_19901020_20170129_01_T1 | 20 October 1990 | 123 | 32 |
| LT05_L1TP_123032_19901121_20180620_01_T1 | 21 November 1990 | 123 | 32 |
| LT05_L1TP_123032_19901207_20170128_01_T1 | 7 December 1990 | 123 | 32 |
| LT05_L1TP_123032_19901223_20170214_01_T1 | 23 December 1990 | 123 | 32 |
| LT05_L1TP_123032_19910108_20170128_01_T1 | January 8, 1991 | 123 | 32 |
| LT05_L1TP_123032_19910124_20170128_01_T1 | 24 January 1991 | 123 | 32 |
| LT05_L1TP_123032_19910225_20170127_01_T1 | 25 February 1991 | 123 | 32 |
| LT05_L1TP_123032_19910313_20170127_01_T1 | 13 March 1991 | 123 | 32 |
| LT05_L1TP_123032_19910329_20170127_01_T1 | 29 March 1991 | 123 | 32 |
| LT05_L1TP_123032_19910516_20170127_01_T1 | 16 May 1991 | 123 | 32 |
| LT05_L1TP_123032_19910617_20170126_01_T1 | 17 June 1991 | 123 | 32 |
| LT05_L1TP_123032_19910804_20170125_01_T1 | 4 August 1991 | 123 | 32 |
| LT05_L1TP_123032_19910905_20170125_01_T1 | 5 September 1991 | 123 | 32 |
| LT05_L1TP_123032_19910921_20170125_01_T1 | 21 September 1991 | 123 | 32 |
| LT05_L1TP_123032_19911007_20180619_01_T1 | 7 October 1991 | 123 | 32 |
| LT05_L1TP_123032_19911023_20170125_01_T1 | 23 October 1991 | 123 | 32 |
| LT05_L1TP_123032_19911108_20170125_01_T1 | 8 November 1991 | 123 | 32 |
| LT05_L1TP_123032_19911124_20170125_01_T1 | 24 November 1991 | 123 | 32 |
| LT05_L1TP_123032_19911210_20170124_01_T1 | 10 December 1991 | 123 | 32 |
| LT05_L1TP_123032_19920127_20170123_01_T1 | 27 January 1992 | 123 | 32 |
| LT05_L1TP_123032_19920212_20170123_01_T1 | 12 February 1992 | 123 | 32 |
| LT05_L1TP_123032_19920228_20170124_01_T1 | 28 February 1992 | 123 | 32 |
| LT05_L1TP_123032_19920416_20170123_01_T1 | 16 April 1992 | 123 | 32 |
| LT05_L1TP_123032_19920518_20170122_01_T1 | 18 May 1992 | 123 | 32 |
| LT05_L1TP_123032_19920603_20170124_01_T1 | 3 June 1992 | 123 | 32 |
| LT05_L1TP_123032_19920619_20170123_01_T1 | 19 June 1992 | 123 | 32 |
| LT05_L1TP_123032_19920822_20170214_01_T1 | 22 August 1992 | 123 | 32 |
| LT05_L1TP_123032_19920907_20170122_01_T1 | 7 September 1992 | 123 | 32 |
| LT05_L1TP_123032_19921009_20170214_01_T1 | 9 October 1992 | 123 | 32 |
| LT05_L1TP_123032_19921025_20170214_01_T1 | 25 October 1992 | 123 | 32 |
| LT05_L1TP_123032_19921110_20170214_01_T1 | 10 November 1992 | 123 | 32 |
| LT05_L1TP_123032_19921126_20170121_01_T1 | 26 November 1992 | 123 | 32 |
| LT05_L1TP_123032_19921212_20170214_01_T1 | 12 December 1992 | 123 | 32 |
| LT05_L1TP_123032_19921228_20170121_01_T1 | 28 December 1992 | 123 | 32 |
| LT05_L1TP_123032_19930113_20170120_01_T1 | 13 January 1993 | 123 | 32 |
| LT05_L1TP_123032_19930129_20170120_01_T1 | 29 January 1993 | 123 | 32 |
| LT05_L1TP_123032_19930214_20170120_01_T1 | 14 February 1993 | 123 | 32 |
| LT05_L1TP_123032_19930302_20170120_01_T1 | 2 March 1993 | 123 | 32 |
| LT05_L1TP_123032_19930318_20170119_01_T1 | 18 March 1993 | 123 | 32 |
| LT05_L1TP_123032_19930606_20170118_01_T1 | 6 June 1993 | 123 | 32 |
| LT05_L1TP_123032_19930622_20170118_01_T1 | 22 June 1993 | 123 | 32 |
| LT05_L1TP_123032_19930809_20180620_01_T1 | 9 August 1993 | 123 | 32 |
| LT05_L1TP_123032_19930825_20170117_01_T1 | 25 August 1993 | 123 | 32 |
| LT05_L1TP_123032_19931215_20170116_01_T1 | 15 December 1993 | 123 | 32 |
| LT05_L1TP_123032_19931231_20170117_01_T1 | 31 December 1993 | 123 | 32 |
| LT05_L1TP_123032_19940321_20170114_01_T1 | 21 March 1994 | 123 | 32 |
| LT05_L1TP_123032_19940406_20180619_01_T1 | 6 April 1994 | 123 | 32 |
| LT05_L1TP_123032_19940508_20170114_01_T1 | 8 May 1994 | 123 | 32 |
| LT05_L1TP_123032_19940609_20170113_01_T1 | 9 June 1994 | 123 | 32 |
| LT05_L1TP_123032_19940913_20170112_01_T1 | 13 September 1994 | 123 | 32 |
| LT05_L1TP_123032_19940929_20170112_01_T1 | 29 September 1994 | 123 | 32 |
| LT05_L1TP_123032_19941031_20170112_01_T1 | 31 October 1994 | 123 | 32 |
| LT05_L1TP_123032_19941202_20170110_01_T1 | 2 December 1994 | 123 | 32 |
| LT05_L1TP_123032_19941218_20170110_01_T1 | 18 December 1994 | 123 | 32 |
| LT05_L1TP_123032_19950409_20170108_01_T1 | 9 April 1995 | 123 | 32 |
| LT05_L1TP_123032_19950425_20170108_01_T1 | 25 April 1995 | 123 | 32 |
| LT05_L1TP_123032_19950612_20170107_01_T1 | 12 June 1995 | 123 | 32 |
| LT05_L1TP_123032_19950628_20170107_01_T1 | 28 June 1995 | 123 | 32 |
| LT05_L1TP_123032_19950730_20170107_01_T1 | 30 July 1995 | 123 | 32 |
| LT05_L1TP_123032_19950815_20170107_01_T1 | 15 August 1995 | 123 | 32 |
| LT05_L1TP_123032_19950916_20170107_01_T1 | 16 September 1995 | 123 | 32 |
| LT05_L1TP_123032_19951018_20170107_01_T1 | 18 October 1995 | 123 | 32 |
| LT05_L1TP_123032_19951119_20170107_01_T1 | 19 November 1995 | 123 | 32 |
| LT05_L1TP_123032_19951205_20170106_01_T1 | 5 December 1995 | 123 | 32 |
| LT05_L1TP_123032_19951221_20170106_01_T1 | 21 December 1995 | 123 | 32 |
| LT05_L1TP_123032_19960207_20170106_01_T1 | 7 February 1996 | 123 | 32 |
| LT05_L1TP_123032_19960223_20170106_01_T1 | 23 February 1996 | 123 | 32 |
| LT05_L1TP_123032_19960310_20170105_01_T1 | 10 March 1996 | 123 | 32 |
| LT05_L1TP_123032_19960326_20170105_01_T1 | 26 March 1996 | 123 | 32 |
| LT05_L1TP_123032_19960411_20170105_01_T1 | 11 April 1996 | 123 | 32 |
| LT05_L1TP_123032_19960427_20170105_01_T1 | 27 April 1996 | 123 | 32 |
| LT05_L1TP_123032_19960513_20170104_01_T1 | 13 May 1996 | 123 | 32 |
| LT05_L1TP_123032_19960529_20170104_01_T1 | 29 May 1996 | 123 | 32 |
| LT05_L1TP_123032_19960614_20170104_01_T1 | 14 June 1996 | 123 | 32 |
| LT05_L1TP_123032_19960630_20170104_01_T1 | 30 June 1996 | 123 | 32 |
| LT05_L1TP_123032_19960817_20180620_01_T1 | 17 August 1996 | 123 | 32 |
| LT05_L1TP_123032_19970209_20180620_01_T1 | 9 February 1997 | 123 | 32 |
| LT05_L1TP_123032_19970430_20161231_01_T1 | 30 April 1997 | 123 | 32 |
| LT05_L1TP_123032_19970516_20161231_01_T1 | 16 May 1997 | 123 | 32 |
| LT05_L1TP_123032_19970804_20161230_01_T1 | 4 August 1997 | 123 | 32 |
| LT05_L1TP_123032_19970921_20161229_01_T1 | 21 September 1997 | 123 | 32 |
| LT05_L1TP_123032_19971007_20180620_01_T1 | 7 October 1997 | 123 | 32 |
| LT05_L1TP_123032_19971023_20161229_01_T1 | 23 October 1997 | 123 | 32 |
| LT05_L1TP_123032_19971108_20161229_01_T1 | 8 November 1997 | 123 | 32 |
| LT05_L1TP_123032_19971210_20161228_01_T1 | 10 December 1997 | 123 | 32 |
| LT05_L1TP_123032_19971226_20161228_01_T1 | 26 December 1997 | 123 | 32 |
| LT05_L1TP_123032_19980417_20161225_01_T1 | 17 April 1998 | 123 | 32 |
| LT05_L1TP_123032_19980823_20161223_01_T1 | 23 August 1998 | 123 | 32 |
| LT05_L1TP_123032_19980924_20161221_01_T1 | 24 September 1998 | 123 | 32 |
| LT05_L1TP_123032_19981111_20161220_01_T1 | 11 November 1998 | 123 | 32 |
| LT05_L1TP_123032_19981127_20161222_01_T1 | 27 November 1998 | 123 | 32 |
| LT05_L1TP_123032_19981213_20161220_01_T1 | 13 December 1998 | 123 | 32 |
| LT05_L1TP_123032_19981229_20161222_01_T1 | 29 December 1998 | 123 | 32 |
| LT05_L1TP_123032_19990114_20161219_01_T1 | 14 January 1999 | 123 | 32 |
| LT05_L1TP_123032_19990130_20161219_01_T1 | 30 January 1999 | 123 | 32 |
| LT05_L1TP_123032_19990303_20161220_01_T1 | 3 March 1999 | 123 | 32 |
| LT05_L1TP_123032_19990506_20161218_01_T1 | 6 May 1999 | 123 | 32 |
| LT05_L1TP_123032_19990607_20161217_01_T1 | 7 June 1999 | 123 | 32 |
| LT05_L1TP_123032_19990623_20161217_01_T1 | 23 June 1999 | 123 | 32 |
| LT05_L1TP_123032_19990709_20161217_01_T1 | 9 July 1999 | 123 | 32 |
| LT05_L1TP_123032_19990725_20161219_01_T1 | 25 July 1999 | 123 | 32 |
| LT05_L1TP_123032_19990810_20161216_01_T1 | 10 August 1999 | 123 | 32 |
| LT05_L1TP_123032_19990826_20161216_01_T1 | 26 August 1999 | 123 | 32 |
| LT05_L1TP_123032_19991013_20161216_01_T1 | 13 October 1999 | 123 | 32 |
| LT05_L1TP_123032_19991029_20161216_01_T1 | 29 October 1999 | 123 | 32 |
| LT05_L1TP_123032_19991114_20180620_01_T1 | 14 November 1999 | 123 | 32 |
| LT05_L1TP_123032_19991130_20161216_01_T1 | 30 November 1999 | 123 | 32 |
| LT05_L1TP_123032_20000117_20161215_01_T1 | 17 January 2000 | 123 | 32 |
| LT05_L1TP_123032_20000202_20161216_01_T1 | 2 February 2000 | 123 | 32 |
| LT05_L1TP_123032_20000305_20161215_01_T1 | 5 March 2000 | 123 | 32 |
| LT05_L1TP_123032_20000321_20161214_01_T1 | 21 March 2000 | 123 | 32 |
| LT05_L1TP_123032_20000406_20161214_01_T1 | 6 April 2000 | 123 | 32 |
| LT05_L1TP_123032_20000524_20161214_01_T1 | 24 May 2000 | 123 | 32 |
| LT05_L1TP_123032_20000828_20161213_01_T1 | 28 August 2000 | 123 | 32 |
| LT05_L1TP_123032_20000913_20161214_01_T1 | 13 September 2000 | 123 | 32 |
| LT05_L1TP_123032_20000929_20161213_01_T1 | 29 September 2000 | 123 | 32 |
| LT05_L1TP_123032_20001031_20161213_01_T1 | 31 October 2000 | 123 | 32 |
| LT05_L1TP_123032_20001218_20161212_01_T1 | 18 December 2000 | 123 | 32 |
| LT05_L1TP_123032_20010103_20161212_01_T1 | 3 January 2001 | 123 | 32 |
| LT05_L1TP_123032_20010119_20161212_01_T1 | 19 January 2001 | 123 | 32 |
| LT05_L1TP_123032_20010324_20161212_01_T1 | 24 March 2001 | 123 | 32 |
| LT05_L1TP_123032_20010628_20161211_01_T1 | 28 June 2001 | 123 | 32 |
| LT05_L1TP_123032_20010730_20161210_01_T1 | 30 July 2001 | 123 | 32 |
| LT05_L1TP_123032_20010831_20161210_01_T1 | 31 August 2001 | 123 | 32 |
| LT05_L1TP_123032_20011018_20161209_01_T1 | 18 October 2001 | 123 | 32 |
| LT05_L1TP_123032_20011103_20161209_01_T1 | 3 November 2001 | 123 | 32 |
| LT05_L1TP_123032_20011119_20161210_01_T1 | 19 November 2001 | 123 | 32 |
| LT05_L1TP_123032_20011221_20161210_01_T1 | 21 December 2001 | 123 | 32 |
| LT05_L1TP_123032_20020122_20161209_01_T1 | 22 January 2002 | 123 | 32 |
| LT05_L1TP_123032_20020207_20161209_01_T1 | 7 February 2002 | 123 | 32 |
| LT05_L1TP_123032_20020223_20161208_01_T1 | 23 February 2002 | 123 | 32 |
| LT05_L1TP_123032_20020311_20161209_01_T1 | 11 March 2002 | 123 | 32 |
| LT05_L1TP_123032_20020717_20161207_01_T1 | 17 July 2002 | 123 | 32 |
| LT05_L1TP_123032_20020802_20161207_01_T1 | 2 August 2002 | 123 | 32 |
| LT05_L1TP_123032_20020818_20161207_01_T1 | 18 August 2002 | 123 | 32 |
| LT05_L1TP_123032_20021005_20161206_01_T1 | 5 October 2002 | 123 | 32 |
| LT05_L1TP_123032_20021106_20161206_01_T1 | 6 November 2002 | 123 | 32 |
| LT05_L1TP_123032_20021208_20161207_01_T1 | 8 December 2002 | 123 | 32 |
| LT05_L1TP_123032_20030109_20161206_01_T1 | 9 January 2003 | 123 | 32 |
| LT05_L1TP_123032_20030210_20161206_01_T1 | 10 February 2003 | 123 | 32 |
| LT05_L1TP_123032_20030226_20161206_01_T1 | 26 February 2003 | 123 | 32 |
| LT05_L1TP_123032_20030517_20161206_01_T1 | 17 May 2003 | 123 | 32 |
| LT05_L1TP_123032_20030922_20161204_01_T1 | 22 September 2003 | 123 | 32 |
| LT05_L1TP_123032_20031024_20161204_01_T1 | 24 October 2003 | 123 | 32 |
| LT05_L1TP_123032_20031211_20161204_01_T1 | 11 December 2003 | 123 | 32 |
| LT05_L1TP_123032_20031227_20161203_01_T1 | 27 December 2003 | 123 | 32 |
| LT05_L1TP_123032_20040112_20161202_01_T1 | 12 January 2004 | 123 | 32 |
| LT05_L1TP_123032_20040128_20161203_01_T1 | 28 January 2004 | 123 | 32 |
| LT05_L1TP_123032_20040401_20161203_01_T1 | 1 April 2004 | 123 | 32 |
| LT05_L1TP_123032_20040519_20161201_01_T1 | 19 May 2004 | 123 | 32 |
| LT05_L1TP_123032_20040706_20161130_01_T1 | 6 July 2004 | 123 | 32 |
| LT05_L1TP_123032_20040823_20161129_01_T1 | 23 August 2004 | 123 | 32 |
| LT05_L1TP_123032_20040908_20161129_01_T1 | 8 September 2004 | 123 | 32 |
| LT05_L1TP_123032_20041026_20161128_01_T1 | 26 October 2004 | 123 | 32 |
| LT05_L1TP_123032_20041127_20161128_01_T1 | 27 November 2004 | 123 | 32 |
| LT05_L1TP_123032_20041213_20161127_01_T1 | 13 December 2004 | 123 | 32 |
| LT05_L1TP_123032_20041229_20161129_01_T1 | 29 December 2004 | 123 | 32 |
| LT05_L1TP_123032_20050319_20161128_01_T1 | 19 March 2005 | 123 | 32 |
| LT05_L1TP_123032_20050522_20161127_01_T1 | 22 May 2005 | 123 | 32 |
| LT05_L1TP_123032_20050607_20161125_01_T1 | 7 June 2005 | 123 | 32 |
| LT05_L1TP_123032_20050709_20161125_01_T1 | 9 July 2005 | 123 | 32 |
| LT05_L1TP_123032_20050725_20161125_01_T1 | 25 July 2005 | 123 | 32 |
| LT05_L1TP_123032_20050911_20161124_01_T1 | 11 September 2005 | 123 | 32 |
| LT05_L1TP_123032_20050927_20161124_01_T1 | 27 September 2005 | 123 | 32 |
| LT05_L1TP_123032_20051029_20161123_01_T1 | 29 October 2005 | 123 | 32 |
| LT05_L1TP_123032_20051114_20161124_01_T1 | 14 November 2005 | 123 | 32 |
| LT05_L1TP_123032_20060202_20161123_01_T1 | 2 February 2006 | 123 | 32 |
| LT05_L1TP_123032_20060218_20161123_01_T1 | 18 February 2006 | 123 | 32 |
| LT05_L1TP_123032_20060306_20161123_01_T1 | 6 March 2006 | 123 | 32 |
| LT05_L1TP_123032_20060407_20161123_01_T1 | 7 April 2006 | 123 | 32 |
| LT05_L1TP_123032_20060610_20161121_01_T1 | 10 June 2006 | 123 | 32 |
| LT05_L1TP_123032_20060626_20161121_01_T1 | 26 June 2006 | 123 | 32 |
| LT05_L1TP_123032_20060712_20161120_01_T1 | 12 July 2006 | 123 | 32 |
| LT05_L1TP_123032_20060930_20161119_01_T1 | 30 September 2006 | 123 | 32 |
| LT05_L1TP_123032_20061101_20161118_01_T1 | 1 November 2006 | 123 | 32 |
| LT05_L1TP_123032_20061203_20161118_01_T1 | 3 December 2006 | 123 | 32 |
| LT05_L1TP_123032_20061219_20161118_01_T1 | 19 December 2006 | 123 | 32 |
| LT05_L1TP_123032_20070104_20161117_01_T1 | 4 January 2007 | 123 | 32 |
| LT05_L1TP_123032_20070120_20161117_01_T1 | 20 January 2007 | 123 | 32 |
| LT05_L1TP_123032_20070309_20161116_01_T1 | 9 March 2007 | 123 | 32 |
| LT05_L1TP_123032_20070410_20161115_01_T1 | 10 April 2007 | 123 | 32 |
| LT05_L1TP_123032_20070426_20161115_01_T1 | 26 April 2007 | 123 | 32 |
| LT05_L1TP_123032_20070512_20161115_01_T1 | 12 May 2007 | 123 | 32 |
| LT05_L1TP_123032_20070528_20161114_01_T1 | 28 May 2007 | 123 | 32 |
| LT05_L1TP_123032_20070901_20161113_01_T1 | 1 September 2007 | 123 | 32 |
| LT05_L1TP_123032_20071003_20161110_01_T1 | 3 October 2007 | 123 | 32 |
| LT05_L1TP_123032_20080208_20161101_01_T1 | 8 February 2008 | 123 | 32 |
| LT05_L1TP_123032_20080327_20161101_01_T1 | 27 March 2008 | 123 | 32 |
| LT05_L1TP_123032_20080428_20161101_01_T1 | 28 April 2008 | 123 | 32 |
| LT05_L1TP_123032_20080514_20161031_01_T1 | 14 May 2008 | 123 | 32 |
| LT05_L1TP_123032_20080530_20161031_01_T1 | 30 May 2008 | 123 | 32 |
| LT05_L1TP_123032_20080802_20161030_01_T1 | 2 August 2008 | 123 | 32 |
| LT05_L1TP_123032_20080818_20170613_01_T1 | 18 August 2008 | 123 | 32 |
| LT05_L1TP_123032_20090125_20161029_01_T1 | 25 January 2009 | 123 | 32 |
| LT05_L1TP_123032_20090210_20161028_01_T1 | 10 February 2009 | 123 | 32 |
| LT05_L1TP_123032_20090226_20161027_01_T1 | 26 February 2009 | 123 | 32 |
| LT05_L1TP_123032_20090314_20161027_01_T1 | 14 March 2009 | 123 | 32 |
| LT05_L1TP_123032_20090330_20161027_01_T1 | 30 March 2009 | 123 | 32 |
| LT05_L1TP_123032_20090415_20161027_01_T1 | 15 April 2009 | 123 | 32 |
| LT05_L1TP_123032_20090517_20161026_01_T1 | 17 May 2009 | 123 | 32 |
| LT05_L1TP_123032_20090602_20161025_01_T1 | 2 June 2009 | 123 | 32 |
| LT05_L1TP_123032_20090720_20161027_01_T1 | 20 July 2009 | 123 | 32 |
| LT05_L1TP_123032_20090922_20161020_01_T1 | 22 September 2009 | 123 | 32 |
| LT05_L1TP_123032_20091024_20161024_01_T1 | 24 October 2009 | 123 | 32 |
| LT05_L1TP_123032_20100128_20161017_01_T1 | 28 January 2010 | 123 | 32 |
| LT05_L1TP_123032_20100213_20161016_01_T1 | 13 February 2010 | 123 | 32 |
| LT05_L1TP_123032_20100317_20161016_01_T1 | 17 March 2010 | 123 | 32 |
| LT05_L1TP_123032_20100402_20161016_01_T1 | 2 April 2010 | 123 | 32 |
| LT05_L1TP_123032_20100418_20161015_01_T1 | 18 April 2010 | 123 | 32 |
| LT05_L1TP_123032_20100504_20161015_01_T1 | 4 May 2010 | 123 | 32 |
| LT05_L1TP_123032_20100520_20161015_01_T1 | 20 May 2010 | 123 | 32 |
| LT05_L1TP_123032_20100605_20161015_01_T1 | 5 June 2010 | 123 | 32 |
| LT05_L1TP_123032_20100723_20161014_01_T1 | 23 July 2010 | 123 | 32 |
| LT05_L1TP_123032_20100808_20161014_01_T1 | 8 August 2010 | 123 | 32 |
| LT05_L1TP_123032_20100824_20161014_01_T1 | 24 August 2010 | 123 | 32 |
| LT05_L1TP_123032_20101011_20161012_01_T1 | 11 October 2010 | 123 | 32 |
| LT05_L1TP_123032_20101128_20161012_01_T1 | 28 November 2010 | 123 | 32 |
| LT05_L1TP_123032_20101214_20161011_01_T1 | 14 December 2010 | 123 | 32 |
| LT05_L1TP_123032_20110115_20161010_01_T1 | 15 January 2011 | 123 | 32 |
| LT05_L1TP_123032_20110131_20161010_01_T1 | 31 January 2011 | 123 | 32 |
| LT05_L1TP_123032_20110304_20161210_01_T1 | 4 March 2011 | 123 | 32 |
| LT05_L1TP_123032_20110405_20161208_01_T1 | 5 April 2011 | 123 | 32 |
| LT05_L1TP_123032_20110507_20161009_01_T1 | 7 May 2011 | 123 | 32 |
| LT05_L1TP_123032_20110523_20161010_01_T1 | 23 May 2011 | 123 | 32 |
| LT05_L1TP_123032_20110608_20161009_01_T1 | 8 June 2011 | 123 | 32 |
| LT05_L1TP_123032_20110726_20161007_01_T1 | 26 July 2011 | 123 | 32 |
| LT05_L1TP_123032_20111030_20161005_01_T1 | 30 October 2011 | 123 | 32 |
| LC08_L1TP_124032_20130410_20200913_02_T1 | 10 April 2013 | 124 | 32 |
| LC08_L1TP_123032_20130512_20200912_02_T1 | 12 May 2013 | 123 | 32 |
| LC08_L1TP_123032_20130613_20200912_02_T1 | 13 June 2013 | 123 | 32 |
| LC08_L1TP_123032_20130731_20200912_02_T1 | 31 July 2013 | 123 | 32 |
| LC08_L1TP_123032_20130816_20200912_02_T1 | 16 August 2013 | 123 | 32 |
| LC08_L1TP_123032_20130901_20200912_02_T1 | 1 September 2013 | 123 | 32 |
| LC08_L1TP_123032_20131003_20200913_02_T1 | 3 October 2013 | 123 | 32 |
| LC08_L1TP_123032_20131104_20200912_02_T1 | 4 November 2013 | 123 | 32 |
| LC08_L1TP_123032_20131120_20200912_02_T1 | 20 November 2013 | 123 | 32 |
| LC08_L1TP_123032_20131206_20200912_02_T1 | 6 December 2013 | 123 | 32 |
| LC08_L1TP_123032_20131222_20200912_02_T1 | 22 December 2013 | 123 | 32 |
| LC08_L1TP_123032_20140208_20200912_02_T1 | 8 February 2014 | 123 | 32 |
| LC08_L1TP_123032_20140413_20200911_02_T1 | 13 April 2014 | 123 | 32 |
| LC08_L1TP_123032_20140429_20200911_02_T1 | 29 April 2014 | 123 | 32 |
| LC08_L1TP_123032_20140515_20200911_02_T1 | 15 May 2014 | 123 | 32 |
| LC08_L1TP_123032_20140718_20200911_02_T1 | 18 July 2014 | 123 | 32 |
| LC08_L1TP_123032_20140803_20200911_02_T1 | 3 August 2014 | 123 | 32 |
| LC08_L1TP_123032_20140819_20200911_02_T1 | 19 August 2014 | 123 | 32 |
| LC08_L1TP_123032_20140904_20200911_02_T1 | 4 September 2014 | 123 | 32 |
| LC08_L1TP_123032_20140920_20200910_02_T1 | 20 September 2014 | 123 | 32 |
| LC08_L1TP_123032_20141006_20200910_02_T1 | 6 October 2014 | 123 | 32 |
| LC08_L1TP_123032_20141225_20200910_02_T1 | 25 December 2014 | 123 | 32 |
| LC08_L1TP_123032_20150110_20200910_02_T1 | 10 January 2015 | 123 | 32 |
| LC08_L1TP_123032_20150315_20200909_02_T1 | 15 March 2015 | 123 | 32 |
| LC08_L1TP_123032_20150416_20200909_02_T1 | 16 April 2015 | 123 | 32 |
| LC08_L1TP_123032_20150502_20200909_02_T1 | 2 May 2015 | 123 | 32 |
| LC08_L1TP_123032_20150518_20200909_02_T1 | 18 May 2015 | 123 | 32 |
| LC08_L1TP_123032_20150705_20200909_02_T1 | 5 July 2015 | 123 | 32 |
| LC08_L1TP_123032_20150806_20200908_02_T1 | 6 August 2015 | 123 | 32 |
| LC08_L1TP_123032_20150822_20200908_02_T1 | 22 August 2015 | 123 | 32 |
| LC08_L1TP_123032_20150907_20200908_02_T1 | 7 September 2015 | 123 | 32 |
| LC08_L1TP_123032_20150923_20200908_02_T1 | 23 September 2015 | 123 | 32 |
| LC08_L1TP_123032_20151009_20200908_02_T1 | 9 October 2015 | 123 | 32 |
| LC08_L1TP_123032_20151126_20200908_02_T1 | 26 November 2015 | 123 | 32 |
| LC08_L1TP_123032_20151228_20200908_02_T1 | 28 December 2015 | 123 | 32 |
| LC08_L1TP_123032_20160129_20200907_02_T1 | 29 January 2016 | 123 | 32 |
| LC08_L1TP_123032_20160214_20200907_02_T1 | 14 February 2016 | 123 | 32 |
| LC08_L1TP_123032_20160301_20200907_02_T1 | 1 March 2016 | 123 | 32 |
| LC08_L1TP_123032_20160317_20200907_02_T1 | 17 March 2016 | 123 | 32 |
| LC08_L1TP_123032_20160402_20200907_02_T1 | 2 April 2016 | 123 | 32 |
| LC08_L1TP_123032_20160418_20200907_02_T1 | 18 April 2016 | 123 | 32 |
| LC08_L1TP_123032_20160504_20200907_02_T1 | 4 May 2016 | 123 | 32 |
| LC08_L1TP_123032_20160520_20200907_02_T1 | 20 May 2016 | 123 | 32 |
| LC08_L1TP_123032_20160605_20200906_02_T1 | 5 June 2016 | 123 | 32 |
| LC08_L1TP_123032_20160621_20200906_02_T1 | 21 June 2016 | 123 | 32 |
| LC08_L1TP_123032_20160707_20200906_02_T1 | 7 July 2016 | 123 | 32 |
| LC08_L1TP_123032_20160808_20200906_02_T1 | 8 August 2016 | 123 | 32 |
| LC08_L1TP_123032_20160909_20200906_02_T1 | 9 September 2016 | 123 | 32 |
| LC08_L1TP_123032_20161011_20200905_02_T1 | 11 October 2016 | 123 | 32 |
| LC08_L1TP_123032_20161112_20200905_02_T1 | 12 November 2016 | 123 | 32 |
| LC08_L1TP_123032_20161128_20200905_02_T1 | 28 November 2016 | 123 | 32 |
| LC08_L1TP_123032_20161214_20200905_02_T1 | 14 December 2016 | 123 | 32 |
| LC08_L1TP_123032_20170131_20200905_02_T1 | 31 January 2017 | 123 | 32 |
| LC08_L1TP_123032_20170304_20200905_02_T1 | 4 March 2017 | 123 | 32 |
| LC08_L1TP_123032_20170405_20200904_02_T1 | 5 April 2017 | 123 | 32 |
| LC08_L1TP_123032_20170421_20200904_02_T1 | 21 April 2017 | 123 | 32 |
| LC08_L1TP_123032_20170507_20200904_02_T1 | 7 May 2017 | 123 | 32 |
| LC08_L1TP_123032_20170523_20200903_02_T1 | 23 May 2017 | 123 | 32 |
| LC08_L1TP_123032_20170710_20200903_02_T1 | 10 July 2017 | 123 | 32 |
| LC08_L1TP_123032_20170912_20200903_02_T1 | 12 September 2017 | 123 | 32 |
| LC08_L1TP_123032_20170928_20200903_02_T1 | 28 September 2017 | 123 | 32 |
| LC08_L1TP_123032_20171030_20200902_02_T1 | 30 October 2017 | 123 | 32 |
| LC08_L1TP_123032_20171115_20200902_02_T1 | 15 November 2017 | 123 | 32 |
| LC08_L1TP_123032_20171201_20200902_02_T1 | 1 December 2017 | 123 | 32 |
| LC08_L1TP_123032_20171217_20200902_02_T1 | 17 December 2017 | 123 | 32 |
| LC08_L1TP_123032_20180102_20200902_02_T1 | 2 January 2018 | 123 | 32 |
| LC08_L1TP_123032_20180203_20200902_02_T1 | 3 February 2018 | 123 | 32 |
| LC08_L1TP_123032_20180408_20201015_02_T1 | 8 April 2018 | 123 | 32 |
| LC08_L1TP_123032_20180627_20200831_02_T1 | 27 June 2018 | 123 | 32 |
| LC08_L1TP_123032_20181001_20200830_02_T1 | 1 October 2018 | 123 | 32 |
| LC08_L1TP_123032_20181017_20200830_02_T1 | 17 October 2018 | 123 | 32 |
| LC08_L1TP_123032_20181102_20200830_02_T1 | 2 November 2018 | 123 | 32 |
| LC08_L1TP_123032_20181118_20200830_02_T1 | 18 November 2018 | 123 | 32 |
| LC08_L1TP_123032_20181204_20200830_02_T1 | 4 December 2018 | 123 | 32 |
| LC08_L1TP_123032_20190121_20200829_02_T1 | 21 January 2019 | 123 | 32 |
| LC08_L1TP_123032_20190326_20200829_02_T1 | 26 March 2019 | 123 | 32 |
| LC08_L1TP_123032_20190411_20200829_02_T1 | 11 April 2019 | 123 | 32 |
| LC08_L1TP_123032_20190513_20200828_02_T1 | 13 May 2019 | 123 | 32 |
| LC08_L1TP_123032_20190529_20200828_02_T1 | 29 May 2019 | 123 | 32 |
| LC08_L1TP_123032_20190614_20200828_02_T1 | 14 June 2019 | 123 | 32 |
| LC08_L1TP_123032_20190630_20200827_02_T1 | 30 June 2019 | 123 | 32 |
| LC08_L1TP_123032_20190817_20200827_02_T1 | 17 August 2019 | 123 | 32 |
| LC08_L1TP_123032_20190902_20200826_02_T1 | 2 September 2019 | 123 | 32 |
| LC08_L1TP_123032_20190918_20200826_02_T1 | 18 September 2019 | 123 | 32 |
| LC08_L1TP_123032_20191020_20200825_02_T1 | 20 October 2019 | 123 | 32 |
| LC08_L1TP_123032_20191105_20200825_02_T1 | 5 November 2019 | 123 | 32 |
| LC08_L1TP_123032_20191207_20200824_02_T1 | 7 December 2019 | 123 | 32 |
| LC08_L1TP_123032_20191223_20200824_02_T1 | 23 December 2019 | 123 | 32 |
| LC08_L1TP_123032_20200108_20200823_02_T1 | 8 January 2020 | 123 | 32 |
| LC08_L1TP_123032_20200124_20200823_02_T1 | 24 January 2020 | 123 | 32 |
| LC08_L1TP_123032_20200209_20200823_02_T1 | 9 February 2020 | 123 | 32 |
| LC08_L1TP_123032_20200312_20200822_02_T1 | 12 March 2020 | 123 | 32 |
| LC08_L1TP_123032_20200328_20200822_02_T1 | 28 March 2020 | 123 | 32 |
| LC08_L1TP_123032_20200413_20200822_02_T1 | 13 April 2020 | 123 | 32 |
| LC08_L1TP_123032_20200429_20200820_02_T1 | 29 April 2020 | 123 | 32 |
| LC08_L1TP_123032_20200531_20200820_02_T1 | 31 May 2020 | 123 | 32 |
| LC08_L1TP_123032_20200803_20200914_02_T1 | 3 August 2020 | 123 | 32 |
| LC08_L1TP_123032_20200904_20200918_02_T1 | 4 September 2020 | 123 | 32 |
| LC08_L1TP_123032_20200920_20201005_02_T1 | 20 September 2020 | 123 | 32 |
| LC08_L1TP_123032_20201006_20201016_02_T1 | 6 October 2020 | 123 | 32 |
| LC08_L1TP_123032_20201022_20201105_02_T1 | 22 October 2020 | 123 | 32 |
| LC08_L1TP_123032_20201123_20210315_02_T1 | 23 November 2020 | 123 | 32 |
| LC08_L1TP_123032_20201225_20210310_02_T1 | 25 December 2020 | 123 | 32 |
References
- Choumert, J.; Salanié, J. Provision of urban green spaces: Some insights from economics. Landsc. Res. 2008, 33, 331–345. [Google Scholar] [CrossRef]
- Beninde, J.; Veith, M.; Hochkirch, A. Biodiversity in cities needs space: A meta-analysis of factors determining intra-urban biodiversity variation. Ecol. Lett. 2015, 18, 581–592. [Google Scholar] [CrossRef]
- Jaafari, S.; Shabani, A.A.; Moeinaddini, M.; Danehkar, A.; Sakieh, Y. Applying landscape metrics and structural equation modeling to predict the effect of urban green space on air pollution and respiratory mortality in Tehran. Environ. Monit. Assess. 2020, 192, 1–15. [Google Scholar] [CrossRef] [PubMed]
- Kadaverugu, A.; Rao, C.N.; Viswanadh, G.K. Quantification of flood mitigation services by urban green spaces using InVEST model: A case study of Hyderabad city, India. Model. Earth Syst. Environ. 2021, 7, 589–602. [Google Scholar] [CrossRef]
- Callaghan, A.; McCombe, G.; Harrold, A.; McMeel, C.; Mills, G.; Moore-Cherry, N.; Cullen, W. The impact of green spaces on mental health in urban settings: A scoping review. J. Ment. Health 2021, 30, 179–193. [Google Scholar] [CrossRef] [PubMed]
- World Health Organization. Urban Green Spaces and Health: A Review of Evidence; World Health Organization: Copenhagen, Denmark, 2016. [Google Scholar]
- Taha, H.; Akbari, H.; Rosenfeld, A.; Huang, J. Residential cooling loads and the urban heat island—The effects of albedo. Build. Environ. 1988, 23, 271–283. [Google Scholar] [CrossRef]
- Zhao, L.; Oleson, K.; Bou-Zeid, E.; Krayenhoff, E.S.; Bray, A.; Zhu, Q.; Zheng, Z.; Chen, C.; Oppenheimer, M. Global multi-model projections of local urban climates. Nat. Clim. Chang. 2021, 11, 152–157. [Google Scholar] [CrossRef]
- Rahman, M.A.; Armson, D.; Ennos, A.R. A comparison of the growth and cooling effectiveness of five commonly planted urban tree species. Urban Ecosyst. 2015, 18, 371–389. [Google Scholar] [CrossRef]
- Konarska, J.; Uddling, J.; Holmer, B.; Lutz, M.; Lindberg, F.; Pleijel, H.; Thorsson, S. Transpiration of urban trees and its cooling effect in a high latitude city. Int. J. Biometeorol. 2016, 60, 159–172. [Google Scholar] [CrossRef]
- Chen, X.; Zhao, P.; Hu, Y.; Ouyang, L.; Zhu, L.; Ni, G. Canopy transpiration and its cooling effect of three urban tree species in a subtropical city—Guangzhou, China. Urban For. Urban Green. 2019, 43, 126368. [Google Scholar] [CrossRef]
- Shekhar, S.; Aryal, J. Role of geospatial technology in understanding urban green space of Kalaburagi city for sustainable planning. Urban For. Urban Green. 2019, 46, 126450. [Google Scholar] [CrossRef]
- Yu, Z.; Guo, X.; Zeng, Y.; Koga, M.; Vejre, H. Variations in land surface temperature and cooling efficiency of green space in rapid urbanization: The case of Fuzhou city, China. Urban For. Urban Green. 2018, 29, 113–121. [Google Scholar] [CrossRef]
- Zhao, J.; Zhao, X.; Liang, S.; Zhou, T.; Du, X.; Xu, P.; Wu, D. Assessing the thermal contributions of urban land cover types. Landsc. Urban Plan. 2020, 204, 103927. [Google Scholar] [CrossRef]
- Peng, J.; Dan, Y.; Qiao, R.; Liu, Y.; Dong, J.; Wu, J. How to quantify the cooling effect of urban parks? Linking maximum and accumulation perspectives. Remote. Sens. Environ. 2021, 252, 112135. [Google Scholar] [CrossRef]
- Feyisa, G.L.; Dons, K.; Meilby, H. Efficiency of parks in mitigating urban heat island effect: An example from Addis Ababa. Landsc. Urban Plan. 2014, 123, 87–95. [Google Scholar] [CrossRef]
- Shah, A.; Garg, A.; Mishra, V. Quantifying the local cooling effects of urban green spaces: Evidence from Bengaluru, India. Landsc. Urban Plan. 2021, 209, 104043. [Google Scholar] [CrossRef]
- Tan, Z.; Lau, K.K.-L.; Ng, E.Y.Y. Urban tree design approaches for mitigating daytime urban heat island effects in a high-density urban environment. Energy Build. 2016, 114, 265–274. [Google Scholar] [CrossRef]
- Tsoka, S.; Leduc, T.; Rodler, A. Assessing the effects of urban street trees on building cooling energy needs: The role of foliage density and planting pattern. Sustain. Cities Soc. 2021, 65, 102633. [Google Scholar] [CrossRef]
- Speak, A.; Montagnani, L.; Wellstein, C.; Zerbe, S. The influence of tree traits on urban ground surface shade cooling. Landsc. Urban Plan. 2020, 197, 103748. [Google Scholar] [CrossRef]
- Thomey, M.L.; Collins, S.; Vargas, R.; Johnson, J.E.; Brown, R.F.; Natvig, D.O.; Friggens, M.T. Effect of precipitation variability on net primary production and soil respiration in a Chihuahuan Desert grassland. Glob. Chang. Biol. 2010, 17, 1505–1515. [Google Scholar] [CrossRef]
- Abel, C.; Horion, S.; Tagesson, T.; De Keersmaecker, W.; Seddon, A.W.; Abdi, A.M.; Fensholt, R. The human–environment nexus and vegetation–rainfall sensitivity in tropical drylands. Nat. Sustain. 2021, 4, 25–32. [Google Scholar] [CrossRef]
- He, B.; Wang, S.; Guo, L.; Wu, X. Aridity change and its correlation with greening over drylands. Agric. For. Meteorol. 2019, 278, 107663. [Google Scholar] [CrossRef]
- Sanchez-Mejia, Z.M.; Papuga, S.A.; Swetish, J.B.; van Leeuwen, W.; Szutu, D.; Hartfield, K. Quantifying the influence of deep soil moisture on ecosystem albedo: The role of vegetation. Water Resour. Res. 2014, 50, 4038–4053. [Google Scholar] [CrossRef]
- Li, Y.; Zhao, M.; Mote, S.; Mu, Q.; Kalnay, E.; Li, S. Local cooling and warming effects of forests based on satellite observations. Nat. Commun. 2015, 6, 6603. [Google Scholar] [CrossRef] [Green Version]
- Fan, P.; Xu, L.; Yue, W.; Chen, J. Accessibility of public urban green space in an urban periphery: The case of Shanghai. Landsc. Urban Plan. 2017, 165, 177–192. [Google Scholar] [CrossRef]
- Dinda, S.; Das Chatterjee, N.; Ghosh, S. An integrated simulation approach to the assessment of urban growth pattern and loss in urban green space in Kolkata, India: A GIS-based analysis. Ecol. Indic. 2021, 121, 107178. [Google Scholar] [CrossRef]
- Banskota, A.; Kayastha, N.; Falkowski, M.J.; Wulder, M.; Froese, R.E.; White, J. Forest Monitoring Using Landsat Time Series Data: A Review. Can. J. Remote. Sens. 2014, 40, 362–384. [Google Scholar] [CrossRef]
- Li, F.; Li, F.; Li, S.; Long, Y. Deciphering the recreational use of urban parks: Experiments using multi-source big data for all Chinese cities. Sci. Total Environ. 2020, 701, 134896. [Google Scholar] [CrossRef]
- Li, W.; Ouyang, Z.; Meng, X.; Wang, X. Plant species composition in relation to green cover configuration and function of urban parks in Beijing, China. Ecol. Res. 2006, 21, 221–237. [Google Scholar] [CrossRef]
- Gorelick, N.; Hancher, M.; Dixon, M.; Ilyushchenko, S.; Thau, D.; Moore, R. Google Earth Engine: Planetary-scale geospatial analysis for everyone. Remote. Sens. Environ. 2017, 202, 18–27. [Google Scholar] [CrossRef]
- Masek, J.; Vermote, E.; Saleous, N.; Wolfe, R.; Hall, F.; Huemmrich, K.; Gao, F.; Kutler, J.; Lim, T.-K. A Landsat Surface Reflectance Dataset for North America, 1990–2000. IEEE Geosci. Remote. Sens. Lett. 2006, 3, 68–72. [Google Scholar] [CrossRef]
- Vermote, E.; Justice, C.; Claverie, M.; Franch, B. Preliminary analysis of the performance of the Landsat 8/OLI land surface reflectance product. Remote. Sens. Environ. 2016, 185, 46–56. [Google Scholar] [CrossRef] [PubMed]
- Foga, S.; Scaramuzza, P.L.; Guo, S.; Zhu, Z.; Dilley, R.D., Jr.; Beckmann, T.; Schmidt, G.L.; Dwyer, J.L.; Hughes, M.J.; Laue, B. Cloud detection algorithm comparison and validation for operational Landsat data products. Remote Sens. Environ. 2017, 194, 379–390. [Google Scholar] [CrossRef] [Green Version]
- Zhu, Z.; Fu, Y.; Woodcock, C.E.; Olofsson, P.; Vogelmann, J.; Holden, C.; Wang, M.; Dai, S.; Yu, Y. Including land cover change in analysis of greenness trends using all available Landsat 5, 7, and 8 images: A case study from Guangzhou, China (2000–2014). Remote. Sens. Environ. 2016, 185, 243–257. [Google Scholar] [CrossRef] [Green Version]
- Roy, D.; Kovalskyy, V.; Zhang, H.; Vermote, E.; Yan, L.; Kumar, S.S.; Egorov, A. Characterization of Landsat-7 to Landsat-8 reflective wavelength and normalized difference vegetation index continuity. Remote. Sens. Environ. 2016, 185, 57–70. [Google Scholar] [CrossRef] [PubMed] [Green Version]
- Fassnacht, F.E.; Schiller, C.; Kattenborn, T.; Zhao, X.; Qu, J. A Landsat-based vegetation trend product of the Tibetan Plateau for the time-period 1990–2018. Sci. Data 2019, 6, 1–11. [Google Scholar] [CrossRef] [PubMed]
- Anderson, K.; Fawcett, D.; Cugulliere, A.; Benford, S.; Jones, D.; Leng, R. Vegetation expansion in the subnival Hindu Kush Himalaya. Glob. Chang. Biol. 2020, 26, 1608–1625. [Google Scholar] [CrossRef] [Green Version]
- Jiménez-Muñoz, J.C.; Sobrino, J.A. A generalized single-channel method for retrieving land surface temperature from remote sensing data. J. Geophys. Res. Space Phys. 2003, 108, 108. [Google Scholar] [CrossRef] [Green Version]
- Malakar, N.K.; Hulley, G.C.; Hook, S.J.; Laraby, K.; Cook, M.; Schott, J.R. An Operational Land Surface Temperature Product for Landsat Thermal Data: Methodology and Validation. IEEE Trans. Geosci. Remote. Sens. 2018, 56, 5717–5735. [Google Scholar] [CrossRef]
- Jiménez-Muñoz, J.C.; Cristóbal, J.; Sobrino, J.A.; Soria, G.; Ninyerola, M.; Pons, X. Revision of the Single-Channel Algorithm for Land Surface Temperature Retrieval From Landsat Thermal-Infrared Data. IEEE Trans. Geosci. Remote. Sens. 2009, 47, 339–349. [Google Scholar] [CrossRef]
- Lyapustin, A.; Wang, Y. MCD19A2 MODIS/Terra+Aqua Land Aerosol Optical Depth Daily L2G Global 1km SIN Grid V006. NASA EOSDIS Land Processes DAAC 2018. Available online: https://doi.org/10.5067/MODIS/MCD19A2.006 (accessed on 24 June 2021).
- Kalnay, E.; Kanamitsu, M.; Kistler, R.; Collins, W.; Deaven, D.; Gandin, L.; Iredell, M.; Saha, S.; White, G.; Woollen, J. The NCEP/NCAR 40-year reanalysis project. Bull. Am. Meteorol. Soc. 1996, 77, 437–472. [Google Scholar] [CrossRef] [Green Version]
- Ermida, S.L.; Soares, P.; Mantas, V.; Göttsche, F.-M.; Trigo, I.F. Google Earth Engine Open-Source Code for Land Surface Temperature Estimation from the Landsat Series. Remote. Sens. 2020, 12, 1471. [Google Scholar] [CrossRef]
- Davies, L.; Gather, U. The identification of multiple outliers. J. Am. Stat. Assoc. 1993, 88, 782–792. [Google Scholar] [CrossRef]
- Duan, S.-B.; Li, Z.-L.; Li, H.; Göttsche, F.-M.; Wu, H.; Zhao, W.; Leng, P.; Zhang, X.; Coll, C. Validation of Collection 6 MODIS land surface temperature product using in situ measurements. Remote. Sens. Environ. 2019, 225, 16–29. [Google Scholar] [CrossRef] [Green Version]
- Mu, Q.; Zhao, M.; Running, S.W. Improvements to a MODIS global terrestrial evapotranspiration algorithm. Remote. Sens. Environ. 2011, 115, 1781–1800. [Google Scholar] [CrossRef]
- Monteith, J.L. Evaporation and environment. In Symposia of the Society for Experimental Biology; Cambridge University Press: Cambridge, UK, 1965; pp. 205–234. [Google Scholar]
- Saha, S.; Moorthi, S.; Wu, X.; Wang, J.; Nadiga, S.; Tripp, P.; Behringer, D.; Hou, Y.-T.; Chuang, H.-Y.; Iredell, M.; et al. NCEP Climate Forecast System Version 2 (CFSv2) 6-hourly Products. Res. Data Arch. Natl. Center Atmos. Res. Comput. Inf. Syst. Lab. 2011, 10, D61C1TXF. [Google Scholar] [CrossRef]
- Buchhorn, M.; Lesiv, M.; Tsendbazar, N.-E.; Herold, M.; Bertels, L.; Smets, B. Copernicus Global Land Cover Layers—Collection. Remote. Sens. 2020, 12, 1044. [Google Scholar] [CrossRef] [Green Version]
- Liang, S. Narrowband to broadband conversions of land surface albedo I: Algorithms. Remote. Sens. Environ. 2001, 76, 213–238. [Google Scholar] [CrossRef]
- Anees, A.; Aryal, J.; O’Reilly, M.; Gale, T. A Relative Density Ratio-Based Framework for Detection of Land Cover Changes in MODIS NDVI Time Series. IEEE J. Sel. Top. Appl. Earth Obs. Remote. Sens. 2015, 9, 3359–3371. [Google Scholar] [CrossRef]
- Cleveland, R.B. STL: A seasonal-trend decomposition procedure based on loess. J. Off. Stat. 1990, 6, 3–73. [Google Scholar]
- Muggeo, V.M.R. Estimating regression models with unknown break-points. Stat. Med. 2003, 22, 3055–3071. [Google Scholar] [CrossRef]
- Zhu, Z.; Piao, S.; Myneni, R.B.; Huang, M.; Zeng, Z.; Canadell, J.G.; Ciais, P.; Sitch, S.; Friedlingstein, P.; Arneth, A.; et al. Greening of the Earth and its drivers. Nat. Clim. Chang. 2016, 6, 791–795. [Google Scholar] [CrossRef]
- Seddon, A.; Macias-Fauria, M.; Long, P.R.; Benz, D.; Willis, K. Sensitivity of global terrestrial ecosystems to climate variability. Nat. Cell Biol. 2016, 531, 229–232. [Google Scholar] [CrossRef] [Green Version]
- Zhao, S.; Liu, S.; Zhou, D. Prevalent vegetation growth enhancement in urban environment. Proc. Natl. Acad. Sci. USA 2016, 113, 6313–6318. [Google Scholar] [CrossRef] [Green Version]
- Zhou, D.; Zhao, S.; Zhang, L.; Liu, S. Remotely sensed assessment of urbanization effects on vegetation phenology in China’s 32 major cities. Remote Sens. Environ. 2016, 176, 272–281. [Google Scholar] [CrossRef] [Green Version]
- Popek, R.; Przybysz, A.; Gawrońska, H.; Klamkowski, K.; Gawroński, S.W. Impact of particulate matter accumulation on the photosynthetic apparatus of roadside woody plants growing in the urban conditions. Ecotoxicol. Environ. Saf. 2018, 163, 56–62. [Google Scholar] [CrossRef] [PubMed]
- Yang, J.; McBride, J.; Zhou, J.; Sun, Z. The urban forest in Beijing and its role in air pollution reduction. Urban For. Urban Green. 2005, 3, 65–78. [Google Scholar] [CrossRef]
- Ow, L.F.; Ghosh, S.; Yusof, M.L.M. Growth of Samanea saman: Estimated cooling potential of this tree in an urban environment. Urban For. Urban Green. 2019, 41, 264–271. [Google Scholar] [CrossRef]
- Rahman, M.A.; Moser, A.; Rötzer, T.; Pauleit, S. Comparing the transpirational and shading effects of two contrasting urban tree species. Urban Ecosyst. 2019, 22, 683–697. [Google Scholar] [CrossRef]
- Zou, Z.; Yang, Y.; Qiu, G.Y. Quantifying the Evapotranspiration Rate and Its Cooling Effects of Urban Hedges Based on Three-Temperature Model and Infrared Remote Sensing. Remote. Sens. 2019, 11, 202. [Google Scholar] [CrossRef] [Green Version]
- Yin, J.; Wu, X.; Shen, M.; Zhang, X.; Zhu, C.; Xiang, H.; Shi, C.; Guo, Z.; Li, C. Impact of urban greenspace spatial pattern on land surface temperature: A case study in Beijing metropolitan area, China. Landsc. Ecol. 2019, 34, 2949–2961. [Google Scholar] [CrossRef]
- Qiu, K.; Jia, B. The roles of landscape both inside the park and the surroundings in park cooling effect. Sustain. Cities Soc. 2020, 52, 101864. [Google Scholar] [CrossRef]
- Gunawardena, K.; Wells, M.; Kershaw, T. Utilising green and bluespace to mitigate urban heat island intensity. Sci. Total. Environ. 2017, 584–585, 1040–1055. [Google Scholar] [CrossRef] [PubMed]
- Azevedo, J.A.; Chapman, L.; Muller, C.L. Quantifying the Daytime and Night-Time Urban Heat Island in Birmingham, UK: A Comparison of Satellite Derived Land Surface Temperature and High Resolution Air Temperature Observations. Remote. Sens. 2016, 8, 153. [Google Scholar] [CrossRef] [Green Version]


Publisher’s Note: MDPI stays neutral with regard to jurisdictional claims in published maps and institutional affiliations. |
© 2021 by the authors. Licensee MDPI, Basel, Switzerland. This article is an open access article distributed under the terms and conditions of the Creative Commons Attribution (CC BY) license (https://creativecommons.org/licenses/by/4.0/).
Share and Cite
Zhao, J.; Zhao, X.; Liang, S.; Wang, H.; Liu, N.; Liu, P.; Wu, D. Dynamic Cooling Effects of Permanent Urban Green Spaces in Beijing, China. Remote Sens. 2021, 13, 3282. https://doi.org/10.3390/rs13163282
Zhao J, Zhao X, Liang S, Wang H, Liu N, Liu P, Wu D. Dynamic Cooling Effects of Permanent Urban Green Spaces in Beijing, China. Remote Sensing. 2021; 13(16):3282. https://doi.org/10.3390/rs13163282
Chicago/Turabian StyleZhao, Jiacheng, Xiang Zhao, Shunlin Liang, Haoyu Wang, Naijing Liu, Ping Liu, and Donghai Wu. 2021. "Dynamic Cooling Effects of Permanent Urban Green Spaces in Beijing, China" Remote Sensing 13, no. 16: 3282. https://doi.org/10.3390/rs13163282
APA StyleZhao, J., Zhao, X., Liang, S., Wang, H., Liu, N., Liu, P., & Wu, D. (2021). Dynamic Cooling Effects of Permanent Urban Green Spaces in Beijing, China. Remote Sensing, 13(16), 3282. https://doi.org/10.3390/rs13163282