Evaluation of Extreme Precipitation Based on Three Long-Term Gridded Products over the Qinghai-Tibet Plateau
Abstract
:1. Introduction
2. Data and Methods
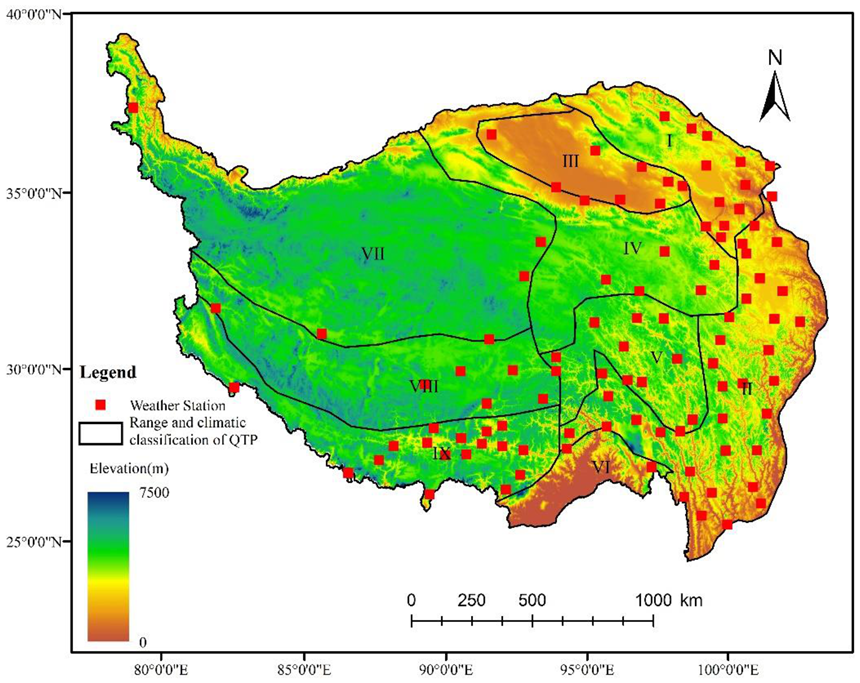
2.1. Study Area
2.2. On-Site Meteorological Data
2.3. Gridded Precipitation Datasets
2.3.1. CMFD
2.3.2. APHRODITE
2.3.3. CHIRPS
2.4. Methodology
2.4.1. Extraction of the Gridded Data
2.4.2. Index Calculations
2.4.3. Statistical Analysis
3. Results
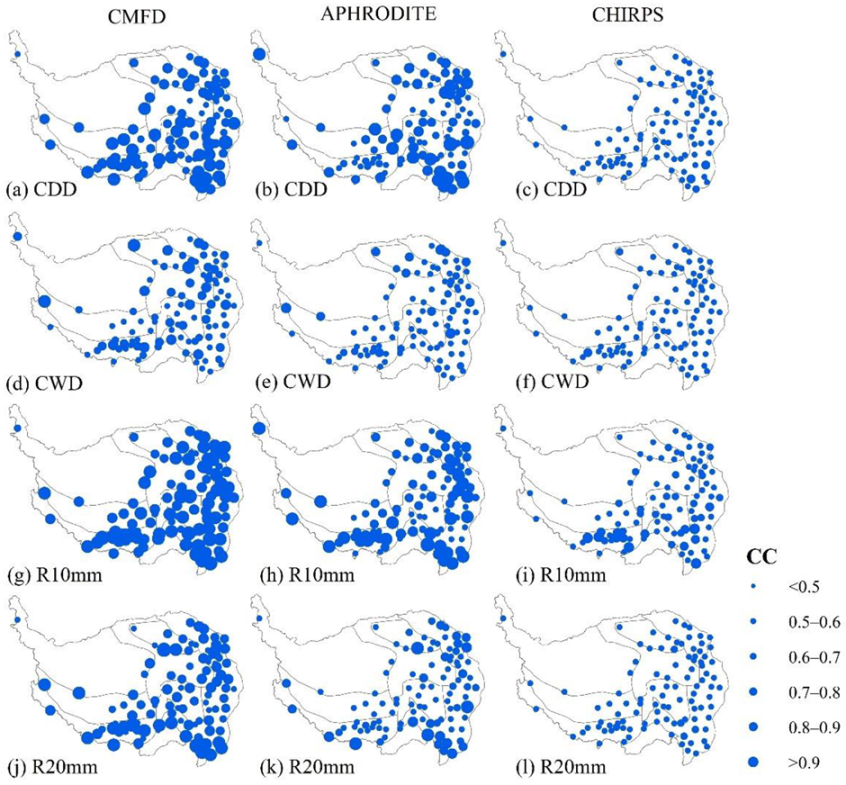
3.1. Spatial Evaluation
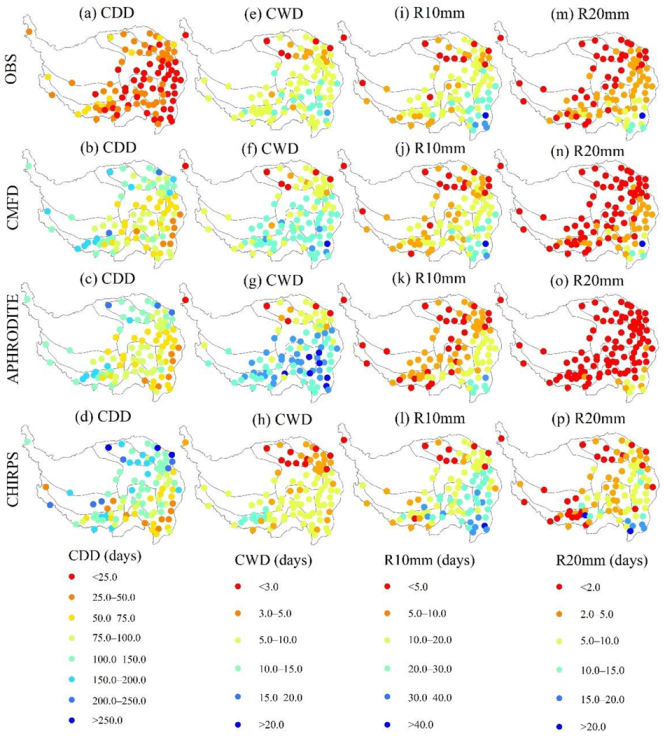
3.1.1. Fixed Threshold Indices
3.1.2. Station-Related Threshold Indices
3.1.3. Non-Threshold Indices
3.2. Temporal Evaluation
3.3. Detection Capabilities and Precipitation Intensities Analysis
4. Discussion
5. Conclusions
Author Contributions
Funding
Institutional Review Board Statement
Informed Consent Statement
Data Availability Statement
Acknowledgments
Conflicts of Interest
Appendix A
| NO. | Station-ID | Long (°N) | Lat (°E) | Altitude (m) | NO. | Station-ID | Long (°N) | Lat (°E) | Altitude (m) |
|---|---|---|---|---|---|---|---|---|---|
| 1 | 51,804 | 75.23 | 37.77 | 3090.10 | 52 | 56,021 | 95.78 | 34.13 | 4175.00 |
| 2 | 51,886 | 90.85 | 38.25 | 2944.80 | 53 | 56,029 | 97.02 | 33.02 | 3681.20 |
| 3 | 52,633 | 98.42 | 38.80 | 3367.00 | 54 | 56,033 | 98.22 | 34.92 | 4272.30 |
| 4 | 52,645 | 99.58 | 38.42 | 3320.00 | 55 | 56,034 | 97.13 | 33.80 | 4415.40 |
| 5 | 52,657 | 100.25 | 38.18 | 2787.40 | 56 | 56,038 | 98.10 | 32.98 | 4200.00 |
| 6 | 52,707 | 93.68 | 36.80 | 2767.00 | 57 | 56,043 | 100.25 | 34.47 | 3719.00 |
| 7 | 52,713 | 95.37 | 37.85 | 3173.20 | 58 | 56,046 | 99.65 | 33.75 | 3967.50 |
| 8 | 52,737 | 97.37 | 37.37 | 2981.50 | 59 | 56,065 | 101.60 | 34.73 | 3500.00 |
| 9 | 52,754 | 100.13 | 37.33 | 3301.50 | 60 | 56,067 | 101.48 | 33.43 | 3628.50 |
| 10 | 52,765 | 101.62 | 37.38 | 2850.00 | 61 | 56,074 | 102.08 | 34.00 | 3471.40 |
| 11 | 52,787 | 102.87 | 37.20 | 3045.10 | 62 | 56,079 | 102.97 | 33.58 | 3439.60 |
| 12 | 52,818 | 94.90 | 36.42 | 2807.60 | 63 | 56,080 | 102.90 | 35.00 | 2910.00 |
| 13 | 52,825 | 96.42 | 36.43 | 2790.40 | 64 | 56,106 | 93.78 | 31.88 | 4022.80 |
| 14 | 52,833 | 98.48 | 36.92 | 2950.00 | 65 | 56,109 | 93.78 | 31.48 | 3940.00 |
| 15 | 52,836 | 98.10 | 36.30 | 3191.10 | 66 | 56,116 | 95.60 | 31.42 | 3873.10 |
| 16 | 52,842 | 99.08 | 36.78 | 3087.60 | 67 | 56,125 | 96.48 | 32.20 | 3643.70 |
| 17 | 52,856 | 100.62 | 36.27 | 2835.00 | 68 | 56,128 | 96.60 | 31.22 | 3810.00 |
| 18 | 52,866 | 101.75 | 36.72 | 2295.20 | 69 | 56,137 | 97.17 | 31.15 | 3306.00 |
| 19 | 52,868 | 101.43 | 36.03 | 2237.10 | 70 | 56,144 | 98.58 | 31.80 | 3184.00 |
| 20 | 52,876 | 102.85 | 36.32 | 1813.90 | 71 | 56,146 | 100.00 | 31.62 | 3393.50 |
| 21 | 52,908 | 93.08 | 35.22 | 4612.20 | 72 | 56,151 | 100.75 | 32.93 | 3530.00 |
| 22 | 52,943 | 99.98 | 35.58 | 3323.20 | 73 | 56,152 | 100.33 | 32.28 | 3893.90 |
| 23 | 52,955 | 100.75 | 35.58 | 3120.00 | 74 | 56,167 | 101.12 | 30.98 | 2957.20 |
| 24 | 52,957 | 100.60 | 35.25 | 3148.20 | 75 | 56,172 | 102.23 | 31.90 | 2664.40 |
| 25 | 52,968 | 101.47 | 35.03 | 3662.80 | 76 | 56,173 | 102.55 | 32.80 | 3491.60 |
| 26 | 52,974 | 102.02 | 35.52 | 2491.40 | 77 | 56,178 | 102.35 | 31.00 | 2369.20 |
| 27 | 55,228 | 80.08 | 32.50 | 4278.60 | 78 | 56,182 | 103.57 | 32.65 | 2850.70 |
| 28 | 55,248 | 84.42 | 32.15 | 4414.90 | 79 | 56,202 | 93.28 | 30.67 | 4488.80 |
| 29 | 55,279 | 90.02 | 31.38 | 4700.00 | 80 | 56,223 | 95.83 | 30.75 | 3640.00 |
| 30 | 55,294 | 91.10 | 32.35 | 4800.00 | 81 | 56,227 | 95.77 | 29.87 | 2736.00 |
| 31 | 55,299 | 92.07 | 31.48 | 4507.00 | 82 | 56,228 | 96.92 | 30.05 | 3260.00 |
| 32 | 55,437 | 81.25 | 30.28 | 4900.00 | 83 | 56,247 | 99.10 | 30.00 | 2589.20 |
| 33 | 55,472 | 88.63 | 30.95 | 4672.00 | 84 | 56,251 | 100.32 | 30.93 | 3000.00 |
| 34 | 55,493 | 91.10 | 30.48 | 4200.00 | 85 | 56,257 | 100.27 | 30.00 | 3948.90 |
| 35 | 55,569 | 87.60 | 29.08 | 4000.00 | 86 | 56,307 | 92.58 | 29.15 | 3260.00 |
| 36 | 55,572 | 89.10 | 29.68 | 4000.00 | 87 | 56,312 | 94.33 | 29.67 | 2991.80 |
| 37 | 55,578 | 88.88 | 29.25 | 3836.00 | 88 | 56,317 | 94.22 | 29.22 | 2950.00 |
| 38 | 55,585 | 90.17 | 29.43 | 3809.40 | 89 | 56,331 | 97.83 | 29.67 | 3780.00 |
| 39 | 55,589 | 90.98 | 29.30 | 3555.30 | 90 | 56,342 | 98.60 | 29.68 | 3870.00 |
| 40 | 55,591 | 91.13 | 29.67 | 3648.90 | 91 | 56,357 | 100.30 | 29.05 | 3727.70 |
| 41 | 55,593 | 91.73 | 29.85 | 3804.30 | 92 | 56,374 | 101.97 | 30.05 | 2615.70 |
| 42 | 55,598 | 91.77 | 29.25 | 3551.70 | 93 | 56,434 | 97.47 | 28.65 | 2327.60 |
| 43 | 55,655 | 85.97 | 28.18 | 3810.00 | 94 | 56,444 | 98.92 | 28.48 | 3319.00 |
| 44 | 55,664 | 87.08 | 28.63 | 4300.00 | 95 | 56,459 | 101.27 | 27.93 | 2426.50 |
| 45 | 55,680 | 89.60 | 28.92 | 4040.00 | 96 | 56,462 | 101.50 | 29.00 | 2987.30 |
| 46 | 55,681 | 90.40 | 28.97 | 4431.70 | 97 | 56,533 | 98.67 | 27.75 | 1583.30 |
| 47 | 55,690 | 91.95 | 27.98 | 4280.30 | 98 | 56,543 | 99.70 | 27.83 | 3276.70 |
| 48 | 55,696 | 92.47 | 28.42 | 3860.00 | 99 | 56,548 | 99.28 | 27.17 | 2326.10 |
| 49 | 55,773 | 89.08 | 27.73 | 4300.00 | 100 | 56,565 | 101.52 | 27.43 | 2545.00 |
| 50 | 56,004 | 92.43 | 34.22 | 4533.10 | 101 | 56,651 | 100.22 | 26.87 | 2392.40 |
| 51 | 56,018 | 95.30 | 32.90 | 4066.40 |
| Indices | Datasets | CC | MAE | RMSE | KGE |
|---|---|---|---|---|---|
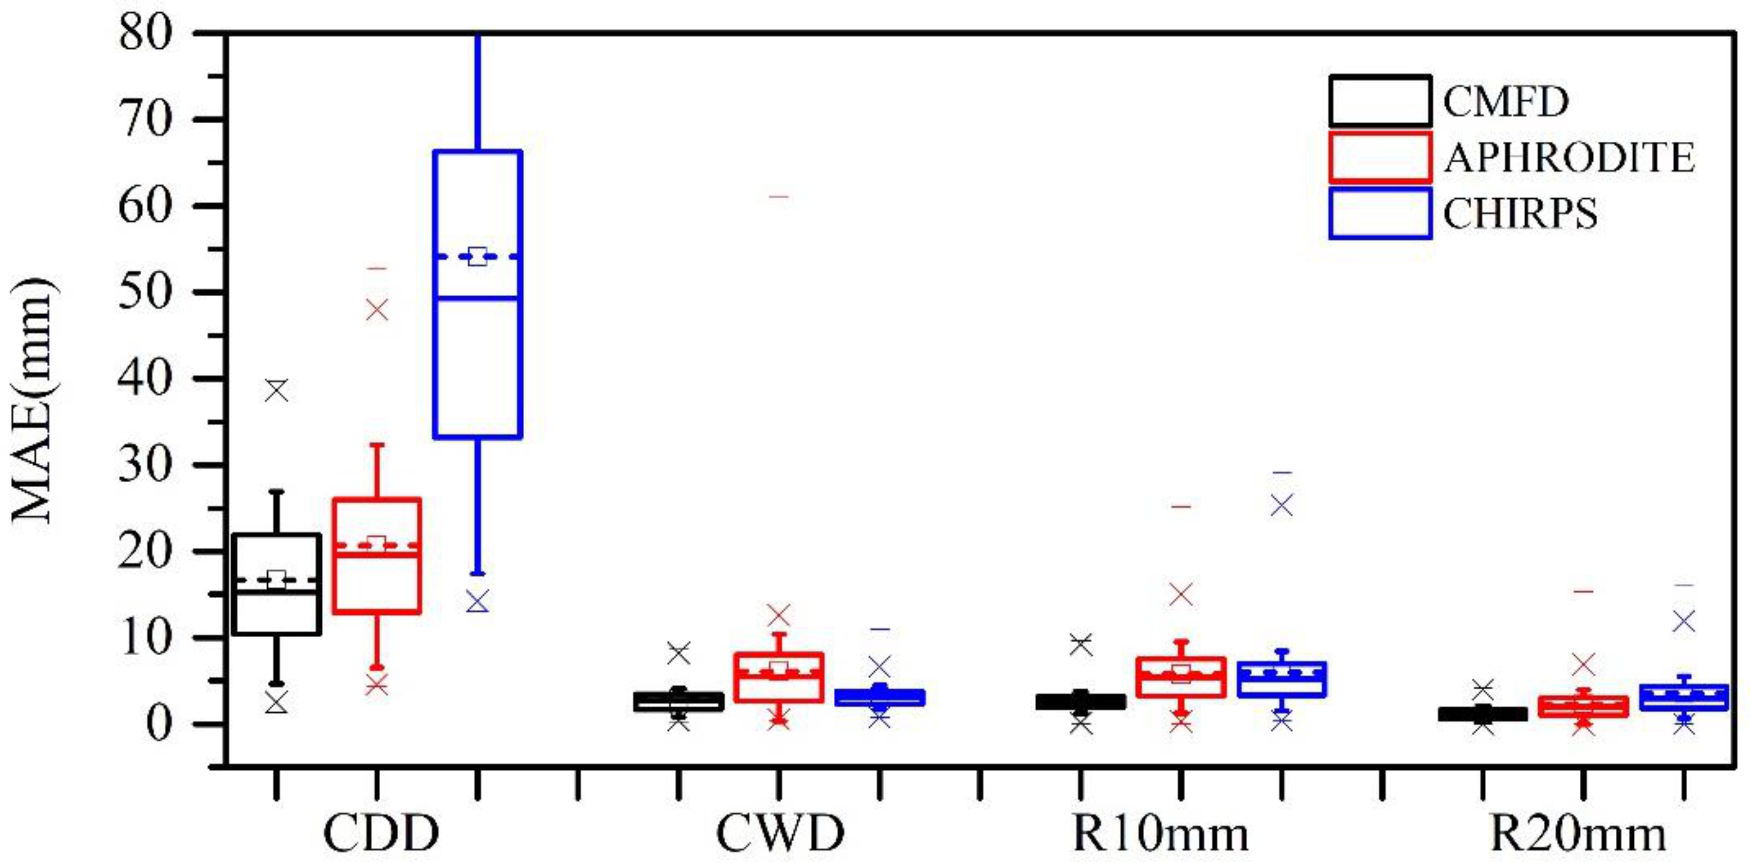
| CDD | CMFD | 0.85 | 16.69 | 27.55 | 0.82 |
| APHRODITE | 0.78 | 20.68 | 31.86 | 0.77 | |
| CHIRPS | 0.37 | 54.12 | 56.56 | 0.30 | |
| CWD | CMFD | 0.67 | 2.87 | 4.04 | 0.53 |
| APHRODITE | 0.64 | 6.07 | 5.67 | 0.21 | |
| CHIRPS | 0.38 | 3.17 | 3.52 | 0.31 | |
| R10mm | CMFD | 0.94 | 2.69 | 3.07 | 0.81 |
| APHRODITE | 0.85 | 5.79 | 3.99 | 0.49 | |
| CHIRPS | 0.72 | 5.99 | 7.26 | 0.54 | |
| R20mm | CMFD | 0.90 | 1.19 | 1.44 | 0.59 |
| APHRODITE | 0.75 | 2.32 | 1.25 | 0.36 | |
| CHIRPS | 0.57 | 3.55 | 4.42 | 0.22 | |
| R95p | CMFD | 0.88 | 25.87 | 37.19 | 0.87 |
| APHRODITE | 0.77 | 35.05 | 40.63 | 0.72 | |
| CHIRPS | 0.46 | 59.86 | 73.47 | 0.46 | |
| R95pT0T | CMFD | 0.73 | 5.46 | 7.30 | 0.72 |
| APHRODITE | 0.58 | 6.94 | 9.04 | 0.56 | |
| CHIRPS | 0.13 | 11.56 | 14.44 | 0.13 | |
| R99p | CMFD | 0.73 | 16.72 | 26.06 | 0.73 |
| APHRODITE | 0.63 | 18.83 | 27.75 | 0.58 | |
| CHIRPS | 0.19 | 35.54 | 49.64 | 0.20 | |
| R99pTOT | CMFD | 0.64 | 3.39 | 5.63 | 0.53 |
| APHRODITE | 0.58 | 3.79 | 5.90 | 0.21 | |
| CHIRPS | 0.08 | 6.95 | 10.14 | 0.31 | |
| PRCPTOT | CMFD | 0.98 | 25.41 | 50.20 | 0.97 |
| APHRODITE | 0.95 | 60.28 | 68.53 | 0.87 | |
| CHIRPS | 0.78 | 108.33 | 167.17 | 0.75 | |
| Rx1day | CMFD | 0.88 | 5.08 | 6.37 | 0.53 |
| APHRODITE | 0.77 | 10.38 | 5.60 | 0.21 | |
| CHIRPS | 0.51 | 17.71 | 18.34 | 0.31 | |
| Rx5day | CMFD | 0.95 | 6.14 | 8.99 | 0.92 |
| APHRODITE | 0.87 | 14.43 | 9.77 | 0.72 | |
| CHIRPS | 0.61 | 21.19 | 27.40 | 0.56 | |
| SDII | CMFD | 0.89 | 0.85 | 0.62 | 0.82 |
| APHRODITE | 0.80 | 1.62 | 0.62 | 0.67 | |
| CHIRPS | 0.58 | 3.80 | 4.11 | 0.46 |
| Datasets | POD | FAR | CSI | |
| General rain events (with daily precipitation amount < 20 mm) | CMFD | 0.931 | 0.308 | 0.657 |
| APHRODITE | 0.950 | 0.381 | 0.599 | |
| CHIRPS | 0.336 | 0.496 | 0.250 | |
| Heavy and extreme rain events (with daily precipitation amount ≥ 20mm) | CMFD | 0.489 | 0.293 | 0.416 |
| APHRODITE | 0.173 | 0.289 | 0.152 | |
| CHIRPS | 0.097 | 0.919 | 0.032 |
References
- Cao, L.; Pan, S. Changes in precipitation extremes over the “Three-River Headwaters” region, hinterland of the Tibetan Plateau, during 1960–2012. Quat. Int. 2014, 321, 105–115. [Google Scholar] [CrossRef]
- Katsanos, D.; Retalis, A.; Tymvios, F.; Michaelides, S. Analysis of precipitation extremes based on satellite (CHIRPS) and in situ dataset over Cyprus. Nat. Hazards 2016, 83, 53–63. [Google Scholar] [CrossRef]
- Cui, P.; Dang, C.; Cheng, Z.; Scott, K.M. Debris flows resulting from glacial-lake outburst floods in Tibet, China. Phys. Geogr. 2010, 31, 508–527. [Google Scholar] [CrossRef]
- Wang, S.; Che, Y.; Xinggang, M. Integrated risk assessment of glacier lake outburst flood (GLOF) disaster over the Qinghai–Tibetan Plateau (QTP). Landslides 2020, 17, 2849–2863. [Google Scholar] [CrossRef]
- Xu, Z.; Wu, Z.; He, H.; Wu, X.; Zhou, J.; Zhang, Y.; Guo, X. Evaluating the accuracy of MSWEP V2.1 and its performance for drought monitoring over mainland China. Atmos. Res. 2019, 226, 17–31. [Google Scholar] [CrossRef]
- Alexander, L.V.; Bador, M.; Roca, R.; Contractor, S.; Donat, M.G. Intercomparison of annual precipitation indices and extremes over global land areas from in situ, space-based and reanalysis products. Environ. Res. Lett. 2020, 15, 055002. [Google Scholar] [CrossRef]
- Ward, P.J.; Blauhut, V.; Bloemendaal, N.; Daniell, J.E.; de Ruiter, M.C.; Duncan, M.J.; Emberson, R.; Jenkins, S.; Kirschbaum, D.; Kunz, M.; et al. Review article: Natural hazard risk assessments at the global scale. Nat. Hazards Earth Syst. Sci. 2020, 20, 1069–1096. [Google Scholar] [CrossRef] [Green Version]
- Bai, L.; Shi, C.; Li, L.; Yang, Y.; Wu, J. Accuracy of CHIRPS Satellite-Rainfall Products over Mainland China. Remote. Sens. 2018, 10, 362. [Google Scholar] [CrossRef] [Green Version]
- Liu, J.; Shangguan, D.; Liu, S.; Ding, Y.; Wang, S.; Wang, X. Evaluation and comparison of CHIRPS and MSWEP dai-ly-precipitation products in the Qinghai-Tibet Plateau during the period of 1981–2015. Atmos. Res. 2019, 230, 104634. [Google Scholar] [CrossRef]
- Wu, Y.; Guo, L.; Zheng, H.; Zhang, B.; Li, M. Hydroclimate assessment of gridded precipitation products for the Tibetan Plateau. Sci. Total. Environ. 2019, 660, 1555–1564. [Google Scholar] [CrossRef]
- Tan, X.; Ma, Z.; He, K.; Han, X.; Ji, Q.; He, Y. Evaluations on gridded precipitation products spanning more than half a century over the Tibetan Plateau and its surroundings. J. Hydrol. 2020, 582, 124455. [Google Scholar] [CrossRef]
- Zhang, S.; Wang, D.; Qin, Z.; Zheng, Y.; Guo, J. Assessment of the GPM and TRMM Precipitation Products Using the Rain Gauge Network over the Tibetan Plateau. J. Meteorol. Res. 2018, 32, 324–336. [Google Scholar] [CrossRef]
- Wang, X.; Ding, Y.; Zhao, C.; Wang, J. Similarities and improvements of GPM IMERG upon TRMM 3B42 precipitation product under complex topographic and climatic conditions over Hexi region, Northeastern Tibetan Plateau. Atmos. Res. 2019, 218, 347–363. [Google Scholar] [CrossRef]
- Guo, J.; Zhai, P.; Wu, L.; Cribb, M.; Li, Z.; Ma, Z.; Wang, F.; Chu, D.; Wang, P.; Zhang, J. Diurnal variation and the influential factors of precipitation from surface and satellite measurements in Tibet. Int. J. Clim. 2013, 34, 2940–2956. [Google Scholar] [CrossRef]
- Mei, Y.; Nikolopoulos, E.I.; Anagnostou, E.N.; Borga, M. Evaluating satellite precipitation error propagation in runoff simulations of mountainous basins. J. Hydrometeorol. 2016, 17, 1407–1423. [Google Scholar] [CrossRef]
- Derin, Y.; Yilmaz, K.K. Evaluation of Multiple Satellite-Based Precipitation Products over Complex Topography. J. Hydrometeorol. 2014, 15, 1498–1516. [Google Scholar] [CrossRef] [Green Version]
- Bhuiyan, M.; Nikolopoulos, E.I.; Anagnostou, E.N. Machine learning-based blending of satellite and reanalysis precipitation datasets: A multiregional tropical complex terrain evaluation. J. Hydrometeorol. 2019, 20, 2147–2161. [Google Scholar] [CrossRef]
- Huang, X.; Wang, D.; Liu, Y.; Feng, Z.; Wang, D. Evaluation of extreme precipitation based on satellite retrievals over China. Front. Earth Sci. 2017, 12, 846–861. [Google Scholar] [CrossRef]
- Timmermans, B.; Wehner, M.; Cooley, D.; O’Brien, T.; Krishnan, H. An evaluation of the consistency of extremes in gridded precipitation data sets. Clim. Dyn. 2019, 52, 6651–6670. [Google Scholar] [CrossRef] [Green Version]
- Cavalcante, R.B.L.; Ferreira, D.B.D.S.; Pontes, P.R.; Tedeschi, R.G.; da Costa, C.P.W.; de Souza, E. Evaluation of extreme rainfall indices from CHIRPS precipitation estimates over the Brazilian Amazonia. Atmos. Res. 2020, 238, 104879. [Google Scholar] [CrossRef]
- Harrison, L.; Funk, C.; Peterson, P. Identifying changing precipitation extremes in Sub-Saharan Africa with gauge and satellite products. Environ. Res. Lett. 2019, 14, 085007. [Google Scholar] [CrossRef]
- Supari; Tangang, F.; Juneng, L.; Cruz, F.; Chung, J.X.; Ngai, S.T.; Salimun, E.; Mohd, M.S.F.; Santisirisomboon, J.; Singhruck, P. Multi-model projections of precipitation extremes in Southeast Asia based on CORDEX-Southeast Asia simulations. Environ. Res. 2020, 184, 109350. [Google Scholar] [CrossRef]
- Zhou, B.; Xu, Y.; Wu, J.; Dong, S.; Shi, Y. Changes in temperature and precipitation extreme indices over China: Analysis of a high-resolution grid dataset. Int. J. Clim. 2015, 36, 1051–1066. [Google Scholar] [CrossRef]
- Miao, C.; Ashouri, H.; Hsu, K.-L.; Sorooshian, S.; Duan, Q. Evaluation of the PERSIANN-CDR Daily Rainfall Estimates in Capturing the Behavior of Extreme Precipitation Events over China. J. Hydrometeorol. 2015, 16, 1387–1396. [Google Scholar] [CrossRef] [Green Version]
- Zhao, G.; Zhai, J.; Tian, P.; Zhang, L.; Mu, X.; An, Z.; Han, M. Variations in extreme precipitation on the Loess Plateau using a high-resolution dataset and their linkages with atmospheric circulation indices. Theor. Appl. Clim. 2017, 133, 1235–1247. [Google Scholar] [CrossRef]
- Xi, Y.; Miao, C.; Wu, J.; Duan, Q.; Lei, X.; Li, H. Spatiotemporal Changes in Extreme Temperature and Precipitation Events in the Three-Rivers Headwater Region, China. J. Geophys. Res. Atmos. 2018, 123, 5827–5844. [Google Scholar] [CrossRef]
- Ren, Z.; Zhao, P.; Zhang, Q.; Zhang, Z.; Cao, L.; Yang, Y. Quality control procedures for hourly precipitation data from automatic weather stations in China (in Chinese). Meteorol. Mon. 2010, 36, 123–132. [Google Scholar]
- He, J.; Yang, K.; Tang, W.; Lu, H.; Qin, J.; Chen, Y.; Li, X. The first high-resolution meteorological forcing dataset for land process studies over China. Sci. Data 2020, 7, 1–11. [Google Scholar] [CrossRef] [Green Version]
- Liu, Y.; Xu, J.; Lu, X.; Nie, L. Assessment of glacier- and snowmelt-driven streamflow in the arid middle Tianshan Mountains of China. Hydrol. Process. 2020, 34, 2750–2762. [Google Scholar] [CrossRef]
- Yatagai, A.; Kamiguchi, K.; Arakawa, O.; Hamada, A.; Yasutomi, N.; Kitoh, A. APHRODITE: Constructing a Long-Term Daily Gridded Precipitation Dataset for Asia Based on a Dense Network of Rain Gauges. Bull. Am. Meteorol. Soc. 2012, 93, 1401–1415. [Google Scholar] [CrossRef]
- Funk, C.; Peterson, P.; Landsfeld, M.; Pedreros, D.; Verdin, J.; Shukla, S.; Husak, G.; Rowland, J.; Harrison, L.; Hoell, A.; et al. The climate hazards infrared precipitation with stations—A new environmental record for monitoring extremes. Sci. Data 2015, 2, 1–21. [Google Scholar] [CrossRef] [PubMed] [Green Version]
- Zhang, X.; Alexander, L.; Hegerl, G.; Jones, P.; Tank, A.K.; Peterson, T.C.; Trewin, B.; Zwiers, F.W. Indices for monitoring changes in extremes based on daily temperature and precipitation data. Wiley Interdiscip. Rev. Clim. Chang. 2011, 2, 851–870. [Google Scholar] [CrossRef]
- Karl, T.R.; Nicholls, N.; Ghazi, A. CLIVAR/GCOS/WMO Workshop on Indices and Indicators for Climate Extremes Workshop Summary BT-Weather and Climate Extremes: Changes, Variations and a Perspective from the Insurance Industry. In Weather and Climate Extremes; Springer: Dordrecht, The Netherlands, 1999; pp. 3–7. [Google Scholar]
- Peterson, T.C.; Manton, M.J. Monitoring Changes in Climate Extremes: A Tale of International Collaboration. Bull. Am. Meteorol. Soc. 2008, 89, 1266–1271. [Google Scholar] [CrossRef]
- Wang, H.; Shao, Z.; Gao, T.; Zou, T.; Liu, J.; Yuan, H. Extreme precipitation event over the Yellow Sea western coast: Is there a trend? Quat. Int. 2017, 441, 1–17. [Google Scholar] [CrossRef]
- Yong, B.; Liu, D.; Gourley, J.J.; Tian, Y.; Huffman, G.J.; Ren, L.; Hong, Y. Global View of Real-Time Trmm Multisatellite Pre-cipitation Analysis: Implications for Its Successor Global Precipitation Measurement Mission. Bull. Am. Meteorol. Soc. 2015, 96, 283–296. [Google Scholar] [CrossRef]
- Beck, H.E.; Vergopolan, N.; Pan, M.; Levizzani, V.; van Dijk, A.I.J.M.; Weedon, G.P.; Brocca, L.; Pappenberger, F.; Huffman, G.J.; Wood, E.F. Global-scale evaluation of 22 precipitation datasets using gauge observations and hydrological modeling. Hydrol. Earth Syst. Sci. 2017, 21, 6201–6217. [Google Scholar] [CrossRef] [Green Version]
- Kumari, M.; Singh, C.K.; Bakimchandra, O.; Basistha, A. Geographically weighted regression based quantification of rainfall-topography relationship and rainfall gradient in Central Himalayas. Int. J. Climatol. 2017, 37, 1299–1309. [Google Scholar] [CrossRef]
- Hughes, M.; Hall, A.; Fovell, R.G. Blocking in areas of complex topography, and its influence on rainfall distribution. J. Atmos. Sci. 2013, 66, 508–518. [Google Scholar] [CrossRef] [Green Version]

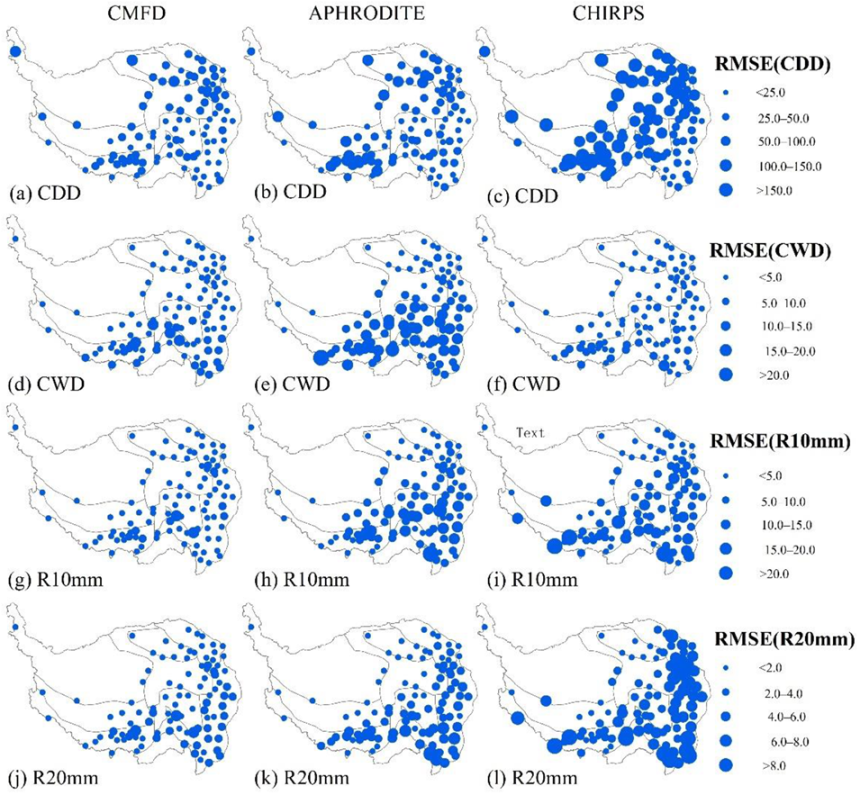

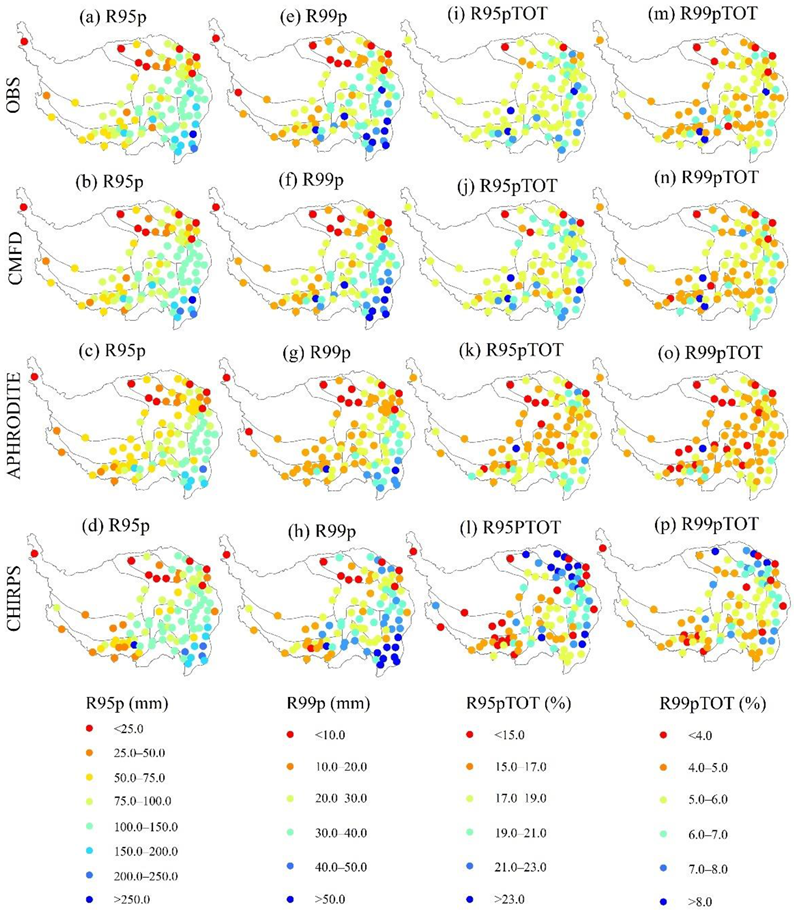
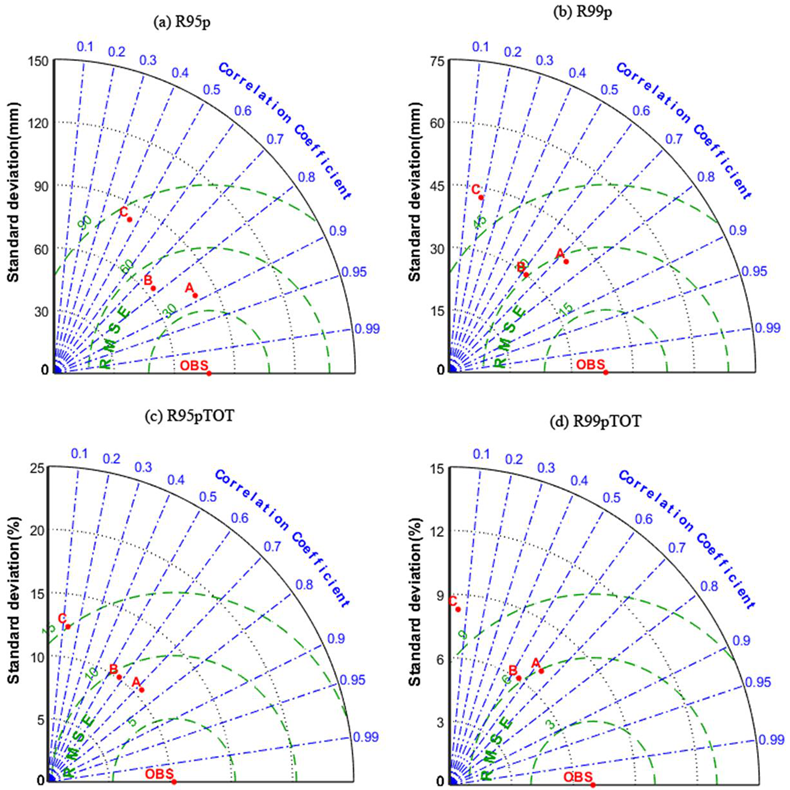
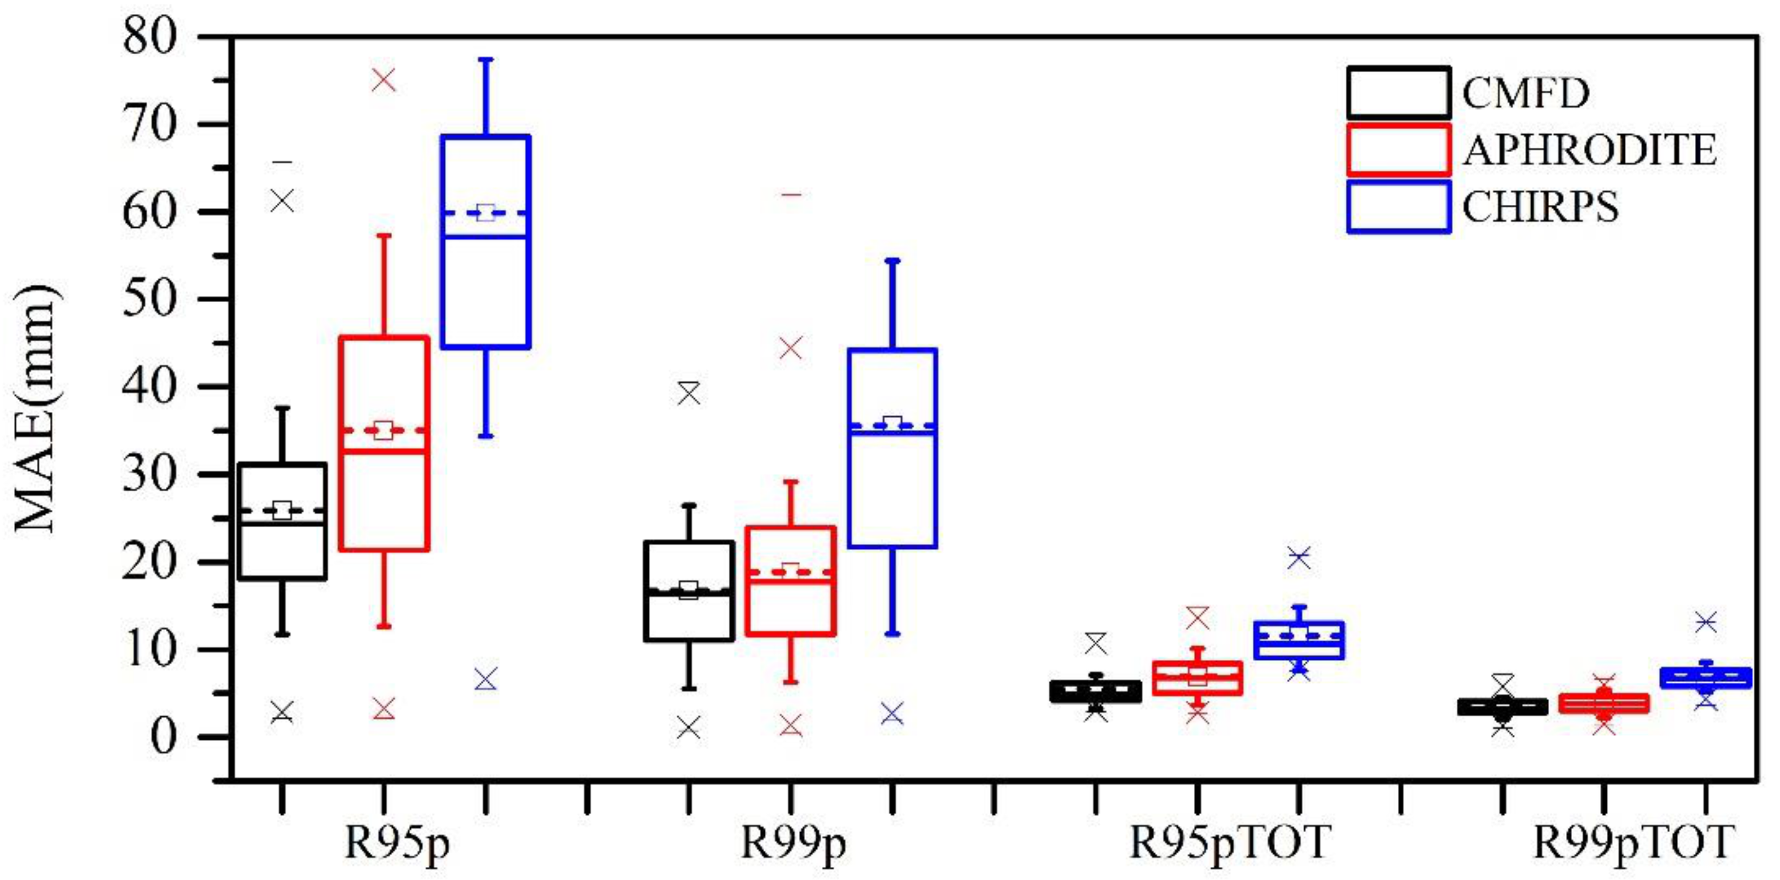

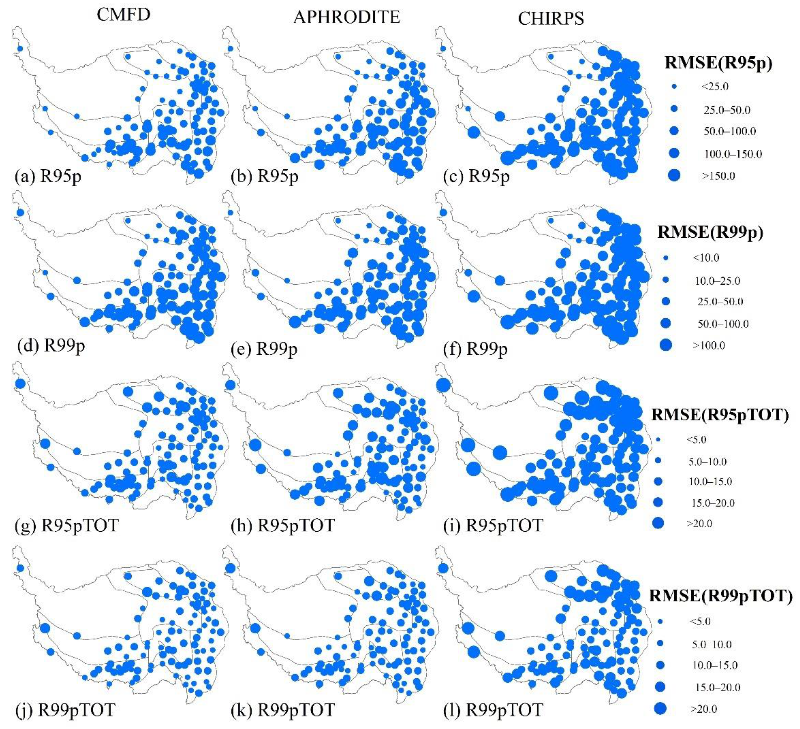


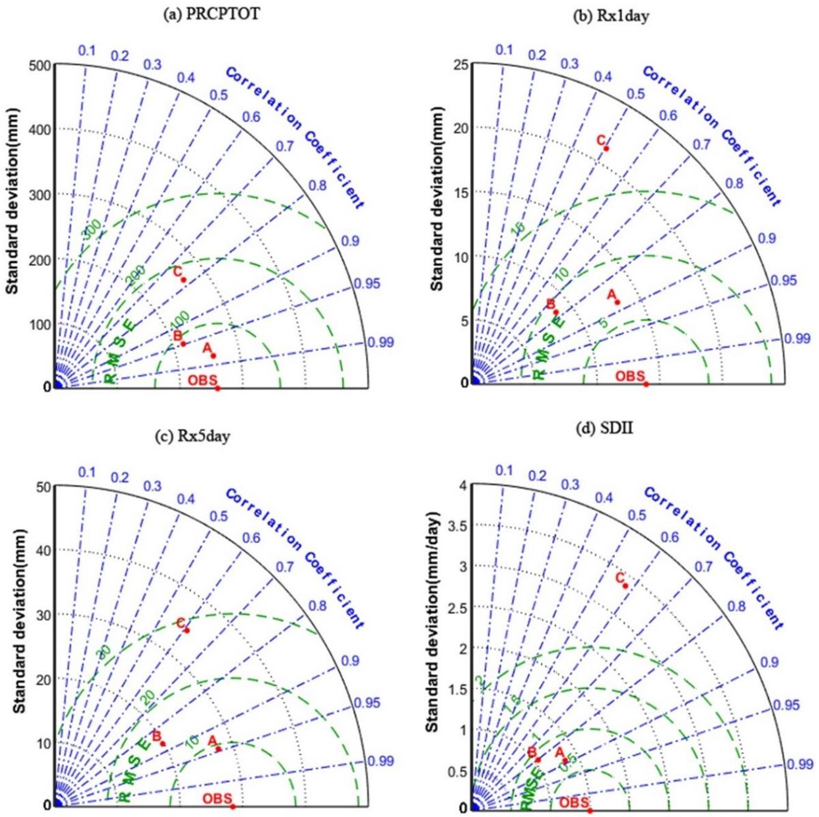


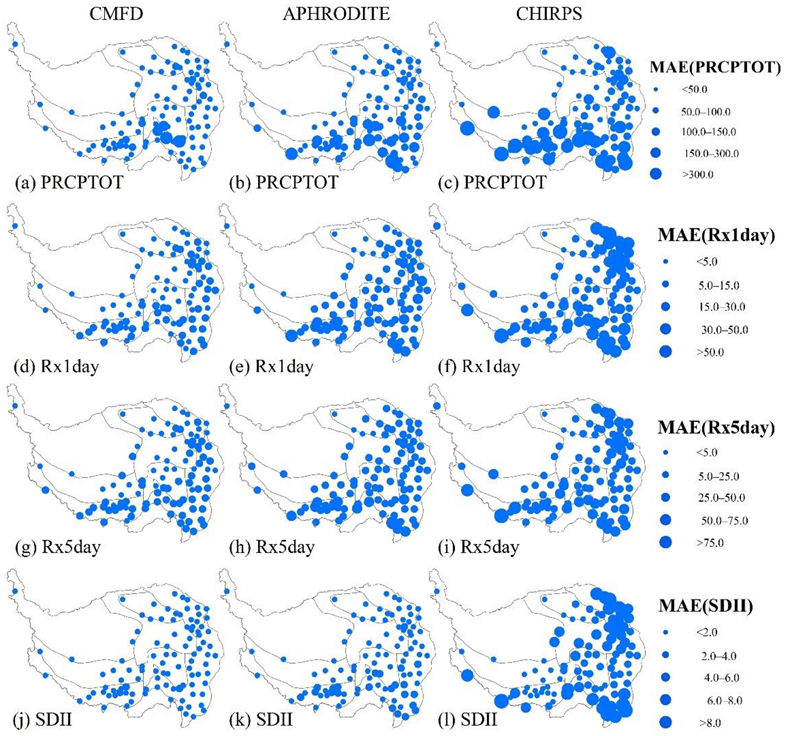
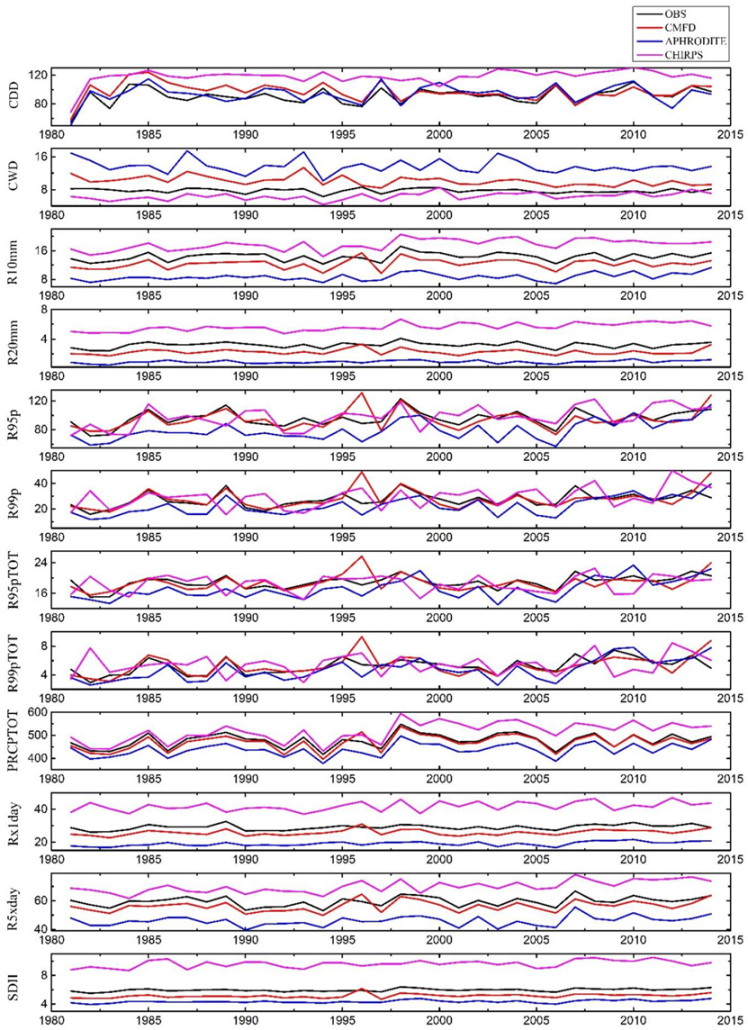

| Datasets | Time-Span | Resolution | Data Source(s) | References |
|---|---|---|---|---|
| CMFD | 1979–2018 | 0.1°/3 h | Gauge, satellite reanalysis | [28] |
| APHRODITE (APHRO_MA_V1101) | 1951–2015 | 0.25°/daily | Gauge | [30] |
| CHIRPS | 1981–present | 0.05°/daily | Gauge, satellite reanalysis | [31] |
| Index | Descriptive Name | Definition | Unit | |
|---|---|---|---|---|
| Fixed threshold indices | CDD | Consecutive dry days | Maximum number of consecutive dry days (when precipitation < 1.0 mm) | day |
| CWD | Consecutive wet days | Maximum annual number of consecutive wet days (when precipitation > 1.0 mm) | day | |
| R10mm | Number of heavy rain days | Number of days when precipitation > 10 mm | day | |
| R20mm | Number of very heavy rain days | Number of days when precipitation > 20 mm | day | |
| Station-related threshold indices | R95p | Total annual precipitation from heavy rain days | Annual sum of daily precipitation > 95th percentile | mm |
| R99p | Total annual precipitation from very heavy rain days | Annual sum of daily precipitation > 99th percentile | mm | |
| R95pTOT | Contribution from very wet days | 100*R95p/PRCPTOT | % | |
| R99pTOT | Contribution from extremely wet days | 100*R99p/PRCPTOT | % | |
| Non-threshold indices | PRCPTOT | Annual total wet day precipitation | Sum of daily precipitation > 1.0 mm | mm |
| Rx1day | Maximum 1-day precipitation | Maximum 1-day precipitation total | mm | |
| Rx5day | Maximum 5-day precipitation | Maximum 5-day precipitation total | mm | |
| SDII | Daily precipitation n intensity | Annual total precipitation divided by the number of wet days (when total PR > 1.0 mm) | mm/day |
| Statistics | Formula | Value Range | Perfect Value |
|---|---|---|---|
| Correlation coefficient (CC) | [−1, 1] | 1 | |
| Root mean square error (RMSE) | [0, +∞) | 0 | |
| Mean absolute error (MAE) KGE score | where x = /, y = | [0, +∞) (−∞,1] | 0 1 |
| The probability of detection (POD) The ratio false alarm (FAR) Critical success index (CSI) | [0, 1] [0, 1] [0, 1] | 1 0 1 |
| Index | Unit | CC | RMSE | ||||
|---|---|---|---|---|---|---|---|
| CMFD | APHRODITE | CHIRPS | CMFD | APHRODITE | CHIRPS | ||
| CDD | day | 0.85 | 0.77 | 0.36 | 28.84 | 34.16 | 69.41 |
| CWD | day | 0.69 | 0.50 | 0.37 | 4.50 | 10.15 | 4.36 |
| R10mm | day | 0.94 | 0.85 | 0.72 | 3.72 | 7.54 | 8.24 |
| R20mm | day | 0.90 | 0.74 | 0.58 | 1.82 | 3.44 | 5.06 |
| R95p | mm | 0.89 | 0.77 | 0.46 | 37.24 | 51.16 | 82.90 |
| R99p | mm | 0.73 | 0.62 | 0.16 | 27.61 | 30.48 | 54.10 |
| R95pTOT | % | 0.73 | 0.57 | 0.13 | 7.66 | 9.55 | 15.01 |
| R99pTOT | % | 0.63 | 0.54 | 0.06 | 5.80 | 6.12 | 10.45 |
| PRCPTOT | mm | 0.96 | 0.93 | 0.78 | 49.50 | 95.95 | 178.78 |
| Rx1day | mm | 0.88 | 0.77 | 0.46 | 7.37 | 13.41 | 25.85 |
| Rx5day | mm | 0.95 | 0.87 | 0.61 | 9.61 | 19.89 | 29.97 |
| SDII | mm/day | 0.90 | 0.80 | 0.54 | 1.05 | 1.83 | 4.84 |
Publisher’s Note: MDPI stays neutral with regard to jurisdictional claims in published maps and institutional affiliations. |
© 2021 by the authors. Licensee MDPI, Basel, Switzerland. This article is an open access article distributed under the terms and conditions of the Creative Commons Attribution (CC BY) license (https://creativecommons.org/licenses/by/4.0/).
Share and Cite
He, Q.; Yang, J.; Chen, H.; Liu, J.; Ji, Q.; Wang, Y.; Tang, F. Evaluation of Extreme Precipitation Based on Three Long-Term Gridded Products over the Qinghai-Tibet Plateau. Remote Sens. 2021, 13, 3010. https://doi.org/10.3390/rs13153010
He Q, Yang J, Chen H, Liu J, Ji Q, Wang Y, Tang F. Evaluation of Extreme Precipitation Based on Three Long-Term Gridded Products over the Qinghai-Tibet Plateau. Remote Sensing. 2021; 13(15):3010. https://doi.org/10.3390/rs13153010
Chicago/Turabian StyleHe, Qingshan, Jianping Yang, Hongju Chen, Jun Liu, Qin Ji, Yanxia Wang, and Fan Tang. 2021. "Evaluation of Extreme Precipitation Based on Three Long-Term Gridded Products over the Qinghai-Tibet Plateau" Remote Sensing 13, no. 15: 3010. https://doi.org/10.3390/rs13153010
APA StyleHe, Q., Yang, J., Chen, H., Liu, J., Ji, Q., Wang, Y., & Tang, F. (2021). Evaluation of Extreme Precipitation Based on Three Long-Term Gridded Products over the Qinghai-Tibet Plateau. Remote Sensing, 13(15), 3010. https://doi.org/10.3390/rs13153010


