
Phenological Classification Using Deep Learning and the Sentinel-2 Satellite to Identify Priority Afforestation Sites in North Korea


Abstract
1. Introduction
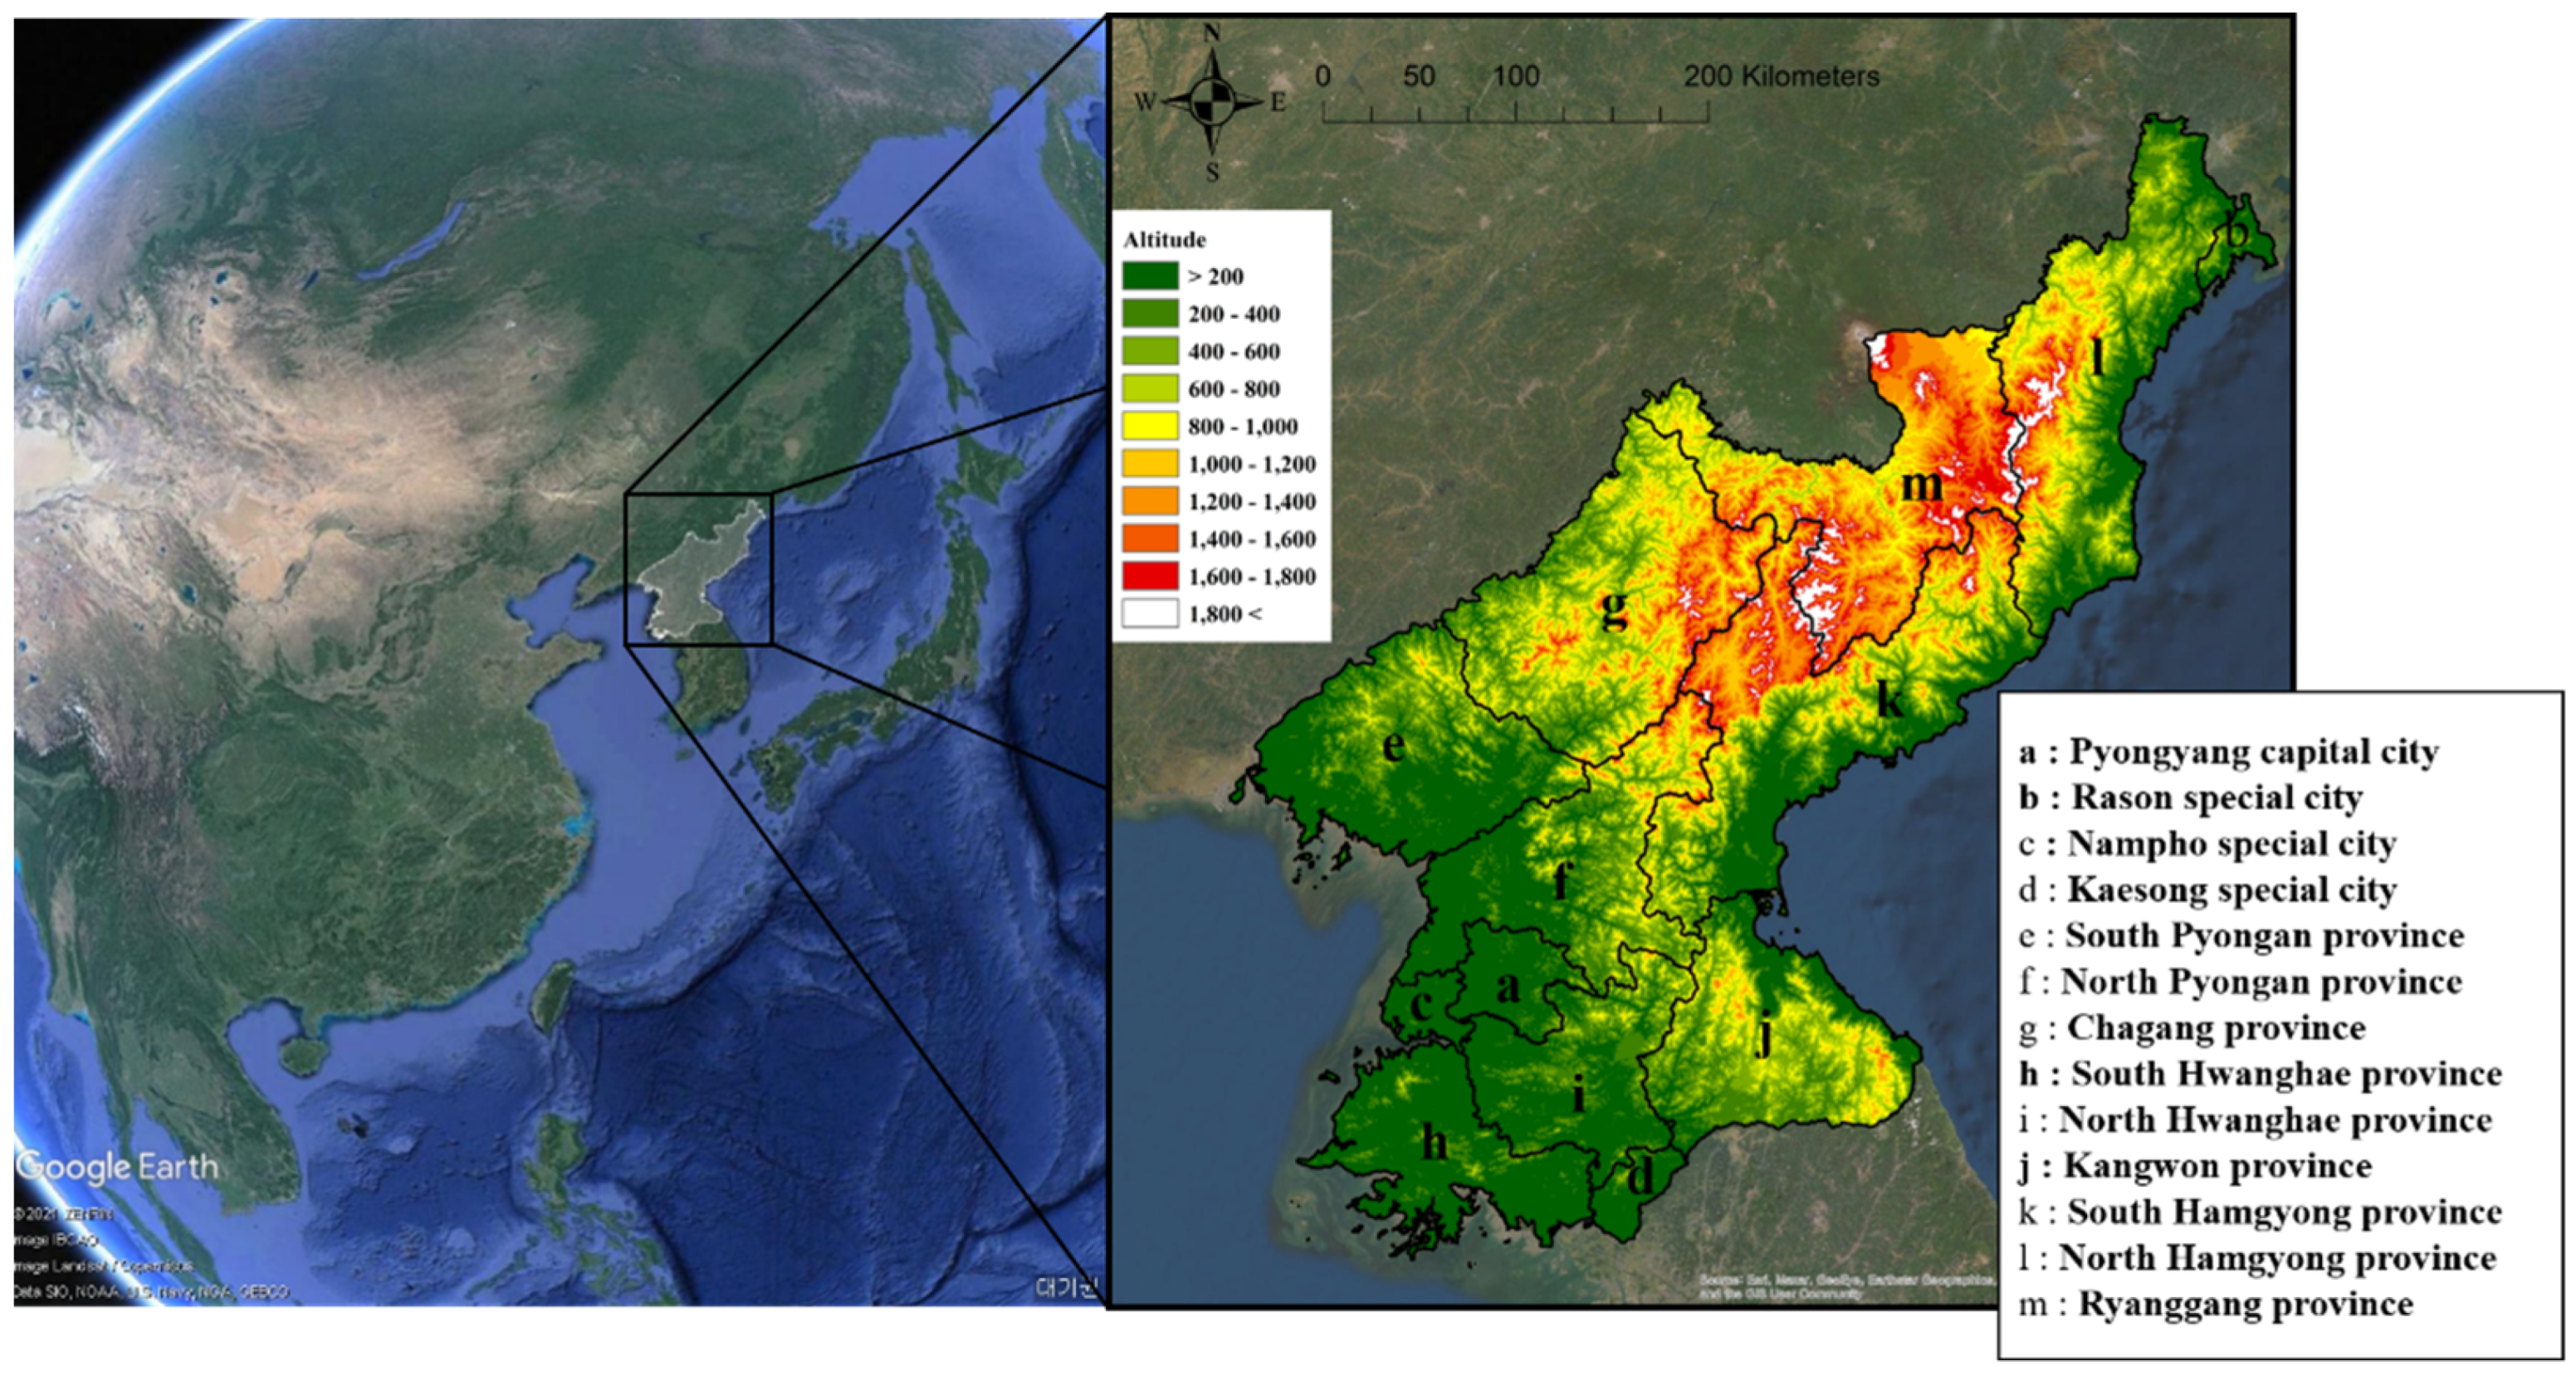
2. Study Area
3. Materials and Methods
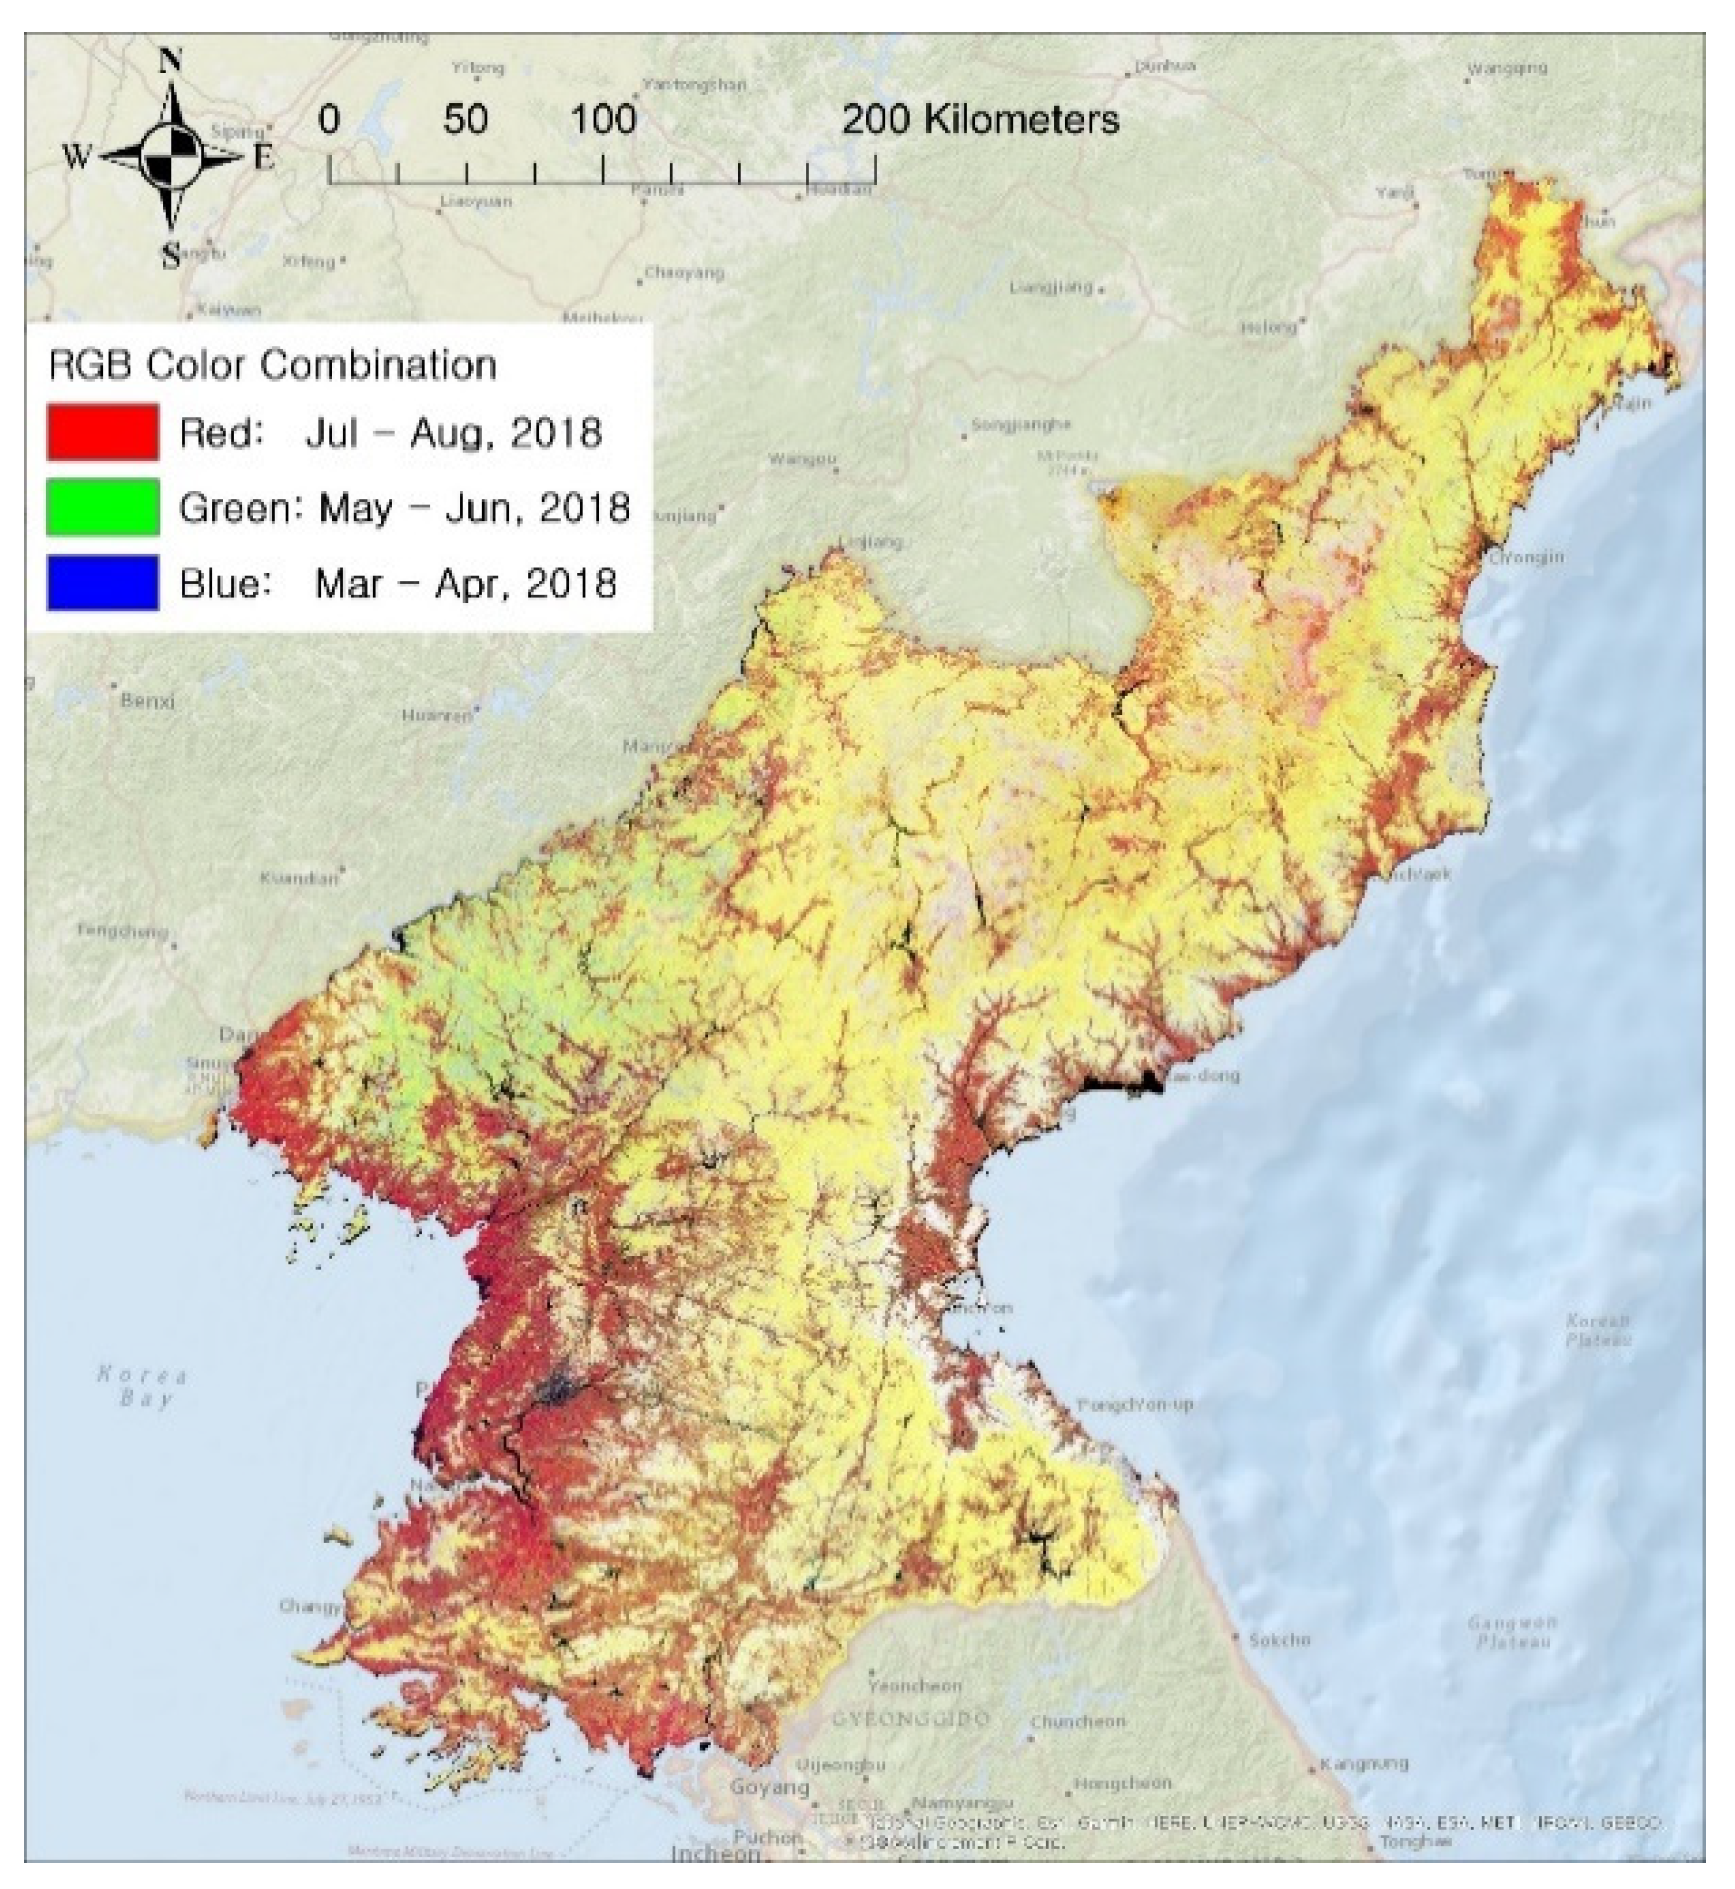
3.1. Sentinel-2 Data Collection and Processing
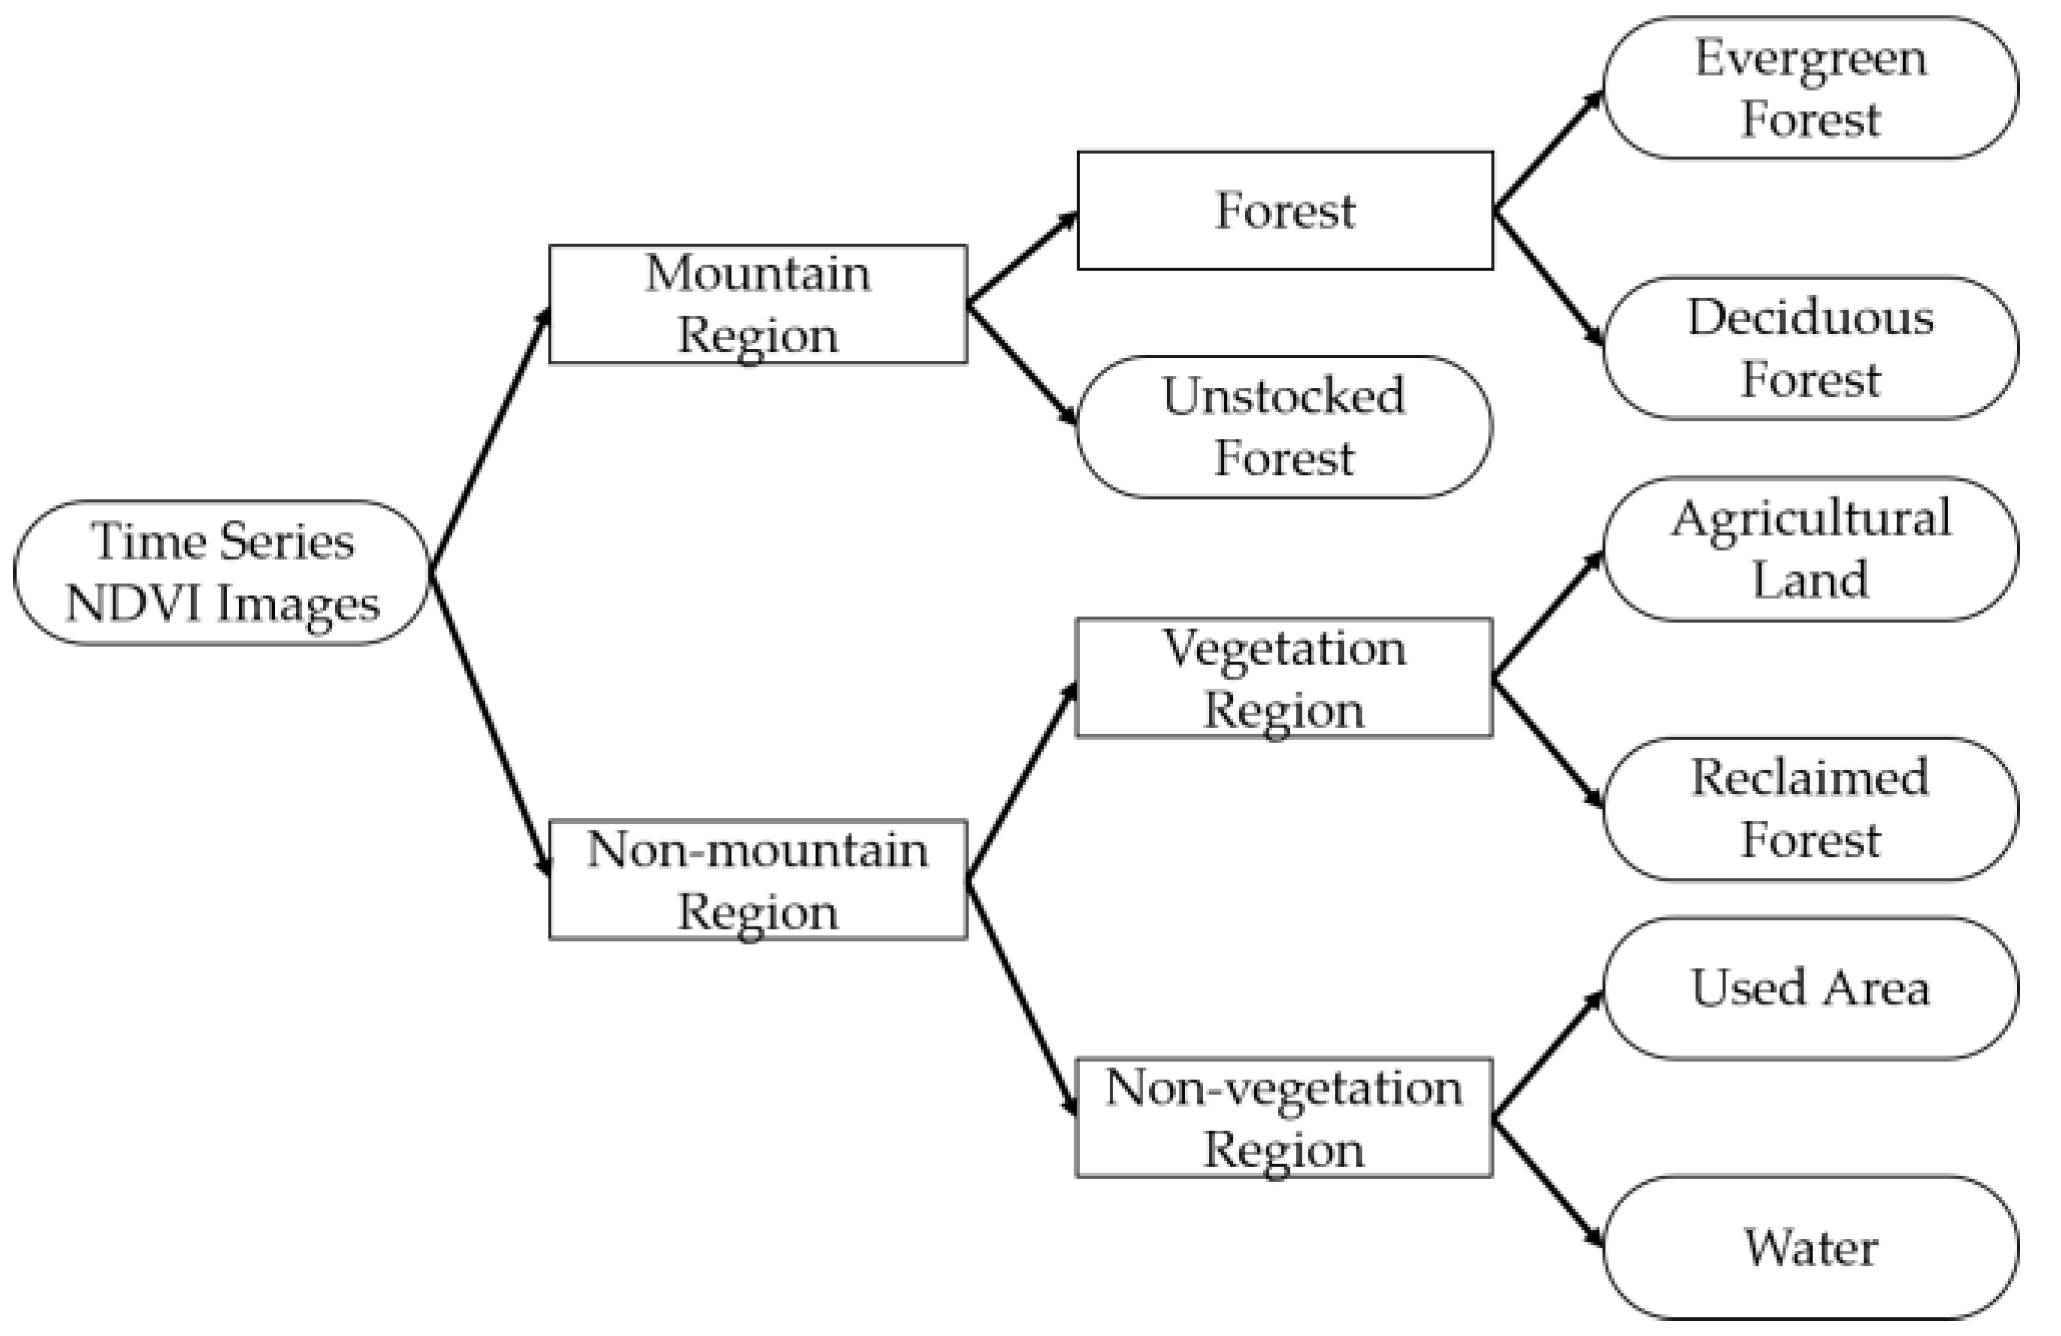
3.2. Classification Using U-Net Based Algorithm
3.3. Identifying Priority Afforestation Sites Using Topographic Data
4. Results and Discussion
4.1. Land Classification Results and Accuracy Verification
4.2. Comparison with Previous Studies for the Deforested Area
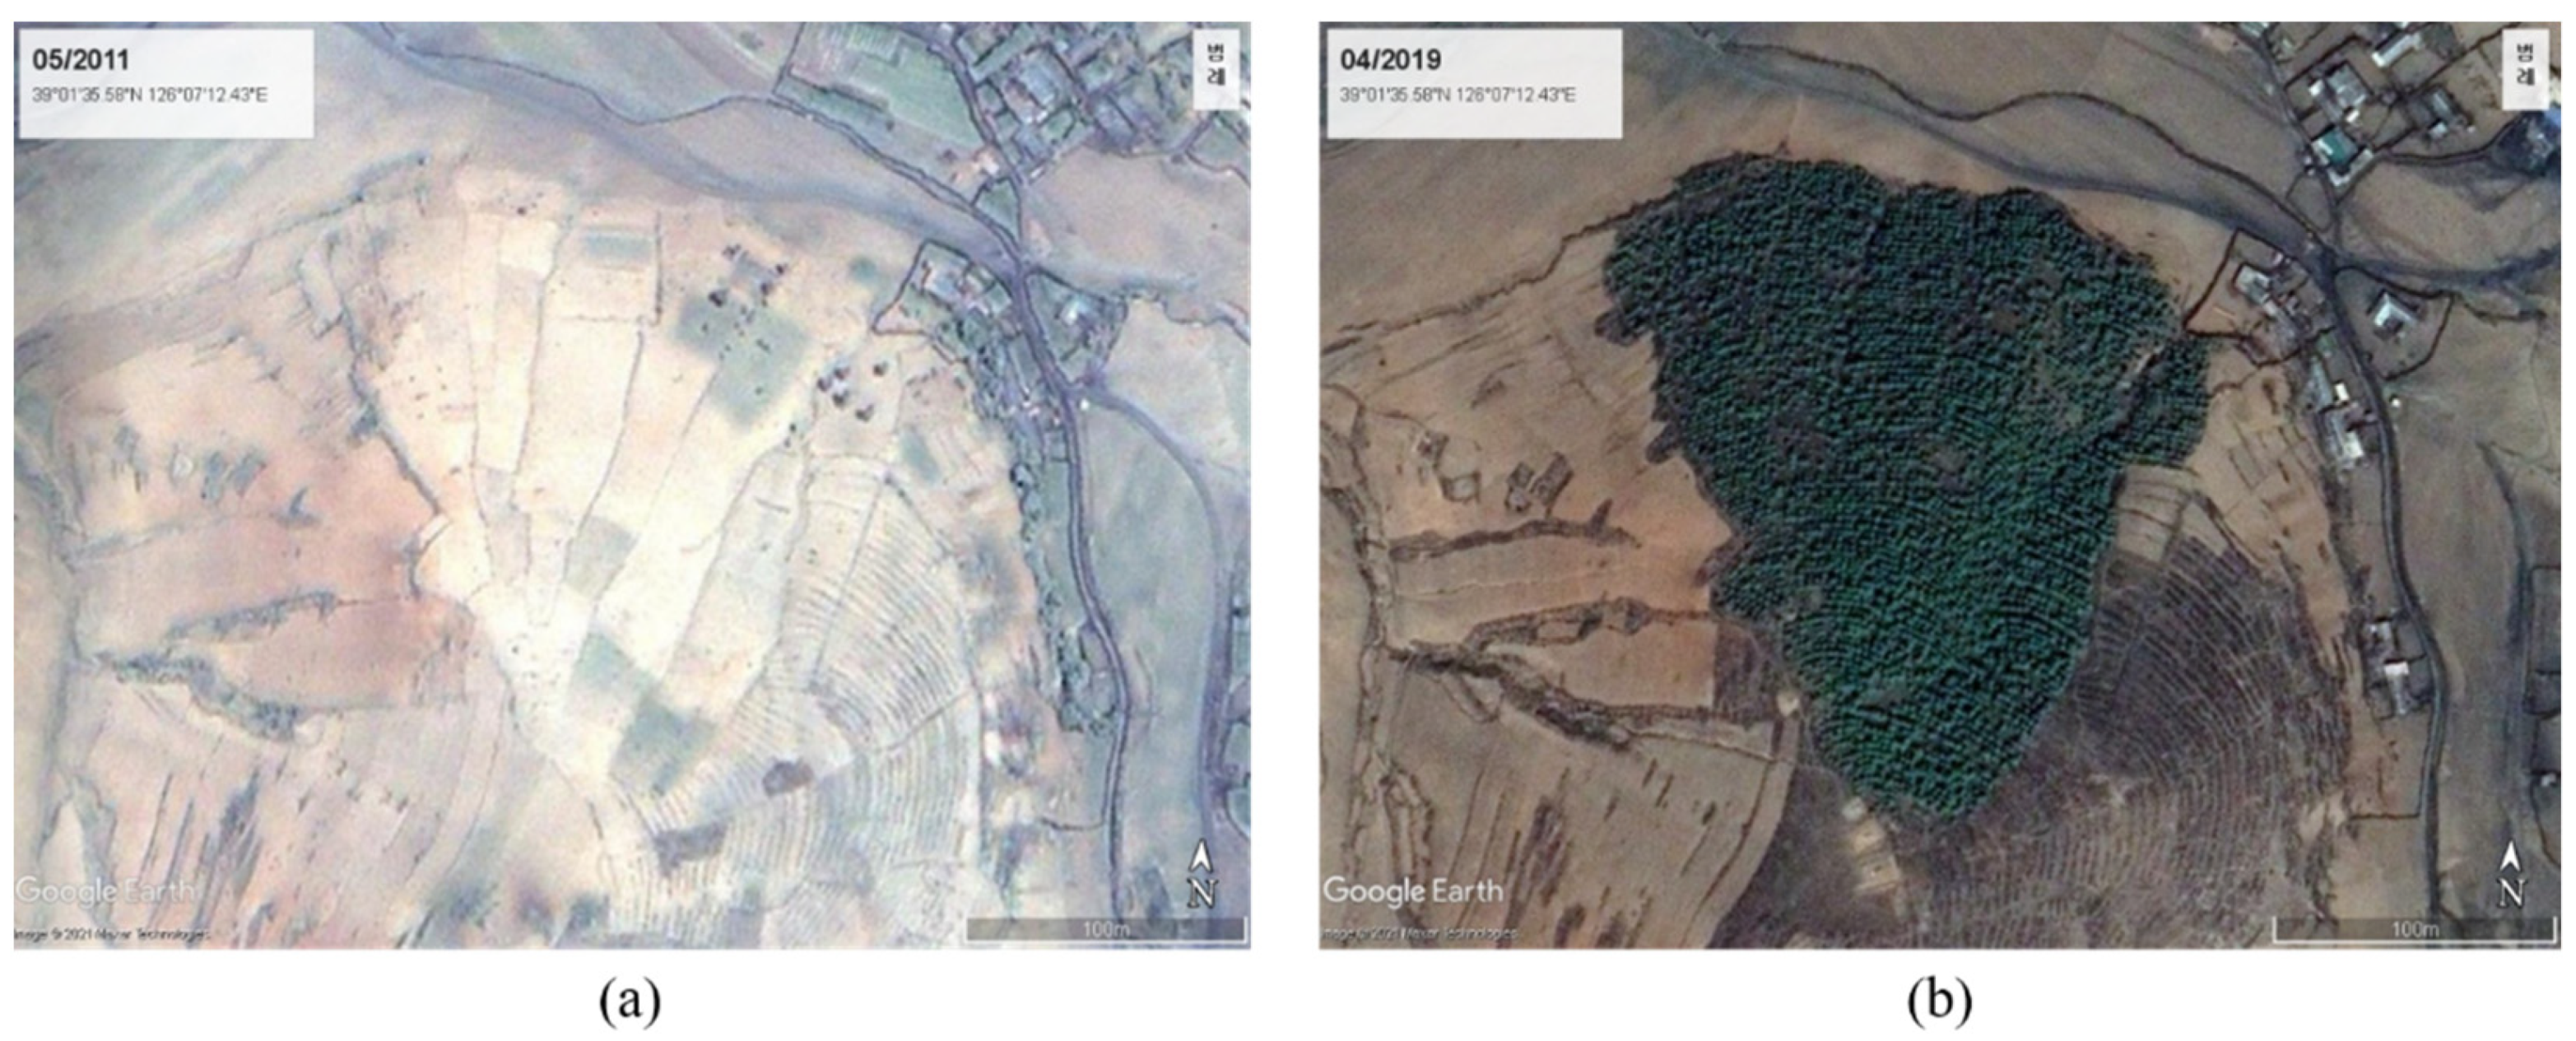
4.3. Identification of Priority Afforestation Target Site
4.4. Implication of Phenological Classification with Sentinel Satellite and Deep Learning Algorithm
5. Conclusions
Author Contributions
Funding
Institutional Review Board Statement
Informed Consent Statement
Data Availability Statement
Acknowledgments
Conflicts of Interest
References
- Díaz, S.; Hector, A.; Wardle, D.A. Biodiversity in forest carbon sequestration initiatives: Not just a side benefit. Curr. Opin. Environ. Sustain. 2009, 1, 55–60. [Google Scholar] [CrossRef]
- Pan, Y.; Birdsey, R.A.; Fang, J.; Houghton, R.; Kauppi, P.E.; Kurz, W.A.; Phillips, O.L.; Shvidenko, A.; Lewis, S.L.; Canadell, J.G.; et al. A large and persistent carbon sink in the world’s forests. Science 2011, 333, 988–993. [Google Scholar] [CrossRef]
- Sedjo, R.; Sohngen, B. Carbon sequestration in forests and soils. Annu. Rev. Resour. Econ. 2012, 4, 127–144. [Google Scholar] [CrossRef]
- Moura-Costa, P. Tropical Foestry Practices for Carbon Dequestration. Dipterocarp Forest Ecosystems: Towards Sustainable Management; World Scientific: Singapore, 1996; p. 309. [Google Scholar]
- Lee, S.J.; Lim, J.S.; Kang, J.T. Standard carbon uptake of major forest species (ver.1.2). NIFoS For. Policy Issue 2019, 129, 13. [Google Scholar]
- Korea Forest Service. Available online: https://www.forest.go.kr/ (accessed on 1 June 2021).
- Yang, A.R.; Kim, K.M.; Lim, J.B.; Kim, E.H. Analysis of North Korea’s Forest Change Using Satellite Imagery. North Korea’s Main Stat. Indic. 2020, 25, 239–253. [Google Scholar]
- E-National Index. Available online: https://www.index.go.kr/ (accessed on 1 June 2021).
- Choi, H. Prospect and Implementation Strategy of the Inter-Korean Forest Cooperation: A case study of international organization support project in DPRK. Unificaiton Policy Stud. 2018, 27, 1–20. [Google Scholar]
- Global Forest Watch. Available online: https://www.globalforestwatch.org/ (accessed on 1 June 2021).
- Yeom, J.M.; Han, K.S.; Lee, C.S.; Park, Y.Y.; Kim, Y.S. A Detection of Vegetation Variation Over North Korea using SPOT/VEGETATION NDVI. J. Korean Assoc. Geogr. Inf. Stud. 2008, 11, 28–37. [Google Scholar]
- Oh, C.Y.; Park, S.Y.; Kim, H.S.; Lee, Y.W.; Choi, C.U. Comparison of Landcover Map Accuracy Using High Resolution Satellite Imagery. J. Korean Assoc. Geogr. Inf. Stud. 2010, 13, 89–100. [Google Scholar]
- Jeong, S.G.; Park, J.; Park, C.H.; Lee, D.K. Terrace fields classification in North Korea using MODIS multi-temporal image data. J. Korean Soc. Environ. Restor. Technol. 2016, 19, 73–83. [Google Scholar] [CrossRef]
- Jin, Y.; Sung, S.; Lee, D.K.; Biging, G.S.; Jeong, S. Mapping Deforestation in North Korea Using Phenology-Based Multi-Index and Random Forest. Remote Sens. 2016, 8, 997. [Google Scholar] [CrossRef]
- Hong, S.Y.; Rim, S.K.; Lee, S.H.; Lee, J.C.; Kim, Y.H. Spatial Anaylsis of Agro-Environment of North Korea Using Remote Sensing, I. Landcover Classification from Landsat TM imagery and Topography Analysis in North Korea. Korean J. Environ. Agric. 2008, 27, 120–132. [Google Scholar] [CrossRef][Green Version]
- Park, K.S. Focus; Forest Status and Forest Policy in North Korea. KREI North Korean Agric. Trends 2013, 15, 1–21. [Google Scholar]
- The National Atlas of Korea. Available online: http://nationalatlas.ngii.go.kr/ (accessed on 1 June 2021).
- Park, S.Y.; Park, K.S.; Lee, S.Y. Forest Administrative Organization of North Korea and Characteristics of Forest Work. North Korean Stud. 2009, 4, 75–101. [Google Scholar]
- Kim, D.; Lim, C.H.; Song, C.; Lee, W.K.; Piao, D.; Heo, S.; Jeon, S. Estimation of future carbon budget with climate change and reforestation scenario in North Korea. Advances in Space Research 2016, 58, 1002–1016. [Google Scholar] [CrossRef]
- Lim, C.H.; Song, C.; Choi, Y.; Jeon, S.W.; Lee, W.K. Decoupling of forest water supply and agricultural water demand attributable to deforestation in North Korea. J. Environ. Manag. 2019, 248, 109256. [Google Scholar] [CrossRef] [PubMed]
- Kim, Y.H. The Study Directions of NK’s Food Rights and Duties. Humanit. Unification 2014, 60, 307–336. [Google Scholar] [CrossRef]
- Foody, G.M. Status of land cover classification accuracy assessment. Remote Sens. Environ. 2002, 80, 185–201. [Google Scholar] [CrossRef]
- Huang, X.; Lu, Q.; Zhang, L. A multi-index learning approach for classification of high-resolution remotely sensed images over urban areas. ISPRS J. Photogramm. Remote Sens. 2014, 90, 36–48. [Google Scholar] [CrossRef]
- Liu, C.; Wei, S.; Chunxia, L.; Jianxin, X. Spatial-temporal Hidden Markov Model for Land Cover Classification using Multitemporal Satellite Images. IEEE Access 2021, 9, 76493–76502. [Google Scholar] [CrossRef]
- Park, H.L.; Choi, J.W.; Oh, J.H. Seasonal effects removal of unsupervised change detection based multitemporal imagery. J. Korean Soc. Surv. Geod. Photogramm. Cartogr. 2018, 36, 51–58. [Google Scholar]
- Ulmas, P.; Liiv, I. Segmentation of satellite imagery using u-net models for land cover classification. arXiv 2020, arXiv:2003.02899. Available online: https://arxiv.org/abs/2003.02899 (accessed on 1 June 2021).
- Lee, S.H.; Lee, M.J. A Study on Deep Learning Optimization by Land Cover Classification Item Using Satellite Imagery. Korean J. Remote Sens. 2020, 36, 1591–1604. [Google Scholar]
- Vali, A.; Comai, S.; Matteucci, M. Deep Learning for Land Use and Land Cover Classification Based on Hyperspectral and Multispectral Earth Observation Data: A Review. Remote Sensing 2020, 12, 2495. [Google Scholar] [CrossRef]
- Kim, G.S.; Lim, C.-H.; Kim, S.J.; Lee, J.; Son, Y.; Lee, W.-K. Effect of National-Scale Afforestation on Forest Water Supply and Soil Loss in South Korea, 1971–2010. Sustainability 2017, 9, 1017. [Google Scholar] [CrossRef]
- Lee, J.; Lim, C.H.; Kim, G.S.; Markandya, A.; Chowdhury, S.; Kim, S.J.; Son, Y. Economic viability of the national-scale forestation program: The case of success in the Republic of Korea. Ecosyst. Serv. 2018, 29, 40–46. [Google Scholar] [CrossRef]
- Lee, S.; Choi, H.A.; Yoo, H.; Song, C.; Cha, S.; Bae, S.W.; Son, Y.; Lee, W.K. Restoration Plan for Degraded Forest in The Democratic People’s Republic of Korea Considering Suitable Tree Species and Spatial Distribution. Sustainability 2018, 10, 856. [Google Scholar] [CrossRef]
- Kang, S.; Choi, W. Forest cover changes in North Korea since the 1980s. Reg. Environ. Chang. 2014, 14, 347–354. [Google Scholar] [CrossRef]
- Lim, C.H.; Choi, Y.; Kim, M.; Jeon, S.W.; Lee, W.K. Impact of deforestation on agro-environmental variables in cropland, North Korea. Sustainability 2017, 9, 1354. [Google Scholar] [CrossRef]
- Food and Agriculture Organization of the United Nations (FAO). Available online: http://www.fao.org/ (accessed on 1 June 2021).
- Heo, S.H. Searching for the Inter-Korean Forest Cooperation Considering Forest Restoration Strategy and limits of Kim Jong-un Era: Focusing on Literature Review and Experts Interview. J. North Korea Stud. 2020, 6, 69–92. [Google Scholar]
- Oh, S.U.; Kim, E.H.; Kim, K.M. Characteristics of forest policy in the Kim Jong-Un era. North Korean Stud. 2018, 14, 101–133. [Google Scholar]
- Ronneberger, O.; Fischer, P.; Brox, T. U-net: Convolutional networks for biomedical image segmentation. In International Conference on Medical image computing and computer-assisted intervention; Springer: Cham, Switzerland, 2015; pp. 234–241. [Google Scholar]
- Otsu, N. A threshold selection method from gray-level histograms. IEEE Trans. Syst. ManCybern. 1979, 9, 62–66. [Google Scholar] [CrossRef]
- Kong, W.S. Biogeographic feature of North Korean ecosystem. J. Environ. Impact Assess. 2002, 11, 157–172. [Google Scholar]
- Yu, J.; Park, H.; Lee, S. H․; Kim, K.M. Review of Slope Criteria and Forestland Restoration Plan in North Korea. J. Korean Soc. Environ. Restor. 2016, 19, 19–28. [Google Scholar]
- Seok, H.D.; Kim, Y.H.; Lee, Y.H.; Koo, J.C.; Park, S.H.; Lee, C.H.; Yoon, T.S. The Strategy of the Restoration and Conservation of Deforested and Degraded Mountainous Areas in North Korea; KREI: Naju, Korea, 2014; p. 23. [Google Scholar]
- Environmental Spatial Data Service. Available online: https://egis.me.go.kr/main.do (accessed on 1 June 2021).


| Used Area | Agriculture | Deciduous | Evergreen | Plateau | Reclaimed | Unstocked | Water | Total | UA | |
|---|---|---|---|---|---|---|---|---|---|---|
| Used Area | 2 | 1 | 1 | 1 | 0 | 0 | 0 | 8 | 13 | 15.4% |
| Agriculture | 4 | 139 | 0 | 0 | 0 | 35 | 0 | 0 | 178 | 78.1% |
| Deciduous | 0 | 3 | 484 | 26 | 0 | 3 | 1 | 0 | 517 | 93.6% |
| Evergreen | 0 | 0 | 0 | 47 | 0 | 0 | 0 | 0 | 47 | 100% |
| Plateau | 0 | 0 | 0 | 0 | 10 | 0 | 0 | 0 | 10 | 100% |
| Reclaimed | 6 | 12 | 16 | 14 | 0 | 125 | 3 | 0 | 176 | 71% |
| Unstocked | 0 | 3 | 0 | 6 | 0 | 6 | 24 | 0 | 39 | 61.5% |
| Water | 1 | 0 | 0 | 0 | 0 | 0 | 0 | 9 | 10 | 90% |
| Total | 13 | 158 | 501 | 94 | 10 | 169 | 28 | 17 | 990 | |
| PA | 15.4% | 88.0% | 96.6% | 50% | 100% | 74.0% | 85.7% | 52.9% | 84.8% |
| Macro-Class | Sub-Class | Classification Results (ha) | Korean Ministry of Environment (ha) |
|---|---|---|---|
| Used Area | Used Area | 160,536 | 201,404 |
| Agricultural Land | Agricultural Land | 2,164,308 | - |
| Reclaimed Forest | 2,137,396 | - | |
| Total | 4,301,703 | 3,072,785 | |
| Forest | Deciduous Forest | 6,451,421 | - |
| Evergreen Forest | 573,256 | - | |
| Unstocked Forest | 472,912 | - | |
| Total | 7,024,677 | 8,503,797 | |
| Grass | Plateau Vegetation | 118,515 | - |
| Grass | - | 27,223 | |
| Wet Land | Wet Land | - | 38,020 |
| Barren | Barren | - | 150,632 |
| Water | Water | 80,097 | 166,835 |
| Total Area | 12,158,440 | 12,160,697 |
| Province | Forested Area | Deforested Area | Deforestation Ratio |
|---|---|---|---|
| Pyongyang capital city | 50,710 | 88,667 | 64% |
| Rason special city | 50,419 | 18,728 | 27% |
| Nampho special city | 5513 | 27,641 | 83% |
| Kaesong special city | 53,656 | 50,731 | 49% |
| South Pyongan | 539,814 | 274,574 | 34% |
| North Pyongan | 525,275 | 318,135 | 38% |
| Chagang | 1,164,533 | 261,579 | 18% |
| South Hwanghae | 184,160 | 283,653 | 61% |
| North Hwanghae | 352,934 | 253,148 | 42% |
| Kangwon | 749,944 | 214,287 | 22% |
| South Hamgyong | 1,239,313 | 319,999 | 21% |
| North Hamgyong | 1,051,034 | 278,154 | 21% |
| Ryanggang | 1,057,372 | 222,750 | 17% |
| Total Area | 7,024,677 | 2,610,308 | 27% |
| Class | Classification Results (ha) | Statistics Korea (ha) | Jin et al. (ha) |
|---|---|---|---|
| Deciduous Forest (a) | 6,451,421 | - | - |
| Evergreen Forest (b) | 573,256 | - | - |
| Reclaimed Forest (c) | 2,137,395 | 1,217,000 | 2,700,000 |
| Unstocked Forest (d) | 472,912 | 1,401,000 | 1,300,000 |
| Healthy Forest (a) + (b) | 7,024,677 | 6,767,000 | 8,300,000 |
| Deforested Land (c) + (d) | 2,610,308 | 2,618,000 | 4,000,000 |
| Total Forest (a) + (b) + (c) + (d) | 9,634,985 | 9,386,000 | 11,695,905 |
| Deforestation Ratio | 27.1% | 28% | 34.2% |
| Priority Afforestation Site (8°<) | 1,709,618 | 2,618,000 | |
| Priority Afforestation Site (15°<) | 1,124,194 | 1,475,000 | -- |
| Afforestation Priority Grade | Description | Area (ha) |
|---|---|---|
| Grade 1 | Unstocked forests with altitudes < 600 m | 258,304 |
| Grade 2 | Reclaimed forest with slope > 20° | 293,535 |
| Grade 3 | Reclaimed forest with slope 15°–20° | 286,648 |
| Grade 4 | Reclaimed forest with slope 8°–15° | 577,564 |
| Grade 5 | Reclaimed forest with slope 0°–8° | 721,289 |
| Natural restoration area | Deforested areas with altitudes > 600 m | 472,967 |
| Total Area | 2,610,308 |
Publisher’s Note: MDPI stays neutral with regard to jurisdictional claims in published maps and institutional affiliations. |
© 2021 by the authors. Licensee MDPI, Basel, Switzerland. This article is an open access article distributed under the terms and conditions of the Creative Commons Attribution (CC BY) license (https://creativecommons.org/licenses/by/4.0/).
Share and Cite
Kim, J.; Lim, C.-H.; Jo, H.-W.; Lee, W.-K. Phenological Classification Using Deep Learning and the Sentinel-2 Satellite to Identify Priority Afforestation Sites in North Korea. Remote Sens. 2021, 13, 2946. https://doi.org/10.3390/rs13152946
Kim J, Lim C-H, Jo H-W, Lee W-K. Phenological Classification Using Deep Learning and the Sentinel-2 Satellite to Identify Priority Afforestation Sites in North Korea. Remote Sensing. 2021; 13(15):2946. https://doi.org/10.3390/rs13152946
Chicago/Turabian StyleKim, Joon, Chul-Hee Lim, Hyun-Woo Jo, and Woo-Kyun Lee. 2021. "Phenological Classification Using Deep Learning and the Sentinel-2 Satellite to Identify Priority Afforestation Sites in North Korea" Remote Sensing 13, no. 15: 2946. https://doi.org/10.3390/rs13152946
APA StyleKim, J., Lim, C.-H., Jo, H.-W., & Lee, W.-K. (2021). Phenological Classification Using Deep Learning and the Sentinel-2 Satellite to Identify Priority Afforestation Sites in North Korea. Remote Sensing, 13(15), 2946. https://doi.org/10.3390/rs13152946