Article

Coral Reef Mapping with Remote Sensing and Machine Learning: A Nurture and Nature Analysis in Marine Protected Areas

by
Camila Brasil Louro da Silveira
1,*,
Gil Marcelo Reuss Strenzel
2,
Mauro Maida
1,
Ana Lídia Bertoldi Gaspar
3 and
Beatrice Padovani Ferreira
1
1
Departamento de Oceanografia, Universidade Federal de Pernambuco (UFPE), Recife 50740-550, Pernambuco, Brazil
2
Laboratório de Oceanografia, Universidade Estadual de Santa Cruz (UESC), Km 16, Ilhéus 45662-900, Bahia, Brazil
3
Instituto Recifes Costeiros (IRCOS), Tamandaré 55578-000, Pernambuco, Brazil
*
Author to whom correspondence should be addressed.
Remote Sens. 2021, 13(15), 2907; https://doi.org/10.3390/rs13152907
Submission received: 22 May 2021 / Revised: 4 July 2021 / Accepted: 20 July 2021 / Published: 24 July 2021
(This article belongs to the Special Issue Machine Learning Methods for Environmental Monitoring)

Abstract

:
Mapping habitats is essential to assist strategic decisions regarding the use and protection of coral reefs. Coupled with machine learning (ML) algorithms, remote sensing has allowed detailed mapping of reefs at meaningful scales. Here we integrated WorldView-3 and Landsat-8 imagery and ML techniques to produce a map of suitable habitats for the occurrence of a model species, the hydrocoral Millepora alcicornis, in coral reefs located inside marine protected areas in Northeast Brazil. Conservation and management efforts in the region were also analyzed, integrating human use layers to the ecological seascape. Three ML techniques were applied: two to derive base layers, namely geographically weighted regressions for bathymetry and support vector machine classifier (SVM) for habitat mapping, and one to build the species distribution model (MaxEnt) for Millepora alcicornis, a conspicuous and important reef-building species in the area. Additionally, human use was mapped based on the presence of tourists and fishers. SVM yielded 15 benthic classes (e.g., seagrass, sand, coral), with an overall accuracy of 79%. Bathymetry and its derivative layers depicted the topographical complexity of the area. The Millepora alcicornis distribution model identified distance from the shore and depth as topographical factors limiting the settling and growth of coral colonies. The most important variables were ecological, showing the importance of maintaining high biodiversity in the ecosystem. The comparison of the habitat suitability model with species absence and human use maps indicated the impact of direct human activities as potential inhibitors of coral development. Results reinforce the importance of the establishment of no-take zones and other protective measures for maintaining local biodiversity.

1. Introduction

Coral reefs are considered hotspots of marine biodiversity and complex ecosystems, both ecologically and geomorphologically [1,2]. Furthermore, these environments support socioeconomic activities and can be essential for the livelihood of millions of people [3,4]. For these reasons, they are usually considered as priority conservation areas [5,6], in an effort to ensure the maintenance of coral reefs’ ability to provide their usual goods and services.
Despite their importance, reefs around the world are in serious decline and are faced with a wide range of impacts, varying from local (e.g., population growth, pollution, erosion, coastal sedimentation) [1,7,8] to global threats (e.g., climate change, overfishing) [9,10]. In fact, this last decade has been characterized by unprecedented coral bleaching and mass mortality due to a period of successive hot years, consecutive El Niño events and heat waves [10,11,12]. Considering the combination of local and global effects, coastal reefs are particularly affected, as they are usually also subjected to intense and direct human impacts related to activities occurring in the reef framework [2,13,14].
The establishment of marine protected areas (MPAs) using ecosystem-based approaches has been long described as one of the most effective tools to reduce habitat loss [15] and harmful impacts in coral ecosystems. Nevertheless, the practical effectiveness relies heavily on how ecologically appropriate the chosen region is and how efficiently they are managed [16,17]. MPAs should, ideally, be specified based on representativeness of the habitat types in the area and prior knowledge of biologically (and/or economically) essential species and ecosystems [18]. However, this information is seldom available, and choices are frequently opportunistic relying mainly on socioeconomic factors.
The influence of topography and underwater relief in coastal coral reef ecosystems is well documented [19,20,21]. Additionally, the maintenance of their inherent relief complexity is a key process in protecting and monitoring the basic functions performed by these ecosystems. Satellite-based remote sensing has been used to map tropical coral reefs since the 1970s, with the launching of the first Landsat satellite [22]. Technological advancements in the last decade have enabled the acquisition of satellite data in resolutions capable of mapping biological assemblages on coral reef areas and their topographical environment in detail [23,24]. Furthermore, satellite imagery is a budget-friendly way of deriving important variables such as bathymetry [25], terrain complexity [26] and benthic cover [27,28], making it a frequent reliable ally in species distribution models (SDMs) and conservation planning. The introduction of machine learning (ML) techniques has improved accuracy [29,30] and enabled prediction, thus enabling the detection of other nonmodeled variables.
SDMs can provide useful insights on how biodiversity is distributed across a region based on environmental conditions [31]. Thus, these models have been used as tools to help in identifying and delineating areas of biological importance and complexity [18,32] and facilitate the determination of MPAs. MaxEnt [33] is an SDM tool that produces straightforward, quantitative and spatially explicit information on the interactions of environmental variables and targeted species by applying a ML (i.e., maximum entropy modeling) [34]. By doing so, it derives an output map of “habitat suitability”, which in practical terms depicts how suitable a certain location is for the presence of a certain species. An initial step of modeling biodiversity distribution is implying and calculating environmental variables that may influence the distribution of the species [35]. The major challenge is usually the acquisition of these environmental data, particularly at spatial extents and resolutions that reflect ecologically meaningful habitat structure. In coral reefs, SDMs have been used to investigate corals species distribution, climate change, conservation planning, the potential for spread of invasive species and past climates [36].
The coral reef complex of Tamandaré is of great biological and socioeconomic importance and harbors many commercially important fisheries [37,38]. The presence of three mosaic-organized MPAs in the area is a strong indicator of these characteristics and demonstrates the need for protection of the area as well as human occupation and dependence. The main reef framework in the region is located less than 1 km from the coastline, and the entire region experiences impacts due to recent developments, overfishing, pollution and unorderly tourism [37,39]. The study area includes the first and oldest no-take area in the MPA [40]. Multiple-use zonation, aiming to reconcile conservation and human activities, is one of the main strategies of a Federal Government’s Management Plan for the MPAs [38]. However, criteria for eligibility of those zones are often more practical than scientific, partially due to data limitations on ecological aspects. Thus, it seems urgent to develop and test methods that can aid in those choices while also evaluating the effectiveness of management measures in place. Considering the aforementioned conditions and characteristics, Tamandaré’s coral reefs and one of its dominant coral species (i.e., Millepora alcicornis) were chosen as our study area and species.
This study aims to produce a map of suitable habitats for the occurrence and development of Millepora alcicornis in Northeast Brazil and to evaluate how this distribution is affected by natural features and human impacts. We applied different ML tools to derive and integrate data from cost-effective and multiresolution remote sensing, generating SDMs and human use layers on shallow water coastal reefs. Such integration can optimize cost–benefit relationships and aid in the management of MPAs and other protected areas. Coral reef areas in anthropogenically impacted regions have shifted from past stages [9,41], so present conditions are a result of ecological features and impact pressure. Along these lines, we propose a discussion on the point in which, after environmental thresholds are reached (i.e., “nature”), human use and conservation measures (i.e., “nurture”) start being the main drivers of ecosystem development and maintenance. Habitat suitability must be accessed by proxies that are significantly resistant to eradication in order to guide restoration initiatives and optimize the intrinsic balance between nurture and nature. We hope this work can offer another tool to guide passive or active coral reef restoration initiatives in the next decade.

2. Materials and Methods
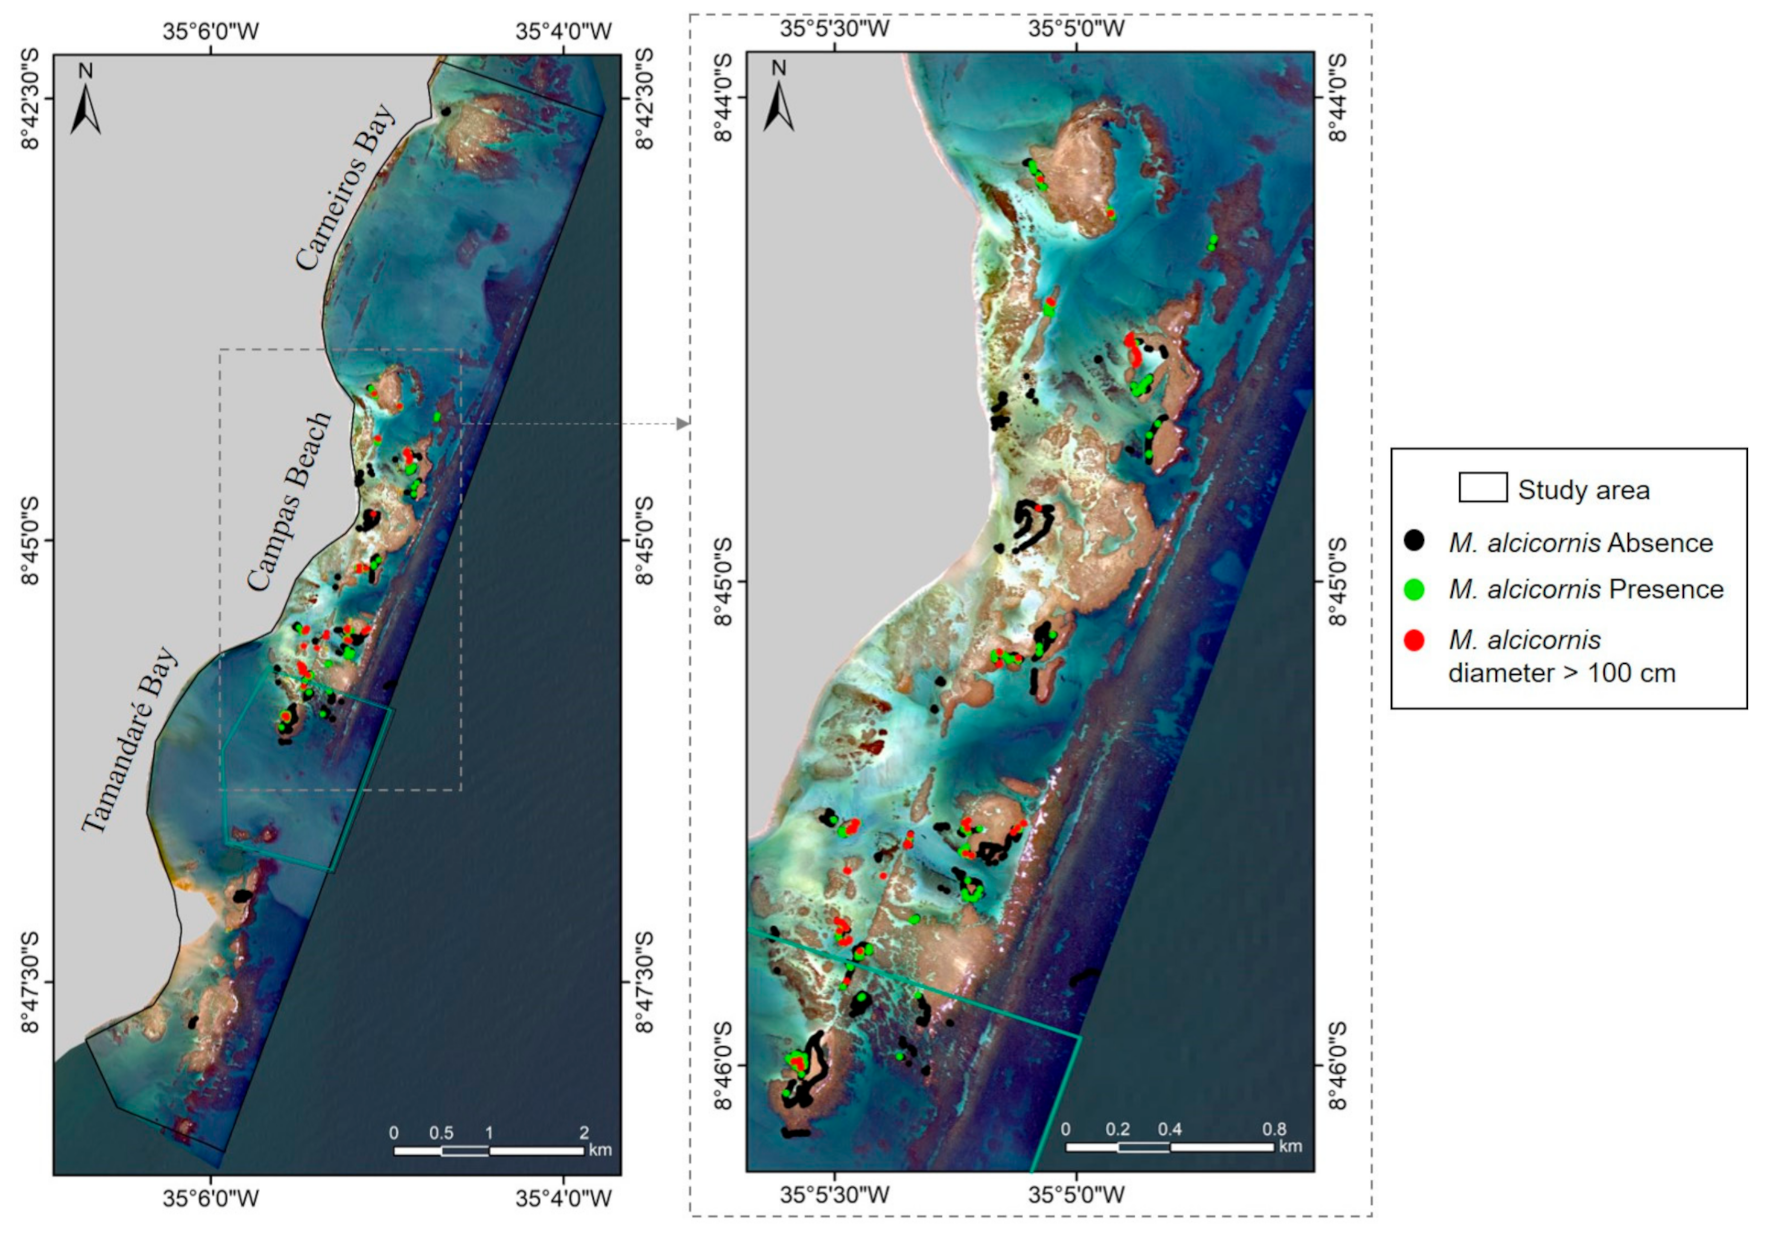
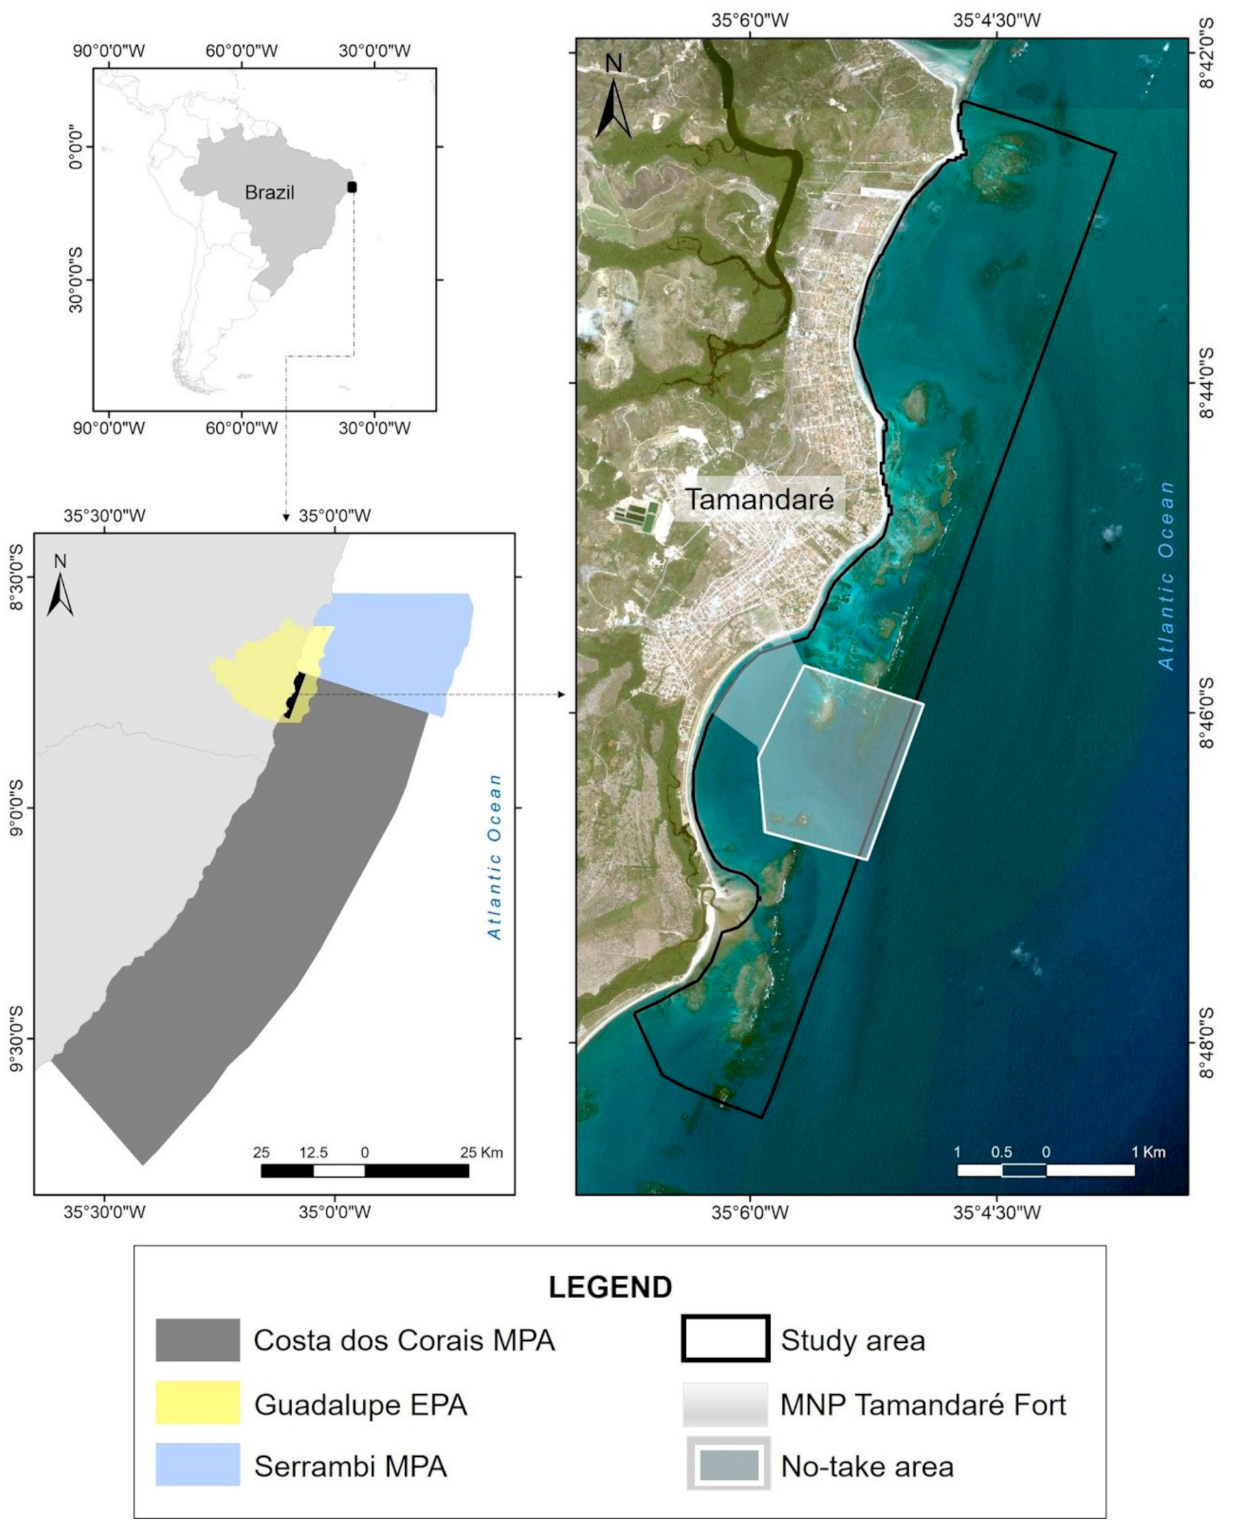
2.1. Study Area

The study area is located in the south of Pernambuco State, Brazil (Figure 1). The main reef complex, in front of the city of Tamandaré, is a region known for its biodiversity, associated with mangroves, estuaries and reef ecosystems present throughout the area [42]. The city has two main rivers, Formoso and Mamucabas, which are the main sediment source for this coastal zone [43], especially during the austral winter months.
The coastal reefs resemble fringing reefs and are arranged in a particular pattern of three lines parallel to the coast with an internal lagoon [44]. They harbor a rich fauna and flora compared to similar areas of the Brazilian Northeast region [37,45]. These environments are inserted in the Costa dos Corais MPA, in zones with different degrees of protection, including no-take zones, exclusive fishing zones and conservation zones [38].
They are located on a shallow carbonate platform, where the clear water, proximity to the coast and biodiversity make this region a regional tourist hotspot [42,46]. The area harbors many commercially valuable fish species, and artisanal fishing is one of the most traditional activities and sources of income in the area [38,47]. One of Costa dos Corais MPA’s main goals is to reconcile the use of the ecosystem, specifically fishing, tourism and its possible derivative impacts, with maintaining the region’s ecological status. Propelled by this objective, a 2.6 km2 no-take zone (i.e., Marine Life Preservation Zone) was also implemented in Tamandaré, in which no human activity is allowed, with the exception of MPA monitoring and research purposes.
Coral reefs in the region, similar to most of the coastal reefs of Brazil, have suffered declines in recent years due to mainly land-based impacts and direct human use [8,37]. One of the most abundant species on reef tops is the fast-growing hydrocoral Millepora alcicornis, known as fire coral and the only branching genus in South Atlantic reefs [45,48,49]. This hydrocoral can be observed in Brazilian coral reefs mostly in its tree-like, branching morphotype and, more rarely, in its encrusting form [49]. Three main morphotypes for Millepora alcicornis (i.e., cellulosa, digitata and fenestrata), which are closely related to the level of turbidity and turbulence in the region, are described [50].
Millepora alcicornis is considered an important reef builder and has a broad distribution throughout the reefs in the study area [37,44,49], with zoning patterns that respond to physical factors [51]. This species is highly tridimensional, contributing to the structural complexity of the reef framework, and offers habitats for various species of fish and invertebrates such as mollusks, crustaceans and polychaetes [51,52]. Due to its dominance in reef tops and high ecological importance in the area, it was chosen as the model species for the SDM.

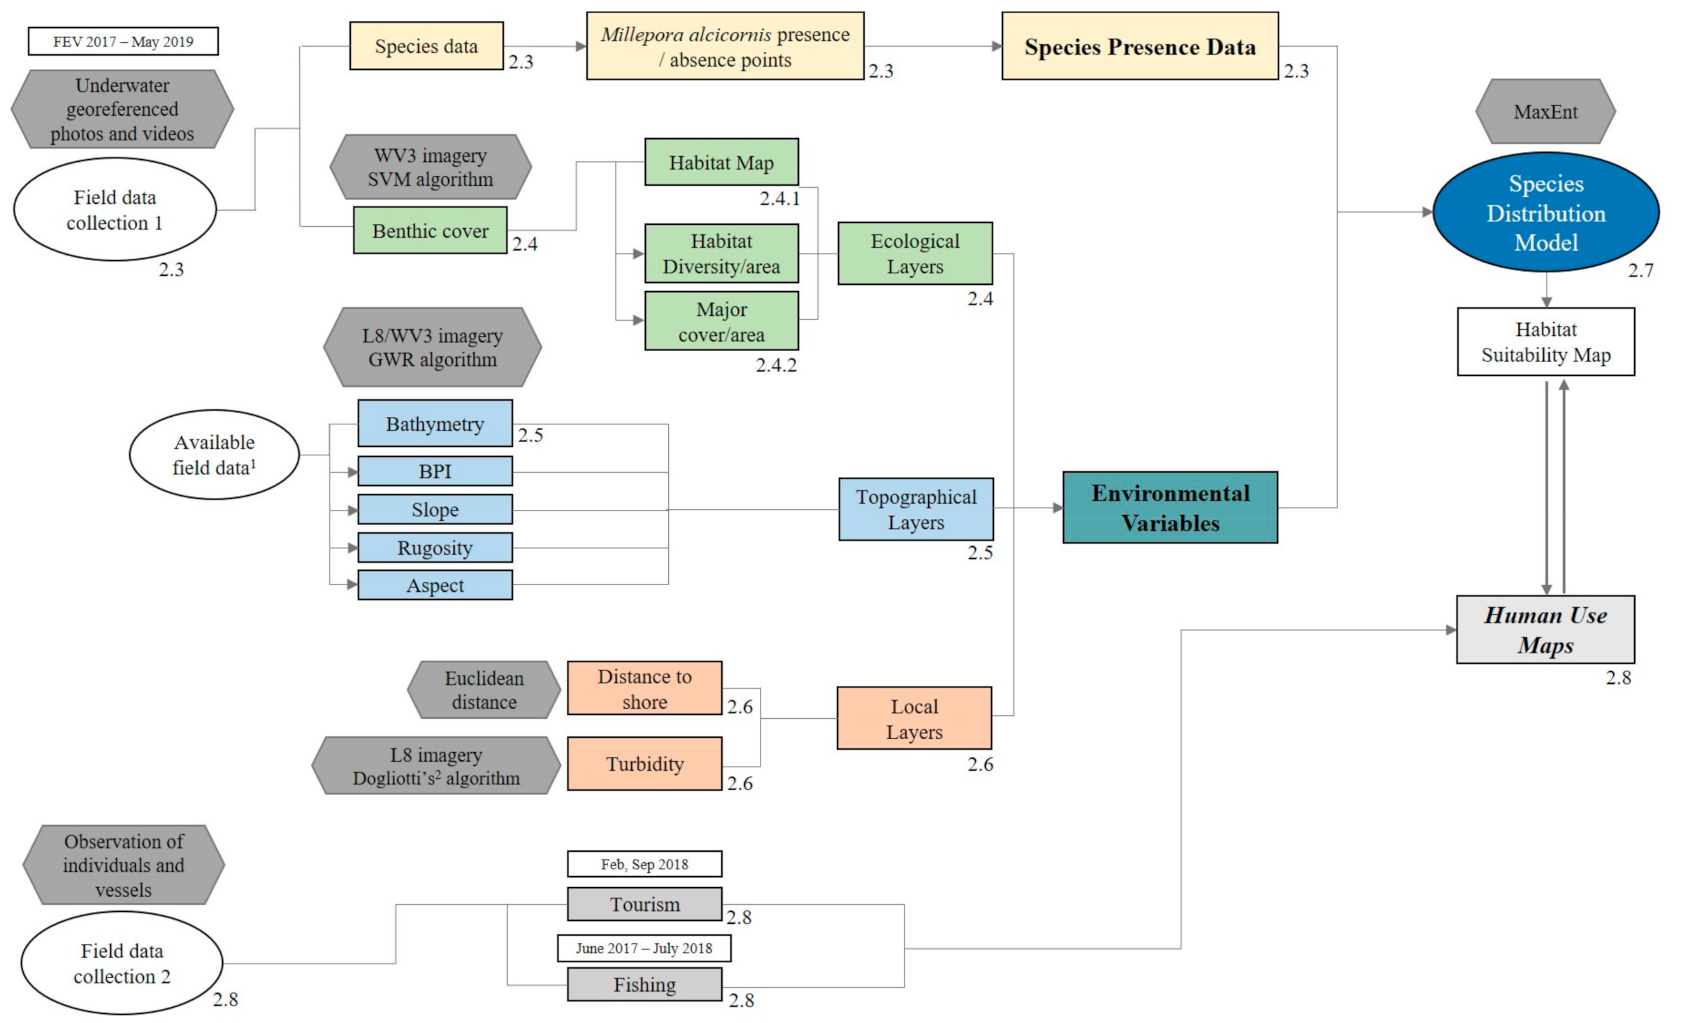
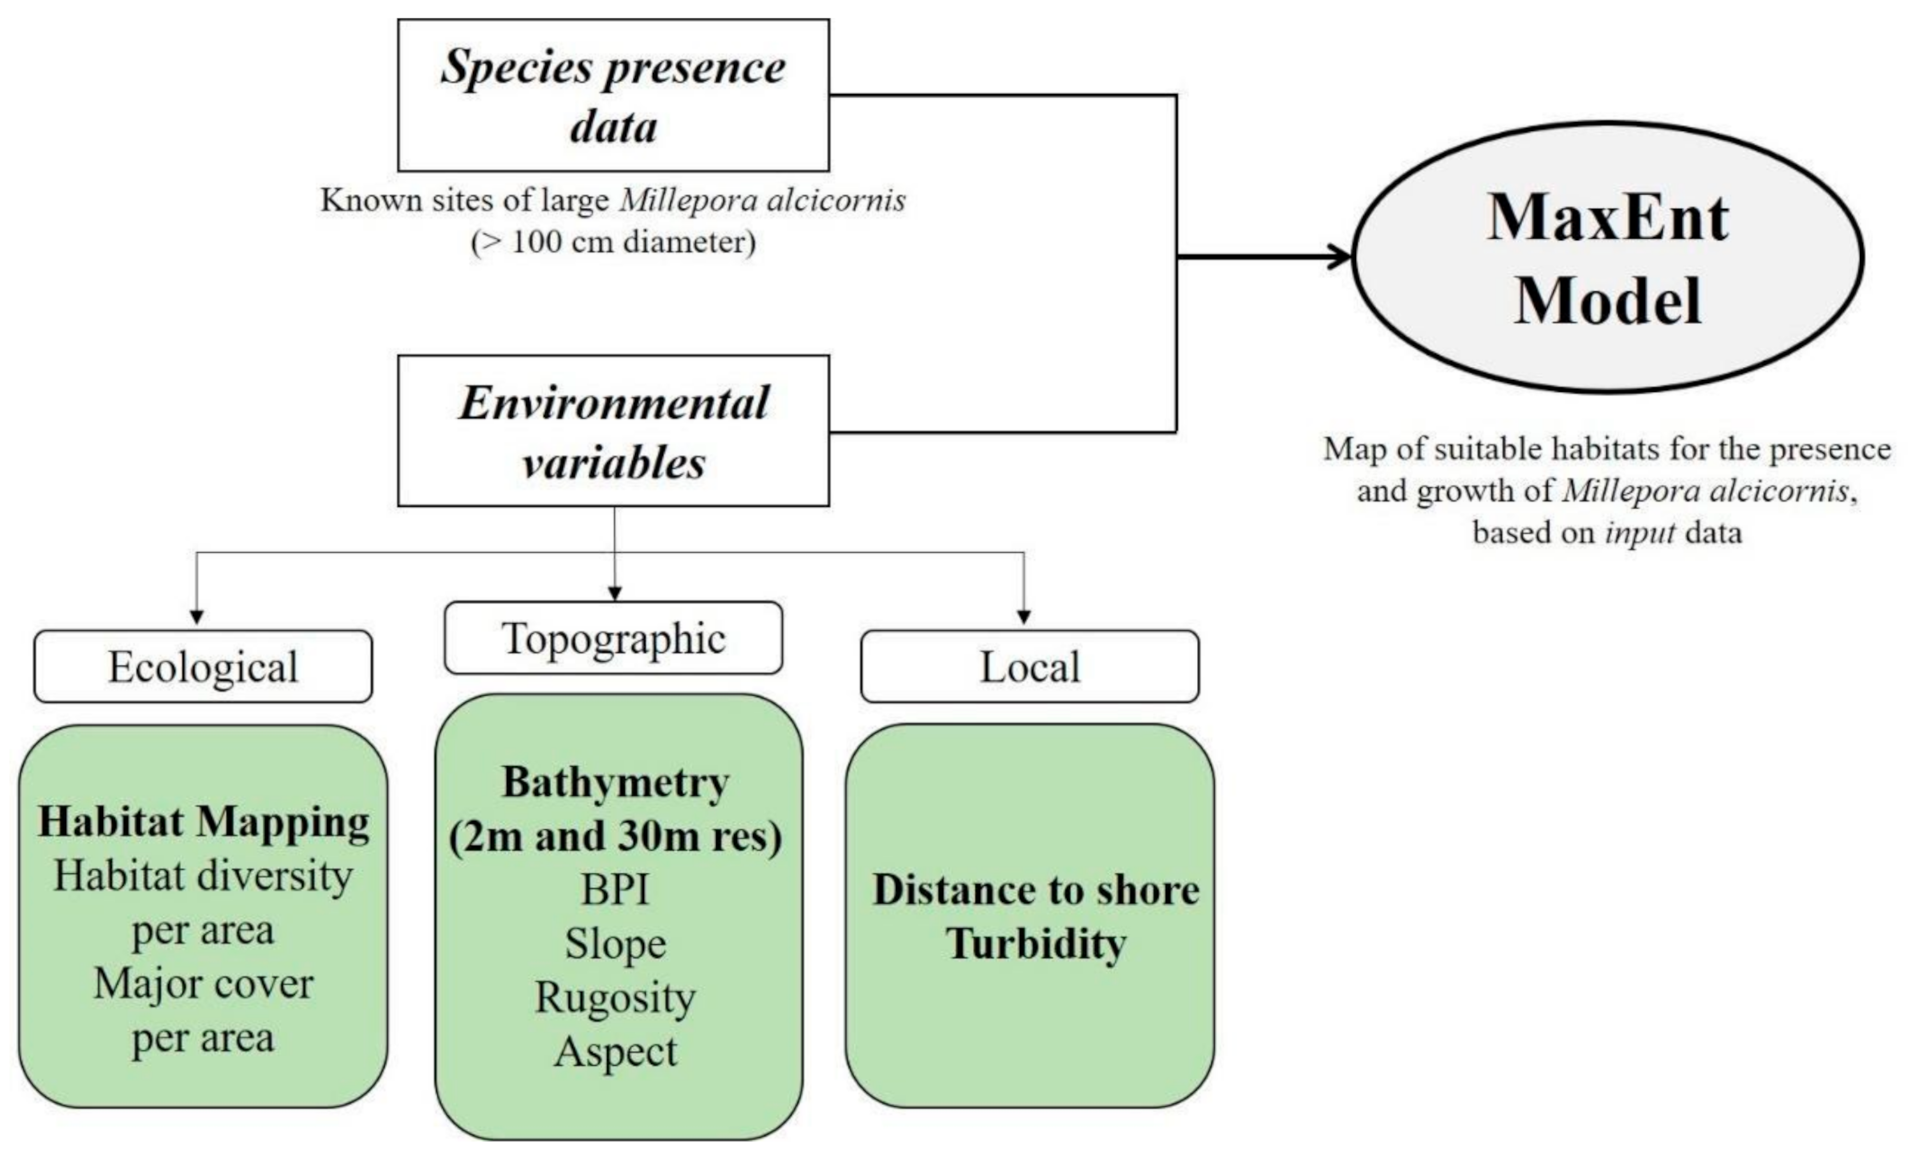
2.2. Methodological Steps—Overview

Here we provide an overview of the following sections, which contain all the steps, methods and processes used in our methodology (Figure 2). Section 2.3 details the field survey conducted to obtain the species presence data for Millepora alcicornis and how these data were subsequentially used in an SDM. Section 2.4 presents the calculation and derivation of the ecological layers used as environmental variables: Section 2.4.1 describes how the habitat map was produced, using supervised classification of a WorldView-3 (WV3) scene, as well as the parameters used to run the support vector machine classifier (SVM) algorithm and its accuracy metrics. Section 2.4.2 details the ecological layers derived from the habitat mapping (diversity per area and major cover per area). Section 2.5 presents the topographical layers used as environmental variables, the calculation of remotely sensed bathymetry using geographically weighted regressions (GWR) from high- and medium-resolution satellite imagery and its derivative layers. Section 2.6 details the calculation of distance to shore and turbidity, our “local layers”. Section 2.7 details the integration of the aforementioned sections to produce an SDM using maximum entropy algorithm in MaxEnt software. Finally, Section 2.8 presents the use layers considered in this study, i.e., fishing and tourism pressure.

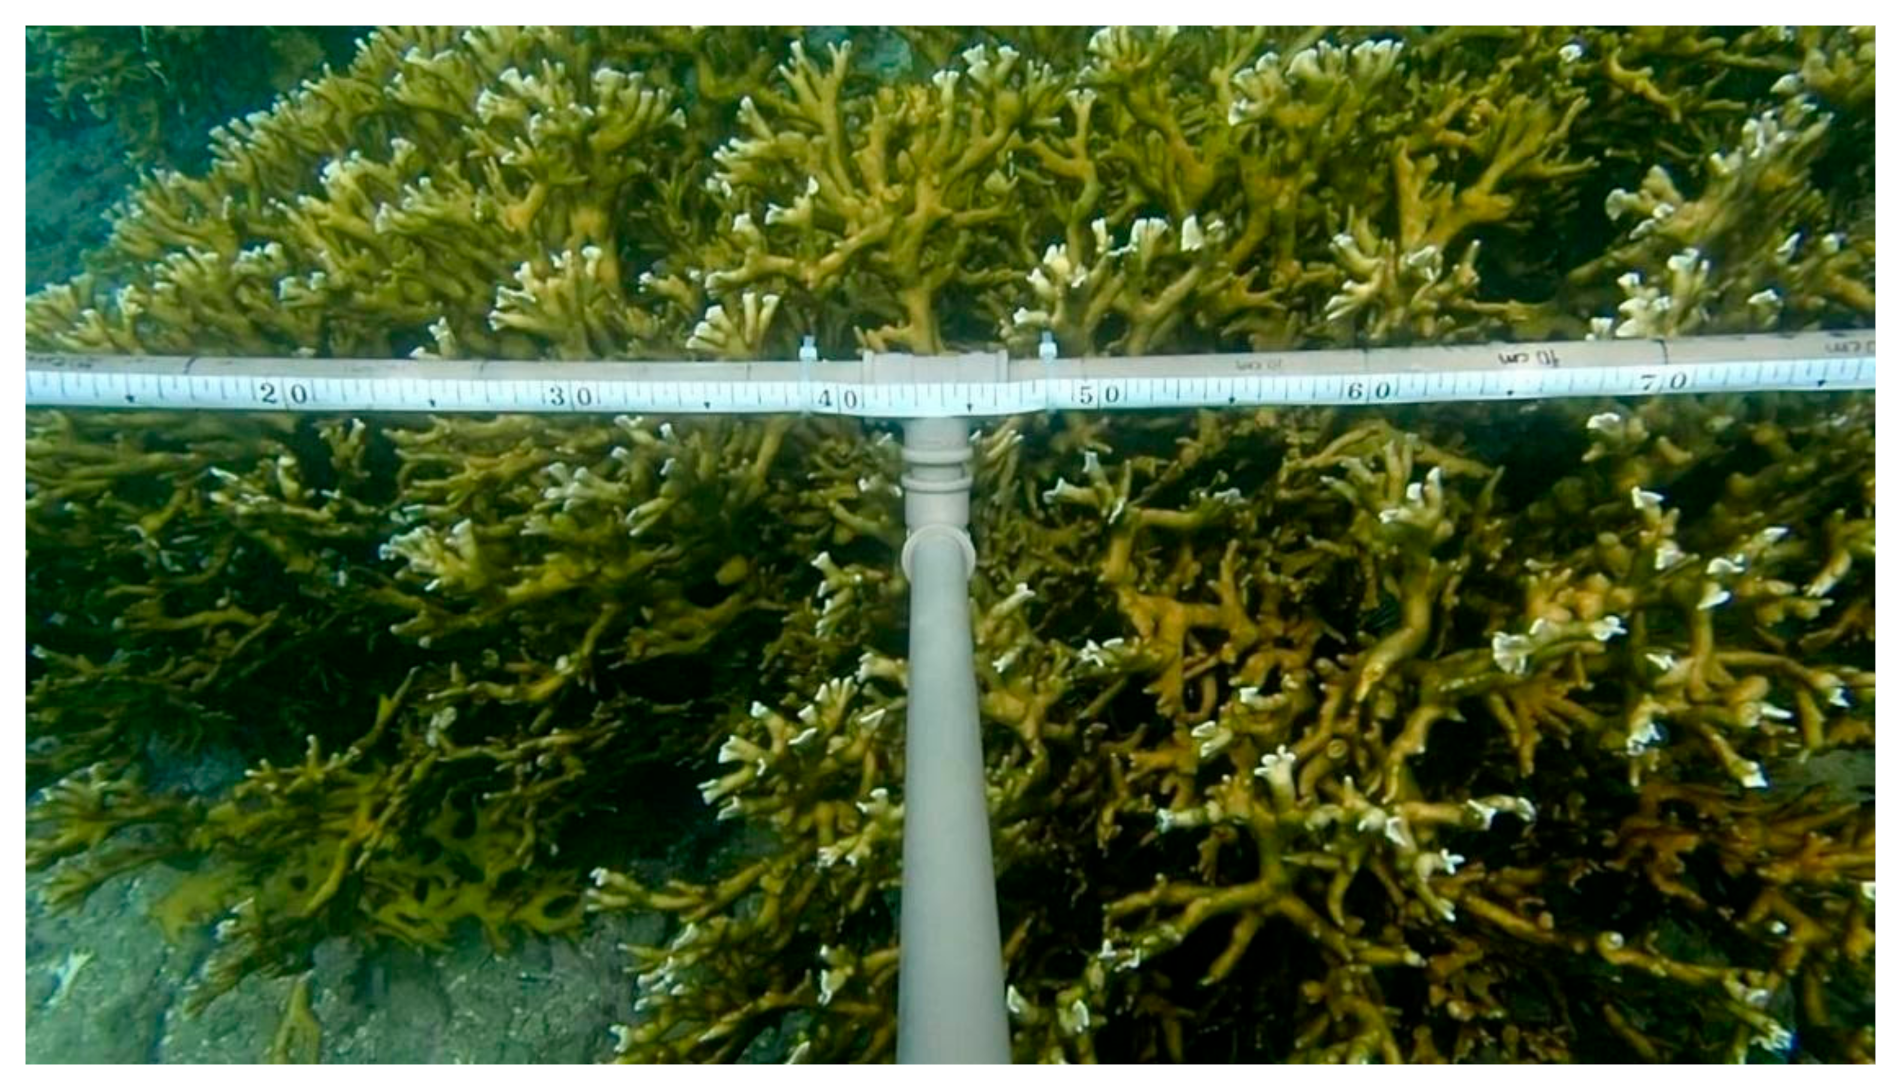
2.3. Species Presence Data

Underwater mapping of hydrocoral Millepora alcicornis was conducted from February 2017 to May 2019, as part of a conjoined, ongoing effort to map the benthic habitats and monitor the coral reefs of the area [53]. As habitat mapping was also an important layer and had to be developed during this research, we purposely surveyed areas of known occurrence of the species as well as areas of known absence, such as seagrass and macroalgae beds, sand and exposed reef tops.
Field survey was undertaken using photo and video transects and a diver-towed GPS (Garmin, Taiwan, model eTrex 20x) [35,54,55] recording location data at 5 s intervals. For the photo-transects, a 30 × 30 cm quadrat was used, made using polyvinyl chloride (PVC) for the frame and handle. Video recordings were undertaken by a patiently swimming diver using a GoPro coupled on top of a one-meter handle. To enable the estimation of the size of each coral colony, a measuring tape was attached to a PVC one-dimensional frame (Figure 3). The location of each coral colony was recorded by checking the timestamp of the specific photos and video frames containing the species and syncing it with a digital watch carefully synchronized with the towed GPS.
Specimens of Millepora alcicornis were also classified by size, and only colonies larger than 100 cm were used in the model. Considering the rapid growth rate exhibited by this species and that the branches of Millepora alcicornis can be fragmented, dispersed and start settlement and growth even under unexpected conditions [56,57], we believe that this 100 cm size rule indicates that the site has been colonized by the colony for at least five years [57,58,59].

2.4. Environmental Variables—Ecological Layers

The ecological layers included the benthic habitat mapping of Tamandaré reefs and its derivatives in different scales (i.e., diversity of habitats and major cover per area). Biological features and benthic cover are known to greatly influence settlement, growth and distribution of corals [60,61] and thus were deemed essential in this study.

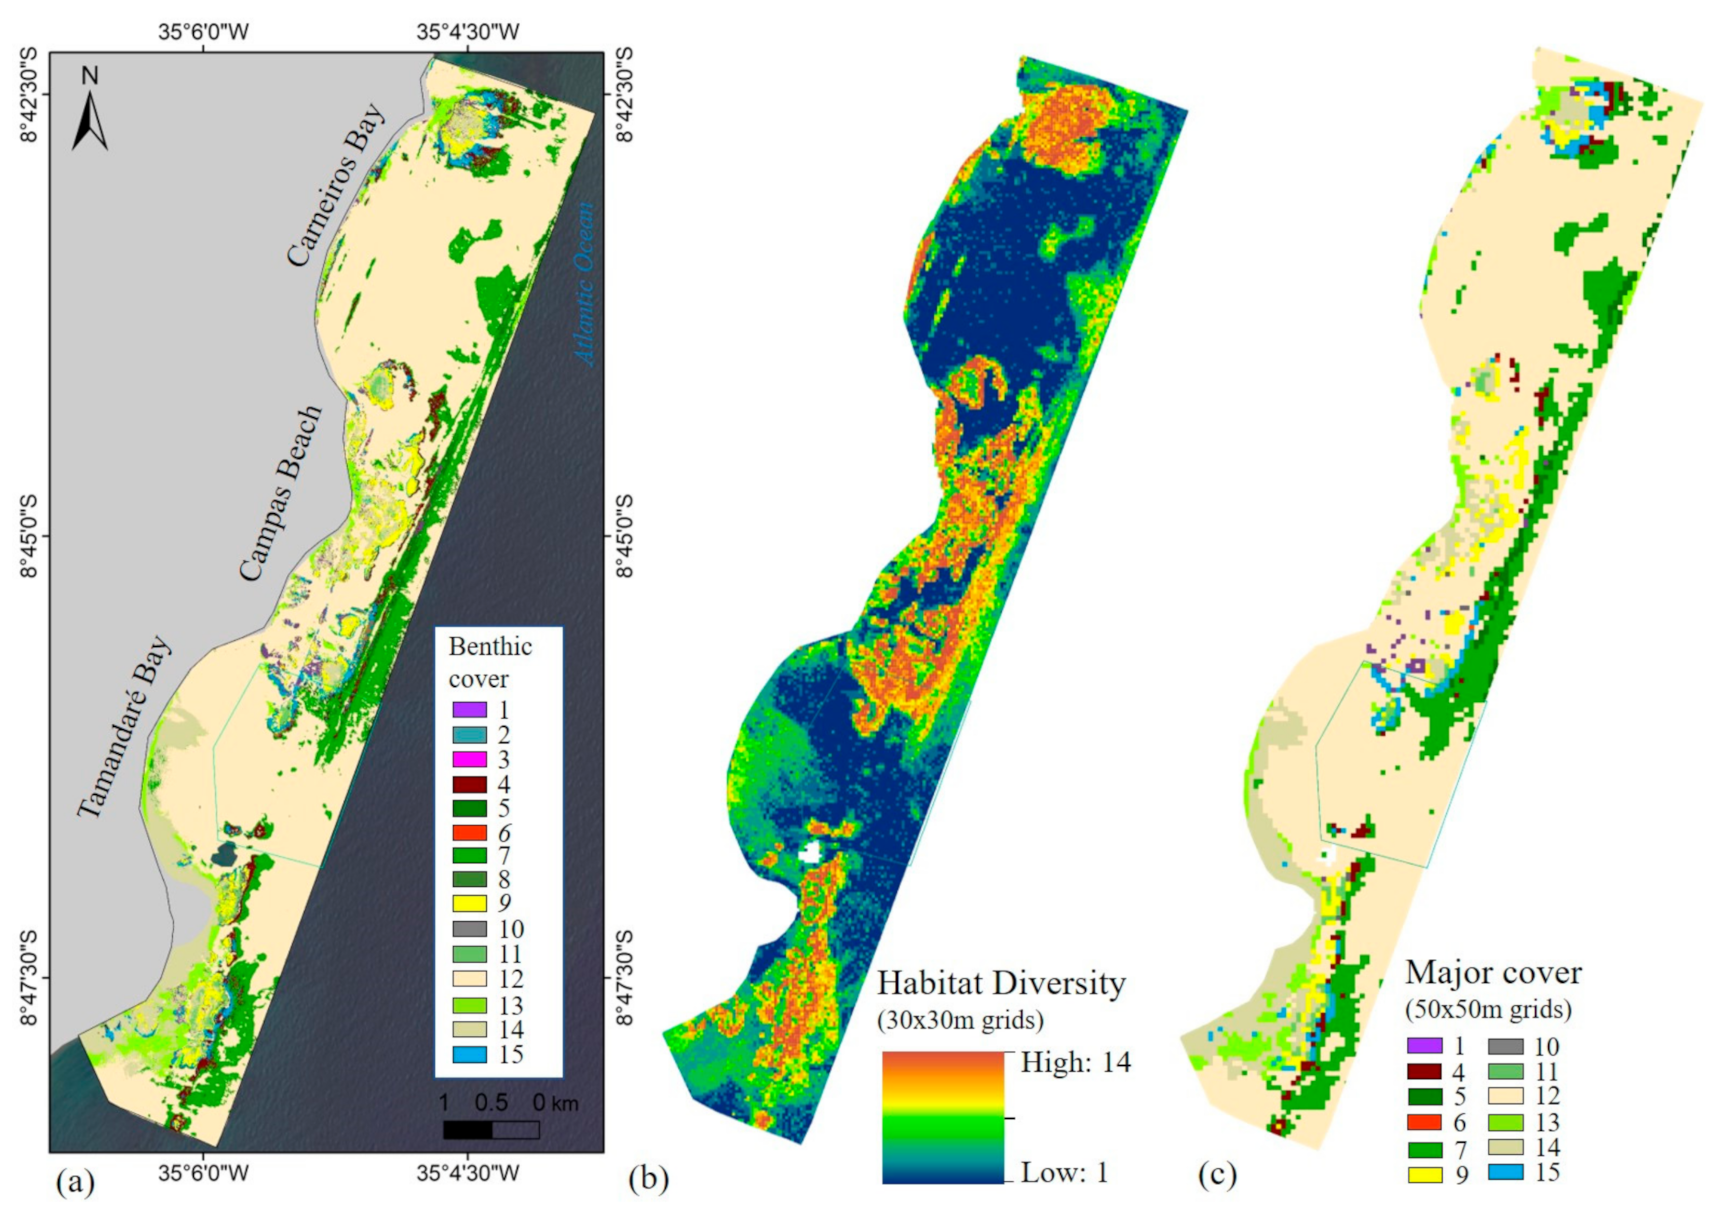
2.4.1. Habitat Mapping

The habitat map was produced by supervised classification of a WV3 scene (Table 1), which provided excellent detail due to its spatial resolution (2 m/pixel). The scene was acquired through DigitalGlobe and selected based on visual criteria such as low cloud cover and sun glint. The processing steps of the satellite imagery were radiometric and atmospheric correction, land and cloud masking and water column corrections [27,62,63]. Glint correction was not necessary as the image showed negligible sun glint in the study area.
Atmospheric correction was performed using ATCOR module in ERDAS IMAGINE (ERDAS, 2014) software. This step converts digital numbers to surface reflectance and intends to reduce atmospheric effects and thus improve the quality of the imagery and recovery of surface reflectance values [64]. Atmospheric correction uses specific parameters for the area and sensor, available in the scene’s metadata file, to produce atmospherically and radiometrically corrected datasets (Table 1).
Land and cloud masking was performed by manually selecting and vectorizing unwanted pixels. These pixels, which included land, clouds and off-land constructions such as vessels and a pier, were subsequently excluded from the imagery.
Due to the influence of variable depth on spectral data, water column correction is a recommended step in most underwater habitat mapping efforts and can greatly improve the quality of the classification of marine habitats [62]. In this study, we generated depth-invariant index (DII) of bottom type, following the methodology proposed in [62]. Five spectral bands with good penetration of water were selected: coastal (B1), blue (B2), green (B3), yellow (B4) and red (B5). As the process is carried out using pairs of spectral bands, the water column correction process was implemented in 10 band pairs. This final corrected scene was the dataset used to derive the habitat map.
Field data collection was done in coordination with Millepora alcicornis colony surveys, using georeferenced underwater photos and videos [54,55] (Section 2.3). Approximately 7500 frames resulted from these campaigns, which were synchronized with GPS data and placed on the satellite scene. In every frame, the main benthic cover was identified visually, following, whenever possible, the Reef Check Brazil substrate cover identification scheme [53]. During the analyses of photos and videos, all coral colonies were identified (genus and species) and counted.
We selected points that best represented each benthic habitat proposed to be used as training sets in the supervised classification of the WV3 image (1500 points). SVM (Spatial Analyst Toolbox in ArcMap 10.4) was used to classify the scene and map the 15 habitat classes we identified in the region (cross-validation rate = 0.91; kernel type = radial basis function; svm type = c_svc): reef rubble, rock/algae and urchin, rock/coral and urchin, fore-reef/“Itapitangas”, macroalgae, Millepora alcicornis, algae turf (leafy), macroalgae and seagrass, Palythoa caribaeorum, hard substratum–reef flat, reef flat with algae, sand, seagrass, terrigenous sediment and calcareous mat. To test the accuracy of the resulting habitat map, we selected 30 pixels per class (totaling 450 pixels) and analyzed the suggested cover against points that were not used to train the algorithms, which resulted in an overall accuracy of 79%. The confusion matrix, kappa values and accuracy metrics derived from this accuracy assessment are displayed in Table 2. Additionally, 10 frames per class were analyzed in CPCe software [65], using 15 points per photo, to quantify each cover’s percentage.

2.4.2. Derivative Ecological Layers

Using the habitat map produced previously, we derived the habitat diversity and the major cover layers for three window sizes 30 × 30 m (900 m2), 50 × 50 m (2500 m2) and 100 × 100 m (10,000 m2). Habitat diversity was derived by calculating the number of different habitats in each grid cell (Zonal tool—Variety, in Spatial Analyst Toolbox in ArcMap 10.4). Major cover was also derived directly from the habitat map (Zonal tool—Majority) and was used to test if the dominant benthic cover within the colonies’ surroundings is a factor determining the distribution of Millepora alcicornis in the area.

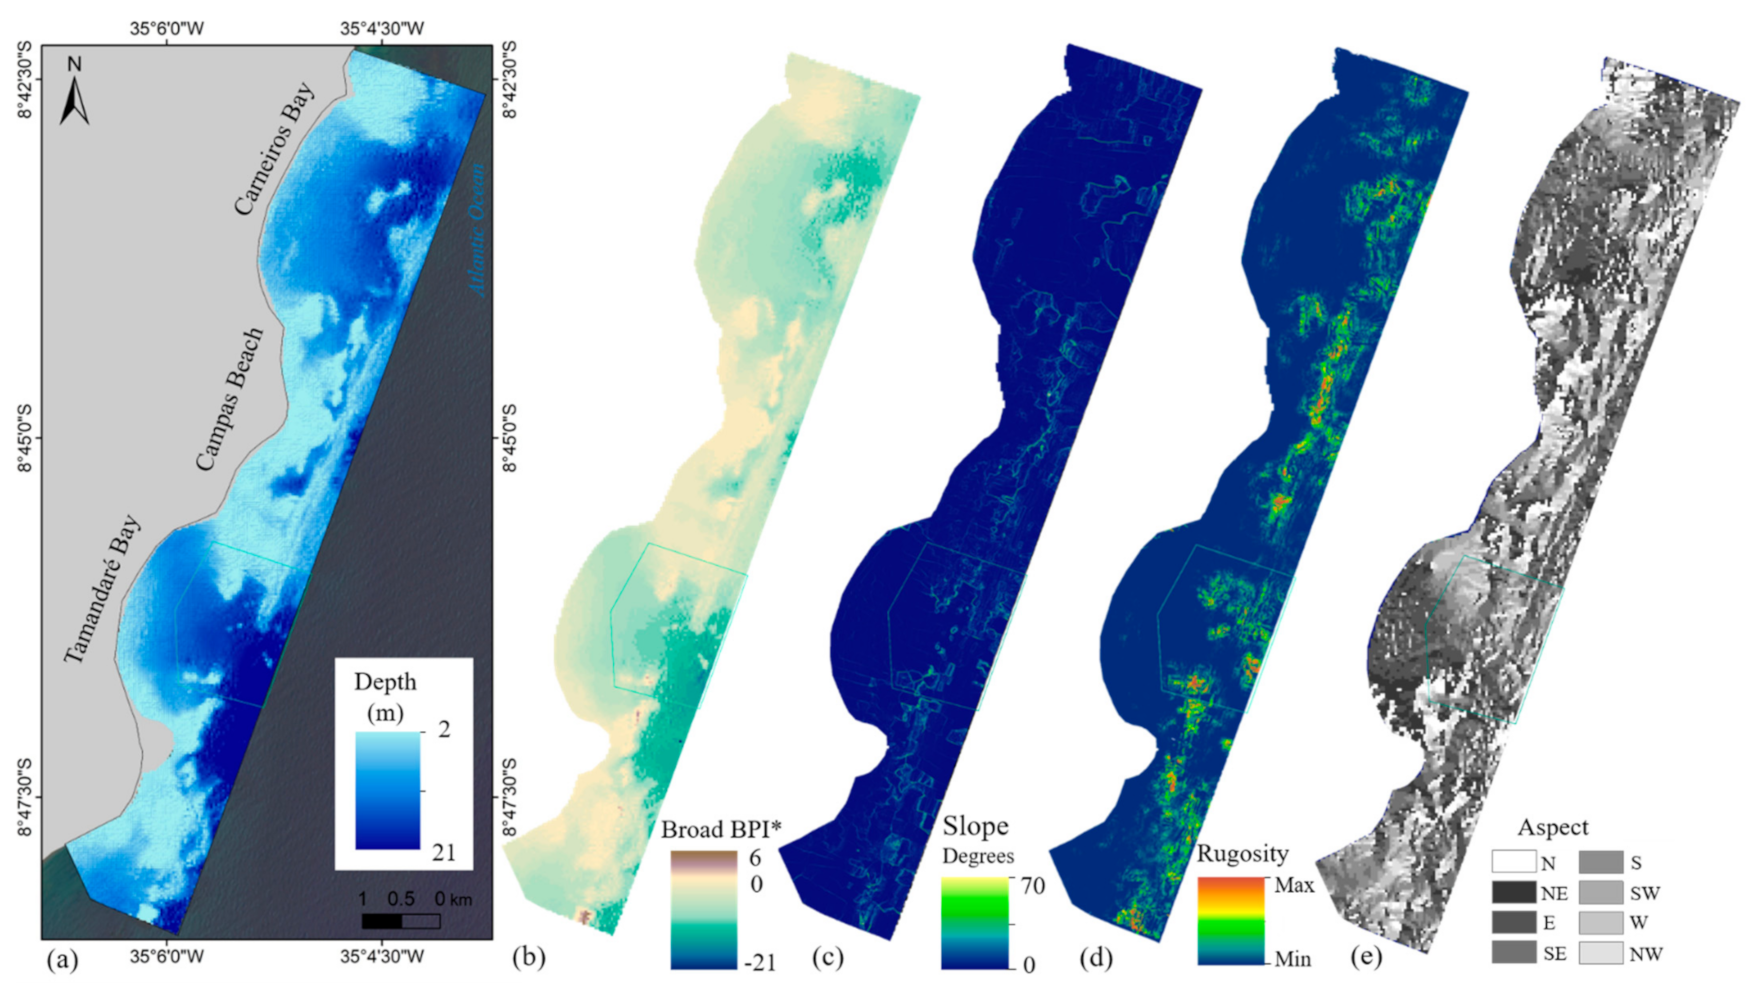
2.5. Environmental Variables—Topographical Layers

Topographic layers were all derived from fine- and medium-resolution bathymetric data available for Tamandaré’s coastal zone [25]. Both scenes were acquired during the austral summer and selected based on visual criteria such as water transparency, low cloud cover and turbidity (acquisition dates were 11 December 2016 and 23 February 2017 for Landsat-8 (L8) and WV3, respectively). Multiresolution satellite-derived bathymetry was calculated using field data and GWR, which improved the accuracy and applicability of the bathymetric models. GWR’s root mean square values were 0.92 and 0.95 for the medium- and fine-resolution satellite-derived bathymetric datasets, respectively. A complete and detailed description of the methodology is found in [25]. From these datasets, four derivatives were calculated: bathymetric position index (BPI), slope, rugosity and aspect. These seascape characteristics are known to influence coral reef zoning and species distribution [51] and are frequently applied in distribution modeling studies [18,35,66]. Topographic layers were derived using Benthic Terrain Modeler (BTM) version 3.0 extension for ArcGIS (Walbridge et al., 2018).
BPI compares the depth of each pixel to the mean depth of a determined surrounding area [67,68]. In other words, it calculates where the pixel is (vertically) compared to its surroundings. As a result, positive BPI values reflect how much shallower a pixel is, in relation to the mean (such as reef structures, reef crests), and negative BPI values reflect how much deeper a pixel is (such as channels, intra-reef lagoons). Slope is given in degrees and is defined as the maximum rate of depth change, or the gradient of each cell using a 3 × 3 screening window. Rugosity was inferred using the Vector Ruggedness Measure (VRM) tool in BTM, and it incorporates slope and aspect into a single unidimensional measure [69]. VRM calculates rugosity (i.e., terrain structural complexity) by measuring the dispersion of vectors orthogonal to the ground surface [70]. It was derived using a 5 × 5 window for the high-resolution bathymetric dataset and a 3 × 3 window for the medium-resolution data. Aspect, given in degrees (0 to 360°), reflects the compass direction of each cell’s gradient (i.e., the orientation of the seabed in a given location) and can be an important predictor in areas where large-scale hydrodynamics and water flow are in place [71,72,73].

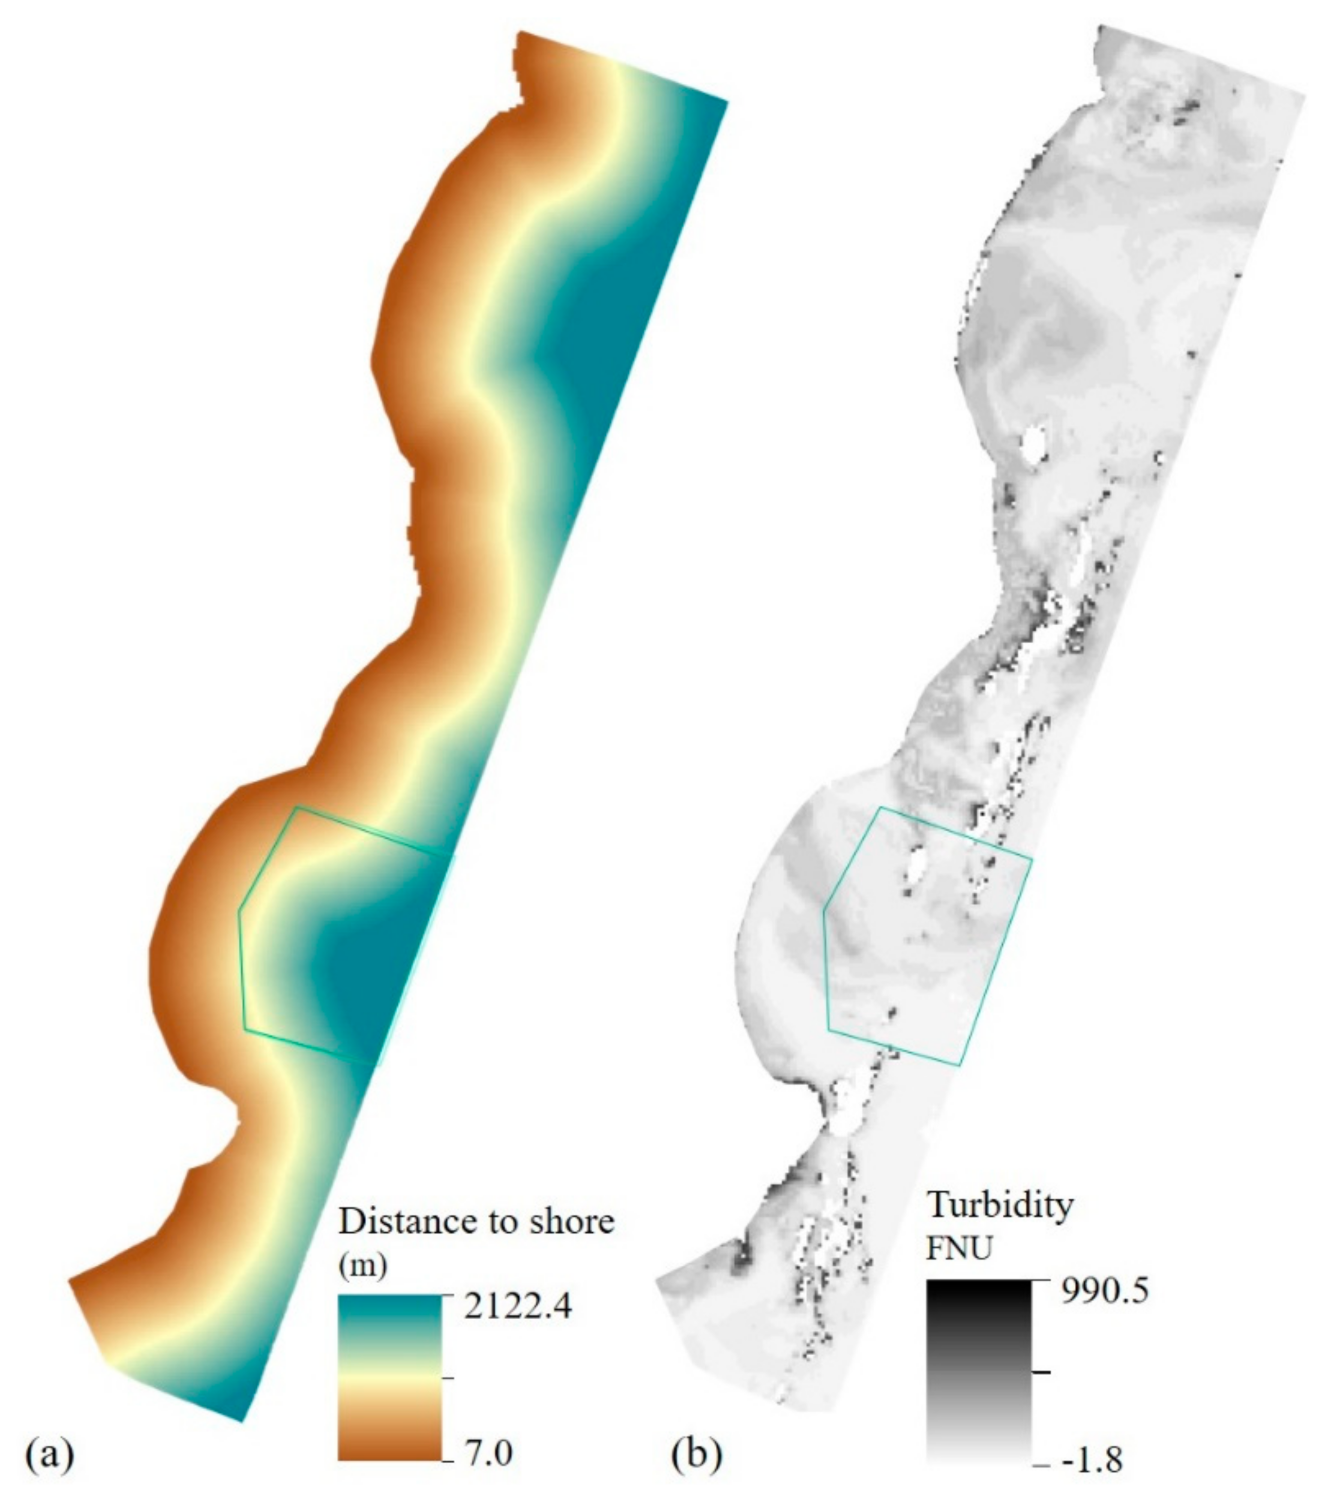
2.6. Environmental Variables—Local Layers

Local environmental attributes that could affect the distribution of Millepora alcicornis were distance to shore and turbidity. The coastline was vectorized using the WV3 image as a reference. Distance to shore was then determined by calculating the Euclidean distance between each pixel in the WV3 image and the closest shore point on a line drawn on the coast–sea boundary. It can affect the stability of the habitat, since areas closer to the coast usually suffer more impacts due to trampling, coastal erosion, pollution and tourist-related damage [7,13,32]. Turbidity is considered a relevant indicator of water quality and a proxy of suspended particulate matter [74,75]. Turbidity (in formazin nephelometric units (FNU)) was derived from a L8 satellite image acquired on 20 July 2016 showing extreme flood conditions and an apparently increased influx of sediment to the area. The algorithm [75] uses the red and near infra-red (NIR) bands to retrieve a relative measure of turbidity. ACOLITE software (version 20181210.0) [76,77] was used to implement this step and produce a turbidity map for the study area.

2.7. Modeling Suitable Habitats for Millepora alcicornis
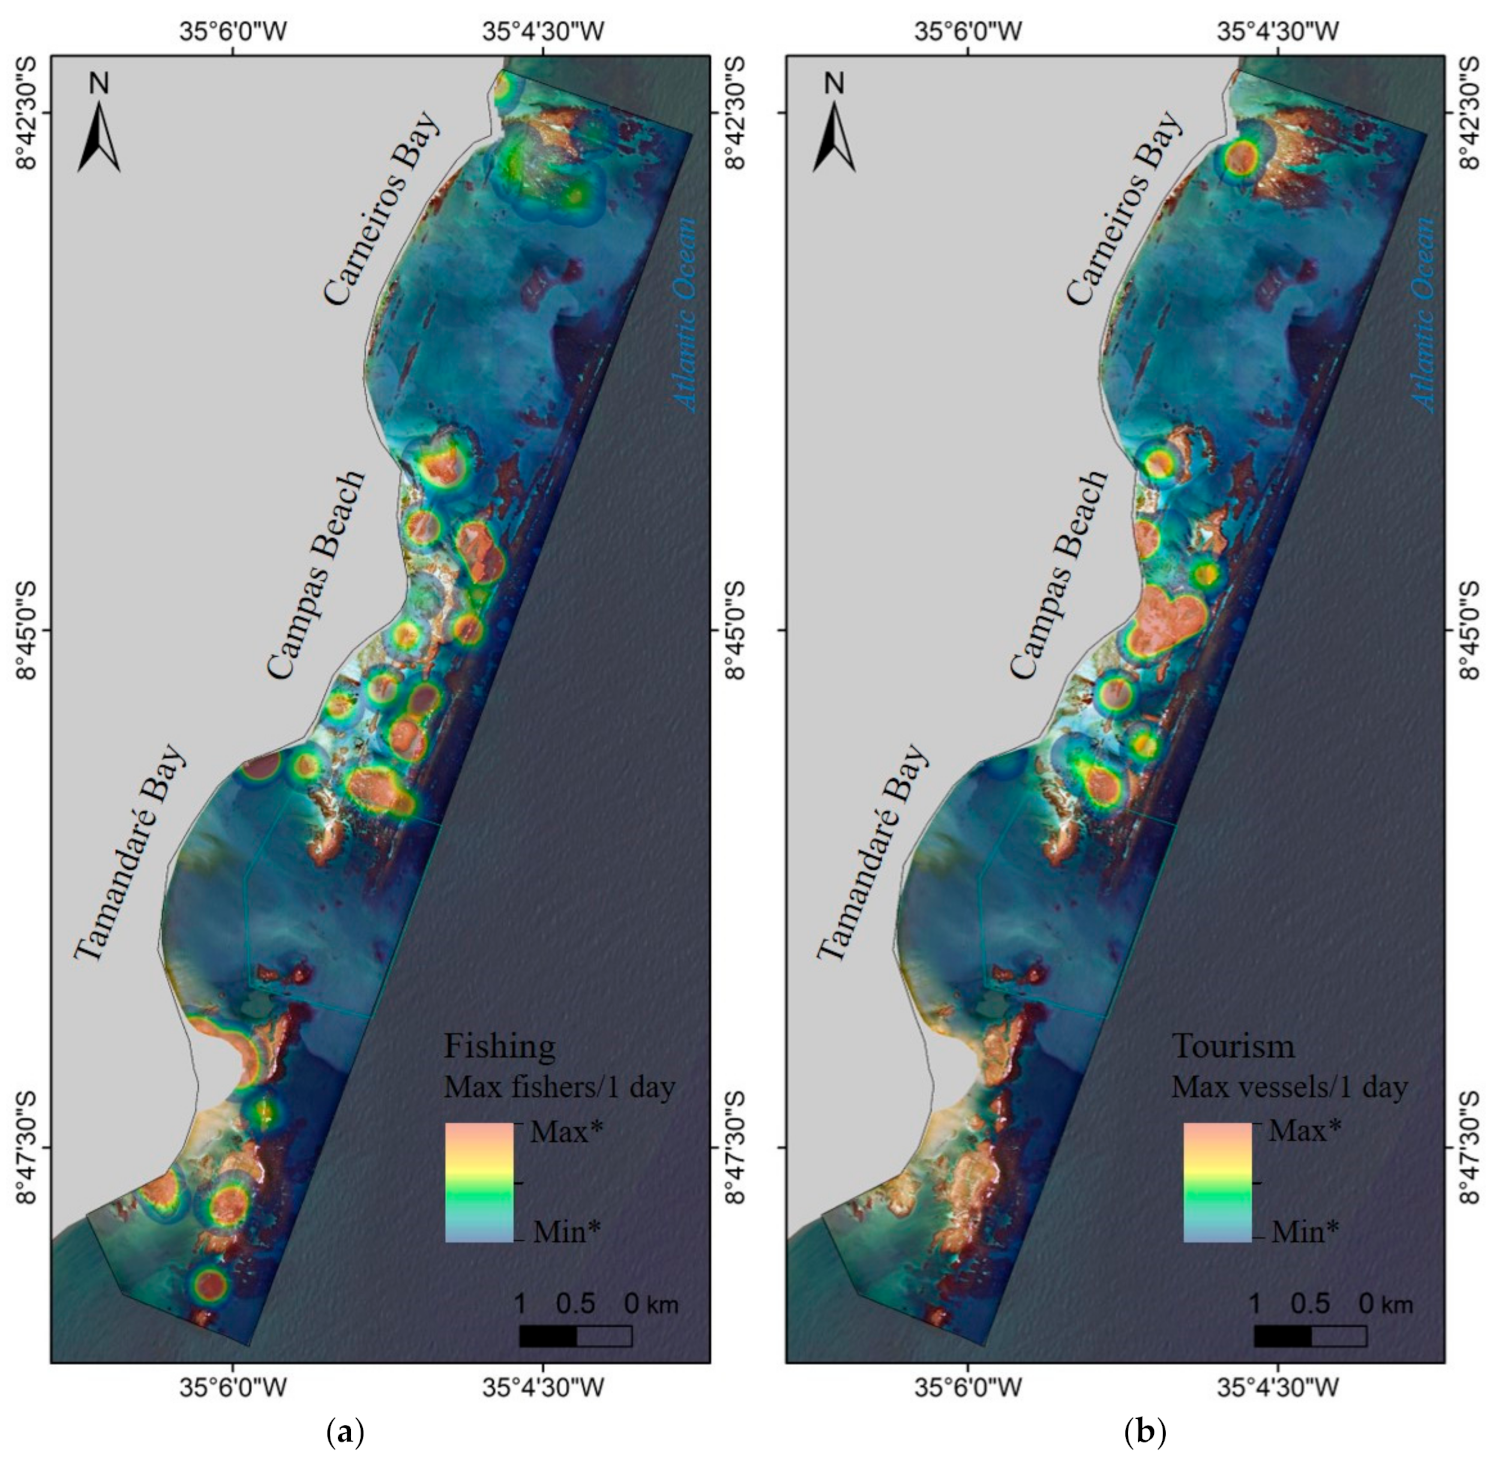
We used MaxEnt software in this research to create predictive models of the location of large colonies of the hydrocoral Millepora alcicornis. This methodology has been widely used to produce SDMs and thus to analyze and predict suitable habitats for a range of terrestrial and marine species [78,79,80]. We chose this software due to its robustness and capacity of working well with presence-only data, even in small numbers [18,33]. It has also resulted in higher map accuracy in coral reef modeling applications when compared with other approaches [2]. MaxEnt identifies where a certain species is most likely to occur, based on the similarities between each pixel in the study area and the presence pixels used as input. To do so, it relies on two sets of input data: first, known occurrences of the target species (or group) and second, topographical, physical and/or biological data on their environment. The role of each environmental feature is also calculated and depicted by response curves, which provide important information on the plausibility of the resulting model [81]. To interpret and evaluate the results, MaxEnt provides a metric of model fit, “area under the receiver operating characteristic curve” (AUC), which is a threshold measure of the model’s discriminatory ability (an AUC score <0.5 means the resulting model is no better than a random prediction) [81,82].
We used presence-only data and default parameters to run the analysis (convergence threshold of 0.00005 and maximum iteration value of 500) and a “logistic” output type. Duplicated records were removed from the analysis; 70% of occurrence data were used as training, and the remaining 30% were used as test data. It is imperative to remember that MaxEnt’s output relying on presence-only data, as is the case of this study, should not be interpreted as probability of occurrence, but rather as a relative measure of how suitable a location is for the occurrence of a certain species based on the input layers provided. After running the model, we used jackknife and individual response curves to analyze the contribution of each variable.
In this research, points where we found large colonies of the hydrocoral Millepora alcicornis (diameter > 100 cm) were used as presence data. We applied a machine learning approach, which suggests including all reasonable predictors and letting the algorithm choose which are the most important ones [81]. The environmental variables chosen here are displayed in Figure 4 and have been applied in previous similar studies [18,83]. Additionally, other authors have shown the importance of using variables in varying window sizes [66]. Therefore, our topographical and ecological data were derived in different scales, to consider a wider range of spatial resolution in which a predictor can impact the final model.

2.8. Use Layers

The “use layers” considered in this study were fishing and tourism pressure. These activities occur on top of the reef structures, or in their immediate surroundings (Silveira, 2018), and thus can interact negatively with the settling and continuous growth of coral colonies.
The tourism layer was calculated using the maximum number of tourism-related vessels observed in the proximities of a reef area or reef lagoon on a given day (including speed boats, artisanal vessels called “jangadas” and catamarans). Three surveys were conducted in 2018, during Brazilian holidays or busy weekends (2 February, 13 September, 14 September), to allow the estimation of the largest impacts.
Fishing data were collected during a 12-month period (July 2016 to June 2017), on an average of two days each week, totaling 87 survey days [46]. Although the data used in this study only comprised 2016 and 2017, artisanal fisheries in Tamandaré have been surveyed since 2005 due to a multi-institutional collaboration of Instituto Recifes Costeiros and SOS Mata Atlântica Foundation. Following the same pattern of the tourism layer calculation, the fishing map was derived using the maximum number of fishers in a reef area on a given day.

3. Results

3.1. MaxEnt Input Parameters

3.1.1. Millepora alcicornis Presence Data

Millepora alcicornis had the second highest rate of occurrence (registered in 859 in 7437 total points in the study area), surpassed only by Siderastrea sp. (1392 in 7437 total points). Out of these 859, 222 registers were of colonies with diameters larger than 100 cm (2.98% of total points). Almost all large colonies (185 registers) were found on a consolidated reef structure, usually on reef crests. Few specimens (37 points) were also associated with reef rubble, detached from a larger framework. All larger colonies in our survey data were on the central region of the study area (Campas Beach and Tamandaré Bay) and were of the ramified type with a “fine branching” form (Figure 5).
During the course of this study, we were able to register all 11 coral species described for the area. The species and their rates of occurrence (number of points where the species was registered in 7437 total points) were as follows: Siderastrea sp. (1392 points), Millepora alcicornis (859), Agaricia humilis (455), Porites astreoides (430), Favia gravida (238), Millepora braziliensis (199), Mussismilia hispida (73), Montastraea cavernosa (50), Mussismilia harttii (41), Porites branneri (26) and Scolymia welsii (8).

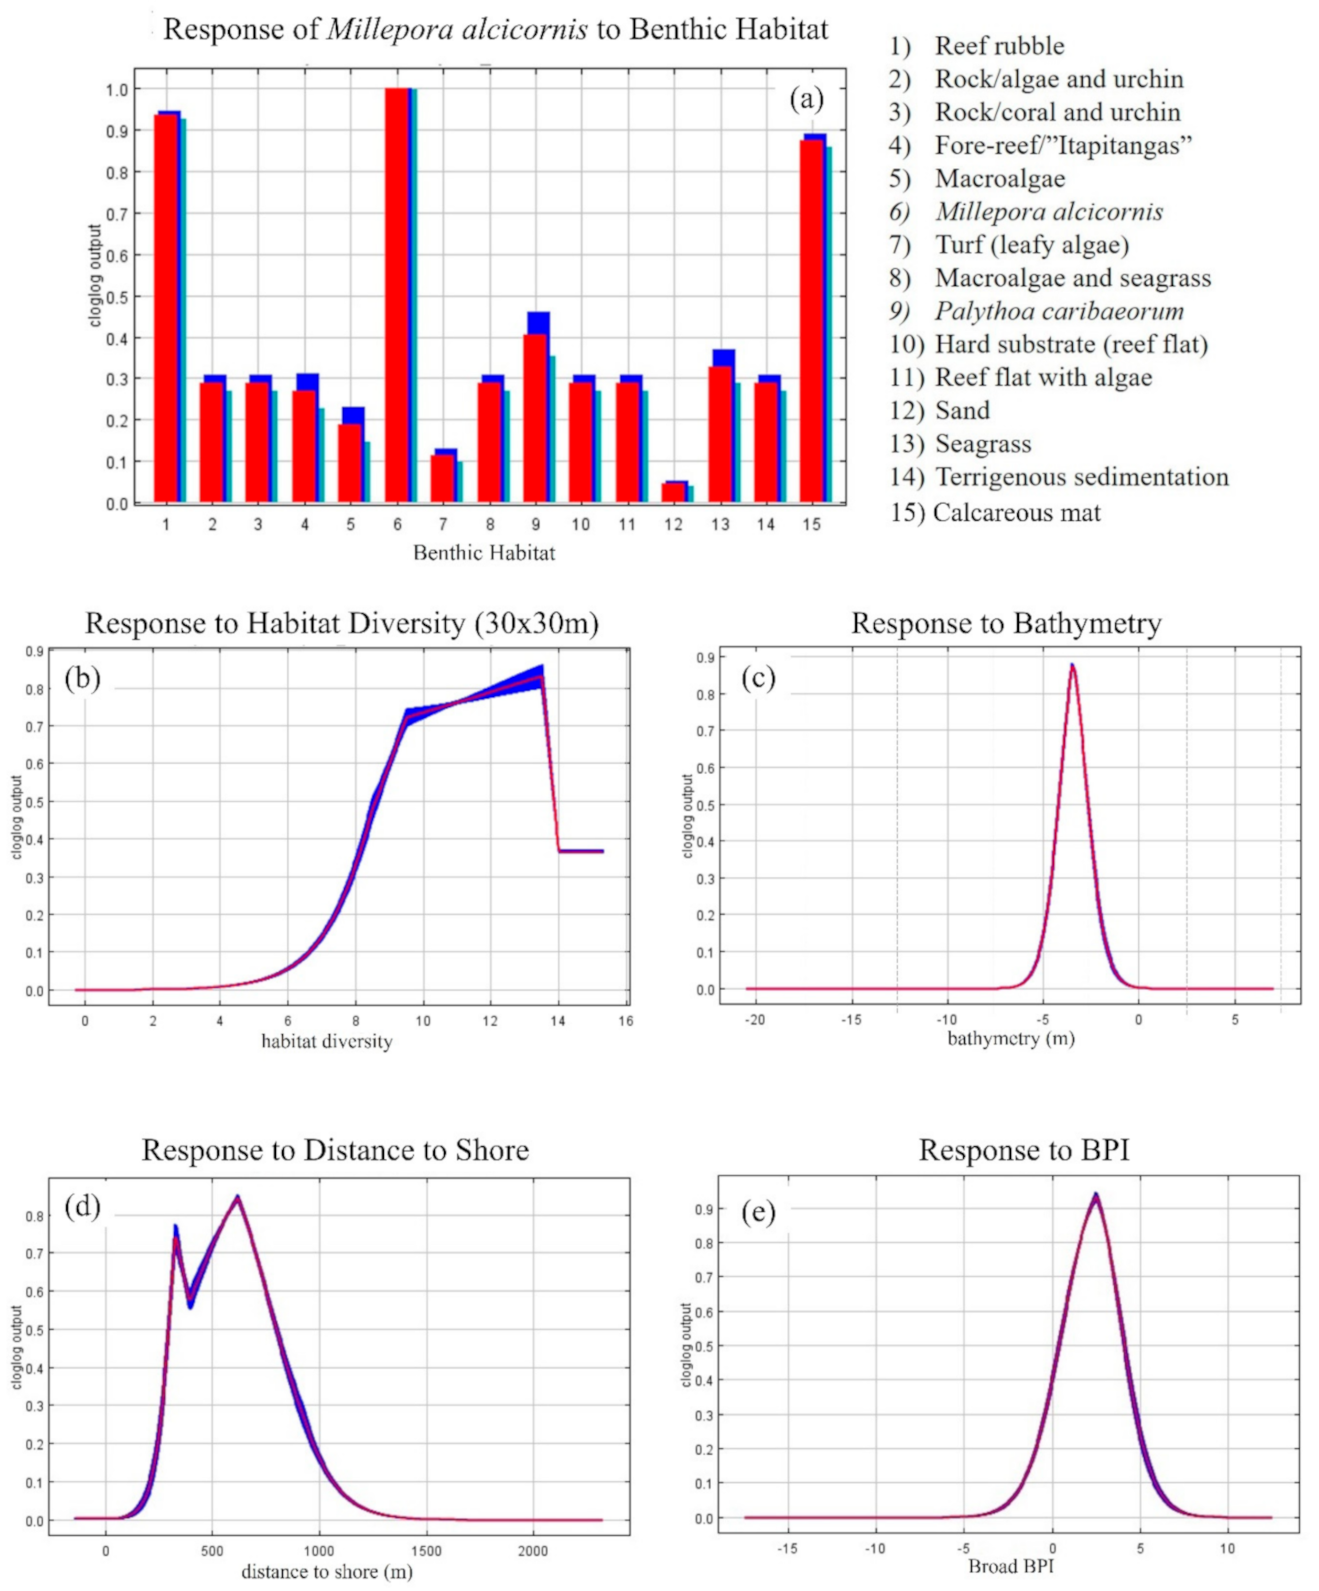
3.1.2. Ecological Layers

Using SVM algorithm to perform a supervised classification of the WV3 scene, we were able to identify 15 marine (benthic) habitats in the study area (Figure 6 and Supplementary Data): reef rubble, rock/algae and urchin, rock/coral and urchin, fore-reef/“Itapitangas”, macroalgae, Millepora alcicornis, algae turf (leafy), macroalgae and seagrass, Palythoa caribaeorum, hard substratum–reef flat, reef flat with algae, sand, seagrass, terrigenous sediment and calcareous mat (Table 3). Each marine habitat was correlated with the main habitat classification following the coral reef mapping scheme proposed by the National Oceanic and Atmospheric Administration (NOAA) [84]. Close-up maps and example photos of each benthic habitat can be found in the Supplementary Material.
Sand covered 61% of the study area, corresponding mostly to the lagoon area, while 11.4% of the study area comprised substrates associated only with reefs (i.e., reef rubble, rock/algae and urchin, rock/coral and urchin, fore-reef, Millepora alcicornis, Palythoa caribaeorum, reef flats, calcareous mat). The benthic habitat “calcareous mat” was found covering most of the submerged parts of the reef structures in the area and is characterized by a multispecific assemblage of algae (e.g., articulated calcareous algae, filamentous algae, Caulerpa spp., juvenile macroalgae) [53]. These mats are formed mainly by jointed-calcareous algae forms (>80%), forming dense mats that extend over most reefs in the area [85]. As noted, Millepora alcicornis was considered a benthic habitat, due to the joint size of some colonies and specific spectral signature. Areas where Millepora alcicornis was the main cover corresponded to 0.5% of the total study area. Most reefs had a very typical habitat zonation: deeper regions covered by macroalgae, followed by turf algae (leafy), a reef crest (characterized by calcareous mat and Millepora alcicornis as the dominant coral), Palythoa caribaeorum on the shallow area partly exposed during lower tides and a reef flat of calcareous rock and/or rock covered by algae.
Habitat diversity maps showed that the highest variety can be found on the reef areas, mostly in grids that include the reef structure and the sea bottom. This trend could be observed in every grid resolution we used in this study (i.e., 30 × 30 m, 50 × 50 m and 100 × 100 m).
It is possible to observe in the major cover map (Figure 6) that significant parts of the region correspond to algae-dominant substrata, with macroalgae and algae turf covering the third reef line and the basal area of the northern and southern reefs. We can also see the seagrass areas almost attached to the coastline, as well as a region of significant reef rubble near the limits of the no-take zone.

3.1.3. Topographical and Local Layers

Figure 7 shows the topographical layers derived in this study. Depth values varied between −21 m in the deeper regions and 2 m in the shallowest areas, exposed during the lowest tides (tide reference = 0.0 m). The overall tendency of the area is characterized mainly by shallow areas, the reefs (>−5 m), separated by deeper channels (<−5 m). It is possible to see the first reef line, almost attached to the coastline, and the main channels occurring in front of the two bays (Tamandaré and Campas Bay). This observation can also be inferred by analyzing the broad BPI derivations, which show negative values corresponding to the channels’ areas and neutral/positive values on the reefs.
Low values of slope and rugosity characterize most of the study area and represent areas of low topographic variation, mainly soft bottom (e.g., sand) without vegetation cover. Low rugosity and slope values are also noticeable in deeper regions and in areas closer to the shore, even when reefs are present. Alternatively, the highest values of both variables were correlated with reefs and areas surrounding them, mostly in the second and third reef bank lines. The most complex regions were always surrounded by intermediate rugosity areas. Aspect maps show the variation in orientation across the area. A gradient oriented to the east seems to be the most constant throughout the region and is mainly registered in front of the bays and associated with the channels’ southern borders. Additionally, frequent changes in orientation can be detected associated with the reefs in the area.
The local layers are shown in Figure 8. Distance to shore for all points in our study area ranged from 7 m (closest to the coast) to 2122 m (furthest from the coast), with an average of 827 m. Out of all field data, the closest point was located 69 m from the shore, in a seagrass area, and the furthest point was 1398 m away from the coastline, on the fore-reef of the third reef line. Large Millepora alcicornis colonies were found as close as 200 m and as far as 930 m but were mostly observed within a 300–800 m coast distance range. Turbidity varied greatly in the region, with higher values near the coast of the two rivers (northern and southern parts of the map). Increased turbidity can be seen in the regions occupied by channels and near the shore (central area of the image), probably associated with coastal sedimentation.

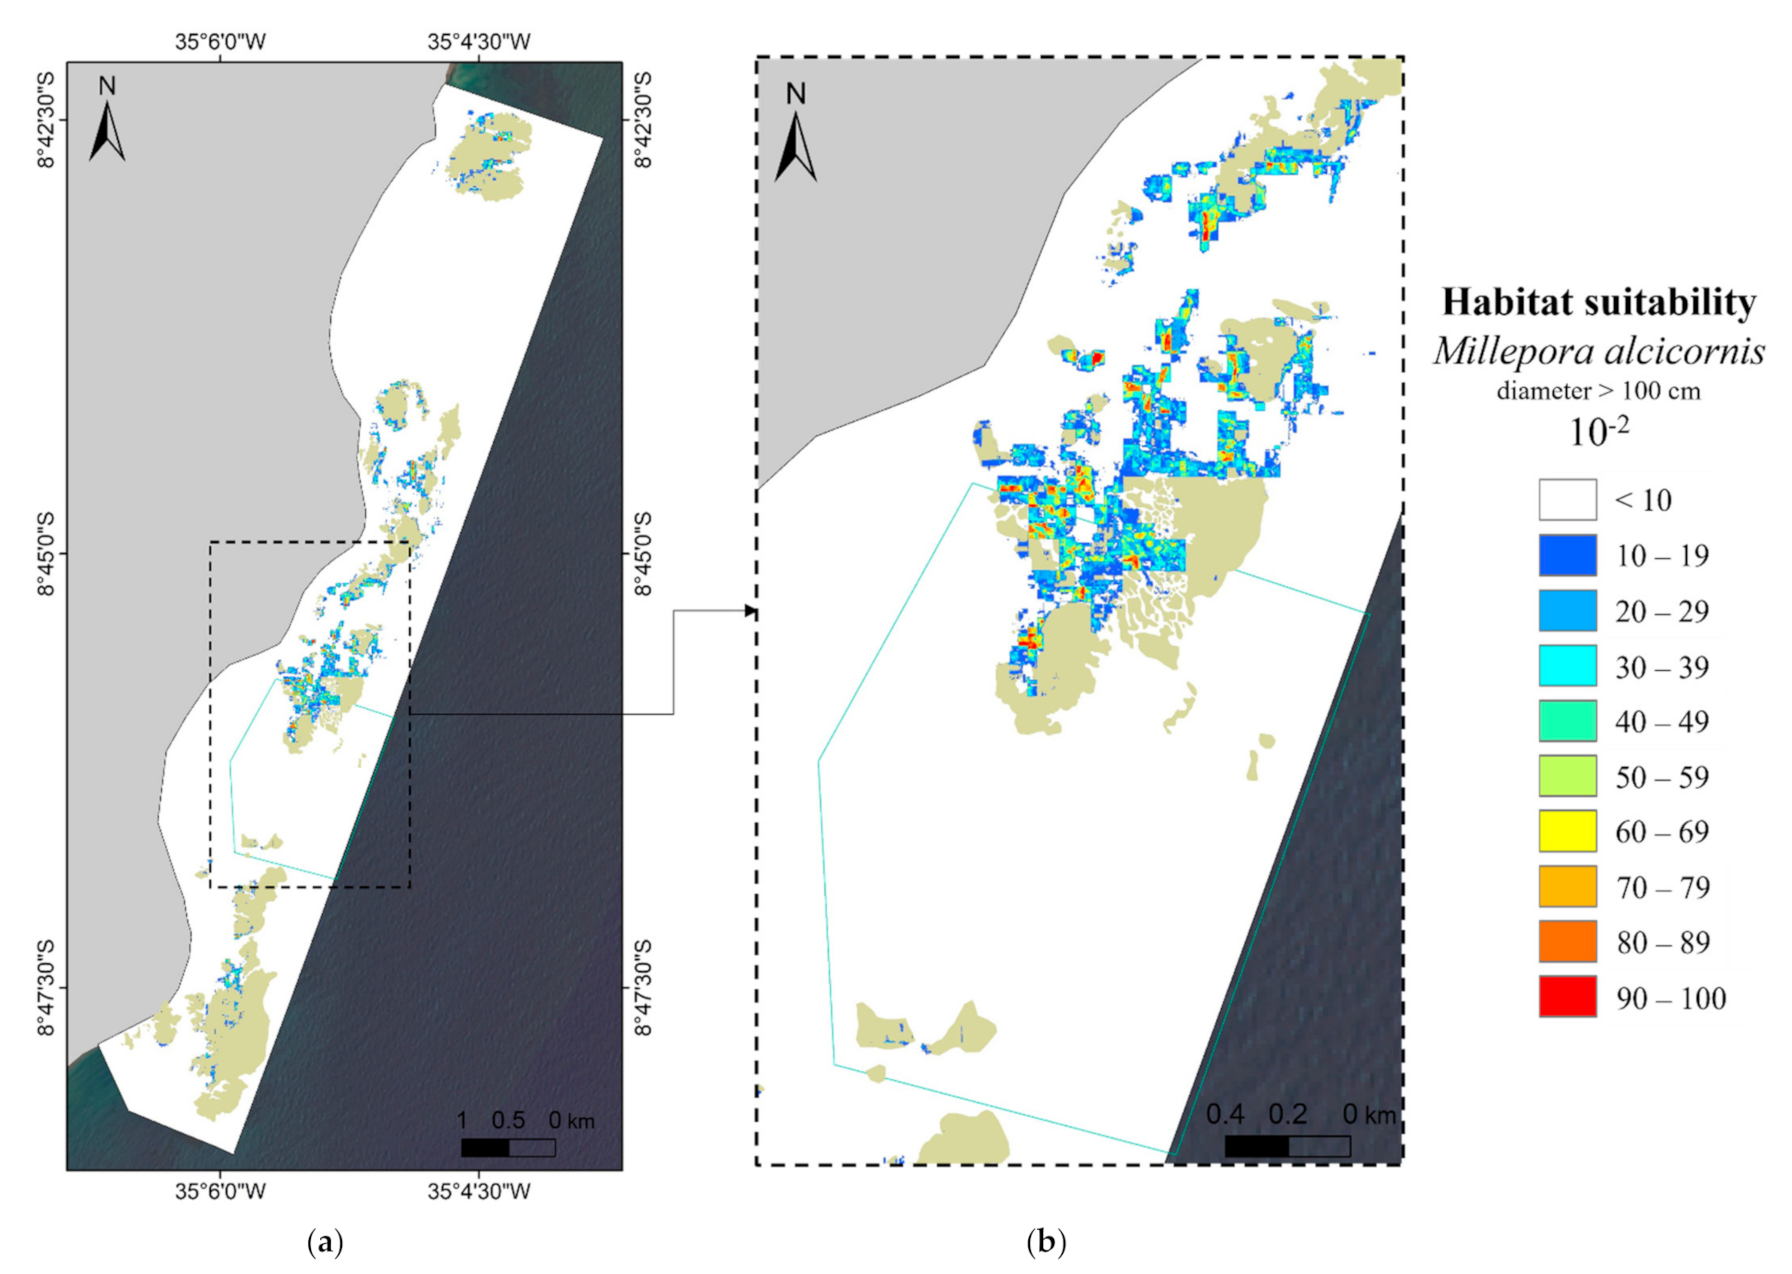
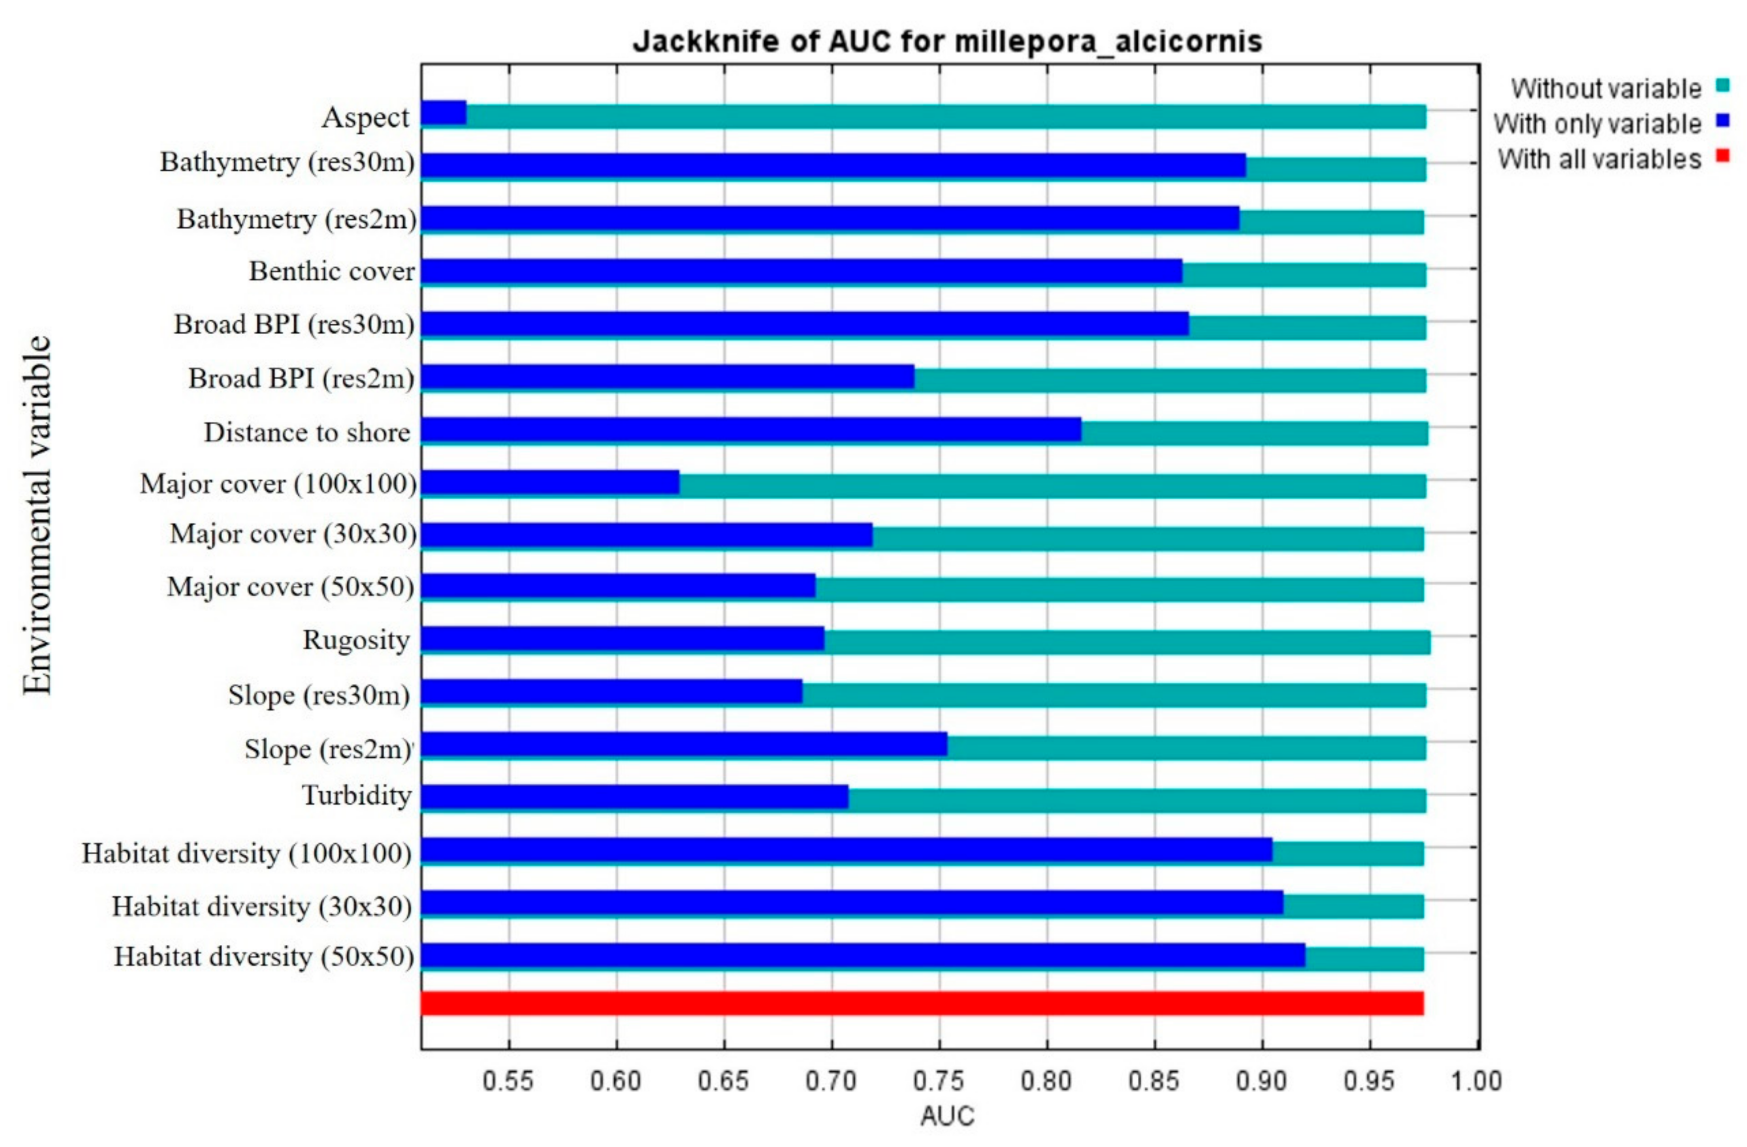
3.2. MaxEnt—Species Distribution Model’s Results

The model’s AUC for training and testing datasets was considered high (>0.97, standard deviation = 0.02). The results (Figure 9) are shown on a scale from 0 to 1, where 0 represents the most unsuitable habitats and 1 represents areas showing the best environmental features for the target species. The habitat suitability map suggests a limited availability of suitable areas for large colonies of Millepora alcicornis. Considering the entire mapped area (17.64 km2), 81% of the pixels exhibited values ranging from 0 to 0.1, indicating an area of more than 14 km2 of highly unsuitable habitats. Alternatively, only 0.56% of the area (0.1 km2) showed habitat suitability values higher than 0.5. In some regions, it is possible to observe abrupt horizontal cuts between suitable and nonsuitable pixels. This effect is due to the varying grid sizes we have used in some of the layers, such as “habitat diversity per area”, considered in 30 × 30 m, 50 × 50 m and 100 × 100 m windows. The resulting habitat suitability map was influenced by different layers with different resolutions, and as a consequence, we observe the effect of an apparent discontinuity between suitable and nonsuitable habitats.
Besides the habitat suitability map, MaxEnt offers jackknife tests and marginal and individual response curves (in probability of presence) for each variable. We used the jackknife on AUC test (Figure 10) and individual response curves (Figure 11) to analyze how each variable influenced the modeled presence of Millepora alcicornis and in what manner they influence occurrence.
The most important ecological factors for our predictive model included habitat diversity (in all three grid sizes) and habitat cover. The most influential topographic and local variables were bathymetry (in both spatial scales), broad BPI and distance to coast. On the other hand, aspect showed practically negligible influence on the predicted occurrence of Millepora alcicornis. We can also infer by the jackknife test analysis that the model was not dependent on any single variable, since the AUC did not decline when a determined variable was excluded from the model (light blue bars, in relation to the test’s AUC in red).
The individual response curve for habitat diversity showed that large colonies of Millepora alcicornis are most likely to occur in areas with a higher variety of habitats and thus higher biological complexity (Figure 11b). The probability of occurrence reaches 50% only in sites with eight (or more) habitats in a 900 m2 area, with similar trends for the other grid windows. As expected, the highest relative probability of occurrence of large Millepora alcicornis is in areas where the benthic cover is Millepora alcicornis. The occurrence rates related to benthic classes are followed by “reef rubble” and “calcareous mat”. The bathymetric curve showed an optimum depth in which Millepora alcicornis are more likely to occur (−3 m), considering both the medium-resolution analysis and the high-resolution data. The most suitable are in depths between −5 and −1 m. BPI results showed the species’ preference for areas that are shallower than their surroundings and that large colonies are less likely to occur in regions such as channels and valleys. Additionally, a distance of about 650 m from the coastline seems to be ideal, and areas too close or too distant from the coast are less likely to harbor large colonies of Millepora alcicornis.

3.3. Human Use

Fishing and tourism density maps showed the broad distribution of these activities in the study area (Figure 12). They also showed how related these activities are to the coral reefs, occurring on top of the reef structures, reef lagoons and areas surrounding the main reefs. Fishing had high densities in the southern (Mamucabas and Tamandaré bay), central (Campas beach) and northern regions (Carneiros Bay); contrastingly, use in the southern area is much less intense. It is possible to notice increased use of both activities right on the boundaries of the no-take zone. We were able to detect five main tourist spots, four of them in Campas Beach. Most tourist activities were in shallow reefs and very close to the shore.

4. Discussion

Considering the wide range of impacts the coral reefs are subjected to, including global reoccurring threats such as El Niño related bleaching and climate change [9,10], it is imperative to at least act locally to avoid mass mortality. In order to apply direct measures that are effective in reaching conservation goals, one of the first and foremost steps is to map the ecosystem, both physically and ecologically.
Since Laborel in 1969 [50], Millepora alcicornis has been described as one of the main reef builders in the region and as a preferential occupant of shallow areas of the reefs [42,44]. Our results showed that this species can indeed be considered the coral with the highest occupation on the reefs of the area, even though Millepora alcicornis was not the most frequently occurring coral in number of colonies (surpassed only by Siderastrea sp.). The occupancy becomes more explicit when we consider the average size of Millepora colonies in comparison with scleractinian corals such as Siderastrea sp. and the other millepore occurring in the area, Millepora braziliensis. Out of almost 1400 colonies, only 15 colonies of Siderastrea sp. had diameters larger than 20 cm (5 of which occurred inside the no-take zone), and only 1 was larger than 100 cm. Indeed, larger colonies of Siderastrea sp. suffered intense mortality during the 1998 bleaching according to in situ observations at the time (Ferreira, personal observation), which can explain their rarity.
Although the preference of M. alcicornis for shallow areas may allow reproductive advantages, due to greater recruitment rates in areas between 4 and 6 m deep [51], it also has several possible drawbacks. In a region where tourism and fishing activities occur on top of the reefs or their immediate surroundings, direct physical impacts on the limits of the reef framework (and the framework itself) are expected. Breakages due to trampling, snorkeling, anchors and the passage of the boats can be observed in the area and are common human-related impacts on coral reefs [13,86,87]. Millepora colonies can use that to their advantage though, as fragmentation and regeneration of broken colonies are important forms of asexual reproduction in the genus [51,56]. Postfragmentation attachment usually occurs on other Millepora alcicornis colonies and rock substratum, but this species has also been described to attach to soft substrates, such as sand [51,58]. On that note, this inherent capability of settling and colonizing different substrates from broken branches was the reason we chose to use only large colonies as input data in MaxEnt modeling. Thus, we believe that by using all available data (i.e., including recently settled branches) the resulting suitability map could suggest areas that are, in fact, not suitable for occurrence on a long-term basis. Additionally, large colonies are valuable not only as individual organisms, but also as habitats, as we were able to see in the habitat map (Figure 6). M. alcicornis are usually found harboring rich associated micro- and macrofauna, including fish, Crustacea, Bryozoa and other Cnidaria [49,51,52].
Large colonies of Millepora alcicornis were not registered in the extreme north of the study area (Carneiros) or in the south (Mamucabas). In Carneiros, the field survey was limited due to high-speed boat traffic, and we were not able to access many areas of the main reef. Even so, other authors have described the scarcity of M. alcicornis in this region [88], with the few colonies registered occurring in fore-reef regions. Large Millepora colonies were absent in the two Mamucabas reefs surveyed. In contrast, presence data were highly concentrated in the central area, which includes Campas Bay and Tamandaré Beach and has a higher density of reef structures. These reefs are located further from the river plumes, which may increase their suitability as habitats for corals.
The benthic mapping of the area exposed the habitat complexity that still exists in Tamandaré’s coastal reefs. Even considering the relatively low coral cover in general (10%) [42], colonies of Millepora alcicornis and small brooders (Porites astreoides, Siderastrea sp., Agaricia humilis and Favia gravida) were found covering large areas of substratum. In fact, two benthic classes directly reflected this dominance: “Millepora alcicornis” and “rock/coral and urchin”. The latter refers to shallow eroded reef tops, located close to shore (less <200 m from the coastline) and easily accessed by swimmers, tourists and fishers. In one specific reef, we also found the highest densities of sea urchin (Echinometra lucunter), which has been associated with human impacts such as fishing [9,89,90]. The increased abundance of urchins in reefs experiencing overfishing is explained mainly by trophic replacement of herbivorous fish by urchins, especially with the removal of their predators (e.g., lobsters, large fish) [91,92]. On the other hand, sea urchin abundance can control algae cover, which seems to have favored brooders’ settlement and growth in the area.
Furthermore, the benthic mapping allowed a direct derivation of habitat-complexity measures, such as the habitat diversity per area. Considering the average area of the reefs in the region and the size of the study area itself, we believe that 30 × 30, 50 × 50 and 100 × 100 grids provide insights on localities concentrating habitat diversity. Albeit some cover classes (i.e., sand, terrigenous sediment, rocky reef flat) are not direct indicators of biological diversity [93], the presence of various types of substrates in a small area is usually positively associated with increased niche availability. Most reef zones (with exception of reef tops), exhibited increased habitat diversity (10–13 different habitats in a 50 × 50 m area), a pattern easily observed in areas within the no-take zone and its immediate surroundings.
MaxEnt modeling output showed the close association between the presence of large colonies and the diversity of habitats: areas with higher habitat variety were the most suitable for M. alcicornis presence. Since the presence of large Millepora colonies may be responsible for an increase in biodiversity [52], these results can be considered part of a feedback succession process that is typical of coral reef ecosystems. Additionally, large colonies were mostly found on reef crests and fore-reefs, areas which, depending on the spatial scale, can be considered “border areas” that limit the ecosystem and the open bottom. Bordering, or very close to, main reef structures, we found cover classes that did not occur in the reef itself, such as seagrass.
Benthic cover on the site was the second most important variable for the model. Not surprisingly, large colonies were highly correlated with areas remotely interpreted as “Millepora alcicornis”. In fact, M. alcicornis and Palythoa caribaeorum were the only single-species substrata that could be detected by the 2 m resolution satellite image used in this study. Interestingly, habitats classified as “reef rubble” showed a strong correlation with M. alcicornis. This habitat was found in several regions throughout the area, but in a more concise way, close to the shore and near the no-take zone. This corroborates this species’ capability of settling in fragmented substrata, as this habitat is mostly composed of reef fragments, boulders covered by filamentous algae, macroalgae and sand. The proximity to the no-take zone (less than 70 m) and its large colonies’ assemblages (400 m) may raise the hypothesis that past natural breakage of large colonies within the protected zone has been supplying fragments for this rubble area. Additionally, no other reef rubble region had such a high presence of Millepora, except for these two near the no-take zone.
The other main correlation with benthic habitat and main cover is a characteristic algae substratum in Tamandaré reefs [53,85], here classified as “calcareous mat”. This class represents a multispecific assemblage of articulated calcareous algae (e.g., Jania spp., Amphiroa spp.) and is the dominant substratum in many parts of the reefs, notably on the reef crests. This alone might explain the high habitat suitability for the presence of Millepora alcicornis in areas classified as calcareous mat. Alternatively, it is generally known that coral species show a negative relation to algae cover mainly due to a decreased availability of substrate for settlement [9]. Remotely classified classes usually depict the major cover (not necessarily a 100% dominance) of a determined pixel. Here, MaxEnt results imply that contrary to other algae covers such as “macroalgae” and “seagrass”, a high percentage of calcareous mat is not necessarily an indicator of unsuitable habitats.
Topographical values showed narrow response curves in general, implying that Millepora alcicornis can be highly dependent on seascape relief. The optimal depths for the species estimated by our modeling ranged between 0 and 5 m, a result that agrees with other studies—0 to 15 m deep [49] and 0 to 10 m deep [94]. Indeed, we were able to see large colonies that grew vertically to reach the upper water column limits, even causing localized mortality on these colonies’ tops due to aerial exposure. Broad BPI results showed the high correspondence of the presence of large colonies and areas shallower than the surroundings, limiting the suitable habitats to “peak-like” areas such as reef crests and, on a broader scale, the reef framework. The two main channels in the area were characterized by negative values of BPI and are highly unsuitable for the settlement and growth of coral colonies in general, since these regions exhibit high turbidity, increased depth and mostly sand substrata.
Distance to shore was also an important limiting factor, registering low suitability in areas too close or too far from the coastline. The highest occurrence peak (650 m) coincides with the second reef line, described as having the highest coral cover and biological complexity [44]. The second highest peak, at about 350 m from the coast, seems to be related to the occurrence of large colonies on reef rubble areas and some extended back reefs. As a particular regional issue, the reefs closer to the shore are easily accessed by foot, swimming and all kinds of vessels, which can cause a range of direct impacts to the corals and thus suppress and impede growth. Coastal development can cause increased sedimentation and fill coastal lagoons, decreasing the extension of suitable habitats. Additionally, higher levels of pollution and coastal sedimentation can influence coral colonies both chemically and physically [95].
On the other hand, areas further than 1000 m from the shore showed the lowest habitat suitability. These regions are beyond the third line of reefs and exposed to wave action. In this case, the “depth” variable is acting as a proxy for hydrodynamical factors, which were not considered in our model. Branching colonies of Millepora, i.e., the ones mapped in this study, are usually related to low to moderate wave energy [51,96]. Beyond the third reef line, furthest from the shore, is an area of high wave energy and turbulence, and it showed little to no habitat suitability. In future studies, researchers may consider using oceanographical variables to test this theory.
The fact that we used only points where large colonies occurred and did not input background points with absence data in the model enabled the comparison of the model results with human use variables. The tourism and fishing maps clearly show that most reef structures of Tamandaré’s coastal zone suffer from either one or both kinds of human impact, with the exception of the no-take zone. Overfishing, uncontrolled tourism and high pollution rates have been consistently described as the major source of impacts in Tamandaré [39,42,97] and may act as limiting factors for coral settlement and growth. Apart from direct impacts to the structure (e.g., anchoring, physical damages due to fishing gear), overfishing may cause chronic impacts to coral reef areas via the removal of herbivores, thus increasing competition between macroalgae and corals [9].
Tourism was higher on shallow reef lagoons, with a maximum of 74 people and 18 vessels in a day in one reef lagoon. We observed that local tourist guides usually use small artisanal vessels called “jangadas” to take the tourists to practice diving activities on the shallow reefs, mostly close to the shore. On the other hand, large speed boats and catamarans were also seen in the area and on top of reefs. One may infer that they must cause larger impacts to the structures than the jangadas, but according to the management plan for the area, there are few differences in the rules regulating vessels used for tourism activities in the Sustainable Use Zone [38].
MaxEnt modeling was mostly accurate in relation to where the most suitable and unsuitable habitats were in the study area, as confirmed by field data. In the few areas where it was not, negative synergies between human use maps and the occurrence of large colonies of Millepora were registered. These instances occurred only in the Sustainable Use Zone, which is the whole area except the no-take zone. Alternatively, large Millepora colonies were registered in all modeled suitable habitats inside the no-take area. We considered this a strong indicator that topography and physical variables may provide the threshold features within which a coral species may occur, but ecological features and conservation measures in place allow these animals to thrive. Meanwhile, some ecological variables in this study may also reflect this evaluation, such as the benthic cover and a high diversity of habitats.

5. Conclusions

Species distribution modeling results may be extremely helpful when selecting areas for the application of conservation measures and evaluating the performance of those already in place [2,18,98,99]. Considering the wide range of impacts the coral reefs are subjected to, including global reoccurring threats such as El Niño related bleaching and climate-change-related heatwaves [10,12], it is imperative to at least improve local reef conditions to prevent mass mortality [9,10]. This study shows that areas that are highly suitable for settlement, growth and development of corals such as Millepora alcicornis and other species can be reliably identified and predicted. These areas should be considered as high priority for conservation and restoration and monitored closely. Furthermore, we believe that the variables derived here can be applied in other predictive models and possibly be extended to similar areas, thus including the whole Costa dos Corais MPA since its coastal reef complex is a large system composed of a continuum of bays, coral reefs and estuaries [44,50].
This may help decision-making by adding a scientific-based perspective on ecologically important areas and directing additional conservation and restoration efforts to the ones currently in place. Notably, our analyses reinforce the importance of no-take zones such as the Tamandaré Municipal Marine Park and the Marine Life Protection Zone (ZPVM) of Costa dos Corais MPA for the maintenance of local biodiversity. Our models also suggest the need for implementation of improved use management rules for the reef areas in order to minimize impacts of tourism and fisheries, to prevent further damage and restore reef areas.

Supplementary Materials

The following are available online at https://www.mdpi.com/article/10.3390/rs13152907/s1, Figure S1: Habitat map of the coastal reefs of Tamandaré – Pernambuco with a close-up of the reefs in Carneiros Bay, in the North of the study area. Figure S2: Habitat map of the coastal reefs of Tamandaré – Pernambuco with a close-up of the reefs in Campas Beach, in the central region of the study area.Figure S3: Habitat map of the coastal reefs of Tamandaré – Pernambuco with a close-up of the reefs in Tamandaré Bay, in the Southern region of the study area. Figures S4 to S7: The 14 benthic habitats found in the coral reefs of the study area, pictured by representative video-frames and photos taken during field survey (all videos and photos were made by the author). Additionally, we provide example areas of each benthic habitat, using a Red, Green, Blue (RGB) composite of the WorldView-3 scene used in this study.

Author Contributions

Conceptualization, C.B.L.d.S., G.M.R.S., M.M. and B.P.F.; methodology, C.B.L.d.S., G.M.R.S., M.M., A.L.B.G. and B.P.F.; software, C.B.L.d.S. and G.M.R.S.; validation, C.B.L.d.S.; formal analysis, C.B.L.d.S., G.M.R.S. and B.P.F.; investigation, C.B.L.d.S.; resources, M.M, A.L.B.G. and B.P.F.; data curation, C.B.L.d.S.; writing—original draft preparation, C.B.L.d.S. and B.P.F.; writing—review and editing, C.B.L.d.S. and B.P.F.; visualization, C.B.L.d.S. and B.P.F.; supervision, B.P.F.; project administration, A.L.B.G. and B.P.F.; funding acquisition, M.M., A.L.B.G. and B.P.F. All authors have read and agreed to the published version of the manuscript.

Funding

This research is a contribution of the Long-Term Ecological Research Program (PELD-CNPq 441632/2016-5 ILTER-Brazil-Tamandaré site 18), and Ciências do Mar II, AUXPE 1979/2014. CBLS thanks the Coordenação de Aperfeiçoamento de Pessoal de Nivel Superior—Brasil (CAPES), Finance Code 001, for a PhD Grant, and for a post-doctoral Research Grant (88887.461761/2019-00). BPF thanks the Brazilian Research Council (CNPq) for a Productivity Research Grant (309216/2018-4).

Institutional Review Board Statement

Not applicable.

Informed Consent Statement

Not applicable.

Data Availability Statement

Field bathymetry data presented in this study are openly available in FigShare at DOI: 10.6084/m9.figshare.15032169.v2. Species presence data collected and presented in this study are openly available in FigShare at DOI: 10.6084/m9.figshare.15032256.

Acknowledgments

This manuscript is based on a chapter of the doctorate thesis of the first author. This research was conducted under a permit issued for the authors by the Brazilian Ministry of Environment (Ministério do Meio Ambiente (MMA) and Instituto Chico Mendes de Biodiversidade (ICMBio)), SISBIO permit number 54683-1. The authors thank the Center for Research and Conservation of Marine Biodiversity of the Northeast (CEPENE) of the Chico Mendes Brazilian Institute of Biodiversity (ICMBio) and Instituto Recifes Costeiros (IRCOS) at Tamandaré for support during fieldwork. The authors are grateful to all volunteers, especially Chagas Junior, E. T.; Lippi, D.; and Pessoa, A. R. for their great help with the fieldwork and helpful insights.

Conflicts of Interest

The authors declare no conflict of interest.

References

  1. Bellwood, D.R.; Hughes, T.P.; Folke, C.; Nyström, M. Confronting the Coral Reef Crisis. Nature 2004, 429, 827–833. [Google Scholar] [CrossRef]
  2. Pittman, S.J.; Brown, K.A. Multi-Scale Approach for Predicting Fish Species Distributions across Coral Reef Seascapes. PLoS ONE 2011, 6, e20583. [Google Scholar] [CrossRef]
  3. Burke, L.; Reytar, K.; Spalding, M.; Perry, A. Reefs at Risk Revisited; World Resources Institute: Washington, DC, USA, 2011. [Google Scholar]
  4. Wilkinson, C.; Salvat, B. Coastal Resource Degradation in the Tropics: Does the Tragedy of the Commons Apply for Coral Reefs, Mangrove Forests and Seagrass Beds. Mar. Pollut. Bull. 2012, 64, 1096–1105. [Google Scholar] [CrossRef]
  5. Roberts, C.M. Marine Biodiversity Hotspots and Conservation Priorities for Tropical Reefs. Science 2002, 295, 1280–1284. [Google Scholar] [CrossRef] [PubMed] [Green Version]
  6. Pittman, S.J.; Christensen, J.D.; Caldow, C.; Menza, C.; Monaco, M.E. Predictive Mapping of Fish Species Richness across Shallow-Water Seascapes in the Caribbean. Ecol. Model. 2007, 204, 9–21. [Google Scholar] [CrossRef]
  7. Halpern, B.S.; Walbridge, S.; Selkoe, K.A.; Kappel, C.V.; Micheli, F.; D’Agrosa, C.; Bruno, J.F.; Casey, K.S.; Ebert, C.; Fox, H.E.; et al. A Global Map of Human Impact on Marine Ecosystems. Science 2008, 319, 948–952. [Google Scholar] [CrossRef] [Green Version]
  8. Leão, Z.M.A.N.; Kikuchi, R.K.P.; Ferreira, B.P.; Neves, E.G.; Sovierzoski, H.H.; Oliveira, M.D.M.; Maida, M.; Correia, M.D.; Johnsson, R.; Leão, Z.M.A.N.; et al. Brazilian Coral Reefs in a Period of Global Change: A Synthesis. Braz. J. Oceanogr. 2016, 64, 97–116. [Google Scholar] [CrossRef]
  9. Hughes, T.P.; Rodrigues, M.J.; Bellwood, D.R.; Ceccarelli, D.; Hoegh-Guldberg, O.; McCook, L.; Moltschaniwskyj, N.; Pratchett, M.S.; Steneck, R.S.; Willis, B. Phase Shifts, Herbivory, and the Resilience of Coral Reefs to Climate Change. Curr. Biol. 2007, 17, 360–365. [Google Scholar] [CrossRef] [PubMed] [Green Version]
  10. Sully, S.; Burkepile, D.E.; Donovan, M.K.; Hodgson, G.; van Woesik, R. A Global Analysis of Coral Bleaching over the Past Two Decades. Nat. Commun. 2019, 10, 1264. [Google Scholar] [CrossRef] [Green Version]
  11. Eakin, C.M.; Sweatman, H.P.A.; Brainard, R.E. The 2014–2017 Global-Scale Coral Bleaching Event: Insights and Impacts. Coral Reefs 2019, 38, 539–545. [Google Scholar] [CrossRef] [Green Version]
  12. Duarte, G.A.S.; Villela, H.D.M.; Deocleciano, M.; Silva, D.; Barno, A.; Cardoso, P.M.; Vilela, C.L.S.; Rosado, P.; Messias, C.S.M.A.; Chacon, M.A.; et al. Heat Waves Are a Major Threat to Turbid Coral Reefs in Brazil. Front. Mar. Sci. 2020, 7. [Google Scholar] [CrossRef]
  13. Davenport, J.; Davenport, J.L. The Impact of Tourism and Personal Leisure Transport on Coastal Environments: A Review. Estuar. Coast. Shelf Sci. 2006, 67, 280–292. [Google Scholar] [CrossRef]
  14. Lai, S.; Loke, L.H.L.; Hilton, M.J.; Bouma, T.J.; Todd, P.A. The Effects of Urbanisation on Coastal Habitats and the Potential for Ecological Engineering: A Singapore Case Study. Ocean. Coast. Manag. 2015, 103, 78–85. [Google Scholar] [CrossRef]
  15. Agardy, T.; di Sciara, G.N.; Christie, P. Mind the Gap: Addressing the Shortcomings of Marine Protected Areas through Large Scale Marine Spatial Planning. Mar. Policy 2011, 35, 226–232. [Google Scholar] [CrossRef]
  16. Jameson, S.C.; Tupper, M.H.; Ridley, J.M. The Three Screen Doors: Can Marine “Protected” Areas Be Effective? Mar. Pollut. Bull. 2002, 44, 1177–1183. [Google Scholar] [CrossRef]
  17. Adam, T.; Burkepile, D.; Ruttenberg, B.; Paddack, M. Herbivory and the Resilience of Caribbean Coral Reefs: Knowledge Gaps and Implications for Management. Mar. Ecol. Prog. Ser. 2015, 520, 1–20. [Google Scholar] [CrossRef] [Green Version]
  18. Bridge, T.; Beaman, R.; Done, T.; Webster, J. Predicting the Location and Spatial Extent of Submerged Coral Reef Habitat in the Great Barrier Reef World Heritage Area, Australia. PLoS ONE 2012, 7, e48203. [Google Scholar] [CrossRef] [PubMed] [Green Version]
  19. Ledlie, M.H.; Graham, N.A.J.; Bythell, J.C.; Wilson, S.K.; Jennings, S.; Polunin, N.V.C.; Hardcastle, J. Phase Shifts and the Role of Herbivory in the Resilience of Coral Reefs. Coral Reefs 2007, 26, 641–653. [Google Scholar] [CrossRef]
  20. Graham, N.A.J.; Nash, K.L. The Importance of Structural Complexity in Coral Reef Ecosystems. Coral Reefs 2013, 32, 315–326. [Google Scholar] [CrossRef]
  21. González-Rivero, M.; Harborne, A.R.; Herrera-Reveles, A.; Bozec, Y.-M.; Rogers, A.; Friedman, A.; Ganase, A.; Hoegh-Guldberg, O. Linking Fishes to Multiple Metrics of Coral Reef Structural Complexity Using Three-Dimensional Technology. Sci. Rep. 2017, 7, 13965. [Google Scholar] [CrossRef] [PubMed]
  22. Green, E.P.; Mumby, P.J.; Edwards, A.J.; Clark, C.D. A Review of Remote Sensing for the Assessment and Management of Tropical Coastal Resources. Coastal Manag. 1996, 24, 1–40. [Google Scholar] [CrossRef]
  23. Collin, A.; Hench, J.L. Towards Deeper Measurements of Tropical Reefscape Structure Using the WorldView-2 Spaceborne Sensor. Remote. Sens. 2012, 4, 1425–1447. [Google Scholar] [CrossRef] [Green Version]
  24. Reshitnyk, L.; Costa, M.; Robinson, C.; Dearden, P. Evaluation of WorldView-2 and Acoustic Remote Sensing for Mapping Benthic Habitats in Temperate Coastal Pacific Waters. Remote. Sens. Environ. 2014, 153, 7–23. [Google Scholar] [CrossRef]
  25. Da Silveira, C.B.L.; Strenzel, G.M.R.; Maida, M.; Araújo, T.C.M.; Ferreira, B.P. Multiresolution Satellite-Derived Bathymetry in Shallow Coral Reefs: Improving Linear Algorithms with Geographical Analysis. Coas 2020, 36, 1247–1265. [Google Scholar] [CrossRef]
  26. Lundblad, E.R.; Wright, D.J.; Miller, J.; Larkin, E.M.; Rinehart, R.; Naar, D.F.; Donahue, B.T.; Anderson, S.M.; Battista, T. A Benthic Terrain Classification Scheme for American Samoa. Mar. Geod. 2006, 29, 89–111. [Google Scholar] [CrossRef] [Green Version]
  27. Andréfouët, S.; Kramer, P.; Torres-Pulliza, D.; Joyce, K.E.; Hochberg, E.J.; Garza-Pérez, R.; Mumby, P.J.; Riegl, B.; Yamano, H.; White, W.H.; et al. Multi-Site Evaluation of IKONOS Data for Classification of Tropical Coral Reef Environments. Remote. Sens. Environ. 2003, 88, 128–143. [Google Scholar] [CrossRef]
  28. Eugenio, F.; Marcello, J.; Martin, J.; Rodríguez-Esparragón, D. Benthic Habitat Mapping Using Multispectral High-Resolution Imagery: Evaluation of Shallow Water Atmospheric Correction Techniques. Sensors 2017, 17, 2639. [Google Scholar] [CrossRef] [PubMed] [Green Version]
  29. Chirayath, V.; Instrella, R. Fluid Lensing and Machine Learning for Centimeter-Resolution Airborne Assessment of Coral Reefs in American Samoa. Remote. Sens. Environ. 2019, 235, 111475. [Google Scholar] [CrossRef]
  30. Hamylton, S.M.; Zhou, Z.; Wang, L. What Can Artificial Intelligence Offer Coral Reef Managers? Front. Mar. Sci. 2020, 7, 603829. [Google Scholar] [CrossRef]
  31. Elith, J.; Phillips, S.J.; Hastie, T.; Dudík, M.; Chee, Y.E.; Yates, C.J. A Statistical Explanation of MaxEnt for Ecologists: Statistical Explanation of MaxEnt. Divers. Distrib. 2011, 17, 43–57. [Google Scholar] [CrossRef]
  32. Selig, E.R.; Turner, W.R.; Troëng, S.; Wallace, B.P.; Halpern, B.S.; Kaschner, K.; Lascelles, B.G.; Carpenter, K.E.; Mittermeier, R.A. Global Priorities for Marine Biodiversity Conservation. PLoS ONE 2014, 9, e82898. [Google Scholar] [CrossRef]
  33. Phillips, S.J.; Anderson, R.P.; Schapire, R.E. Maximum Entropy Modeling of Species Geographic Distributions. Ecol. Model. 2006, 190, 231–259. [Google Scholar] [CrossRef] [Green Version]
  34. Phillips, S.J.; Dudík, M. Modeling of Species Distributions with Maxent: New Extensions and a Comprehensive Evaluation. Ecography 2008, 31, 161–175. [Google Scholar] [CrossRef]
  35. Poulos, D.E.; Gallen, C.; Davis, T.; Booth, D.J.; Harasti, D. Distribution and Spatial Modelling of a Soft Coral Habitat in the Port Stephens–Great Lakes Marine Park: Implications for Management. Mar. Freshw. Res. 2016, 67, 256. [Google Scholar] [CrossRef]
  36. Melo-Merino, S.M.; Reyes-Bonilla, H.; Lira-Noriega, A. Ecological Niche Models and Species Distribution Models in Marine Environments: A Literature Review and Spatial Analysis of Evidence. Ecol. Model. 2020, 415, 108837. [Google Scholar] [CrossRef]
  37. Ferreira, B.P.; Maida, M. Monitoramento dos Recifes de Coral do Brasil: Situação Atual e Perspectivas; MMA/SBF: Brasília, Brazil, 2006; ISBN 978-85-87166-86-9. [Google Scholar]
  38. ICMBio. Plano de Manejo Da APA Costa Dos Corais; ICMBio: Tamandaré, Brazil, 2012. [Google Scholar]
  39. Castro, C.B.; Pires, D.O. Brazilian Coral Reefs: What We Already Know and What Is Still Missing. Bull. Mar. Sci. 2001, 69, 15. [Google Scholar]
  40. Ferreira, B.P.; Messias, L.T.; Maida, M. The Environmental Municipal Councils as an Instrument in Coastal Integrated Management: The Área de Proteção Ambiental Costa Dos Corais (AL/PE) Experience. J. Coast. Res. 2006, 1003–1007. [Google Scholar]
  41. Fung, T.; Seymour, R.M.; Johnson, C.R. Alternative Stable States and Phase Shifts in Coral Reefs under Anthropogenic Stress. Ecology 2011, 92, 967–982. [Google Scholar] [CrossRef]
  42. Ferreira, B.P.; Maida, M.; Castro, C.B.; Pires, D.O.; Prates, A.P.L.; Marx, D. The Status of Coral Reefs of Brazil. In Proceedings of the 10th International Coral Reef Symposium, Okinawa, Japan, 27 June–2 July 2004; pp. 1011–1015. [Google Scholar]
  43. Cavalcante de Macêdo, E. Um Ensaio Sobre a Sedimentação e Suas Implicações Ecológicas Nos Recifes Costeiros Da Baía de Tamandaré/PE. Master’s Thesis, Universidade Federal de Pernambuco, Recife, Pernambuco, Brazil, 2009. [Google Scholar]
  44. Maida, M.; Ferreira, B. Coral Reefs of Brazil: Overview and Field Guide. In Proceedings of the 8th International Coral Reef Symposium, Panama City, FL, USA, 24–29 June 1996; Volume 1, pp. 263–274. [Google Scholar]
  45. Leão, Z.M.A.N.; Kikuchi, R.K.P.; Testa, V. Corals and coral reefs of Brazil. In Latin American Coral Reefs; Cortés, J., Ed.; Elsevier Science: Amsterdam, The Netherlands, 2003; pp. 9–52. ISBN 978-0-444-51388-5. [Google Scholar]
  46. Silveira, M.F. da Pesca Artesanal e Manejo: Uma Abordagem Temporal Comparativa em Tamandaré-PE. Available online: https://repositorio.ufpe.br/handle/123456789/31801 (accessed on 17 May 2021).
  47. Ferreira, B.; Maida, M.; Cava, F.C. Características e Perspectivas Para o Manejo Da Pesca Na APA Marinha Costa Dos Corais. In Proceedings of the Congresso Brasileiro de Unidades de Conservação, Campo Grande, Brazil; 2000; pp. 50–58. [Google Scholar]
  48. Coni, E.O.C.; Ferreira, C.M.; de Moura, R.L.; Meirelles, P.M.; Kaufman, L.; Francini-Filho, R.B. An Evaluation of the Use of Branching Fire-Corals (Millepora Spp.) as Refuge by Reef Fish in the Abrolhos Bank, Eastern Brazil. Env. Biol. Fish 2013, 96, 45–55. [Google Scholar] [CrossRef]
  49. Amaral, F.M.D.; Steiner, A.Q.; Broadhurst, M.K.; Cairns, S.D. An Overview of the Shallow-Water Calcified Hydroids from Brazil (Hydrozoa: Cnidaria), Including the Description of a New Species. Zootaxa 2008, 1930, 56–68. [Google Scholar] [CrossRef]
  50. Laborel, J. Madreporaires et Hydrocoralliares Recifaux Des Cotes Bresiliennes. Systematique, Ecologie. Repartition Verticale et Geographique. Results Sci. Camp. Calypso. 1969, 9, 171–229. [Google Scholar]
  51. Lewis, J.B. Biology and Ecology of the Hydrocoral Millepora on Coral Reefs. In Advances in Marine Biology; Elsevier: Amsterdam, The Netherlands, 2006; Volume 50, pp. 1–55. ISBN 978-0-12-026151-2. [Google Scholar]
  52. Garcia, T.; Matthews-Cascon, H.; Franklin-Júnior, W. Millepora Alcicornis (Cnidaria: Hydrozoa) as Substrate for Benthic Fauna. Braz. J. Oceanogr. Braz. J. Oceanogr. 2009, 57. [Google Scholar] [CrossRef] [Green Version]
  53. Ferreira, B.P.; Gaspar, A.L.B.; Coxey, M.S.; Monteiro, A.C.G. Manual de Monitoramento Reef Check Brasil; Ministério do Meio Ambiente: Brasília, Brazil, 2018. [Google Scholar]
  54. Roelfsema, C. Integrating Field Data with High Spatial Resolution Multispectral Satellite Imagery for Calibration and Validation of Coral Reef Benthic Community Maps. J. Appl. Remote. Sens. 2010, 4, 043527. [Google Scholar] [CrossRef] [Green Version]
  55. Roelfsema, C.; Lyons, M.; Dunbabin, M.; Kovacs, E.M.; Phinn, S. Integrating Field Survey Data with Satellite Image Data to Improve Shallow Water Seagrass Maps: The Role of AUV and Snorkeller Surveys? Remote. Sens. Lett. 2015, 6, 135–144. [Google Scholar] [CrossRef]
  56. Rodríguez, L.; López, C.; Casado-Amezua, P.; Ruiz-Ramos, D.V.; Martínez, B.; Banaszak, A.; Tuya, F.; García-Fernández, A.; Hernández, M. Genetic Relationships of the Hydrocoral Millepora Alcicornis and Its Symbionts within and between Locations across the Atlantic. Coral Reefs 2019, 38, 255–268. [Google Scholar] [CrossRef]
  57. Wirtz, P.; Zilberberg, C. Fire! The Spread of the Caribbean Fire Coral Millepora Alcicornis in the Eastern Atlantic. bioRxiv 2019. [Google Scholar] [CrossRef] [Green Version]
  58. Edmunds, P.J. The Role of Colony Morphology and Substratum Inclination in the Success of Millepora Alcicornis on Shallow Coral Reefs. Coral Reefs 1999, 18, 133–140. [Google Scholar] [CrossRef]
  59. Oliveira, M.D.M.; Leão, Z.M.A.N.; Kikuchi, R.K.P. Cultivo de Millepora alcicornis como uma ferramenta para Restauração e Manejo dos Ecossistemas Recifais do Nordeste do Brasil. RGCI 2008, 8, 183–201. [Google Scholar] [CrossRef]
  60. Dalleau, M.; Andréfouët, S.; Wabnitz, C.C.C.; Payri, C.; Wantiez, L.; Pichon, M.; Friedman, K.; Vigliola, L.; Benzoni, F. Use of Habitats as Surrogates of Biodiversity for Efficient Coral Reef Conservation Planning in Pacific Ocean Islands. Conserv. Biol. 2010, 24, 541–552. [Google Scholar] [CrossRef]
  61. McManus, L.C.; Watson, J.R.; Vasconcelos, V.V.; Levin, S.A. Stability and Recovery of Coral-Algae Systems: The Importance of Recruitment Seasonality and Grazing Influence. Theor. Ecol. 2019, 12, 61–72. [Google Scholar] [CrossRef]
  62. Green, E.; Mumby, P.; Edwards, A.; Clark, C. Remote Sensing Handbook for Tropical Coastal Management; Green, E.P., Edwards, A.J., Eds.; Coastal management sourcebooks; Unesco Pub: Paris, France, 2000; ISBN 978-92-3-103736-8. [Google Scholar]
  63. Deidda, M.; Sanna, G. Pre-Processing of High Resolution Satellite Images for Sea Bottom Classification. Ital. J. Remote. Sens. Riv. Ital. Telerilevamento 2012, 83–95. [Google Scholar] [CrossRef]
  64. Richter, R.; Schläpfer, D. Geo-Atmospheric Processing of Airborne Imaging Spectrometry Data. Part 2: Atmospheric/Topographic Correction. Int. J. Remote. Sens. 2002, 23, 2631–2649. [Google Scholar] [CrossRef]
  65. Kohler, K.E.; Gill, S.M. Coral Point Count with Excel Extensions (CPCe): A Visual Basic Program for the Determination of Coral and Substrate Coverage Using Random Point Count Methodology. Comput. Geosci. 2006, 32, 1259–1269. [Google Scholar] [CrossRef]
  66. Etnoyer, P.J.; Wagner, D.; Fowle, H.A.; Poti, M.; Kinlan, B.; Georgian, S.E.; Cordes, E.E. Models of Habitat Suitability, Size, and Age-Class Structure for the Deep-Sea Black Coral Leiopathes Glaberrima in the Gulf of Mexico. Deep. Sea Res. Part II Top. Stud. Oceanogr. 2018, 150, 218–228. [Google Scholar] [CrossRef]
  67. Yamamoto, K.H.; Powell, R.L.; Anderson, S.; Sutton, P.C. Using LiDAR to Quantify Topographic and Bathymetric Details for Sea Turtle Nesting Beaches in Florida. Remote. Sens. Environ. 2012, 125, 125–133. [Google Scholar] [CrossRef]
  68. Secomandi, M.; Jones, E.; Terente, V.; Comrie, R.; Owen, M. Application of the Bathymetric Position Index Method (BPI) for the Purpose of Defining a Reference Seabed Level for Cable Burial. In Offshore Site Investigation Geotechnics 8th International Conference Proceedings; Society of Underwater Technology: London, England, 2017; pp. 904–913. ISBN 978-0-906940-57-0. [Google Scholar]
  69. Walbridge, S.; Slocum, N.; Pobuda, M.; Wright, D.J. Unified Geomorphological Analysis Workflows with Benthic Terrain Modeler. Geosciences 2018, 8, 94. [Google Scholar] [CrossRef] [Green Version]
  70. Sappington, J.M.; Longshore, K.M.; Thompson, D.B. Quantifying Landscape Ruggedness for Animal Habitat Analysis: A Case Study Using Bighorn Sheep in the Mojave Desert. J. Wildl. Manag. 2007, 71, 1419–1426. [Google Scholar] [CrossRef]
  71. Wilson, M.F.J.; O’Connell, B.; Brown, C.; Guinan, J.C.; Grehan, A.J. Multiscale Terrain Analysis of Multibeam Bathymetry Data for Habitat Mapping on the Continental Slope. Mar. Geod. 2007, 30, 3–35. [Google Scholar] [CrossRef] [Green Version]
  72. Henry, L.-A.; Davies, A.J.; Murray Roberts, J. Beta Diversity of Cold-Water Coral Reef Communities off Western Scotland. Coral Reefs 2010, 29, 427–436. [Google Scholar] [CrossRef]
  73. Henry, L.-A.; Moreno Navas, J.; Roberts, J.M. Multi-Scale Interactions between Local Hydrography, Seabed Topography, and Community Assembly on Cold-Water Coral Reefs. Biogeosciences 2013, 10, 2737–2746. [Google Scholar] [CrossRef] [Green Version]
  74. Nechad, B.; Ruddick, K.G.; Neukermans, G. Calibration and Validation of a Generic Multisensor Algorithm for Mapping of Turbidity in Coastal Waters. In Proceedings of the Remote Sensing of the Ocean, Sea Ice, and Large Water Regions, Berlin, Germany, 17 September 2009; Volume 7473, p. 74730H. [Google Scholar]
  75. Dogliotti, A.I.; Ruddick, K.G.; Nechad, B.; Doxaran, D.; Knaeps, E. A Single Algorithm to Retrieve Turbidity from Remotely-Sensed Data in All Coastal and Estuarine Waters. Remote. Sens. Environ. 2015, 156, 157–168. [Google Scholar] [CrossRef] [Green Version]
  76. Vanhellemont, Q.; Ruddick, K. Acolite for Sentinel-2: Aquatic applications of MSI imagery. In Proceedings of the 2016 ESA Living Planet Symposium, Prague, Czech Republic, 9–13 May 2016. [Google Scholar]
  77. Vanhellemont, Q.; Ruddick, K. Atmospheric Correction of Metre-Scale Optical Satellite Data for Inland and Coastal Water Applications. Remote. Sens. Environ. 2018, 216, 586–597. [Google Scholar] [CrossRef]
  78. Couce, E.; Ridgwell, A.; Hendy, E.J. Environmental Controls on the Global Distribution of Shallow-Water Coral Reefs: Global Distribution Models of Shallow-Water Coral Reefs. J. Biogeogr. 2012, 39, 1508–1523. [Google Scholar] [CrossRef] [Green Version]
  79. Freeman, L.A.; Kleypas, J.A.; Miller, A.J. Coral Reef Habitat Response to Climate Change Scenarios. PLoS ONE 2013, 8, e82404. [Google Scholar] [CrossRef]
  80. Bargain, A.; Marchese, F.; Savini, A.; Taviani, M.; Fabri, M.-C. Santa Maria Di Leuca Province (Mediterranean Sea): Identification of Suitable Mounds for Cold-Water Coral Settlement Using Geomorphometric Proxies and Maxent Methods. Front. Mar. Sci. 2017, 4, 338. [Google Scholar] [CrossRef] [Green Version]
  81. Merow, C.; Smith, M.J.; Silander, J.A. A Practical Guide to MaxEnt for Modeling Species’ Distributions: What It Does, and Why Inputs and Settings Matter. Ecography 2013, 36, 1058–1069. [Google Scholar] [CrossRef]
  82. Radosavljevic, A.; Anderson, R.P. Making Better Maxent Models of Species Distributions: Complexity, Overfitting and Evaluation. J. Biogeogr. 2014, 41, 629–643. [Google Scholar] [CrossRef]
  83. Costa, B.; Kendall, M.S.; Parrish, F.A.; Rooney, J.; Boland, R.C.; Chow, M.; Lecky, J.; Montgomery, A.; Spalding, H. Identifying Suitable Locations for Mesophotic Hard Corals Offshore of Maui, Hawai‘i. PLoS ONE 2015, 10, e0130285. [Google Scholar] [CrossRef] [PubMed] [Green Version]
  84. Kendall, M.S.; Monaco, M.E.; Buja, K.R.; Christensen, J.D.; Kruer, C.R.; Finkbeiner, M. Methods Used to Map the Benthic Habitats of Puerto Rico and the US Virgin Islands; NOAA Technical Memorandum 152; NOS NCCOS CCMA: Silver Springs, MD, USA, 2002. [Google Scholar]
  85. Feitosa, J.L.L.; Concentino, A.M.; Teixeira, S.F.; Ferreira, B.P. Food Resource Use by Two Territorial Damselfish (Pomacentridae: Stegastes) on South-Western Atlantic Algal-Dominated Reefs. J. Sea Res. 2012, 70, 42–49. [Google Scholar] [CrossRef]
  86. Tratalos, J.A.; Austin, T.J. Impacts of Recreational SCUBA Diving on Coral Communities of the Caribbean Island of Grand Cayman. Biol. Conserv. 2001, 102, 67–75. [Google Scholar] [CrossRef]
  87. Flynn, R.L.; Forrester, G.E. Boat Anchoring Contributes Substantially to Coral Reef Degradation in the British Virgin Islands. PeerJ 2019, 7, e7010. [Google Scholar] [CrossRef] [PubMed] [Green Version]
  88. Correia, J.R.M.B.; Oliveira, W.D.M.; Pereira, P.S.; de Camargo, J.M.R.; de Araújo, M.E. Substrate Zonation as a Function of Reef Morphology: A Case Study in Carneiros Beach, Pernambuco, Brazil. J. Coast. Res. 2018, 81, 1. [Google Scholar] [CrossRef]
  89. Roberts, C.M. Effects of Fishing on the Ecosystem Structure of Coral Reefs. Conserv. Biol. 1995, 9, 988–995. [Google Scholar] [CrossRef] [PubMed] [Green Version]
  90. Topor, Z.M.; Rasher, D.B.; Duffy, J.E.; Brandl, S.J. Marine Protected Areas Enhance Coral Reef Functioning by Promoting Fish Biodiversity. Conserv. Lett. 2019, 12, e12638. [Google Scholar] [CrossRef]
  91. McClanahan, T.R.; Nugues, M.; Mwachireya, S. Fish and Sea Urchin Herbivory and Competition in Kenyan Coral Reef Lagoons: The Role of Reef Management. J. Exp. Mar. Biol. Ecol. 1994, 184, 237–254. [Google Scholar] [CrossRef]
  92. Graham, N.A.J.; McClanahan, T.R.; MacNeil, M.A.; Wilson, S.K.; Cinner, J.E.; Huchery, C.; Holmes, T.H. Human Disruption of Coral Reef Trophic Structure. Curr. Biol. 2017, 27, 231–236. [Google Scholar] [CrossRef] [PubMed] [Green Version]
  93. Wedding, L.M.; Friedlander, A.M.; McGranaghan, M.; Yost, R.S.; Monaco, M.E. Using Bathymetric Lidar to Define Nearshore Benthic Habitat Complexity: Implications for Management of Reef Fish Assemblages in Hawaii. Remote. Sens. Environ. 2008, 112, 4159–4165. [Google Scholar] [CrossRef]
  94. Leão, Z.M.A.N.; Kikuchi, R.K.P. The Abrolhos Reefs of Brazil. In Coastal Marine Ecosystems of Latin America; Seeliger, U., Kjerfve, B., Eds.; Ecological Studies; Springer: Berlin/Heidelberg, Germany, 2001; pp. 83–96. ISBN 978-3-662-04482-7. [Google Scholar]
  95. Zaneveld, J.R.; Burkepile, D.E.; Shantz, A.A.; Pritchard, C.E.; McMinds, R.; Payet, J.P.; Welsh, R.; Correa, A.M.S.; Lemoine, N.P.; Rosales, S.; et al. Overfishing and Nutrient Pollution Interact with Temperature to Disrupt Coral Reefs down to Microbial Scales. Nat. Commun. 2016, 7, 11833. [Google Scholar] [CrossRef]
  96. Dubé, C.E.; Mercière, A.; Vermeij, M.J.A.; Planes, S. Population Structure of the Hydrocoral Millepora Platyphylla in Habitats Experiencing Different Flow Regimes in Moorea, French Polynesia. PLoS ONE 2017, 12, e0173513. [Google Scholar] [CrossRef]
  97. Chaves, L.T.C.; Pereira, P.H.C.; Feitosa, J.L.L. Coral Reef Fish Association with Macroalgal Beds on a Tropical Reef System in North-Eastern Brazil. Mar. Freshw. Res. 2013, 64, 1101–1111. [Google Scholar] [CrossRef]
  98. Pawar, S.; Koo, M.S.; Kelley, C.; Ahmed, M.F.; Chaudhuri, S.; Sarkar, S. Conservation Assessment and Prioritization of Areas in Northeast India: Priorities for Amphibians and Reptiles. Biol. Conserv. 2007, 136, 346–361. [Google Scholar] [CrossRef]
  99. Carroll, C. Role of Climatic Niche Models in Focal-Species-Based Conservation Planning: Assessing Potential Effects of Climate Change on Northern Spotted Owl in the Pacific Northwest, USA. Biol. Conserv. 2010, 143, 1432–1437. [Google Scholar] [CrossRef]
Figure 1. Study area at the coral reefs of Tamandaré (black polygon) and the location of the no-take zone (white outlined polygon) within the Municipal Natural Park (MNP) Tamandaré Fort (white polygon). The map on the left also shows the location of the three mosaic-organized marine protected areas (MPAs): Costa dos Corais MPA (grey polygon), Serrambi MPA (light blue polygon) and Guadalupe Environmental Protected Area (EPA) (yellow polygon). Background image: Google Earth.
Remotesensing 13 02907 g001
Figure 2. General workflow of the methodology and expected resulting layers in the present study. Field surveys and dates in which each survey was conducted are represented by white circles and white rectangles, respectively; the methodology, satellite imagery and/or algorithm used in each specific step are represented by grey hexagons; layers related to species presence data (yellow rectangles), ecological variables (green rectangles), topographical variables (blue rectangles) and local layers (orange rectangles) used as input in the species distribution model (SDM) are also shown; use layers are represented by grey rectangles. The number on the bottom right of each step corresponds to the subsection in which it is described.
Remotesensing 13 02907 g002
Figure 3. Polyvinyl chloride (PVC) apparatus (handle and frame with metric tape) used in the field study to obtain presence records and measurements of Millepora alcicornis colonies.
Remotesensing 13 02907 g003
Figure 4. Histogram of the process to derive the predictive distribution model of Millepora alcicornis in MaxEnt.
Remotesensing 13 02907 g004
Figure 5. Millepora alcicornis presence data in Tamandaré, Brazil, used as input in MaxEnt modeling. Red dots show locations where large colonies of the species were found (222). Green dots show all Millepora alcicornis locations, considering smaller colonies (637). Black dots show all remaining field data (6578). Background satellite image: WorldView-03 RGB431.
Remotesensing 13 02907 g005
Figure 6. Ecological layers used as environmental variables in the predictive modeling of Millepora alcicornis. The hollow blue polygon on the three images shows the location of the no-take zone. (a) Habitat map of the coastal reefs of Tamandaré, Pernambuco, with 15 classes: (1) reef rubble, (2) rock/algae and urchin, (3) rock/coral and urchin, (4) fore-reef/“Itapitangas”, (5) macroalgae, (6) Millepora alcicornis, (7) algae turf (leafy), (8) macroalgae and seagrass, (9) Palythoa caribaeorum, (10) reef flat - hard substratum, (11) reef flat with algae, (12) sand, (13) seagrass, (14) terrigenous sediment and (15) calcareous mat. (b) Number of different habitats present in a 30 × 30 m grid, or 900 m2 area. (c) Major benthic cover calculated for a 50 × 50 m grid, or 2500 m2 area.
Remotesensing 13 02907 g006
Figure 7. Topographical layers used as environmental variables in the predictive modeling of Millepora alcicornis. The hollow blue polygon on the images shows the location of the no-take zone. (a) Bathymetric dataset; (b) broad bathymetric position index (BPI); (c) slope; (d) rugosity; (e) aspect.
Remotesensing 13 02907 g007
Figure 8. Local layers used as environmental variables in the predictive modeling of Millepora alcicornis. The hollow blue polygon on the images shows the location of the no-take zone. (a) Distance to shore; (b) relative measures of turbidity in formazin nephelometric units (FNU).
Remotesensing 13 02907 g008
Figure 9. MaxEnt georeferenced output showing relative habitat suitability for large colonies of Millepora alcicornis. (a) Complete map of habitat suitability in Tamandaré, PE; (b) map focusing on the no-take zone and surrounding reefs. The reefs are pictured in light brown to enable the visualization of the results.
Remotesensing 13 02907 g009
Figure 10. Jackknife test results exhibiting the influence of each variable on the final area under the receiver operating characteristic curve (AUC) value.
Remotesensing 13 02907 g010
Figure 11. Response curves for the most influential variables of the model: (a) benthic cover, (b) habitat diversity, (c) bathymetry, (d) distance to shore and (e) broad-scale bathymetric position index (BPI). The curves show the mean response of the 15 replicate MaxEnt runs (red) and the mean +/− one standard deviation (blue, two shades for the categorical variable).
Remotesensing 13 02907 g011
Figure 12. Use maps of the study area, including the main regions: Tamandaré Bay, Campas Beach and Carneiros Bay. (a) Fishing pressure, calculated using the maximum number of fishers in the vicinities of a reef in a given day (max = 10 fishers); (b) tourism activities map, calculated using the maximum number of tourism-related vessels on a reef or its proximities in a given day (max = 18 vessels, 74 people).
Remotesensing 13 02907 g012
Table 1. Details of the WorldView-3 (WV3) scene used in this research for the habitat mapping provided in the metadata file. Tide at acquisition (m) was calculated based on the tide charts provided by the Brazilian Hydrographic Authority.
Satellite SensorWV3
Scene104001002788CE00
Map ProjectionUTM
DatumWGS84; Ellipsoid: WGS84
CoverageX: −8.80934577 to −8.68585772
Y: −35.11410824 to −35.06263346
Sun azimuth94.20
Sun elevation65.70
Date acquired (DMY)23/02/2017
Scene center time12:55:08
Resolution (m/px)2
Tide at acquisition1.1 m above spring tide
Table 2. Accuracy assessment metrics. The table shows the confusion matrix displaying the habitat classes and major benthic cover (1–15) and the accuracy metrics: user’s accuracy (UAC.); producer’s accuracy (PAC.) and kappa value.
Class123456789101112131415TotalUACKappa
12712001000001003350.77
20232000000000000250.92
30220000000000000220.91
40002400000000000241.00
50000211060000000280.75
61001026000000102310.84
70005012520000000330.76
80000000210000000211.00
90200300027320000370.73
100000000002610000270.96
110000200001240000270.89
120000000000026050310.84
130020102100002731370.73
142240300010332220420.52
150000013020000024300.80
Total points3030303030303030303030303030304500.00
PAC0.900.770.670.800.700.870.830.700.900.870.800.870.900.730.800.000.81
Kappa 0.79
Table 3. Benthic habitats identified in the habitat mapping of Tamandaré coastal area. Habitat classification is given following the scheme proposed in [84]. Main cover of each benthic habitat was identified in CPCe software using 15 points per photo and is displayed in order of contribution.
NumberMajor Habitat ClassificationBenthic habitatMain Cover (in Order of Contribution)
1Fragmented patchy reefReef Rubblerubble (gravel)turf algaerockHalimeda spp.-
2Coral reef and colonized hardbottomRock/algae and urchinrockturf algaeEchinometra lucunterencrusting coralline algae-
3Coral reef and colonized hardbottomRock/coral and urchinrockcoral (Porites astreoides)Echinometra lucunterPalythoa caribaeorum-
4Fore-reefItapitanga/Fore-reefPalythoa caribaeorumRockCaulerpa spp.--
5Submerged vegetationMacroalgaeSargassum spp. Dictyota spp.Caulerpa spp.turf algae-
6Coral reef and colonized hardbottomMillepora alcicornisMillepora alcicornisturf algae---
7Submerged vegetationTurf algae (leafy)turf algaecalcareous matSargassum spp. Halimeda spp.rock
8Submerged vegetationSeagrass and
macroalgae
Sargassum spp. Seagrass (Halodule wrightii)sand--
9Coral reef and colonized hardbottomPalythoa caribaeorumPalythoa caribaeorumturf algae---
10Uncolonized hardbottomReef flat – (hard substratum)rockturf algaePalythoa caribaeorum--
11Colonized hardbottomReef flat (algae)rockturf algaefilamentous algaeHalimeda spp.-
12Unconsolidated sedimentsSandsandgravel---
13Submerged vegetationSeagrassSeagrass (Halodule wrightii)sandgravel--
14Unknown 1Terrigenous sediment1-----
15Coral reef and colonized hardbottomCalcareous matcalcareous mat (multispecific articulated calcareous algae)algae turfrocksandM. alcicornis
1 The marine habitat “terrigenous sediment” was only identified remotely (due to high sedimentation in the coastal area and on top of some reefs and thus the infeasibility of mapping the substrata correctly with satellite imagery).
Publisher’s Note: MDPI stays neutral with regard to jurisdictional claims in published maps and institutional affiliations.

