Article

A Novel Mosaic Method for Spaceborne ScanSAR Images Based on Homography Matrix Compensation

1
The Department of Space Microwave Remote Sensing System, Aerospace Information Research Institute, Chinese Academy of Sciences, Beijing 100194, China
2
The School of Electronic, Electrical and Communication Engineering, University of Chinese Academy of Sciences, Beijing 101408, China
*
Author to whom correspondence should be addressed.
Remote Sens. 2021, 13(15), 2866; https://doi.org/10.3390/rs13152866
Submission received: 20 June 2021 / Revised: 16 July 2021 / Accepted: 19 July 2021 / Published: 22 July 2021
(This article belongs to the Special Issue Advances in SAR Image Processing and Applications)

Abstract

:
Accurate and efficient image mosaicking is essential for generating wide-range swath images of spaceborne scanning synthetic aperture radar (ScanSAR). However, the existing methods cannot guarantee the accuracy and efficiency of stitching simultaneously, especially when mosaicking multiple large-area images. In this paper, we propose a novel image mosaic method based on homography matrix compensation to solve the mentioned problem. A set of spaceborne ScanSAR images from the Gaofen-3 (GF-3) satellite were selected to test the performance of the new method. First, images are preprocessed by an improved Wallis filter to eliminate intensity inconsistencies. Then, to reduce the enormous computational redundancy of registration, the overlapping areas of adjacent images are coarsely extracted using geolocation technologies. Furthermore, to improve the efficiency of stitching and maintain the original information and resolution of images, we deduce a compensation of homography matrix to implement downsampled images registration and original-size images projection. After stitching, the transitions at the edges of the images were smooth and seamless, the information and resolution of the original images were preserved successfully, and the efficiency of the mosaic was improved by approximately one thousand-fold. The validity, high efficiency and reliability of the method are verified.

Graphical Abstract

1. Introduction

Synthetic aperture radar (SAR) is a kind of active imaging system operating in the microwave band. It has the capability to observe the ground under all-day and all-weather conditions, which is difficult for optical sensors [1]. Scanning SAR (ScanSAR) is an important development of spaceborne SAR technology. It can shorten the global revisit period by its wide surveying and mapping swath. Some surface phenomena that undergo rapid changes, such as marine wind, wave, sea ice and aboveground biomass, can be monitored by ScanSAR [2,3,4,5,6,7,8,9,10]. Gaofen-3 (GF-3), the first C-band polarization high-resolution SAR satellite in China, has three ScanSAR modes. Its global observation mode can obtain an imaging nominal swath width of 650 km, which greatly expands the ability of Earth observation and application [11,12].
Image mosaic is a prerequisite for some quantitative applications of SAR. Registration as an important part of the image mosaic process has been studied widely. Among registration methods based on features, the scale-invariant feature transform (SIFT) algorithm has received wide attention because of its strong adaptability to image scaling, rotation, translation and intensity [13,14,15]. However, due to the influence of speckle noise, the traditional SIFT algorithm does not perform well in SAR image mosaics. Therefore, P. Schwind et al. [16] proposed using the infinite symmetric exponential filter (ISEF) to smooth SAR images. They also suggested skipping the first octave of the scale-space pyramid to reduce the number of incorrect keypoint detections. Yu X. et al. [17] used a multilook preprocessing method to suppress speckle noise. This method reduces the computational complexity at the expense of losing image features and reducing the resolution of the original image. To enhance the matching performance of SAR images, many studies have focused on improving the scale space. Bilateral filter SIFT (BFSIFT), adapted anisotropic Gaussian SIFT (AAG-SIFT), nonlinear diffusion scale space SIFT (NDSS-SIFT), and the SIFT-like algorithm for SAR images (SAR-SIFT) were proposed by replacing a Gaussian filter with several anisotropic filters to construct the scale space [18,19,20,21]. This kind of method retains more image details and edges than other methods so that more keypoints can be obtained. However, keypoint detection and matching initially take up a large part of the time in the entire mosaic process, and these methods will increase the computational complexity. Another type of research optimized the image registration process, which consists of coarse registration and fine registration. Gong M. et al. [22] proposed a novel coarse-to-fine scheme for automatic image registration based on SIFT and mutual information. First, SIFT is used for preregistration. Then, a fine-tuning process is implemented by maximizing the mutual information. Xiang Y. et al. [23] proposed an automatic and novel SAR image registration algorithm. They downsampled images to reduce the computational complexity of SAR-SIFT.
Although these methods have achieved a good mosaic effect on SAR images, there are still some limitations when they are applied to spaceborne ScanSAR image mosaics:
1. The stitching seams cannot be eliminated completely in some special cases. After stitching, there will be inconsistent intensity distributions on different sides of the seam, which causes difficulties in the applications of large-area ScanSAR images. For example, if there is a ship just across the seam of the two stitched images, the inconsistent intensity distribution may lead to the failure of ship recognition.
2. Keypoint redundancy. Keypoint detection and matching will directly determine the accuracy and efficiency of stitching. Most of the above algorithms are used to detect keypoints from the whole image by the SIFT algorithm, but the keypoints that can be matched correctly are from overlapping areas between adjacent images. For spaceborne ScanSAR, the overlapping areas between adjacent images generally account for 5% ~ 45% of the total image, which depends on the antenna angle, imaging geometry and latitude. Therefore, keypoint detection of the whole ScanSAR image will acquire a considerable number of redundant keypoints from nonoverlapping areas, resulting in much computational redundancy and stitching time. The redundant keypoints are not only unhelpful for keypoint matching but also reduce the matching accuracy due to some similar mismatched keypoints detected from nonoverlapping areas. Sun W. et al. [24] proposed to convert the large-size small-overlap image registration into the small-overlap image registration by using the location of an airborne SAR image. This idea could also be used in spaceborne ScanSAR images.
3. Resolution reduction. The resolution of ScanSAR images is not as good as that of stripmap SAR or spotlight SAR because ScanSAR can obtain a wide-range swath at the expense of the azimuth resolution [25]. It will worsen by either multilooking or downsampling. In that case, many details and edges will be lost, and the image quality will be affected.
4. The mosaicking of multiple spaceborne ScanSAR images is a time-consuming process that is intolerable in practice. The swath of GF-3 ScanSAR varies from 300 km to 650 km, and an image of a single subswath has hundreds of millions of pixels. The computation will be enormous when mosaicking of multiple spaceborne ScanSAR images is required. Too many pixels will drastically slow down the detection and matching speeds, especially when using algorithms that increase the number of keypoints after optimization.
Another type of method which should be discussed in this article is geolocation technology. It seems that the stitching of ScanSAR images can be realized by geolocation, which is fast. However, due to various errors, such as satellite measurement error, time error of SAR system, pulse repeat frequency error and relative height error, the geolocation of SAR processors cannot achieve sufficient accuracy in practice. As for the GF-3 satellite, the accuracy of a location is 230 m, and the resolution of narrow scanning (NS) is 50 m [11]. It can be seen that using geolocation can only guarantee the efficiency of stitching instead of the accuracy. To improve the accuracy of geolocation, the SAR processors should be more complex, which is very difficult.
Thus, the traditional feature-based mosaic method can only guarantee the accuracy rather than efficiency of stitching, while the geolocation-based mosaic method can only guarantee the efficiency rather than accuracy of stitching.
To solve the problems mentioned above, we propose a novel mosaic method for spaceborne ScanSAR images. First, an improved Wallis filter is used to eliminate the inconsistency of intensity and contrast between adjacent images before mosaicking. Then, the overlapping areas of images are coarsely extracted by geolocation technologies to remove the redundant areas of images that are useless for registration. In the image registration process, we reduce the size of the extracted overlapping areas and divide them into equal parts perpendicular to the stitching direction so that keypoint detection by the SIFT algorithm and keypoint matching can run in parallel. The homography matrix is calculated by matched keypoints, filtered by the random sample consensus (RANSAC) algorithm and compensated based on the multiple of overlapping area downsampling. After scaling compensation, the matrix can be used to project the original-size images so that the original resolution can be preserved. To validate the performance of this method, we selected a group of ScanSAR image data acquired by the GF-3 satellite for experiments. The results indicate that the proposed method can significantly reduce the mosaicking time while ensuring the accuracy of the mosaic and maintaining high resolution. This method can, thus, be used on the mosaic of multiple large-area spaceborne ScanSAR images.
The remainder of this paper is organized as follows: Section 2 introduces the ScanSAR modes of GF-3. Section 3 presents a traditional feature-based image mosaic process. Section 4 shows the details of our proposed method. Section 5 reports the experimental results and discussion. Conclusions are provided in Section 6.

2. ScanSAR Modes of GF-3 Satellite

As an important technology based on stripmap SAR, ScanSAR has been applied in many spaceborne SAR systems. Figure 1 shows the working mechanism of spaceborne ScanSAR. Unlike the fixed antenna pointing of stripmap SAR, ScanSAR can obtain several times the range swath of stripmap SAR by switching radar beams within a preset angle range. The antenna scans from different subswaths in turn.
The antenna spends a fixed time transmitting a set of pulses (i.e., a burst) and receiving echo data on each subswath [1]. Then, the radar beam is switched to the next subswath, and the above-mentioned process is repeated until all the subswaths are scanned once. A period of scanning is completed when the antenna returns to the point of the first subswath. The working mechanism of spaceborne ScanSAR shows that there is a time gap between two bursts in the same subswath, which means that the azimuth resolution of the ScanSAR image is sacrificed. Moreover, the wide-range swath is composed of multiple subswaths with independent echo data phases. Therefore, stitching the imaging results of each subswath into a smooth and seamless wide image is an effective approach.
As the first C-band polarization high-resolution SAR satellite in China, GF-3 carries three advanced ScanSAR modes: NS, wide scanning (WS) and global observation (G). Table 1 shows the information of these modes [26]. The NS, WS and G modes all use the same antenna beam as the standard stripmap (S) mode, which covers an approximately 130 km swath. Its capability of wide swath observations plays a crucial role in sea surface information retrieval and sea monitoring.

3. Traditional Feature-Based Mosaic Process for SAR Images

The traditional feature-based image mosaic process for SAR can be roughly divided into five parts: image preprocessing, keypoint detection and matching (registration), homography matrix calculation, image projection and image blending [27,28]. The entire traditional feature-based image mosaic process is shown in Figure 2.

3.1. Image Preprocessing

Before mosaicking, to suppress speckle noise, SAR images were filtered to enhance edges and denoise. In regard to ScanSAR, the intrinsic periodic scalloping in the azimuth and the effect of the roll angle error on the range, which are caused by the multiple-beam scanning strategy in swath, should also be corrected [29,30,31]. In addition, the radiation intensity of adjacent images has to be balanced to avoid obvious differences after stitching.

3.2. Keypoint Detection and Matching

The classic SIFT is an efficient feature detection algorithm [13]. First, the potential interest points that are invariant to scale and orientation were identified by using a difference of Gaussians function and select the keypoints based on their stability. Then, one or more orientations were assigned to each keypoint location based on local image gradient directions and form a feature vector with 128 elements for each keypoint. Finally, the candidate keypoints were matched by finding their nearest neighbor, which is defined as the keypoint with the minimum Euclidean distance for the descriptor vector. In addition, the speeded-up robust features (SURF) algorithm and the oriented features from the accelerated segment test (FAST) and rotated binary robust independent elementary features (BRIEF) algorithm were also used in SAR image mosaics [32,33].

3.3. Homography Matrix Calculation

The transformation of the pixel coordinates, which is called the homography matrix, was calculated based on the coordinates of matched keypoints [34,35]:
H = [ a x b x c x b y a y c y 0 0 1 ]
where a x and a y stand for the scaling degree of rows and columns, respectively, b x and b y reflect the rotation of the image rows and columns, respectively, and c x and c y represent the translation of rows and columns, respectively. The homography matrix, which directly affects the accuracy of image projection, should be filtered by the RANSAC algorithm because using mismatched keypoints for the calculation is possible [36,37]. Four pairs of matched keypoints were selected randomly to calculate a homography matrix. Then, all matched keypoints were projected based on the homography matrix, and their Euclidean distances between coordinates (threshold) were recorded. The number of the correctly matched keypoints, whose threshold was less than one, were also recorded. After iterating the above steps multiple times, the accurate homography matrix with the most correctly matched keypoints could be screened. The threshold was one pixel in this paper. The number of iterations was 2000. Such parameters of the RANSAC algorithm can result in a higher accuracy of homography matrix calculation and were independent from the images to be stitched. In addition, the RANSAC algorithm used in this paper was very efficient and took time in seconds.

3.4. Image Projection

To ensure the relative positions between images are accurate, the image to be stitched was projected to the coordinate system of the reference image by scaling, rotation and translation based on the homography matrix. ( x , y ) are the coordinates of any pixel in the image to be stitched, and the coordinates of pixels in the projected image are represented by ( x , y ) :
[ x y 1 ] = H [ x y 1 ] = [ a x b x c x b y a y c y 0 0 1 ] [ x y 1 ]

3.5. Image Blending

To eliminate mosaic seams and achieve a smooth transition after projection, image blending, which can process the pixel values of overlapping areas, becomes indispensable. The weighted-average algorithm is a simple and effective image blending method that sums the pixel values after assigning them a particular weight [38]. In the case of the transverse mosaic, the pixel values of overlapping areas after distance weighting can be expressed as:
I ( i , j ) = w I α ( i , j ) + ( 1 w ) I β ( i , j )
where I α and I β stand for the overlapping areas of the reference image and the image to be stitched, respectively, before blending, and w = d α d α + d β represents the weight, where d α or d β are the distances from any pixel location to the left or right boundary, respectively, of the overlapping area. After image blending, the final mosaic result was obtained.

4. The Proposed Novel Mosaic Method for Spaceborne ScanSAR Images Based on Homography Matrix Compensation

To eliminate intensity inconsistencies, reduce redundant computations and improve efficiency under the premise of ensuring the images’ high resolution, we optimize several parts of the traditional process.

4.1. Image Preprocessing Based on an Improved Wallis Filter

The wide swath of ScanSAR was composed of multiple subswaths. However, the radiation intensities of the different subswath images were still inconsistent even though the intrinsic periodic scalloping in the azimuth and the effect of the roll angle error on the range were corrected. This phenomenon is caused by many factors, such as the slant range from the satellite to the target, the radar looking angle, different antenna gain patterns and inconsistent processor parameterizations. Therefore, the radiation intensity of adjacent images should be balanced during preprocessing to avoid inconsistency after mosaicking.
The Wallis filter, which can equalize the intensity and contrast of images, is a pixel-value processing algorithm based on the reference image [39]. We used I α and I β to represent the reference image and the image to be stitched, respectively; then, the classic Wallis filter can be shown as:
I β ( i , j ) = ( I β ( i , j ) m β ) s α s β + m α
where I β is the filtered image, m α and m β represent the mean of the pixel values in I α and I β , and s α and s β are the standard deviations of the pixel values.
As shown in Figure 3a, the classic Wallis filter worked well when two images with similar intensity trends along the stitching seam were processed. However, when the seam was too long and the intensity trends were opposites, there would still be obvious intensity inconsistencies even when the means and standard deviations of the two images were adjusted to the same, as shown in Figure 3b.
It can be analyzed from Equation (4), when m α = m β and s α = s β , I β ( i , j ) = I β ( i , j ) , which means that the classic Wallis filter will be invalid if the means and standard deviations of I α and I β are equal. This could happen in the situation of opposite intensity trends. Thus, these two parameters were not enough to accurately describe the differences between images.
In this paper, a ratio of the mean was multiplied by the classic Wallis filter to implement the description of intensity trends along the stitching seam:
I β ( i , j ) = I β ( i , j ) M α M β
where I β is the result of the improved Wallis filter, I β is the result of the classic Wallis filter, and M α and M β are the mean pixel values of I α and I β perpendicular to the stitching seam (if the stitching seam is along the column, M α and M β are the mean pixel values of every row). The improved Wallis filter performed well regardless of whether the intensity trends were similar or opposite, so that the inconsistency in the intensity could be successfully eliminated and the effect of the mosaic result would be improved.

4.2. Overlapping Area Coarse Extraction

As mentioned in the introduction, the keypoints that could be matched correctly were from overlapping areas between adjacent images. In that case, a large number of redundant keypoints were acquired from nonoverlapping areas, which would cause considerable computational redundancy in keypoint matching. The accuracy of matching and the efficiency of mosaics would both be affected. To solve this problem, we reduced the range of keypoint detection from the whole images to the overlapping areas. First, we calculate the actual longitude and latitude of the pixels using the geolocation technologies of spaceborne SAR [40,41,42]. The mature geolocation technologies used in this paper were efficient enough and took time in seconds. Then, the overlapping rates were estimated by the longitude and latitude of the pixels. Finally, the overlapping areas of adjacent images were coarsely extracted based on the overlapping rates. Only the keypoints in overlapping areas would be detected and matched, while nonoverlapping areas that accounted for a large proportion would not be involved in the registration.
We used r α and r β to represent the overlapping rates of I α and I β :
r α = card ( L α L β ) card ( L α )
r β = card ( L α L β ) card ( L β )
where card ( ) represents the number of elements in the set, L α is the longitude and latitude of all the pixels in I α , and L β is the longitude and latitude of all the pixels in I β . As shown in Figure 4, the overlapping areas were extracted from the whole images based on the overlapping rates.

4.3. Homography Matrix Compensation

To improve the efficiency of the mosaic, we initially tried to downsample the images for stitching and upsample the stitched image to the original size. Although multilooking or image downsampling can greatly reduce the amount of data and effectively speed up image mosaicking [17], the problem of ScanSAR with a lower resolution than stripmap SAR worsens. Neither of these methods were helpful in maintaining the original resolution or as many image details as possible. One aspect considered significant was that the image projection accuracy was directly determined by the homography matrix. In that case, we switched our attention from image scaling to homography matrix scaling and proposed a novel method. The extracted overlapping areas were downsampled for registration, so keypoints would be detected and matched quickly. After being calculated based on matched keypoints, the homography matrix should be compensated, which depends on the multiple of downsampling. Then, the compensated matrix could be applied to the projection of the original-size images. In that case, the resolution could be preserved successfully in the final mosaic result.
To ensure the accuracy of projection, the scaling compensation for the homography matrix should be precisely deduced. As shown in Figure 5, the rows and columns of the reference image I α and the projected image I β were scaled to 1 / n . The homography matrix used to complete this step is as follows:
H 1 = diag ( 1 / n , 1 / n , 1 )
the homography matrix H used for the projection of downsampled image I β to downsampled image I α was calculated as shown in Equation (1). After being projected based on H , the rows and columns should be scaled by n times to approximate the projection of the original-size images. The homography matrix used in amplification is:
H 2 = diag ( n , n , 1 )
( x β , y β ) are the coordinates of any pixel in image I β , ( x β , y β ) are the coordinates of any pixel in downsampled image I β , ( x β , y β ) are the coordinates of any pixel in projected downsampled image I β , and ( x β , y β ) are the coordinates of any pixel in projected original-size image I β . Thus, the relationship among these coordinates can be expressed as:
[ x β y β 1 ] = H 1 [ x β y β 1 ]
[ x β y β 1 ] = H [ x β y β 1 ]
[ x β y β 1 ] = H 2 [ x β y β 1 ] = H 2 H [ x β y β 1 ] = H 2 H H 1 [ x β y β 1 ]
Therefore, the homography matrix used to project the original image I β to the original image I α can be shown as:
H 0 = H 2 H H 1 = [ n 0 0 0 n 0 0 0 1 ] [ a x b x c x b y a y c y 0 0 1 ] [ 1 / n 0 0 0 1 / n 0 0 0 1 ] = [ a x b x n c x b y a y n c y 0 0 1 ]
First, H was calculated after keypoint detection and matching in downsampled overlapping areas. Then, the projection of the original-size images was achieved based on H 0 . This method not only projected correctly and preserved the original information of the images, but also decreased the keypoint detection and matching times to make the image mosaic process faster. However, although the efficiency of keypoint detection and matching was improved, the overlapping areas could not be downsampled indefinitely. According to Equation (13), if there was a computational error in c x or c y , it would be magnified n times in H 0 , which affected the image projection accuracy. Therefore, a tradeoff between the efficiency and accuracy of image mosaics should be determined according to the specific mosaic requirements, which will be discussed in Section 5.

4.4. Parallel Registration
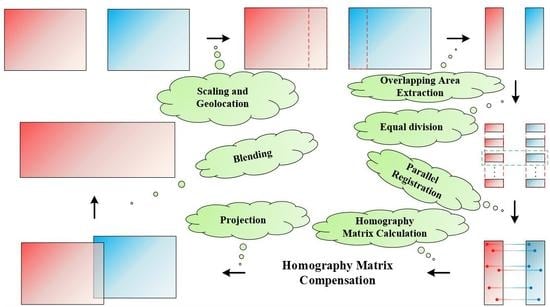
With the rapid development of modern radar technology, the image processing scale of spaceborne ScanSAR has increased continually. Parallel operation is becoming an attractive solution when traditional serial operation cannot meet the growing application requirements. Thus, we developed an efficient registration method. First, perpendicular to the direction of the mosaic, the downsampled overlapping areas were divided into multiple equally sized parts. Then, as shown in Figure 6, the keypoints of different parts could be simultaneously detected and matched to achieve parallel registration.
Directly calculating the homography matrix using the matched keypoints obtained from the downsampled divided overlapping areas was not enough. It should be noted that to ensure the accuracy of H0 and the mosaic relationship between block and block, the coordinates of the matched keypoints must be corrected due to the offsets caused by overlapping area extraction, downsampling and division. Taking transverse stitching as an example, the row coordinate offset of the overlapping area’s kth part in I α is:
x e ( k ) = h α n M ( k 1 ) , k = 1 , , M
where h α stands for the number of rows in I α , n represents the multiple of downsampling, and M is the number of divided parts in overlapping areas, which can depend on the number of central processing unit (CPU) cores on the experimental device. The column coordinate offset in I α is:
y e = 1 n ( c α c α r α )
here, c α is the number of columns in I α and r α is the overlapping rate of I α . Therefore, the coordinate of any matched keypoint in the overlapping area’s kth part of I α should be corrected as:
( x c , y c ) = ( x , y ) + ( x e ( k ) , y e )
where ( x c , y c ) are the corrected coordinates and ( x , y ) are the coordinates before correction. After extraction, downsampling and division, the keypoints were detected and matched in the M parts of the overlapping areas at the same time. Then, the coordinates of the matched keypoints in different parts were simultaneously corrected. The matched keypoints of all blocks were selected randomly to calculate the homography matrix. Thus, the proposed parallel registration can significantly improve the efficiency of the image mosaic.

4.5. Workflow

In summary, the new method is a combination of the traditional process and our novel improvements. Figure 7 shows its entire workflow: (1) inputting the image data of spaceborne ScanSAR; (2) geolocation; (3) image preprocessing by the improved Wallis filter; (4) overlapping area coarse extraction based on the longitude and latitude of the pixels; (5) overlapping area downsampling, (6) equal division of the downsampled overlapping areas; (7) keypoint detection by the SIFT algorithm, keypoint matching and coordinate offset compensation of matched keypoints (all run in parallel); (8) homography matrix calculation, RANSAC filtering and scaling compensation; (9) preprocessed image (in original size) projection based on the compensated homography matrix; (10) image blending by the weighted-average algorithm; (11) outputting the smooth, seamless and large-area image of spaceborne ScanSAR.

5. Experimental Results and Discussion

An image mosaic was created using a program written in MATLAB. The computer has thirty-two Intel (R) Xeon (R) CPU (2.6 GHz) cores and 512 GB RAM. In this section, we will use real GF-3 ScanSAR image data to perform a series of contrast experiments to compare the traditional feature-based mosaic method with the method we proposed and analyze their results and performances in terms of various aspects.

5.1. Image Preprocessing Contrast Experiment

To verify the effect of the improved Wallis filter, the mosaic results without preprocessing, using the classic Wallis filter and using the improved Wallis filter, were compared in this paper. Two ScanSAR images of GF-3, which corrected the intrinsic periodic scalloping in the azimuth and the effect of the roll angle error on the range, were selected to implement this experiment. We divided every stitching result into three parts for comparison. As shown in Figure 8a, the intensity of the original images was not consistent. There was an obvious stitching seam due to the fault in the azimuthal intensity distribution (the azimuth is along the vertical direction in this image). The result using the classic Wallis filter is presented in Figure 8b, where the seam still exists even if the intensity distribution in azimuth of the middle part is balanced. Therefore, the limitation of the classic Wallis filter is that it had difficulty handling the situation where the means and standard deviations were very similar but the trends in the intensity along the seam were opposites. Figure 8c provides the result based on the improved Wallis filter. The azimuthal intensity of all three parts is consistent, and the connection between the two images is smooth, which means that the mosaic seam was successfully eliminated. In addition, for two images with the same trends in the intensity along the seam, both the classic Wallis filter and the improved Wallis filter could achieve good results. Therefore, the effect of the mosaic results can be markedly improved by the improved Wallis filter, which is more robust than the classic filter.

5.2. Image Registration Contrast Experiment

To verify the improvement of overlapping area extraction, Azimuth1_subswath2 and Azimuth2_subswath2 and their overlapping areas were used for the keypoint detection and matching experiments. The overlapping rates estimated from the geolocation of the two images were 7.46% and 7.50%, respectively. Ideally, the matched keypoints should have the same coordinates when projection finishes. Therefore, after stitching, the matched keypoints whose Euclidean distances between the coordinates were not greater than one were regarded as correctly matched keypoints. The ratio of correctly matched keypoints to matched keypoints is defined as the correct matching rate:
E m = P m P m
where P m is the number of matched keypoints and P m is the number of correctly matched keypoints.
The keypoint detection and matching performances in the whole images and overlapping areas are compared in Table 2. It can be seen that the number of keypoints detected from the overlapping areas was much less than that detected from whole images, but the numbers of matched keypoints in the two situations were almost the same. Therefore, acquiring keypoints from overlapping areas can provide enough matched keypoints for subsequent operations. In addition, keypoint detection and matching will be more efficient. More importantly, compared to the situation without an overlapping area extraction, the correct matching rate was improved by nearly four percentage points to 98.89%, which means there were some mismatched keypoints obtained from the whole images. In that case, the interference of mismatched keypoints from nonoverlapping areas was avoided, which improves the accuracy of matching and provides a strong guarantee for the calculation of the homography matrix.

5.3. Efficiency Analysis

The time needed for keypoint detection and matching will be greatly reduced due to the improved methods we proposed. However, it is difficult to estimate the degree of efficiency optimization because the distribution of keypoints in spaceborne ScanSAR images is not uniform. In this paper, assuming that keypoints follow a uniform distribution, we roughly estimated the improvement in the efficiency with our proposed methods. The total time needed for keypoint detection by the SIFT algorithm and matching with the traditional method is:
t 0 = t S + t m
where t S is the time needed for keypoint detection by the SIFT algorithm and t m represents the time needed for matching. Assuming that u is the computational load, the computational efficiency of the SIFT algorithm is O ( u ) and the computational efficiency of matching is O ( u 2 ) . The time after overlapping area extraction is:
t 1 = r o t S + ( r 0 ) 2 t m
where r o is the overlapping rate of the reference image and the image to be stitched. The time after overlapping area extraction and downsampling is:
t 2 = r o t S n + ( r o n ) 2 t m
where 1 / n is considered the scaling coefficient of the image. The range of keypoint detection and matching is reduced to equal parts of overlapping areas when performed in parallel, so the time after overlapping area extraction, downsampling and division is:
t 3 = r o t S M n + ( r α M n ) 2 t m
where M is the number of parts after division. Thus, compared with the traditional method, the efficiency of keypoint detection and matching can be considerably improved.
To evaluate the influence of the improved methods presented in Section 4 on the mosaic efficiency of multiple large-area images, several mosaic experiments with different situations of overlapping area extraction, different scaling coefficients and different numbers of divided parts were performed on six GF-3 ScanSAR images (two images in the azimuth and three subswath). The basic parameters of the six GF-3 ScanSAR images are presented in Table 3.
From Figure 9a, we know that the time can be reduced to approximately 1/10 when the overlapping area extraction is applied to the mosaic of large-area images. The efficiency of stitching was improved significantly. As shown in Figure 9b, mosaic time can also be reduced effectively by downsampling overlapping areas, especially when the scaling coefficient is from 0.5 to 0.05. The smaller the scaling coefficient is, the faster the stitching speed. However, the degree of improvement in efficiency is not significant when the scaling coefficient changes from 0.1 to 0.05, which means that too much scaling is unnecessary. In addition, Figure 9c shows that parallel operation greatly contributed to the efficiency of mosaics, especially for large-area images. As the number of divided parts increased, the stitching speed became faster. Moreover, all situations of the image mosaic contrast experiments we implemented are presented in Figure 9d. For the traditional feature-based mosaic process (no overlapping area extraction, no scaling compensation or parallel operation), the total mosaic time of six GF-3 ScanSAR images of original size was more than five thousand minutes. After using the improved methods, the mosaic time could easily reach approximately five minutes, which means that the efficiency was improved by nearly a thousand-fold. This indicates that the new method is more efficient.
We recorded the time of each processing step in two situations. The scaling coefficient was 0.5 and the number of the parts in parallel was 32. From Table 4, we knew that the registration was the most time-consuming part of the traditional method and its efficiency could be improved greatly by using our proposed method.
To test the effect of the proposed method on multiple large-area image mosaics, six spaceborne ScanSAR images of GF-3 were stitched to a wide image. The scaling coefficient was 0.5, and the number of divided parts was 32. The geolocation results of the six GF-3 ScanSAR images are presented in Table 5, the overlapping rates between adjacent images are provided in Table 6 and the overlapping areas of six images are shown in Figure 10.
The wide image was 70,088 × 69,500 pixels and 9.07 GB. The range of the geolocation results was from 40.083754° to 43.656159° north latitude and from 116.192071° to 121.062448° east longitude. The real width of the range swath was more than 400 km. From Figure 11g, there is no obvious intensity inconsistency among adjacent subswaths and no stitching seams in the wide image. The means and standard deviations of the pixel values among adjacent images were successfully balanced by an improved Wallis filter to make the transitions smoother. There were no apparent position offsets or image pixel coverage issues, which demonstrates that the mosaic accuracy of multiple large-area images can be ensured by the proposed method. The details of the objects in the original subimages can be found in the wide image, which means that the information and resolution of the original ScanSAR images can be successfully preserved. Thus, the proposed method can provide support for some subsequent applications of wide ScanSAR images, such as information extraction, object detection and target recognition.

5.4. Error Analysis

To analyze the error of the image mosaic caused by homography matrix scaling, Azimuth1_subswath2 and Azimuth2_subswath2 were stitched at different scaling coefficients. First, an experiment with a scaling coefficient of one was performed. We recorded all the pixel coordinates of the Azimuth2_subswath2′s mosaic result and regarded them as the correct coordinates. Then, experiments with scaling coefficients of 1, 0.5, 0.1 and 0.05 were conducted, and all the pixel coordinates of the corresponding Azimuth2_subswath2 mosaic results were recorded as the experimental coordinates.
The root-mean-square error (RMSE) of the distances between the correct coordinates and the experimental coordinates was calculated as follows:
RMSE = 1 N × i = 1 N ( ( x i x i ) 2 + ( y i y i ) 2 )
where N is the number of pixels, ( x i , y i ) are the correct coordinates and ( x i , y i ) are the experimental coordinates. Figure 12 shows the correct matching rate E m and the RMSE at the different scaling coefficients.
It can be seen from Figure 12 that E m decreased as the scaling coefficient decreased. Especially when the scaling coefficient was 0.05, it decreased by more than twenty percentage points compared to the case without downsampling. Therefore, overlapping area downsampling has a negative impact on the correct matching rate so that the fault tolerance rate of the homography matrix calculation will be lower. However, the RMSE changed in an opposite trend with the scaling coefficient. When the scaling coefficients were 0.1 and 0.05, the RMSE was greater than three. Apparently, overlapping area downsampling increases the RMSE of the distances between the correct coordinates and the experimental coordinates, which causes a worse accuracy of the image mosaic. Moreover, one important aspect is that the RMSE was not zero when the scaling coefficient was 1. This phenomenon demonstrates that there is still an error in the calculation of the homography matrix itself even with the same scaling coefficient because the matched keypoints used to calculate the homography matrix were randomly selected. The homography matrixes computed by different matched keypoints will produce tiny errors.

6. Conclusions

Aiming to solve the mosaic problems of multiple large-area spaceborne ScanSAR images, a new method was presented that is an improvement over the traditional method. Six GF-3 ScanSAR images were stitched quickly and accurately based on the proposed method. The main findings of this study can be summarized as follows:
1. Images were preprocessed by the improved Wallis filter. The mosaic result had no obvious intensity inconsistency so that the stitching seams can be eliminated and the transitions are very smooth.
2. Extracting overlapping areas using the geolocation results was a crucial improvement in the registration. On the one hand, a large number of redundant keypoints were eliminated to improve the efficiency of mosaics, and the number of matched keypoints could also be guaranteed. On the other hand, the interference of similar keypoints from nonoverlapping areas was avoided, and the false matching rate was reduced, which improved the accuracy of matched keypoints.
3. Homography matrix scaling compensation can greatly improve the efficiency of image mosaics but causes some stitching errors. Therefore, it is not suggested to downsample blindly but to make a tradeoff between the efficiency and accuracy of mosaics according to the specific requirements.
4. The speed of image mosaicking was much faster when a parallel operation was used in equally divided overlapping areas, especially for large-area images.
The performance of the novel image mosaic method based on homography matrix compensation was verified by GF-3 spaceborne ScanSAR images. The experimental results indicate that the proposed method is more effective, more efficient and more robust than the traditional method. In addition, the degree of optimization can be adjusted within the range of permissible error to achieve a shorter mosaicking time. In summary, this new method is suitable for multiple large-area spaceborne ScanSAR image mosaics to obtain a wide image for subsequent applications, such as information extraction, object detection and target recognition, and has a strong value in both theoretical research and practical applications.

Author Contributions

Conceptualization, W.Y. and H.F.; methodology, J.T., Y.W. and Y.C.; software, J.T.; investigation, J.T., Y.W. and Y.C.; resources, W.Y. and H.F.; writing—original draft preparation, J.T.; writing—review and editing, Y.W., Y.C., W.Y. and H.F.; All authors have read and agreed to the published version of the manuscript.

Funding

This research was funded by the National Natural Science Foundation of China, grant number 61901442.

Conflicts of Interest

The authors declare no conflict of interest.

References

  1. Cumming, I.G.; Wong, F.H. Digital Processing of Synthetic Aperture Radar Data: Algorithms and Implementation; Artech House Publishers: London, UK, 2005. [Google Scholar]
  2. Romeiser, R.; Horstmann, J.; Caruso, M.J.; Graber, H.C. A Descalloping Postprocessor for ScanSAR Images of Ocean Scenes. IEEE Trans. Geosci. Remote Rens. 2013, 51, 3259–3272. [Google Scholar] [CrossRef]
  3. Zhang, G.; Li, X.; Perrie, W.; Hwang, P.A.; Zhang, B.; Yang, X. A Hurricane Wind Speed Retrieval Model for C-Band RADARSAT-2 Cross-Polarization ScanSAR Images. IEEE Trans. Geosci. Remote Sens. 2017, 55, 4766–4774. [Google Scholar] [CrossRef]
  4. Shao, W.; Yuan, X.; Sheng, Y.; Jian, S.; Wei, Z.; Zhang, Q. Development of Wind Speed Retrieval from Cross-Polarization Chinese Gaofen-3 Synthetic Aperture Radar in Typhoons. Sensors 2018, 18, 412. [Google Scholar] [CrossRef] [Green Version]
  5. Zhang, T.; Li, X.M.; Feng, Q.; Ren, Y.; Shi, Y. Retrieval of Sea Surface Wind Speeds from Gaofen-3 Full Polarimetric Data. Remote Sens. 2019, 11, 813. [Google Scholar] [CrossRef] [Green Version]
  6. Shao, W.; Ding, Y.; Li, J.; Guo, S.; Nunziata, F.; Yuan, X.; Zhao, L. Wave Retrieval Under Typhoon Conditions Using a Machine Learning Method Applied to Gaofen-3 SAR Imagery. Can. J. Remote Sens. 2019, 45, 723–732. [Google Scholar] [CrossRef]
  7. Liu, Z.; Liu, B.; Guo, W.; Zhang, Z.; Zhang, B.; Zhou, Y.; Ma, G.; Yu, W. Ship detection in GF-3 NSC Mode SAR images. J. Radars 2017, 6, 473–482. [Google Scholar]
  8. Xu, L.; Jun, H.; Xian, S.; Yi, Y. Fast ship detection method based on ScanSAR image. J. Univ. Chin. Acad. Sci. 2013, 30, 793–799. [Google Scholar]
  9. Zhang, L.; Liu, H.; Gu, X.; Guo, H.; Chen, J.; Liu, G. Sea Ice Classification Using TerraSAR-X ScanSAR Data with Removal of Scalloping and Interscan Banding. IEEE J. Sel. Top. Appl. Earth Obs. Remote Sens. 2019, 12, 589–598. [Google Scholar] [CrossRef]
  10. Hayashi, M.; Motohka, T.; Sawada, Y. Aboveground Biomass Mapping Using ALOS-2/PALSAR-2 Time-Series Images for Borneo’s Forest. IEEE J. Sel. Top. Appl. Earth Obs. Remote Sens. 2019, 2, 5167–5177. [Google Scholar] [CrossRef]
  11. Zhang, Q. System design and key technologies of the GF-3 satellite. Acta Geod. Cartogr. Sin. 2017, 46, 269–277. [Google Scholar]
  12. Zhang, G.; Cui, H.; Wang, T.; Li, Z. Random cross-observation intensity consistency method for large-scale SAR images mosaics: An example of Gaofen-3 SAR images covering China. ISPRS J. Photogramm. Remote Sens. 2019, 156, 215–234. [Google Scholar] [CrossRef]
  13. Lowe, D.G. Distinctive Image Features from Scale-Invariant Keypoints. Int. J. Comput. Vis. 2004, 60, 91–110. [Google Scholar] [CrossRef]
  14. Wessel, B.; Huber, M.; Roth, A. Registration of Near Real-time SAR Images by Image-to-Image Matching. ISPRS Int. Arch. Photogramm. Remote Sens. Spat. Inf. Sci. 2007, 3, 179–184. [Google Scholar]
  15. Li, Q.; Wang, G.; Liu, J.; Liu, S. Robust Scale-Invariant Feature Matching for Remote Sensing Image Registration. IEEE Geosci. Remote Sens. Lett. 2009, 6, 287–291. [Google Scholar]
  16. Schwind, P.; Suri, S.; Reinartz, P.; Siebert, A. Applicability of the SIFT operator to geometric SAR image registration. Int. J. Remote Sens. 2010, 31, 1959–1980. [Google Scholar] [CrossRef]
  17. Yu, X.; Liu, T.; Li, P.; Huang, G. The application of improved SIFT algorithm in high resolution SAR image matching in mountain areas. In Proceedings of the 2011 International Symposium on Image and Data Fusion, Tengchong, China, 9–11 August 2011; pp. 1–4. [Google Scholar]
  18. Wang, S.; You, H.; Kun, F. BFSIFT: A Novel Method to Find Feature Matches for SAR Image Registration. IEEE Geosci. Remote Sens. Lett. 2011, 9, 649–653. [Google Scholar] [CrossRef]
  19. Wang, F.; You, H.; Fu, X. Adapted Anisotropic Gaussian SIFT Matching Strategy for SAR Registration. IEEE Geosci. Remote Sens. Lett. 2015, 12, 160–164. [Google Scholar] [CrossRef]
  20. Fan, J.; Wu, Y.; Wang, F.; Zhang, Q.; Liao, G.; Li, M. SAR Image Registration Using Phase Congruency and Nonlinear Diffusion-Based SIFT. IEEE Geosci. Remote Sens. Lett. 2015, 12, 562–566. [Google Scholar]
  21. Dellinger, F.; Delon, J.; Gousseau, Y.; Michel, J.; Tupin, F. SAR-SIFT: A SIFT-Like Algorithm for SAR Images. IEEE Trans. Geosci. Remote Sens. 2015, 53, 453–466. [Google Scholar] [CrossRef] [Green Version]
  22. Gong, M.; Zhao, S.; Jiao, L.; Tian, D.; Wang, S. A Novel Coarse-to-Fine Scheme for Automatic Image Registration Based on SIFT and Mutual Information. IEEE Trans. Geosci. Remote Sens. 2014, 52, 4328–4338. [Google Scholar] [CrossRef]
  23. Xiang, Y.; Wang, F.; You, H. An Automatic and Novel SAR Image Registration Algorithm: A Case Study of the Chinese GF-3 Satellite. Sensors 2018, 18, 672. [Google Scholar] [CrossRef] [PubMed] [Green Version]
  24. Sun, W.; Yao, H.; Qian, L.; Zhang, L. A mosaic method for airborne SAR image based on location. In Proceedings of the 2009 2nd Asian-Pacific Conference on Synthetic Aperture Radar, Xi’an, China, 26–30 October 2009; pp. 514–517. [Google Scholar]
  25. Ning, J.; Liu, D.; Liu, K.; Zhang, H.; Wang, Y. An Improved Full-Aperture ScanSAR Imaging Method Integrating the MIAA Based Aperture Interpolation. J. Sens. 2020, 2020, 1–15. [Google Scholar] [CrossRef]
  26. Sun, J.; Yu, W.; Deng, Y. The SAR Payload Design and Performance for the GF-3 Mission. Sensors 2017, 17, 2419. [Google Scholar] [CrossRef] [Green Version]
  27. Manikandan, S.; Vardhini, J.P. Enhanced Feature Based Mosaicing Technique for Visually and Geometrically Degraded Airborne Synthetic Aperture Radar Images. Sens. Imaging 2015, 16, 1–19. [Google Scholar] [CrossRef]
  28. Pandey, A.; Pati, U.C. Image mosaicing: A deeper insight. Image Vis. Comput. 2019, 89, 236–257. [Google Scholar] [CrossRef]
  29. Bamler, R.; Eineder, M. ScanSAR processing using standard high precision SAR algorithms. IEEE Trans. Geosci. Remote Sens. 1996, 34, 212–218. [Google Scholar] [CrossRef]
  30. Shimada, M. A New Method for Correcting ScanSAR Scalloping Using Forests and Inter-SCAN Banding Employing Dynamic Filtering. IEEE Trans. Geosci. Remote Sens. 2009, 47, 3933–3942. [Google Scholar] [CrossRef]
  31. Cai, Y.; Wang, Y.; Fan, H. A Scalloping Correction Method for ScanSAR Image Based on Improved Kalman Filter Model. J. Electron. Inf. Technol. 2021. [Google Scholar] [CrossRef]
  32. Bay, H.; Tuytelaars, T.; Van, G.L. Surf: Speeded up robust features. In European Conference on Computer Vision; Springer: Berlin/Heidelberg, Germany, 2006; pp. 404–417. [Google Scholar]
  33. Rublee, E.; Rabaud, V.; Konolige, K.; Bradski, G.R. ORB: An efficient alternative to SIFT or SURF. In Proceedings of the 2011 International Conference on Computer Vision, Barcelona, Spain, 6–13 November 2011; pp. 2564–2571. [Google Scholar]
  34. Li, Z.; Song, L.; Xi, J.; Guo, Q.; Zhu, X.; Chen, M. A stereo matching algorithm based on SIFT feature and homography matrix. Optoelectron. Lett. 2015, 11, 390–394. [Google Scholar] [CrossRef] [Green Version]
  35. Zhang, M.; Hou, Y.; Hu, Z. Accurate Object Tracking Based on Homography Matrix. In Proceedings of the 2012 International Conference on Computer Science and Service System, Nanjing, China, 11–13 August 2012; pp. 2310–2312. [Google Scholar]
  36. Martin, A.F.; Robert, C.B. Random sample consensus: A paradigm for model fitting with application to image analysis and automated cartography. Commun. ACM 1981, 24, 381–395. [Google Scholar]
  37. Kim, T.; Im, Y.J. Automatic satellite image registration by combination of matching and random sample consensus. IEEE Trans. Geosci. Remote Sens. 2003, 41, 1111–1117. [Google Scholar]
  38. Ge, J.; Han, X. An Image Mosaic Research Based on Feature Points Matching. Comput. Meas. Control 2012, 20, 836–851. [Google Scholar]
  39. Zhang, L.; Zhang, Z.; Zhang, J. The image matching based on wallis filtering. J. Wuhan Tech. Univ. Surv. Mapp. 1999, 24, 24–27. [Google Scholar]
  40. Curlander, J.C. Location of Spaceborne Sar Imagery. IEEE Trans. Geosci. Remote Sens. 1982, GE-20, 359–364. [Google Scholar] [CrossRef]
  41. Wivell, C.E.; Steinwand, D.R.; Kelly, G.G.; Meyer, D.J. Evaluation of terrain models for the geocoding and terrain correction, of synthetic aperture radar (SAR) images. IEEE Trans. Geosci. Remote Sens. 1992, 30, 1137–1144. [Google Scholar] [CrossRef]
  42. Wang, T.; Zang, G.; Yu, L.; Zhao, R.; Deng, M.; Kai, X. Multi-Mode GF-3 Satellite Image Geometric Accuracy Verification Using the RPC Model. Sensors 2017, 17, 2005. [Google Scholar] [CrossRef] [Green Version]
Figure 1. Spaceborne ScanSAR working mechanism of GF-3.
Remotesensing 13 02866 g001
Figure 2. The traditional feature-based image mosaic process.
Remotesensing 13 02866 g002
Figure 3. The intensity distribution trends along the stitching seam of two images before and after classic Wallis filtering. (a) The situation of similar trends; (b) the situation of opposite trends.
Remotesensing 13 02866 g003
Figure 4. Overlapping area coarse extraction.
Remotesensing 13 02866 g004
Figure 5. The relationship of image scaling and homography matrix scaling.
Remotesensing 13 02866 g005
Figure 6. Equal division and parallel registration.
Remotesensing 13 02866 g006
Figure 7. Workflow of the proposed method.
Remotesensing 13 02866 g007
Figure 8. Image preprocessing experiment: (a) result without preprocessing; (b) result with the classic Wallis filter (the existing method of traditional process); (c) result with the improved Wallis filter (the method we proposed).
Remotesensing 13 02866 g008
Figure 9. Time needed for image mosaicking in different situations: (a) overlapping area extraction or not (no scaling compensation or parallel operation); (b) different downsampling degrees of overlapping areas (no parallel operation); (c) different parts in parallel (no downsampling); (d) mosaic times of the contrast experiments in all situations.
Remotesensing 13 02866 g009aRemotesensing 13 02866 g009b
Figure 10. Overlapping areas of the six images.
Remotesensing 13 02866 g010
Figure 11. GF-3 ScanSAR images: (a) Azimuth1_subswath1; (b) Azimuth1_subswath2; (c) Azimuth1_subswath3; (d) Azimuth2_subswath1; (e) Azimuth2_subswath2; (f) Azimuth2_subswath3; (g) mosaic result of the six GF-3 spaceborne ScanSAR images.
Remotesensing 13 02866 g011
Figure 12. Correct matching rate and RMSE at the different scaling coefficients.
Remotesensing 13 02866 g012
Table 1. ScanSAR modes of GF-3 satellite.
ScanSAR ModeIncidence Angle (°)Nominal Resolution (m)Nominal Swath (km)PolarizationAdjacent Beams
NS17–5050300Dual3
WS17–50100500Dual5
G17–53500650Dual7
Table 2. Keypoint detection and matching performances of the whole images and overlapping areas.
Range of Keypoint DetectionNumber of Keypoints
in Azimuth1_ Subswath2
Number of Keypoints
in Azimuth2_ Subswath2
Number of Matched Keypoints E m / %
Whole image843,159931,70453,26994.92
Overlapping area93,86693,50751,81298.89
Table 3. Parameters of the six GF-3 ScanSAR images.
Image NameSizeBit Depth/FormatCapacity
Azimuth1_subswath124,648 × 36,09216/TIF1.65 GB
Azimuth1_subswath229,256 × 30,01616/TIF1.63 GB
Azimuth1_subswath331,304 × 36,53216/TIF2.12 GB
Azimuth2_subswath124,648 × 36,09216/TIF1.65 GB
Azimuth2_subswath229,256 × 30,01616/TIF1.63 GB
Azimuth2_subswath331,304 × 36,53216/TIF2.12 GB
Table 4. Time of each processing stage.
MethodRegistrationHomography Matrix
Calculation
Image
Projection
Image BlendingTotal
Traditional method5200.7 min0.5 min1.8 min1.2 min5204.2 min
The method we proposed1.7 min0.5 min1.8 min1.2 min5.2 min
Table 5. Geolocation results of the six GF-3 ScanSAR images.
Image NameLatitude/Longitude (°) of the Top-Left CornerLatitude/Longitude (°) of the Top-Right CornerLatitude/Longitude (°) of the Lower-Left CornerLatitude/Longitude (°) of the Lower-Right Corner
Azimuth1_subswath143.043873/
121.062448
41.509605/
120.578586
43.339918/
119.192047
41.802235/
118.759260
Azimuth1_subswath243.218379/
119.982423
41.681016/
119.528637
43.478385/
118.232633
41.939181/
117.824313
Azimuth1_subswath343.454342/
118.396638
41.919444/
117.985239
43.656159/
116.900489
42.120934/
116.527078
Azimuth2_subswath141.620338/
120.612775
40.083754/
120.159869
41.913187/
118.789969
40.374984/
118.376998
Azimuth2_subswath241.792651/
119.560996/
40.254233/
119.130605
42.050932/
117.853522
40.511655/
117.461630
Azimuth2_subswath342.026978/
118.013633
40.491942/
117.619156
42.228482/
116.552920
40.693604/
116.192071
Table 6. Overlapping rates between adjacent images.
Direction Image   I α Image   I β r α / % r β / %
RangeAzimuth1_subswath1Azimuth1_subswath242.1645.06
Azimuth1_subswath2Azimuth1_subswath39.5111.22
Azimuth2_subswath1Azimuth2_subswath242.2745.11
Azimuth2_subswath2Azimuth2_subswath39.4111.11
AzimuthAzimuth1_subswath1Azimuth2_subswath17.437.48
Azimuth1_subswath2Azimuth2_subswath27.467.50
Azimuth1_subswath3Azimuth2_subswath37.217.23
Publisher’s Note: MDPI stays neutral with regard to jurisdictional claims in published maps and institutional affiliations.

