Article

An Improved Cloud Masking Method for GOCI Data over Turbid Coastal Waters

1
Ocean College, Zhejiang University, Zhoushan 316021, China
2
Hainan Institute of Zhejiang University, Sanya 572025, China
3
College of Marine Science and Technology, Zhejiang Ocean University, Zhoushan 316022, China
*
Author to whom correspondence should be addressed.
Remote Sens. 2021, 13(14), 2722; https://doi.org/10.3390/rs13142722
Submission received: 4 June 2021 / Revised: 8 July 2021 / Accepted: 9 July 2021 / Published: 10 July 2021
(This article belongs to the Special Issue Remote Sensing Applications in Ocean Observation)

Abstract

:
Clouds severely hinder the radiative transmission of visible light; thus, correctly masking cloudy and non-cloudy pixels is a preliminary step in processing ocean color remote sensing data. However, cloud masking over turbid waters is prone to misjudgment, leading to loss of non-cloudy pixel data. This research proposes an improved cloud masking method over turbid water to classify cloudy and non-cloudy pixels based on spectral variability of Rayleigh-corrected reflectance acquired by the Geostationary Ocean Color Imager (GOCI). Compared with other existing cloud masking methods, we demonstrated that this improved method can identify the spatial positions and shapes of clouds more realistically, and more accurate pixels of turbid waters were retained. This improved method can be effectively applied in typical turbid coastal waters. It has potential to be used in cloud masking procedures of spaceborne ocean color sensors without short-wave infrared bands.

Graphical Abstract

1. Introduction

Spaceborne sensors observe the Earth from above the top of atmosphere (TOA); hence, the presence of clouds is often inevitable in optical remote sensing images [1]. Effective ocean color and other surface information can only be extracted from cloudless pixels of satellite remote sensing images, as clouds can block the visible light emerging from the ocean to the sensor. Therefore, the detection and masking of cloud pixels is an essential and important step before further processing in various optical remote sensing applications [2].
Current statistical threshold cloud masking algorithms are mostly based on the analysis of optical and physical characteristics of cloud pixels, such as brightness temperature and reflectance variation, at different bands [3,4,5,6,7]. In infrared remote sensing, the algorithm package called APOLLO (AVHRR Processing scheme Over cLouds, Land and Ocean) has been used since the late 1980s, and its physics is the backbone of a series of cloud detection schemes for AVHRR (Advanced Very High Resolution Radiometer) heritage sensors. In APOLLO, the spatial coherence and dynamic visible threshold tests were conducted after a gross cloud check involving five daytime or nighttime tests. If the reflectance test ratio at near-infrared and visible bands is lower than 1.6 over land or larger than 0.75 over sea or the thin cirrus test using brightness temperatures at 11 μm and 12 μm fail, pixels are flagged as clear [8]. Subsequent studies were conducted to improve and document the APOLLO [9,10,11]. Thereinto, pixel properties, such as spectral and spatial variability [12,13], and multi-spectral polarization properties [14,15,16,17] are further considered. In operational processing of ocean color remote sensing, a threshold of Rayleigh-corrected reflectance ( ρ rc ) at near-infrared bands is commonly used in cloud masking. For example, a threshold method of ρ rc ( 865   nm ) 0.028 is used to automatically mask cloud pixels in standard atmospheric correction for the Geostationary Ocean Color Imager (GOCI) sensor. Considering band registration errors or cloud movements, it also masks out their neighboring (up, down, left, and right) pixels [18]. A threshold method of ρ rc ( 869   nm ) 0.027 is used by the Moderate-resolution Imaging Spectroradiometer (MODIS) onboard NASA’s Earth Observing System (EOS) Aqua and Terra satellites [19,20,21]. For simplicity, hereinafter, we call these cloud masking procedure the NIR threshold method. Generally, such methods perform well over open ocean water, but clear pixels with optical characteristics of complex seawater are often mistaken as clouds over coastal water areas [22,23].
Complex water optical conditions affected by high phytoplankton biomass, intense blue-green algal (cyanobacteria) blooms, high suspended matter concentrations, or some anthropogenic factors [24,25,26,27] can lead to the failure of the standard threshold method in cloud masking. This often occurs in populated coastal waters, inland lakes, and estuaries. These waters usually have high reflectance at red and near-infrared bands well beyond standard thresholds due to significant contributions from high suspended matter concentrations and eutrophication. The mistaken discrimination of water and cloud reflectance is more likely to lead to the loss of cloudless pixels.
Existing cloud masking methods over coastal waters with complex optical properties can be divided primarily into two categories: threshold methods and machine learning algorithms. For sensors with infrared bands, considering that water absorbs strongly in the short-wave infrared (SWIR) spectral range, progresses have been made in cloud detection methods over turbid coastal waters. For the MODIS sensor, Wang and Shi suggested using the threshold reflectance of 0.0235 and 0.0215 at 1240 nm and 1640 nm [28]. For sediment-laden water in Greenland fjords, Hudson et al. used a difference threshold of 0.05 between TOA reflectance at 645 nm and that estimated at 865 nm, using an empirical relationship to classify turbid water from cloud pixels [29].
For some sensors without SWIR bands, such as the GOCI and Sea-viewing Wide Field-of-view Sensor (SeaWiFS), the credibility of standard cloud identification methods is further diminished [30,31]. Wang and Shi proposed the use of Rayleigh-corrected reflectance ratios of two NIR bands and a Rayleigh-corrected reflectance threshold at 865 nm [28]. Firstly, thick cloudy pixels are masked out with ρ rc ( 865   nm ) > 0.06 . Then, for pixels with ρ rc ( 865   nm ) 0.06 and ρ rc ( 865   nm ) 0.027 , pixels with ρ rc ( 745 ) / ρ rc ( 865   nm ) 1.15 are also identified as clouds. For simplicity, hereinafter, we call this the Wang and Shi method. Nordkvist et al. also proposed a threshold method for cloud recognition based on spectral variability of Rayleigh-corrected reflectance over coastal waters [32]. This algorithm is based on standard ocean color wavelengths. It makes use of the lower spectral variability of clouds compared to that of water. Firstly, the Rayleigh-corrected reflectance of pixels at the four bands of 412 nm, 660 nm, 680 nm, and 865 nm was derived, and then spectral variability ε max was calculated as the maximum value of the reflectance at these four bands divided by the minimum value following
ε max = MAX [ ρ rc ( 412   nm ) ,   ρ rc ( 660   nm ) ,     ρ rc ( 680 ) ,     ρ rc ( 865   nm ) ] MIN [ ρ rc ( 412   nm ) ,   ρ rc ( 660   nm ) ,   ρ rc ( 680 ) ,   ρ rc ( 865   nm ) ] .
The combination of ε max and ρ rc ( 865   nm ) is used to identify whether the pixel is cloudless or not. When ε max exceeds 2.5 and ρ rc ( 865   nm ) 0.027 , pixels are classified as clouds. For simplicity, hereinafter, we call this the Nordkvist et al. method.
In addition, machine learning algorithms, such as support vector machine (SVM) [33], artificial neural networks [34], image segmentation, and deep convolutional neural network (CNN) [35,36,37,38], were also used in many studies in different waters. Machine learning methods usually bring good performance through a large amount of training data; however, their performance is also limited by the time and space range of their training samples.
The first geostationary ocean color sensor GOCI launched in June 2010 is equipped with eight spectral bands ranging from visible to near infrared (412 nm–865 nm) [22], and a second mission GOCI-II with 13 bands (380 nm–865 nm) was launched in February 2020. They can acquire 8/10 images daily with a spatial resolution of 500/250 m [39]. They offer good opportunities for researchers to study diurnal variabilities of coastal environment parameters. However, standard GOCI atmospheric correction processing systematically masks out data over very turbid waters and requires further corrections [40]. We also observed that in sediment-dominated particularly turbid waters, such as the Hangzhou Bay of China, existing cloud masking methods designed for coastal waters also often mistake turbid water pixels as clouds. Thus, in this study, to acquire more water surface pixels in GOCI processing over turbid coastal water, an improved threshold-based cloud masking algorithm is proposed based on the spectral variability of the Rayleigh-corrected reflectance of GOCI. Its performance was further compared with other existing methods. In this paper, the improved cloud mask method is first described. Then, its feasibility is demonstrated. Finally, the performance of the algorithm is evaluated and compared based on image interpretation in different GOCI scenarios.

2. Materials and Methods

2.1. GOCI Data

The GOCI Level 1B data products used in this study were provided by Korean Ocean Satellite Center (KOSC) at http://kosc.kiost.ac.kr/eng/ (accessed on 4 June 2021). The Rayleigh-corrected reflectance at eight spectral bands (412 nm, 443 nm, 490 nm, 555 nm, 660 nm, 680 nm, 745 nm, 865 nm) was processed using the GOCI Data Processing System (GDPS version 1.4.1). GDPS is an officially recognized data processing system for GOCI data by KOSC.
In ocean color remote sensing, the optical properties of water constituents can be retrieved under the premise of an accurate atmospheric correction. The GOCI standard atmospheric correction algorithm [41] was developed based on the theoretical basis of the SeaWiFS standard atmospheric correction algorithm [42], though partially different in the turbid water near-infrared (NIR) correction method and the aerosol models. In the GOCI standard atmospheric correction procedure, the multiply scattered Rayleigh (molecular) reflectance is first removed from the TOA reflectance of ρ TOA ( λ ) following
ρ TOA ( λ ) = ρ r ( λ ) + ρ a ( λ ) + ρ ra ( λ ) + { td r v ( λ ) × td a v ( λ ) × td ra v   ( λ ) } ( λ )   ρ w   ( λ ) ,
ρ rc ( λ ) = ρ TOA ( λ ) ρ r ( λ ) = ρ a ( λ ) + ρ ra ( λ ) + { td r v ( λ ) × td a v ( λ ) × td ra v   ( λ ) } ( λ ) ρ w ( λ ) ,
where ρ r ( λ ) means multiply scattered Rayleigh reflectance, ρ a ( λ ) means multiply scattered aerosol reflectance, and ρ ra ( λ ) means reflectance of interactively scattered between aerosols and molecules. In addition, td r v ( λ ) means diffuse Rayleigh transmittance from the sea surface to the sensor, td a v ( λ ) means diffuse transmittance of aerosols from the sea surface to the sensor, similarly, td ra v   ( λ ) represents diffuse transmittance of Rayleigh and aerosol interaction from the sea surface to the sensor, and ρ w ( λ ) represents water-leaving reflectance [18]. Then, cloud masking is performed using Rayleigh-corrected reflectance ( ρ rc ( λ ) ) to retain cloud-free pixels. After that, aerosol contribution is estimated and removed, and, finally, the surface reflectance of the ocean is obtained. Thus, correctly masking cloudy and non-cloudy pixels is a preliminary step in processing ocean color remote sensing data.

2.2. An Improved Cloud Masking Method

As a preliminary check of existing cloud masking methods, we applied the NIR threshold method and the Nordkvist et al. method over the turbid water around the Hangzhou Bay and Yangtze River (120–124°E, 29.5–33°N) of China. Figure 1a shows the RGB image composited from the GOCI Rayleigh-corrected reflectance at 680 nm, 555 nm, and 443 nm at 05:16 (Coordinated Universal Time, UTC) on 10 February 2020. Figure 1b shows the pseudo-color images of ρ rc ( 865   nm ) . The red isolines represent the pixels with the threshold of ρ rc ( 865   nm ) = 0.027 used in the NIR threshold method, and the white pixels were masked with ε max 2.5 used by the Nordkvist et al. method.
In standard ocean color data products, pixels with ρ rc ( 865   nm ) 0.027 are often masked as clouds. The red isolines in Figure 1b represent ρ rc ( 865   nm ) = 0.027 . We can see that a large number of cloudless coastal turbid water pixels with ρ rc ( 865   nm ) values higher than the red isolines can be mistaken as cloudy ones in standard ocean color data products [43]. By contrast, the Nordkvist et al. method performs better in most coastal turbid waters. Most cloudless coastal turbid water pixels are correctly recognized, but cloudless pixels with very turbid water or silt coast are still misjudged as clouds. Therefore, it is necessary to further improve existing cloud masking methods over very turbid water. In this paper, we propose an improved cloud masking scheme by combining additional threshold methods with the Nordkvist et al. method to address this problem.
Clear water pixels generally have low Rayleigh-corrected reflectance at the 865 nm band and high spectral variations and can be easily distinguished from cloud pixels by the NIR threshold method. However, for coastal turbid water pixels with complex optical characteristics, their Rayleigh-corrected reflectance values are generally higher than that of clear water at red and near-infrared bands and lower than that of clouds at short visible bands. These turbid water pixels are easily mistaken as clouds by the standard NIR threshold method.
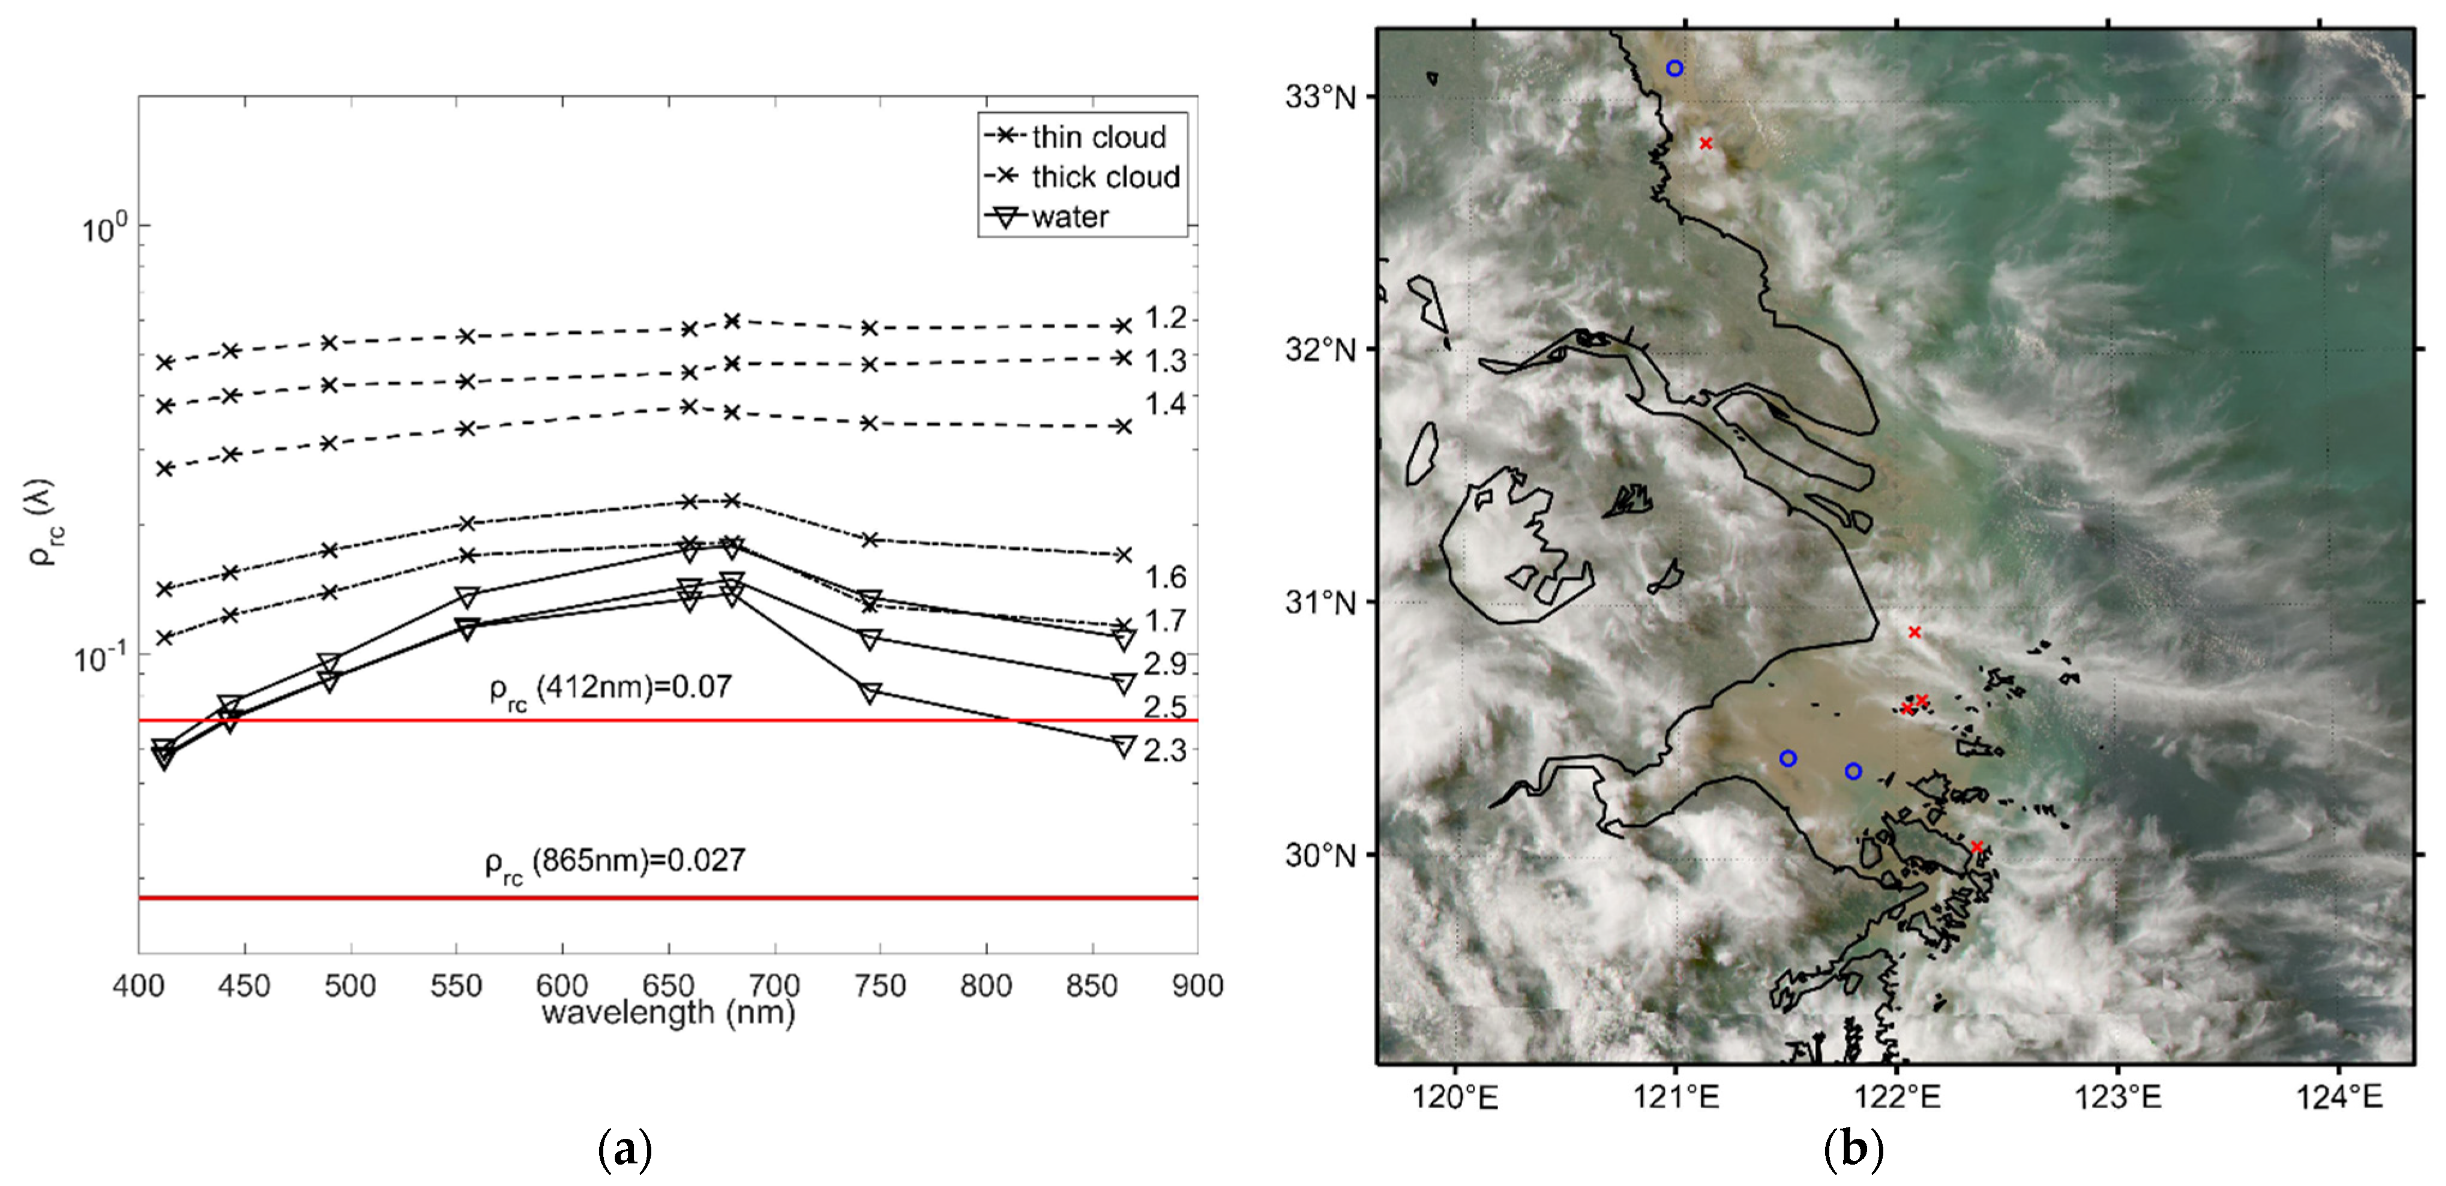
To demonstrate the difference of spectral variability between turbid water and cloud pixels, eight samples of Rayleigh-corrected spectral reflectance were selected around sediment-dominated Hangzhou Bay from the GOCI data acquired at 07:16 (UTC) on 10 May 2018. Their spectral Rayleigh-corrected reflectance at 8 bands are shown in Figure 2a, and the sample locations are shown in Figure 2b. The arithmetic mean values of 3 × 3 pixels centered at each sample were used in order to reduce the random noise effects of the satellite data.
As seen from Figure 2a, the sampled Rayleigh-corrected reflectance of thick cloud pixels has higher magnitudes and smaller spectral variations. The spectral reflectance of thin clouds and over cloudless turbid water is close, especially at red bands, and the primary difference can be observed in the blue spectral range, such as at 412 nm. We also observed that the ρ rc ( 412   nm ) values of most turbid waters are generally over 0.07. In terms of correctly distinguishing cloudy and non-cloudy pixels with turbid water, we tested whether a threshold of ρ rc ( 412   nm ) > 0.07 in combination with ε max < 2.5 and ρ rc ( 865   nm ) 0.027 can effectively retain water pixels.
It is known that the spectral characteristics of clear water and turbid water are different. Samples in clearer water generally have larger ρ rc ( 412   nm ) and smaller ρ rc ( 660   nm ) , and it is just the reverse in turbid water. The ρ rc ( 412   nm ) values in clear water can be larger than 0.07. This could cause some of the turbid water pixels to be mistaken as clouds. Based on sampled reflectance data over clear and turbid water, we observed that the ratio of ρ rc ( 412   nm ) ρ rc ( 660   nm ) can be used to discriminate clear and turbid water in our cloud masking procedure. Therefore, with the purpose of distinguishing the clear water pixels from cloudy ones correctly, a second threshold of
ρ rc ( 412   nm ) ρ rc ( 660   nm ) > 1
in combination of ε max < 2.5 and ρ rc ( 865   nm ) 0.027 is performed.
In brief, our improved cloud masking procedure is concluded as the following:
Step 1.
calculate the Rayleigh-corrected reflectance at the four bands of 412 nm, 660 nm, 680 nm, and 865 nm;
Step 2.
calculate the ε max according to Equation (1), which was proposed by Nordkvist et al.;
Step 3.
pixels satisfying either of the following two conditions (1 or 2) are masked as clouds:
(1)
ρ rc ( 412   nm ) > 0.07 and ε max < 2.5 and ρ rc ( 865   nm ) 0.027 ;
(2)
ρ rc ( 412   nm ) ρ rc ( 660   nm ) > 1 and ε max < 2.5 and ρ rc ( 865   nm ) 0.027 .
For simplicity, hereinafter, we call this the improved method in this study.

3. Results

3.1. Comparison of Four Cloud Masking Methods Using Selected Samples

The cloud masking effects of the NIR threshold method, Wang and Shi method, Nordkvist et al. method, and the improved method in this study were compared. These four methods were, respectively, applied and tested using visually selected samples in the inland lake water and turbid coastal water off the mouth of Yangtze River, which are typical turbid waters in China.
A total of 136 samples were visually selected from the GOCI data acquired at 02:16 (UTC) on 19 October 2014, 01:16 (UTC) on 19 August 2017, 06:16 (UTC) on 11 May 2018, and 04:16 (UTC) on 19 November 2019 around Lake Tai, Hangzhou Bay, and the coastal area of Jiangsu Province of China. The sample locations are indicated in Figure 3. These samples include cloudy ones covered by thick clouds and cloud-free ones over turbid water, as well as lakes in different weather conditions and near narrow straits. The circles represent visually selected cloudless samples, and the crosses represent cloudy ones. As a performance comparison demonstration, we applied four cloud masking methods to these visually selected 136 samples.
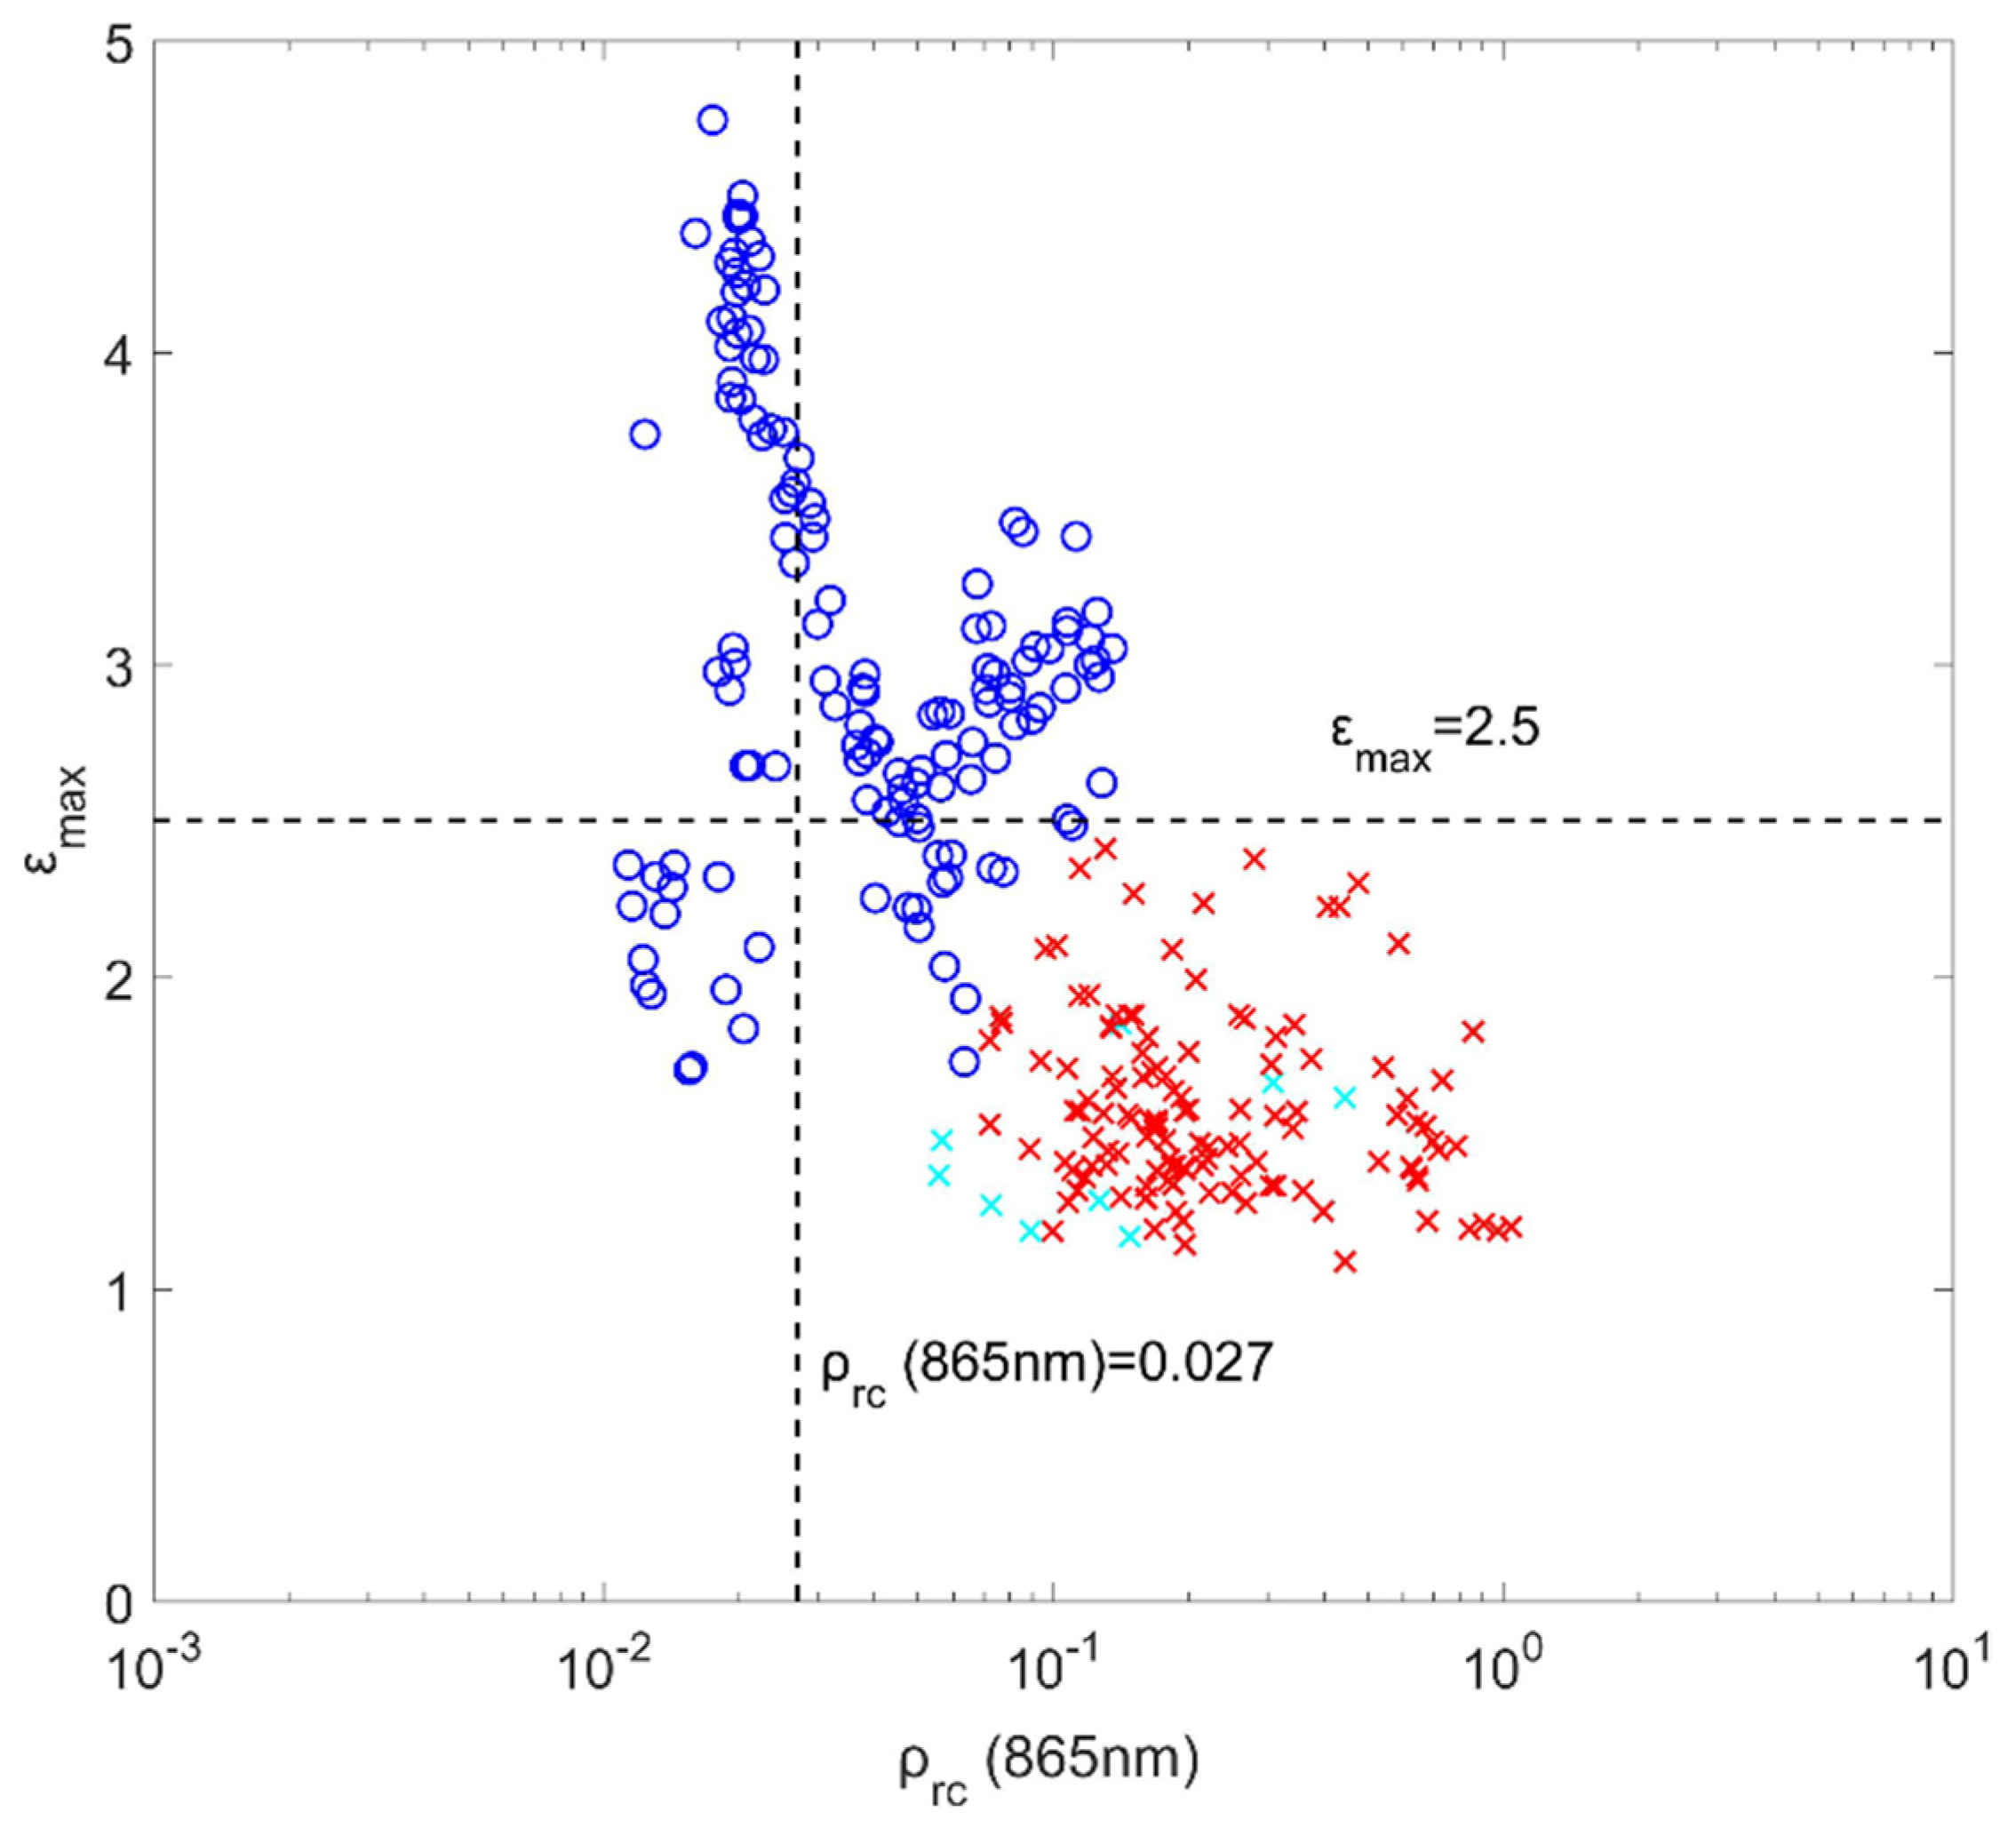
The scatter plot of ρ rc ( 865   nm ) versus ε max for these 136 samples is shown in Figure 4. The vertical dashed line is ρ rc ( 865   nm ) = 0.027 , which represents the standard cloud masking threshold method instandard atmospheric correction procedure. The horizontal dashed line represents a threshold of 2.5 for ε max used in the Nordkvist et al. method. It is clear that the standard NIR method using ρ rc ( 865   nm ) 0.027 is not enough in coastal waters, as many cloudless samples (circles) are with ρ rc ( 865   nm ) 0.027 . The Nordkvist et al. method using ε max < 2.5 and ρ rc ( 865   nm ) 0.027 can mask all the cloudy samples, while some cloudless samples indicated by blue circles in the fourth quadrant of Figure 4 will be incorrectly masked. These usually correspond to samples in lake water, near narrow straits, and near land.
In Figure 4, by applying the improved cloud masking method in this study, samples with ρ rc ( 412   nm ) > 0.07 are indicated in red, and those with ρ rc ( 412   nm ) ρ rc ( 660   nm ) > 1 are marked in bright cyan. If the visually selected cloud pixels do not pass these two threshold tests, they are masked in black, and the visually selected water pixels are in blue. It can be seen that all crosses visually selected as clouds are correctly masked by the improved method in this study. Combining with the sample positions in Figure 3, we can see that ρ rc ( 412   nm ) > 0.07 works primarily in very turbid yellow colored water, and the ρ rc ( 412   nm ) ρ rc ( 660   nm ) > 1 takes effect primarily in clearer green colored water.
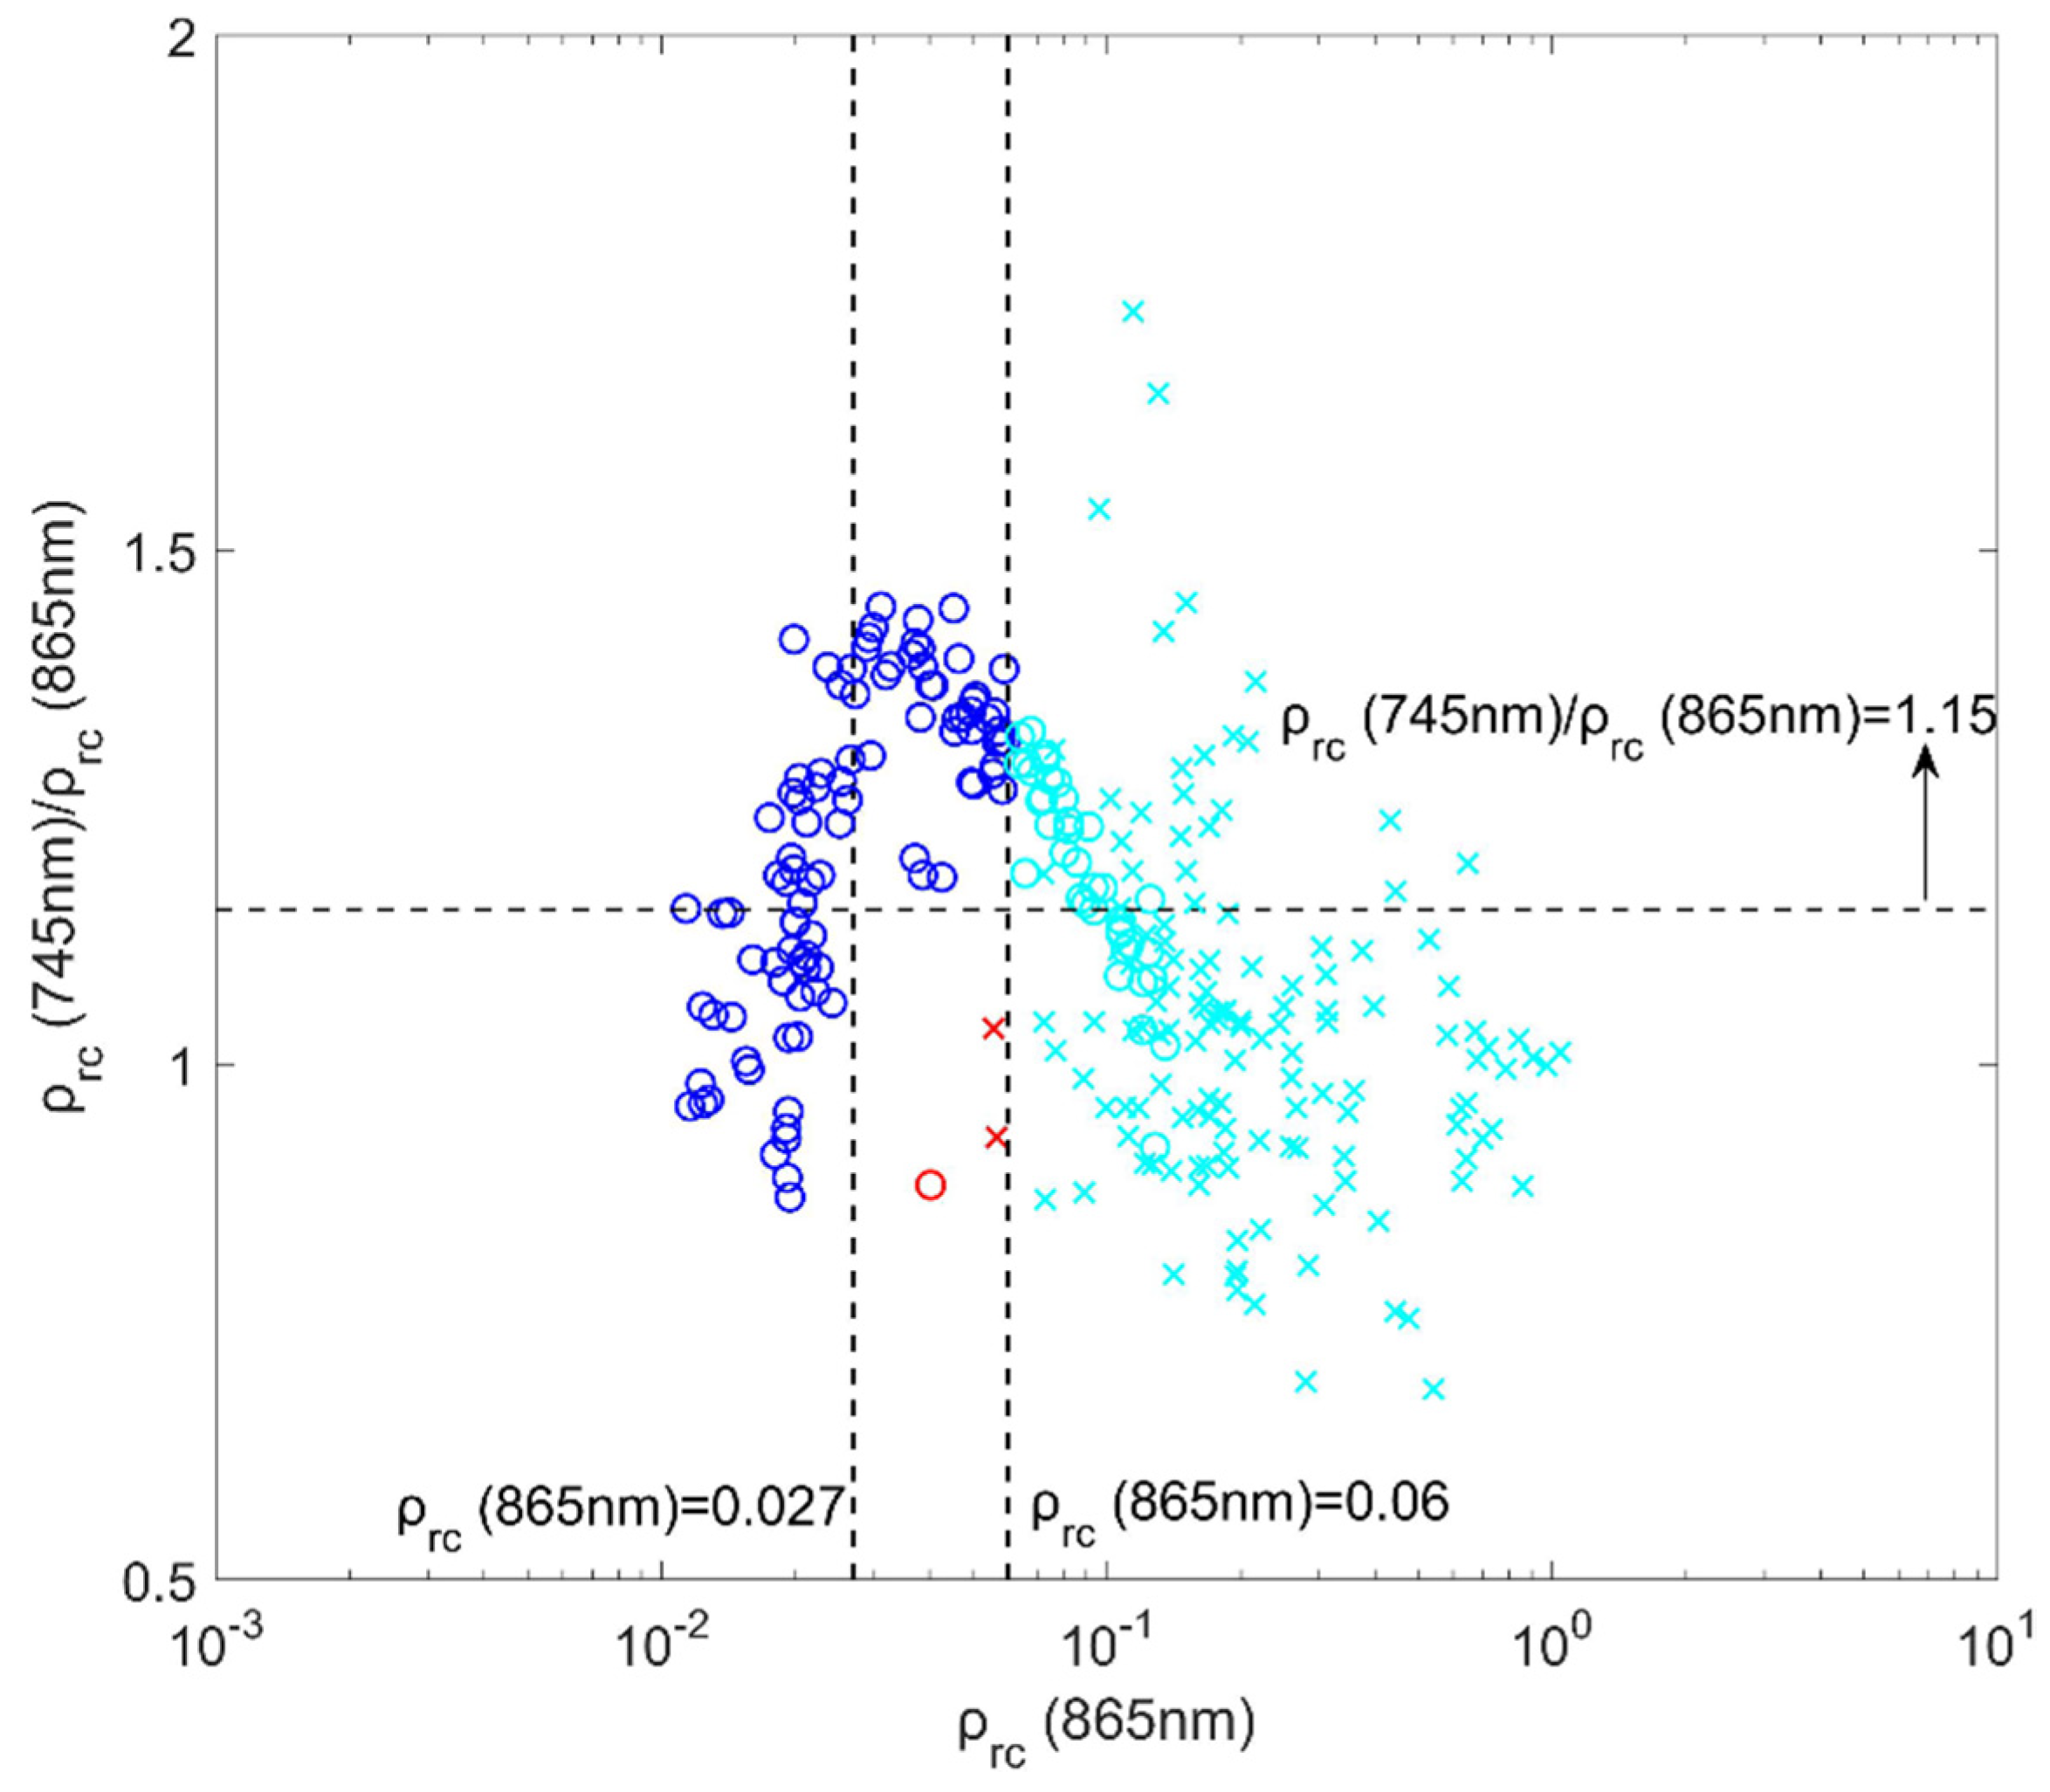
In Figure 5, by applying the Wang and Shi method, samples with ρ rc ( 865   nm ) > 0.06 are indicated in bright cyan, and those with ρ rc ( 412   nm ) ρ rc ( 660   nm ) < 1.15 in combination with ρ rc ( 865   nm ) 0.06 and ρ rc ( 865   nm ) 0.027 are marked in red. We can see that all crosses visually selected as clouds are correctly masked; however, one red circle and many bright cyan circles, which are supposed to be water pixels, are mistaken as clouds.
Therefore, based on our 136 visually selected samples, it is clear that the improved method in this study performs better than the other three methods. To further check the general application of the four cloud masking methods, we then applied them in different GOCI scenes.

3.2. Performance Comparison Over Typical Turbid Waters

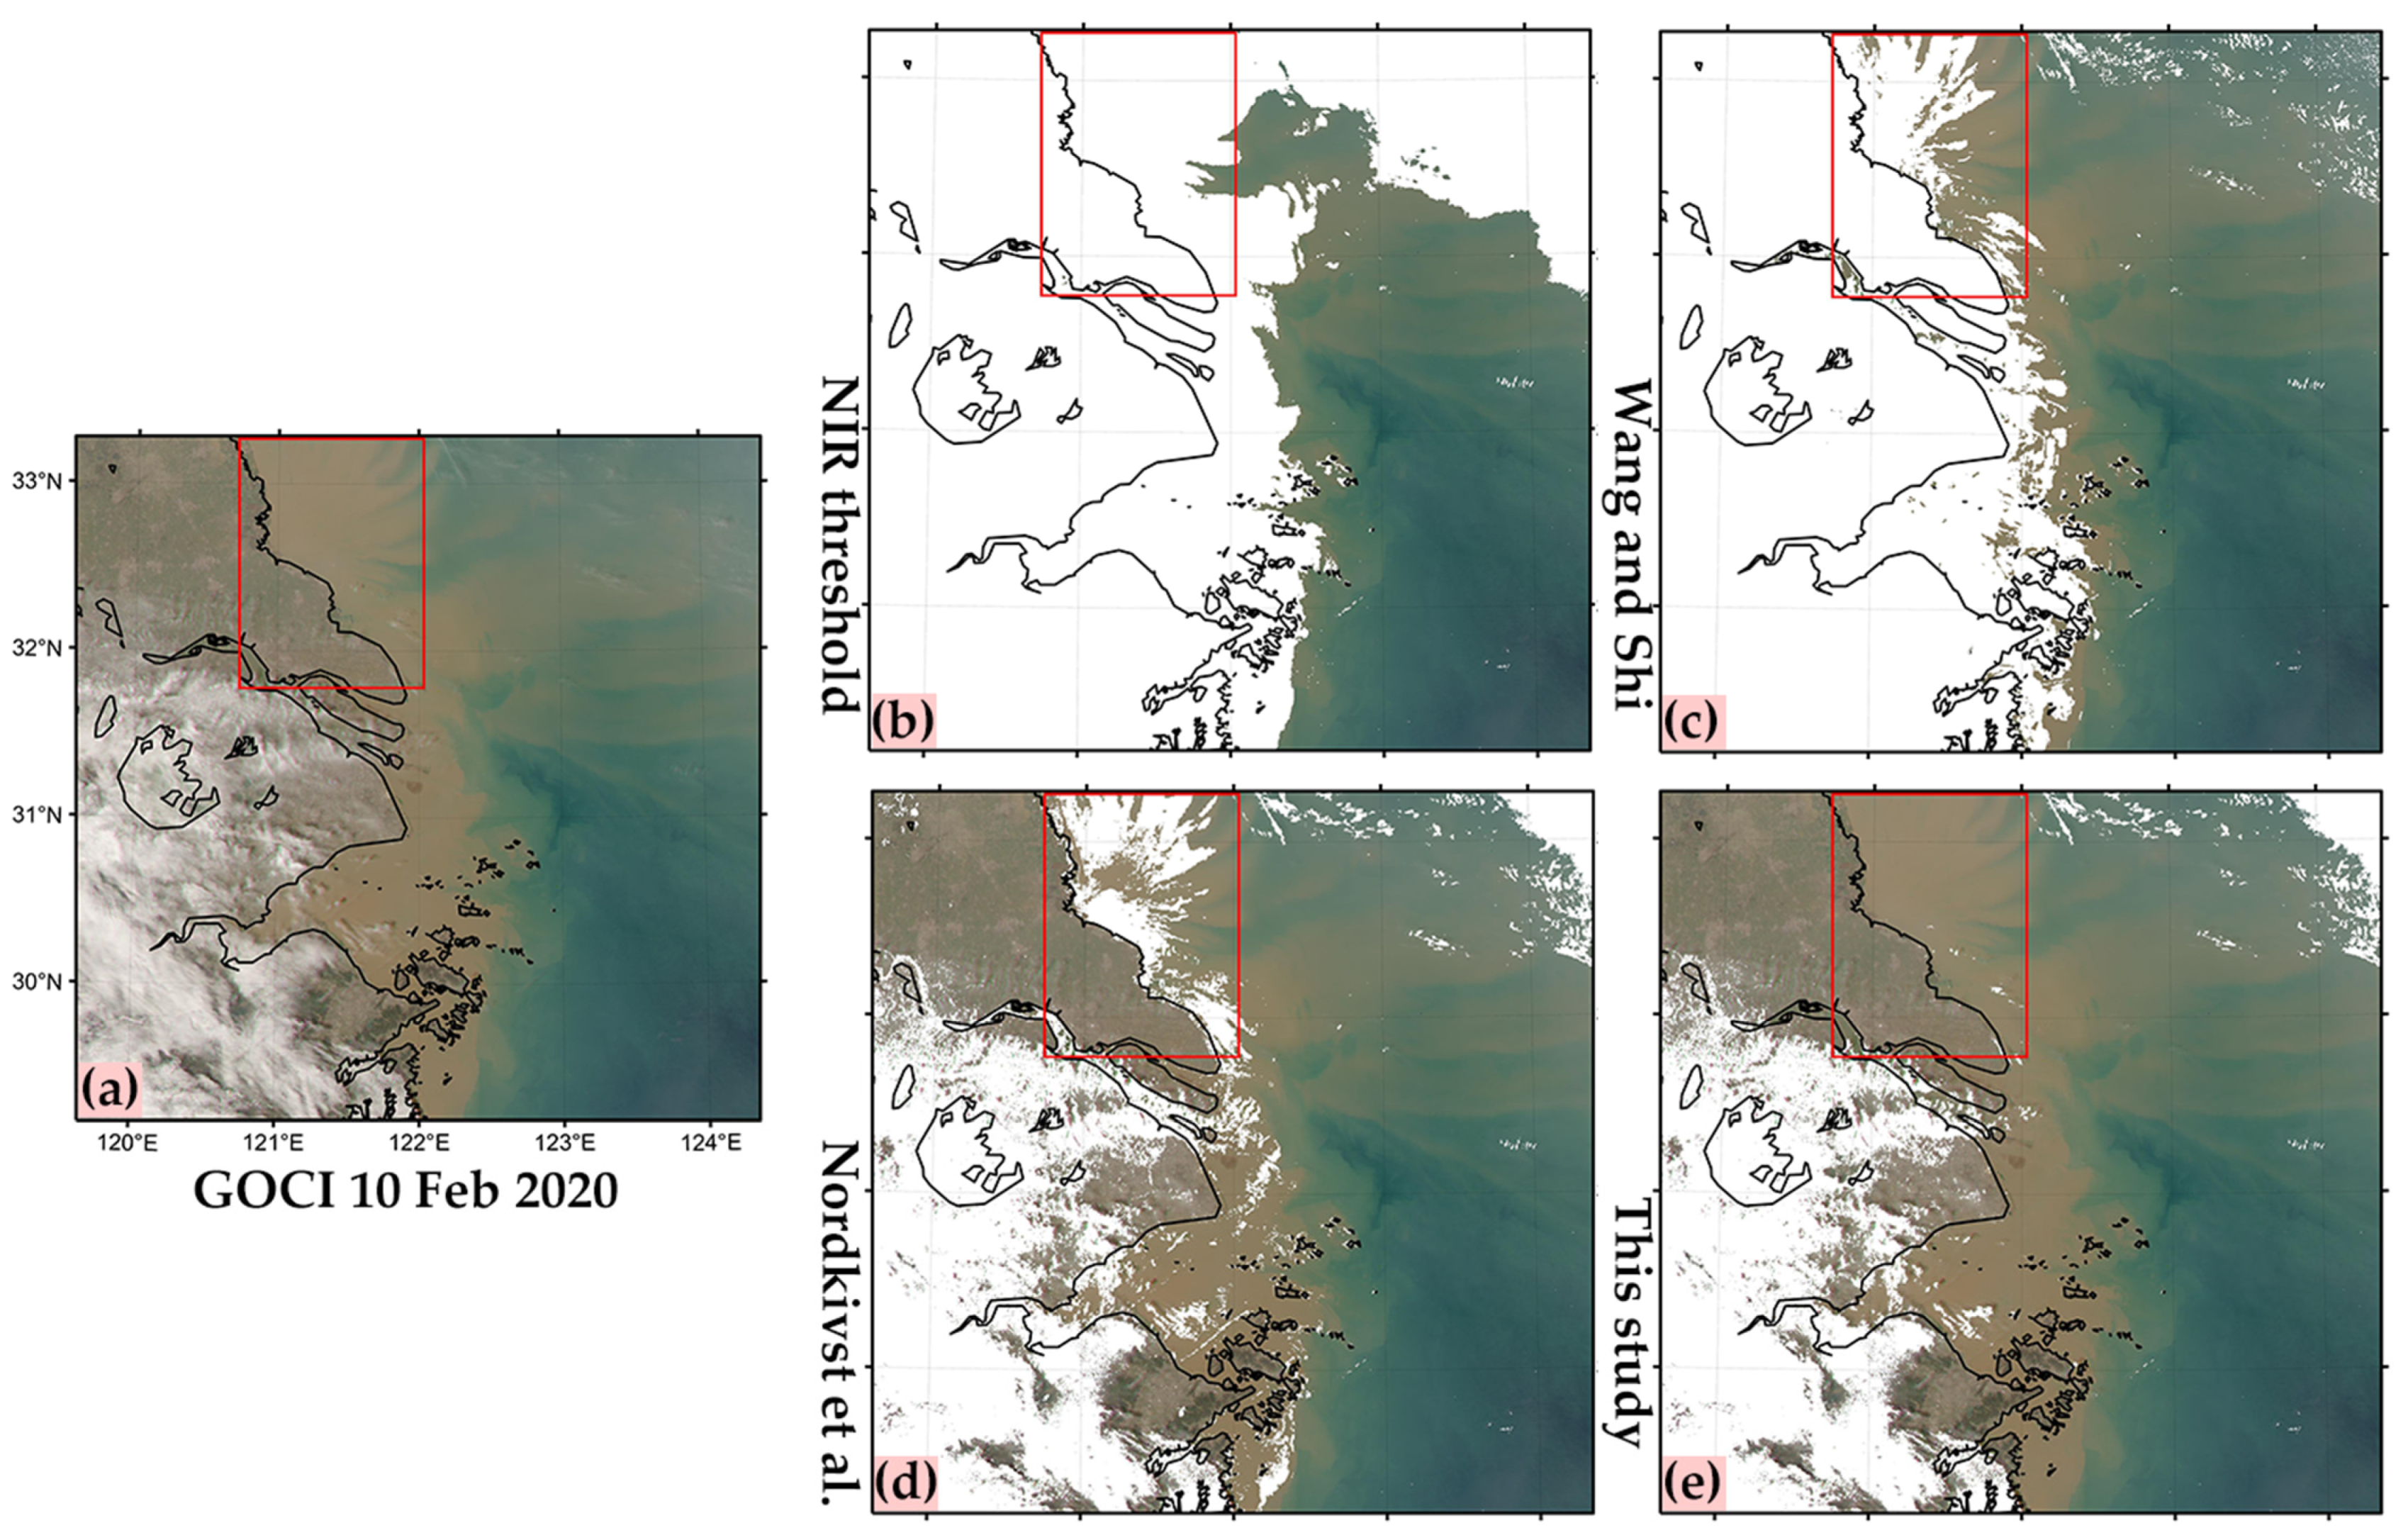
Figure 6a shows the RGB image composited by Rayleigh-corrected reflectance at the three bands of 443 nm, 555 nm, and 680 nm at 05:16 (UTC) on 10 February 2020. White pixels in the RGB image are clouds. Figure 6b–e shows the results of the four cloud masking methods. Pixels identified by cloud masking methods are also indicated as white. Compared with the RGB image in Figure 6a, we can see that the NIR threshold method as well as the Wang and Shi method masked both clouds and land as clouds. The NIR threshold method masked almost all turbid coastal water (yellow colored water) as clouds in Figure 6b. The Wang and Shi method masked most of the turbid coastal water as clouds in Figure 6c. The Nordkvist et al. method is better in retaining turbid coastal water pixels, but it still misjudged some very turbid water pixels as clouds in the coastal water of Jiangsu Province of China as indicated by the red rectangle in Figure 6d. The improved method in this study performed better than the other three methods. It can mask almost all cloud pixels with fewer misjudgments over almost all turbid water pixels. It is worthy to note that there is thin fog in the upper right corner of the image in Figure 6a. The water here is clearer, which is indicated by the RGB color in Figure 6a. The Wang and Shi method can retain more pixels over this foggy clear water area. The NIR threshold method masked more pixels. The Nordkvist et al. method and the improved one in this study masked less than the NIR threshold method and more than the Wang and Shi method.
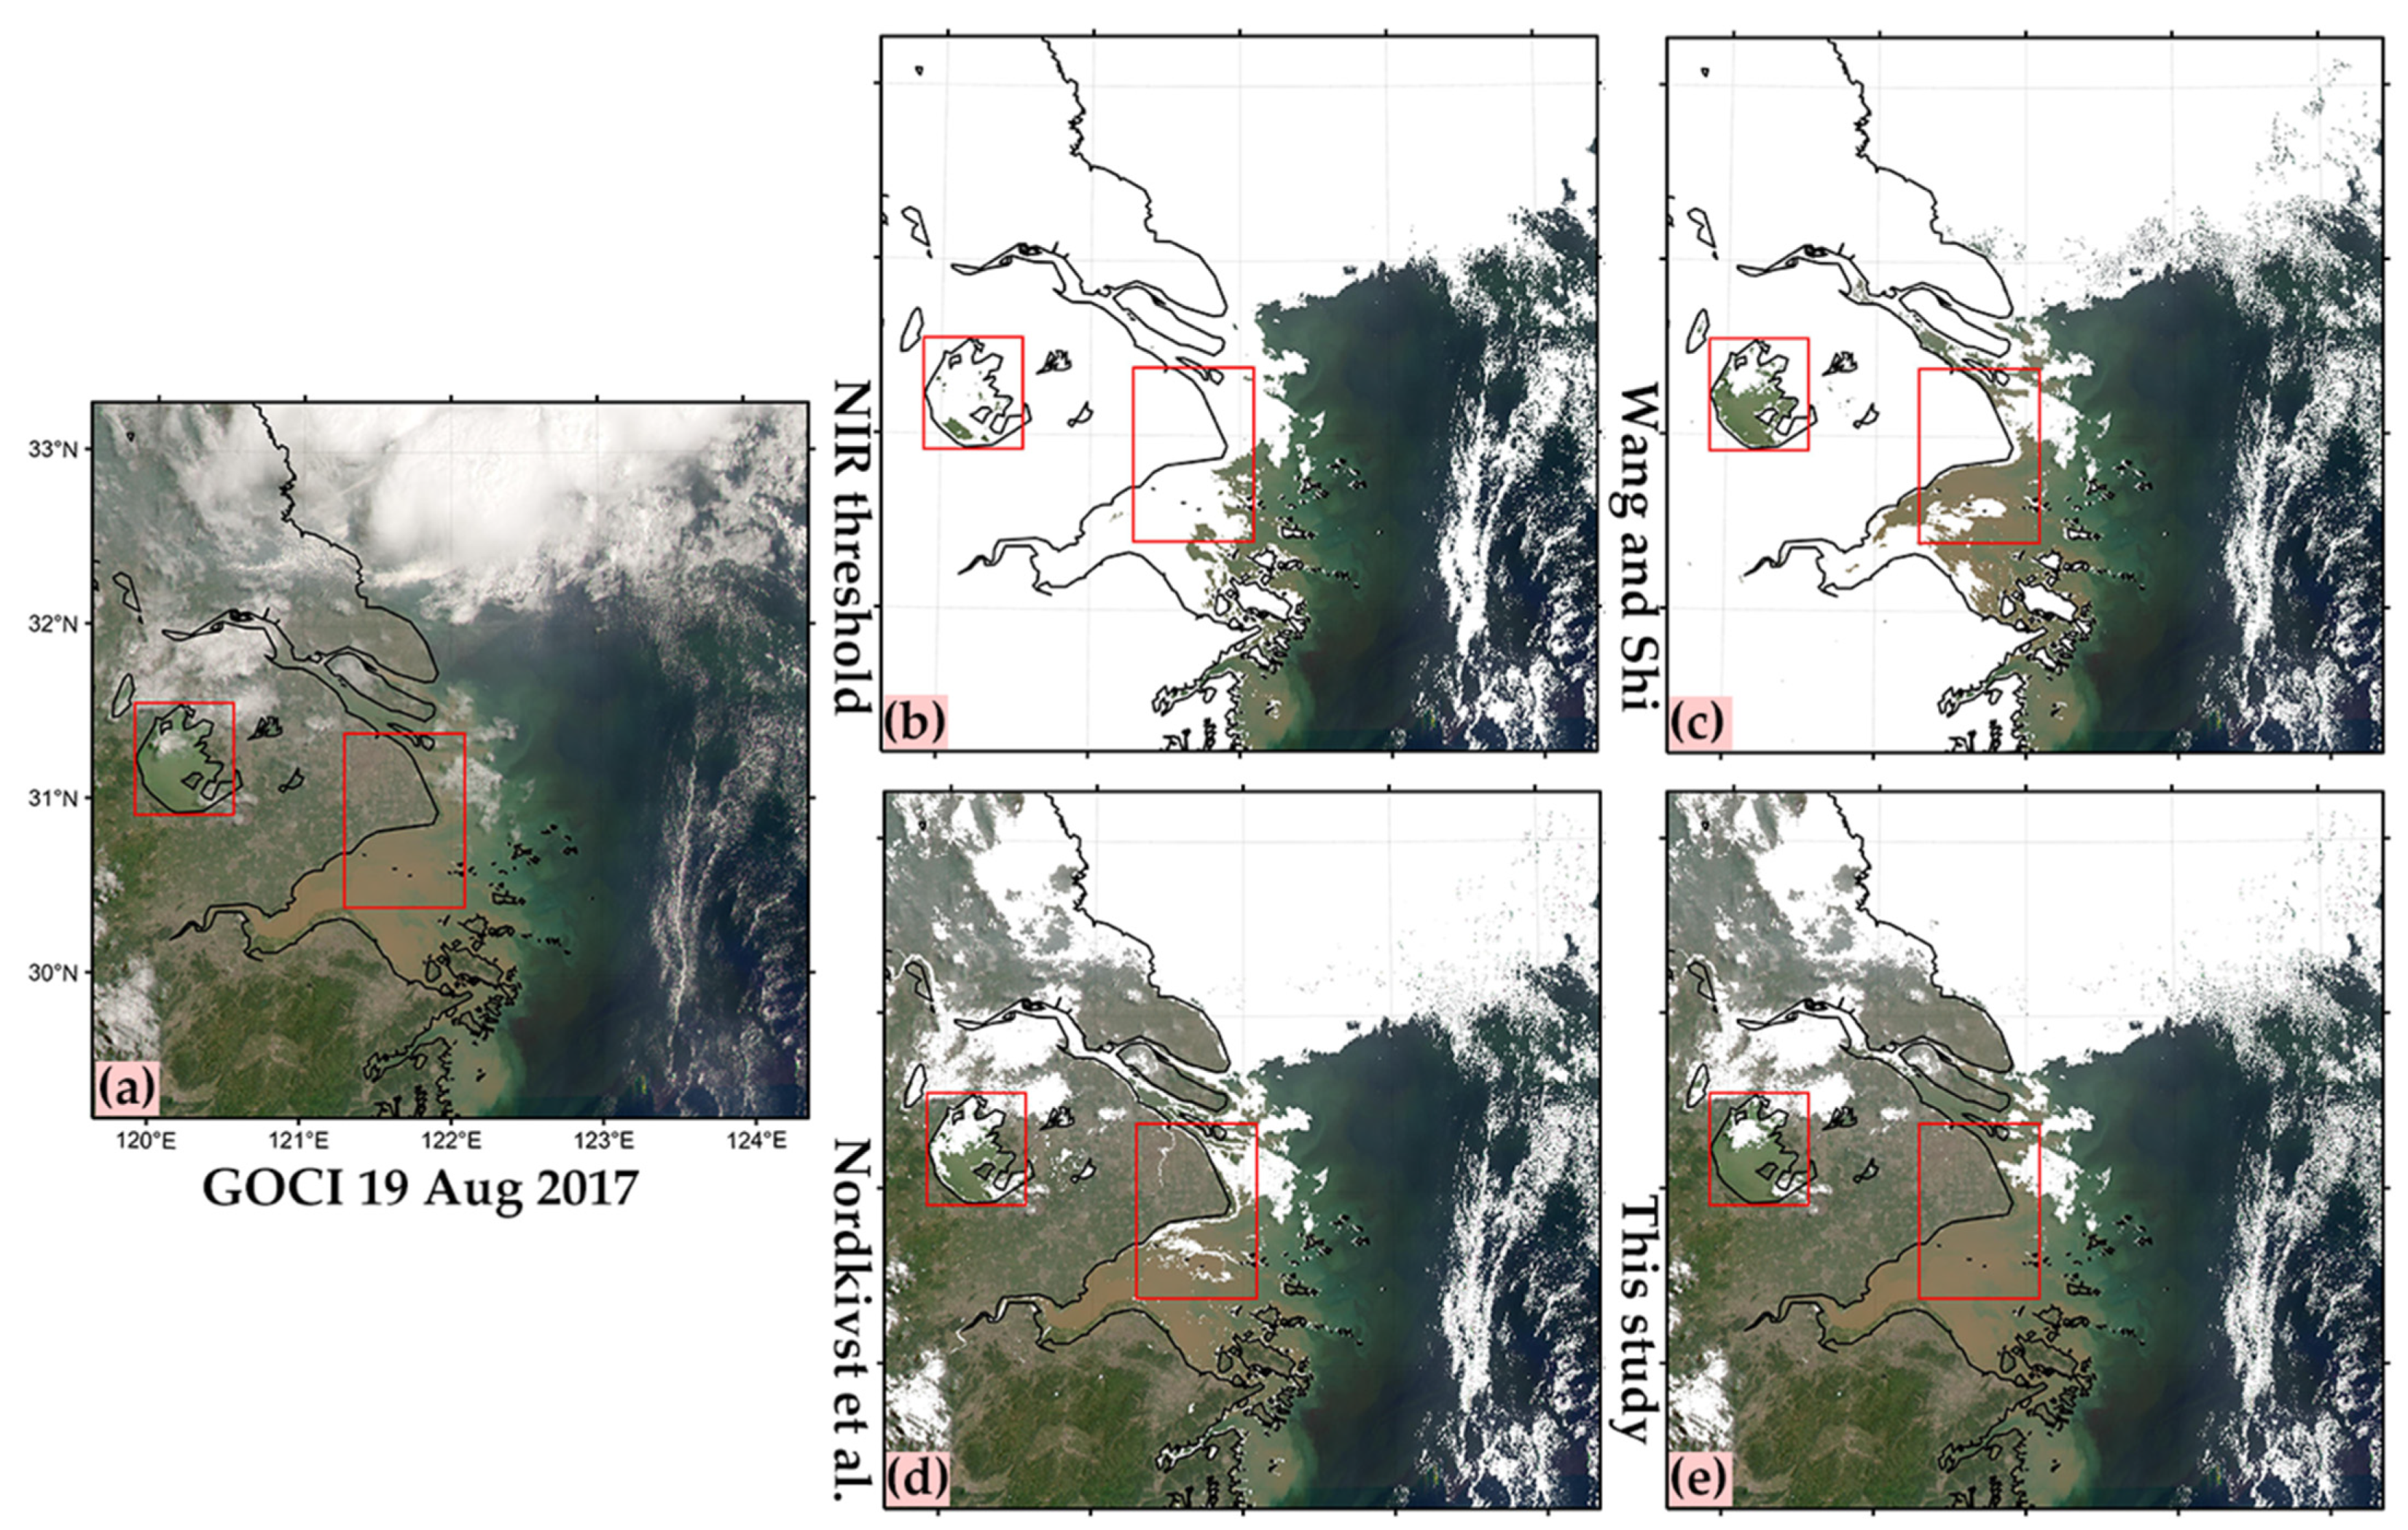
Figure 7 shows cloud recognition results of the four different cloud masking methods applied to the GOCI data at 01:16 (UTC) on 19 August 2017. All four methods performed well in clear water off the coast. For the inland lake water indicated by the left red rectangle, by comparing it with the RGB image in Figure 7a, it can be observed that the NIR method retained the fewest water pixels and misjudged most water pixels as clouds, followed by the Wang and Shi method and then by the Nordkvist et al. method; the best was the improved method in this study. In addition, it is not difficult to see that the Nordkvist et al. method is prone to misjudge water near the land edge and in narrow water channels as clouds. This can also be seen in the mouth of the Yangtze River and the Hangzhou Bay of China indicated by the right red rectangle in Figure 7d.
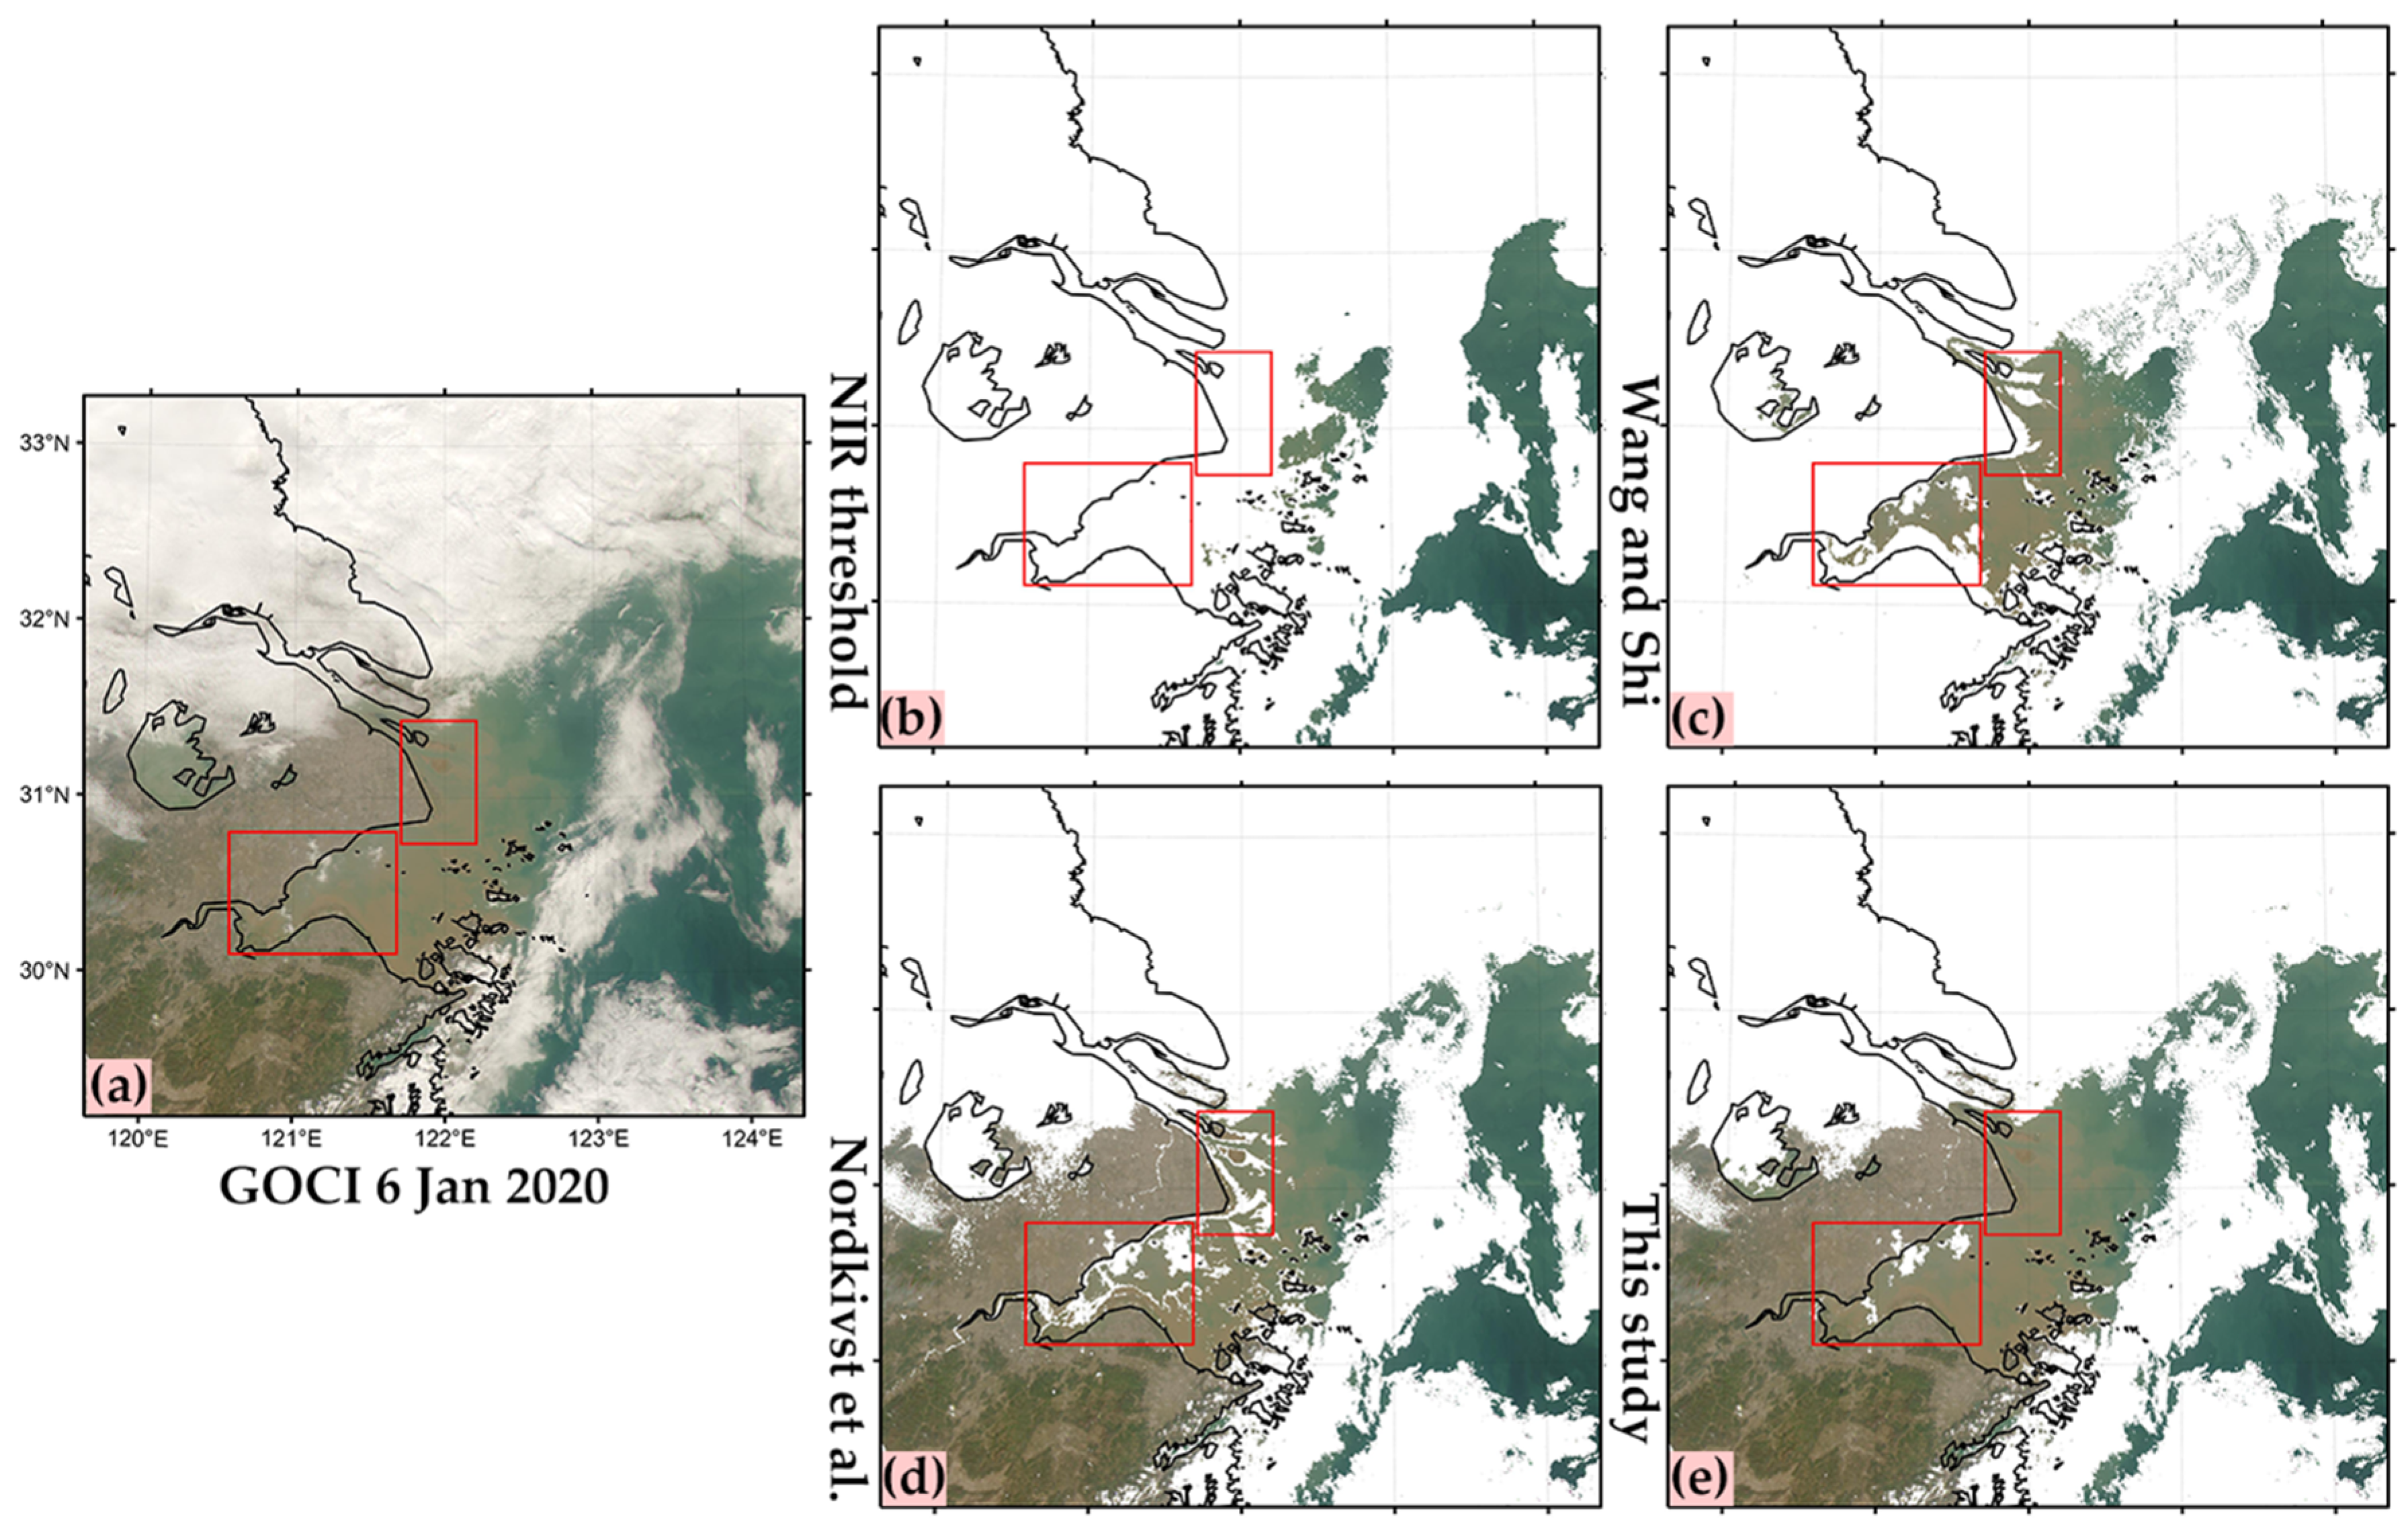
To further verify the adaptability of the improved cloud masking method in hazy weather conditions, Figure 8 compares the results of the four cloud masking methods on 6 January 2020. Comparing the RGB image in Figure 8a with the water area around the mouth of Yangtze River, indicated by the right smaller red rectangle, and the west part of Hangzhou Bay, indicated by the left bigger red rectangle in Figure 8b–e, the results of the Nordkvist et al. method show serious misjudgments in water near land edges and in narrow water channels. The improved method in this study performed better than the others.
To quantitatively evaluate the performance of the four cloud masking methods, the clear pixel numbers recognized by the different methods over the selected turbid water regions as indicated in Figure 6, Figure 7 and Figure 8 are listed in Table 1. The clear pixel percentage is the ratio of the non-cloudy pixels to the total pixels in the selected region. Based on these five selected regions, the improved method in this study can retain a higher number of clear pixels with an average clear pixel percentage of 92.77%, which is 19%, 55%, and 89% higher than that of the Nordkvist et al., the Wang and Shi, and the NIR threshold methods, respectively.

3.3. Performance Comparison Over Other Areas

As the improved cloud masking method in this study is designed for turbid waters, in this section, illustrations are given to demonstrate whether it performs as well as other methods in water areas other than the coastal waters off the mouth of Yangtze River, such as waters with high chlorophyll concentrations or clear water. For the above purpose, we selected GOCI scenarios acquired in Bohai of China and the water area off the south of the Korean Peninsula.
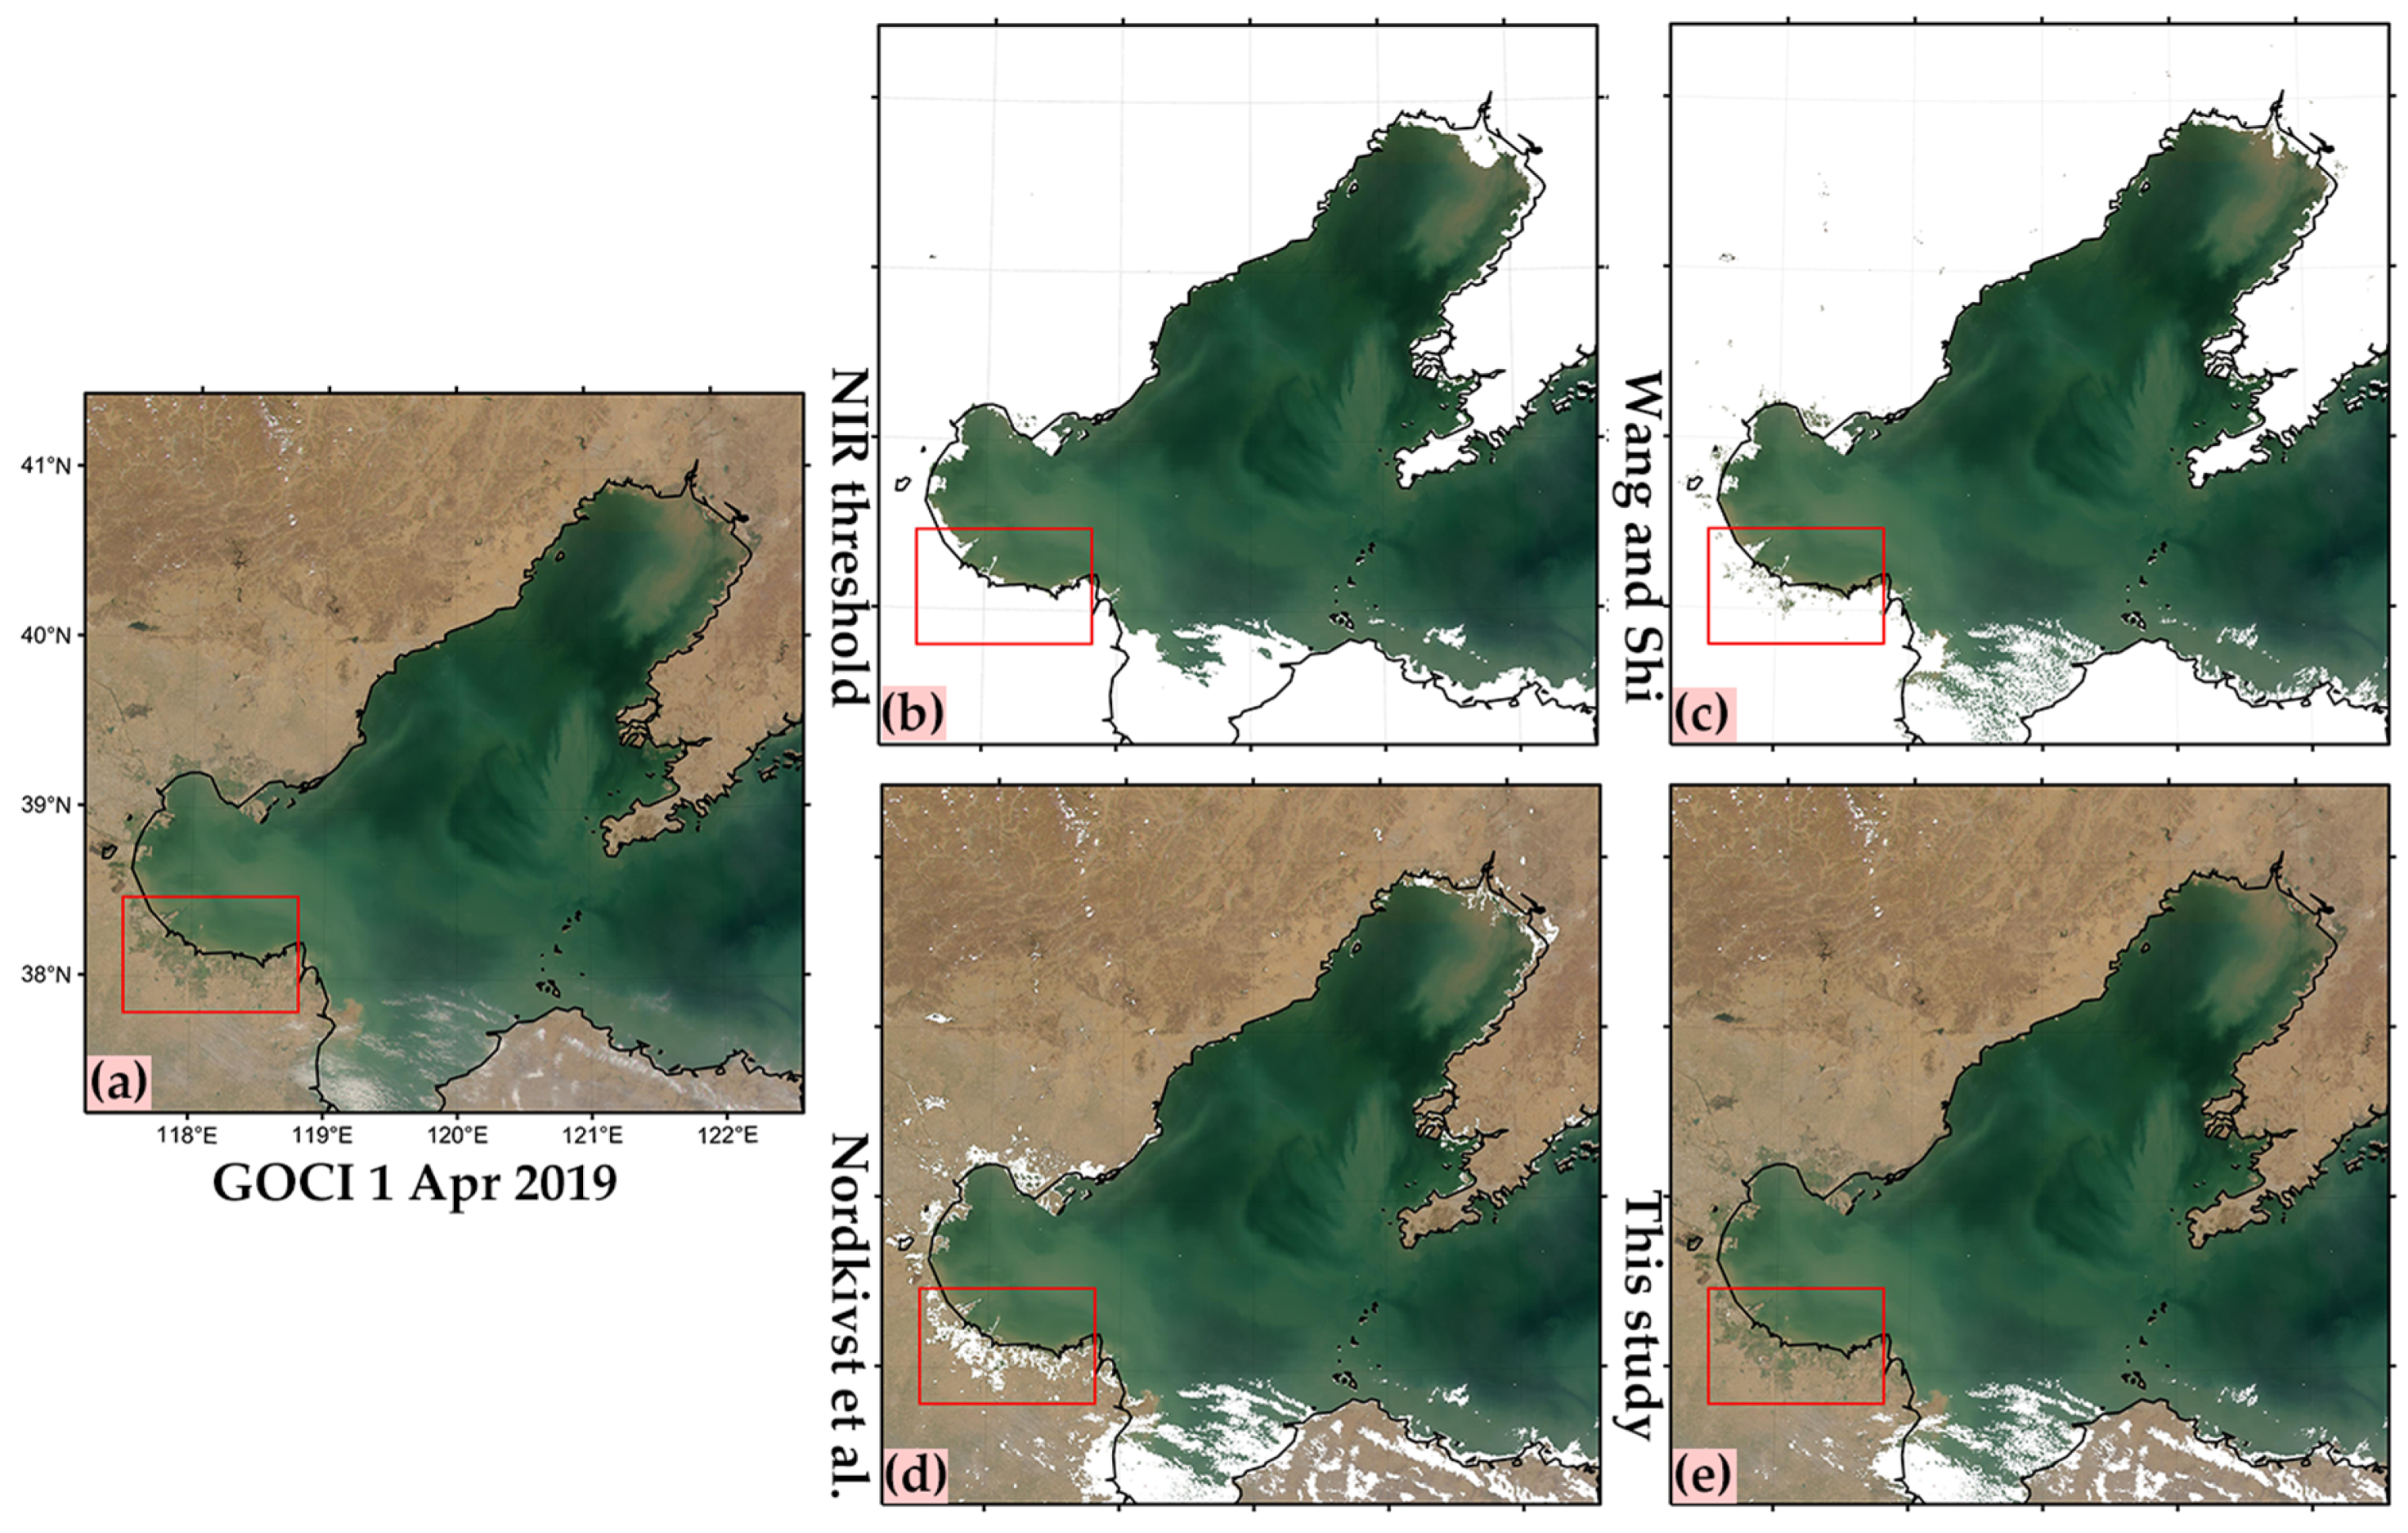
Figure 9a shows the RGB image composited by GOCI Rayleigh-corrected reflectance in Bohai at 03:16 (UTC) on 1 April 2019. As seen from the RGB color, the water in Bohai is dominated by high chlorophyll concentrations. It is surrounded by silt and tidal flats along the coast of Bohai, as shown in the red rectangle.
Comparing the cloud recognition results of four cloud masking methods in Figure 9b–e, it can be seen that all the four cloud masking methods perform well in waters with high chlorophyll concentrations in Bohai. The NIR threshold method as shown in Figure 9b misidentified the sediment-dominated turbid water and shallow water over the tidal flats along the shorelines as clouds. The Wang and Shi method (Figure 9c) and Nordkvist et al. method (Figure 9d) can correctly recognize most of the turbid water pixels, while the cloudless shallow water pixels over the tidal flats along the shorelines were still misidentified as clouds. By comparison, the improved cloud masking method in this study can delineate the spatial location and morphology of clouds more accurately and retain more turbid water pixels (Figure 9e).
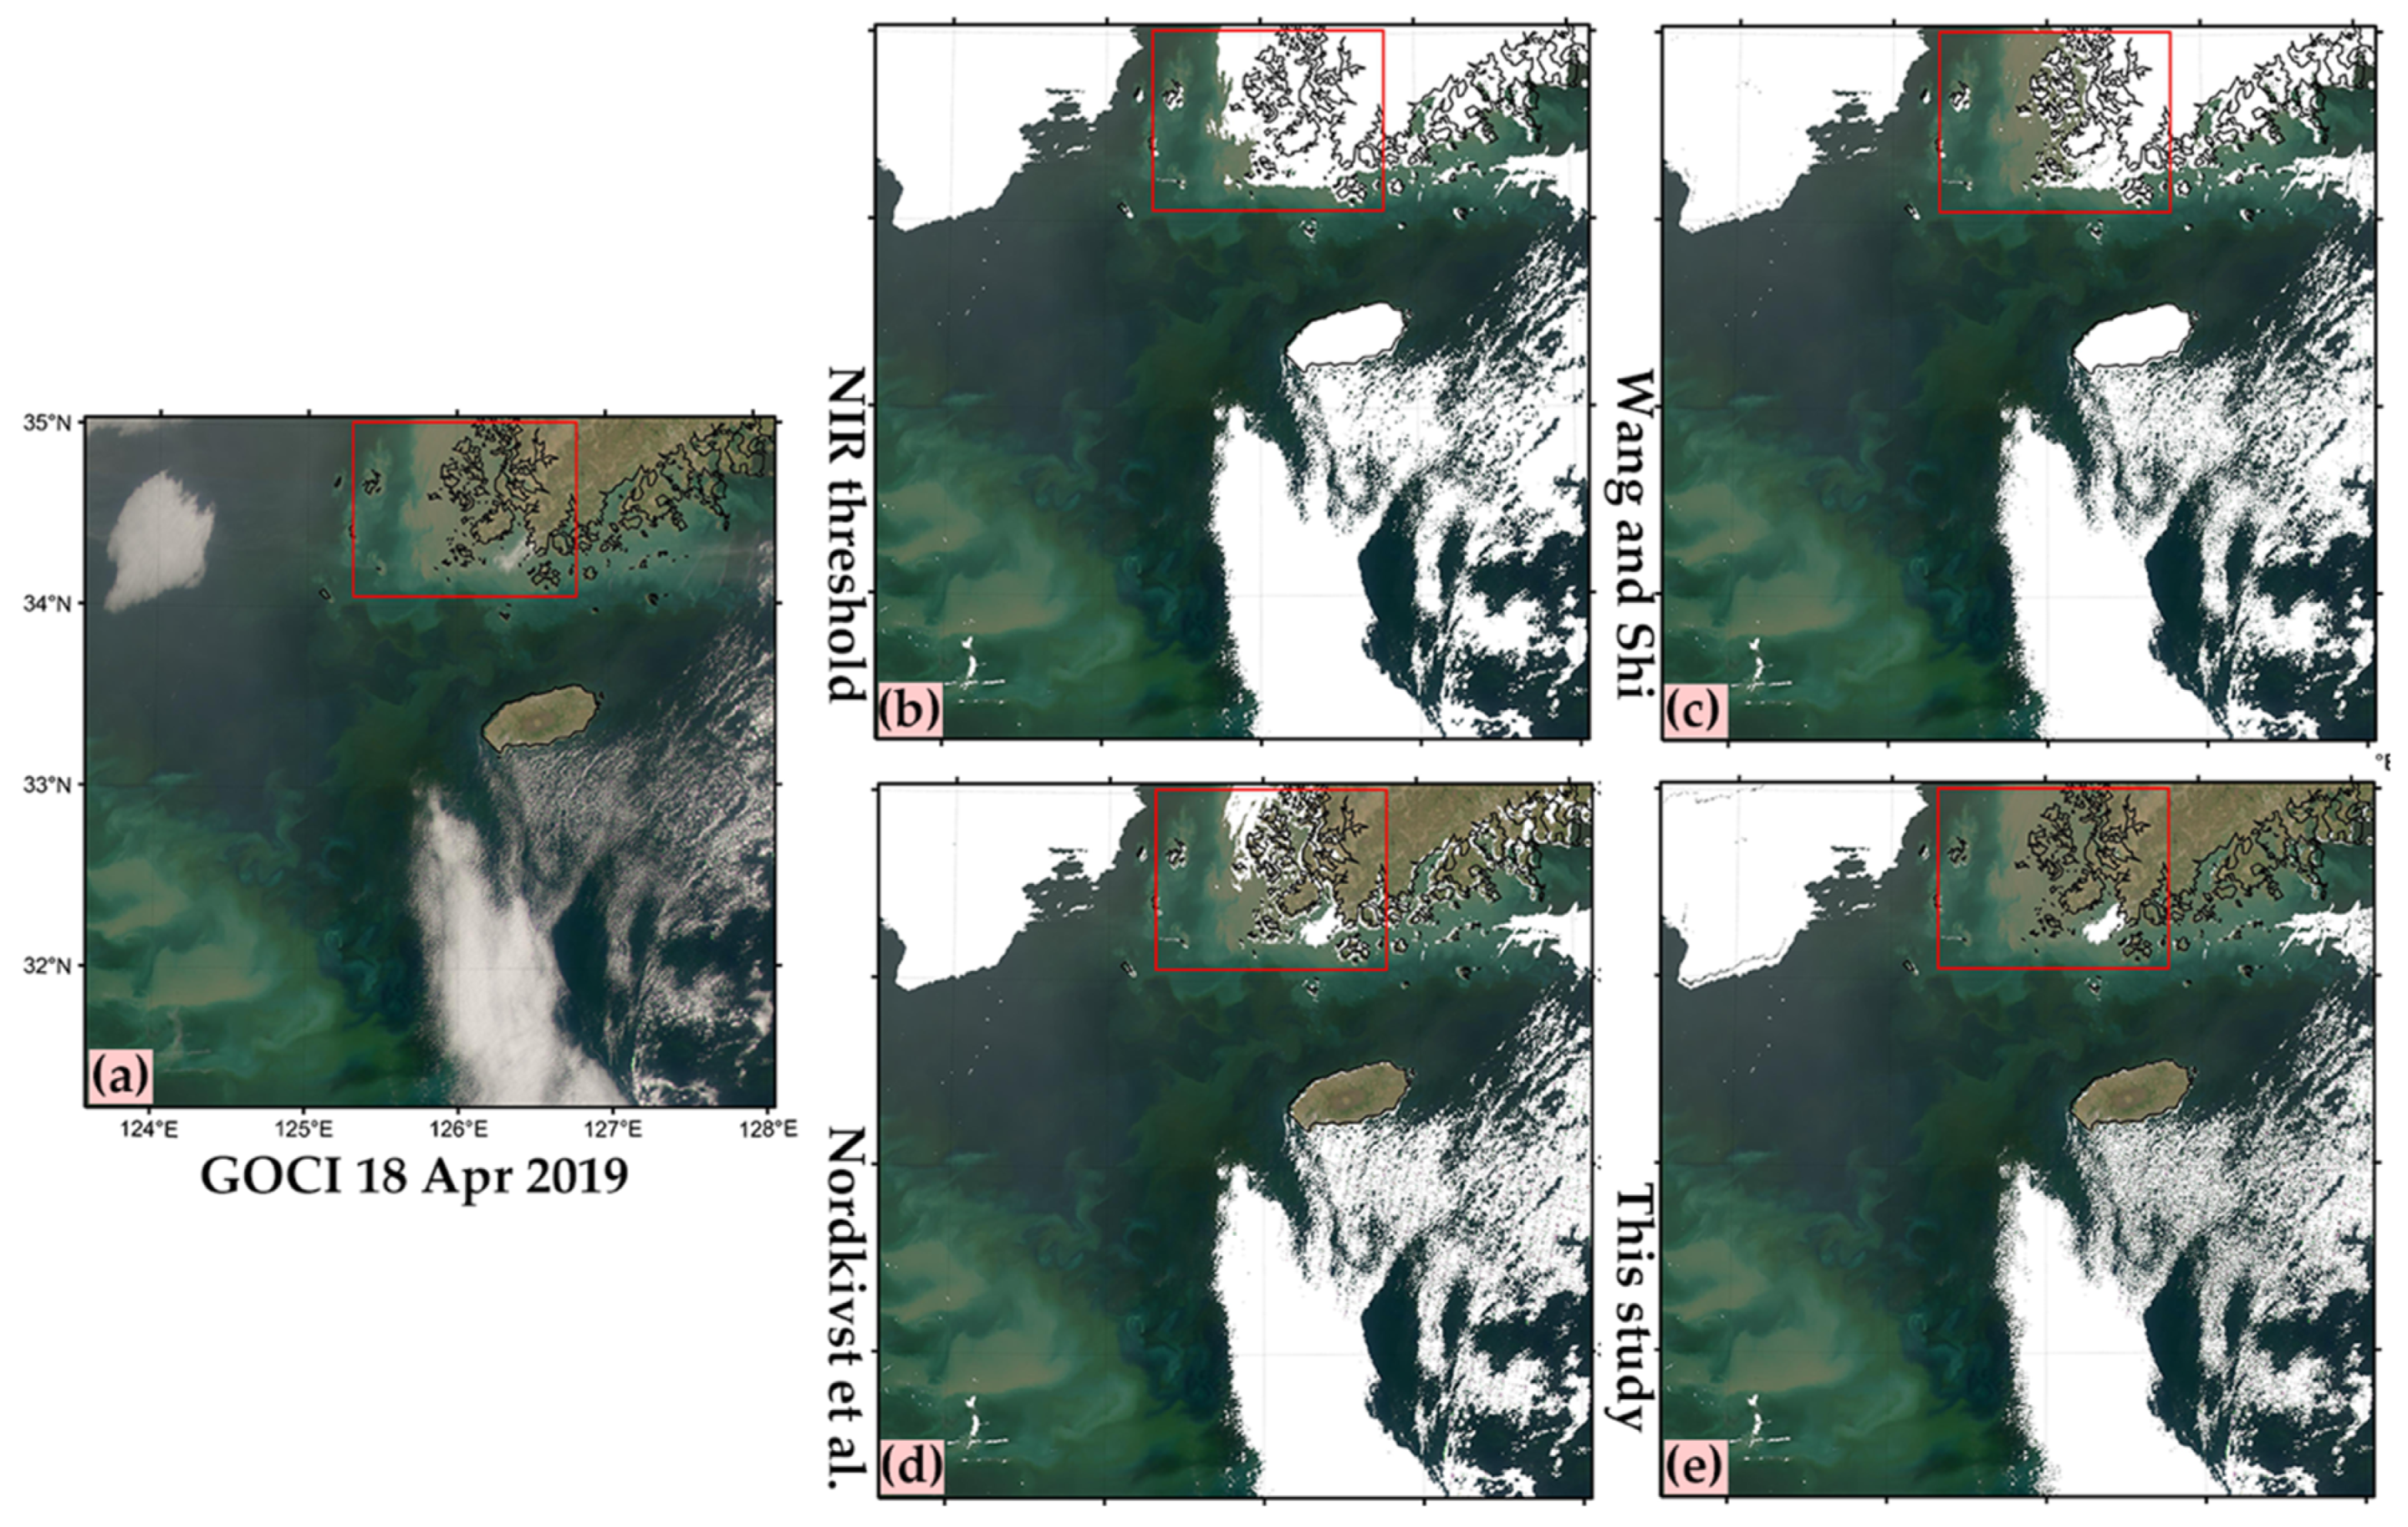
Figure 10a shows the RGB image composited by GOCI Rayleigh-corrected reflectance off and around the south of the Korean Peninsula at 03:16 (UTC) on 18 April 2019. The water along the southern coast of the Korean peninsula as indicated by a red rectangle in Figure 10 is turbid with sediments composed of fine sand and silt [44]. The water over the southeast of the Korean Peninsula is clear open water, and the southwest water is affected by turbid water from Yangtze River.
In comparison to the RGB image in Figure 10a, the four cloud masking methods in Figure 10b–e all perform well over clear water toward the southeast of the Korean Peninsula, and this is also the same case in medium turbid water toward the southwest of the Korean Peninsula. As for the water with high sediment concentrations in the red box, the NIR threshold, Wang and Shi method, and Nordkvist et al. method all have misjudgment at different levels. The results of the improved method in this study (Figure 10e) agree well with the cloud distribution shown in the RGB composite image (Figure 10a). Therefore, our improved cloud masking method can be successfully applied over not only turbid waters but also clear waters.
It is worthy to note that there is thick cloud and thin fog in the upper left corner of the image in Figure 10a. Over this area, the four cloud masking methods show similar results in Figure 10b–e, while they show little difference along the edge between thick cloud and thin fog. It is difficult to judge visually whether it is cloudy or not along the edge. To reduce the misjudgment error, it is recommended to discard these edge pixels by masking out the pixels neighboring the cloud pixels (up, down, left, and right) according to the GOCI algorithm theoretical basis document [18].
The clear pixel numbers recognized by the different methods over the selected water regions as indicated in Figure 9 and Figure 10 are listed in Table 2. Based on these two selected regions, the improved method in this study can retain a higher number of clear pixels with an average clear pixel percentage of 98.66%, which is 14%, 51%, and 61% higher than that of the Nordkvist et al., the Wang and Shi, and the NIR threshold methods, respectively.

4. Discussion

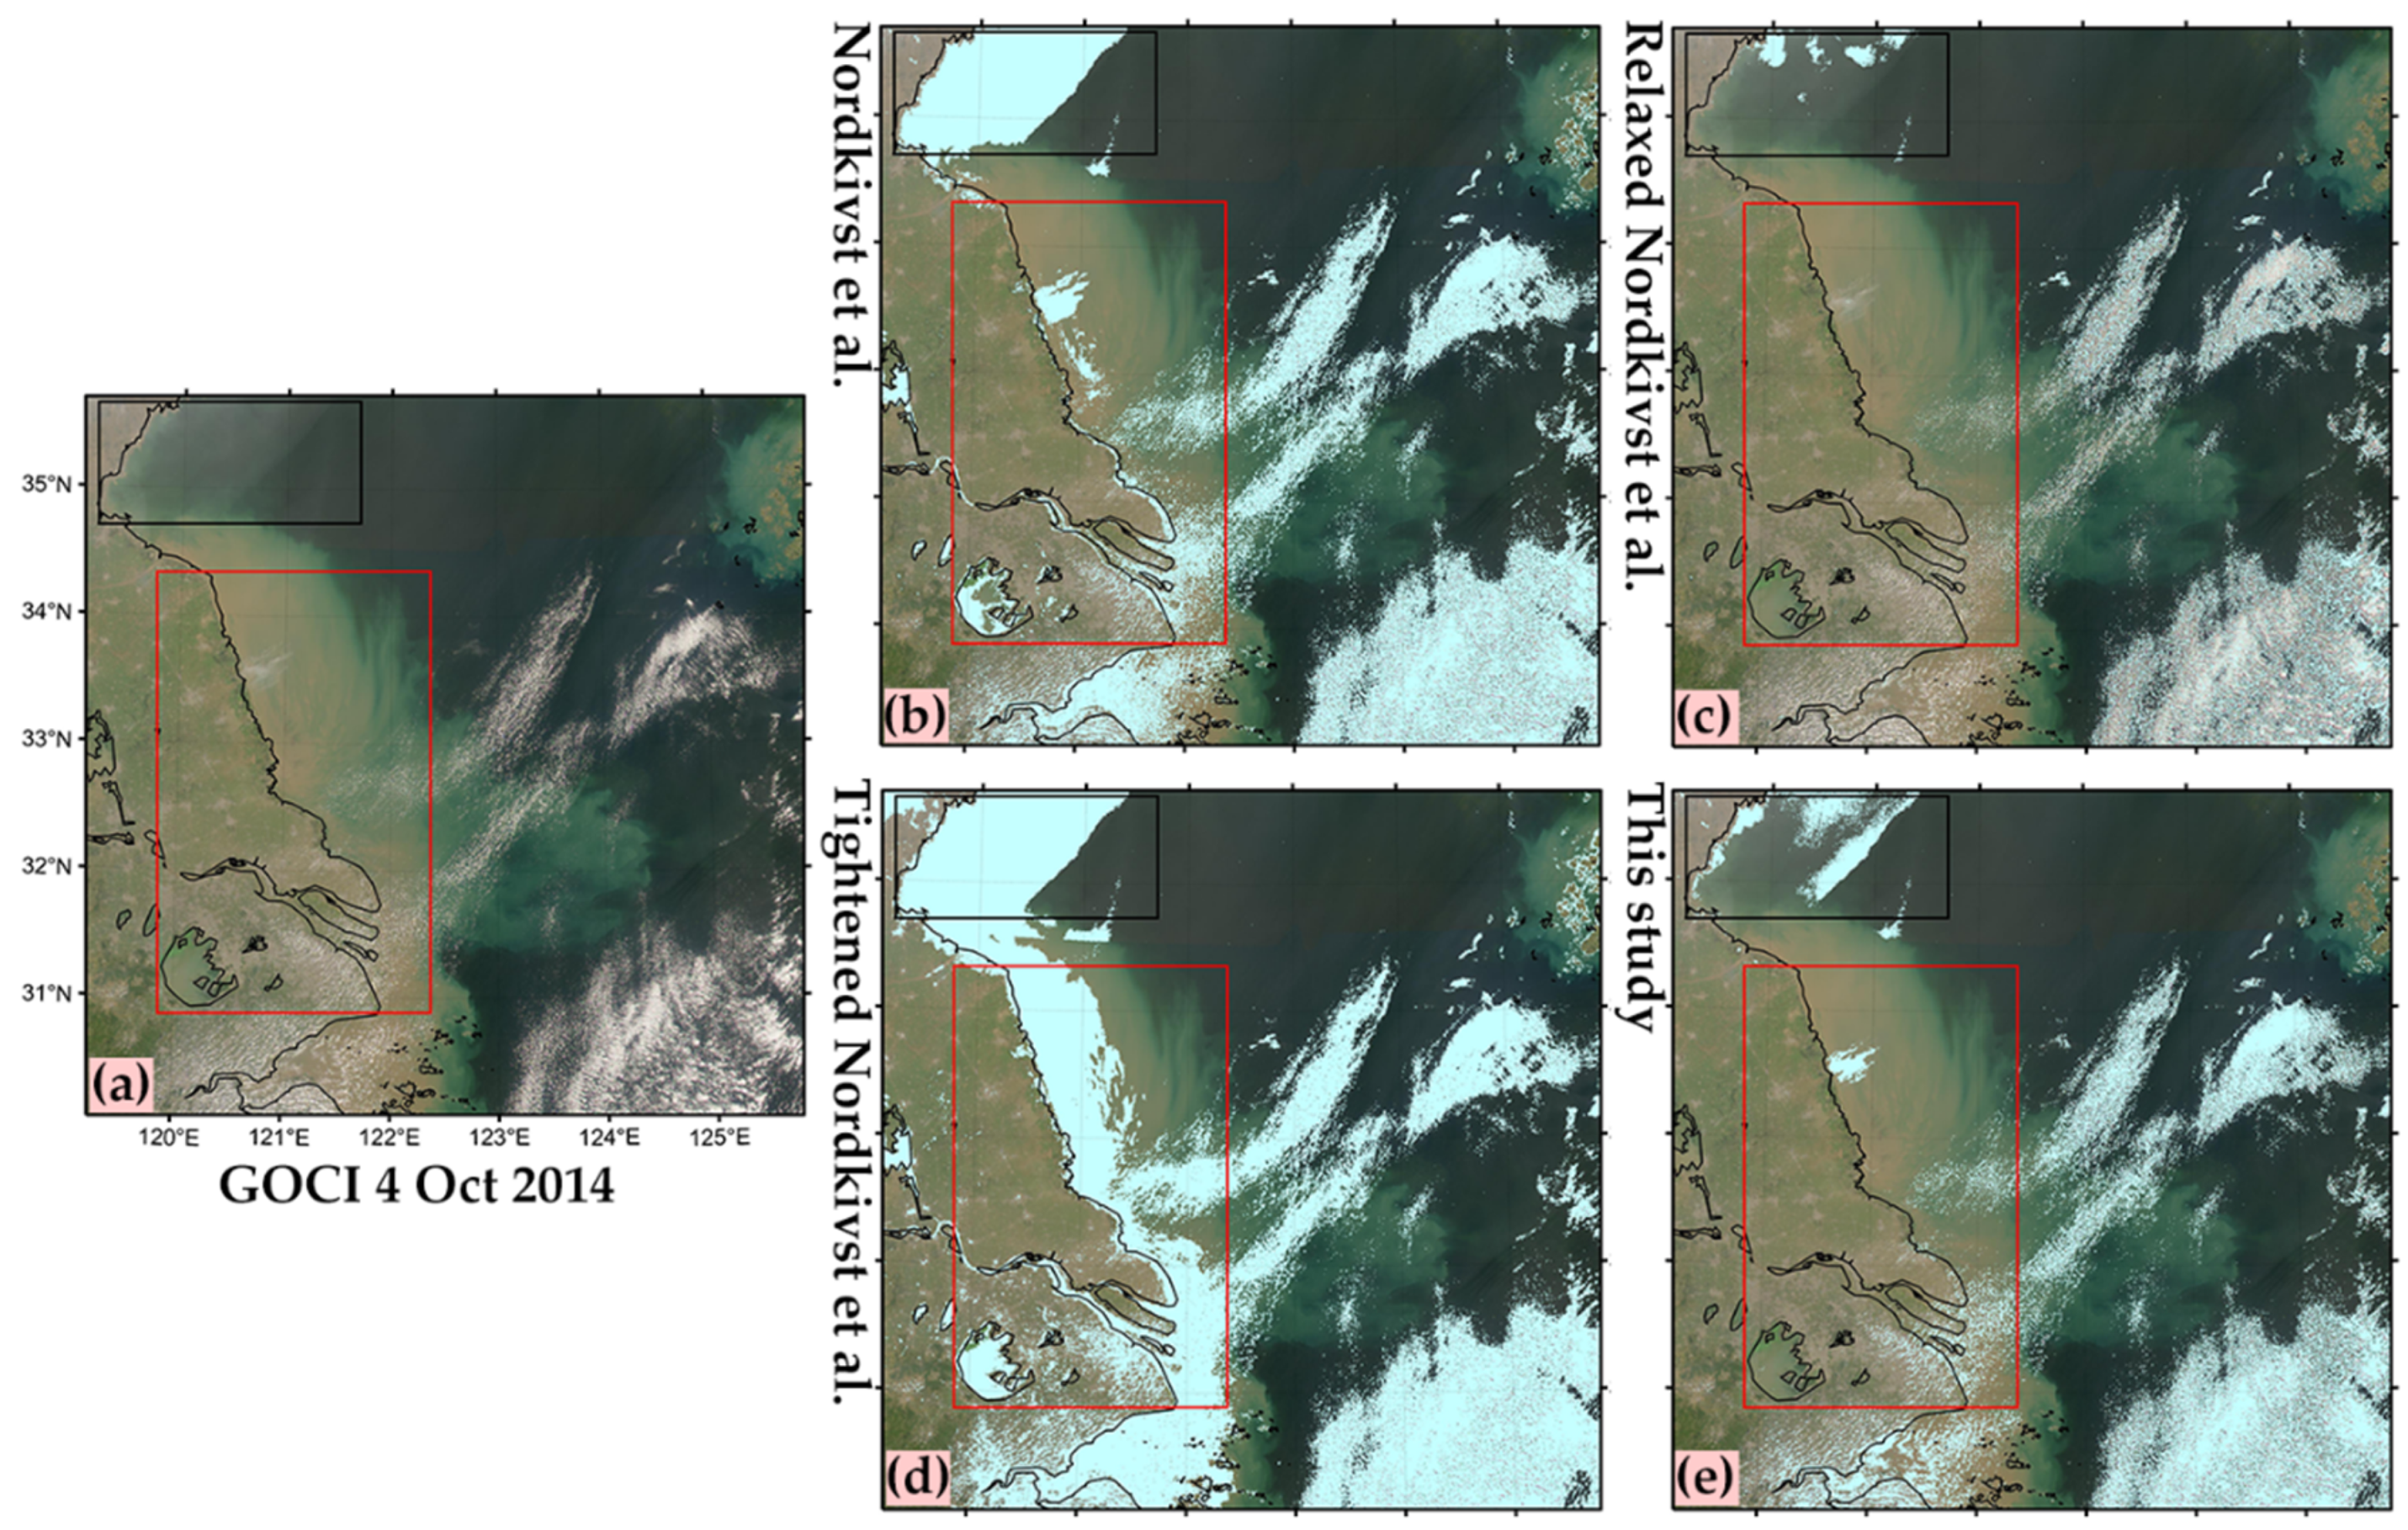
The improved cloud masking method is achieved by combining the spectral variability threshold of ε max by Nordkvist et al. with two other thresholds of ρ rc ( 412   nm ) and ρ rc ( 412   nm ) ρ rc ( 660   nm ) proposed in this study. In order to further discuss the necessity of the new threshold scheme and consider whether the same effect can be achieved by simply relaxing or tightening the ε max threshold in the Nordkvist et al. method, we made a simple attempt as shown in Figure 11.
It can be seen from Figure 11 that if the ε max threshold value in the Nordkvist et al. method is set to be larger than 2.5, many cloudless coastal turbid water pixels are misjudged as clouds (Figure 11d). If the ε max threshold value is set to be smaller than 2.5, many cloudless turbid water pixels, such as the water pixels in lakes, narrow rivers and coastal channels, and near land, are retained (Figure 11c). However, thin cloud pixels over turbid water are also mistaken as water pixels as indicated in the red rectangle. The improved method in this study (Figure 11e) performs well in both lakes and coastal turbid waters. Thus, by simply changing the ε max threshold in the Nordkvist et al. method, it is difficult to achieve the same effect over turbid water as well as the improved method in this study. This also proves the practicability and effectiveness of the improved cloud masking method in this study.
The improved method in this study can perform well over thin cloudy yellow colored turbid water pixels. It is also worthy to note that, as indicated by the black rectangle, the improved method in this study seems to retain some foggy and thin cloudy pixels over clearer waters. By comparison, the Nordkvist et al. method performs better here. Note that the performance evaluation in this study is primarily based on manual visual judgements. It is difficult to discriminate the thin clouds and foggy pixels from clear pixels. This may bring some errors in performance evaluations and comparisons. If users want to apply the improved method in this study primarily onto clearer water, we recommend adjusting the threshold value of ρ rc ( 412   nm ) ρ rc ( 660   nm ) to smaller than 1 to remove thin cloud pixels. The specific value needs to be adjusted by regional water samples.
The improved cloud masking method in this study is designed for GOCI, and typical operational ocean color sensors have similar spectral bands in the visible and near-infrared range. Therefore, the improved method in this study is supposed to be applicable to almost all ocean color sensors. Here, we test the improved method in this study using MODIS data.
Figure 12a shows MODIS (onboard Aqua) RGB images (645 nm, 555 nm, 469 nm) acquired on 10 February 2020, almost synchronized with the GOCI data in Figure 6. By using the Nordkvist et al. method and the improved method in this study (Figure 12b,c), the improved method in this study performs better over the Hangzhou Bay and Yangtze River coastal area than the Nordkvist et al. method. However, it seems to mask out all pixels in the Subei coastal area. If we modify the ρ rc ( 412   nm ) threshold value from 0.07 to 0.09, most water pixels in the Subei coastal area are retained. This implies that if one applies the improved cloud masking method in this study to ocean color sensors other than GOCI, the ρ rc ( 412   nm ) threshold value may need to be slightly adjusted. Different sensors observe the ocean with different viewing angles, and this may lead to the deviation of Rayleigh-corrected reflectance at 412 nm.
Although this improved cloud masking method generally performs better compared to other threshold methods, misjudgments may still occur in the presence of large amounts of aerosols in the atmosphere. The cloud masking methods easily mistook the aerosol-laden pixels as turbid water ones. This improved cloud masking method could be further refined based on the spectral variability analysis of a number of samples with aerosols over the coastal region. Due to huge changes in clouds, their shape aspect is not currently considered. Cloud edge and continuity aspects may need to be further improved in the future. In addition, combined with an accurate cloud masking method, feasible techniques to reconstruct missing data, such as the DINEOF (Data Interpolating Empirical Orthogonal Functions), are promising to be used to restore more water pixels obscured by clouds [45,46].

5. Conclusions

The geostationary ocean color sensor GOCI offers good opportunities to study diurnal variabilities of coastal environment dynamics. However, existing cloud masking methods often mistake turbid water pixels as clouds in sediment-dominated particularly turbid waters, such as the coastal area of Jiangsu Province and the Hangzhou Bay of China. In this study, based on 136 samples selected from the GOCI data on four individual days, the spectral variability of Rayleigh-corrected reflectance over turbid water and cloud pixels was analyzed. According to the characteristics of the Rayleigh-corrected reflectance at 412 nm and 660 nm bands, an improved cloud masking method combining two threshold tests of ρ rc ( 412   nm ) > 0.07 and ρ rc ( 412   nm ) ρ rc ( 660   nm ) > 1 with the Nordkvist et al. method was proposed in this study.
The cloud masking effects of the NIR threshold method, Wang and Shi method, Nordkvist et al. method, and the improved method in this study were further compared and evaluated. These four methods were, respectively, applied and tested in inland lake water, sediment-dominated and phytoplankton-dominated turbid coastal waters, and clearer waters. Results show that the improved method in this study performs better than the others over typical turbid water and can effectively retain more turbid water pixels. However, the improved method in this study sometimes may not be able to mask out thin foggy pixels over clearer water.
The improved cloud masking method in this study is designed for GOCI based on typical ocean color spectral bands in the visible and near-infrared range. Thus, it can be applied to almost all ocean color sensors, especially for those without SWIR bands. It can retain more effective coastal water information in data products of ocean color remote sensing processing in support of various optical remote sensing studies and applications.

Author Contributions

Conceptualization, S.H. (Shuangyan He); methodology, S.L., S.H. (Shuangyan He), and S.H. (Shuo He); software, S.L., M.H., Y.P., and W.Y.; validation, S.L. and S.H. (Shuo He); writing—original draft preparation, S.L.; writing—review and editing, S.H. (Shuangyan He), M.H., and W.Y.; funding acquisition, S.H. (Shuangyan He) and P.L. All authors have read and agreed to the published version of the manuscript.

Funding

This research was funded by the National Key Research and Development Plan of China, grant number 2018YFD0900901; the National Natural Science Foundation of China, grant number 41876031; the Hainan Provincial Natural Science Foundation of China, grant number 420QN289; the Major Science and Technology Project of Sanya, grant number SKJC-KJ-2019KY03; the Key Research and Development Plan of Zhejiang Province, grant number 2020C03012; and the High-level Personnel of Special Support Program of Zhejiang Province, grant number 2019R52045.

Institutional Review Board Statement

Not applicable.

Informed Consent Statement

Not applicable.

Acknowledgments

We thank Korea Ocean Satellite Center for providing the GOCI L1b data and the GDPS software. We thank Pei Sun Loh for help with English.

Conflicts of Interest

The authors declare no conflict of interest.

References

  1. Tsai, Y.-L.S.; Dietz, A.; Oppelt, N.; Kuenzer, C. Remote Sensing of Snow Cover Using Spaceborne SAR: A Review. Remote Sens. 2019, 11, 1456. [Google Scholar] [CrossRef] [Green Version]
  2. Jeppesen, J.H.; Jacobsen, R.H.; Inceoglu, F.; Toftegaard, T.S. A cloud detection algorithm for satellite imagery based on deep learning. Remote Sens. Environ. 2019, 229, 247–259. [Google Scholar] [CrossRef]
  3. Derrien, M.; Le Gleau, H. MSG/SEVIRI cloud mask and type from SAFNWC. Int. J. Remote Sens. 2005, 26, 4707–4732. [Google Scholar] [CrossRef]
  4. Lyapustin, A.; Wang, Y.; Frey, R. An automatic cloud mask algorithm based on time series of MODIS measurements. J. Geophys. Res. Atmos. 2008, 113. [Google Scholar] [CrossRef] [Green Version]
  5. Purbantoro, B.; Aminuddin, J.; Manago, N.; Toyoshima, K.; Lagrosas, N.; Sumantyo, J.T.S.; Kuze, H. Comparison of Aqua/Terra MODIS and Himawari-8 Satellite Data on Cloud Mask and Cloud Type Classification Using Split Window Algorithm. Remote Sens. 2019, 11, 2944. [Google Scholar] [CrossRef] [Green Version]
  6. Wilson, M.J.; Oreopoulos, L. Enhancing a Simple MODIS Cloud Mask Algorithm for the Landsat Data Continuity Mission. IEEE Trans. Geosci. Remote Sens. 2013, 51, 723–731. [Google Scholar] [CrossRef] [Green Version]
  7. Zhuge, X.; Zou, X.; Wang, Y. A Fast Cloud Detection Algorithm Applicable to Monitoring and Nowcasting of Daytime Cloud Systems. IEEE Trans. Geosci. Remote Sens. 2017, 55, 6111–6119. [Google Scholar] [CrossRef]
  8. Saunders, R.W.; Kriebel, K.T. An improved method for detecting clear sky and cloudy radiances from AVHRR data. Int. J. Remote Sens. 1988, 9, 123–150. [Google Scholar] [CrossRef]
  9. Kriebel, K.; Gesell, G.; Kaestner, M.; Mannstein, H. Cloud detection in AVHRR and ATSR data with APOLLO. In Proceedings of the Satellite Remote Sensing, Rome, Italy, 23 December 1994. [Google Scholar]
  10. Kriebel, K.T.; Gesell, G.; Kaestner, M.; Mannstein, H. The cloud analysis tool APOLLO: Improvements and validations. Int. J. Remote Sens. 2003, 24, 2389–2408. [Google Scholar] [CrossRef]
  11. Karlsson, K.G. Development of an operational cloud classification model. Int. J. Remote Sens. 1989, 10, 687–693. [Google Scholar] [CrossRef]
  12. Martins, J.V.; Tanré, D.; Remer, L.; Kaufman, Y.; Mattoo, S.; Levy, R. MODIS Cloud screening for remote sensing of aerosols over oceans using spatial variability. Geophys. Res. Lett. 2002, 29, MOD4-1–MOD4-4. [Google Scholar] [CrossRef] [Green Version]
  13. Zhu, Z.; Woodcock, C.E. Object-based cloud and cloud shadow detection in Landsat imagery. Remote Sens. Environ. 2012, 118, 83–94. [Google Scholar] [CrossRef]
  14. Breon, F.M.; Colzy, S. Cloud detection from the spaceborne POLDER instrument and validation against surface synoptic observations. J. Appl. Meteorol. 1999, 38, 777–785. [Google Scholar] [CrossRef]
  15. Benas, N.; Finkensieper, S.; Stengel, M.; van Zadelhoff, G.J.; Hanschmann, T.; Hollmann, R.; Meirink, J.F. The MSG-SEVIRI-based cloud property data record CLAAS-2. Earth Syst. Sci. Data 2017, 9, 415–434. [Google Scholar] [CrossRef] [Green Version]
  16. Li, C.; Ma, J.J.; Yang, P.; Li, Z.Q. Detection of cloud cover using dynamic thresholds and radiative transfer models from the polarization satellite image. J. Quant. Spectrosc. Radiat. Transf. 2019, 222–223, 196–214. [Google Scholar] [CrossRef]
  17. Spangenberg, D.A.; Doelling, D.R.; Chakrapani, V.; Minnis, P.; Uttal, T. Nighttime cloud detection over the Arctic using AVHRR data. In Proceedings of the Twelfth ARM Science Team Meeting Proceedings, St. Petersburg, FL, USA, 8–12 April 2002. [Google Scholar]
  18. Park, Y.-J.; Ahn, Y.; Han, H.; Yang, H.; Moon, J.; Ahn, J.; Lee, B.; Min, J.; Lee, S.; Kim, K.; et al. GOCI Level 2 Ocean Color Products (GDPS 1.3) Brief Algorithm Description; Korea Ocean Satellite Center: Busan Metropolitan City, Korea, 2014. [Google Scholar]
  19. Ackerman, S.A.; Strabala, K.I.; Menzel, W.P.; Frey, R.A.; Moeller, C.C.; Gumley, L.E. Discriminating clear sky from clouds with MODIS. J. Geophys. Res. Atmos. 1998, 103, 32141–32157. [Google Scholar] [CrossRef]
  20. Platnick, S.; King, M.D.; Ackerman, S.A.; Menzel, W.P.; Baum, B.A.; Riedi, J.C.; Frey, R.A. The MODIS cloud products: Algorithms and examples from Terra. IEEE Trans. Geosci. Remote Sens. 2003, 41, 459–473. [Google Scholar] [CrossRef] [Green Version]
  21. Remer, L.A.; Kaufman, Y.J.; Tanre, D.; Mattoo, S.; Chu, D.A.; Martins, J.V.; Li, R.R.; Ichoku, C.; Levy, R.C.; Kleidman, R.G.; et al. The MODIS aerosol algorithm, products, and validation. J. Atmos. Sci. 2005, 62, 947–973. [Google Scholar] [CrossRef] [Green Version]
  22. Choi, J.-K.; Park, Y.J.; Ahn, J.H.; Lim, H.-S.; Eom, J.; Ryu, J.-H. GOCI, the world’s first geostationary ocean color observation satellite, for the monitoring of temporal variability in coastal water turbidity. J. Geophys. Res. Ocean. 2012, 117. [Google Scholar] [CrossRef]
  23. Ruddick, K.G.; Ovidio, F.; Rijkeboer, M. Atmospheric correction of SeaWiFS imagery for turbid coastal and inland waters. Appl. Opt. 2000, 39, 897–912. [Google Scholar] [CrossRef] [Green Version]
  24. Arrigo, K.R.; McClain, C.R. Spring phytoplankton production in the western ross sea. Science 1994, 266, 261–263. [Google Scholar] [CrossRef]
  25. Banks, A.C.; Melin, F. An assessment of cloud masking schemes for satellite ocean colour data of marine optical extremes. Int. J. Remote Sens. 2015, 36, 797–821. [Google Scholar] [CrossRef] [Green Version]
  26. Banks, A.C.; Prunet, P.; Chimot, J.; Pina, P.; Donnadille, J.; Jeansou, E.; Lux, M.; Petihakis, G.; Korres, G.; Triantafyllou, G.; et al. A satellite ocean color observation operator system for eutrophication assessment in coastal waters. J. Mar. Syst. 2012, 94, S2–S15. [Google Scholar] [CrossRef]
  27. Hallegraeff, G.M. Ocean climate change, phytoplankton community responses, and harmful algal blooms: A formidable predictive challenge. J. Phycol. 2010, 46, 220–235. [Google Scholar] [CrossRef]
  28. Wang, M.; Shi, W. Cloud masking for ocean color data processing in the coastal regions. IEEE Trans. Geosci. Remote Sens. 2006, 44, 3196–3205. [Google Scholar] [CrossRef]
  29. Hudson, B.D.; Overeem, I.; Syvitski, J.P.M. A novel technique to detect turbid water and mask clouds in Greenland fjords. Int. J. Remote Sens. 2016, 37, 1730–1746. [Google Scholar] [CrossRef]
  30. Hu, C.; Carder, K.L.; Muller-Karger, F.E. Atmospheric correction of SeaWiFS imagery over turbid coastal waters: A practical method. Remote Sens. Environ. 2000, 74, 195–206. [Google Scholar] [CrossRef]
  31. Wang, M.; Shi, W.; Jiang, L. Atmospheric correction using near-infrared bands for satellite ocean color data processing in the turbid western Pacific region. Opt. Express 2012, 20, 741–753. [Google Scholar] [CrossRef] [PubMed]
  32. Nordkvist, K.; Loisel, H.; Gaurier, L.D. Cloud masking of SeaWiFS images over coastal waters using spectral variability. Opt. Express 2009, 17, 12246–12258. [Google Scholar] [CrossRef]
  33. Ishida, H.; Oishi, Y.; Morita, K.; Moriwaki, K.; Nakajima, T.Y. Development of a support vector machine based cloud detection method for MODIS with the adjustability to various conditions. Remote Sens. Environ. 2018, 205, 390–407. [Google Scholar] [CrossRef]
  34. Mahajan, S.; Fataniya, B. Cloud detection methodologies: Variants and development-a review. Complex Intell. Syst. 2020, 6, 251–261. [Google Scholar] [CrossRef] [Green Version]
  35. Chai, D.; Newsam, S.; Zhang, H.K.; Qiu, Y.; Huang, J. Cloud and cloud shadow detection in Landsat imagery based on deep convolutional neural networks. Remote Sens. Environ. 2019, 225, 307–316. [Google Scholar] [CrossRef]
  36. Qiu, S.; He, B.; Zhu, Z.; Liao, Z.; Quan, X. Improving Fmask cloud and cloud shadow detection in mountainous area for Landsats 4–8 images. Remote Sens. Environ. 2017, 199, 107–119. [Google Scholar] [CrossRef]
  37. Hughes, M.J.; Kennedy, R. High-Quality Cloud Masking of Landsat 8 Imagery Using Convolutional Neural Networks. Remote Sens. 2019, 11, 2591. [Google Scholar] [CrossRef] [Green Version]
  38. Park, J.H.; Inamori, T.; Hamaguchi, R.; Otsuki, K.; Kim, J.E.; Yamaoka, K. RGB Image Prioritization Using Convolutional Neural Network on a Microprocessor for Nanosatellites. Remote Sens. 2020, 12, 3941. [Google Scholar] [CrossRef]
  39. Yang, H.; Han, H.; Heo, J.; Jeong, J.; Lee, T.; Hu, W.; Kwak, S. Ocean Color Algorithm Development Environment for High-Speed Data Processing of GOCI-II. In Proceedings of the IGARSS 2018–2018 IEEE International Geoscience and Remote Sensing Symposium, Valencia, Spain, 22–27 July 2018; pp. 7968–7971. [Google Scholar]
  40. Lamquin, N.; Mazeran, C.; Doxaran, D.; Ryu, J.-H.; Park, Y.-J. Assessment of GOCI Radiometric Products using MERIS, MODIS and Field Measurements. Ocean Sci. J. 2012, 47, 287–311. [Google Scholar] [CrossRef]
  41. Ahn, J.-H.; Park, Y.-J.; Ryu, J.-H.; Lee, B.; Oh, I.S. Development of Atmospheric Correction Algorithm for Geostationary Ocean Color Imager (GOCI). Ocean Sci. J. 2012, 47, 247–259. [Google Scholar] [CrossRef]
  42. Gordon, H.R.; Wang, M.H. Retrieval of water-leaving radiance and aerosal optical-thickness over the oceans with SeaWiFS-a preliminary algorithm. Appl. Opt. 1994, 33, 443–452. [Google Scholar] [CrossRef]
  43. Ruddick, K.; Vanhellemont, Q.; Yan, J.; Neukermans, G.; Wei, G.; Shang, S. Variability of Suspended Particulate Matter in the Bohai Sea from the Geostationary Ocean Color Imager (GOCI). Ocean Sci. J. 2012, 47, 331–345. [Google Scholar] [CrossRef]
  44. Kim, J.B.; Park, J.-I.; Jung, C.-S.; Lee, P.-Y.; Lee, K.-S. Distributional range extension of the seagrass Halophila nipponica into coastal waters off the Korean peninsula. Aquat. Bot. 2009, 90, 269–272. [Google Scholar] [CrossRef]
  45. Alvera-Azcarate, A.; Vanhellemont, Q.; Ruddick, K.; Barth, A.; Beckers, J.-M. Analysis of high frequency geostationary ocean colour data using DINEOF. Estuar. Coast. Shelf Sci. 2015, 159, 28–36. [Google Scholar] [CrossRef] [Green Version]
  46. Liu, X.; Wang, M. Filling the Gaps of Missing Data in the Merged VIIRS SNPP/NOAA-20 Ocean Color Product Using the DINEOF Method. Remote Sens. 2019, 11, 178. [Google Scholar] [CrossRef] [Green Version]
Figure 1. (a) The RGB image composited from GOCI Rayleigh-corrected reflectance at 680 nm, 555 nm, and 443 nm at 05:16 (UTC) on 10 February 2020; (b) the pseudo-color image of ρ rc ( 865   nm ) . The red isolines in Figure 1b represent ρ rc ( 865   nm ) = 0.027 , and the white pixels represent the pixels with ε max 2.5 .
Remotesensing 13 02722 g001
Figure 2. (a) Spectral variation of Rayleigh-corrected reflectance at 8 bands from eight typical GOCI samples in turbid waters around Hangzhou Bay of China. The ε max values calculated according to Equation (1) in Nordkvist et al. method are also labeled. (b) Locations of eight typical samples indicated in red crosses and blue circles on the GOCI RGB image at 07:16 UTC on 10 May 2018. The circles represent water samples visually selected, and the crosses represent clouds.
Remotesensing 13 02722 g002
Figure 3. Positions of (a) 45 samples selected on 19 October 2014, (b) 24 samples selected on 19 November 2019, (c) 36 samples selected on 11 May 2018, and (d) 31 samples selected on 19 August 2017. The background images are RGB ones synthesized using Rayleigh-corrected reflectance at three bands of 443 nm, 555 nm, and 680 nm. The circles represent water samples visually selected, and the crosses represent clouds. Red and bright cyan represent the clouds identified by conditions 1 and 2 in the improved cloud masking method in this study, respectively.
Remotesensing 13 02722 g003
Figure 4. Scatter plot of ρ rc ( 865   nm ) versus ε max for 136 visually selected samples as shown in Figure 3. The circles represent water samples visually selected, and the crosses represent clouds. Samples with ρ rc ( 412   nm ) exceeding a threshold of 0.07 are indicated in red, and those with ρ rc ( 412   nm ) ρ rc ( 660   nm ) exceeding a threshold of 1 are marked in bright cyan.
Remotesensing 13 02722 g004
Figure 5. Scatter plot of ρ rc ( 865   nm ) versus ρ rc ( 745   nm ) / ρ rc ( 865   nm ) for 136 visually selected samples as shown in Figure 3. The circles represent water samples visually selected, and the crosses represent clouds. Samples with ρ rc ( 745   nm ) ρ rc ( 865   nm ) < 1.15, ρ rc ( 865   nm ) 0.06 , and ρ rc ( 865   nm ) 0.027 are indicated in red, and those with ρ rc ( 865   nm ) exceeding a threshold of 0.06 are marked in bright cyan.
Remotesensing 13 02722 g005
Figure 6. Comparison of four cloud masking methods in turbid coastal water off the mouth of Yangtze River at 05:16 (UTC) on 10 February 2020. The images are (a) the RGB image composited by GOCI-derived Rayleigh-corrected reflectance at 443 nm, 555 nm, and 680 nm; the cloud masking results using the NIR threshold method (b); Wang and Shi method (c); the Nordkvist et al. method (d); and the improved method in this study (e). Clouds are indicated as white. The red rectangle marks the turbid coastal water of Jiangsu Province of China.
Remotesensing 13 02722 g006
Figure 7. Comparison of four cloud masking methods over Lake Tai and coastal water around Hangzhou Bay of China at 01:16 (UTC) on 19 August 2017. The images of (ae) are the same as Figure 6. Clouds are indicated as white. The smaller red rectangle (left one) marks the location of Lake Tai. The bigger red rectangle (right one) marks turbid coastal water around the mouth of Yangtze River and Hangzhou Bay of China.
Remotesensing 13 02722 g007
Figure 8. Comparison of four cloud masking methods over coastal water around the mouth of Yangtze River and Hangzhou Bay of China on 6 January 2020. The images of (ae) are the same as Figure 6. Clouds are indicated as white. The smaller red rectangle (right one) marks the location around the mouth of Yangtze River, and the bigger red rectangle (left one) marks the west part of Hangzhou Bay of China.
Remotesensing 13 02722 g008
Figure 9. Comparison of four cloud masking methods over Bohai of China at 03:16 (UTC) on 1 April 2019. The images of (ae) are the same as Figure 6. Clouds are indicated as white. The red rectangle marks a typical region of silt and tidal flats along the coast of Bohai.
Remotesensing 13 02722 g009
Figure 10. Comparison of four cloud masking methods over water area off the south of the Korean Peninsula at 03:16 (UTC) on 18 April 2019. The images of (ae) are the same as Figure 6. Clouds are indicated as white. The red rectangle marks the coastal turbid water area around the Korean Peninsula.
Remotesensing 13 02722 g010
Figure 11. (a) GOCI RGB images (680 nm, 555 nm, 443 nm) acquired at 02:16 (UTC) on 4 October 2014; (b) cloud masking results using Nordkvist et al. method; (c) cloud masking results after adjusting the ε max threshold value in Nordkvist et al. method to 1.5; (d) cloud masking results after adjusting the ε max threshold value in Nordkvist et al. method to 3.5; (e) cloud masking results using the improved method in this study. Clouds are indicated as light green. The red rectangle marks the turbid coastal water of Jiangsu Province of China. The black rectangle indicates the foggy or thin cloudy water area off the south of Shandong Peninsula.
Remotesensing 13 02722 g011
Figure 12. (a) MODIS (onboard Aqua) RGB images (645 nm, 555 nm, 469 nm) acquired on 10 February 2020; (b) cloud masking results using Nordkvist et al. method; (c) cloud masking results using the improved method in this study; (d) cloud masking results using the improved method in this study after adjusting the ρ rc ( 412   nm ) threshold value from 0.07 to 0.09. Clouds are indicated as white.
Remotesensing 13 02722 g012
Table 1. Comparison of clear pixel numbers recognized by four cloud masking methods over selected turbid water regions as indicated in Figure 6, Figure 7 and Figure 8.
RegionDateTotal Pixel NumberClear Pixel Percentage
NIR ThresholdWang and ShiNordkvist et al.This Study
Lake Tai
Hangzhou Bay
19 August 201717,9524.23%28.67%65.61%79.77%
35,3219.65%40.25%82.59%94.63%
Subei coastal10 February 202083,6592.88%33.59%70.65%99.37%
Hangzhou Bay
Yangtze River
6 January 202030,0560.00%29.12%77.65%92.12%
15,8360.01%55.41%71.47%97.95%
Averaged clear pixel percentage3.35%37.41%73.59%92.77%
Table 2. Comparison of clear pixel numbers recognized by four cloud masking methods over selected water regions as indicated in Figure 9 and Figure 10.
RegionDateTotal Pixel NumberClear Pixel Percentage
NIR ThresholdWang and ShiNordkvist et al.This Study
Bohai Bay1 April 201931,10431.77%36.97%85.58%99.88%
Korean Peninsula18 April 201957,44941.85%56.99%81.85%97.43%
Averaged clear pixel percentage36.81%46.98%83.72%98.66%
Publisher’s Note: MDPI stays neutral with regard to jurisdictional claims in published maps and institutional affiliations.