Abstract
Aerosol types in Asian capital cities were classified using a random forest (RF) satellite-based aerosol classification model during 2018–2020 in an investigation of the contributions of aerosol types, with or without Aerosol Robotic Network (AERONET) observations. In this study, we used the recently developed RF aerosol classification model to detect and classify aerosols into four types: pure dust, dust-dominated aerosols, strongly absorbing aerosols, and non-absorbing aerosols. Aerosol optical and microphysical properties for each aerosol type detected by the RF model were found to be reasonably consistent with those for typical aerosol types. In Asian capital cities, pollution-sourced aerosols, especially non-absorbing aerosols, were found to predominate, although Asian cities also tend to be seasonally affected by natural dust aerosols, particularly in East Asia (March–May) and South Asia (March–August). No specific seasonal effects on aerosol type were detected in Southeast Asia, where there was a predominance of non-absorbing aerosols. The aerosol types detected by the RF model were compared with those identified by other aerosol classification models. This study indicates that the satellite-based RF model may be used as an alternative in the absence of AERONET sites or observations.
1. Introduction
Aerosol characteristics such as particle size and absorption properties vary with their emission sources [1], and it is difficult to define categories of aerosol type due to their diverse properties and temporospatial variability [2,3,4]. In climate research, aerosol type is an important input parameter in calculating radiative forcing, and can cause uncertainties in outputs [5,6,7,8]. Aerosol type is also a useful input in satellite aerosol retrieval algorithms [9,10] and transport models [11,12].
In the investigation of predominant aerosol types on regional scales, several classification methods have been proposed using ground-based Aerosol Robotic Network (AERONET) observations, which provide aerosol optical (e.g., aerosol optical depth, single scattering albedo, and phase function) and microphysical (e.g., size distribution) properties. Gobbi et al. [13] classified aerosol types for unsupervised classification based on the Ångström exponent (AE) and its variations, as well as aerosol optical depth (AOD). Other studies introduced cluster analysis with inputs for aerosol properties such as refractive index, AE, mean radius, asymmetry factors, and single scattering albedo (SSA) [14,15,16]. In threshold-based aerosol classification, AOD, SSA, and aerosol particle size (AE and fine mode fraction; FMF) are commonly involved [17,18,19,20,21]. These threshold-based aerosol classification methods were applied to investigate aerosol types on a global scale [17], Southeast Asia [18], Beijing [19], Europe, the Middle East, North Africa, the Arabian Peninsula [20], and Saudi Arabia [21]. The depolarization ratio, which is sensitive to aerosol particle shape, has recently been introduced in threshold-based aerosol classification [22]. The aerosol classification model suggested in Shin et al. [22] is reportedly able to identify mixed aerosols containing non-spherical particles (dust aerosols). Although such numerous aerosol classification models have been suggested, determining the characteristics of dominant aerosol types remains difficult in areas lacking AERONET ground-based observations.
As a solution, satellite-based classification models have been proposed that use threshold values of satellite input variables such as aerosol optical properties and column densities of trace gases [23,24,25,26,27,28,29]. However, misclassification of aerosols can be caused by internal uncertainties in satellite input variables. Machine learning has recently been applied in classifying aerosol types, with training of classification models with datasets comprising satellite input variables and AERONET-based aerosol types determined by Shin et al. [22,30,31]. Choi et al. [30] first used a random forest (RF) model to classify aerosols with an accuracy of up to 73%. Eleven satellite variables from the TROPOspheric Monitoring Instrument (TROPOMI) and Moderate Resolution Imaging Spectroradiometer (MODIS) measurements were used as input variables. Regarding the 11 variables, four (aerosol index, solar zenith angle, CO column amount, and tropospheric NO2 column density) are from TROPOMI; and five (AOD, AE, top-of-atmosphere reflectance at three wavelengths, land cover type, and percent urban area) are from MODIS. However, the use of 11 input variables was found to have insufficient spatial coverage due to data missing for each satellite product, and an attempt was made to reduce the number of variables, thus minimizing missing data from the input variable dataset [31]. The minimization of missing data was found to improve spatial coverage of the RF-based aerosol classification model [31]. Compared with the previously developed model [30], ~2.6 times more pixels were classified by the RF model [31] with reasonable performance (~72% accuracy). Therefore, the RF model may be a useful tool for aerosol classification even without AERONET observations.
Asia is affected by various types of aerosols with high aerosol loadings, originating from desert regions [32,33,34,35], biomass burning [36,37,38], and anthropogenic sources associated with high regional populations and fossil-fuel combustion [39,40,41,42]. Air masses in Asian urban areas are particularly influenced by transport and mixing of aerosols from deserts and biomass burning [43,44,45,46]. The identification of aerosol types in Asian urban areas is therefore a challenging problem requiring investigation of their characteristics.
In this study, we classified and investigated dominant aerosol types in Asian urban regions using an RF-based satellite aerosol classification model, focusing on capital cities during 2018–2020, with or without AERONET observations. We examined AERONET aerosol optical and microphysical properties for aerosol types detected by the RF model, and the predominant types were investigated annually and seasonally. Classified aerosol types were compared with those determined by the AERONET-based classification model [22] and other satellite aerosol classification models [26,27].
2. Method
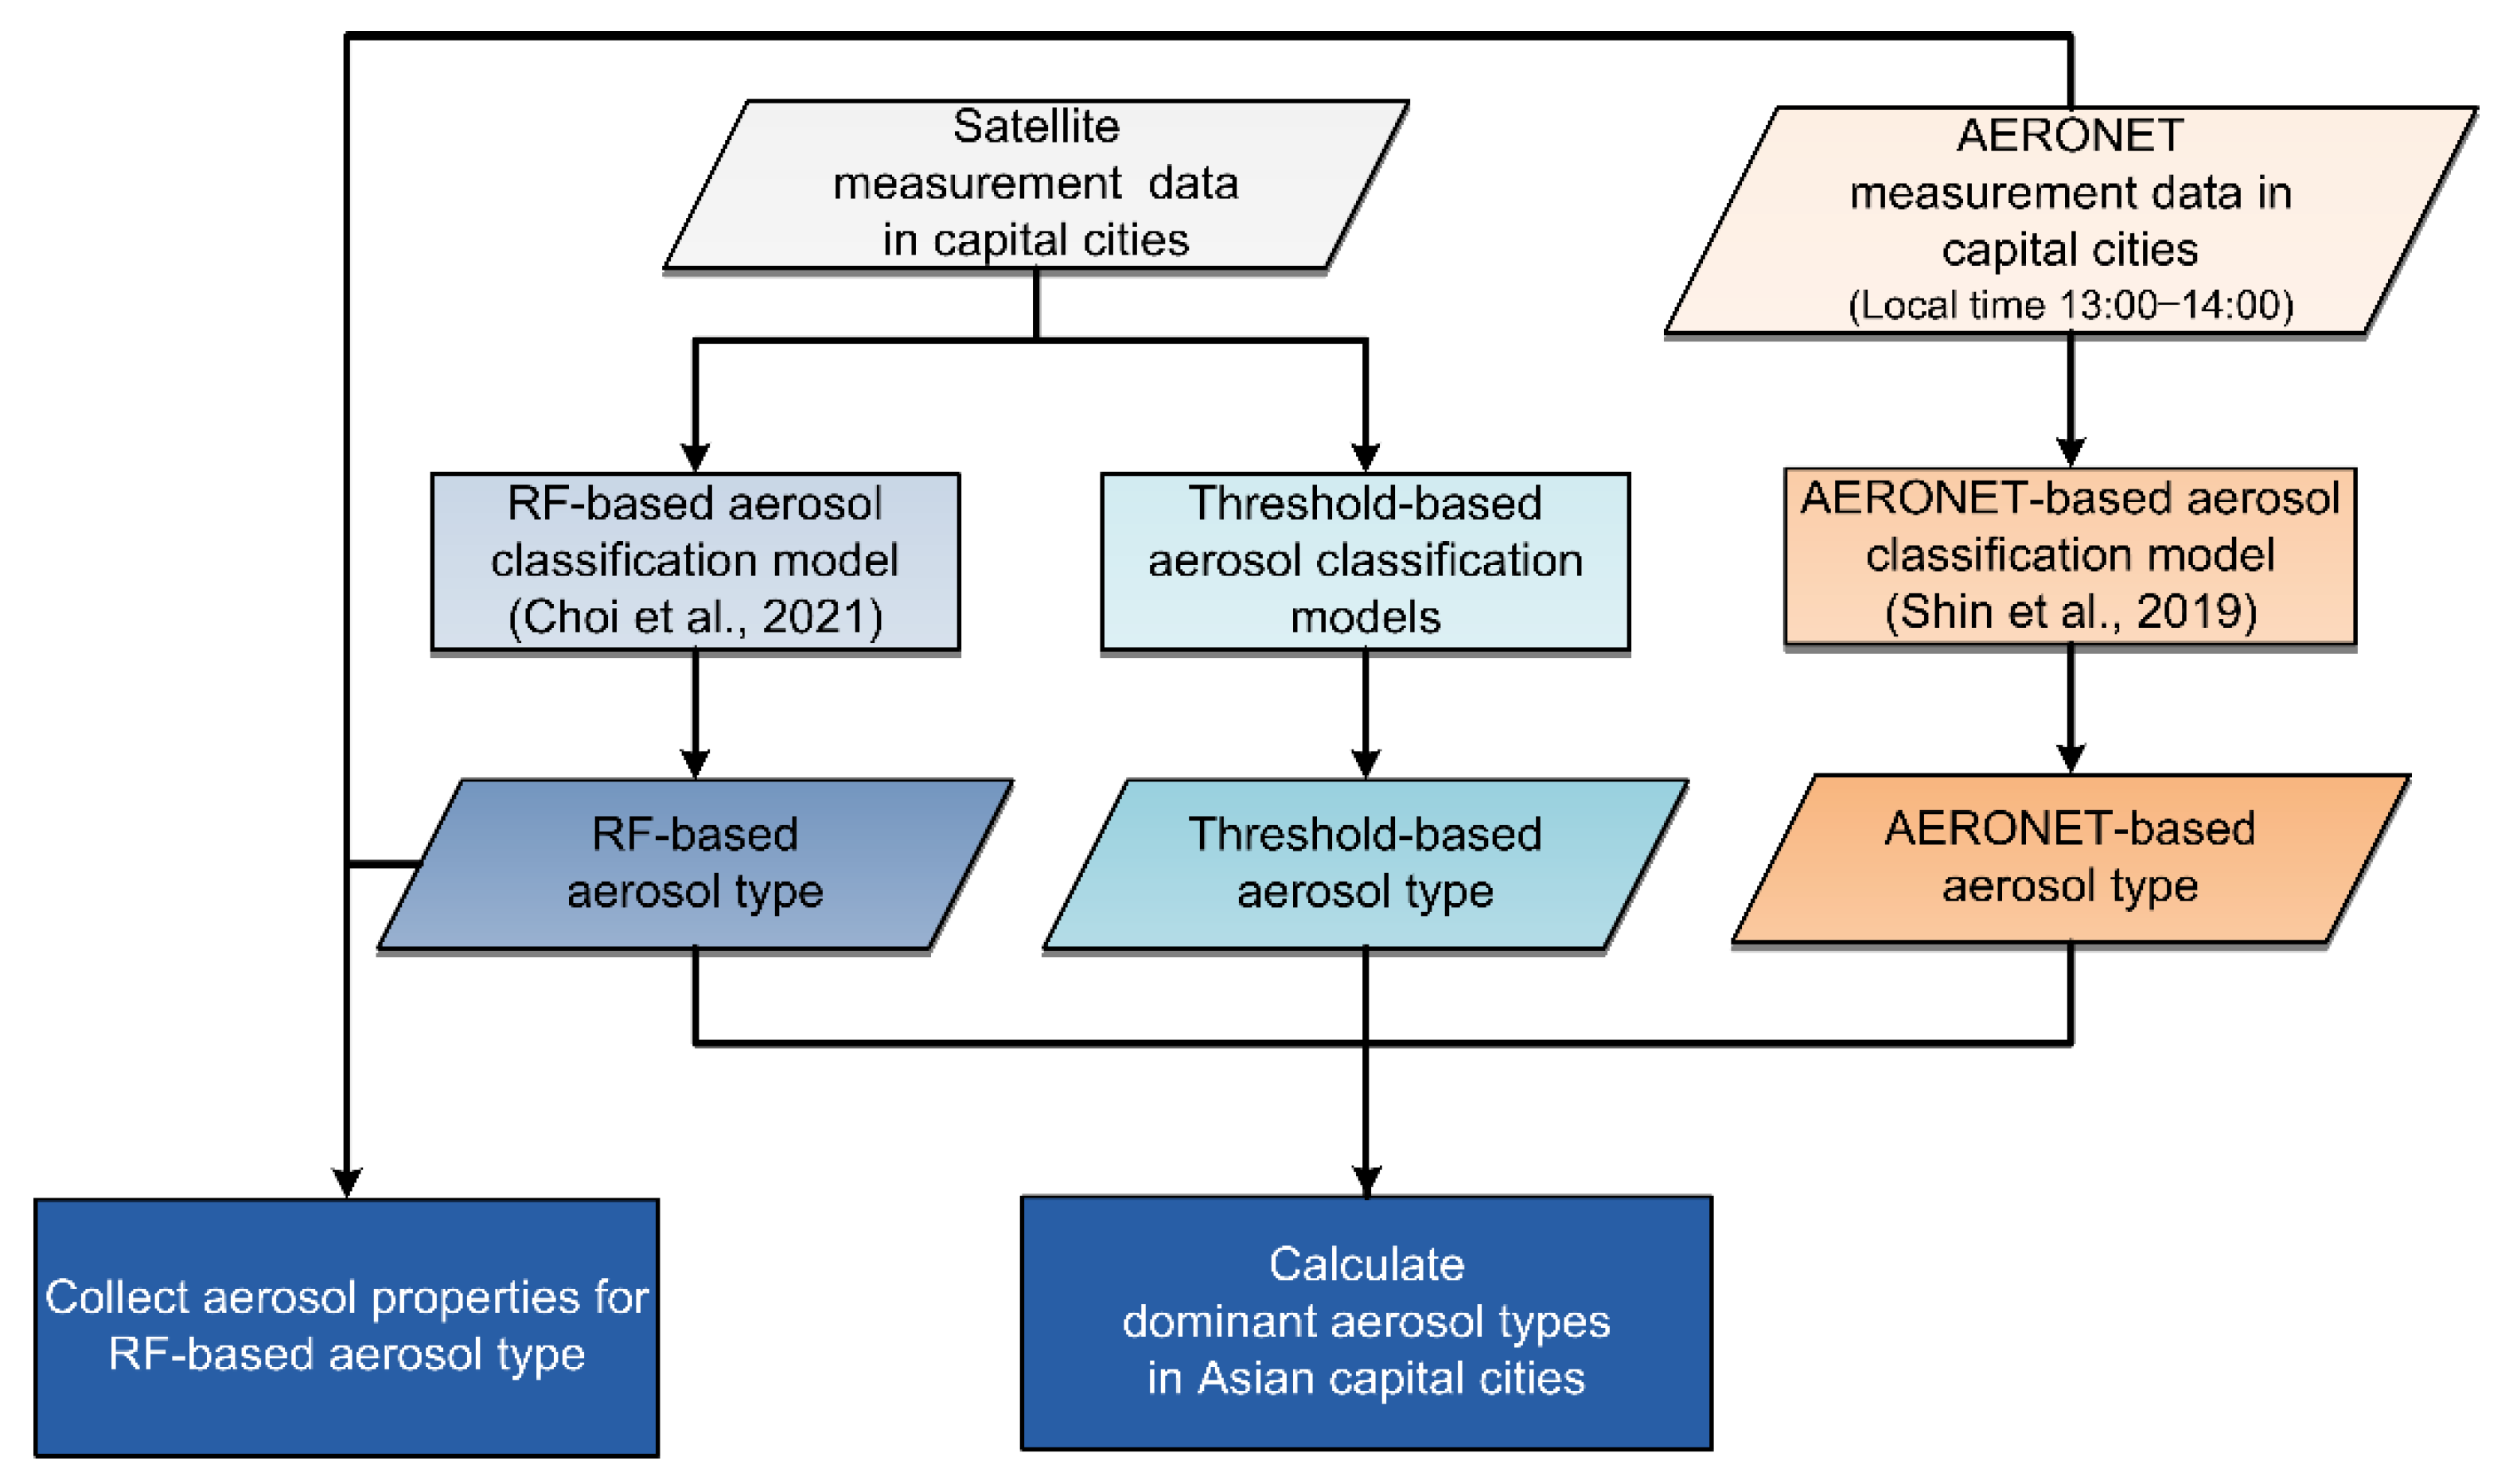
The overall flow chart of this study is shown in Figure 1. Aerosol types at 13:30 local time (overpass time of satellite inputs) were classified and seasonally and annually investigated in several capital cities in Asia for the period from 2018 to 2020. Locations of the regions of interest (Asian capital cities) are specified in Section 2.1. To classify aerosol types in Asian capital cities, we used the RF model that had been globally trained using a dataset for January 2018 to June 2020 [31], as described in Section 2.2. To test the feasibility of the RF model in Asian capital cities, we first investigated AERONET aerosol optical (spectral dependence of SSA, depolarization ratio, and FMF) and microphysical (volume size distribution and effective radius) properties for aerosol types detected by the RF model. The RF-based aerosol types of Asian capital cities were compared with those of the AERONET-based and other satellite aerosol classification models (Figure 1). The descriptions of AERONET and satellite data used in this study are in Section 2.3.

Figure 1.
Flow chart of the overall methodology used in this study.
2.1. Regions of Interest
The regions of interest were selected from capital cities in East Asia, South Asia, and Southeast Asia with populations of >1 million. About 40% of the 19 capitals lack an AERONET observation site (Table 1). To simultaneously compare AERONET and satellite observation data, the location of the AERONET site was used as the location of the corresponding city, with satellite data for near that location being collected. For cities with no AERONET site, coordinates were obtained from the GeoHack system of Wikitech (https://geohack.toolforge.org/, accessed on 20 April 2021).

Table 1.
Regions of interest containing capital cities in East Asia, South Asia, and Southeast Asia with populations of >1,000,000 [47]. The coordinates of cities are those of an AERONET site; coordinates of cities without AERONET sites were obtained from the GeoHack system of Wikitech (https://geohack.toolforge.org/, accessed on 20 April 2021).
2.2. Random Forest Model for Satellite Aerosol Classification
We used the satellite classification model developed previously [31] and based on the RF approach, which builds an ensemble of decision trees by making predictions determined by a majority vote of each tree [48]. Choi et al. [31] trained using a set of observational data including target (AERONET aerosol type) and input (satellite measurement) variables to detect aerosol types without input of AERONET data. Satellite input parameters of the RF model include 6 satellite-based products: aerosol index, column densities of trace gases (CO and tropospheric NO2), solar zenith angle, land-cover type, and percentage urban area. For example, column amounts of CO and tropospheric NO2 were selected for identifying the presence of carbonaceous particles and scattering-dominant aerosols, respectively [30,31]. In the case of sulfur oxides (SOx), SO2 is the only one that can be measured by satellite observations, but it was excluded due to the greater uncertainty in satellite SO2 column data [49] compared with that of column CO [50] and tropospheric NO2 [51] data. The aerosol index is the parameter for identifying absorbing and non-absorbing aerosols, but it is not the only parameter useful for identifying dust aerosols [21]. The RF model was found to have sensitivity for distinguishing dust aerosols by training with satellite input variables (e.g., aerosol index, column amount of trace gases) and the AERONET-based aerosol type dataset [31]. The training dataset of the model included 60% of data collected globally from January 2018 to June 2020 [31]. Optimal hyperparameters were selected based on 5-fold validation while training the RF model [31]. The previously developed RF model allowed classification of 7 aerosol types: pure dust, dust-dominant mixed, pollution-dominant mixed, and pollution aerosols (strongly, moderately, weakly, and non-absorbing) with an accuracy of 56% [31]. The accuracy of the RF model was improved to 72% by merging aerosol classes into 4 types: pure dust (PD), dust-dominated mixed (DDM), and strongly absorbing (SA) and non-absorbing (NA) aerosols [31]. Therefore, in this study, an RF model able to classify 4 aerosol types was utilized to take advantage of its reasonable accuracy. Choi et al. [31] reported that aerosol types classified by the RF model had consistent aerosol optical properties (FMF and spectral dependence of SSA) compared with the typical values for individual aerosol types. More detailed descriptions for development and validation of the model are in Choi et al. [31].
2.3. Satellite and AERONET Observation Data
As referred above, the RF model uses 6 satellite input variables including aerosol index, column densities of CO and tropospheric NO2, solar zenith angle, land-cover type, and percentage urban area [31]. In this study, we additionally tried to compare the results using other satellite aerosol classification models [26,27]. In Lee et al. [26], aerosol index, AOD, and AE are used as input variables. In Torres et al. [27], aerosol index and column densities of CO are input variables. To collect those satellite data, aerosol index, column densities of CO and tropospheric NO2, and solar zenith angle were obtained from TROPOMI measurements onboard the Sentinel-5 Precursor mission. Aerosol index and solar zenith angle were from Sentinel-5P TROPOMI Aerosol Index 1-Orbit L2. Column densities of CO and Tropospheric NO2 were obtained from Sentinel-5P TROPOMI Carbon Monoxide CO Column 1-Orbit L2 and Sentinel-5P TROPOMI Tropospheric NO2 1-Orbit L2, respectively. AOD was from MODIS measurements onboard Aqua (MYD04_L2). Land-cover type and percentage urban area were from a MODIS level-3 product (MCD12C1; Terra+Aqua). In this study, we used the AERONET version 3 level-1.5 data when AOD was >0.4 to minimize uncertainties in AERONET Level 1.5 data. The aerosol optical and microphysical properties were collected, including FMF, SSA, depolarization ratio, effective radius, and volume size distribution. Both satellite input data and AERONET observation data in this Section were collected for the period from 2018 to 2020. Because the overpass time of TROPOMI and MODIS satellites is 13:30 local time, AERONET data for 13:00–14:00 were collected.
3. Aerosol Properties of the Classified Aerosol Types in Asian Capital Cities
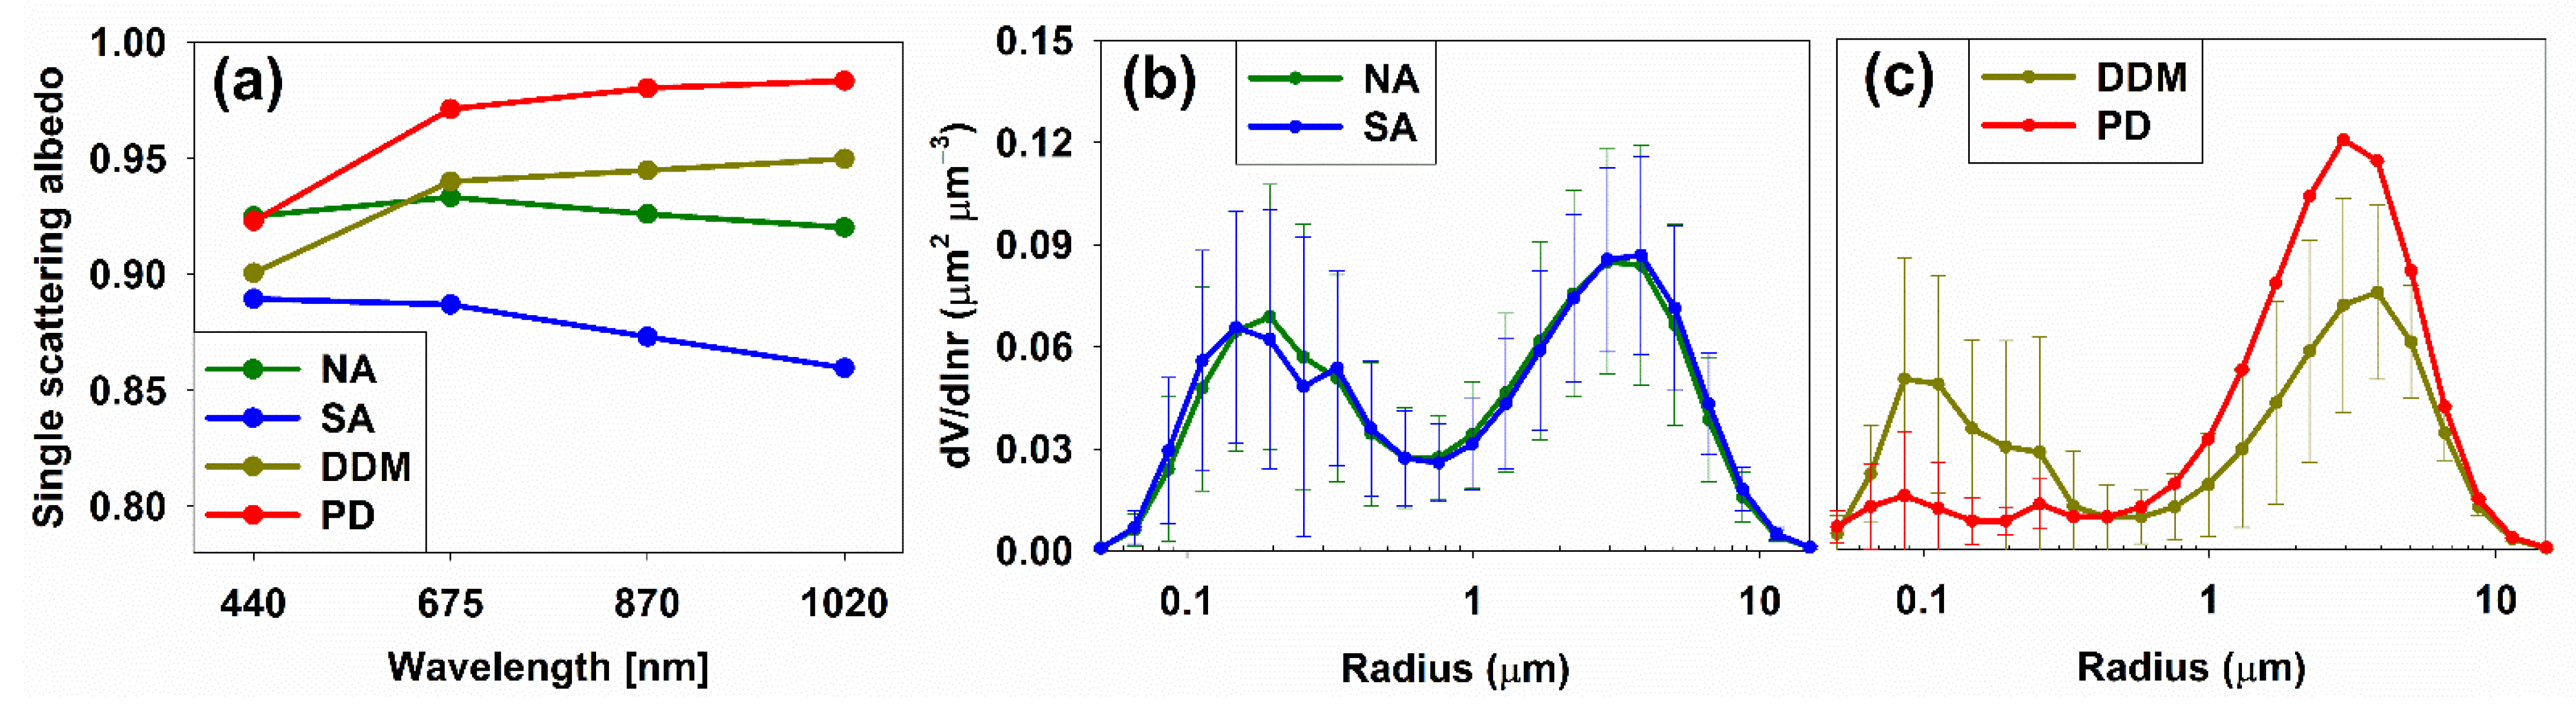
We investigated aerosol properties of the aerosol types detected by the RF model, which included the four types (PD, DDM, NA, and SA) during 2018–2020 in the 11 cities where there is an AERONET site (Table 1). Satellite aerosol types were classified based on the nearest pixel of each AERONET site. The AERONET-derived aerosol properties were collected near overpass time, from 13:00 to 14:00. Figure 2 and Table 2 indicate the AERONET-derived aerosol properties for aerosol types identified by the RF model, including spectral variation of SSA, mean volume size distribution, effective radius, SSA difference (dSSA440/1020 = SSA at 1020 nm—SSA at 440 nm), and depolarization ratio. The depolarization ratio at 1020 nm was utilized because the AERONET-derived ratio at 1020 nm is reported to have the highest correlation with lidar data [52]. As shown in Figure 2b, volume size distributions of the NA and SA types were similar, with high FMF (0.88 for NA and 0.89 for SA) and low effective radius (0.42 µm for NA and 0.38 µm for SA). Depolarization ratios of the NA and SA types were 0.06 and 0.04, respectively, showing the predominance of spherical fine-mode aerosols detected by the RF model. However, SSA spectral variation for the NA type differs from that of the SA type (Figure 2a). SSA spectral variability is reported as an indicator of aerosol particle size, type, and source [53,54,55]. In the case of absorbing fine mode aerosols (SA), SSA tends to decrease with increasing wavelength [53,54,55]. Non-absorbing fine mode aerosols (NA) were reported to have no spectral dependence on SSA [53]. In this study, the dSSA440/1020 value for the NA type was found to be zero, whereas that for the SA type was negative (−0.03). These spectral tendencies and aerosol particle sizes are consistent with previous studies [53,54,55]. Thus, the RF model detects pollution aerosols (both NA and SA) well. However, standard deviations of dSSA440/1020 for NA and SA were 0.04 and 0.07, respectively. Thus, there was a presence of misclassification of NA and SA. Notably, a higher standard deviation (0.07) of dSSA440/1020 of SA appeared, showing more misclassification of SA than NA. For PD aerosols, the volume size distribution (Figure 2b) showed a predominance of coarse-mode particles with an FMF of 0.30 and effective radius of 0.70 µm. The fraction of fine-mode particles of PD was higher than that for the DDM, which is aerosol mixed with dust with FMF of 0.58 and effective radius of 0.49 µm. Depolarization ratios, indicators of non-spherical aerosols, were 0.19 for DDM and 0.32 for PD, indicating that PD aerosol detected by the RF model reflects well the characteristics of that type even though only nine such types were detected. As reported in previous studies [53,54,55], the SSA of dust-containing aerosols (PD and DDM) tend to increase with increasing wavelength with positive dSSA440/1020 values usually being associated with the coarse mode particle (dust or mixtures of dust). The RF model also detects dust aerosols and aerosols mixed with dust well.
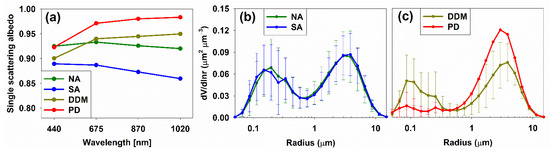
Figure 2.
(a) Spectral variation in single scattering albedo and mean volume size distributions for (b) pollution aerosols (NA and SA) and (c) DDM and PD types detected by the RF model. Abbreviations: NA, non-absorbing; SA, strongly absorbing; DDM, dust dominated mixed; PD, pure dust.
Table 2.
Average values of AERONET-derived aerosol properties classified by the RF model.
4. Characteristics of Aerosol Types in Asian Capital Cities
4.1. Frequency of Occurrence of Aerosol Types for 3 Years
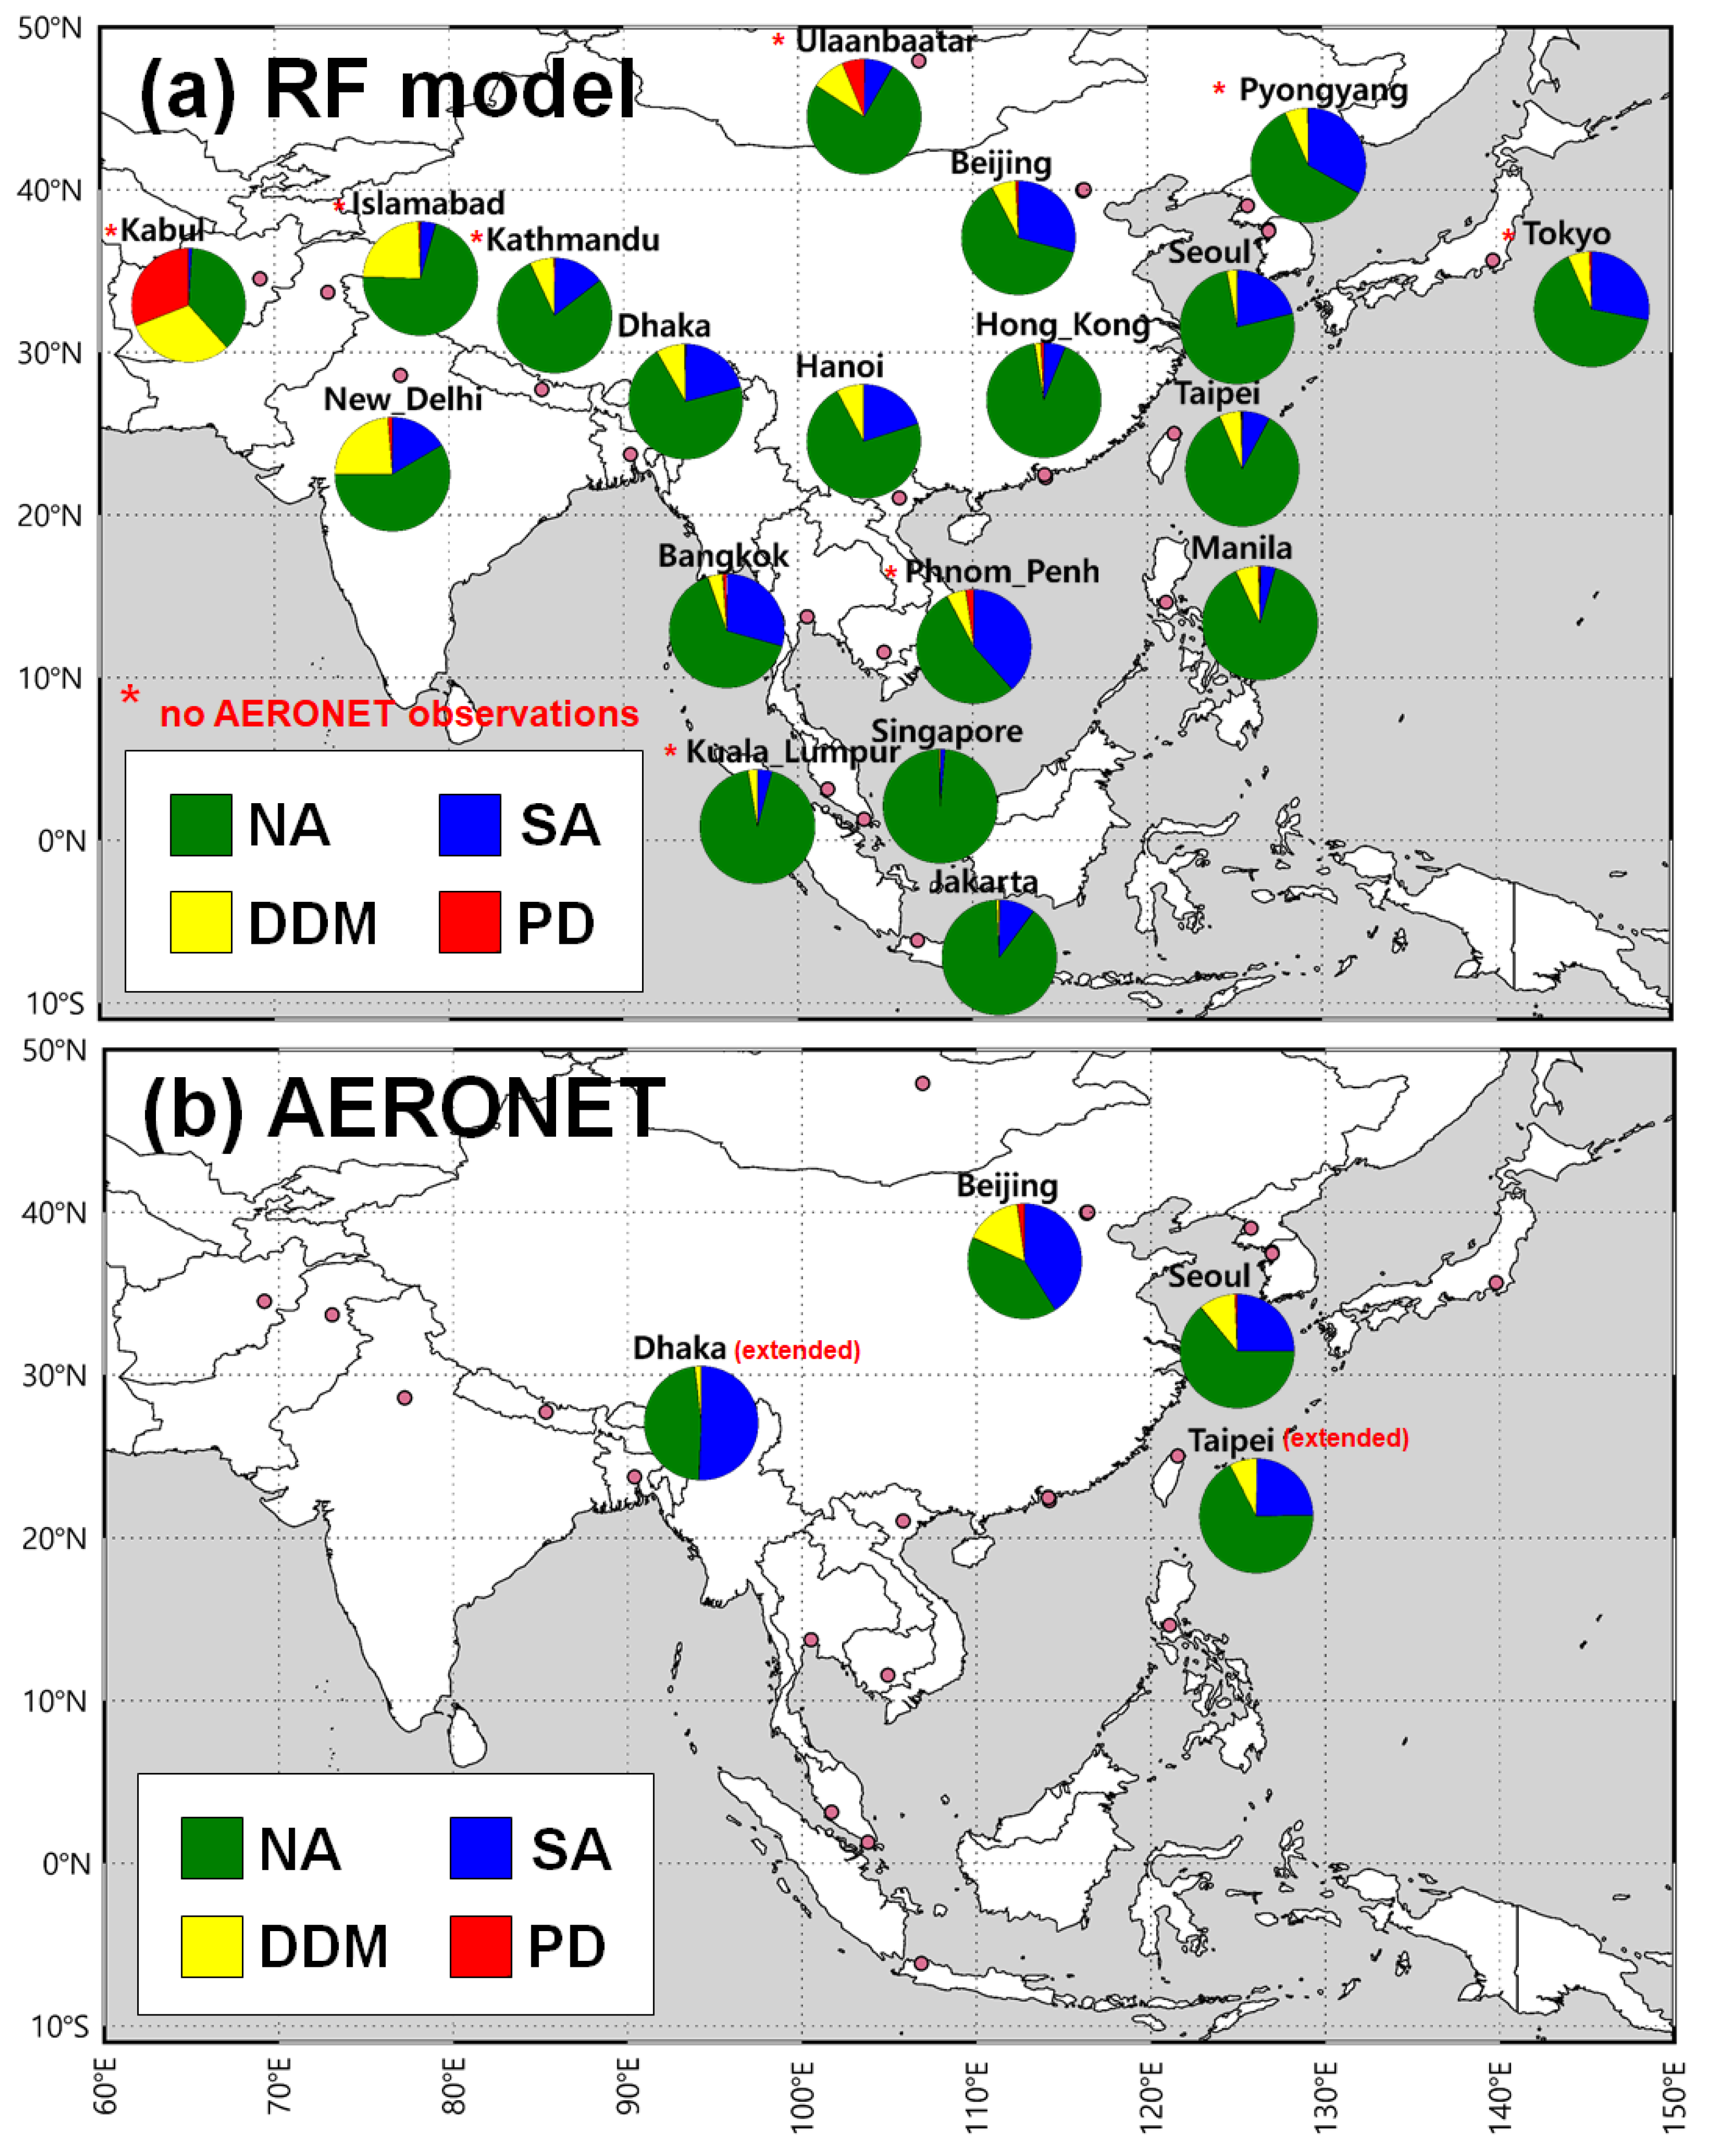
Over 19 capital cities of Asia, aerosol types were classified for a three-year period using the RF model and compared with those classified using the AERONET-based aerosol classification model [22] and two satellite threshold-based aerosol classification models [27,28]. Figure 3 and Figure 4 indicate the frequency distributions of aerosol-type detections in the capital cities, with the pie charts applying to cases with >200 detections. In the AERONET-based model, aerosol types were classified using AERONET data collected from near real time (13:00–14:00) of the TROPOMI overpass. Of the 11 capital cities with AERONET measurement sites, only Beijing (China; Beijing) and Seoul (Korea; Yonsei_University) had >200 detections. The time interval was extended to 12:00–15:00 to capture data for Dhaka (Bangladesh; Dhaka_University) and Taipei (Taiwan; Taipei_CWB).

Figure 3.
Pie charts showing aerosol-type detection proportions by (a) the RF model and (b) the AERONET-based model [22]. Abbreviations: NA, non-absorbing; SA, strongly absorbing; DDM, dust dominated mixed; PD, pure dust.
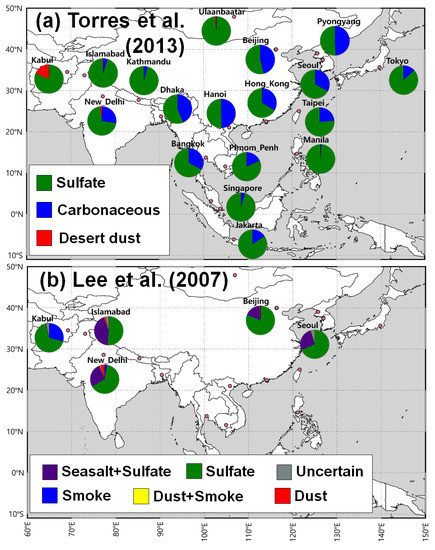
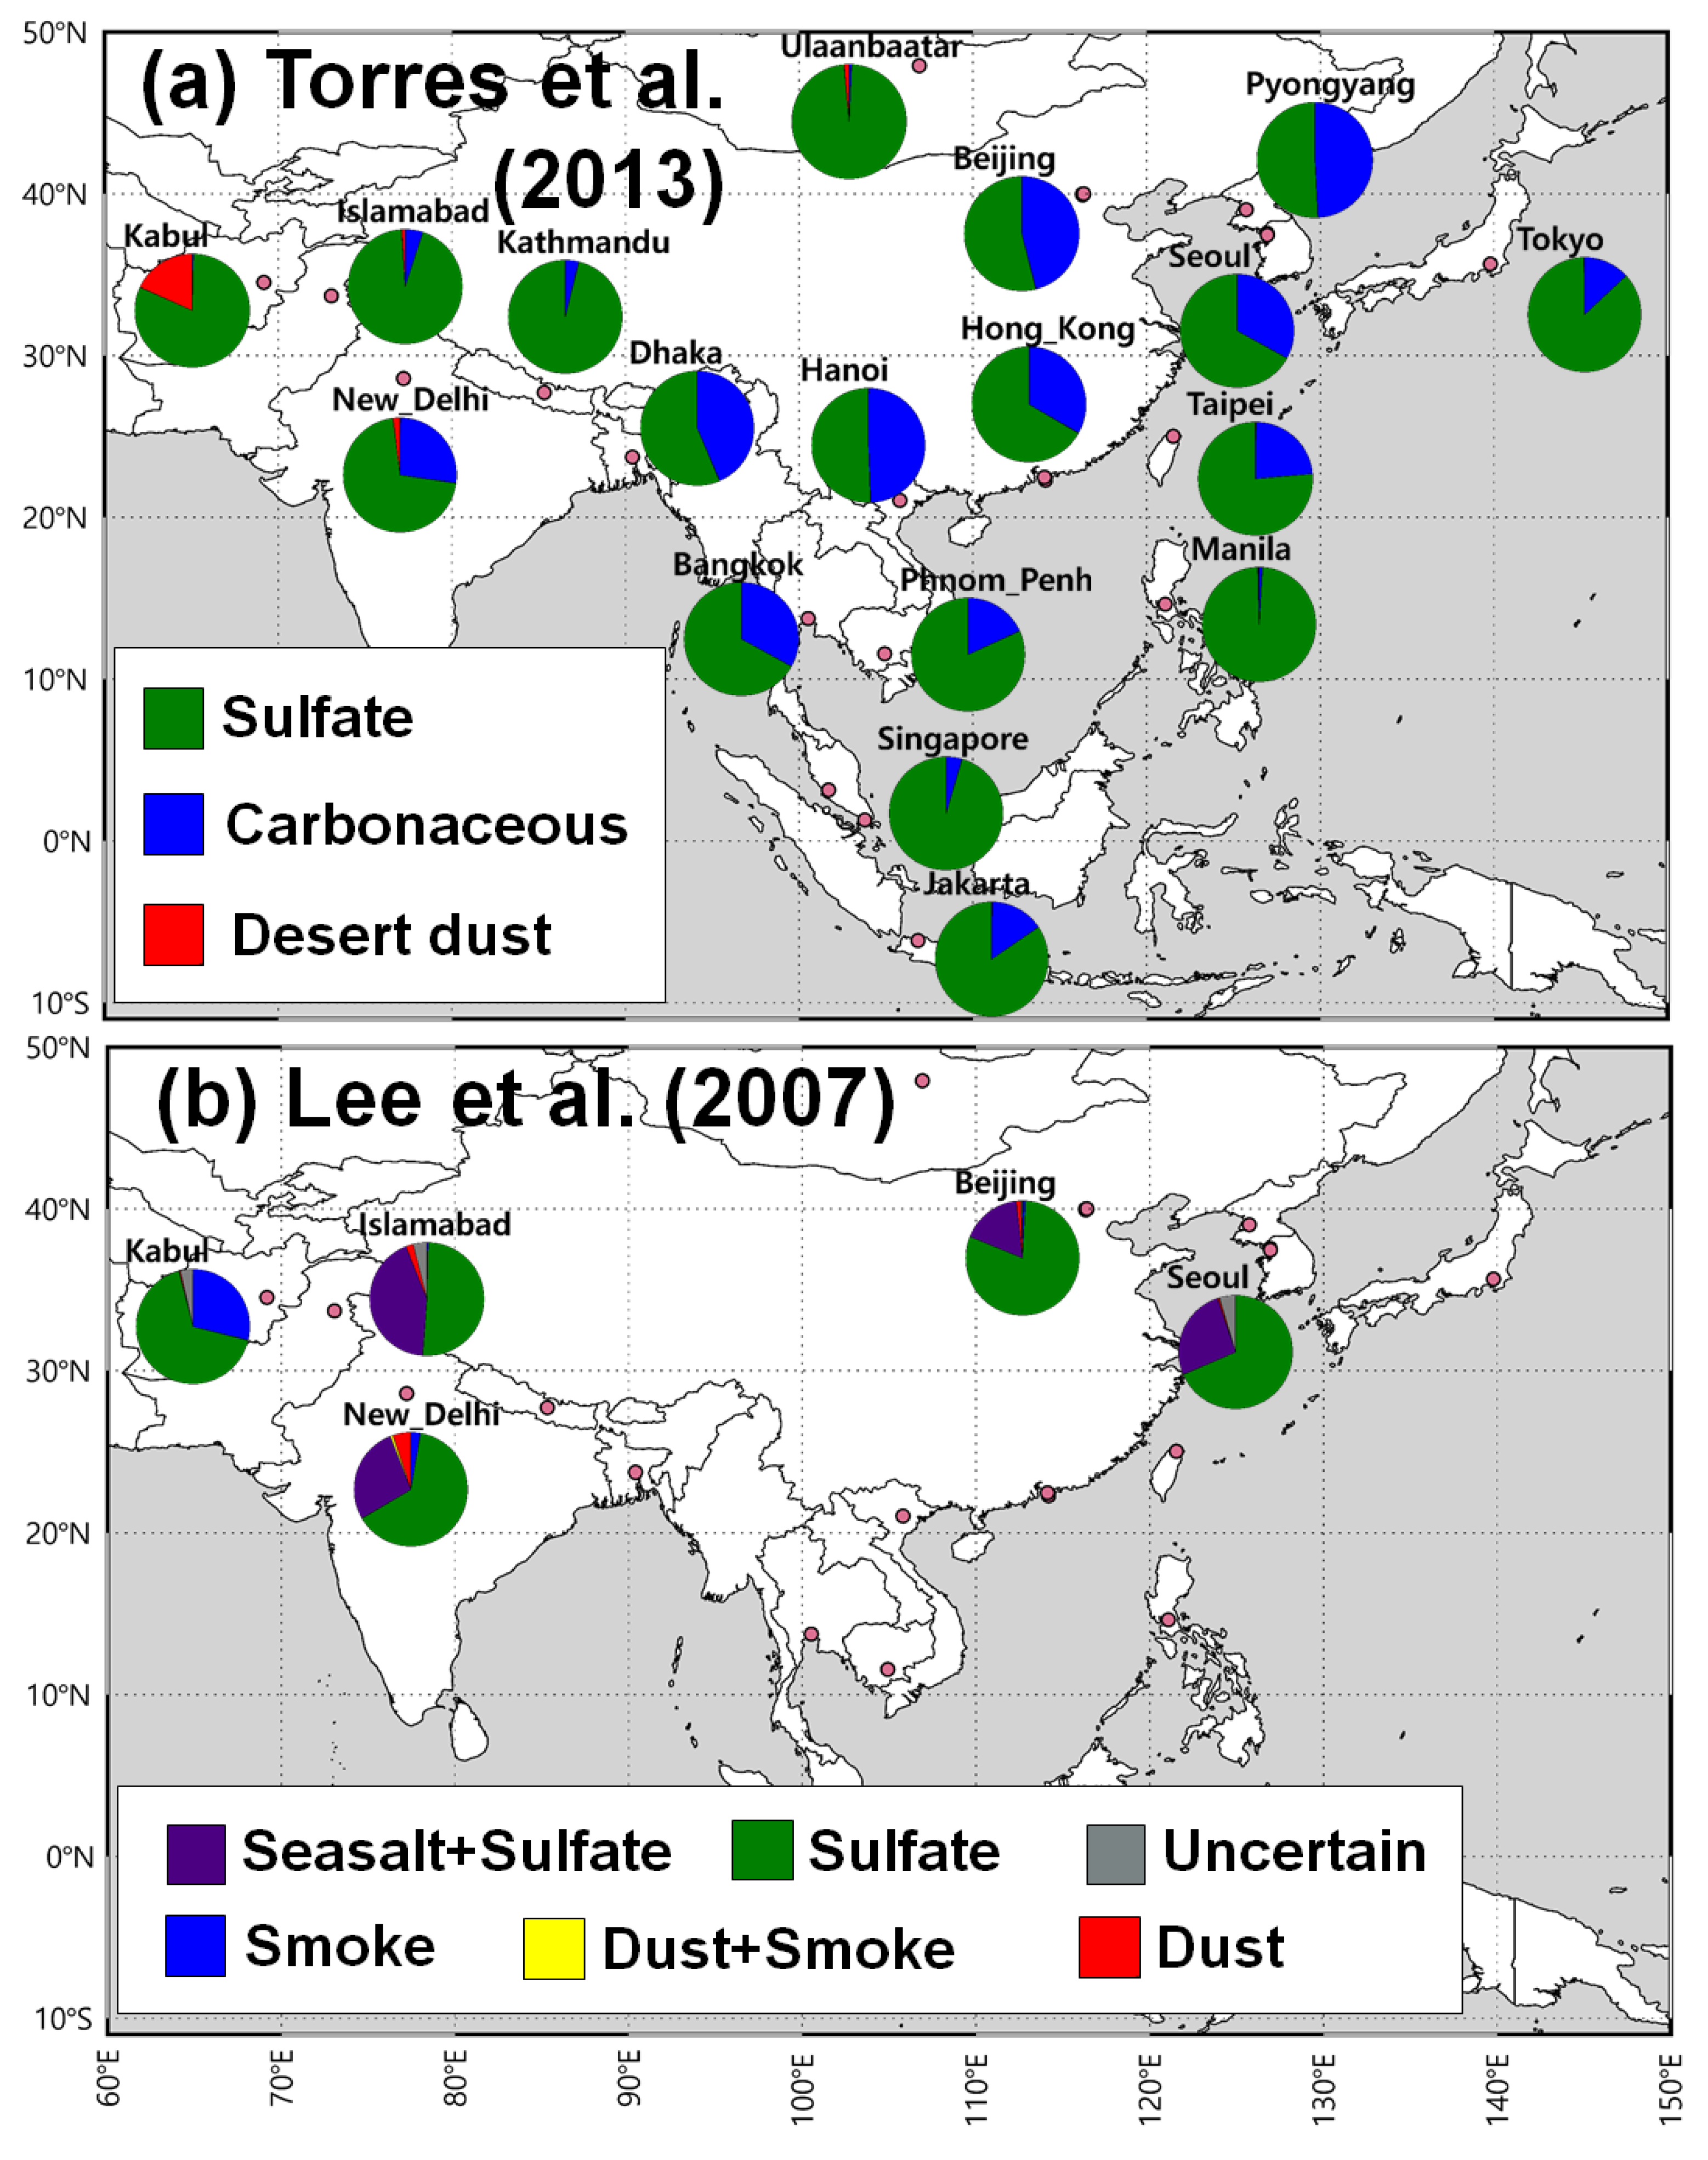
Figure 4.
Distributions of aerosol types detected by (a) Torres et al. [27] and (b) Lee et al. [26] in capital cities of Asia. Abbreviations: NA, non-absorbing; SA, strongly absorbing; DDM, dust dominated mixed; PD, pure dust.
Figure 3a shows the aerosol-type distribution for the 19 capital cities with populations of >1,000,000. In general, spherical aerosols (NA and SA) had a higher incidence than DDM and PD, except for Kabul, Afghanistan. The NA proportion was high in Singapore (98%) and that of SA was high in Phnom Penh, Cambodia (38%). The highest proportions of PD (31%) and DDM (31%) occurred in Kabul, Afghanistan, which is close to sources of dust aerosols. In East Asia, PD was rarely detected over capital cities except for Ulaanbaatar, Mongolia (12%). However, spherical aerosols (NA and SA) were also detected in Ulaanbaatar as reported in a previous study [56]. DDM was partly detected over East Asia with a range from 3 to 10%, which was affected by the transport of desert dust [57,58,59]. In Southeast Asia, proportions of SA (29%) in capital cities on the Indo-China peninsula (Hanoi, Bangkok, and Phnom Penh) were higher than those (5%) in Jakarta, Kuala Lumpur, Singapore, and Manila. It may be affected by biomass burning events in the Indo-China peninsula [60,61]. South Asia is reported to be affected by dust aerosols transported from West Asia [62] and deserts in South Asia [62,63]. The average proportion of dust-related aerosols (PD and DDM) in South Asia was calculated to be 25%, which is the higher proportion of dust-related aerosols in Southeast Asia (5%) and East Asia (7%).
Thus, the RF model reflects the influence of adjacent sources well. Figure 3b shows the aerosol-type distribution based on AERONET data. For Beijing and Seoul, which were classified using observation data for 13:00–14:00 local time, aerosol-type distributions were similar. Dhaka and Taipei involved AERONET data for 12:00–15:00 local time, and the RF model classified significantly fewer SA-type aerosols. This underestimation of the SA type may be caused by internal uncertainties in the RF model, as reported previously [31], and could be overcome by training the RF model with more data. As more AERONET observation data become available in the satellite observation period, it may be possible to compare and verify aerosol-type classifications at more AERONET stations in the future. However, the RF-based classification can be an alternative tool to classify aerosols in the regions where AERONET-based classification is not possible due to the lack of an AERONET observatory such as Tokyo, Ulaanbaatar, Pyongyang (East Asia), Kabul, Kathmandu, Islamabad (South Asia), Phnom Penh, or Kuala Lumpur (Southeast Asia).
Aerosol-type classifications for Asian capital cities from threshold-based satellite models [27,28] are shown in Figure 4 (with >200 classifications). Aerosol types were classified into three types (sulfate, carbonaceous, and desert dust) by Torres et al. [27] in 18 capital cities (Figure 4a) and classified into six types (smoke, sulfate, dust, sea salt and sulfate, dust and smoke, and uncertain) by Lee et al. [26] for Beijing, Seoul, Islamabad, Kabul, and New Delhi (Figure 4b). In general, both satellite models also detected non-absorbing aerosols with high occurrence rates in all capital cities. There were high contributions of carbonaceous aerosol (strongly absorbing fine mode aerosol) detected by Torres et al. [27] in Pyongyang (49%), Dhaka (44%), and Beijing (46%). Moreover, the contribution of carbonaceous aerosol detected by Torres et al. [27] was found to be similar to the AERONET-based aerosol type (Figure 3b) in Dhaka and Taipei. Torres et al. [27] also detected dust aerosol with a maximum occurrence rate (20%) in Kabul among other capital cities while Lee et al. [26] classified smoke (strongly absorbing fine mode aerosol) aerosol in Kabul with a high occurrence rate of 29%.
4.2. Seasonal Variations in Aerosol Type
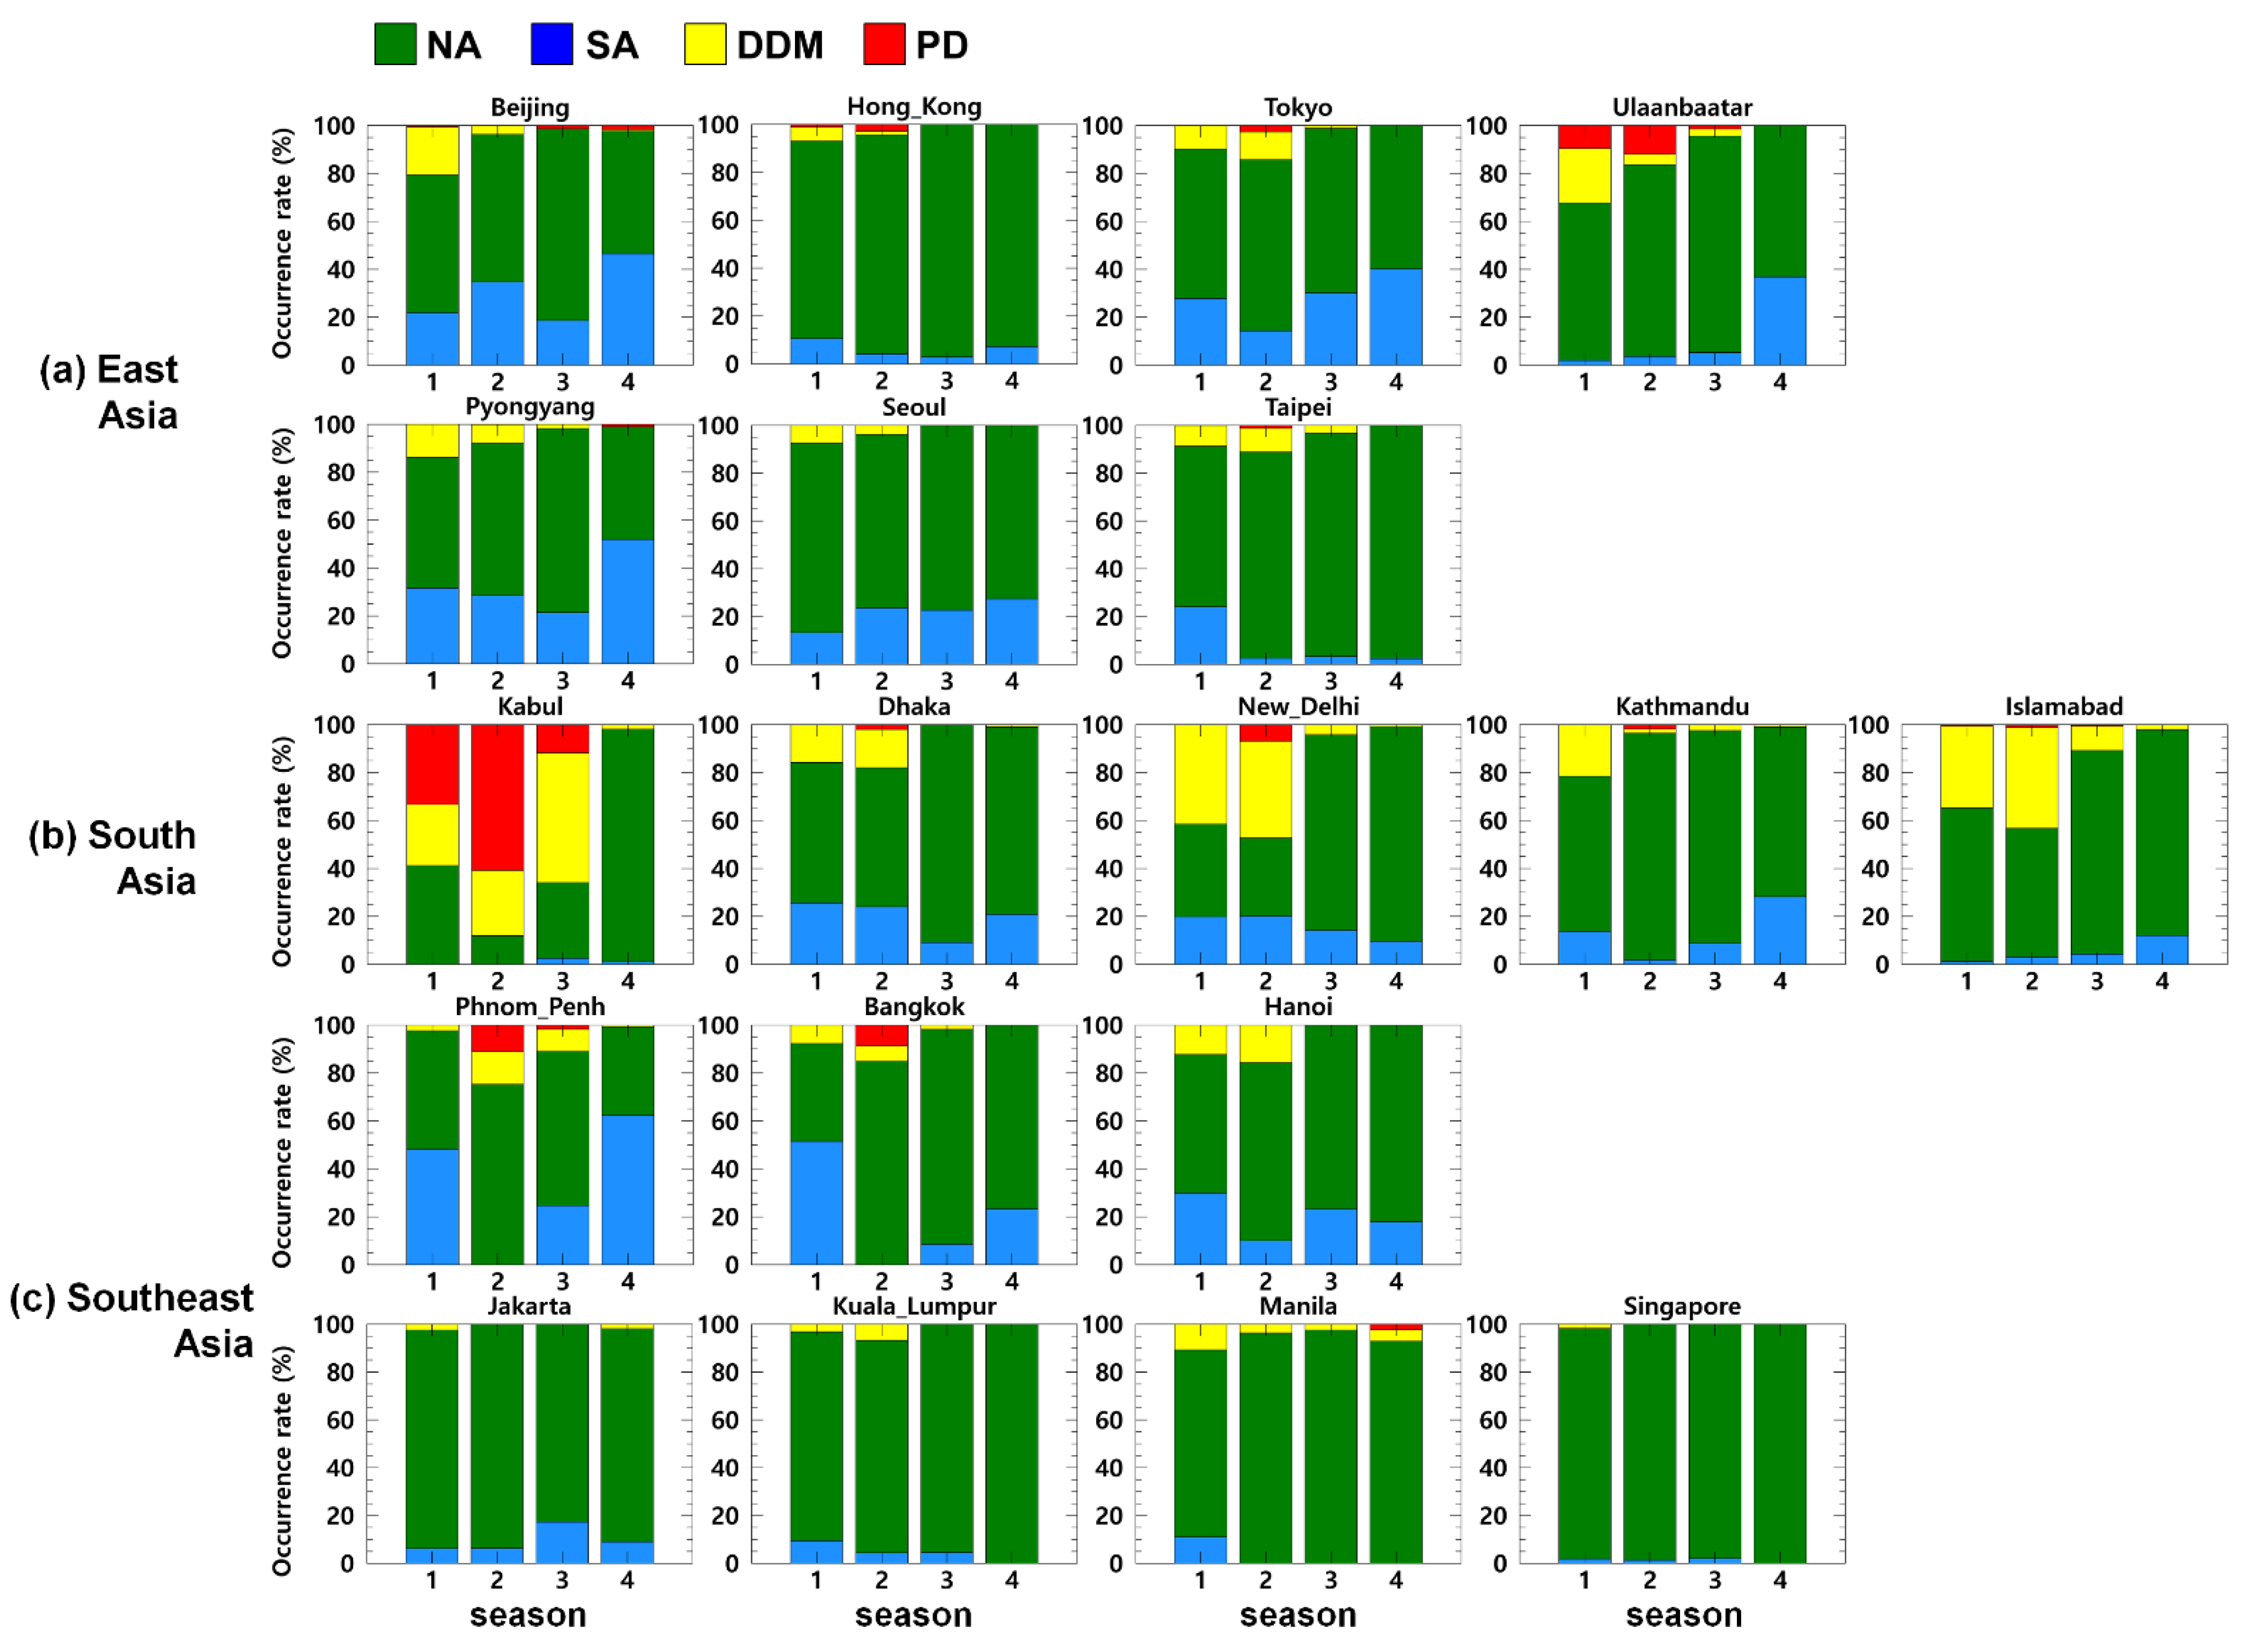
The aerosol-type occurrence rate was calculated seasonally in the capital cities of East Asia, South Asia, and Southeast Asia (Figure 5). For the seasonal variation, four seasons were labeled as season 1, season 2, season 3, and season 4, respectively, because there are different ways to divide the four seasons: South Asia and Southeast Asia (pre-monsoon, monsoon, post-monsoon, and winter), East Asia (spring, summer, autumn, and winter). As reported in earlier study [22], pollution particles (NA and SA) are predominant in East Asia with the NA type occurring frequently throughout all seasons, and NA being the most prevalent in Hong Kong and Taipei, possibly due to large contributions of maritime aerosol, which is strongly light-scattering and highly hygroscopic (Figure 5a). Contributions of the SA type usually peak in season 4 (winter), likely due to increased coal combustion for domestic heating [22]. Over East Asia, the DDM and PD types are usually more prevalent in season 1 (March–May, spring), especially in Ulaanbaatar where the occurrence rate of pure dust and dust mixed with pollution aerosols (PD and DDM) peaked at 32%. Contributions of PD were <3% in capital cities except for Ulaanbaatar (12%) near desert regions. Besides Ulaanbaatar, a higher DDM (20%) type was detected in Beijing in season 1 (March–May, spring) due to the Yellow wind phenomenon in the area [57]. Seasonal aerosol-type occurrence rates in South Asia are shown in Figure 5b. Overall, there were fewer SA and more DDM and PD detections than in East Asia. Dust-containing (DDM and PD) aerosols were usually detected from season 1 to season 2 (March–August, spring–summer). As reported in previous studies, dust aerosols are usually transported during the pre-monsoon (season 1) and South Asian monsoon (season 2) [64,65]. Dust-dominated aerosols were more frequently identified in Kabul than in other capital cities during season 1–season 3 (March–November), with a PD contribution of >50% in season 2 (June–August, South Asian monsoon), likely due to the effect of desert regions [64,65]. From season 3 to season 4 (September–February), contributions of dust aerosol were significantly lower than those of pollution aerosol (SA and NA). In Southeast Asia (Figure 5c) overall, the contribution of NA was predominant, possibly due to maritime aerosols, as these cities are located near the coast. The NA type includes both anthropogenic and marine aerosols [20]. In capital cities of the Indo-china Peninsula (Phnom Penh, Bangkok, and Hanoi), contributions of SA were generally at their maximum in season 1 (March–May, pre-monsoon) and minimum in season 2 (June–August, Southeast Asian monsoon) due to the seasonality of biomass burning activity as reported in previous studies [66,67]. There was negligible seasonality in Jakarta, Kuala Lumpur, Manila, and Singapore with an average proportion of NA of 98%.
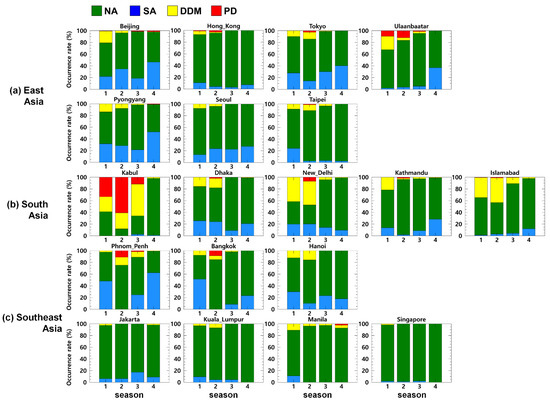
Figure 5.
Seasonal occurrence rates for aerosol types detected by the RF model in (a) East Asia, (b) South Asia, and (c) Southeast Asia for season 1 (March–May), season 2 (June–August), season 3 (September–November), and season 4 (December–February).
5. Discussion
Aerosol types in 19 Asian capital cities were identified using a previously developed satellite aerosol-classification algorithm [31] and aerosol optical and microphysical properties investigated for aerosol types detected using an RF model for Asian cities where AERONET sites are located. For cities (e.g., Kabul and Ulaanbaatar) near desert regions, the predominant type was dust aerosol. Dust aerosols were generally mixed with anthropogenic aerosols in many capital cities and detected as the DDM type. In Kabul, the contribution of PD was the highest (>50%) in South Asian monsoon, but the NA type was predominant in most cities. Aerosol types classified by the RF model were compared with those of AERONET and satellite classification models, with those of the RF method generally exhibiting trends similar to those of AERONET-based aerosol types. The other satellite-based classification algorithm [27] seems to classify SA aerosols similarly to AERONET. Seasonal variations in aerosol type detected using the RF model were investigated for capital cities in East Asia, South Asia, and Southeast Asia. NA was the predominant type in most cities and seasons. In East Asia, the dust aerosol (PD and DDM) incidence increased in spring, and the SA type was highest in winter, likely due to increased coal combustion for domestic heating [22]. In particular, a high proportion of DDM was detected in Beijing due to the Yellow wind phenomenon in the area [57]. In South Asia, dust aerosols (PD and DDM) increased between the pre-monsoon and monsoon seasons (March–August) [64,65], while in Southeast Asia NA was generally much more predominant than any seasonal changes.
6. Conclusions
In this work, aerosol types were classified using the RF model over Asian capital cities for a three-year period. Aerosol properties for each aerosol type were found to be reasonable, showing similar aerosol properties for the typical aerosol type. The globally trained RF model seems to be appropriate for use in Asian cities. This study demonstrated that the RF model can be used to provide aerosol type information with spatially continuous coverage even where there are no AERONET sites. Long-term results of satellite-based aerosol classification methods may be useful in providing climatological input data in the future. Aerosol detections here were relevant to near satellite overpass time (13:30), and if satellite observation data at a range of times were applied to the RF algorithm, it may be possible to extend its temporal coverage. For example, geostationary observations can provide information for trace gases and aerosols with high temporal resolution. Moreover, a combination of satellite-based measurement data, numerical weather prediction models, and chemical transport models should improve the accuracy of the RF model.
Author Contributions
Conceptualization, H.L.; methodology, W.C.; writing—original draft preparation, W.C.; writing—review and editing, H.L.; investigation, W.C., H.K. and D.S. All authors have read and agreed to the published version of the manuscript.
Funding
This work was supported by the National Research Foundation of Korea (NRF) grant funded by the Korea government (MSIP) (No. 2021R1I1A1A01061233).
Institutional Review Board Statement
Not applicable.
Informed Consent Statement
Not applicable.
Data Availability Statement
For the results and data generated during the study, please contact the first author.
Acknowledgments
The authors would like to thank the U.S. NASA for providing MODIS Collection 6.1 aerosol product and AERONET data. We also thank ESA for making possible the distribution of TROPOMI data. This work was performed within the framework of the Sentinel 5P Calibration & Validation (S5P Cal/Val) Project.
Conflicts of Interest
The authors declare no conflict of interest.
References
- Hamill, P.; Giordano, M.; Ward, C.; Giles, D.; Holben, B. An AERONET-based aerosol classification using the Mahalanobis distance. Atmos. Environ. 2016, 140, 213–233. [Google Scholar] [CrossRef]
- Giles, D.M.; Holben, B.N.; Eck, T.F.; Sinyuk, A.; Smirnov, A.; Slutsker, I.; Dickerson, R.R.; Thompson, A.M.; Schafer, J.S. An analysis of AERONET aerosol absorption properties and classifications representative of aerosol source regions. J. Geophys. Res. Atmos. 2012, 117. [Google Scholar] [CrossRef] [Green Version]
- Perrone, M.R.; Romano, S.; Orza, J. Particle optical properties at a Central Mediterranean site: Impact of advection routes and local meteorology. Atmos. Res. 2014, 145, 152–167. [Google Scholar] [CrossRef]
- Schmeisser, L.; Andrews, E.; Ogren, J.A.; Sheridan, P.; Jefferson, A.; Sharma, S.; Kim, J.E.; Sherman, J.P.; Sorribas, M.; Kalapov, I.; et al. Classifying aerosol type using in situ surface spectral aerosol optical properties. Atmos. Chem. Phys. 2017, 17, 12097–12120. [Google Scholar] [CrossRef] [Green Version]
- Charlson, R.J.; Schwartz, S.; Hales, J.; Cess, R.D.; Coakley, J.J.; Hansen, J.; Hofmann, D. Climate forcing by anthropogenic aerosols. Science 1992, 255, 423–430. [Google Scholar] [CrossRef] [PubMed]
- Christopher, S.A.; Zhang, J. Daytime variation of shortwave direct radiative forcing of biomass burning aerosols from GOES-8 imager. J. Atmos. Sci. 2002, 59, 681–691. [Google Scholar] [CrossRef] [Green Version]
- Procopio, A.S.; Artaxo, P.; Kaufman, Y.J.; Remer, L.A.; Schafer, J.S.; Holben, B.N. Multiyear analysis of amazonian biomass burning smoke radiative forcing of climate. Geophys. Res. Lett. 2004, 31, L03108. [Google Scholar] [CrossRef]
- García, O.E.; Díaz, J.P.; Expósito, F.J.; Díaz, A.M.; Dubovik, O.; Derimian, Y.; Roger, J.C. Shortwave radiative forcing and efficiency of key aerosol types using AERONET data. Atmos. Chem. Phys. 2012, 12, 5129–5145. [Google Scholar] [CrossRef] [Green Version]
- Remer, L.A.; Kaufman, Y.; Tanré, D.; Mattoo, S.; Chu, D.; Martins, J.V.; Li, R.-R.; Ichoku, C.; Levy, R.; Kleidman, R. The MODIS aerosol algorithm, products, and validation. J. Atmos. Sci. 2005, 62, 947–973. [Google Scholar] [CrossRef] [Green Version]
- Levy, R.C.; Mattoo, S.; Munchak, L.A.; Remer, L.A.; Sayer, A.M.; Patadia, F.; Hsu, N.C. The Collection 6 MODIS aerosol products over land and ocean. Atmos. Meas. Tech. 2013, 6, 2989–3034. [Google Scholar] [CrossRef] [Green Version]
- Myhre, G.; Samset, B.H.; Schulz, M.; Balkanski, Y.; Bauer, S.; Berntsen, T.K.; Bian, H.; Bellouin, N.; Chin, M.; Diehl, T.; et al. Radiative forcing of the direct aerosol effect from AeroCom Phase II simulations. Atmos. Chem. Phys. 2012, 13, 1853–1877. [Google Scholar] [CrossRef] [Green Version]
- Myriokefalitakis, S.; Daskalakis, N.; Gkouvousis, A.; Hilboll, A.; van Noije, T.; Williams, J.E.; Le Sager, P.; Huijnen, V.; Houweling, S.; Bergman, T.; et al. Description and evaluation of a detailed gas-phase chemistry scheme in the TM5-MP global chemistry transport model (r112). Geosci. Model Dev. 2020, 13, 5507–5548. [Google Scholar] [CrossRef]
- Gobbi, G.P.; Kaufman, Y.J.; Koren, I.; Eck, T.F. Classification of aerosol properties derived from AERONET direct sun data. Atmos. Chem. Phys. 2007, 7, 453–458. [Google Scholar] [CrossRef] [Green Version]
- Omar, A.H.; Won, J.G.; Winker, D.M.; Yoon, S.C.; Dubovik, O.; McCormick, M.P. Development of global aerosol models using cluster analysis of Aerosol Robotic Network (AERONET) measurements. J. Geophys. Res. Atmos. 2005, 110. [Google Scholar] [CrossRef]
- Mukai, S.; Nishina, M.; Sano, I.; Mukai, M.; Iguchi, N.; Mizobuchi, S. Suspended particulate matter sampling at an urban AERONET site in Japan, part 1: Clustering analysis of aerosols. J. Appl. Remote Sens. 2007, 1, 013518. [Google Scholar] [CrossRef]
- Alam, K.; Shaheen, K.; Blaschke, T.; Chishtie, F.; Khan, H.U.; Haq, B.S. Classification of aerosols in an urban environment on the basis of optical measurements. Aerosol Air Qual. Res. 2016, 16, 2535–2549. [Google Scholar] [CrossRef] [Green Version]
- Lee, J.; Kim, J.; Song, C.H.; Kim, S.B.; Chun, Y.; Sohn, B.J.; Holben, B.N. Characteristics of aerosol types from AERONET sunphotometer measurements. Atmos. Environ. 2010, 44, 3110–3117. [Google Scholar] [CrossRef]
- Tan, F.; San Lim, H.; Abdullah, K.; Yoon, T.L.; Holben, B. AERONET data–based determination of aerosol types. Atmos. Poll. Res. 2015, 6, 682–695. [Google Scholar] [CrossRef] [Green Version]
- Zheng, C.; Zhao, C.; Zhu, Y.; Wang, Y.; Shi, X.; Wu, X.; Qiu, Y. Analysis of influential factors for the relationship between PM 2.5 and AOD in Beijing. Atmos. Chem. Phys. 2017, 17, 13473–13489. [Google Scholar] [CrossRef] [Green Version]
- Logothetis, A.; Salamalikis, V.; Kazantzidis, A. Aerosol classification in Europe, Middle East, North Africa and Arabian Peninsula based on AERONET version 3. Atmos. Res. 2020, 239, 104893. [Google Scholar] [CrossRef]
- Ali, M.A.; Nichol, J.E.; Bilal, M.; Qiu, Z.; Mazhar, U.; Wahiduzzaman, M.; Almazroui, M.; Islam, M.N. Classification of aerosols over Saudi Arabia from 2004–2016. Atmos. Environ. 2020, 241, 117785. [Google Scholar] [CrossRef]
- Shin, S.K.; Tesche, M.; Noh, Y.; Müller, D. Aerosol-type classification based on AERONET version 3 inversion products. Atmos. Meas. Tech. 2019, 12, 3789–3803. [Google Scholar] [CrossRef] [Green Version]
- Higurashi, A.; Nakajima, T. Detection of aerosol types over the East China Sea near Japan from four-channel satellite data. Geophys. Res. Lett. 2002, 29, 17-1–17-4. [Google Scholar] [CrossRef]
- Jeong, M.J.; Li, Z. Quality, compatibility, and synergy analyses of global aerosol products derived from the advanced very high resolution radiometer and Total Ozone Mapping Spectrometer. J. Geophys. Res. Atmos. 2005, 110. [Google Scholar] [CrossRef] [Green Version]
- Kim, J.; Lee, J.; Lee, H.C.; Higurashi, A.; Takemura, T.; Song, C.H. Consistency of the aerosol type classification from satellite remote sensing during the Atmospheric Brown Cloud–East Asia Regional Experiment campaign. J. Geophys. Res. Atmos. 2007, 112. [Google Scholar] [CrossRef]
- Lee, J.; Kim, J.; Lee, H.C.; Takemura, T. Classification of aerosol type from MODIS and OMI over East Asia. Asia-Pac. J. Atmos. Sci. 2007, 43, 343–357. [Google Scholar]
- Torres, O.; Ahn, C.; Chen, Z. Improvements to the OMI near-UV aerosol algorithm using A-train CALIOP and AIRS observations. Atmos. Meas. Tech. 2013, 6, 3257–3270. [Google Scholar] [CrossRef] [Green Version]
- Penning de Vries, M.; Beirle, S.; Hörmann, C.; Kaiser, J.; Stammes, P.; Tilstra, L.; Wagner, T. A global aerosol classification algorithm incorporating multiple satellite data sets of aerosol and trace gas abundances. Atmos. Chem. Phys. 2015, 15, 10597–10618. [Google Scholar] [CrossRef] [Green Version]
- Mao, Q.; Huang, C.; Chen, Q.; Zhang, H.; Yuan, Y. Satellite-based identification of aerosol particle species using a 2D-space aerosol classification model. Atmos. Environ. 2019, 219, 117057. [Google Scholar] [CrossRef]
- Choi, W.; Lee, H.; Park, J. A first approach to aerosol classification using space-borne measurement data: Machine learning-based algorithm and evaluation. Remote Sens. 2021, 13, 609. [Google Scholar] [CrossRef]
- Choi, W.; Lee, H.; Kim, D.; Kim, S. Improving spatial coverage of satellite aerosol classification using a random forest model. Remote Sens. 2021, 13, 1268. [Google Scholar] [CrossRef]
- Iwasaka, Y.; Shibata, T.; Nagatani, T.; Shi, G.Y.; Kim, Y.S.; Matsuki, A.; Trochkine, D.; Zhang, D.; Yamada, M.; Nagatani, M.; et al. Large depolarization ratio of free tropospheric aerosols over the Taklamakan Desert revealed by lidar measurements: Possible diffusion and transport of dust particles. J. Geophys. Res. Atmos. 2003, 108, ACE20-1–ACE20-8. [Google Scholar] [CrossRef]
- Chinnam, N.; Dey, S.; Tripathi, S.N.; Sharma, M. Dust events in Kanpur, northern India: Chemical evidence for source and implications to radiative forcing. Geophys. Res. Lett. 2006, 33. [Google Scholar] [CrossRef]
- Jugder, D.; Shinoda, M.; Sugimoto, N.; Matsui, I.; Nishikawa, M.; Park, S.U.; Chun, Y.S.; Park, M.S. Spatial and temporal variations of dust concentrations in the gobi desert of Mongolia. Glob. Planet. Chang. 2011, 78, 14–22. [Google Scholar] [CrossRef]
- Jadoon, W.A.; Khpalwak, W.; Chidya, R.C.G.; Abdel-Dayem, S.M.M.A.; Takeda, K.; Makhdoom, M.A.; Sakugawa, H. Evaluation of levels, sources and health hazards of road-dust associated toxic metals in Jalalabad and Kabul cities, Afghanistan. Arch. Environ. Contam. Toxicol. 2018, 74, 32–45. [Google Scholar] [CrossRef]
- Engling, G.; Zhang, Y.N.; Chan, C.Y.; Sang, X.F.; Lin, M.; Ho, K.F.; Lee, J.J. Characterization and sources of aerosol particles over the southeastern Tibetan Plateau during the Southeast Asia biomass-burning season. Tellus B Chem. Phys. Meteorol. 2011, 63, 117–128. [Google Scholar] [CrossRef]
- Huang, K.; Fu, J.S.; Hsu, N.C.; Gao, Y.; Dong, X.; Tsay, S.C.; Lam, Y.F. Impact assessment of biomass burning on air quality in Southeast and East Asia during BASE-ASIA. Atmos. Environ. 2013, 78, 291–302. [Google Scholar] [CrossRef] [Green Version]
- Shi, S.; Cheng, T.; Gu, X.; Guo, H.; Wu, Y.; Wang, Y.; Zuo, X. Probing the dynamic characteristics of aerosol originated from South Asia biomass burning using POLDER/GRASP satellite data with relevant accessory technique design. Environ. Int. 2020, 145, 106097. [Google Scholar] [CrossRef]
- Salam, A.; Bauer, H.; Kassin, K.; Ullah, S.M.; Puxbaum, H. Aerosol chemical characteristics of a mega-city in Southeast Asia (Dhaka–Bangladesh). Atmos. Environ. 2003, 37, 2517–2528. [Google Scholar] [CrossRef]
- Carmichael, G.R.; Adhikary, B.; Kulkarni, S.; D’Allura, A.; Tang, Y.; Streets, D.; Zhang, Q.; Bond, T.C.; Ramanathan, V.; Jamroensan, A.; et al. Asian aerosols: Current and year 2030 distributions and implications to human health and regional climate change. Environ. Sci. Technol. 2009, 43, 5811–5817. [Google Scholar] [CrossRef]
- Dutkiewicz, V.A.; Alvi, S.; Ghauri, B.M.; Choudhary, M.I.; Husain, L. Black carbon aerosols in urban air in South Asia. Atmos. Environ. 2009, 43, 1737–1744. [Google Scholar] [CrossRef]
- Saikawa, E.; Naik, V.; Horowitz, L.W.; Liu, J.; Mauzerall, D.L. Present and potential future contributions of sulfate, black and organic carbon aerosols from China to global air quality, premature mortality and radiative forcing. Atmos. Environ. 2009, 43, 2814–2822. [Google Scholar] [CrossRef]
- Pandithurai, G.; Dipu, S.; Dani, K.K.; Tiwari, S.; Bisht, D.S.; Devara, P.C.S.; Pinker, R.T. Aerosol radiative forcing during dust events over New Delhi, India. J. Geophys. Res. Atmos. 2008, 113. [Google Scholar] [CrossRef]
- Kim, S.W.; Yoon, S.C.; Kim, J.; Kang, J.Y.; Sugimoto, N. Asian dust event observed in Seoul, Korea, during 29–31 May 2008: Analysis of transport and vertical distribution of dust particles from lidar and surface measurements. Sci. Total Environ. 2010, 408, 1707–1718. [Google Scholar] [CrossRef]
- Braun, R.A.; Aghdam, M.A.; Bañaga, P.A.; Betito, G.; Cambaliza, M.O.; Cruz, M.T.; Sorooshian, A. Long-range aerosol transport and impacts on size-resolved aerosol composition in Metro Manila, Philippines. Atmos. Chem. Phys. 2020, 20, 2387–2405. [Google Scholar] [CrossRef] [Green Version]
- Dejchanchaiwong, R.; Tekasakul, P.; Tekasakul, S.; Phairuang, W.; Nim, N.; Sresawasd, C.; Suwattiga, P. Impact of transport of fine and ultrafine particles from open biomass burning on air quality during 2019 Bangkok haze episode. J. Environ. Sci. 2020, 97, 149–161. [Google Scholar] [CrossRef]
- Breiman, L. Random forests. Mach. Learn. 2001, 45, 5–32. [Google Scholar] [CrossRef] [Green Version]
- United Nations. World Urbanization Prospects: The 2018 Revision, online ed.; United Nations: New York, NY, USA, 2019. [Google Scholar]
- Theys, N.; Smedt, I.D.; Yu, H.; Danckaert, T.; Gent, J.V.; Hörmann, C.; Wagner, T.; Hedelt, P.; Bauer, H.; Romahn, F. Sulfur dioxide retrievals from TROPOMI onboard Sentinel-5 Precursor: Algorithm theoretical basis. Atmos. Meas. Tech. 2017, 10, 119–153. [Google Scholar] [CrossRef] [Green Version]
- Lambert, J.; Compernolle, S.; Eichmann, K.; de Graaf, M.; Hubert, D.; Keppens, A.; Kleipool, Q.; Langerock, B.; Sha, M.; Verhoelst, T. Quarterly Validation Report of the Copernicus Sentinel-5 Precursor Operational Data Products# 06: April 2018–February 2020; Belgian Institute for Space Aeronomy: Uccle, Belgium, 2020. [Google Scholar]
- Van Geffen, J.; Eskes, H.; Boersma, K.; Maasakkers, J.; Veefkind, J. TROPOMI ATBD of the Total and Tropospheric NO2 Data Products; KNMI: De Bilt, The Netherlands, 2019. [Google Scholar]
- Noh, Y.; Müller, D.; Lee, K.; Kim, K.; Lee, K.; Shimizu, A.; Sano, I.; Park, C.B. Depolarization ratios retrieved by AERONET sun–sky radiometer data and comparison to depolarization ratios measured with lidar. Atmos. Chem. Phys. 2017, 17, 6271–6290. [Google Scholar] [CrossRef] [Green Version]
- Costabile, F.; Barnaba, F.; Angelini, F.; Gobbi, G.P. Identification of key aerosol populations through their size and composition resolved spectral scattering and absorption. Atmos. Chem. Phys. 2013, 13, 2455–2470. [Google Scholar] [CrossRef] [Green Version]
- Li, J.; Carlson, B.E.; Lacis, A.A. Using single-scattering albedo spectral curvature to characterize East Asian aerosol mixtures. J. Geophys. Res. Atmos. 2015, 120, 2037–2052. [Google Scholar] [CrossRef]
- Kaskaoutis, D.; Kambezidis, H. Comparison of the Ångström parameters retrieval in different spectral ranges with the use of different techniques. Meteorol. Atmos. Phys. 2008, 99, 233–246. [Google Scholar] [CrossRef]
- Davy, P.K.; Gunchin, G.; Markwitz, A.; Trompetter, W.J.; Barry, B.J.; Shagjjamba, D.; Lodoysamba, S. Air particulate matter pollution in Ulaanbaatar, Mongolia: Determination of composition, source contributions and source locations. Atmos. Poll. Res. 2011, 2, 126–137. [Google Scholar] [CrossRef] [Green Version]
- Ai, N.; Polenske, K.R. Socioeconomic impact analysis of yellow-dust storms: An approach and case study for Beijing. Econ. Syst. Res. 2008, 20, 187–203. [Google Scholar] [CrossRef]
- Wang, S.H.; Tsay, S.C.; Lin, N.H.; Hsu, N.C.; Bell, S.W.; Li, C.; Ji, Q.; Jeong, M.J.; Hansell, M.A.; Welton, E.J.; et al. First detailed observations of long-range transported dust over the northern South China Sea. Atmos. Environ. 2011, 45, 4804–4808. [Google Scholar] [CrossRef]
- Sugimoto, N.; Hara, Y.; Shimizu, A.; Yumimoto, K.; Uno, I.; Nishikawa, M. Comparison of surface observations and a regional dust transport model assimilated with lidar network data in Asian dust event of March 29 to April 2, 2007. Sola 2011, 7, 13–16. [Google Scholar] [CrossRef] [Green Version]
- Chuang, M.T.; Chou, C.C.K.; Sopajaree, K.; Lin, N.H.; Wang, J.L.; Sheu, G.R.; Chang, Y.J.; Lee, C.T. Characterization of aerosol chemical properties from near-source biomass burning in the northern Indochina during 7-SEAS/Dongsha experiment. Atmos. Environ. 2013, 78, 72–81. [Google Scholar] [CrossRef]
- Yadav, I.C.; Devi, N.L.; Li, J.; Syed, J.H.; Zhang, G.; Watanabe, H. Biomass burning in Indo-China peninsula and its impacts on regional air quality and global climate change-a review. Environ. Poll. 2017, 227, 414–427. [Google Scholar] [CrossRef]
- Middleton, N.J. A geography of dust storms in South-west Asia. J. Climatol. 1986, 6, 183–196. [Google Scholar] [CrossRef]
- Wang, T.; Tang, J.; Sun, M.; Liu, X.; Huang, Y.; Huang, J.; Han, Y.; Cheng, Y.; Huang, Z.; Li, J. Identifying a transport mechanism of dust aerosols over South Asia to the Tibetan Plateau: A case study. Sci. Total Environ. 2021, 758, 143714. [Google Scholar] [CrossRef]
- Sanap, S.D.; Pandithurai, G. The effect of absorbing aerosols on Indian monsoon circulation and rainfall: A review. Atmos. Res. 2015, 164, 318–327. [Google Scholar] [CrossRef]
- Jin, Q.; Wei, J.; Lau, W.K.; Pu, B.; Wang, C. Interactions of Asian mineral dust with Indian summer monsoon: Recent advances and challenges. Earth-Sci. Rev. 2021, 215, 103562. [Google Scholar] [CrossRef]
- Gautam, R.; Hsu, N.C.; Eck, T.F.; Holben, B.N.; Janjai, S.; Jantarach, T.; Tsay, S.; Lau, W.K. Characterization of aerosols over the Indochina peninsula from satellite-surface observations during biomass burning pre-monsoon season. Atmos. Environ. 2013, 78, 51–59. [Google Scholar] [CrossRef]
- Kalita, G.; Kunchala, R.K.; Fadnavis, S.; Kaskaoutis, D.G. Long term variability of carbonaceous aerosols over Southeast Asia via reanalysis: Association with changes in vegetation cover and biomass burning. Atmos. Res. 2020, 245, 105064. [Google Scholar] [CrossRef]
Publisher’s Note: MDPI stays neutral with regard to jurisdictional claims in published maps and institutional affiliations. |
© 2021 by the authors. Licensee MDPI, Basel, Switzerland. This article is an open access article distributed under the terms and conditions of the Creative Commons Attribution (CC BY) license (https://creativecommons.org/licenses/by/4.0/).