Article

Parameterization of the Individual Tree Detection Method Using Large Dataset from Ground Sample Plots and Airborne Laser Scanning for Stands Inventory in Coniferous Forest

1
Faculty of Civil Engineering and Environmental Sciences, Bialystok University of Technology, Wiejska 45E, 15-351 Bialystok, Poland
2
Forest Management and Geodesy Bureau, Sekocin Stary, ul. Lesnikow 21, 05-090 Raszyn, Poland
3
Faculty of Computer Science, Bialystok University of Technology, ul. Wiejska 45A, 15-351 Bialystok, Poland
*
Author to whom correspondence should be addressed.
Remote Sens. 2021, 13(14), 2753; https://doi.org/10.3390/rs13142753
Submission received: 20 April 2021 / Revised: 6 July 2021 / Accepted: 9 July 2021 / Published: 13 July 2021

Abstract

:
Highly accurate and extensive datasets are needed for the practical implementation of precision forestry as a method of forest ecosystem management. Proper processing of huge datasets involves the necessity of the appropriate selection of methods for their analysis and optimization. In this paper, we propose a concept for and implementation of a data preprocessing algorithm, and a method for the empirical verification of selected individual tree detection (ITD) algorithms, based on Airborne Laser Scanning (ALS) data. In our study, we used ALS data and very extensive dendrometric field measurements (including over 21,000 trees on 522 circular sample plots) in the economic and protective coniferous stands of north-eastern Poland. Our algorithm deals well with the overestimation problems of tree top detection. Furthermore, we analyzed segmentation parameters for the two currently dominant ITD methods: Watershed (WS) and Local Maximum Filter with Growing Region (LMF+GR). We optimized them with respect to minimizing the Root Mean Square Error (RMSE) and Mean Absolute Percentage Error (MAPE). Additionally, our results show the crucial importance of the quality of empirical data for the correct evaluation of the accuracy of ITD algorithms.

1. Introduction

It is believed that the conceptual scope of the term “precision forestry” refers to both the application of modern techniques and technologies in the performance of specific forestry operations, and to the collection of real-time and truthful information to support decision-making processes [1,2,3,4].
Some authors directly link the concept of “precision forestry” with highly accurate geographical information [5,6]. For instance, the localization of single trees with sub-meter precision can be determined using a GPS (GNSS) instrument [7,8] or other electronic devices for accurate relative localization using a distance measurement to several points with known coordinates (e.g., Haglöf PosTex Measuring Instrument, produced by Haglöf in Langsle, Sweden) [9,10]. As a direct consequence of the possibility of obtaining precise geographic coordinates for individual tree location or forest ground plants—including old, magnificent trees and valuable or rare plant species—it is possible to protect them from negative impacts, for example, by omitting clear-cutting in a specific location. In the literature, some studies can be found that indicate the effect of conducting clear cuts on the decline of vascular plant species [11], including some indicator species of Old Growth Forests (OGFs) [12]. Indirectly, therefore, the “precision forestry” methods studied in this paper can support the conservation of valuable elements of the forest environment including habitats, plant communities and preserved areas of OGF.
The last twenty years have seen a rapid development of techniques for the efficient acquisition of precise remote sensing data. This fact has given rise to a technological revolution in dendrometry (tree biometry) and has introduced significant changes in the understanding of the relationships that shape forests. This development concerns many technologies of data acquisition in different spectral and radiometric ranges, but the most significant progress has taken place in measuring space and the environment with laser scanners [13,14,15,16,17].
Surveys of forest areas using laser scanners involve the use of different scanning platforms. Currently, the technology with tremendous potential for forest inventory is Airborne Laser Scanning (ALS), which offers adequate parameters for data collected (allowing modeling of selected stand parameters, i.e., number of trees, height, crown size, stem volume) from a large geographic extent [18,19,20]. A notably rich tradition of the practical application of ALS technology to acquire precise tree and stand data is attributed to the Nordic countries [21,22,23,24]. Technological developments have meant that scanners can be successfully mounted on unmanned aerial vehicles (UAVs), providing very dense point clouds, but from areas of significantly smaller spatial extent than ALS [25,26]. Studies of forest areas using remote sensing technologies are also performed stationary from the ground level by terrestrial laser scanning (TLS). This approach allows the acquisition of very precise data regarding individual trees (e.g., trunk shape, diameter at breast height (DBH)) in the surveyed sample plots (SPs). However, this technology has not become the leading one due to its low spatial operability compared to aerial scanning and the presence of other interfering factors (e.g., undergrowth limiting visibility). Still, it can provide an additional source of data [27].
The highly accurate and objective data obtained with this technique allow us to record completely new features of trees and stands and to measure the hitherto elusive dynamics of vast populations of individuals (many millions of trees) in a short time, which is different from the statistical-representational methods used so far [28,29]. These developments allow the practical application of the idea of precision forestry to protect forest ecosystems by limiting timber harvesting in susceptible areas [30] or the complete discontinuation of economic activities in small, irregular areas of Natura 2000 priority habitats [31]. Often, these priority habitats can be precisely delineated by only using precise models generated from ALS data. For example, this concerns the exceptionally valuable wet forest habitat, Vaccinio uliginosi-Pinetum (Natura 2000, habitat code: 91D0-2), which occurs in the examined area. It is undoubtedly beneficial to learn accurate local biometric models of trees and stands, balance their use based on real and precise data, and track their response to human activity to modify conservation and management actions quickly. In protected forests (ecosystems), the implementation of the concept of precision forestry allows us to closely follow natural processes and mimic them through the detailed planning and implementation of economic and protective actions [30], which will increase the safety of valuable habitats and species, especially fragments of forests (forest phytocoenoses) of exceptional importance for the sustainability of forests in general, for example, OGFs [12]. The rapid development of remote sensing technologies has significantly increased the availability of spatial data, including those freely available, often acquired with standard parameters [32], without taking into account the complexity of the local forest structure or specific research scope, for example, the detection of lying tree stems [33].
This attitude limits the use of fully automated methods for ALS data analysis, and a necessary step in their processing is the calibration stage based on local data acquired during field inventory. Therefore, it is crucial that analysis methods of ALS data are resistant to the often unknown parameters of point clouds. Furthermore, field inventory data for the calibration of these methods should be acquired very precisely, considering the local variability of ecosystems in the sample [34].
One of the main goals of ALS data analysis according to precision forestry theory is to detect trees, estimate their number in the stand, and measure biometric features as accurately as possible. In the last decades, many methods and analytical approaches dedicated to detecting individual trees have been introduced, referred to as ITD methods (Individual Tree Detection). We can distinguish two main approaches in the ITD methods in the delimitation of individual trees of the upper storey; these are direct point cloud analysis (3D clustering) [35] and the use of point cloud derived products—Canopy Height Models (CHMs) [36,37]. Whereas, the Single Tree Detection procedure, itself using laser scanning data, is most often done in two stages. First, the locations of potential tree tops are detected using local maximum filter methods, where different crown size-tree height relationship functions are applied. Then, the identified tree top locations form the basis for the delimitation of crown contours using the Watershed (WS) algorithm or by using the nearest neighbors method [38].
The main goal of our study was to investigate the effects of the parameters of popular ITD methods on the estimation error of the number of trees in stands with a predominance of coniferous species (Scots pine, Norway spruce) based on a large ALS dataset. In our study, we focused on the following methods: the WS algorithm and Local Maximum Filter + the Growing Region (LMF+GR) algorithm. Many studies have considered relatively limited ground sample datasets (a few tens of SPs at most) [39,40,41]. In this study, we used a large ground sample dataset including measurements of 21,830 trees on 522 SPs to minimize the uncertainty of our results. The large sample dataset also allowed us to divide the study population into subsets and investigate the influence of other factors (plot size, stand type, forest district, proportion of gaps and crown size) on the accuracy of the detection methods used.

2. Materials and Methods

2.1. Study Area

Poland, located in Central Europe, is covered with 29.6% forest (as of the end of 2019) [42]. Most of the forested areas are governed by State Forests (over 75%). Over 65% of the forest stands in Poland are coniferous.
We chose two administrative units of the State Forests as our research object, which constitute a vast forest complex of the Knyszyńska Primeval Forest with semi-natural character—and two neighboring Forest Districts: Supraśl and Żednia (Figure 1). Knyszyńska Primeval Forest is located in the lowlands of Northeastern Poland. In this area there are economic and protected forests, nature reserves and Natura 2000 sites [43], which means temporary or permanent exclusion from management and submission to natural processes. It is worth mentioning that a part of the studied stands was damaged by a hurricane in 2016, which significantly disrupted the forest structure, but adds value to the experiment. The choice of the study area is also supported by its coverage by other research projects, involving the acquisition and analysis of ALS data and very extensive ground surveys: the two-phase research project Zajma I and II in the Żednia Forest District—140 SPs [44,45] and part of the national project RemBioFor in the Supraśl Forest District—500 SPs [46].

2.2. Field Inventory Data

We parameterized the two chosen ITD methods based on an extensive empirical dataset, including dendrometric measurements on randomly distributed circular ground sample plots. The dendrometric measurements were collected in two independent projects using a homogeneous measurement methodology. Data for the RemBioFor project (Supraśl Forest District) [47] were acquired in a regular grid of circular plots. The Zajma I and Zajma II (Żednia Forest District) experiment data were acquired from sample plots distributed randomly, employing a stratification layer method with selection. Measurements of the centers of each SP were taken with a static-mode geodetic-class Global Navigation Satellite System Trimble SPS 882 (GNSS, mean position error = 0.32 m). The measurements for the RemBioFor project were obtained from September to November of 2015. The measurements for the Zajma I and Zajma II experiments were obtained from January to March of 2018. The features of each sample plot were determined, including sample plot location, tree count in each sample plot (with DBH greater than 70 mm), and so forth. For each tree in a sample plot, dendrometric features were gathered, along with the tree’s location (measurement in polar coordinates relative to the center of the sample plot), species of the tree, DBH [mm], tree height [m], crown visibility in terms of remote sensing (1—full, 2—partial, 3—no crown visibility) [46], and additional features (sharing common crown, high trunk deflection, etc.).
We parameterized the examined ITD methods in the context of its effective implementation in the detection of coniferous stands that constitute about 68% of all stands in Poland, irrespective of ownership form [48]. For this reason, we selected plots with the majority of coniferous species in the upper story of the stand (trees with full crown visibility). An empirical statistical sample was constructed by selecting 522 out of 640 SPs with different radii (81% of all SPs). In the Supraśl Forest District 410 SPs with a radius of 12.62 m (500 m 2 ) were located, whereas in the Żednia Forest District 112 SPs, with radii ranging from 5.64 to 25 m, were established. A total of 21,630 trees were measured on SPs, of which 11,806 were trees with full crown visibility (55%), 2393 were trees with partially crown visibility (11%), and 7431 were canopy trees with crowns not visible from the aerial level (34%).
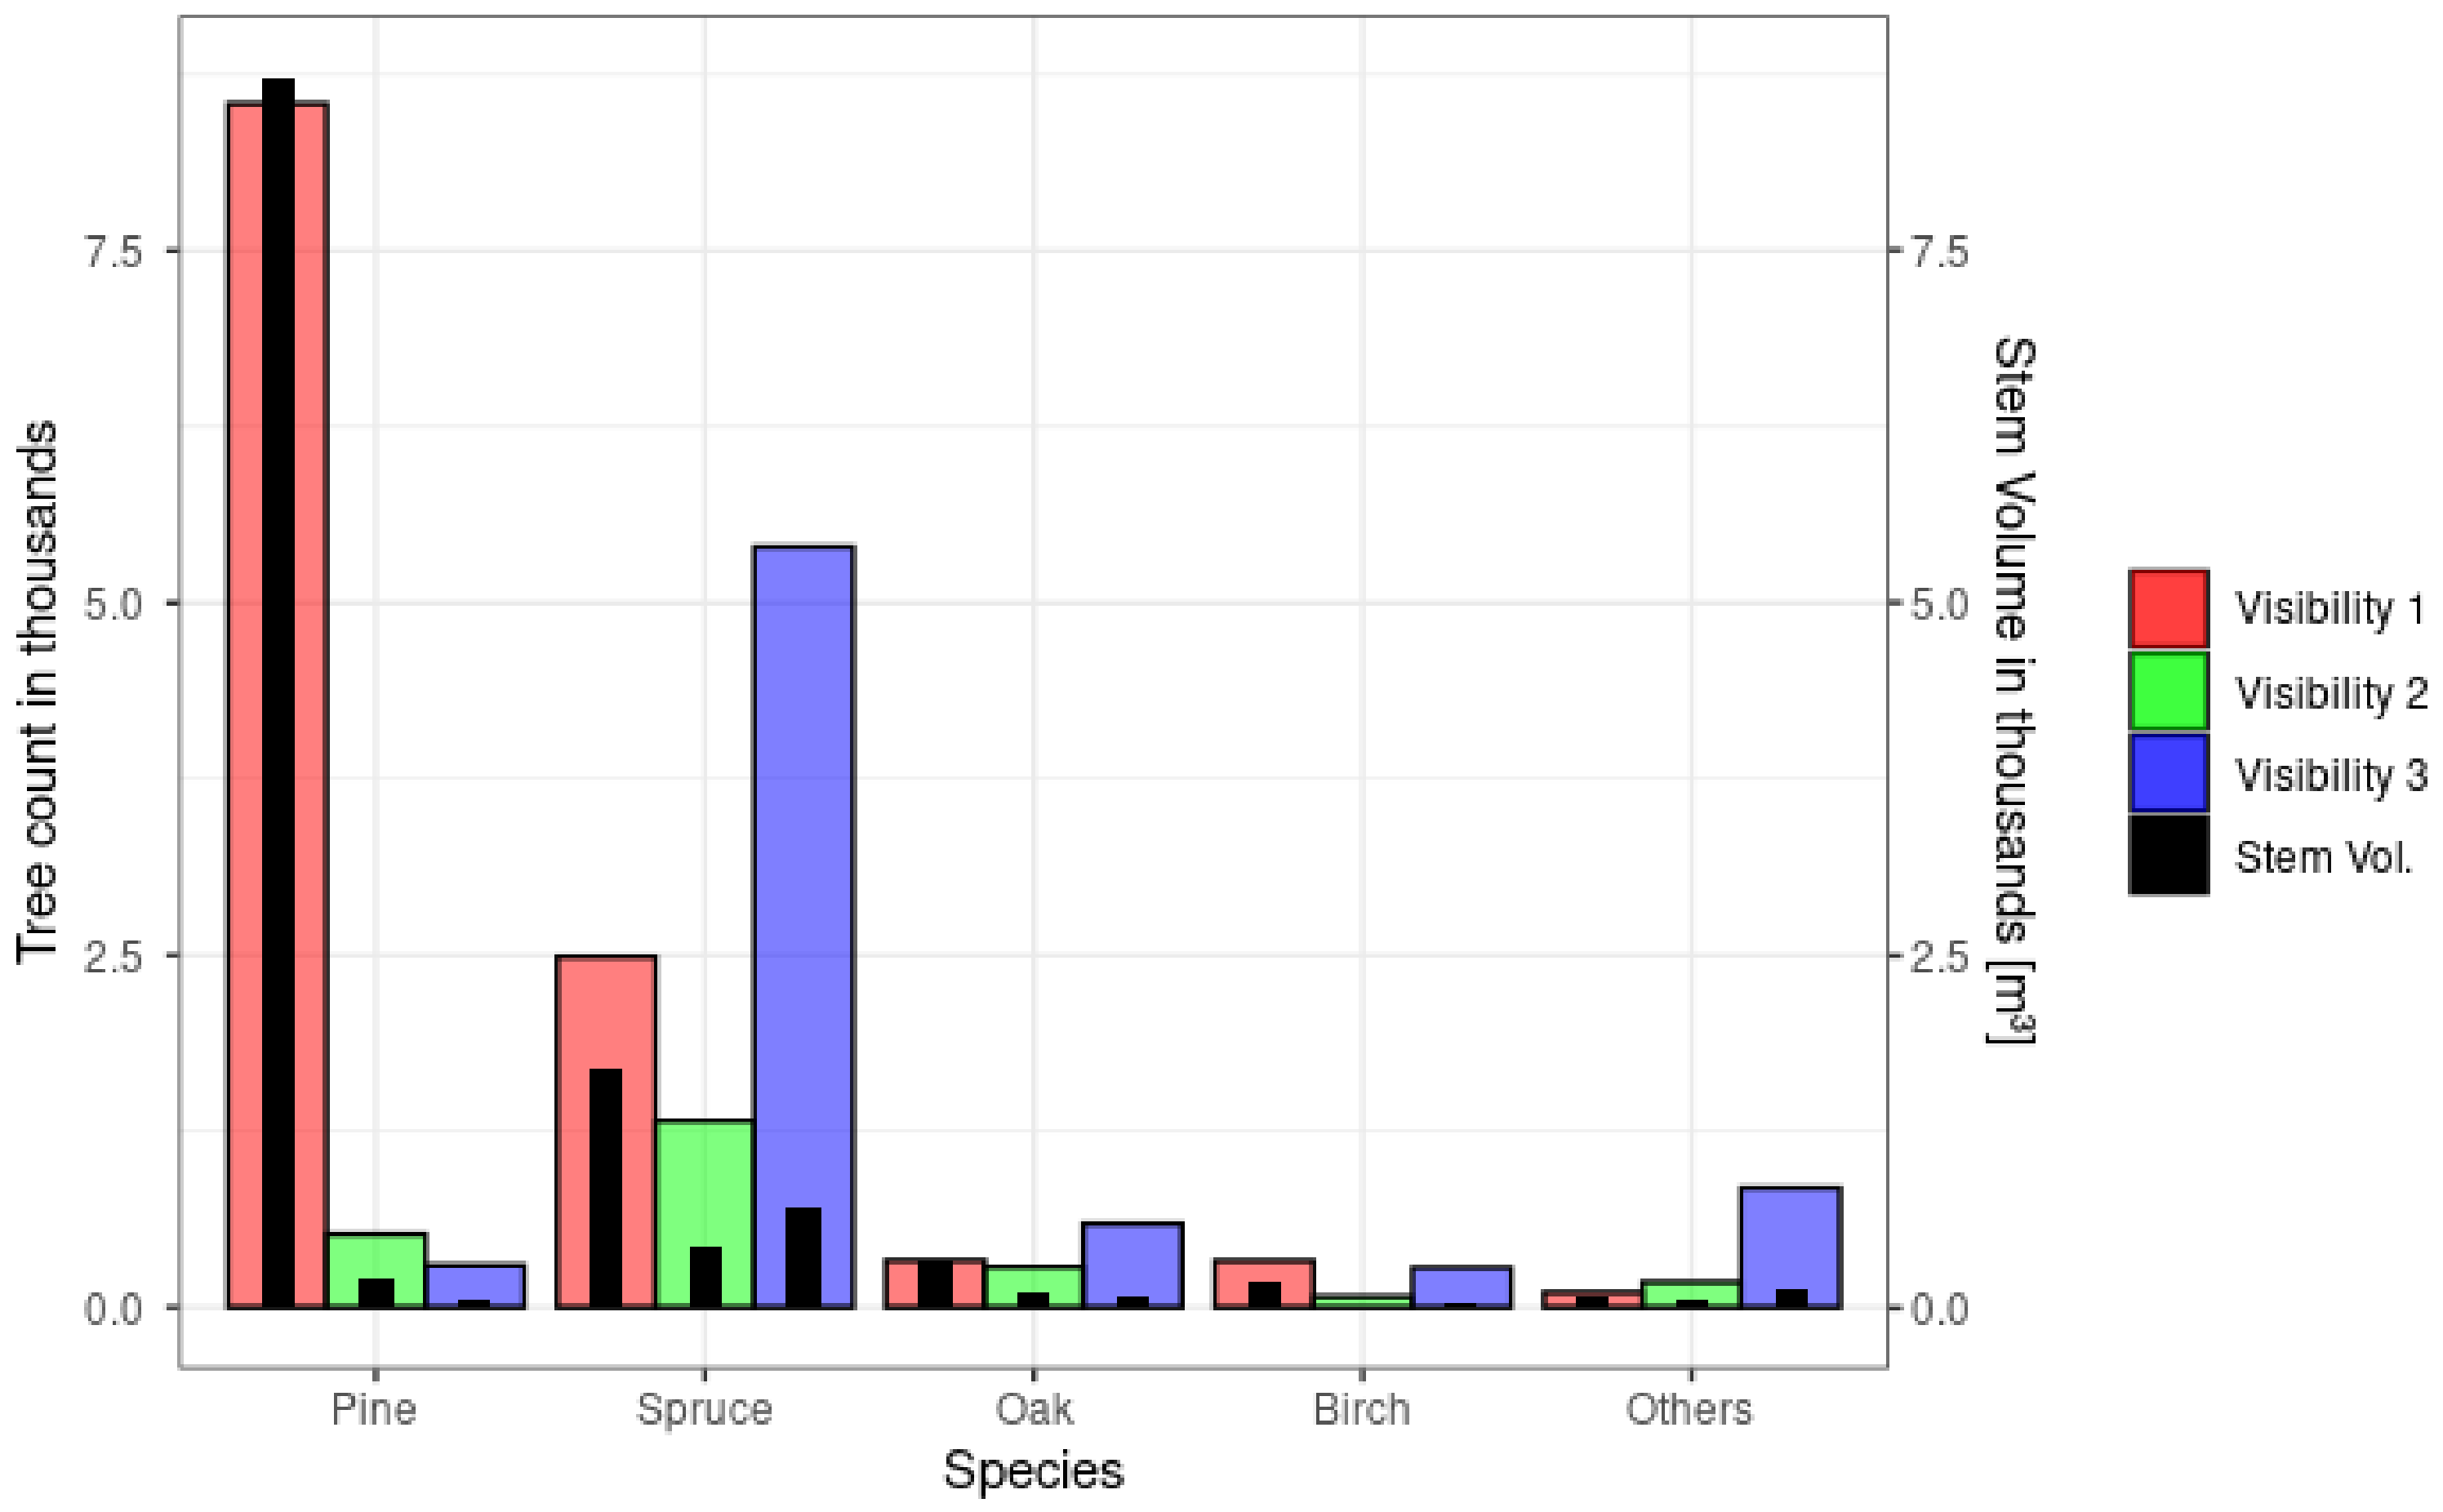
A characteristic feature of the analyzed stands is a complex vertical structure characterized by the 3-level crown visibility index adopted in our study. On the analyzed SPs, the upper forest layer of the stand (crown visibility 1) is dominated by Scots pine (Pinus sylvestris L.) and Norway spruce (Picea abies (L.) H.Karst), with a smaller share of oak (Quercus robur L.), birch (Betula pendula Roth), and other species. Spruce is the most abundant in the second, and undergrowth forest layer (crown visibility 2 and 3), accounts for about 31% of all observations. A large share of spruce in the lower forest layers is a characteristic feature of the stands of north-eastern Poland. As presented in Figure 2, despite a considerable share of trees in the lower forest layers, they do not have a significant share in total stem volume. The stem volume of trees with a crown visibility of 2 and 3 accounts for about 14%, and the stem volume of trees with a crown visibility of 3 accounts for only about 7% of the total stem volume.
Despite minor differences between sets of circular plots (draw method, radius of circular plot) at the analyzed sites, there were no significant discrepancies in average tree characteristics. The average tree height was 21.52 m in the Supraśl Forest District and 22.12 m in the Żednia Forest District. Larger differences between the forest districts were noted in the case of the share of gaps in CHM, which is a result of the hurricane damage of 2016. The average value of this parameter is 8.76% in the Supraśl Forest District and 14.36% in the Żednia Forest District.

2.3. Airborne Laser Scanning Point Clouds

In this study, we used two sets of ALS data acquired under separate orders and at different times. However, most of the parameters of the obtained point clouds are similar. One contractor conducted both flights. The first dataset covers the Supraśl Forest District and comes from 2015, while the second scanning dataset was acquired for the Zajma Subdistrict—part of the Żednia Forest District. Table 1 summarizes the analyzed point clouds.
Both flights were conducted using a Vulcanair P-68 “Observer 2” light aircraft equipped with a Riegl LiteMapper LMSQ-680i laser scanning system. The collected data were processed in RiProcess software. The point cloud was stored in LAS format version 1.4. After XYZ series alignment, the accuracy of height and the XY coordinates are characterized by mean error m h 0.15 m and m p 0.20 m, respectively. The next step was point cloud classification using the TerraScan tool of the Terrasolid package. Points were assigned to classes according to the ASPRS standard [49]: 1—unclassified, 2—ground, 3—low vegetation, 4—medium vegetation, 5—high vegetation, 6—buildings and engineering structures, 7—noise. The points in the cloud were assigned spectral values of the pixels in the color-infrared (CIR) images.

2.4. Homogenization of Field Dendrometric Measurements with Remotely Determined Trees

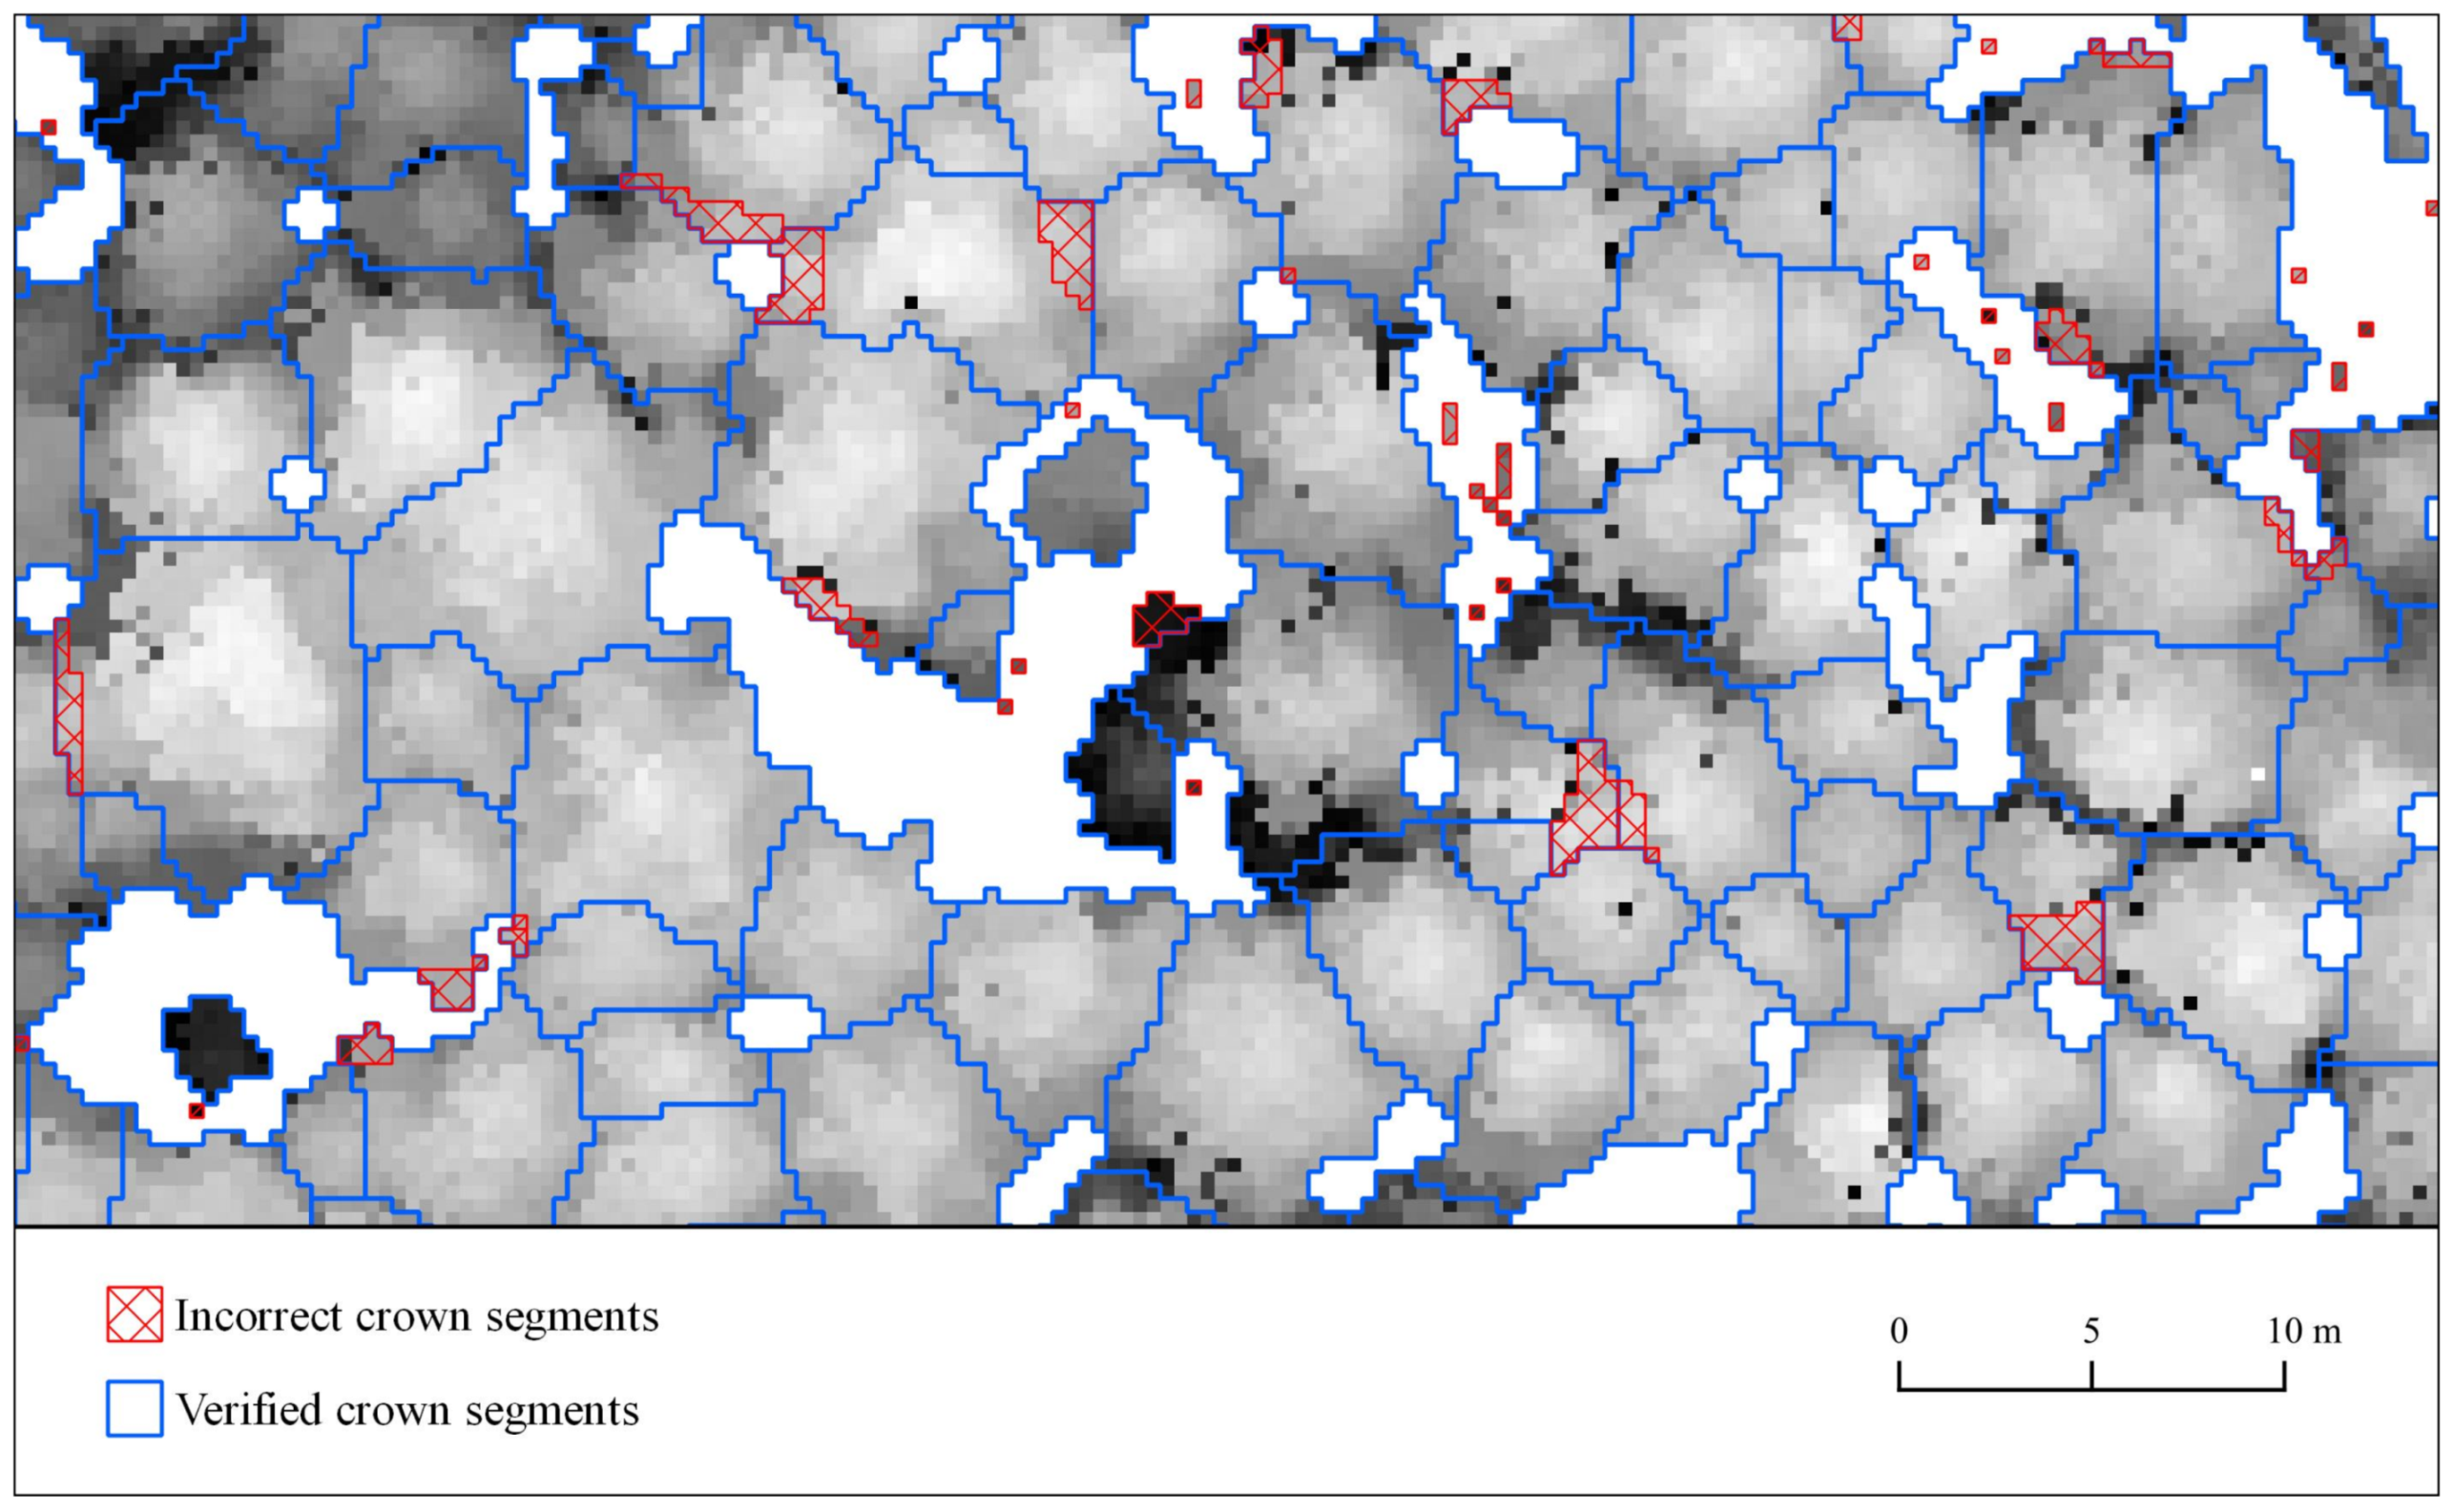
A tree matching procedure for linking the detection results to the reference field inventory data is crucial in modeling some detection parameters correctly, for example, the relationship between crown diameter and tree height. Various automatic procedures have been proposed in this field, but the reference is always a manual interpretation by experienced human interpreters [50]. We performed a manual spatial linking of ground-based relative location measurements of trees (trunk locations at 1.30 m above ground level from field inventory) with the corresponding crown segments of trees automatically detected using the raster-based WS segmentation method. In this way, we used these databases to build parameterization models of the considered ITD methods. We carried out an additional manual correction of the tree crown segments, determined automatically with the WS algorithm running on the Gaussian filter smoothed CHM [51]. We performed the correction of segment outlines on the CHM overlay displayed in grayscale by allowing operations such as changing segment outlines, merging adjacent segments, or splitting segments encompassing more than one tree crown.
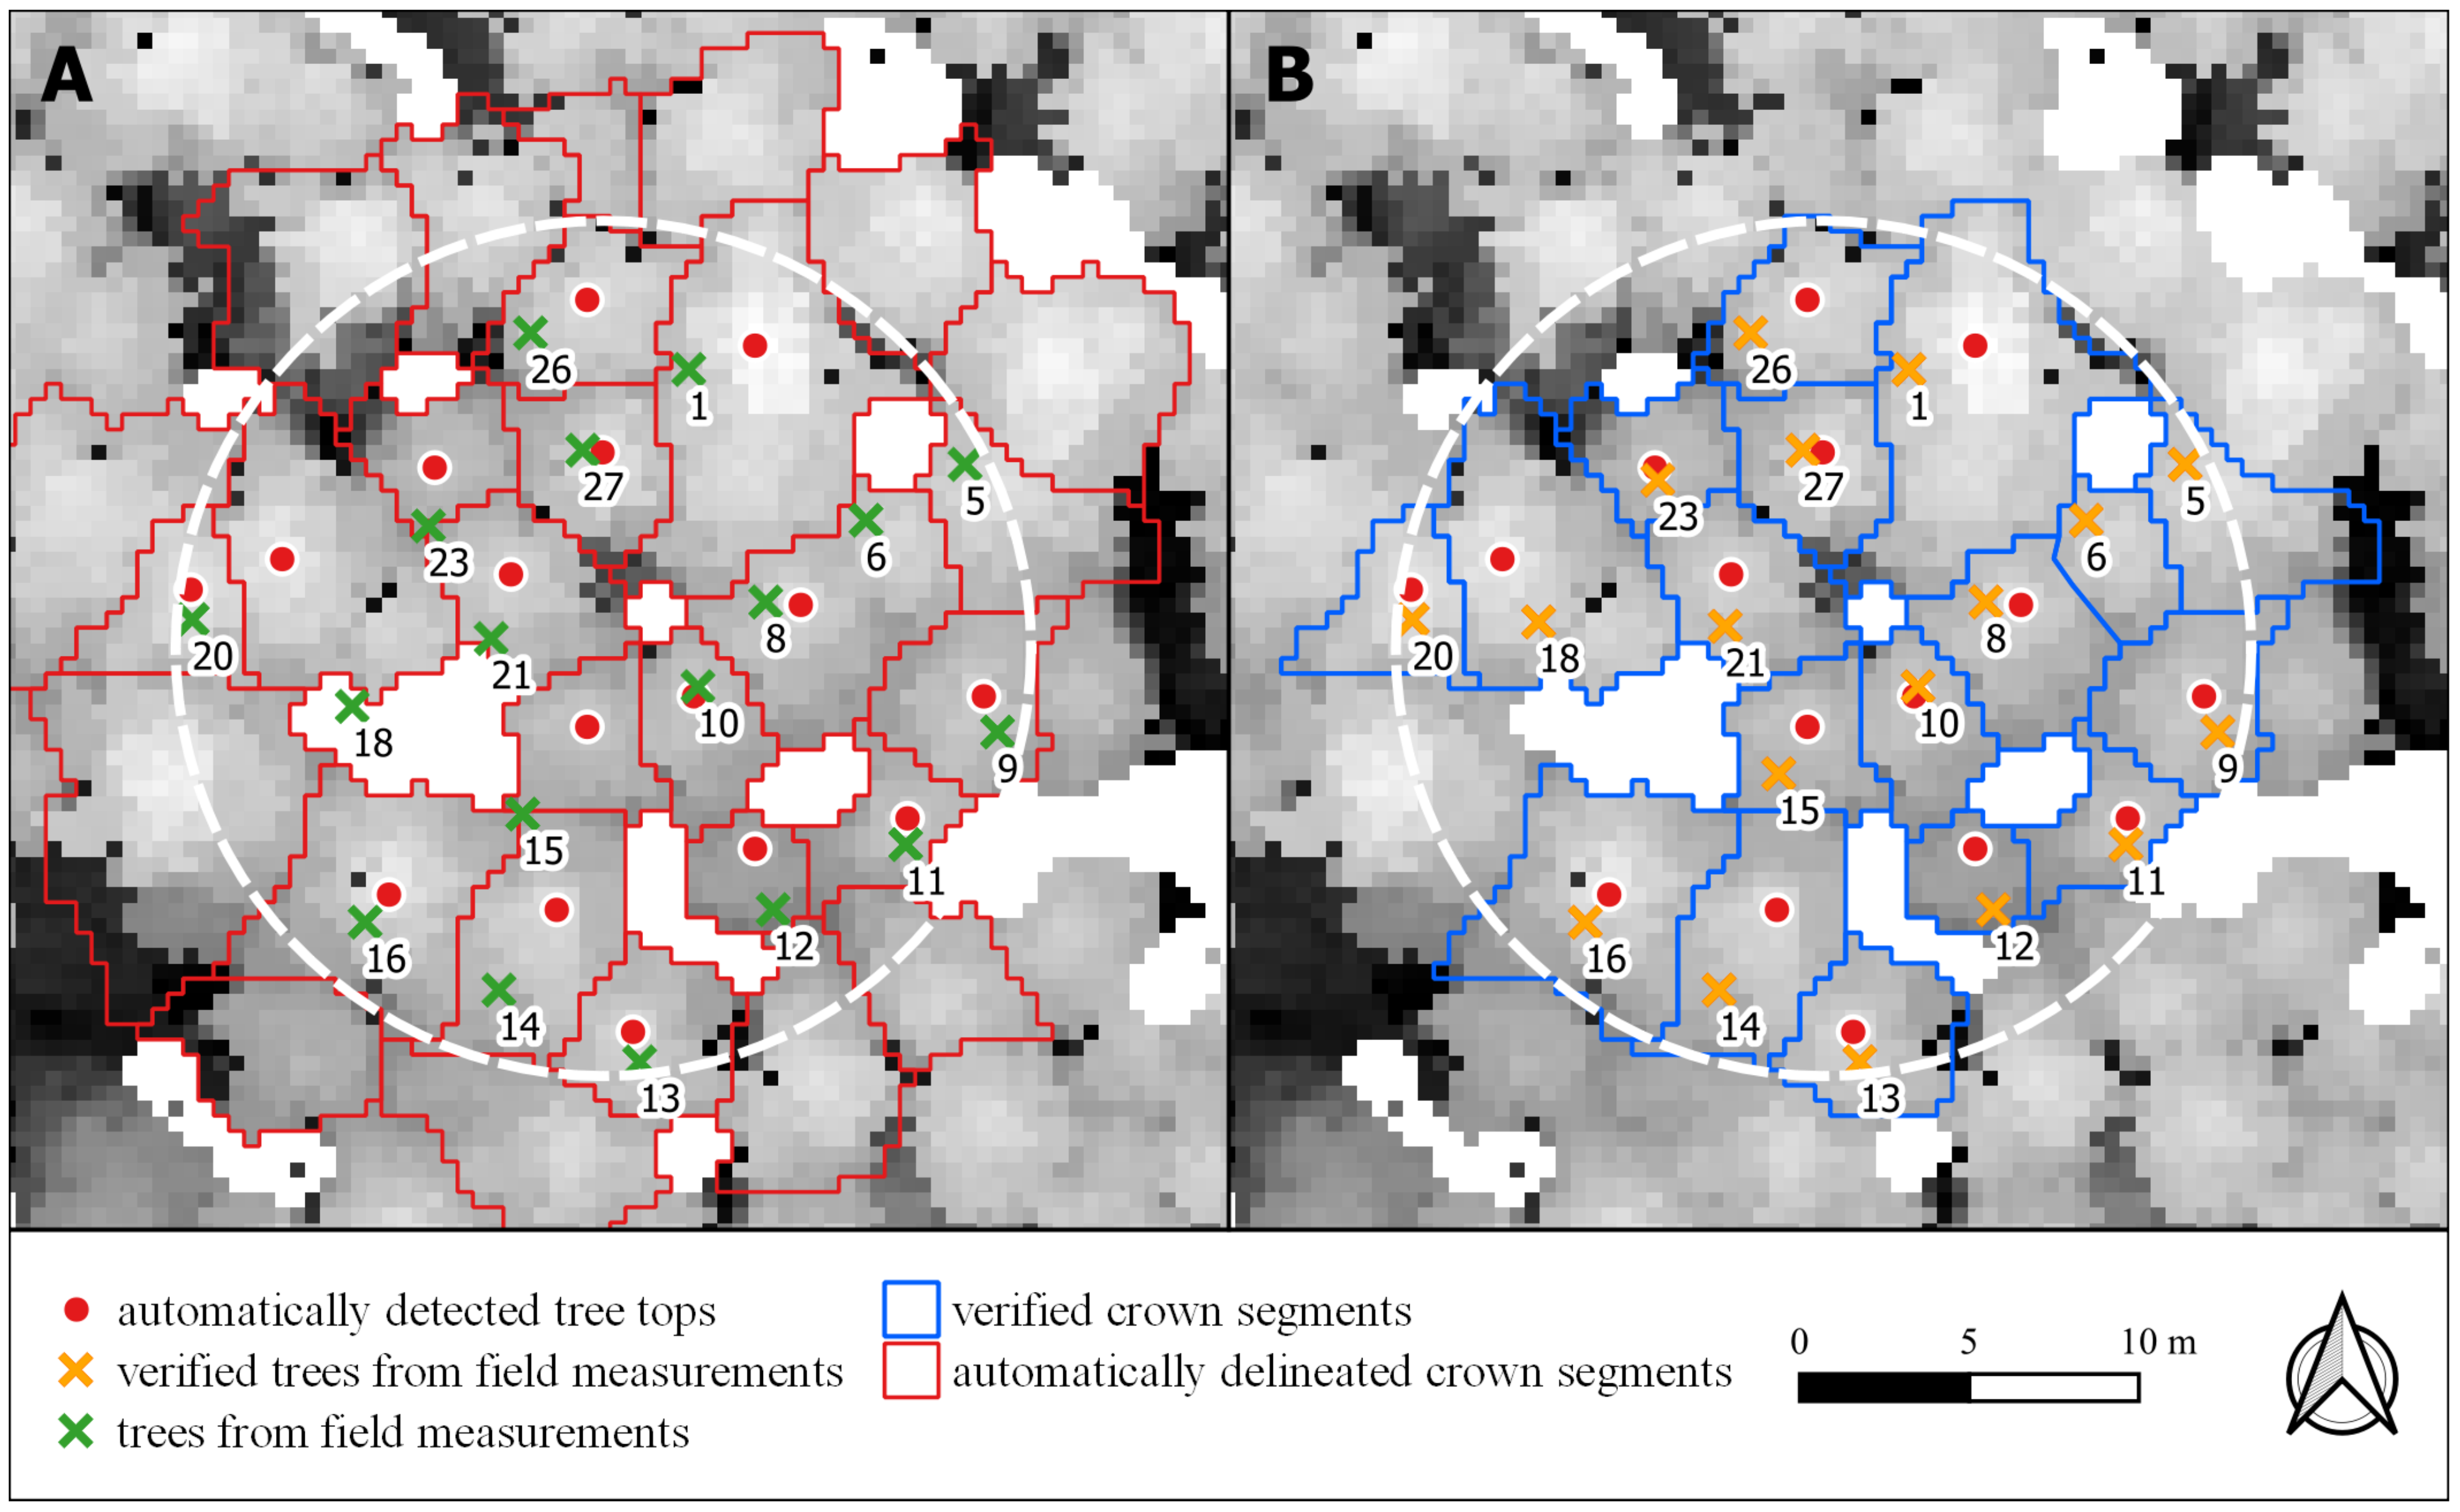
Simultaneously, we controlled the correctness of the position of the trunk location from ground measurements on the SP relative to the automatically generated crown segment outline. In most cases, it was necessary to correct the trunk position relative to the segment slightly. It was needed due to several factors, the most important of which were the natural inclination of the trees resulting in the eccentricity of the treetop projection on the ground relative to the actual position of the stem and the limited accuracy of locating the center of the plot using a GNSS receiver in forested areas [52]. We used a ten-point scale to evaluate the correctness of the segment’s delineation in reference to the ground dendrometric and location measurements. If we found unambiguous correspondence, then we rated the segment a ten. Depending on the degree of correction needed, we gave the segments lower ratings. We assumed a rating threshold value of seven to build the set of observations for creating parameterizing functions. As a result, we built a database containing a total of 9451 observations for coniferous species (Pine, Spruce). Figure 3 presents an example of SP before and after the correction.

2.5. Individual Tree Detection on Sample Plots

We automatically determined the number of trees in each SP based on two analytical solutions commonly available and effectively used in the forestry field. The first of the considered algorithms includes the classical WS method, while the second approach is a hybrid method of searching for treetops on a normalized point cloud using Local Maximum Filter [53] and generating crown contours using interpolated CHM and the growing region method (LMF+GR) [54,55,56]. The main advantage of the adopted methods is the possibility of using the information potential of a large set of empirical measurements to build functions that parameterize the ITD analysis process. We extended the considered methods with the author’s approach to CHM generation and the implementation of the function of the dependence of the crown diameter on the tree height, as well as the relation of the crown projection area on the plane and the tree height. Considering the previously described deviation of the virtual tree top position in the crown segment, we additionally propose an approach for the criterion of recognizing the membership of a crown segment to an SP. The schematic process of determining the number of trees per SP using both ITD methods is summarized in Figure 4. We implemented the analytical procedure using the SAGA GIS free software libraries [51], R language script [57] and QGIS software geoprocessing models [58].

2.5.1. Point Cloud Pre-Processing

Point cloud, classified according to the ASPRS standard, underwent a normalization process, that is, the transformation of point cloud absolute coordinates above mean sea level (MSL) to relative coordinates, above ground level (AGL). The process of point cloud normalization is important to extract the stand height. We implemented point cloud normalization using the LidR library [59]. We realized the removal of topographical information from the processed point cloud based on points classified as class 2 (ground) using the TIN algorithm [60]. Next, from the normalized point cloud, we selected the points of first return (single or first of many returns) belonging to the high vegetation class with a height relative to the ground exceeding 5 m. The threshold value of points cut-off was adopted on the basis of field empirical data indicating the lack of occurrence of trees of that height possessing sufficient volume in the context of Forest Management Instructions in force in Poland (DBH ≥ 70 mm).

2.5.2. Parameterization of Individual Tree Detection Methods

Due to the different nature of the implemented methods, we considered different sets of output parameters. We used a total of 94 sets of parameters in the comparative analysis of the considered ITD methods.
For the WS method, we considered 54 parameter sets based on raster analysis, including combinations of various spatial resolutions of CHM (pixel sizes) and Gaussian filter smoothing strength (kernel size and standard deviation). We analyzed the validity of using CHM in the following pixel sizes [m]: 0.35, 0.40, 0.45, 0.50, 0.55, 0.60. Pixel size ≤ 0.3 m was not included in the analysis due to insufficient point cloud density. We smoothed the resulting CHM with a Gaussian filter in a moving window (circular window) with a size range of one to three pixels, and a standard deviation of one to three.
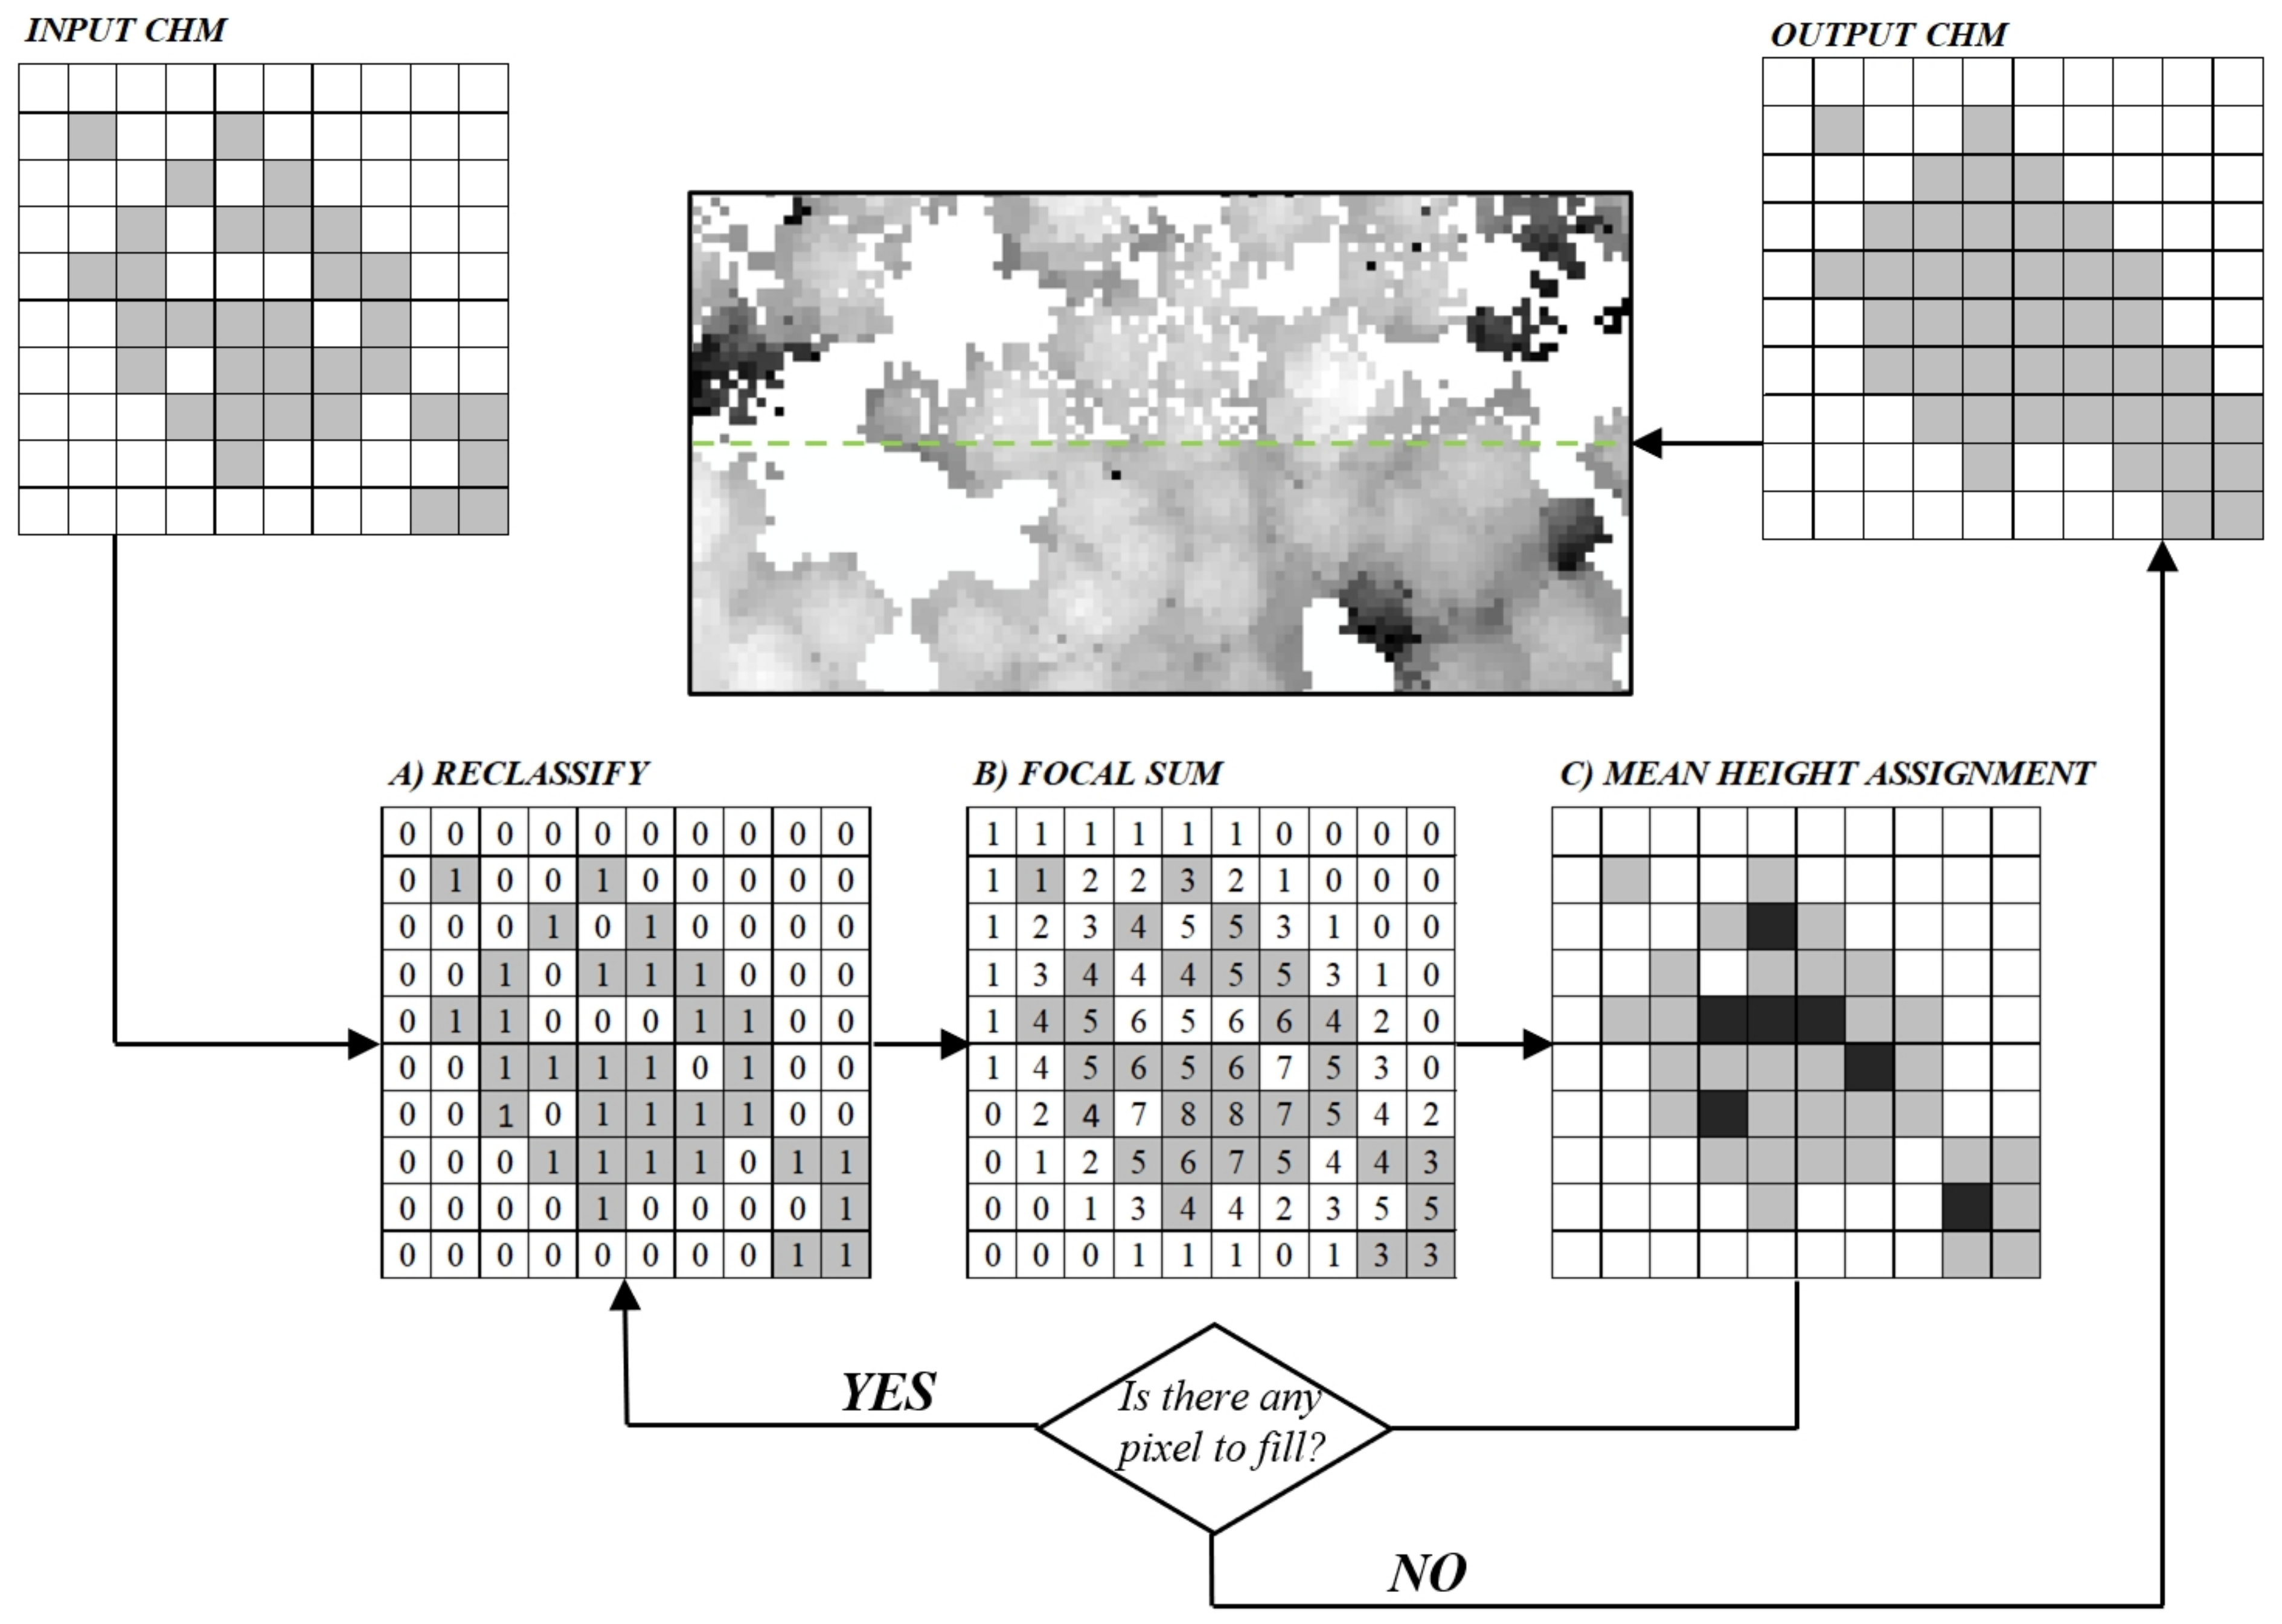
Given the crucial importance of CHM quality in the WS method, we proposed a proprietary algorithm for filling empty CHM cells based on nearest neighbor analysis. We implemented the construction of CHM in R by means of the point to raster method (P2R) available in the lidR package, with assigning height to the raster cell from the highest point. When building a CHM with a pixel size less than 0.45 m, empty pixels in the height image of the canopy becomes a significant difficulty due to insufficient density of first returns in the point cloud. We propose an algorithm performing iterative filling of empty CHM cells with the principle of minimizing the artificial growth of tree crowns.
The algorithm begins with reclassifying the CHM to zero (empty pixels) and one (pixels with positive value of height) (A). Then, non-empty pixels are counted in a 3 × 3 moving window (B). In the last phase of the procedure, the empty pixels that have at least five neighbors are calculated as the average height from neighboring cells (C). The presented procedure is easy to implement in the R environment and can be run with a predefined number of iterations, or until there are no empty cells with a sufficient number of neighbors with height, as presented in Figure 5.
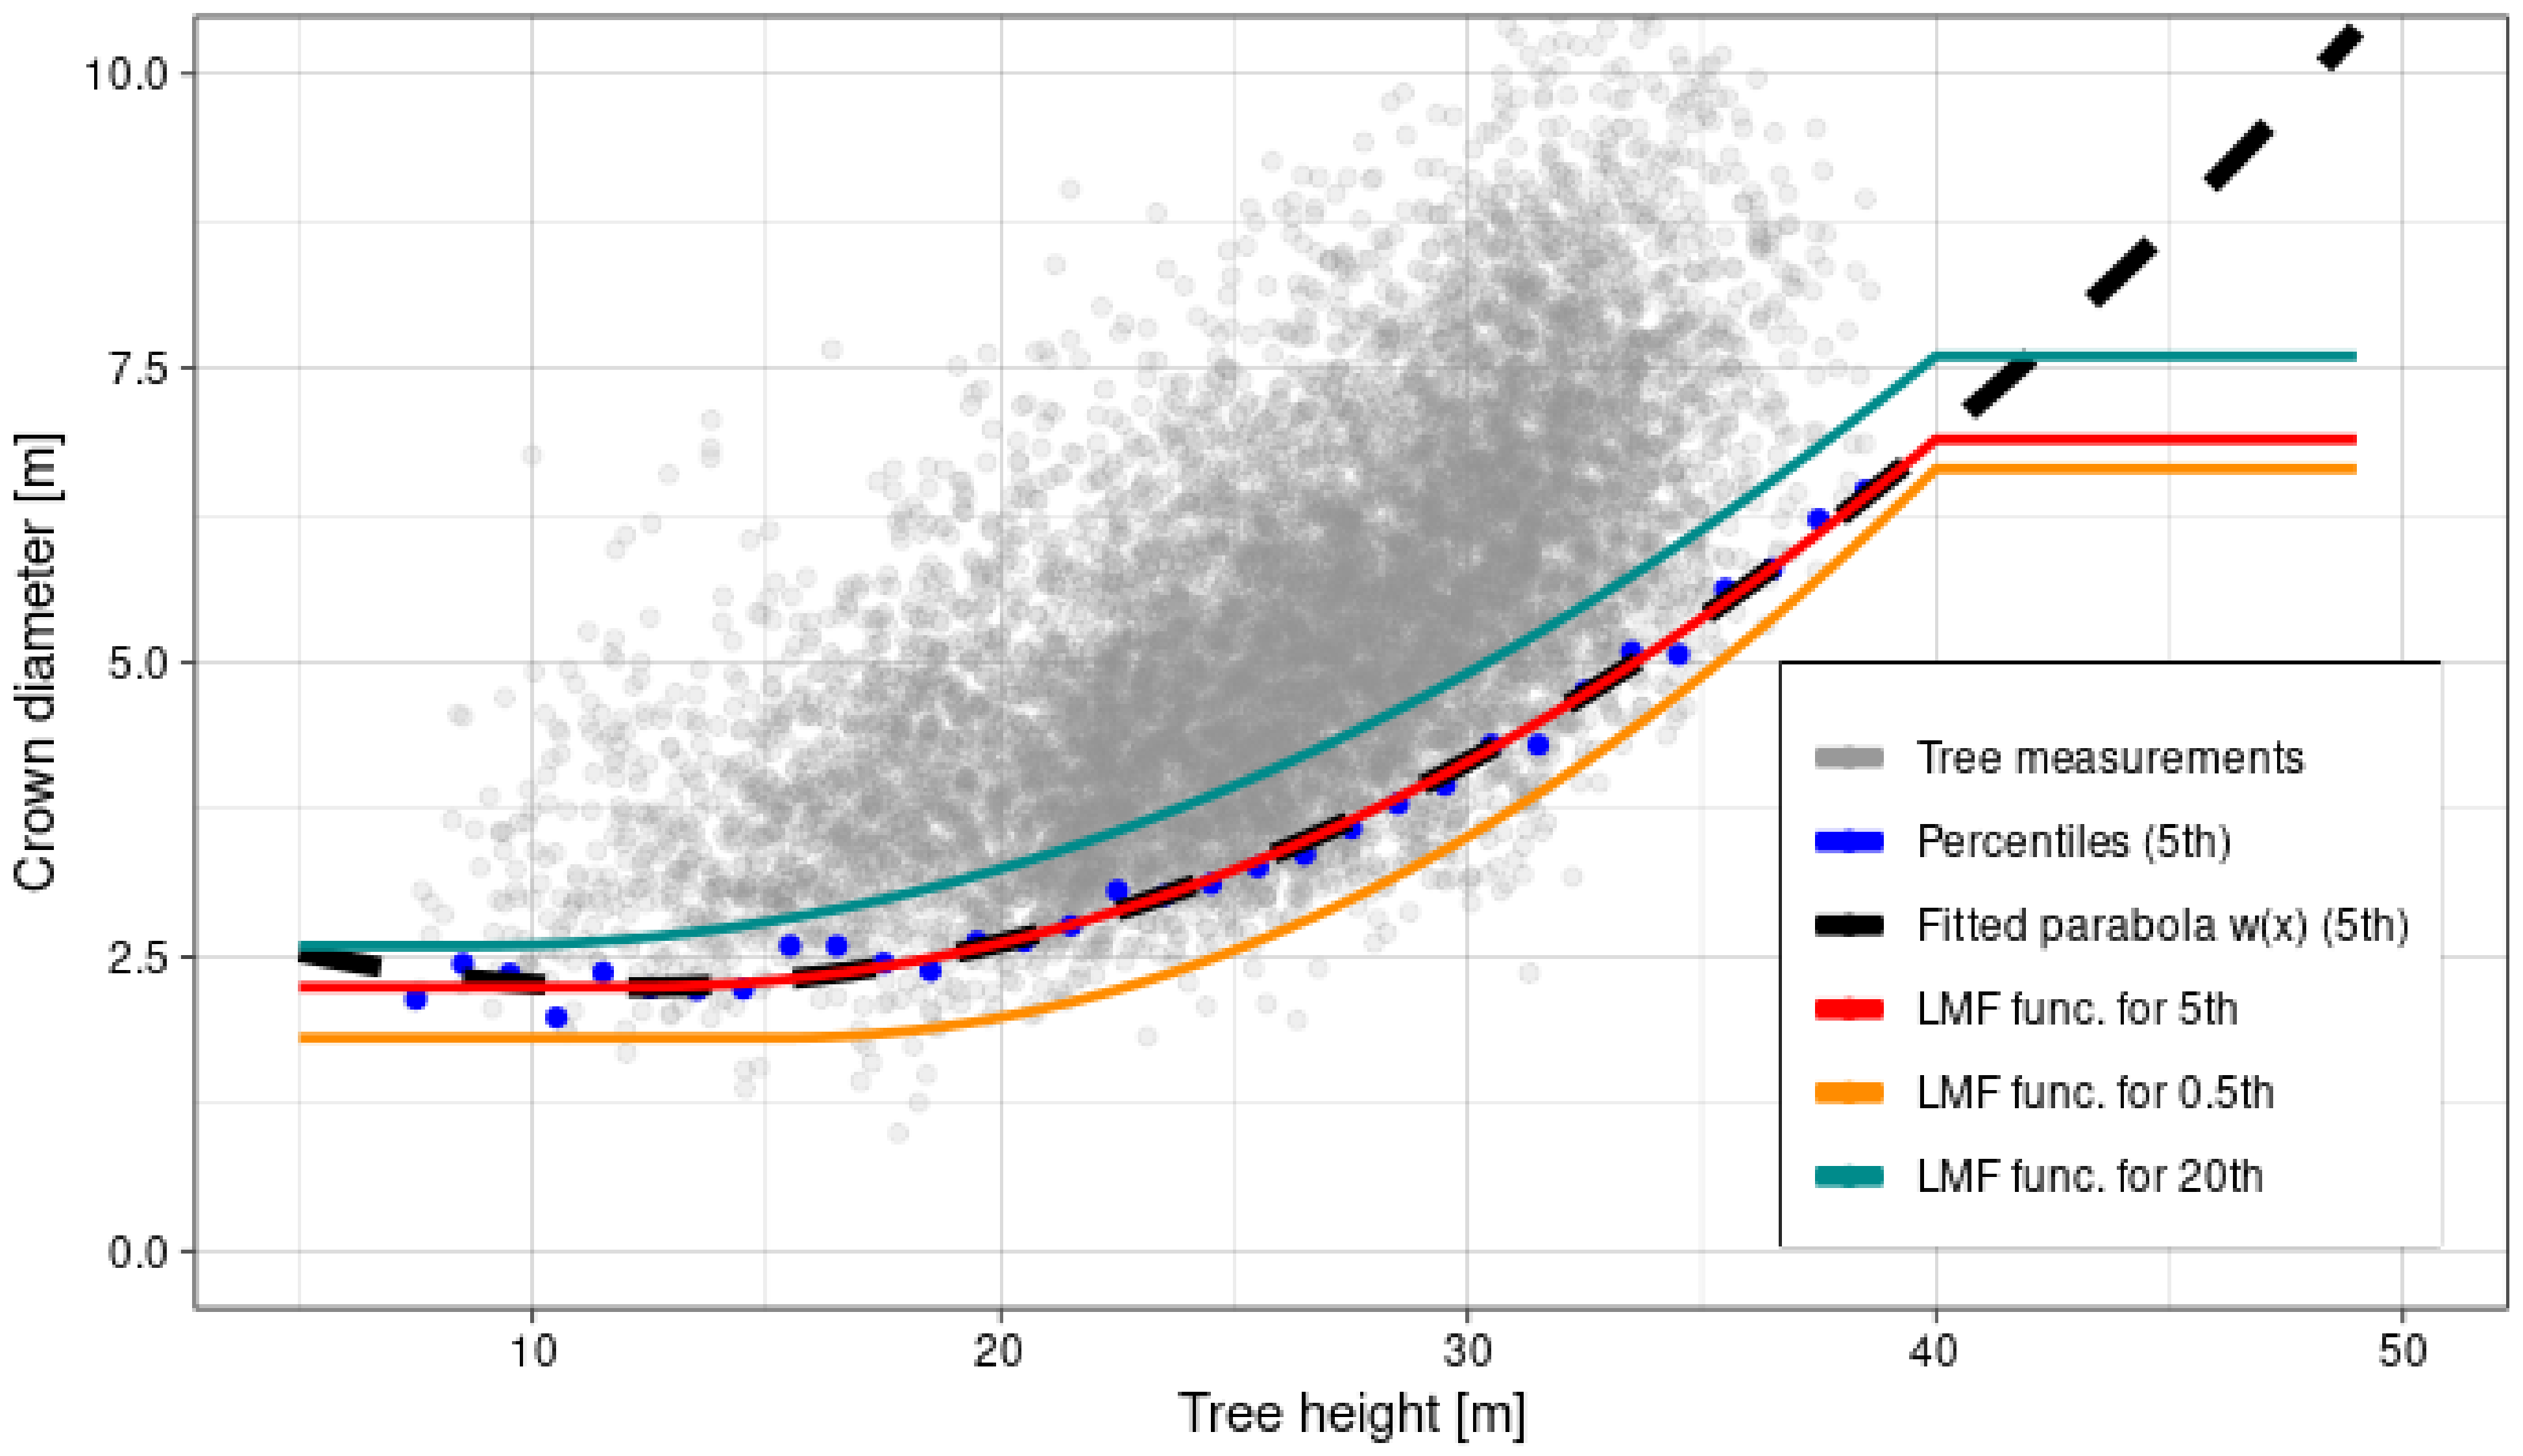
In the LMF+GR method, in the first stage of this analysis, we examine the normalized point cloud for local extremes, identified as the tops of individual trees. A given point in the cloud is classified as a tree top if it has the highest Z coordinate in a circular search region of a size dependent on the height of that point. For low-diversity stands with high similarity in tree height and crown size, a search radius of constant size may be sufficient. As the variation in these characteristics increases, it is desirable to determine an appropriate relationship between height and crown diameter. This relationship is described by a continuous function. We propose to use the function,
f L M F ( x ) = min w ( x ) , if x < arg min w ( x ) w ( x ) , w ( H m a x ) , if x > H m a x ,
where w ( x ) is a quadratic function determined from the measured data.
In determining the function f L M F ( x ) of the relationship, we used a total of 9451 tree segments of coniferous species (pine, spruce) validated in the previous step, enriched with data from ground dendrometric measurements, and approximated as circles determined from crown segments. We grouped the collected observations into 1 m bins with respect to their height, ordered in ascending order, and within each of these height bins we determined percentiles of crown diameter p { 0.5 , 1.0 , 1.5 , , 20.0 } . Based on these percentiles for each p and the corresponding heights, we constructed a crown size-height dependence function w p ( x ) (Figure 6). In this way, we constructed 40 such functions, which we tested to indicate the optimal p. Having treetops identified, we performed crown delineation using the GR algorithm on a CHM with 0.45 m spatial resolution.

2.5.3. Post-Processing Tree Detection Outputs

A general problem of tree detection from ALS data is the general tendency to overestimate the tree number due to the characteristics of LiDAR data (structure complexity, noise) [61]. Many researchers have encountered this problem and have dealt with it in various ways, for example, by thresholding the distance between detected treetops [35,62,63]. Given the availability of a large empirical dataset, we proposed a method to eliminate segments with an inappropriate ratio of tree segment area to tree height. We determined this relationship based on a dataset of 9451 validated tree segments. We grouped these trees by height into one-meter subsets. For each such subset we took a minimal segment area. Given these observations, we fitted an exponential function which resulted in a relationship:
A m i n = 0.909 e 0.0623 H ,
where Amin is the minimal area of the segment representing a detected tree and H is the tree height obtained based on LiDAR measurements. Based on relationship (1) we constructed a rule:
A < 0.909 e 0.0623 H ,
for segments to be merged with another adjacent segment that shared the longest common boundary. As we were dissolving the segments, which are too small for its height, given the criterion above, we corrected the number of detected trees, respectively. We performed the post-processing procedure of ITD results for both methods analyzed in our study. We ran the post-processing procedure using a workflow processing model in QGIS. Figure 7 shows an exemplary execution result of the post-processing correction procedure after automatic tree detection.

2.5.4. Number of Trees Estimation in Sample Plots

For the number of trees estimation in an SP, we need to define a criterion of tree containment in the SP. It is a vital aspect of validation of the methods as it may render an error to the assessment of the results. A common eccentricity of the treetops encountered during field dendrometric measurements prevented us from using the treetops containment as that criterion [41,64]. In this situation, we constructed another criterion based on the point cloud returns in the crown segment. The detected tree belongs to the SP when over half of its returns fall into a cylindrical shape over the SP. It is also worth mentioning that we calculated the proportion of points of a designated tree in the circular plot using the relative height filter of points. We discarded points at heights not exceeding 40 cm above ground level (low vegetation class according to the ASPRS standard).
We implemented the procedure for determining the membership of a tree to an SP using a script in R language. The developed process consisted of the classification of points in a filtered point cloud according to the affiliation to the unique ID of crown segments, and the affiliation to an area of a sample circular plot. As a result, we were able to determine the percentage of points located in the SP to points located outside this area, which can be seen in Figure 8.

2.5.5. Sample Plots Classification Based on Several Attributes

The SPs analyzed in this paper, despite the fact that they are located in a homogeneous complex of the Knyszyn Forest in neighboring forest districts, can be grouped due to the occurrence of some specific conditions of local character. In this respect, we have made a grouping of circular plots due to six main factors: administrative affiliation of the site (A), radius size of the circular plot (B), proportion of gaps in the circular plot determined as the spatial difference of the sample plot and the area from the crowns represented by the CHM (C), variance of the area of the rectangular projection of the crown in the circular plot (D), variance of the height of the trees in the sample plot (E), and proportion of the number of trees with apex visibility 2 to visibility 1 (F). The ranges of variation of the plot differentiation factors, that we used in our analysis, along with the sample size in classes, are presented in Table 2.

3. Results

In the comparative study, we performed a detailed analysis of the error distribution for each of the considered parameter sets, which ultimately allowed us to identify optimal solutions for the parameterization of the methods within each category (A–F) and group (g1–g3) of SPs. The objective function was to minimize the Root Mean Square Error (RMSE) value. In particular categories and groups of SPs, we noticed a large variation in the number of measured trees (ranging from 5 to 157, on average 27) on SPs with various sizes. For the correct evaluation of this factor, we also minimized the Mean Absolute Percentage Error (MAPE). We used the number of trees from ground measurements (14,199) with full and partial crown visibility from the aerial ceiling as a reference in the error calculus.

3.1. Impact of Parameterization of ITD Methods on Estimation Errors

The results of the ITD on SPs obtained with the use of the considered methods indicate a very high efficiency of representing the variability of the tree count ( R 2 = 0.90 ). Depending on the group and category of the circular plots, as well as on the adopted parameter sets, outliers appeared which resulted from a high variability of the number of trees per SP and a very heterogeneous horizontal and vertical structure of stands in the Knyszyn Primeval Forest.
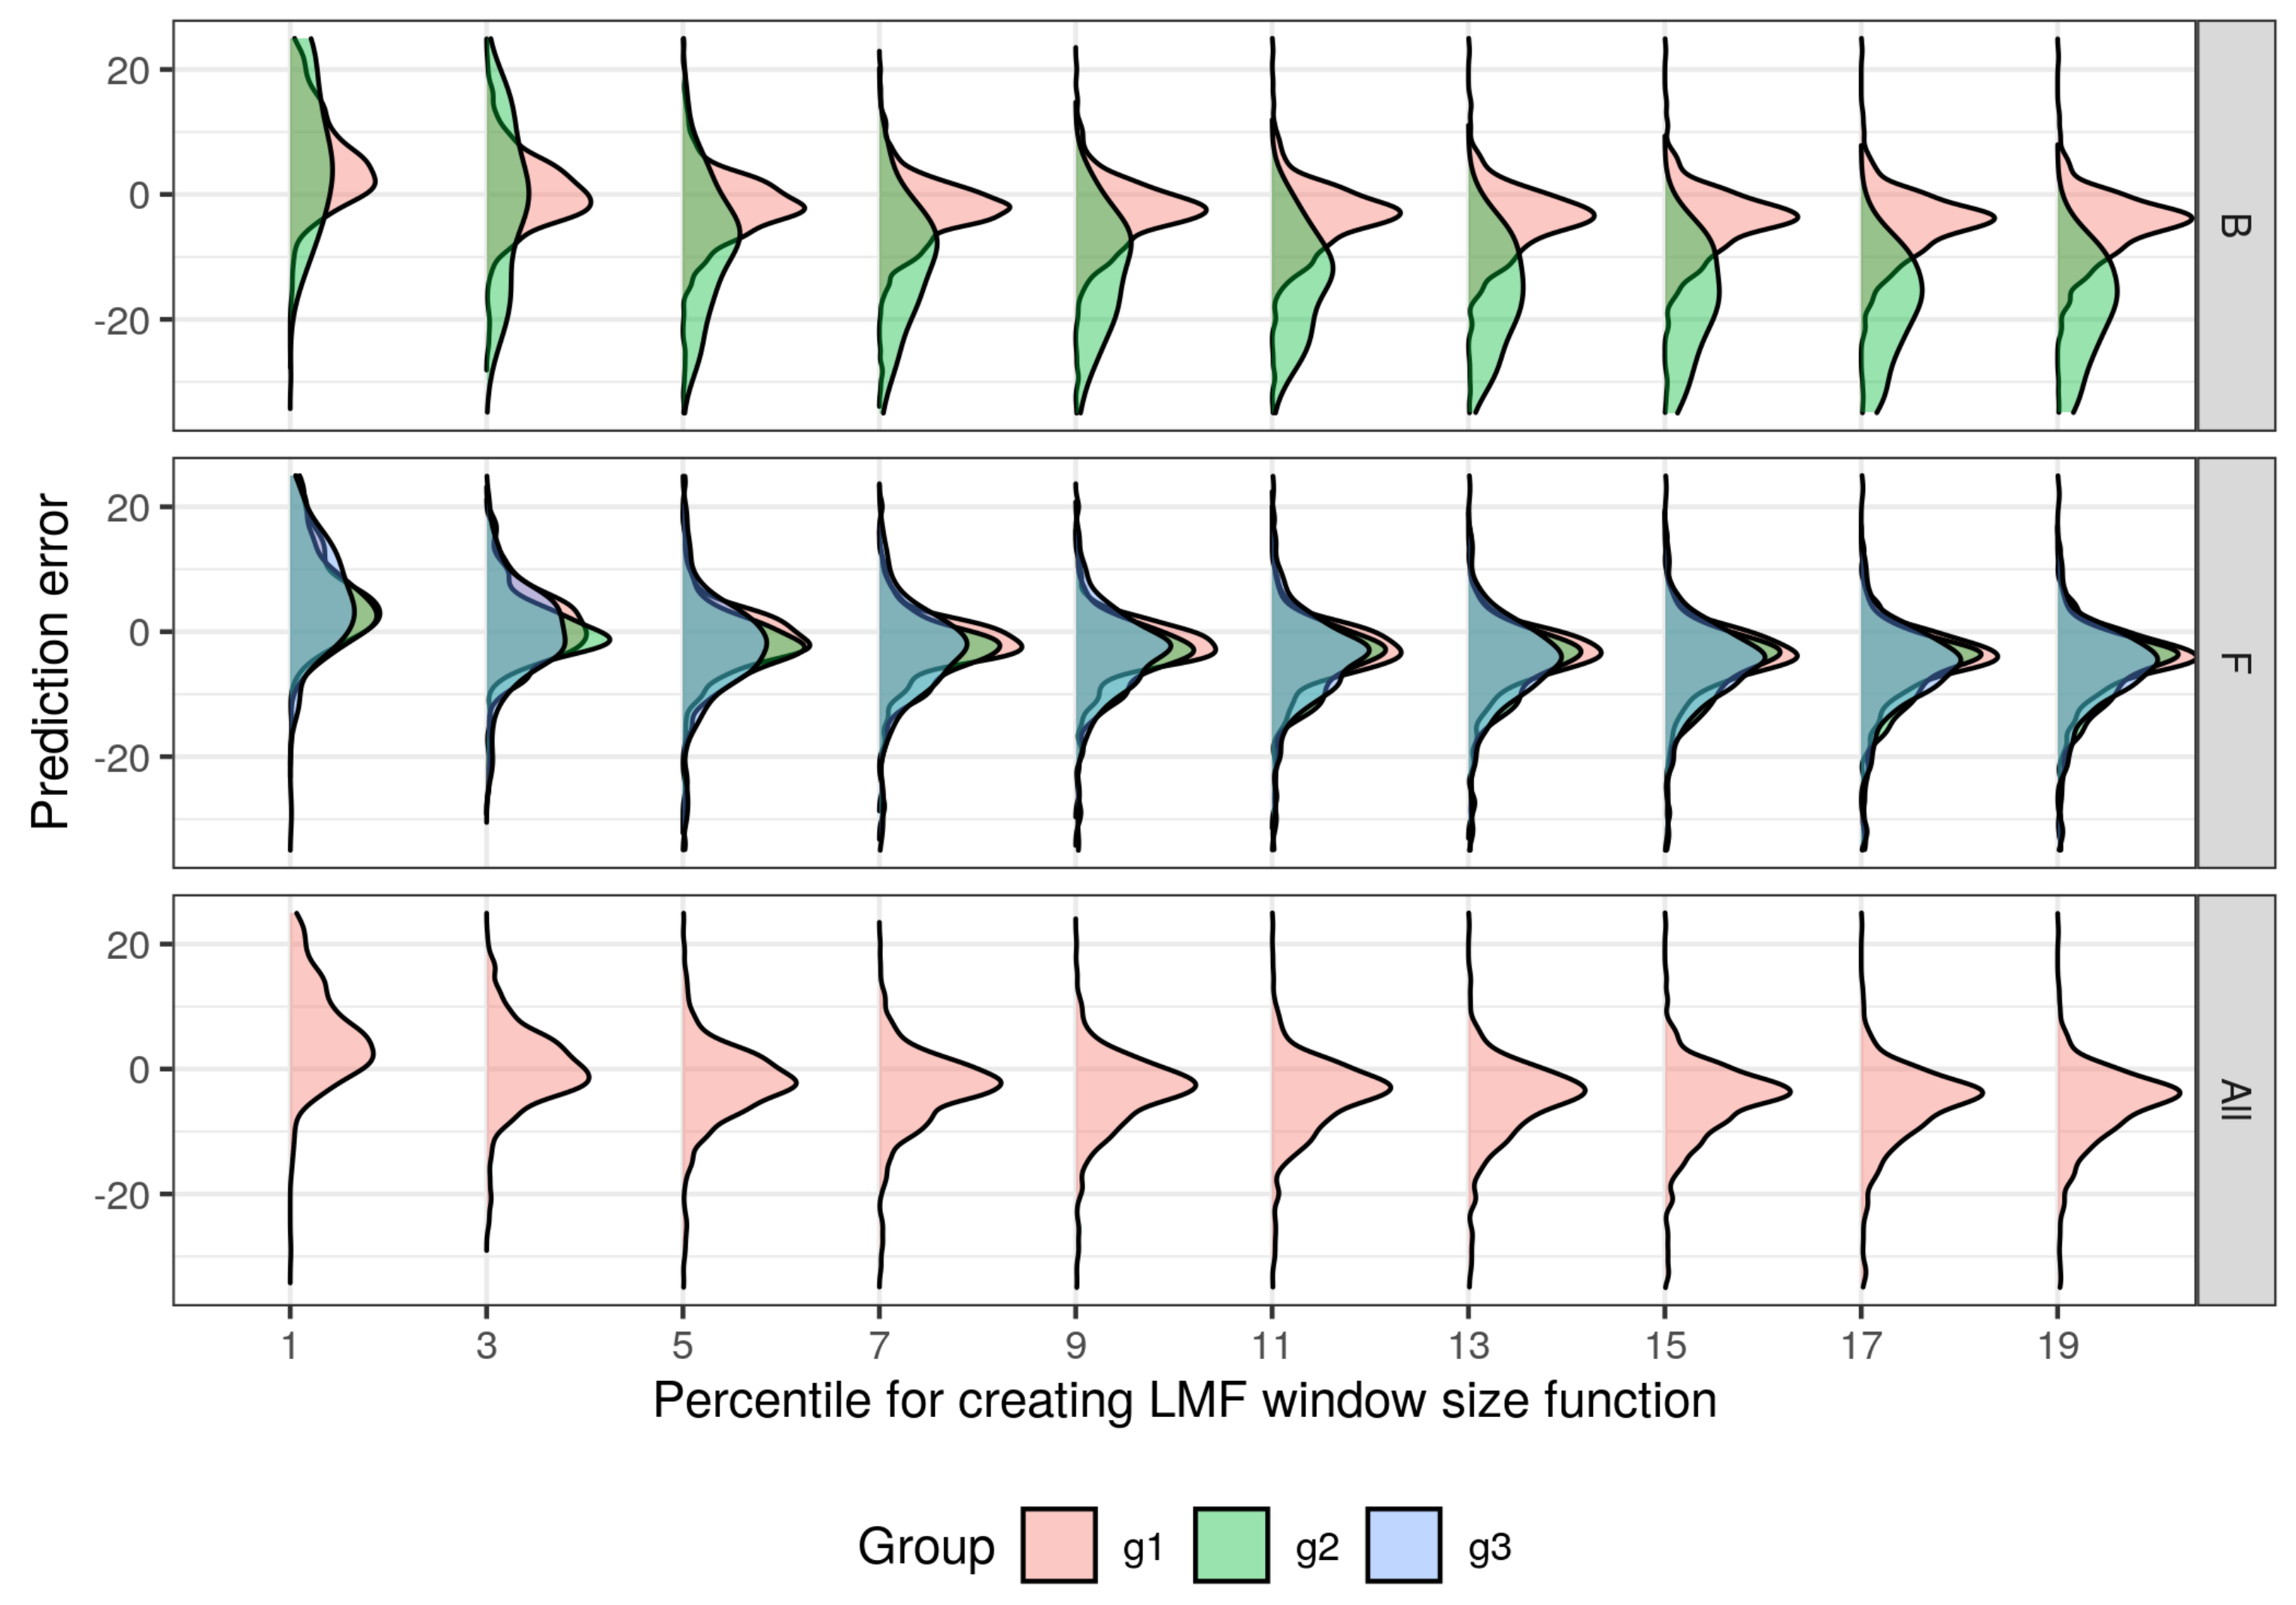
A direct comparison of the number of trees from ground-based dendrometric measurements to the number of treetops detected by the LMF+GR algorithm allows us to conclude that using percentiles in the range ( p [ 0.5 , 2.0 ] ) to construct the LMF function leads to overestimating the results. Subsequent percentiles result in a decreasing trend in the number of detected trees. Considering all circular plots, the optimal variant in the ITD analysis providing a symmetric distribution of errors is the percentile 3.0. On the other hand, considering the categorization of SPs shows very strong disproportions of the error distribution between plots with different radius sizes. A similar situation applies to categories involving trees with partially obscured crowns (shown in Figure 9).
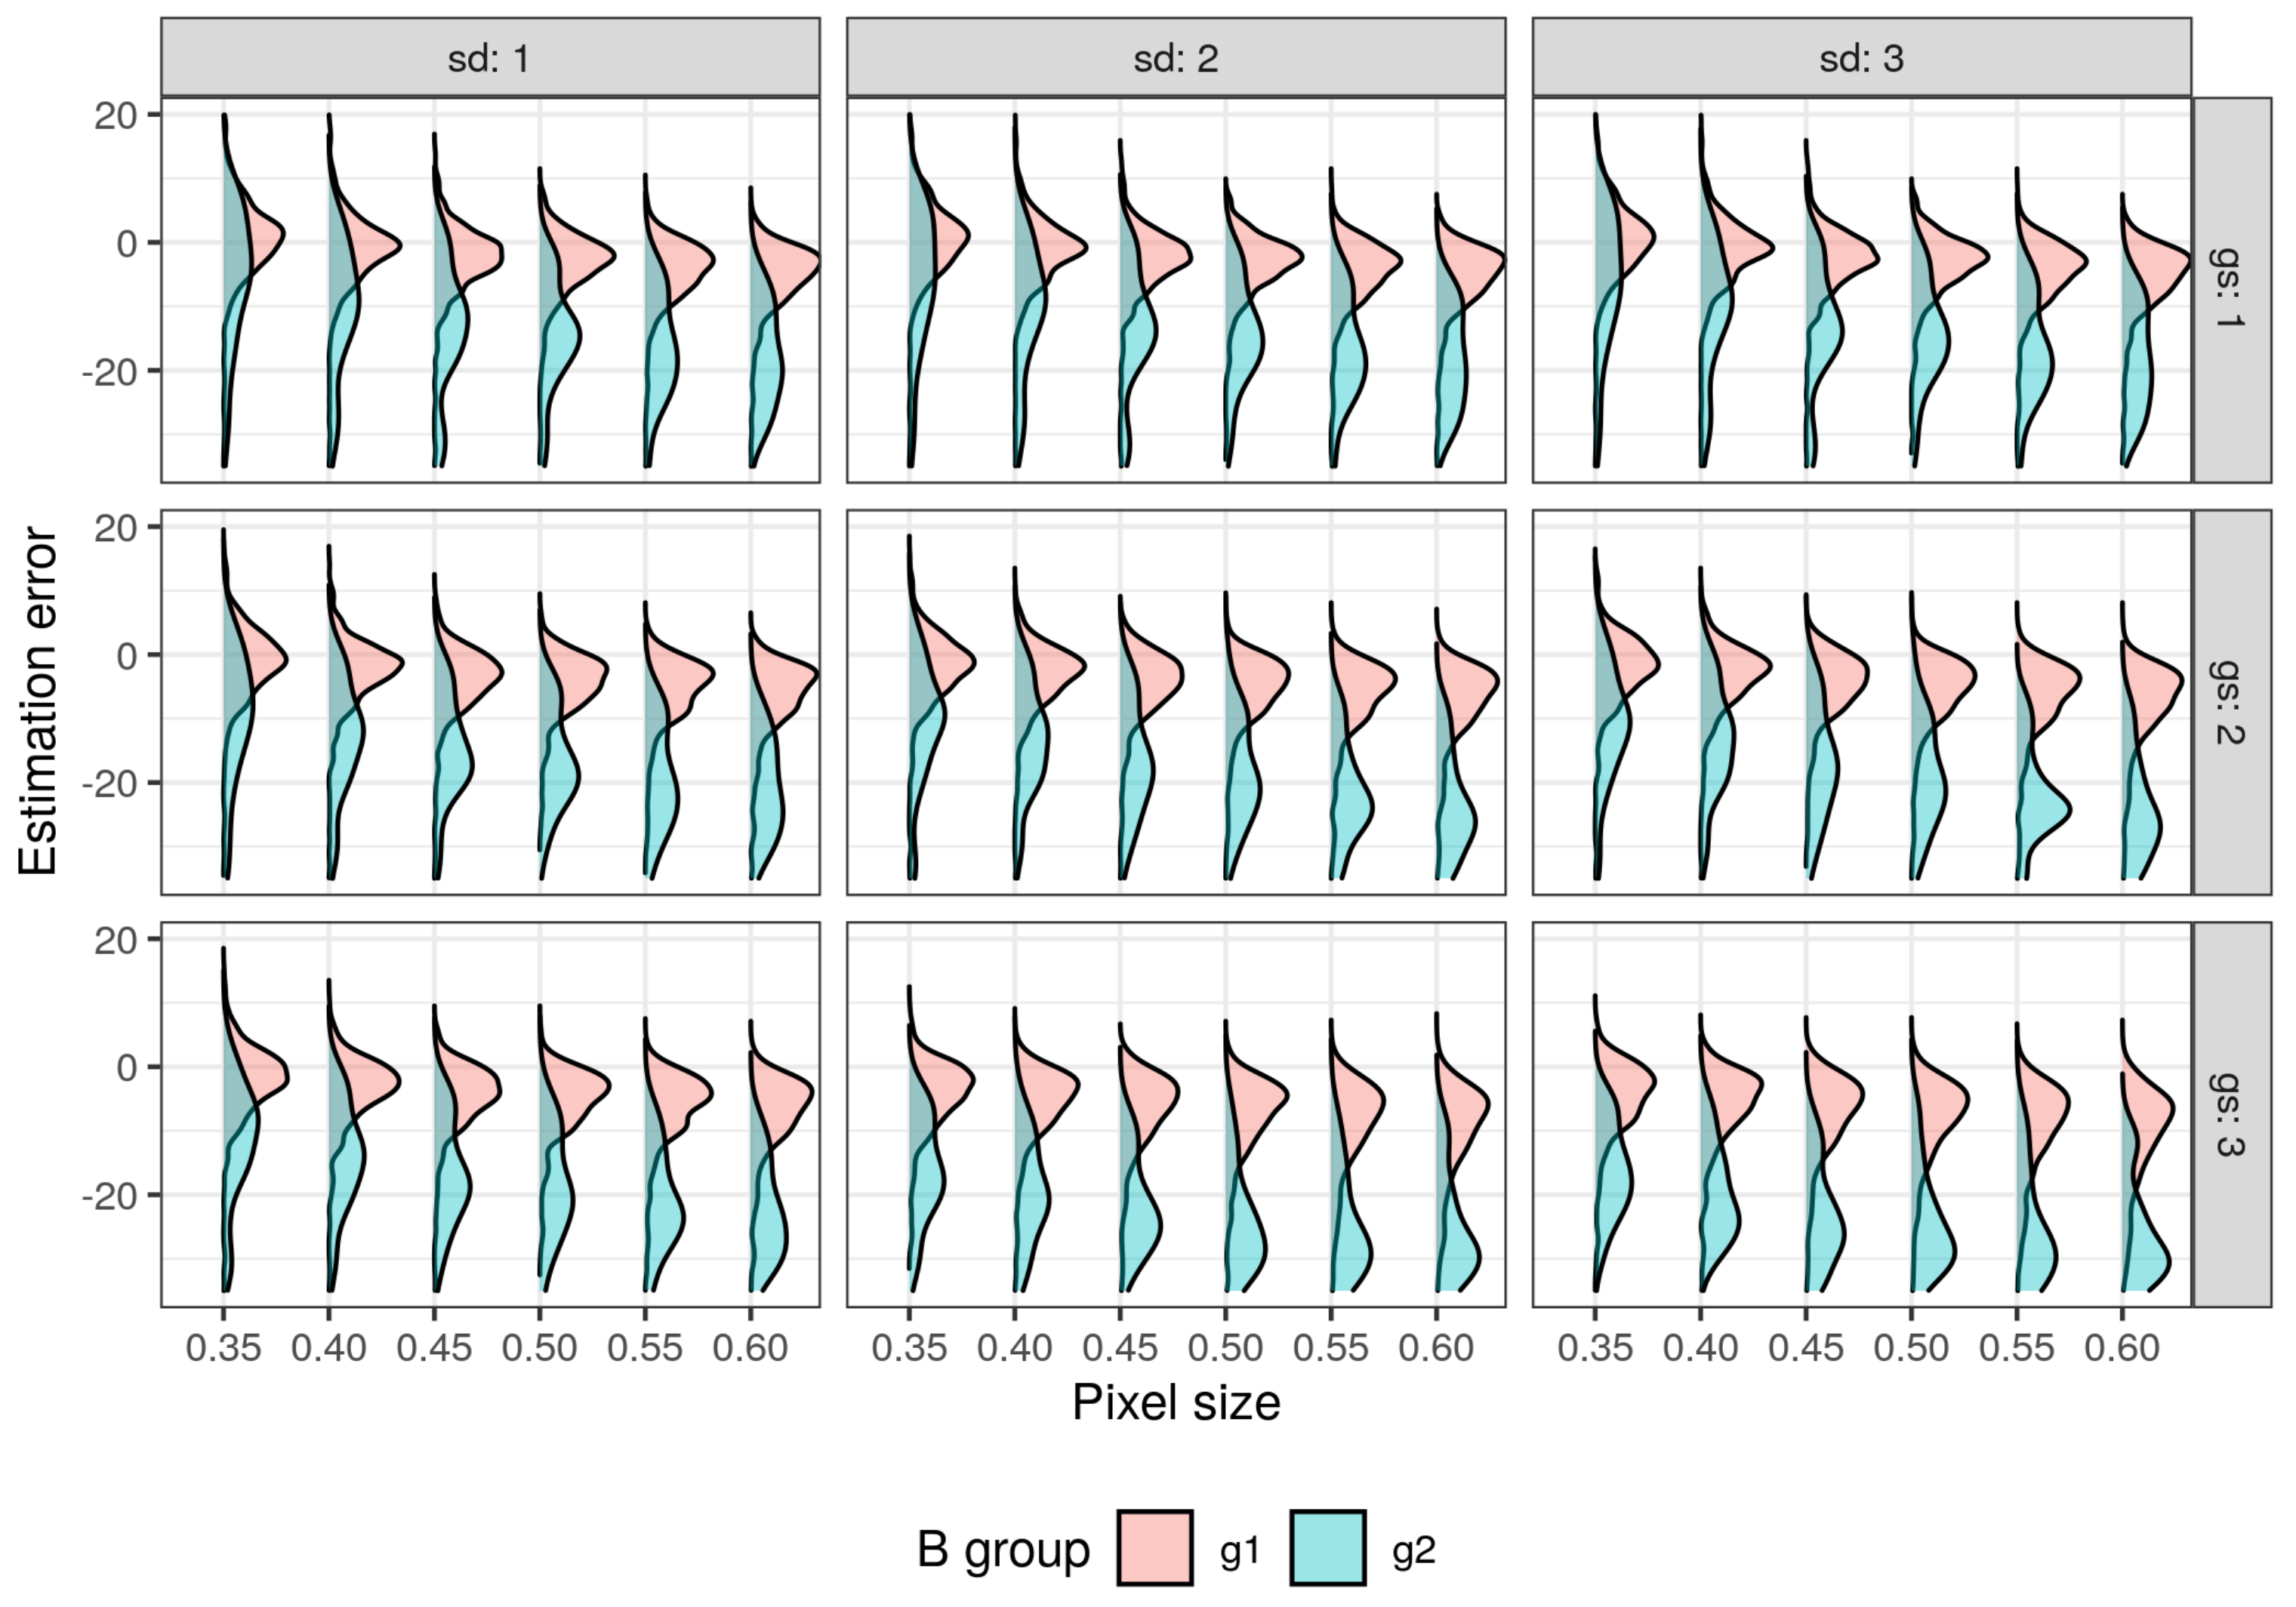
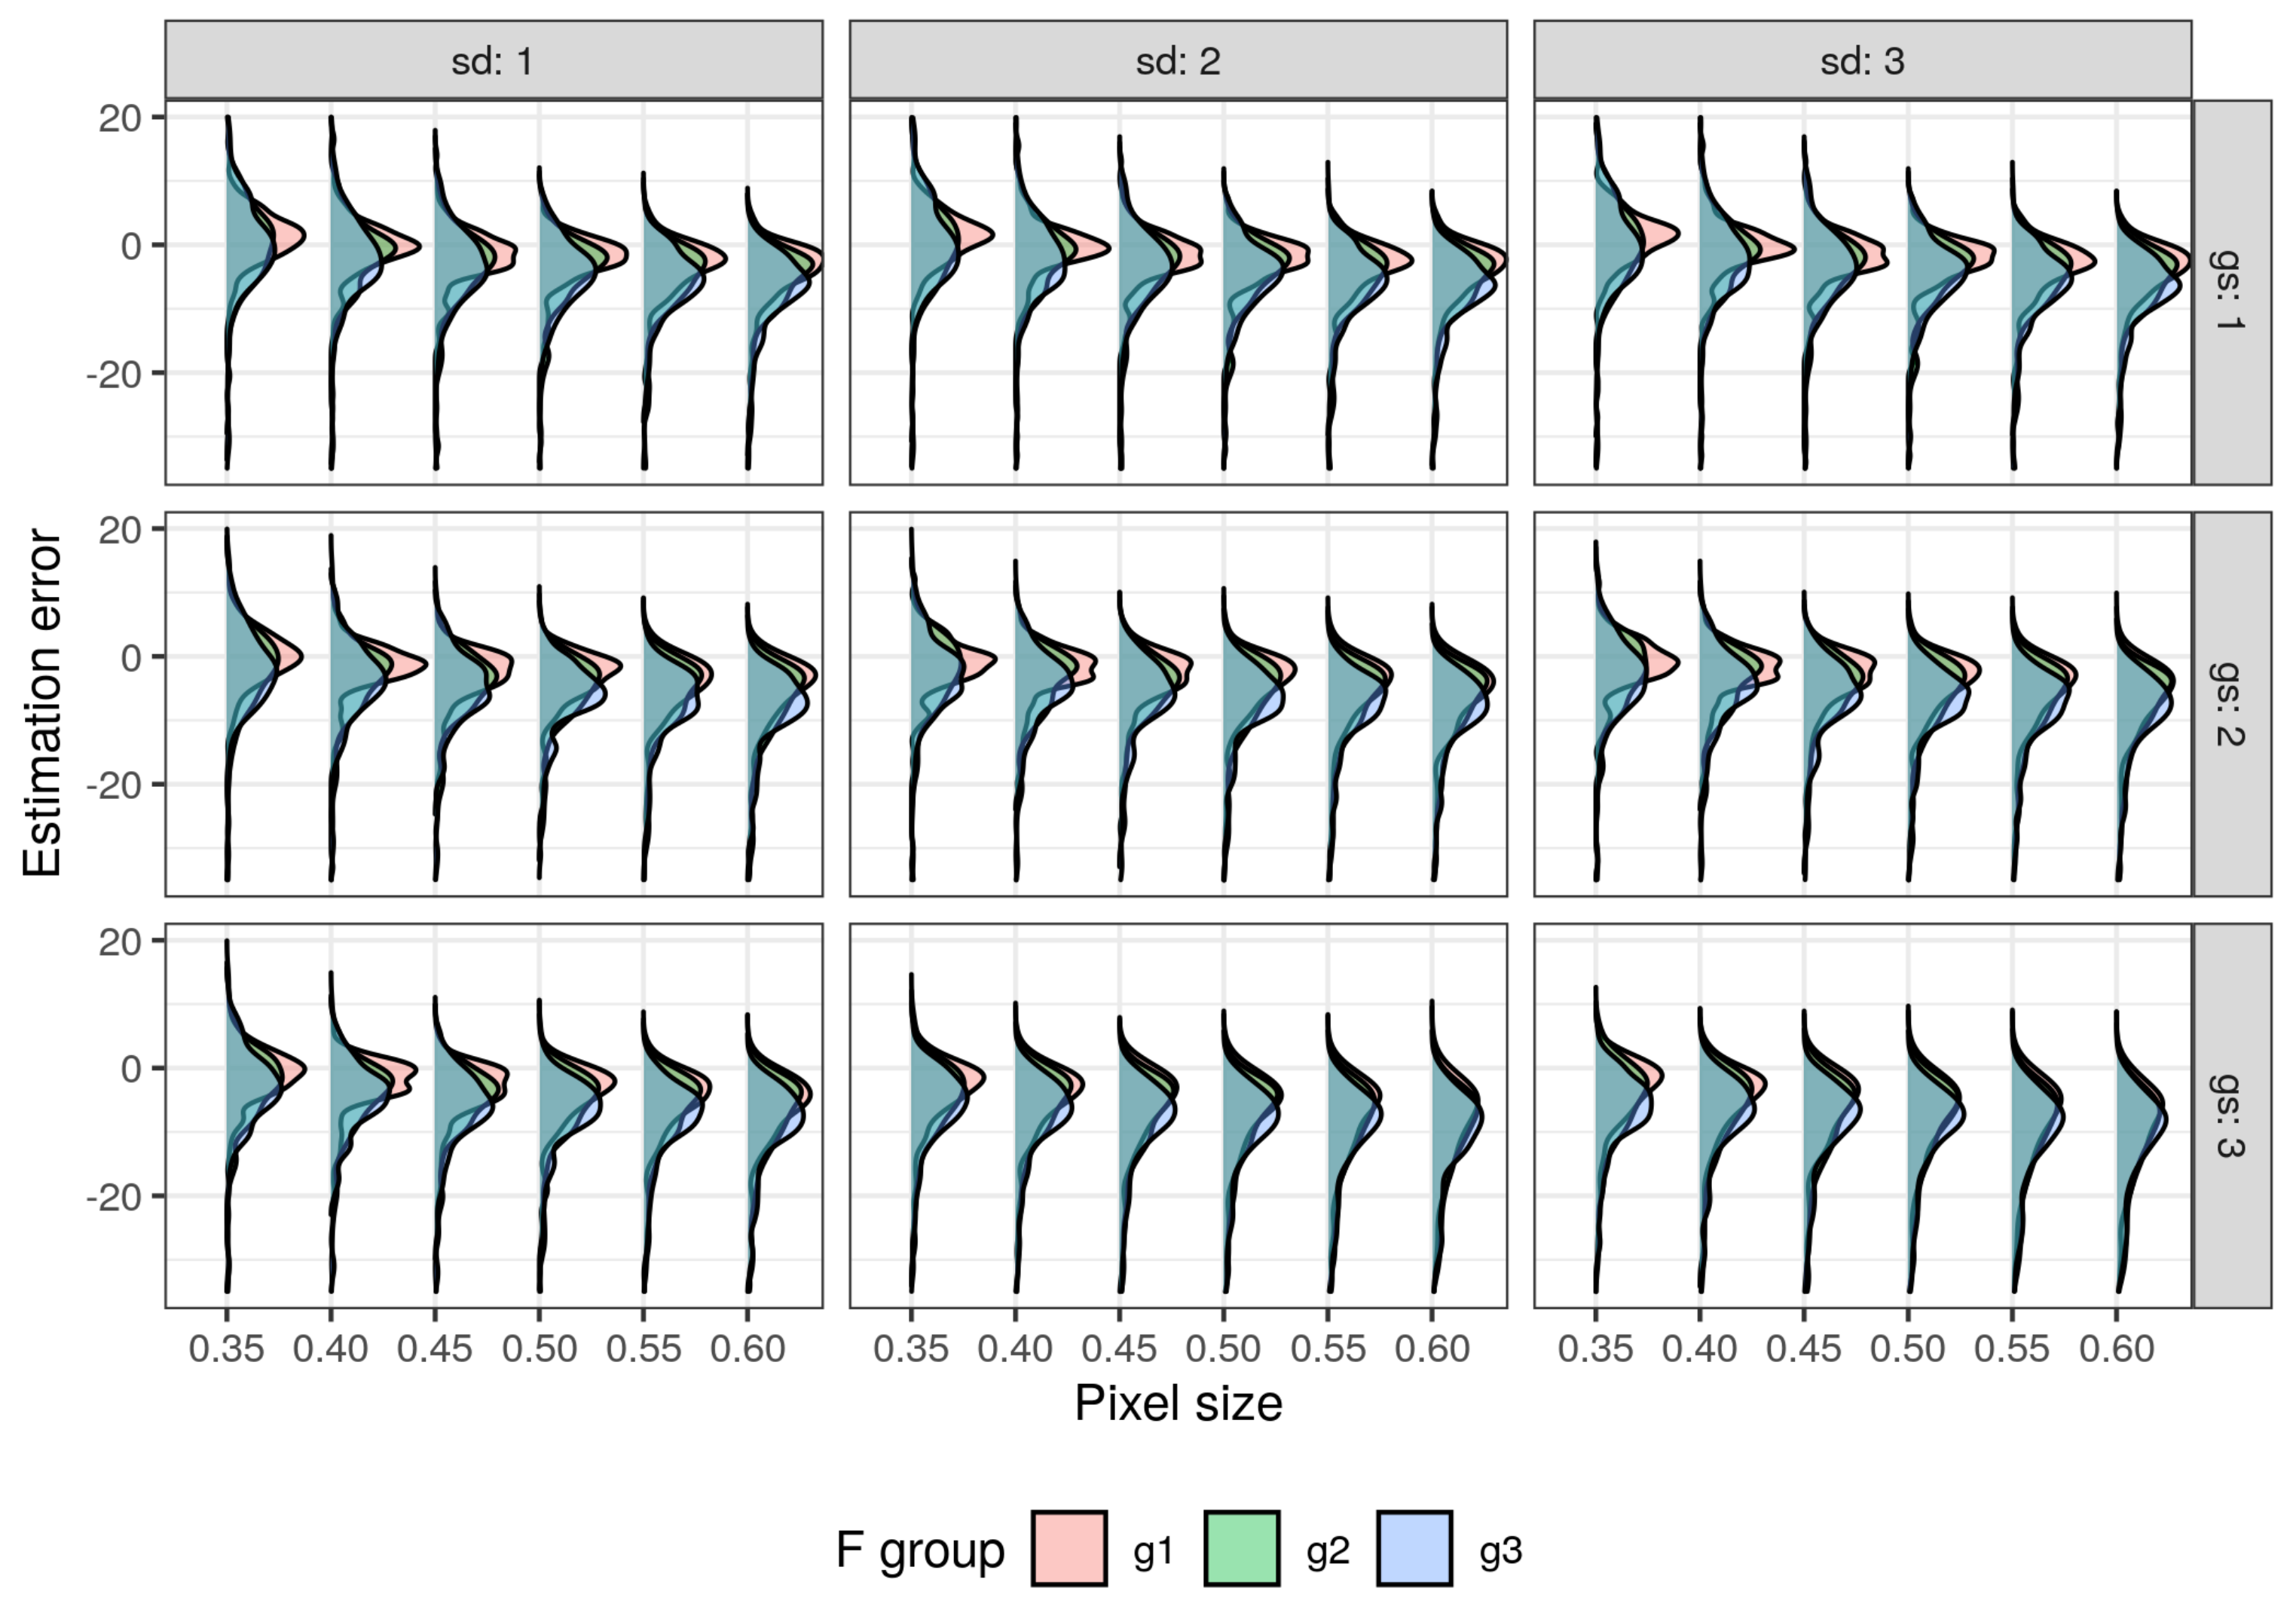
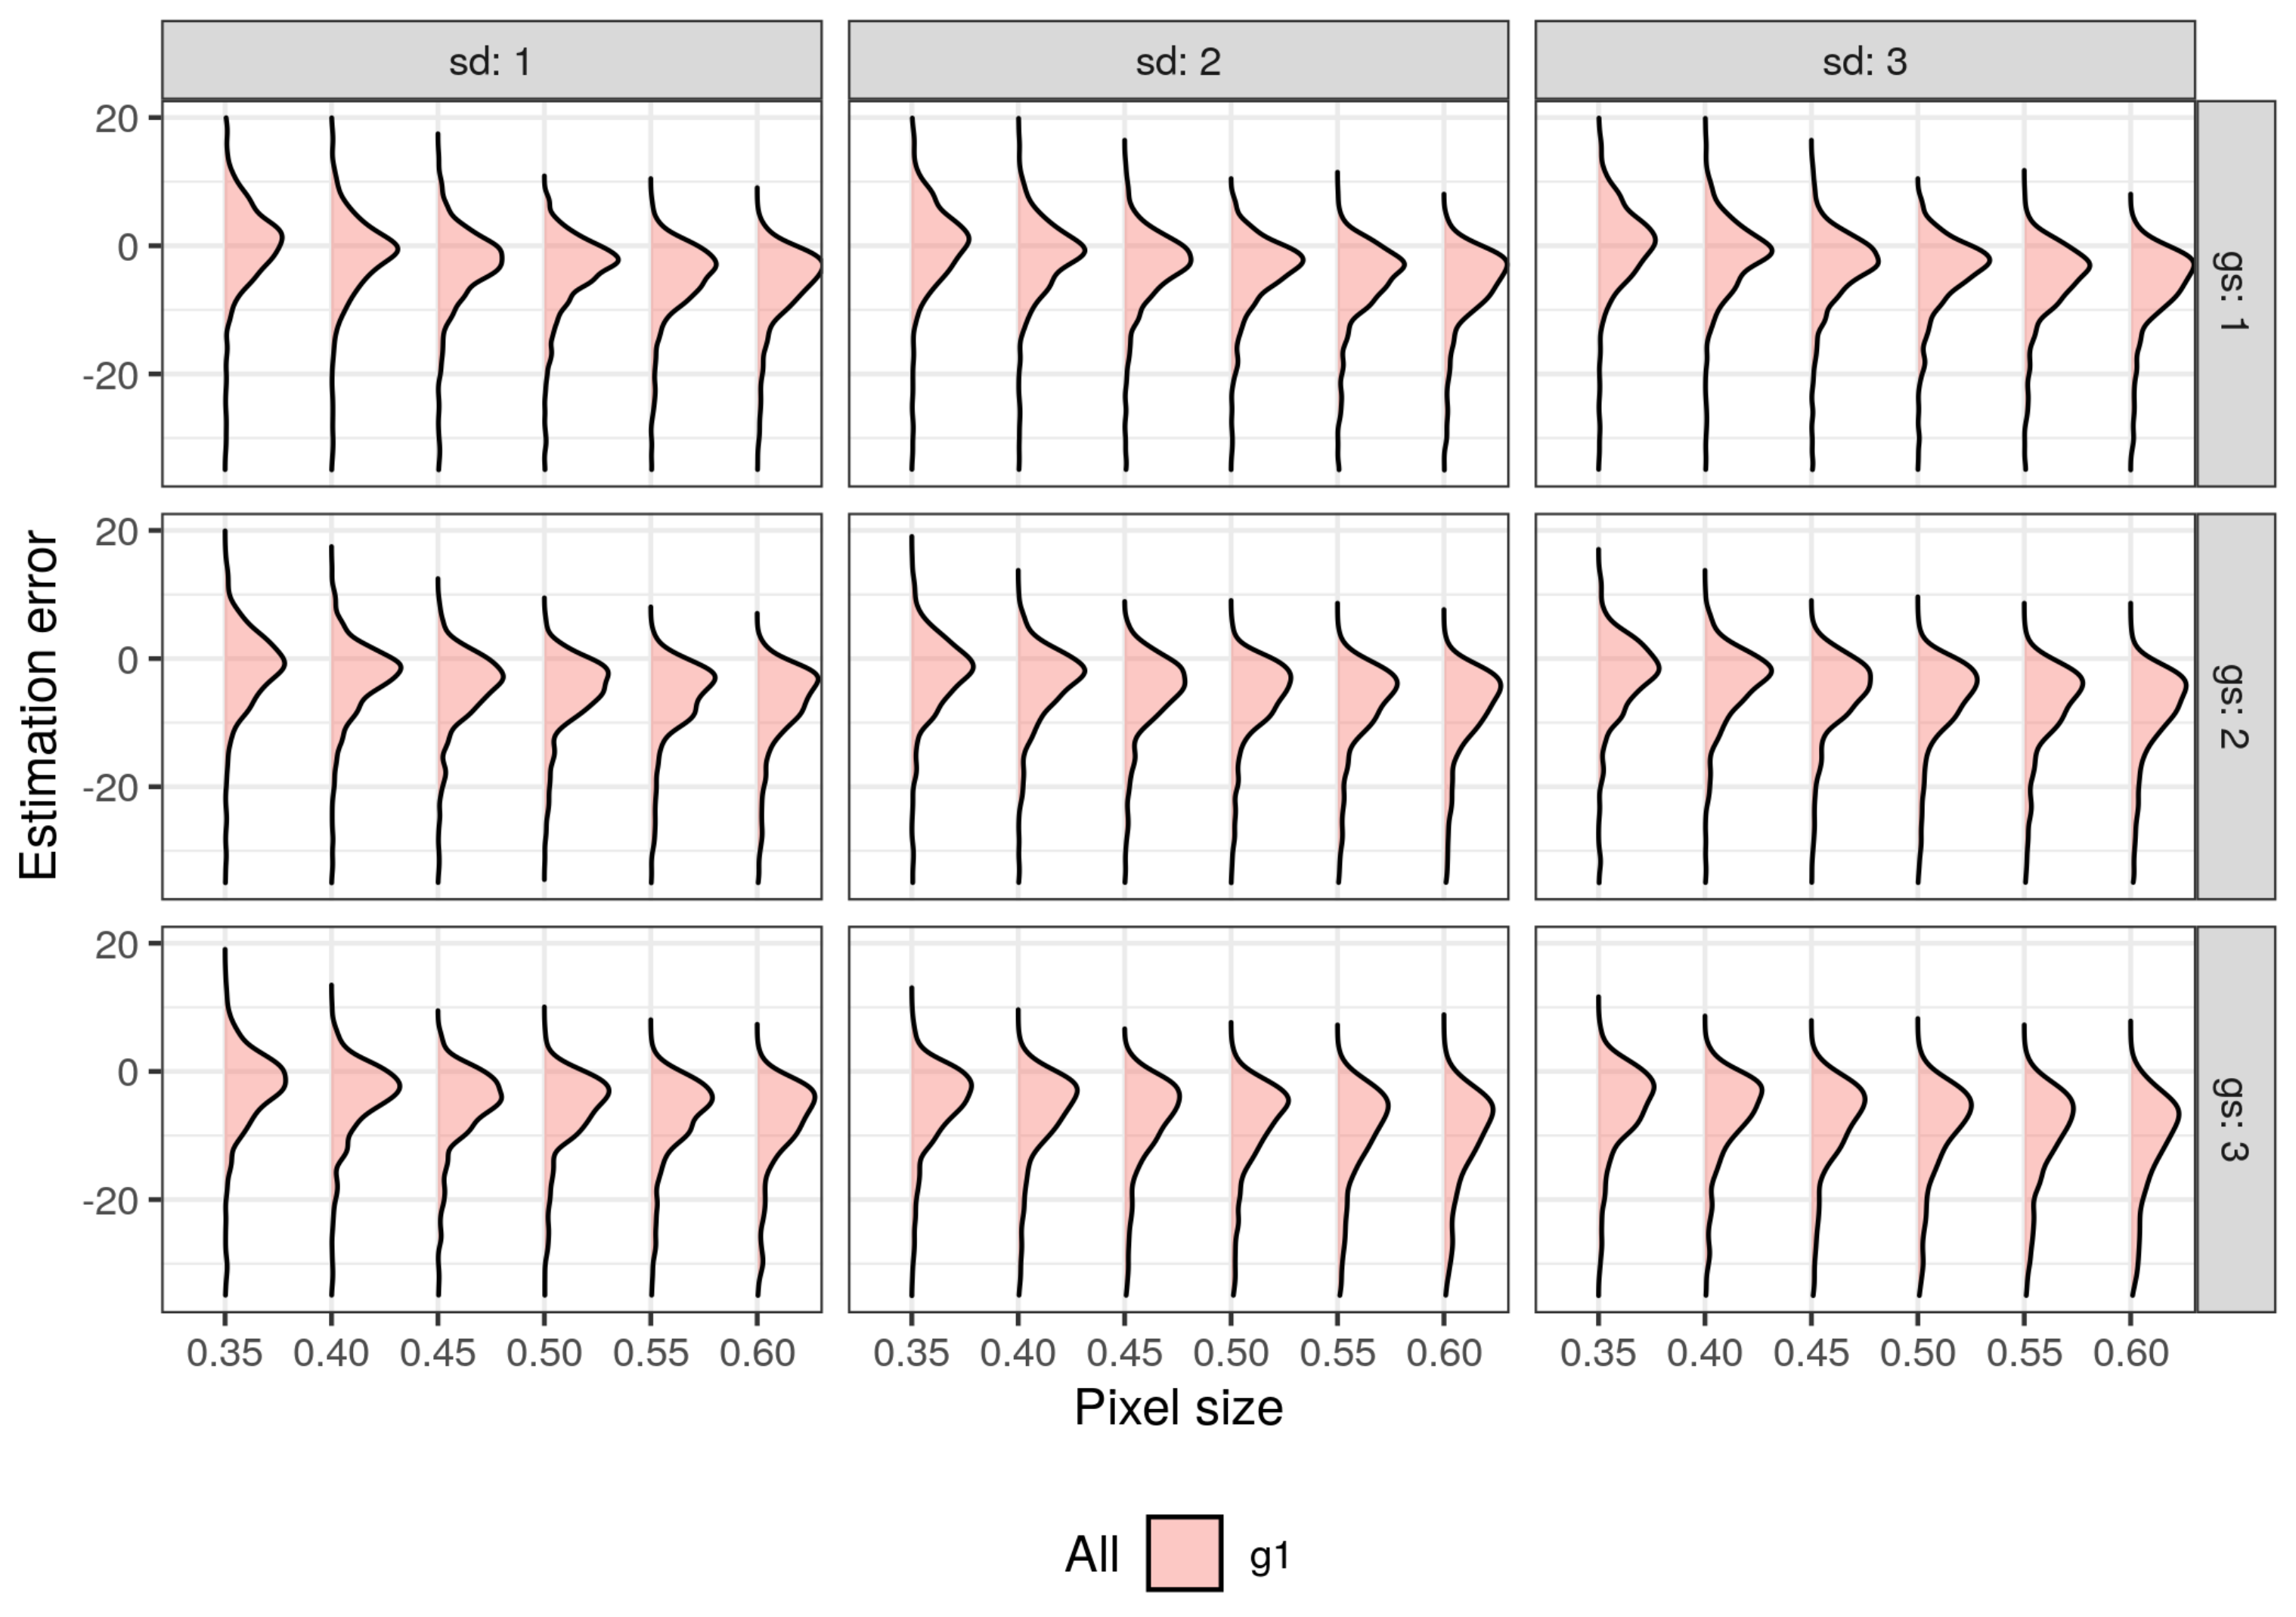
Analysis of the estimation error distribution with respect to the WS method shows that the most symmetric distributions were obtained for the analysis variants with CHM in the range 0.35–0.40 m spatial resolution, and low smoothing strength. Increasing the pixel size and the strength of smoothing causes an underestimation of the detected trees over SPs. It is also worth pointing out that with this method there are no solutions that cause the overestimation of the results (as was the case with low percentiles in the LMF method). Moreover, the results are strongly influenced by taking into account differentiating factors such as the SP radius and the share of trees with partially obscured crowns (presented in Figure 10, Figure 11 and Figure 12).
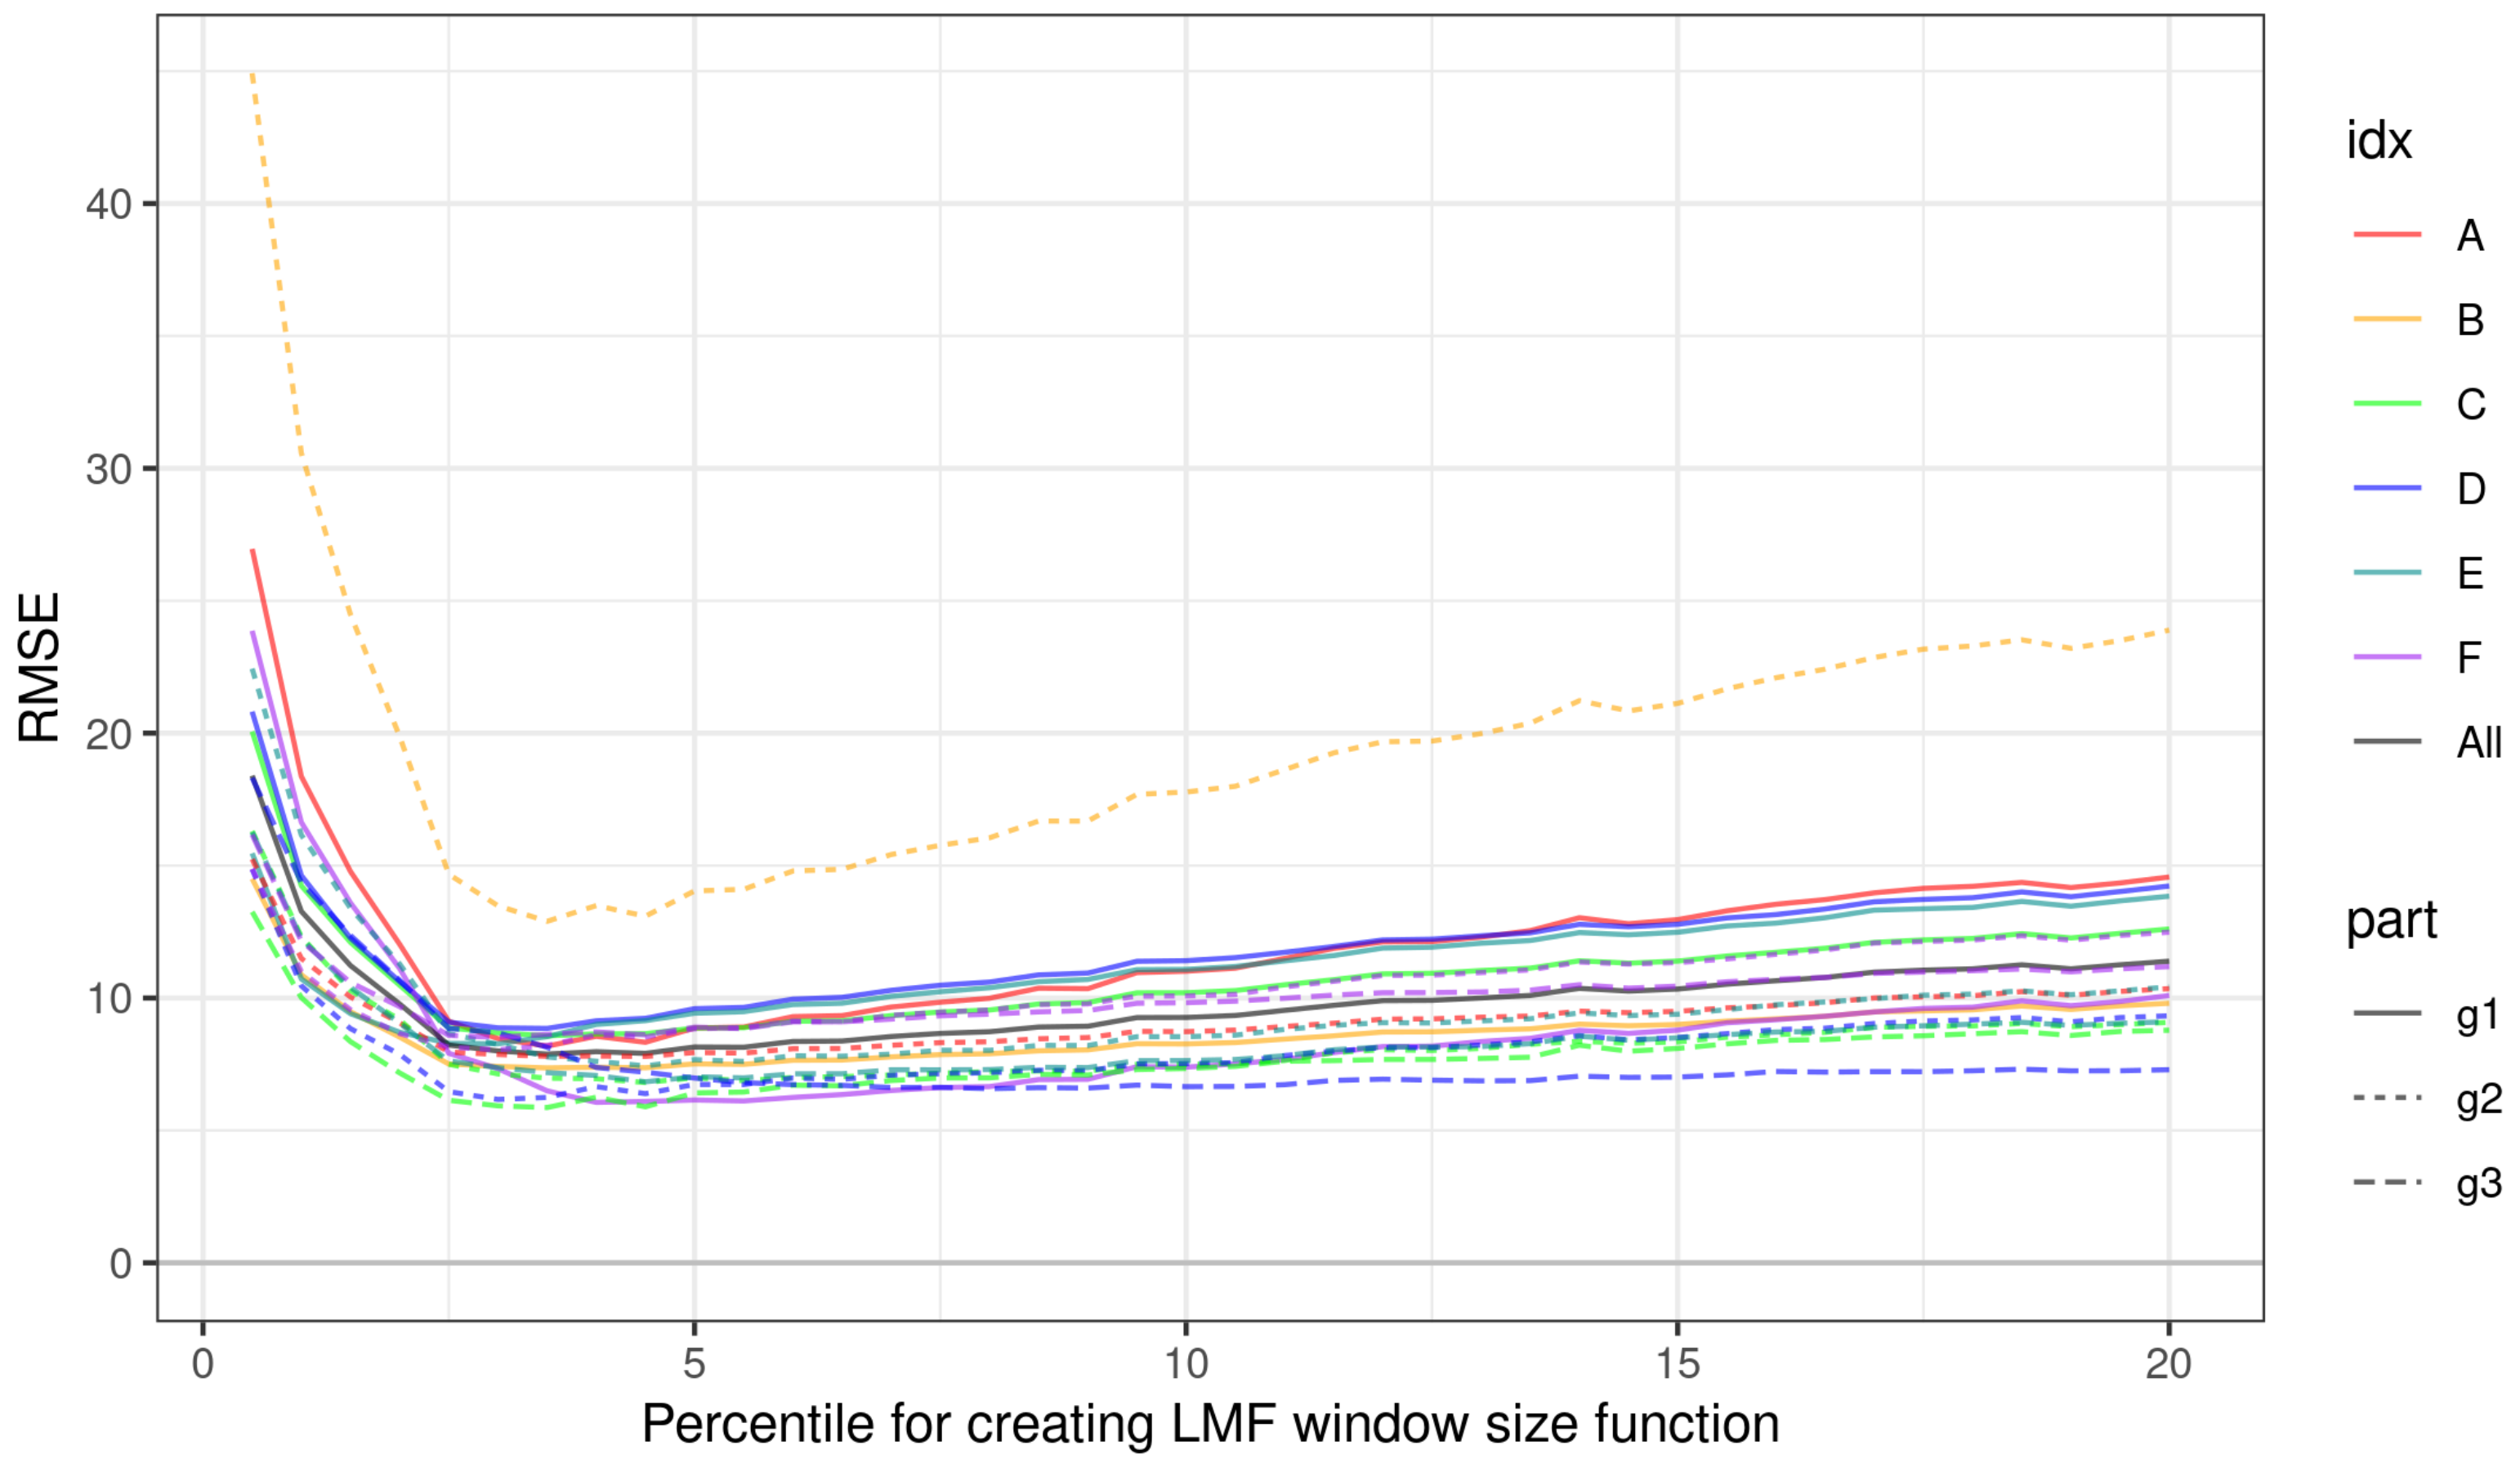
Using the LMF+GR method, we recorded the highest RMSE in the range of 0.5–3.0 percentile of the crown diameter used in the parameterization of the LMF function. Crown diameter percentiles, p [ 3.0 , 6.0 ] , resulted in a stabilization of the RMSE, while we noticed a slight increasing trend in the subsequent percentiles. Analyzing the curves in Figure 13, it can be seen that the highest values of the metric occur for the variant B-g2 covering SPs with r [ 20 , 25 ] , which is dictated by a significantly higher number of ground measured trees (80 trees on average) on enlarged SPs, as compared to typical SPs with r 12.62 m, where 23 trees were recorded on average. The detailed decomposition of the metric’s variations in SP groups and categories allows us to distinguish the characteristic features of stands. These qualities affect the propagation of the laser signal and detection quality. The method applied leads to a higher efficiency in the case of stands with a more than 20% share of crown gaps and is characterized by a greater variance of height and size of crowns (groups g2 and g3). Simultaneously, the analysis of variation of RMSE in group F (ratio of the number of trees with visibility 2 to visibility 1) indicates that the results deteriorate with the increasing share of partially obscured trees.
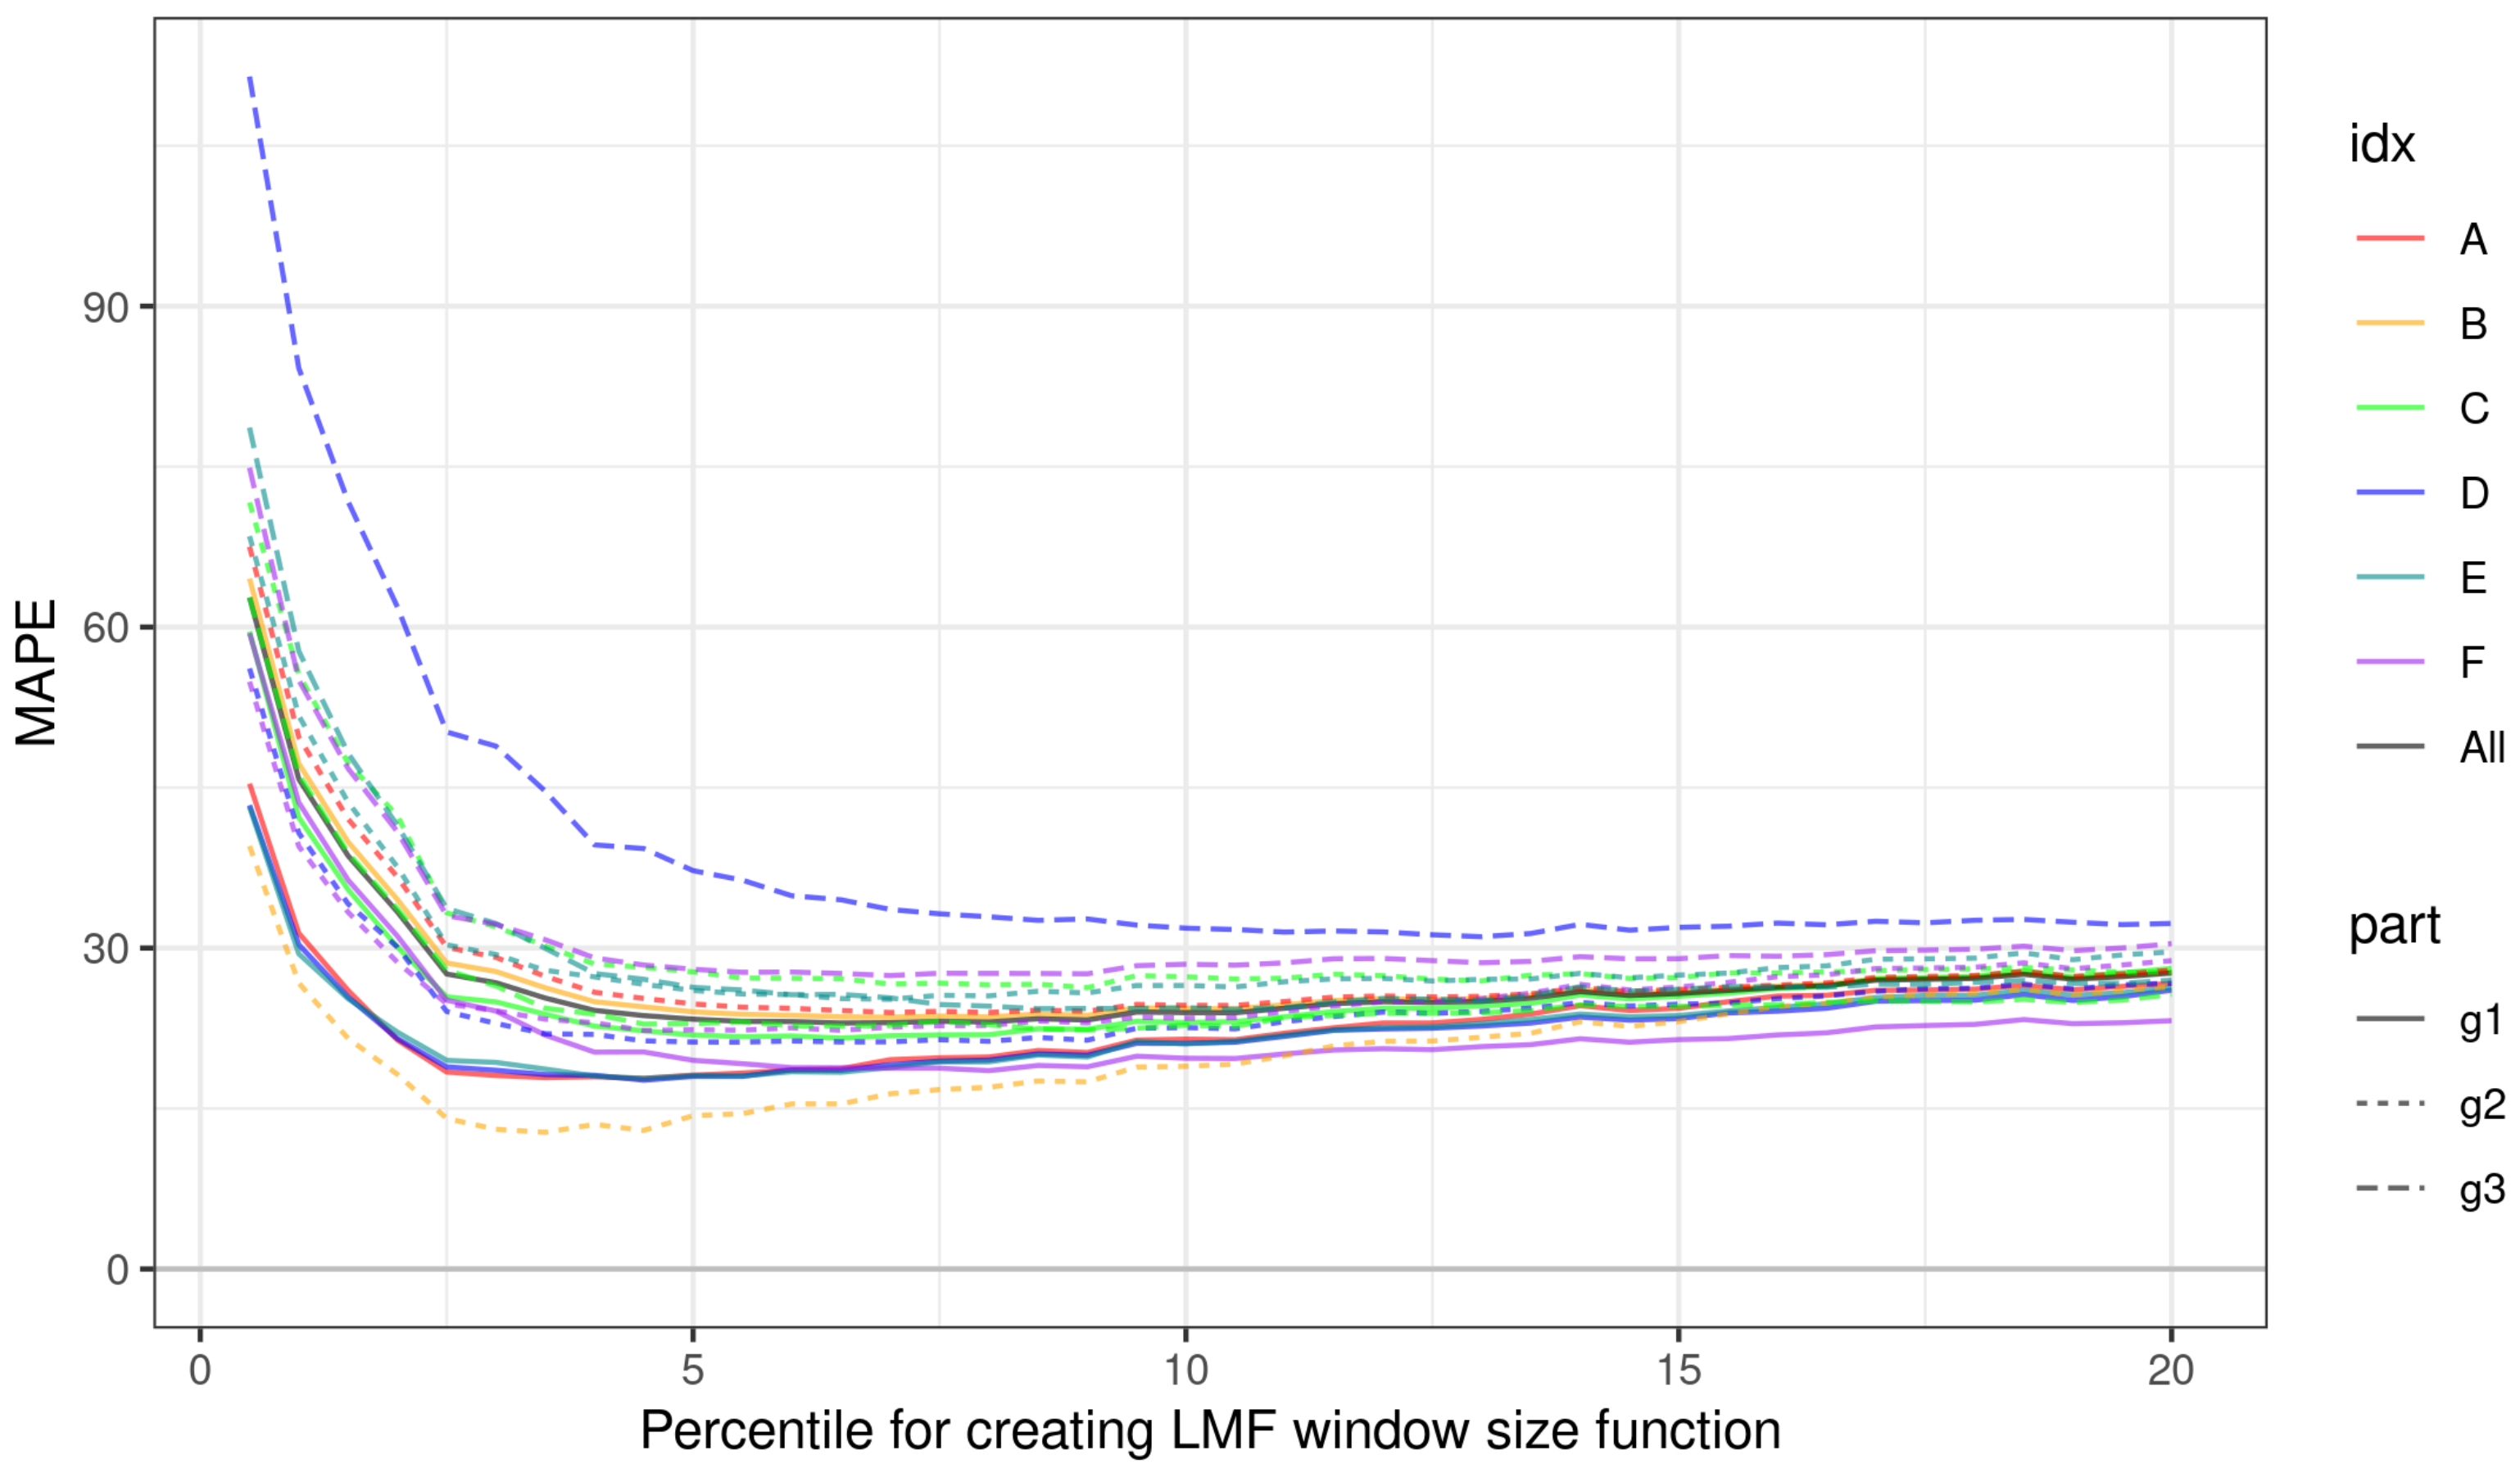
Analysis of the variability of the MAPE metric allows us to conclude that we obtained the lowest percentage errors for estimating the number of trees in the SPs with a radius in the range r [ 20 , 25 ] . In the optimal range of 3.0–6.0 percentile of crown diameter, errors on larger SPs are about 10 percentage points lower than on plots with radius r 12.62 m. In contrast to the RMSE metric, we obtained lower errors in stands characterized by less variation in height and crown size (Dg1, Eg1) (Figure 14). The use of higher-order percentiles of crown diameter, on the one hand, obliterates inter-group differences and, on the other hand, reveals an increasing trend in percentage error.
In the case of the WS segmentation method, it is remarkable that the RMSE increases with increasing CHM pixel size and Gaussian filter smoothing strength (kernel size and standard deviation). Figure 15 shows that the optimal set to minimize the RMSE error is a CHM with a pixel size in the range of 0.35–0.45, smoothed in the closest neighborhood of the processed cell (kernel size 1). Analyzing the variation of RMSE in categories and groups of SPs, it can be seen that the algorithm used performs better with stands with a greater variation in height, crown diameter, and with a greater proportion of gaps between crowns. Similar to the LMF+GR method, we obtained worse results on SPs with a higher proportion of crowns partially obscured by crowns of taller trees.
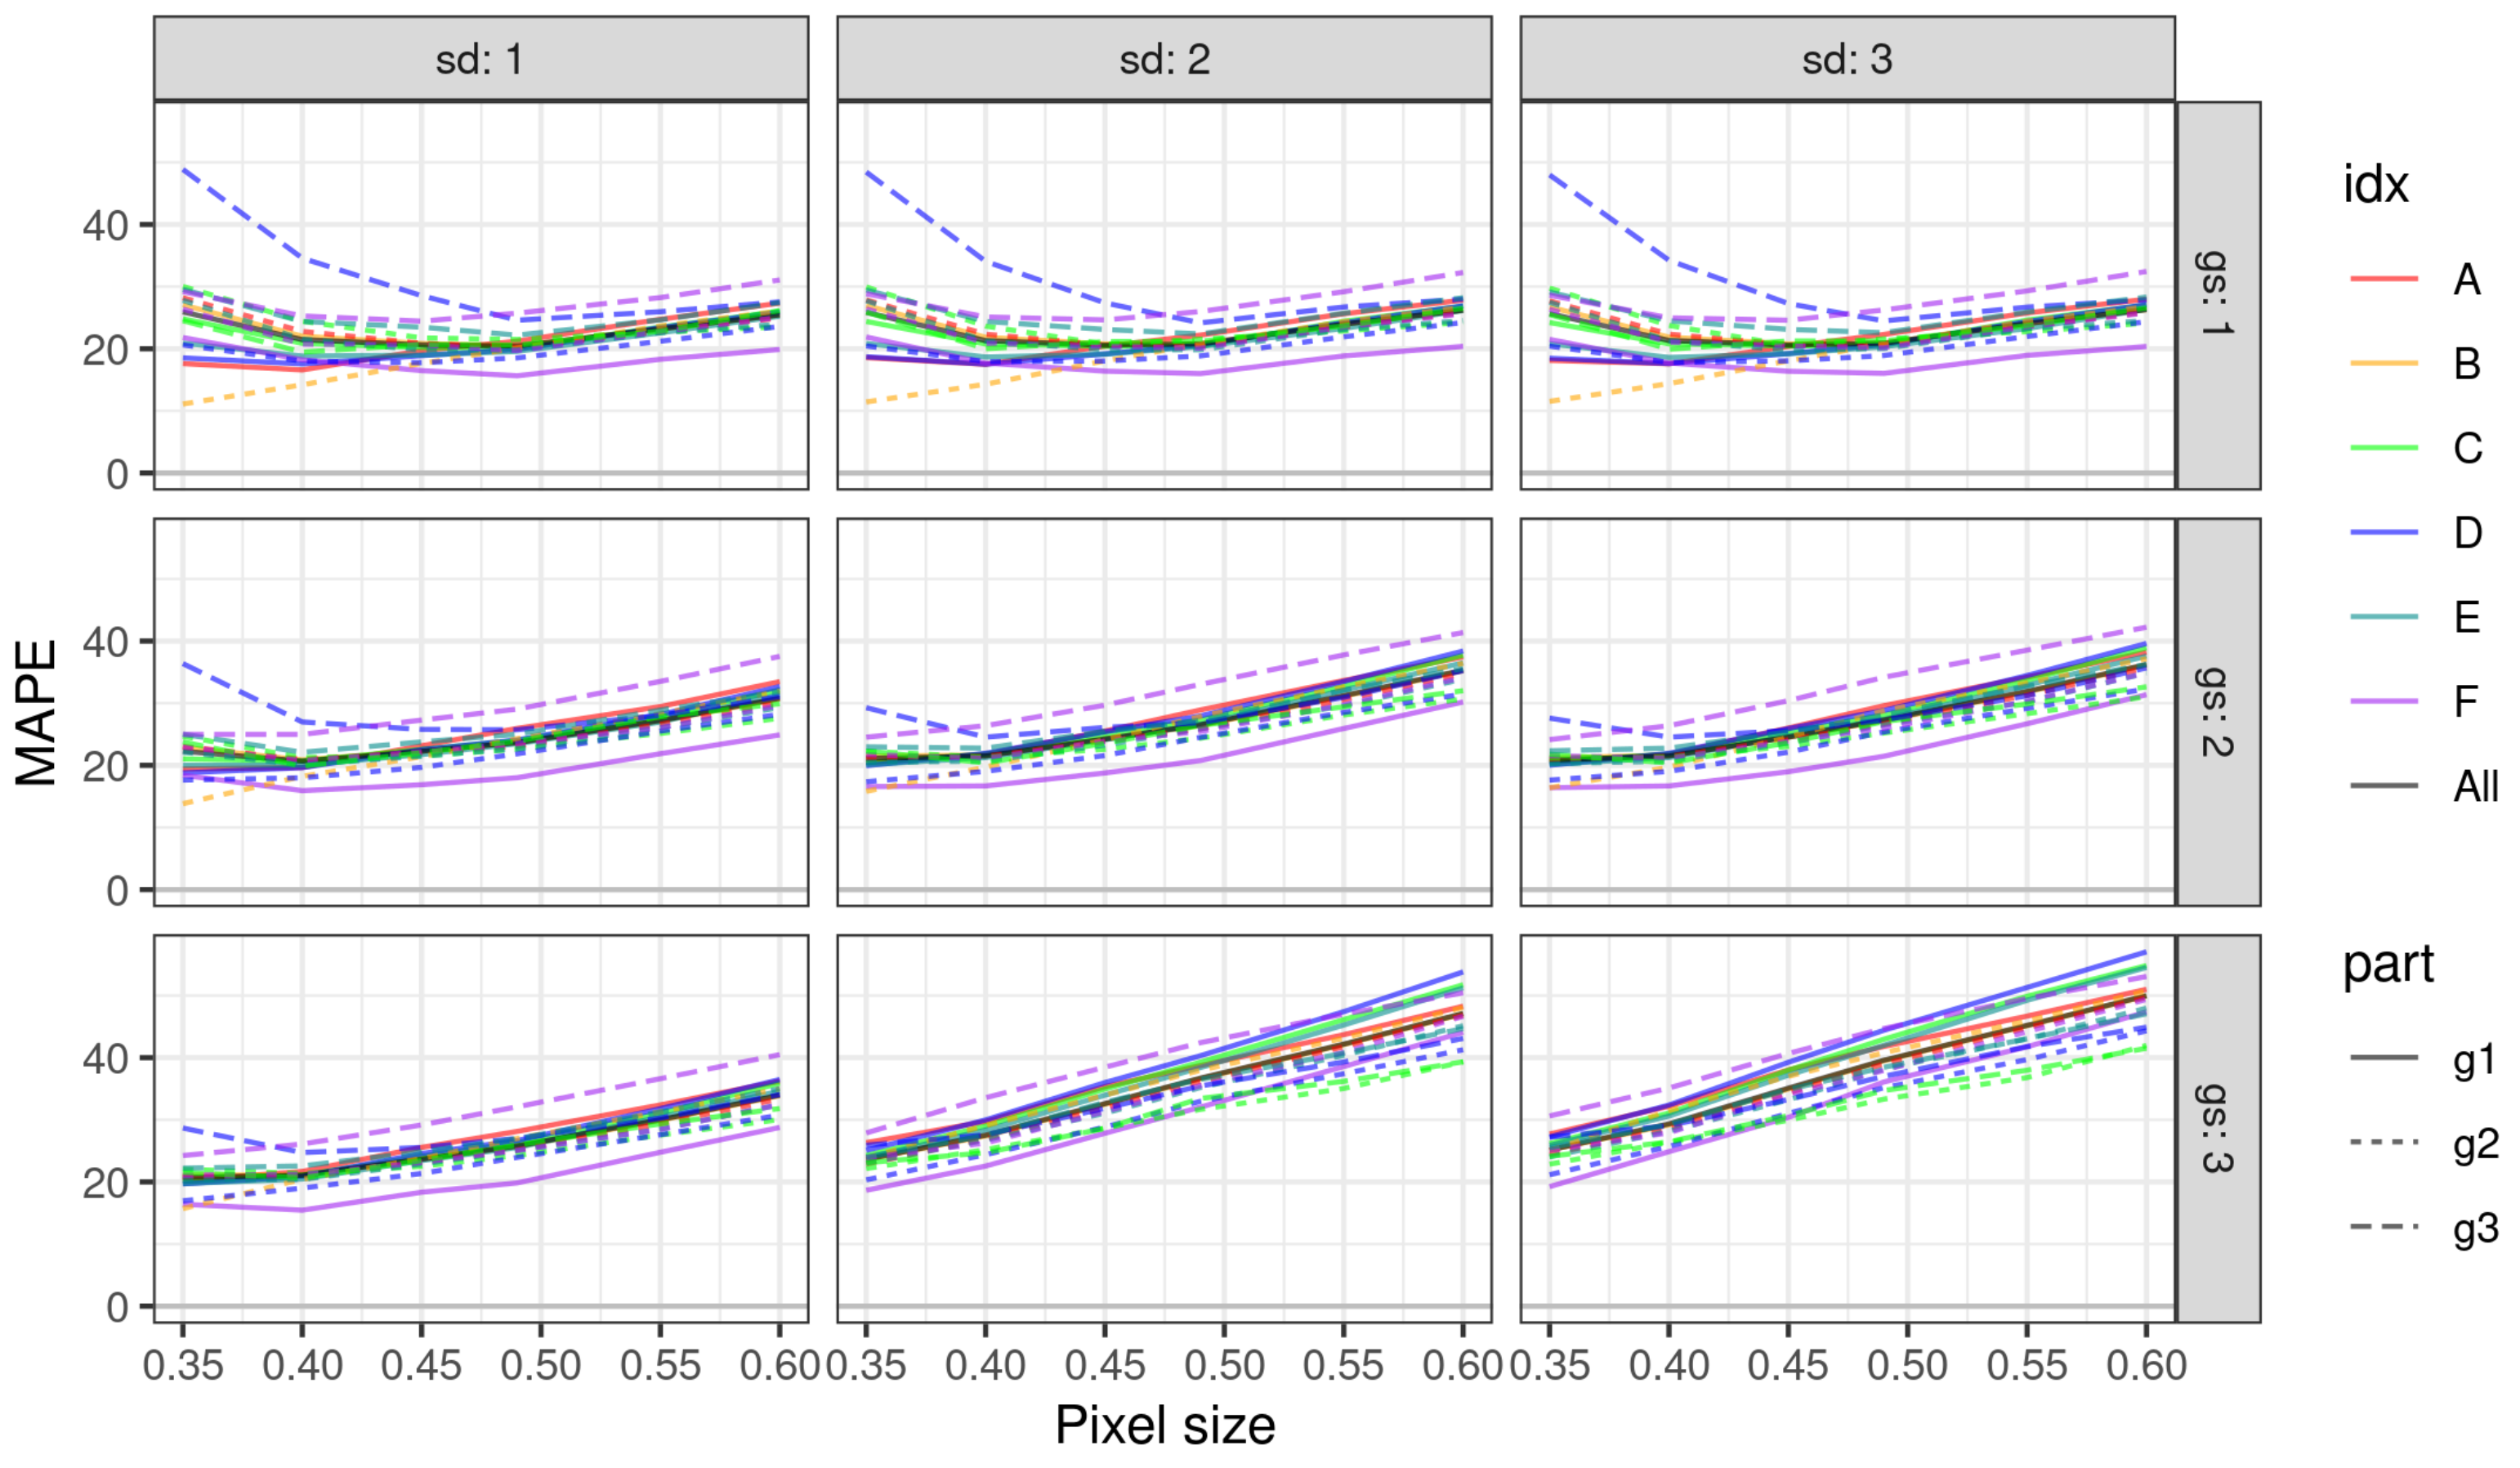
Referring to the effect of the parameterization of the WS method on the MAPE value (presented in Figure 16), the differences in subgroups Bg1 and Bg2 (variation of SP radius) disappears with increasing pixel size and degree of smoothing of the CHM. Nevertheless, in the range of optimal variants of parameterization, the errors on SPs with smaller radii are much higher, reaching the level of 20 percentage points with minimal smoothing of the CHM with a pixel size of 0.35 m. For the WS method, we noted only slight differences in percentage error values between stands in different groups of categories of gap proportion, height variance, and crown size. MAPE differences for these group categories are less pronounced than for the LMF+GR method.

3.2. Choosing Optimal Parameters for ITD Methods

Detailed error analysis allowed us to identify the optimal parameter sets in the considered ITD methods by determining the minimum values of the RMSE and MAPE metrics. Analyzing Table 3, it can be generally indicated that, when implementing the LMF+GR method, the minimization of RMSE is obtained for low values of crown diameter percentiles (3.5–4.5). At the same time, when analyzing stands with a greater variation in height and crown size, the optimal solution shifts toward higher-order percentiles (4.0–8.0). Similar relations occur in MAPE minimization with the difference that the optimal indications are percentiles higher than in RMSE minimization (percentile value on average + 3.0). In this case, the optimal solution for the entire set was estimated for percentile 6.5. On the other hand, the variation of optimal combinations of parameters for the WS method (CHM pixel size and the strength of smoothing with the Gaussian filter) is less pronounced than in the LMF+GR method. In this method, the optimum parameters oscillate around the CHM pixel size in the range of 0.35–0.40 m and the minimum CHM smoothing strength with Gaussian filter (window size 1). Besides, it is very difficult to indicate an unambiguous relation of the indicated parameter sets with the local character of the analyzed stands. This is due to the multidimensional variability of forests.
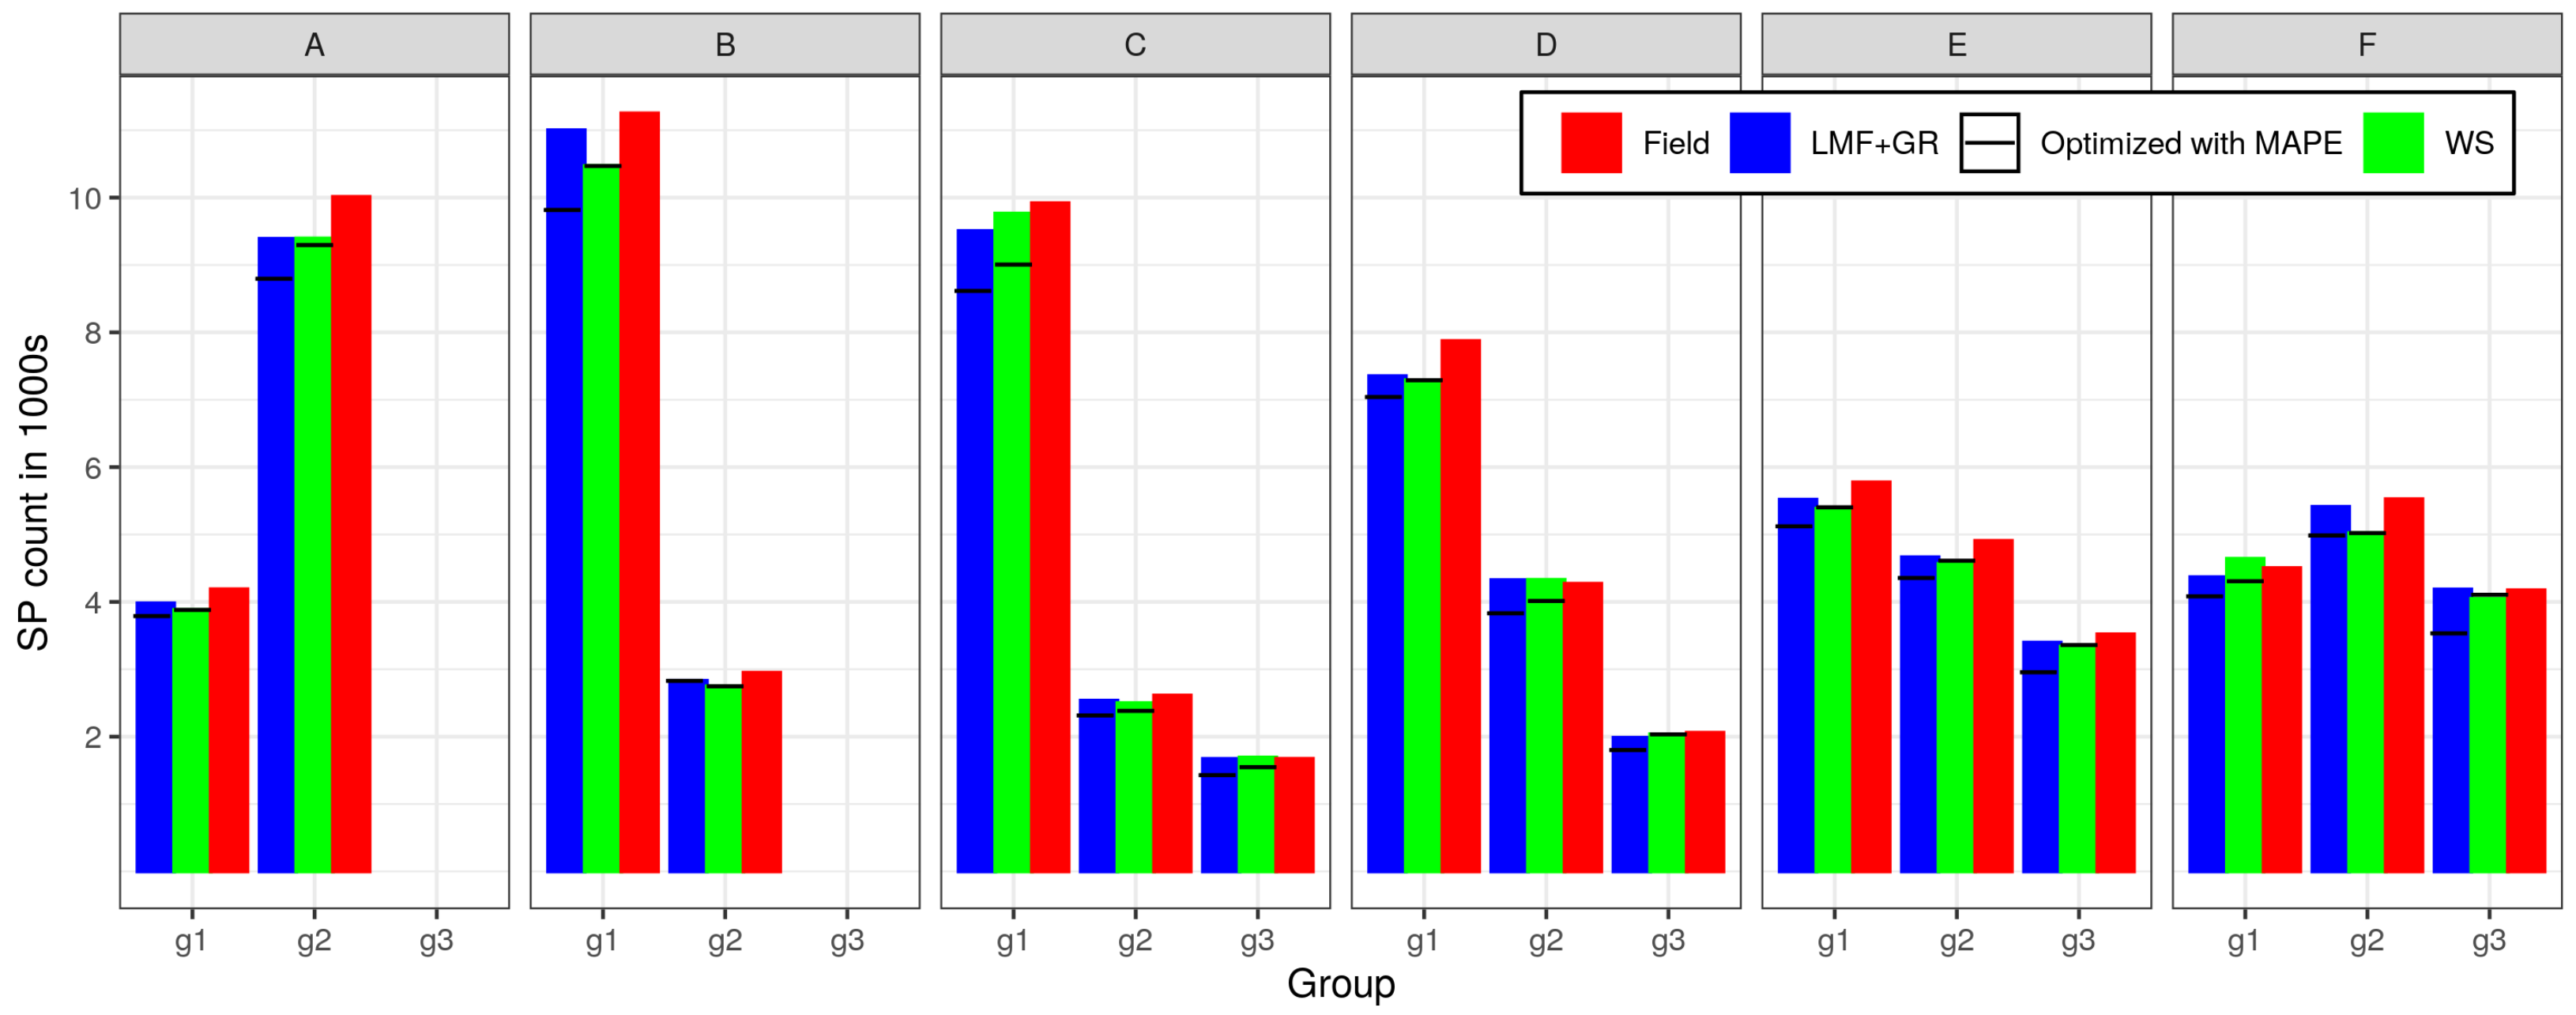
ITD methods are supposed to provide precise information on the number of trees in a given plot unit (and on the location of individual trees or their dense groups). Considering only the parameter of tree abundance, we believe that the applied ITD methods allow us to estimate, with very high accuracy, the total number of trees in the control SPs across all categories (in Figure 17). Analysis of the following graphs shows a slight tendency to underestimate the results in both methods; this is slightly stronger in the case of LMF+GR. In addition, a trend of greater underestimation in the MAPE minimization variant compared to the RMSE minimization is evident. When comparing the two methods, in most of the analyzed cases, the WS method produces a better accuracy of fitting the estimates to the empirical data.

3.3. Analysis of ITD Results on Some Sample Plots (Case Study)

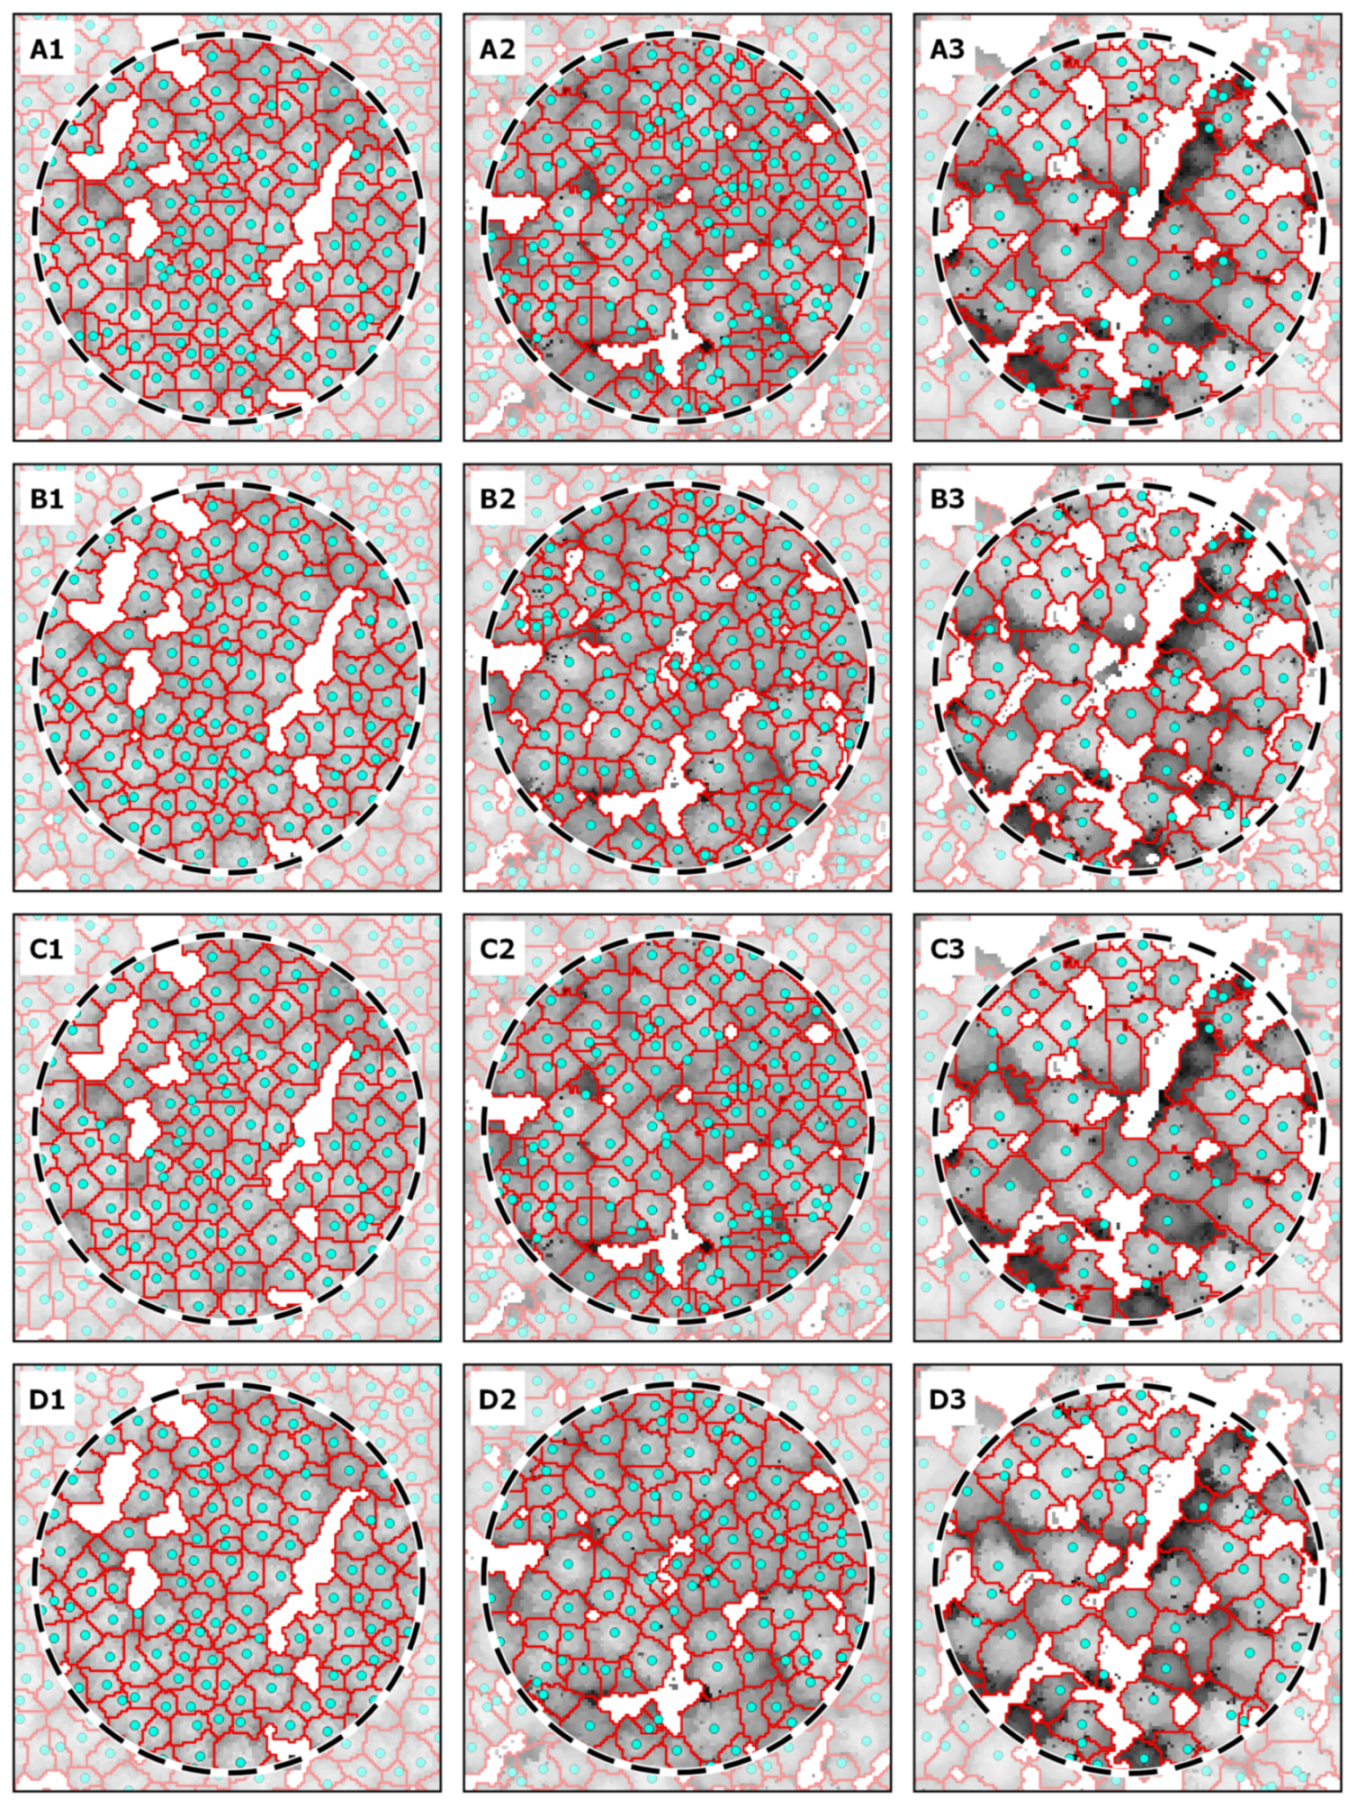
As a case study, we performed an analysis using both ITD methods with optimal parameters to ensure the minimization of RMSE and MAPE on three selected enlarged circular plots (r = 25 m) that differed significantly in stand vertical structure, tree compactness, and spatial distribution of gaps. We ranked the plots according to the complexity of their analysis: SP1—plot with a relatively low variance in tree size and height; SP2—plot with a greater variance in height, size and the occurrence of partially obscured trees; SP3—plot with a high variance in tree size and height and proportion of artificial and natural gaps between crowns (Figure 18).
Comparing the ITD methods used in these few sample SPs (Table 4), we can indicate that the WS method generally provided better results in estimating the total number of trees. We noted the largest discrepancy at SP2, where the LMF+GR method resulted in a visible overestimation of the number of trees. It is due to the peculiarities of LMF, which worked worse in the case of greater variation in crown size. It is worth pointing out that the variant of parameterization ensuring minimization of RMSE caused greater overestimation of the number of trees. On the other hand, analyzing basic statistics of height and size of automatically determined segments, the differences turned out to be small. Segments determined by the WS method generally have more correct borders in the context of CHM. Only in partially obscured trees (SP3), the WS algorithm tends to merge the segment of the towering tree and the obscured tree.

4. Discussion

Despite the availability of sophisticated analytical tools, the accurate determination of tree numbers from ALS data analysis for precision forestry remains a complex problem [65].
This study aimed to investigate the influence of the ITD method parameters on the quality of automatic trees detection using a large-scale ground sample dataset. Its realization required field data from two neighboring forest districts, studied in independently realized research projects. As a consequence, it was necessary to integrate databases obtained in different time intervals. Despite the adoption of a uniform measurement methodology, there is uncertainty about the homogeneity of the data. An instance of this problem is the stage of subjective evaluation of crown visibility by two independent teams. The determination of tree visibility in categories 1 (full crown visibility) and 3 (no crown visibility) was not a problem. However, in the case of category 2 (partial crown visibility), there was a difficulty in unambiguously determining the feature in individual cases, for example, trees with a crown growing into another crown or limited visibility of crowns from the ground level. For this reason, we used facility (forest district) as one of the variables differentiating the study population. We found no clear differences between the results for individual objects (Figure 17). For subdivision category B (area size), differences are noticeable (Figure 9 and Figure 10). We obtained significantly better results for larger SPs, which is in line with other studies [66,67,68]. We, therefore, conclude that SPs with larger radius (r > 12.62 m) are worth using in the absence of economic constraints.
Another issue that can affect the results of the experiment is the edge effect. It is a problem associated with all natural geographic studies where spatial analyses are performed. It also concerns methods based on sample plots (also circular) [46]. It is related to the size of the plot (the larger the plot, the smaller the influence of the edge effect) [45] and to measurement errors (location of the plot center, location of trees on the plot, etc.). Among other things, the edge effect results in uncertainty in the membership of crown segments to SPs. Some researchers compensate for this effect by manually correcting the location of detected trees [50] or correcting the SP outline by matching it to crown segments [41].
We also used manual correction of segment outlines for our experiment to build an accurate reference sample for the parameterization of ITD methods. We used a 10-point scale to evaluate the correctness of the segment’s delineation in reference to the ground dendrometric and location measurements. With such a large sample, it was possible to discard uncertain crown segments (with scores less than 7).
Another critical issue is the subjective choice of ITD methods for the experiment. Among the many existing ITD methods [50], we chose two of them based on different analytical approaches: the CHM-based WS method and the point cloud-based LMF+GR method. These methods also differ significantly in the number of parameters that need to be taken into account. In the case of the WS method, there are more parameters. This method also requires more steps, including the process of CHM preparation. We introduced an original algorithm for filling in empty CHM pixels to overcome the influence of the low-density point cloud on CHM quality. In contrast, the LMF+GR method, at the stage of filtering in the point cloud for local maximums corresponding to theoretical treetops, is parameterized mainly by the function of the tree height–crown diameter relationship. Therefore, we found that LMF+GR was a more effective method for practical applications. As indicated by other studies [69], the overall performance of single-tree detection methods is strictly dependent on the adopted parameters. One of the general problems was the overestimation of detected trees, especially with using the WS algorithm [10,70]. Therefore, our introduced post-processing procedure for the results of automatic tree detection led to a clear stabilization of the results (Figure 15 and Figure 16). This results in an increase in the range of optimal values of tree detection parameters in predominantly coniferous stands. Only for circular plots characterized by a large variation in crown size (D-g3) and the LMF+GR method did we record optimal detection parameters that were clearly different from the others (Table 3).
The agreement of the number of detected trees with the reference data obtained in our work is at a similar level to that of other authors [71,72]. It is worth mentioning that in this study we focused on the number of trees as a dependent variable, so we did not analyze the correctness of the determination of the crown reaches of individual trees. The carried out case study clearly shows that there are differences in the basic statistics of the crown segment area depending on the adopted set of analysis parameters. The segment size was conditioned by the number of detected trees as well as the CHM pixel size. The issue of the influence of the parameterization of ITD methods on the correctness of the representation of the crown extent of individual trees, therefore, seems interesting and will be addressed in further analyses. This is a key issue in the context of further research on single tree segment features. The selection of criteria related to the inclusion of a given segment into a circular plot, taking into account issues such as the accuracy of the location of the center of the circular plot and the location of individual trees, as well as the direction and degree of their deflection from the vertical, require further analysis. It is worth mentioning that an interesting aspect of future research is the verification of the effectiveness of the developed parameterizing functions in ITD analysis of coniferous stands from other geographical regions.
We can find many studies of individual tree crown delineation using passive and active remote sensing data in the literature. We chose the two most popular ITD methods, one based on point cloud analysis and another one utilizing CHM. We assessed the influence of the parametrization of these methods on the resulting number of detected trees. The value of our study comes from a large dataset of field measurements, which we used in the parameterization of ITD methods. We used these data in the postprocessing of the output of the ITD methods as well: we used the dendrometric features to describe a relationship between tree height and tree crown area to establish a criterion to choose which boundaries between tree segments should be dissolved. It was of particular importance when applying the WS method. The use of postprocessing had a beneficial effect on stabilizing the results in using CHM with various resolutions and the strength of its smoothing, thus expanding the optimal variants. It is also worth noting that our proprietary procedure for the iterative filling of empty CHM pixels is particularly important in Poland due to the availability of ALS data from the ISOK project (4 pt/m 2 scan density is available for most of the country). Our study confirms indications from other research teams about the need for the local parameterization of applied ITD methods based on field dendrometric measurements [62,73,74,75]. Due to the local nature of the analysis and the multitude of methods for their local modification, it is not easy to directly compare the results obtained by studies conducted by other authors. Nevertheless, the accuracy we obtained for estimating the number of trees corresponds with other studies conducted in Poland [46,76,77].

5. Conclusions

In this paper, we proposed an approach to exploit the information potential of a large set of ground-based dendrometric measurements for the parameterization of selected ITD methods. We parameterized two popular approaches for single tree detection in conifer stands: Watershed and LMF+GR. For the WS method, we proposed a proprietary algorithm for iterative filling in empty CHM pixels based on direct neighborhood analysis. This allowed us to generate correct CHMs at resolutions of 0.35–0.40 m, which would not be possible with the recorded number of first returns in the processed point clouds. Subsequently, we post-processed the results of the ITD WS method for the considered sets of output parameters in order to eliminate crown segments with an incorrect ratio of tree height to its segment area. The procedure used allowed us to stabilize the results across the sets of considered parameter combinations, which was particularly important when analyzing CHM with smaller pixel sizes. To parameterize the LMF+GR method, we used crown diameter-to-height functions at the stage of finding extremes on the point cloud. The obtained results for each percentile for creating LMF window size functions were subjected to the same procedure for eliminating invalid segments as used in the WS method.
The analysis of semi-natural coniferous stands indicated the necessity of taking into account selected conditions related to, among others, variation in crown size and height or the share of trees with partially obscured crowns when selecting output parameters. Nevertheless, the applied parameterization increased the range of combinations of ITD analysis parameters in the considered methods. In our opinion, conducting continuous research on single tree detection from ALS data, despite the need to take into account many confounding factors, is a key element of the idea of precision forestry.

Author Contributions

Conceptualization, Ł.K.; Data curation, Ł.K. and S.C.; Formal analysis, Ł.K., M.K. (Marcin Kozniewski) and M.K. (Marek Ksepko); Funding acquisition, B.N.; Investigation, Ł.K. and M.K. (Marcin Kozniewski); Methodology, Ł.K., M.K. (Marcin Kozniewski) and M.K. (Marek Ksepko); Supervision, M.K. (Marek Ksepko); Validation, M.K. (Marcin Kozniewski) and M.K. (Marek Ksepko); Visualization, M.K. (Marcin Kozniewski) and S.C.; Writing—original draft, Ł.K., M.K. (Marcin Kozniewski) and M.K. (Marek Ksepko); Writing—review & editing, Ł.K., M.K. (Marcin Kozniewski), S.C. and B.N. All authors have read and agreed to the published version of the manuscript.

Funding

The APC was funded by the Forest Management and Geodesy Bureau.

Institutional Review Board Statement

Not applicable.

Informed Consent Statement

Not applicable.

Conflicts of Interest

We declare no conflict of interest.

References

  1. Panagiotidis, D.; Abdollahnejad, A.; Slavík, M. Assessment of Stem Volume on Plots Using Terrestrial Laser Scanner: A Precision Forestry Application. Sensors 2021, 21, 301. [Google Scholar] [CrossRef] [PubMed]
  2. Fardusi, M.J.; Chianucci, F.; Barbati, A. Concept to practice of geospatial-information tools to assist forest management and planning under precision forestry framework: A review. Ann. Silvic. Res. 2017, 41, 3–14. [Google Scholar]
  3. Kovácsová, P.; Antalová, M. Precision forestry–definition and technologies. Šumar. List 2010, 134, 603–610. [Google Scholar]
  4. Dyck, B. Precision forestry—The path to increased profitability. In Proceedings of the Second International Precision Forestry Symposium, University of Washington, Seattle, WA, USA, 15–17 June 2003; Volume 2003, pp. 3–8. [Google Scholar]
  5. Antosiewicz, M.; Wężyk, P. GPS as environment management tool. Rocz. Geomatyki Ann. Geomat. 2005, 3, 125–133. [Google Scholar]
  6. Szostak, M.; Wezyk, P. GNNS measurements in forest environment using various receivers and measurement modes. Arch. Photogramm. Cartogr. Remote Sens. 2013, 25, 217–231. [Google Scholar]
  7. Kaartinen, H.; Hyyppä, J.; Vastaranta, M.; Kukko, A.; Jaakkola, A.; Yu, X.; Pyörälä, J.; Liang, X.; Liu, J.; Wang, Y.; et al. Accuracy of kinematic positioning using global satellite navigation systems under forest canopies. Forests 2015, 6, 3218–3236. [Google Scholar] [CrossRef]
  8. Qian, C.; Liu, H.; Tang, J.; Chen, Y.; Kaartinen, H.; Kukko, A.; Zhu, L.; Liang, X.; Chen, L.; Hyyppä, J. An integrated GNSS/INS/LiDAR-SLAM positioning method for highly accurate forest stem mapping. Remote Sens. 2017, 9, 3. [Google Scholar] [CrossRef] [Green Version]
  9. Wężyk, P.; Sroga, R.; Szwed, P. POSTEX precision positioning of tree trunks on circular inventory plots using the POSTEX device. Rocz. Geomatyki Ann. Geomat. 2008, 6, 109–118. [Google Scholar]
  10. Myszkowski, M.; Ksepko, M.; Gajko, K. Detekcja liczby drzew na podstawie danych lotniczego skanowania laserowego. Arch. Inst. Inż. Lądowej 2009, 6, 63–72. [Google Scholar]
  11. Quinby, P.A. First-year impacts of shelterwood logging on understory vegetation in an old-growth pine stand in central Ontario, Canada. Environ. Conserv. 2000, 27, 229–241. [Google Scholar] [CrossRef]
  12. Blasi, C.; Marchetti, M.; Chiavetta, U.; Aleffi, M.; Audisio, P.; Azzella, M.M.; Brunialti, G.; Capotorti, G.; Del Vico, E.; Lattanzi, E.; et al. Multi-taxon and forest structure sampling for identification of indicators and monitoring of old-growth forest. Plant Biosyst. 2010, 144, 160–170. [Google Scholar] [CrossRef]
  13. Wang, X.; Zhang, Y.; Luo, Z. Combining Trunk Detection with Canopy Segmentation to Delineate Single Deciduous Trees Using Airborne LiDAR Data. IEEE Access 2020, 8, 99783–99796. [Google Scholar] [CrossRef]
  14. Mielcarek, M.; Kamińska, A.; Stereńczak, K. Digital Aerial Photogrammetry (DAP) and Airborne Laser Scanning (ALS) as Sources of Information about Tree Height: Comparisons of the Accuracy of Remote Sensing Methods for Tree Height Estimation. Remote Sens. 2020, 12, 1808. [Google Scholar] [CrossRef]
  15. Harikumar, A.; Bovolo, F.; Bruzzone, L. A local projection-based approach to individual tree detection and 3-D crown delineation in multistoried coniferous forests using high-density airborne LiDAR data. IEEE Trans. Geosci. Remote Sens. 2018, 57, 1168–1182. [Google Scholar] [CrossRef]
  16. Smreček, R.; Sačkov, I.; Michňová, Z.; Tuček, J. Automated tree detection and crown delineation using airborne laser scanner data in heterogeneous East-Central Europe forest with different species mix. J. For. Res. 2017, 28, 1049–1059. [Google Scholar] [CrossRef]
  17. Paris, C.; Valduga, D.; Bruzzone, L. A hierarchical approach to three-dimensional segmentation of LiDAR data at single-tree level in a multilayered forest. IEEE Trans. Geosci. Remote Sens. 2016, 54, 4190–4203. [Google Scholar] [CrossRef]
  18. Koch, B.; Heyder, U.; Weinacker, H. Detection of individual tree crowns in airborne lidar data. Photogramm. Eng. Remote Sens. 2006, 72, 357–363. [Google Scholar] [CrossRef] [Green Version]
  19. Yu, X.; Hyyppä, J.; Vastaranta, M.; Holopainen, M.; Viitala, R. Predicting individual tree attributes from airborne laser point clouds based on the random forests technique. ISPRS J. Photogramm. Remote Sens. 2011, 66, 28–37. [Google Scholar] [CrossRef]
  20. Yao, W.; Krzystek, P.; Heurich, M. Tree species classification and estimation of stem volume and DBH based on single tree extraction by exploiting airborne full-waveform LiDAR data. Remote Sens. Environ. 2012, 123, 368–380. [Google Scholar] [CrossRef]
  21. Hyyppa, J.; Kelle, O.; Lehikoinen, M.; Inkinen, M. A segmentation-based method to retrieve stem volume estimates from 3-D tree height models produced by laser scanners. IEEE Trans. Geosci. Remote Sens. 2001, 39, 969–975. [Google Scholar] [CrossRef]
  22. Maltamo, M.; Eerikäinen, K.; Pitkänen, J.; Hyyppä, J.; Vehmas, M. Estimation of timber volume and stem density based on scanning laser altimetry and expected tree size distribution functions. Remote Sens. Environ. 2004, 90, 319–330. [Google Scholar] [CrossRef]
  23. Korpela, I. 3D treetop positioning by multiple image matching of aerial images in a 3D search volume bounded by Lidar surface models. Photogramm. Fernerkund. Geoinf. 2007, 1, 35–44. [Google Scholar]
  24. Packalén, P.; Maltamo, M. The k-MSN method for the prediction of species-specific stand attributes using airborne laser scanning and aerial photographs. Remote Sens. Environ. 2007, 109, 328–341. [Google Scholar] [CrossRef]
  25. Wallace, L.; Lucieer, A.; Watson, C.; Turner, D. Development of a UAV-LiDAR system with application to forest inventory. Remote Sens. 2012, 4, 1519–1543. [Google Scholar] [CrossRef] [Green Version]
  26. Cao, L.; Liu, H.; Fu, X.; Zhang, Z.; Shen, X.; Ruan, H. Comparison of UAV LiDAR and digital aerial photogrammetry point clouds for estimating forest structural attributes in subtropical planted forests. Forests 2019, 10, 145. [Google Scholar] [CrossRef] [Green Version]
  27. Krok, G.; Kraszewski, B.; Stereńczak, K. Application of terrestrial laser scanning in forest inventory—An overview of selected issues. For. Res. Pap. 2020, 81, 175–194. [Google Scholar]
  28. Moskal, L.M.; Erdody, T.; Kato, A.; Richardson, J.; Zheng, G.; Briggs, D. Lidar applications in precision forestry. In Proceedings of the Silvilaser 2009, College Station, TX, USA, 14–16 October 2009; pp. 154–163. [Google Scholar]
  29. Dash, J.P.; Watt, M.S.; Bhandari, S.; Watt, P. Characterising forest structure using combinations of airborne laser scanning data, RapidEye satellite imagery and environmental variables. Forestry 2016, 89, 159–169. [Google Scholar] [CrossRef] [Green Version]
  30. Paschalis, P. The concept of Precise Ergoefficient Logging Operations (Koncepcja precyzyjnego, ergonomicznego i efektywnego pozyskiwania surowca drzewnego). Adv. Agric. Sci. Probl. Issues (Zesz. Probl. Postępów Nauk Rol.) 2002, 486, 107–113. (In Polish) [Google Scholar]
  31. Council of European Union. Council Directive 92/43/EEC of 21 May 1992 on the Conservation of Natural Habitats and of Wild Fauna and Flora. 1992. Available online: https://eur-lex.europa.eu/legal-content/EN/TXT/?uri=CELEX:31992L0043 (accessed on 1 December 2020).
  32. White, J.C.; Coops, N.C.; Wulder, M.A.; Vastaranta, M.; Hilker, T.; Tompalski, P. Remote sensing technologies for enhancing forest inventories: A review. Can. J. Remote Sens. 2016, 42, 619–641. [Google Scholar] [CrossRef] [Green Version]
  33. Lindberg, E.; Hollaus, M.; Mücke, W.; Fransson, J.E.; Pfeifer, N. Detection of lying tree stems from airborne laser scanning data using a line template matching algorithm. Proc. ISPRS Ann. II-5 W 2013, 2, 11–13. [Google Scholar] [CrossRef] [Green Version]
  34. Maltamo, M.; Packalén, P.; Peuhkurinen, J.; Suvanto, A.; Pesonen, A.; Hyyppä, J. Experiences and possibilities of ALS based forest inventory in Finland. In Proceedings of the ISPRS Workshop on Laser Scanning, Espoo, Finland, 12–14 September 2007; pp. 12–14. [Google Scholar]
  35. Li, W.; Guo, Q.; Jakubowski, M.K.; Kelly, M. A new method for segmenting individual trees from the lidar point cloud. Photogramm. Eng. Remote Sens. 2012, 78, 75–84. [Google Scholar] [CrossRef] [Green Version]
  36. Hyyppa, J.; Inkinen, M. Detecting and estimating attributes for single trees using laser scanner. Photogramm. J. Finl. 1999, 16, 27–42. [Google Scholar]
  37. Khosravipour, A.; Skidmore, A.K.; Isenburg, M.; Wang, T.; Hussin, Y.A. Generating pit-free canopy height models from airborne lidar. Photogramm. Eng. Remote Sens. 2014, 80, 863–872. [Google Scholar] [CrossRef]
  38. Coomes, D.A.; Dalponte, M.; Jucker, T.; Asner, G.P.; Banin, L.F.; Burslem, D.F.; Lewis, S.L.; Nilus, R.; Phillips, O.L.; Phua, M.H.; et al. Area-based vs. tree-centric approaches to mapping forest carbon in Southeast Asian forests from airborne laser scanning data. Remote Sens. Environ. 2017, 194, 77–88. [Google Scholar] [CrossRef] [Green Version]
  39. Dalponte, M.; Reyes, F.; Kandare, K.; Gianelle, D. Delineation of individual tree crowns from ALS and hyperspectral data: A comparison among four methods. Eur. J. Remote Sens. 2015, 48, 365–382. [Google Scholar] [CrossRef] [Green Version]
  40. Leite, R.V.; Silva, C.A.; Mohan, M.; Cardil, A.; Almeida, D.R.A.d.; Carvalho, S.d.P.C.; Jaafar, W.S.W.M.; Guerra-Hernández, J.; Weiskittel, A.; Hudak, A.T.; et al. Individual Tree Attribute Estimation and Uniformity Assessment in Fast-Growing Eucalyptus spp. Forest Plantations Using Lidar and Linear Mixed-Effects Models. Remote Sens. 2020, 12, 3599. [Google Scholar] [CrossRef]
  41. Pascual, A. Using tree detection based on airborne laser scanning to improve forest inventory considering edge effects and the co-registration factor. Remote Sens. 2019, 11, 2675. [Google Scholar] [CrossRef] [Green Version]
  42. Państwowych, D.G.L. Raport o Stanie Lasów W Polsce 2019 [Raport on the State of Forests in Poland 2019]; Centrum Informacyjne Lasów Państwowych: Warsaw, Poland, 2020. (In Polish) [Google Scholar]
  43. Evans, D. Building the European union’s Natura 2000 network. Nat. Conserv. 2012, 1, 11. [Google Scholar] [CrossRef]
  44. Gajko, K.; Myszkowski, M.; Ksepko, M. Eksperyment w obrębie Zajma. Geod. Mag. Geoinform. 2009, 164, 60–62. [Google Scholar]
  45. Kolendo, Ł.; Ksepko, M. Selection of optimal tree top detection parameters in a context of effective forest management. Ekonomia i Środowisko 2019, 68, 67–85. [Google Scholar]
  46. Stereńczak, K.; Kraszewski, B.; Mielcarek, M.; Piasecka, Ż.; Lisiewicz, M.; Heurich, M. Mapping individual trees with airborne laser scanning data in an European lowland forest using a self-calibration algorithm. Int. J. Appl. Earth Obs. Geoinf. 2020, 93, 102191. [Google Scholar] [CrossRef]
  47. Instytut Badawczy Lesnictwa (Forest Research Institute). Remote Sensing Based Assessment of Woody Biomass and Carbon Storage in Forests (RemBioFor). 2015. Available online: http://rembiofor.pl/en/305-2/ (accessed on 1 December 2020).
  48. BULiGL. Wielkoobszarowa Inwentaryzacja Stanu Lasów w Polsce, Wyniki za Okres 2015–2019, Sękocin Stary. 2020. Available online: https://www.bdl.lasy.gov.pl/portal/Media/Default/Publikacje/WISL2015_2019.pdf (accessed on 1 December 2020).
  49. ASPRS. LAS Specification. Version 1.2. 2008. Available online: https://www.asprs.org/wp-content/uploads/2010/12/asprslasformatv12.pdf (accessed on 1 December 2020).
  50. Eysn, L.; Hollaus, M.; Lindberg, E.; Berger, F.; Monnet, J.M.; Dalponte, M.; Kobal, M.; Pellegrini, M.; Lingua, E.; Mongus, D.; et al. A benchmark of lidar-based single tree detection methods using heterogeneous forest data from the alpine space. Forests 2015, 6, 1721–1747. [Google Scholar] [CrossRef] [Green Version]
  51. Conrad, O.; Bechtel, B.; Bock, M.; Dietrich, H.; Fischer, E.; Gerlitz, L.; Wehberg, J.; Wichmann, V.; Böhner, J. System for Automated Geoscientific Analyses (SAGA) v. 2.1.4. Geosci. Model Dev. 2015, 8, 1991–2007. [Google Scholar] [CrossRef] [Green Version]
  52. Edson, C.; Wing, M.G. Tree location measurement accuracy with a mapping-grade GPS receiver under forest canopy. For. Sci. 2012, 58, 567–576. [Google Scholar] [CrossRef]
  53. Popescu, S.C.; Wynne, R.H. Seeing the Trees in the Forest: Using Lidar and Multispectral Data Fusion with Local Filtering and Variable Window Size for Estimating Tree Height. Photogramm. Eng. Remote Sens. 2004, 70, 589–604. [Google Scholar] [CrossRef] [Green Version]
  54. Dalponte, M.; Coomes, D.A. Tree-centric mapping of forest carbon density from airborne laser scanning and hyperspectral data. Methods Ecol. Evol. 2016, 7, 1236–1245. [Google Scholar] [CrossRef] [Green Version]
  55. Pirotti, F.; Kobal, M.; Roussel, J. A Comparison of Tree Segmentation Methods Using Very High Density Airborne Laser Scanner Data. Int. Arch. Photogramm. Remote Sens. Spat. Inf. Sci. 2017, 42, 285–290. [Google Scholar] [CrossRef] [Green Version]
  56. Rahman, M.R.; Shi, Z.; Chongfa, C. Soil erosion hazard evaluation—An integrated use of remote sensing, GIS and statistical approaches with biophysical parameters towards management strategies. Ecol. Model. 2009, 220, 1724–1734. [Google Scholar] [CrossRef]
  57. R Core Team. R: A Language and Environment for Statistical Computing; R Foundation for Statistical Computing: Vienna, Austria, 2020. [Google Scholar]
  58. QGIS Development Team. QGIS Geographic Information System; Open Source Geospatial Foundation: Chicago, IL, USA, 2009. [Google Scholar]
  59. Roussel, J.R.; Auty, D.; Coops, N.C.; Tompalski, P.; Goodbody, T.R.; Meador, A.S.; Bourdon, J.F.; de Boissieu, F.; Achim, A. lidR: An R package for analysis of Airborne Laser Scanning (ALS) data. Remote Sens. Environ. 2020, 251, 112061. [Google Scholar] [CrossRef]
  60. Imangholiloo, M.; Saarinen, N.; Holopainen, M.; Yu, X.; Hyyppä, J.; Vastaranta, M. Using Leaf-Off and Leaf-On Multispectral Airborne Laser Scanning Data to Characterize Seedling Stands. Remote Sens. 2020, 12, 3328. [Google Scholar] [CrossRef]
  61. Mongus, D.; Žalik, B. An efficient approach to 3D single tree-crown delineation in LiDAR data. ISPRS J. Photogramm. Remote Sens. 2015, 108, 219–233. [Google Scholar] [CrossRef]
  62. Chen, Q.; Baldocchi, D.; Gong, P.; Kelly, M. Isolating individual trees in a savanna woodland using small footprint lidar data. Photogramm. Eng. Remote Sens. 2006, 72, 923–932. [Google Scholar] [CrossRef] [Green Version]
  63. Alonzo, M.; Bookhagen, B.; Roberts, D.A. Urban tree species mapping using hyperspectral and lidar data fusion. Remote Sens. Environ. 2014, 148, 70–83. [Google Scholar] [CrossRef]
  64. Packalen, P.; Strunk, J.L.; Pitkänen, J.A.; Temesgen, H.; Maltamo, M. Edge-tree correction for predicting forest inventory attributes using area-based approach with airborne laser scanning. IEEE J. Sel. Top. Appl. Earth Obs. Remote Sens. 2015, 8, 1274–1280. [Google Scholar] [CrossRef]
  65. Wan Mohd Jaafar, W.S.; Woodhouse, I.H.; Silva, C.A.; Omar, H.; Abdul Maulud, K.N.; Hudak, A.T.; Klauberg, C.; Cardil, A.; Mohan, M. Improving individual tree crown delineation and attributes estimation of tropical forests using airborne LiDAR data. Forests 2018, 9, 759. [Google Scholar] [CrossRef] [Green Version]
  66. Mauya, E.W.; Hansen, E.H.; Gobakken, T.; Bollandsås, O.M.; Malimbwi, R.E.; Næsset, E. Effects of field plot size on prediction accuracy of aboveground biomass in airborne laser scanning-assisted inventories in tropical rain forests of Tanzania. Carbon Balance Manag. 2015, 10, 1–14. [Google Scholar] [CrossRef] [PubMed] [Green Version]
  67. Gobakken, T.; Næsset, E. Assessing effects of positioning errors and sample plot size on biophysical stand properties derived from airborne laser scanner data. Can. J. For. Res. 2009, 39, 1036–1052. [Google Scholar] [CrossRef]
  68. Stereńczak, K.; Lisańczuk, M.; Parkitna, K.; Mitelsztedt, K.; Mroczek, P.; Miścicki, S. The influence of number and size of sample plots on modelling growing stock volume based on airborne laser scanning. Drew. Pr. Nauk. Doniesienia Komun. 2018, 61, 5–22. [Google Scholar]
  69. Duncanson, L.; Cook, B.; Hurtt, G.; Dubayah, R. An efficient, multi-layered crown delineation algorithm for mapping individual tree structure across multiple ecosystems. Remote Sens. Environ. 2014, 154, 378–386. [Google Scholar] [CrossRef]
  70. Yang, J.; Kang, Z.; Cheng, S.; Yang, Z.; Akwensi, P.H. An individual tree segmentation method based on watershed algorithm and three-dimensional spatial distribution analysis from airborne LiDAR point clouds. IEEE J. Sel. Top. Appl. Earth Obs. Remote Sens. 2020, 13, 1055–1067. [Google Scholar] [CrossRef]
  71. Zhao, Y.; Hao, Y.; Zhen, Z.; Quan, Y. A region-based hierarchical cross-section analysis for individual tree crown delineation using ALS data. Remote Sens. 2017, 9, 1084. [Google Scholar] [CrossRef] [Green Version]
  72. Wang, Y.; Hyyppä, J.; Liang, X.; Kaartinen, H.; Yu, X.; Lindberg, E.; Holmgren, J.; Qin, Y.; Mallet, C.; Ferraz, A.; et al. International benchmarking of the individual tree detection methods for modeling 3-D canopy structure for silviculture and forest ecology using airborne laser scanning. IEEE Trans. Geosci. Remote Sens. 2016, 54, 5011–5027. [Google Scholar] [CrossRef] [Green Version]
  73. Zhen, Z.; Quackenbush, L.J.; Zhang, L. Trends in automatic individual tree crown detection and delineation—Evolution of LiDAR data. Remote Sens. 2016, 8, 333. [Google Scholar] [CrossRef] [Green Version]
  74. Hauglin, M.; Næsset, E. Detection and segmentation of small trees in the forest-tundra ecotone using airborne laser scanning. Remote Sens. 2016, 8, 407. [Google Scholar] [CrossRef] [Green Version]
  75. Zhen, Z.; Quackenbush, L.J.; Zhang, L. Impact of tree-oriented growth order in marker-controlled region growing for individual tree crown delineation using airborne laser scanner (ALS) data. Remote Sens. 2014, 6, 555–579. [Google Scholar] [CrossRef] [Green Version]
  76. Stereńczak, K. Factors influencing individual tree crowns detection based on airborne laser scanning data. For. Res. Pap. 2013, 74, 323–333. [Google Scholar] [CrossRef] [Green Version]
  77. Stereńczak, K. Określenie zagęszczenia drzewostanów z wykorzystaniem danych z lotniczego skanowania laserowego. Sylwan 2013, 157, 607–617. [Google Scholar]
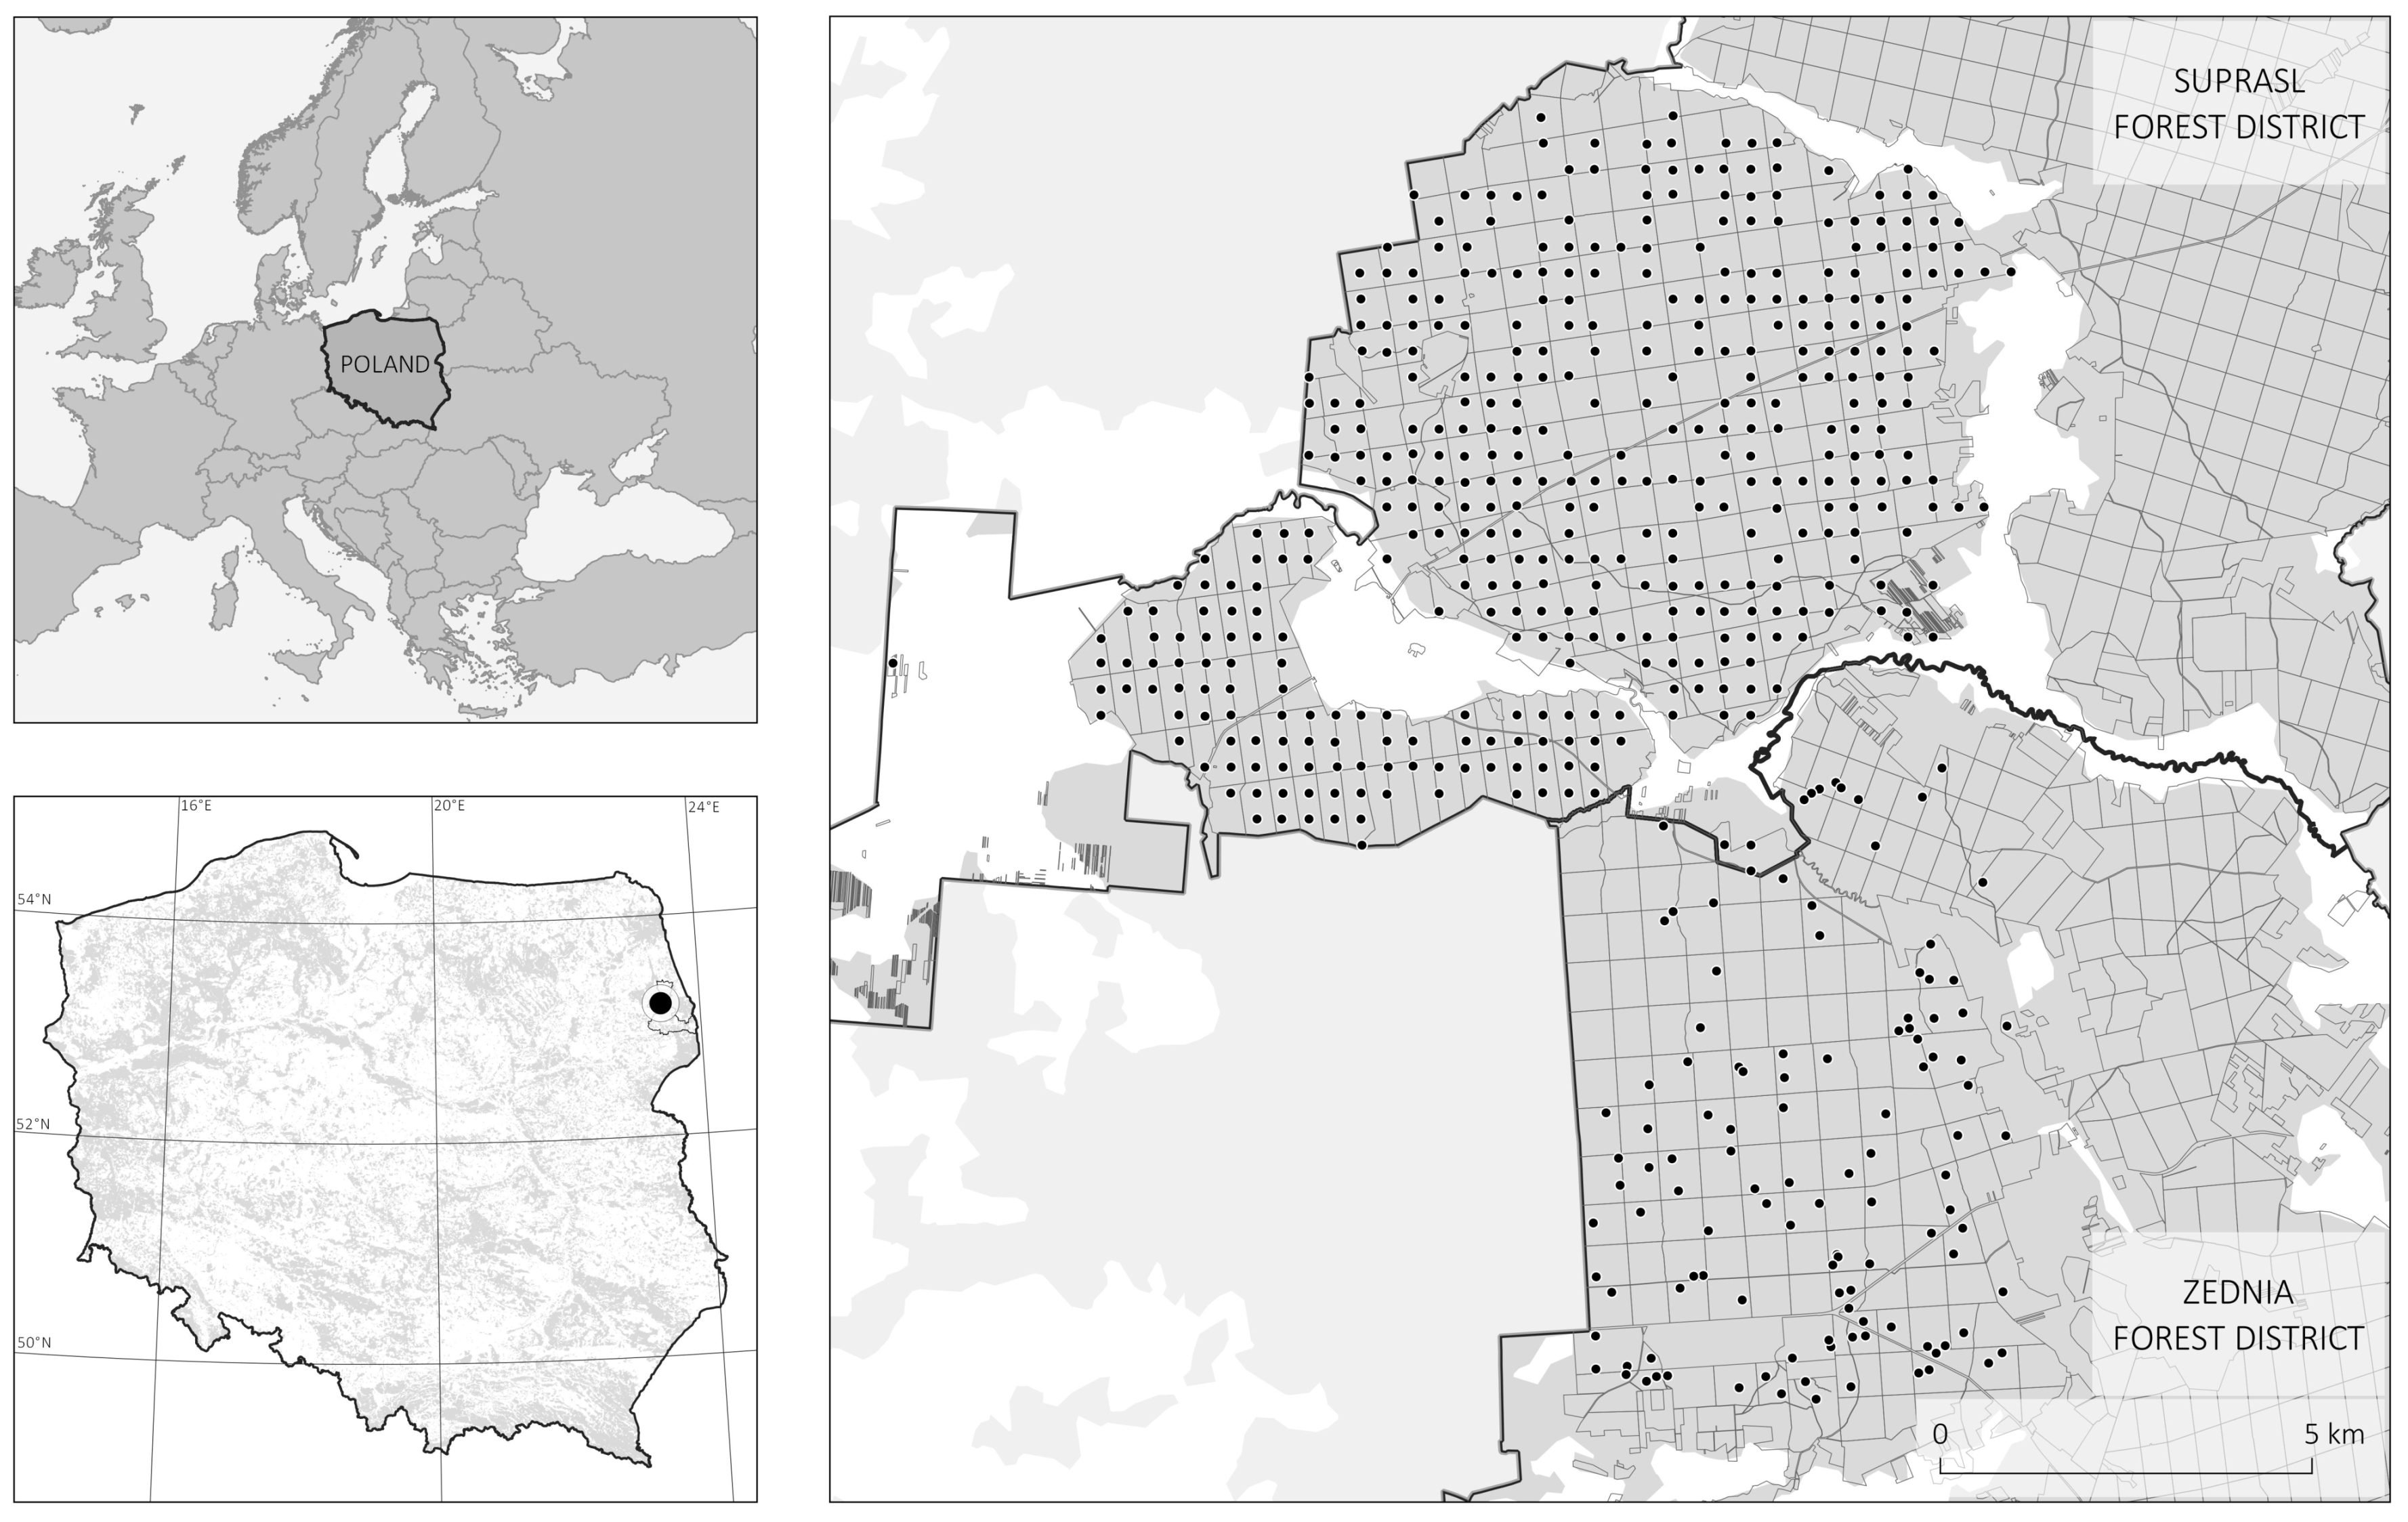
Figure 1. The study area is located in Northeastern Poland (the bottom left map of Poland with the distribution of forested areas in grey). The ground sample plots are distributed across the Żednia Forest District and Supraśl Forest District (the map on the right).
Remotesensing 13 02753 g001
Figure 2. Comparison of field tree count of each species in the analyzed stands distinguishing by their visibility in the context of stem volume.
Remotesensing 13 02753 g002
Figure 3. Comparison of field measurements of tree trunks with segments determined automatically (A) and after verification (B) in one of the sample plots with a radius of 12.62 m overlaid on Canopy Height Model (CHM).
Remotesensing 13 02753 g003
Figure 4. Schematic of the procedures used in the study to determine the number of trees in the sample plots using considered Individual Tree Detection methods utilizing Canopy Height Model (CHM).
Remotesensing 13 02753 g004
Figure 5. Scheme of the iterative method of Canopy Height Model (CHM) interpolation on the basis of pixel neighborhood analysis together with an example of the algorithm operation on a fragment of the CHM with a pixel size of 0.40 m (white—empty cells, light gray—non-empty cells with height, dark gray—interpolated cells).
Remotesensing 13 02753 g005
Figure 6. Construction of the Local Maximum Filter (LMF) function of the moving window for the detection of local maxima (percentile p = 5), taking into account the variability of height and crown diameter parameters, determined based on field dendrometric measurements on circular plots. Two more LMF functions provided: for 0.5th percentile and 20th percentile.
Remotesensing 13 02753 g006
Figure 7. An exemplary execution result of the post-processing correction procedure after applying one of the automatic tree detection algorithms.
Remotesensing 13 02753 g007
Figure 8. An example of determining tree membership in a sample plot based on the percentage of Airborne Laser Scanning derived points in a crown segment that are contained in the sample plot.
Remotesensing 13 02753 g008
Figure 9. Distribution of estimation error of number of trees on sample plots over B category groups (sample plot size g1: r ≤ 12.62 m and g2: r > 12.62 m), F (crown visibility ratio—ratio of partially visible crowns of trees to fully visible crowns of trees—g1: less than 10%, g2: between 10% and 20%, and g3: over 20%) category groups and all sample plots dependent on the Local Maximum Filter method parameterization.
Remotesensing 13 02753 g009
Figure 10. Distribution of estimation error of number of trees on sample plots in B category groups (sample plot size g1: r ≤ 12.62 m and g2: r > 12.62 m) dependent on Watershed method parameterization—Canopy Height Model (CHM) spatial resolution (pixel size in meters), Gaussian smoothing strength (Gaussian filter window size (gs) and standard deviation (sd) in pixels).
Remotesensing 13 02753 g010
Figure 11. Distribution of estimation error of number of trees on sample plots in F category groups (crown visibility ratio—ratio of partial visible crowns of trees to fully visible crowns of trees—g1: less than 10%, g2: between 10% and 20%, and g3: over 20%) dependent on Watershed method parameterization—Canopy Height Model (CHM) spatial resolution (pixel size in meters), Gaussian smoothing strength (Gaussian filter window size (gs) and standard deviation (sd) in pixels).
Remotesensing 13 02753 g011
Figure 12. Distribution of estimation error of number of trees over all sample plots dependent on Watershed method parameterization—Canopy Height Model (CHM) spatial resolution (pixel size in meters), Gaussian smoothing strength (Gaussian filter window size (gs) and standard deviation (sd) in pixels).
Remotesensing 13 02753 g012
Figure 13. Variability of the RMSE metric for Local Maximum Filter (LMF) method as a function of crown diameter percentile including sample plot categories and groups (AF, g1–g3, see Table 2; the ‘All’ group represents the entire set of sample plots).
Remotesensing 13 02753 g013
Figure 14. Variability of the MAPE metric for the Local Maximum Filter (LMF) method as a function of crown diameter percentile including sample plot categories and groups (A–F, g1–g3, see Table 2; the ‘All’ group represents the entire set of sample plots).
Remotesensing 13 02753 g014
Figure 15. Variability of the RMSE metric as a function of Watershed method parameters—Canopy Height Model (CHM) spatial resolution (pixel size in meters), Gaussian smoothing strength (Gaussian filter window size (gs) and standard deviation (sd) in pixels)—and with respect to groupings of circular plots in different categories (A–F, g1–g3, see Table 2; the ‘All’ group represents the entire set of sample plots).
Remotesensing 13 02753 g015
Figure 16. Variability of the MAPE metric as a function of Watershed method parameters—Canopy Height Model (CHM) spatial resolution (pixel size in meters), Gaussian smoothing strength (Gaussian filter window size (gs) and standard deviation (sd) in pixels)—and with respect to groupings of circular plots in different categories (A–F, g1–g3, see Table 2; the ‘All’ group represents the entire set of sample plots).
Remotesensing 13 02753 g016
Figure 17. Comparison of the number of trees detected using the tested ITD methods and ground survey across categories and groups of circular plots (AF, g1–g3, see Table 2) in the variant of the experiment that ensures minimization of the RMSE metric (with reference to use of the MAPE metric.
Remotesensing 13 02753 g017
Figure 18. Examples of segmentation of stands and detection of treetops on circular plots characterized by a variable level of difficulty in implementation of the ITD method: 1—with low diversity of crowns, 2—with moderate diversity of crowns, 3—with high diversity of height-dimension of crowns and overlapping crowns. The analysis was performed with both methods with selection of optimal sets of parameters ensuring the minimization of RMSE error (A—LMF+GR, B—Watershed) and MAPE measure (C—LMF+GR, D—Watershed).
Remotesensing 13 02753 g018
Table 1. Technical parameters of the Airborne Laser Scanning datasets used in this study: airing date, mean scanning density (beams density on the scanning surface), mean point cloud density, mean density of single point returns (density of beams that resulted in a single point return in the dataset), mean flight altitude (both above ground level (AGL) and above mean sea level (MSL)), scanning coverage, number of strips of scanning, length of strips, data coverage area, and scanning angle (field of view (FOV)).
FeatureSupraśl Forest DistrictŻednia Forest District
Airing date23 August 201530 August 2017
Scanning density [pts/m 2 ]7.306.70
Point cloud density [pts/m 2 ]27.1319.64
Density of single point returns [pts/m 2 ]4.894.06
Flight Altitude (AGL) [m]550 (510–590)520
Flight Altitude (MSL) [m]690–717687–713
Scanning coverage30%25%
Number of strips2619
Length of strips [km]390186
Data coverage area [km 2 ]161.770
Scanning angle (FOV)60°60°
Table 2. Ranges of the variability of features grouping the circular sample plots (the counts within the considered categories are given in brackets): administrative affiliation of the site (A), radius size of the circular plot (B), proportion of gaps in the circular plot (C), variance of the area of the rectangular projection of the crown in the circular plot (D), variance of the height of the trees in the sample plot (E), and proportion of the number of trees with apex partial visibility to full visibility (F).
Category:AB [m]C [%]D [m 2 ]E [m]F [%]
g1:Żednia [112]≤12.62 [485]0–20 [328]0–100 [227]0–2 [182]0–10 [156]
g2:Supraśl [410]>12.62 [37]20–30 [117]100–250 [180]2–5 [181]10–20 [196]
g3:--30–100 [77]>250 [115]>5 [159]>20 [170]
Table 3. Optimal parameter combinations in the ITD process that ensure minimum errors of the considered metrics for each category and group of sample plots. Window size and standard deviation parameters for Watershed (WS) method are presented in pixels, while pixel size is in meters. Categories and divisions into groups correspond to Table 2.
Cat.GroupMinimizing RMSEMinimizing MAPE
LMF+GR PercentileWs—Window SizeWs—Std. Dev.Ws—Pixel SizeRMSE LMF RMSE WS LMF+GR PercentileWs—Window SizeWs—Std. Dev.Ws—Pixel SizeMAPE LMF MAPE WS
Ag13.50110.358.187.534.50110.3517.8117.60
Ag24.50110.407.798.627.00120.4023.9722.34
Bg13.50110.407.368.097.00110.4023.5322.01
Bg23.50110.3512.8911.553.50110.3512.7711.10
Cg13.50110.358.579.496.50110.4021.5820.88
Cg24.50210.356.816.429.00230.3526.3021.18
Cg33.50110.355.865.729.00110.4022.3419.45
Dg13.50110.358.8510.264.50110.3517.6518.53
Dg23.00120.356.175.655.50210.3521.2117.63
Dg38.00310.356.575.8213.00310.3531.0628.67
Eg13.00120.358.2710.544.50110.3517.8120.91
Eg24.50120.407.437.207.00110.4025.2121.53
Eg34.50210.356.846.6910.50110.4024.2724.40
Fg14.00110.356.066.638.00120.4018.5417.69
Fg23.00110.408.049.594.50110.4022.2920.73
Fg33.00130.358.528.457.00110.3527.4329.19
Gg13.50110.357.888.456.50110.4022.9921.46
Table 4. Summary of basic statistics of resulting detected trees in case study analysis considering both methods (the Watershed (WS) method and the Local Maximum Filter (LMF) method) and variants of RMSE and MAPE optimization.
Tree Height [m]Segment Area [m 2 ]
SPField TressTrees Remotely DetectedDifference [%]MaxMinMeanStdMaxMinMeanStdMethod (Optimization)
11151258.7024.4517.7922.231.2125.293.6413.414.17LMF (RMSE)
210314237.8624.7714.5721.401.6127.934.8613.014.68
355573.6435.5214.5628.056.3052.612.8326.8212.36
11151171.7424.4518.9122.401.0634.793.4314.695.96WS (RMSE)
210312016.5024.7718.2721.751.3243.733.1814.788.68
35554−1.8235.5216.1230.124.3356.234.1625.5114.14
11151150.0024.4517.7922.341.1728.943.2414.674.39LMF (MAPE)
210312521.3624.7714.5721.441.7431.973.6414.695.60
35552−5.4535.5214.7928.805.8254.845.2629.5612.73
11151160.8724.4518.9122.411.0633.923.0415.056.12WS (MAPE)
21031062.9124.7718.6421.781.2650.563.8416.609.32
35553−3.6435.5216.1230.054.5459.845.2828.2015.36
Publisher’s Note: MDPI stays neutral with regard to jurisdictional claims in published maps and institutional affiliations.