
An Open Source Approach for Near-Real Time Mapping of Oil Spills along the Mediterranean Coast of Egypt


Abstract
:
1. Introduction
1.1. Background
1.2. Literature Review
2. Materials and Methods
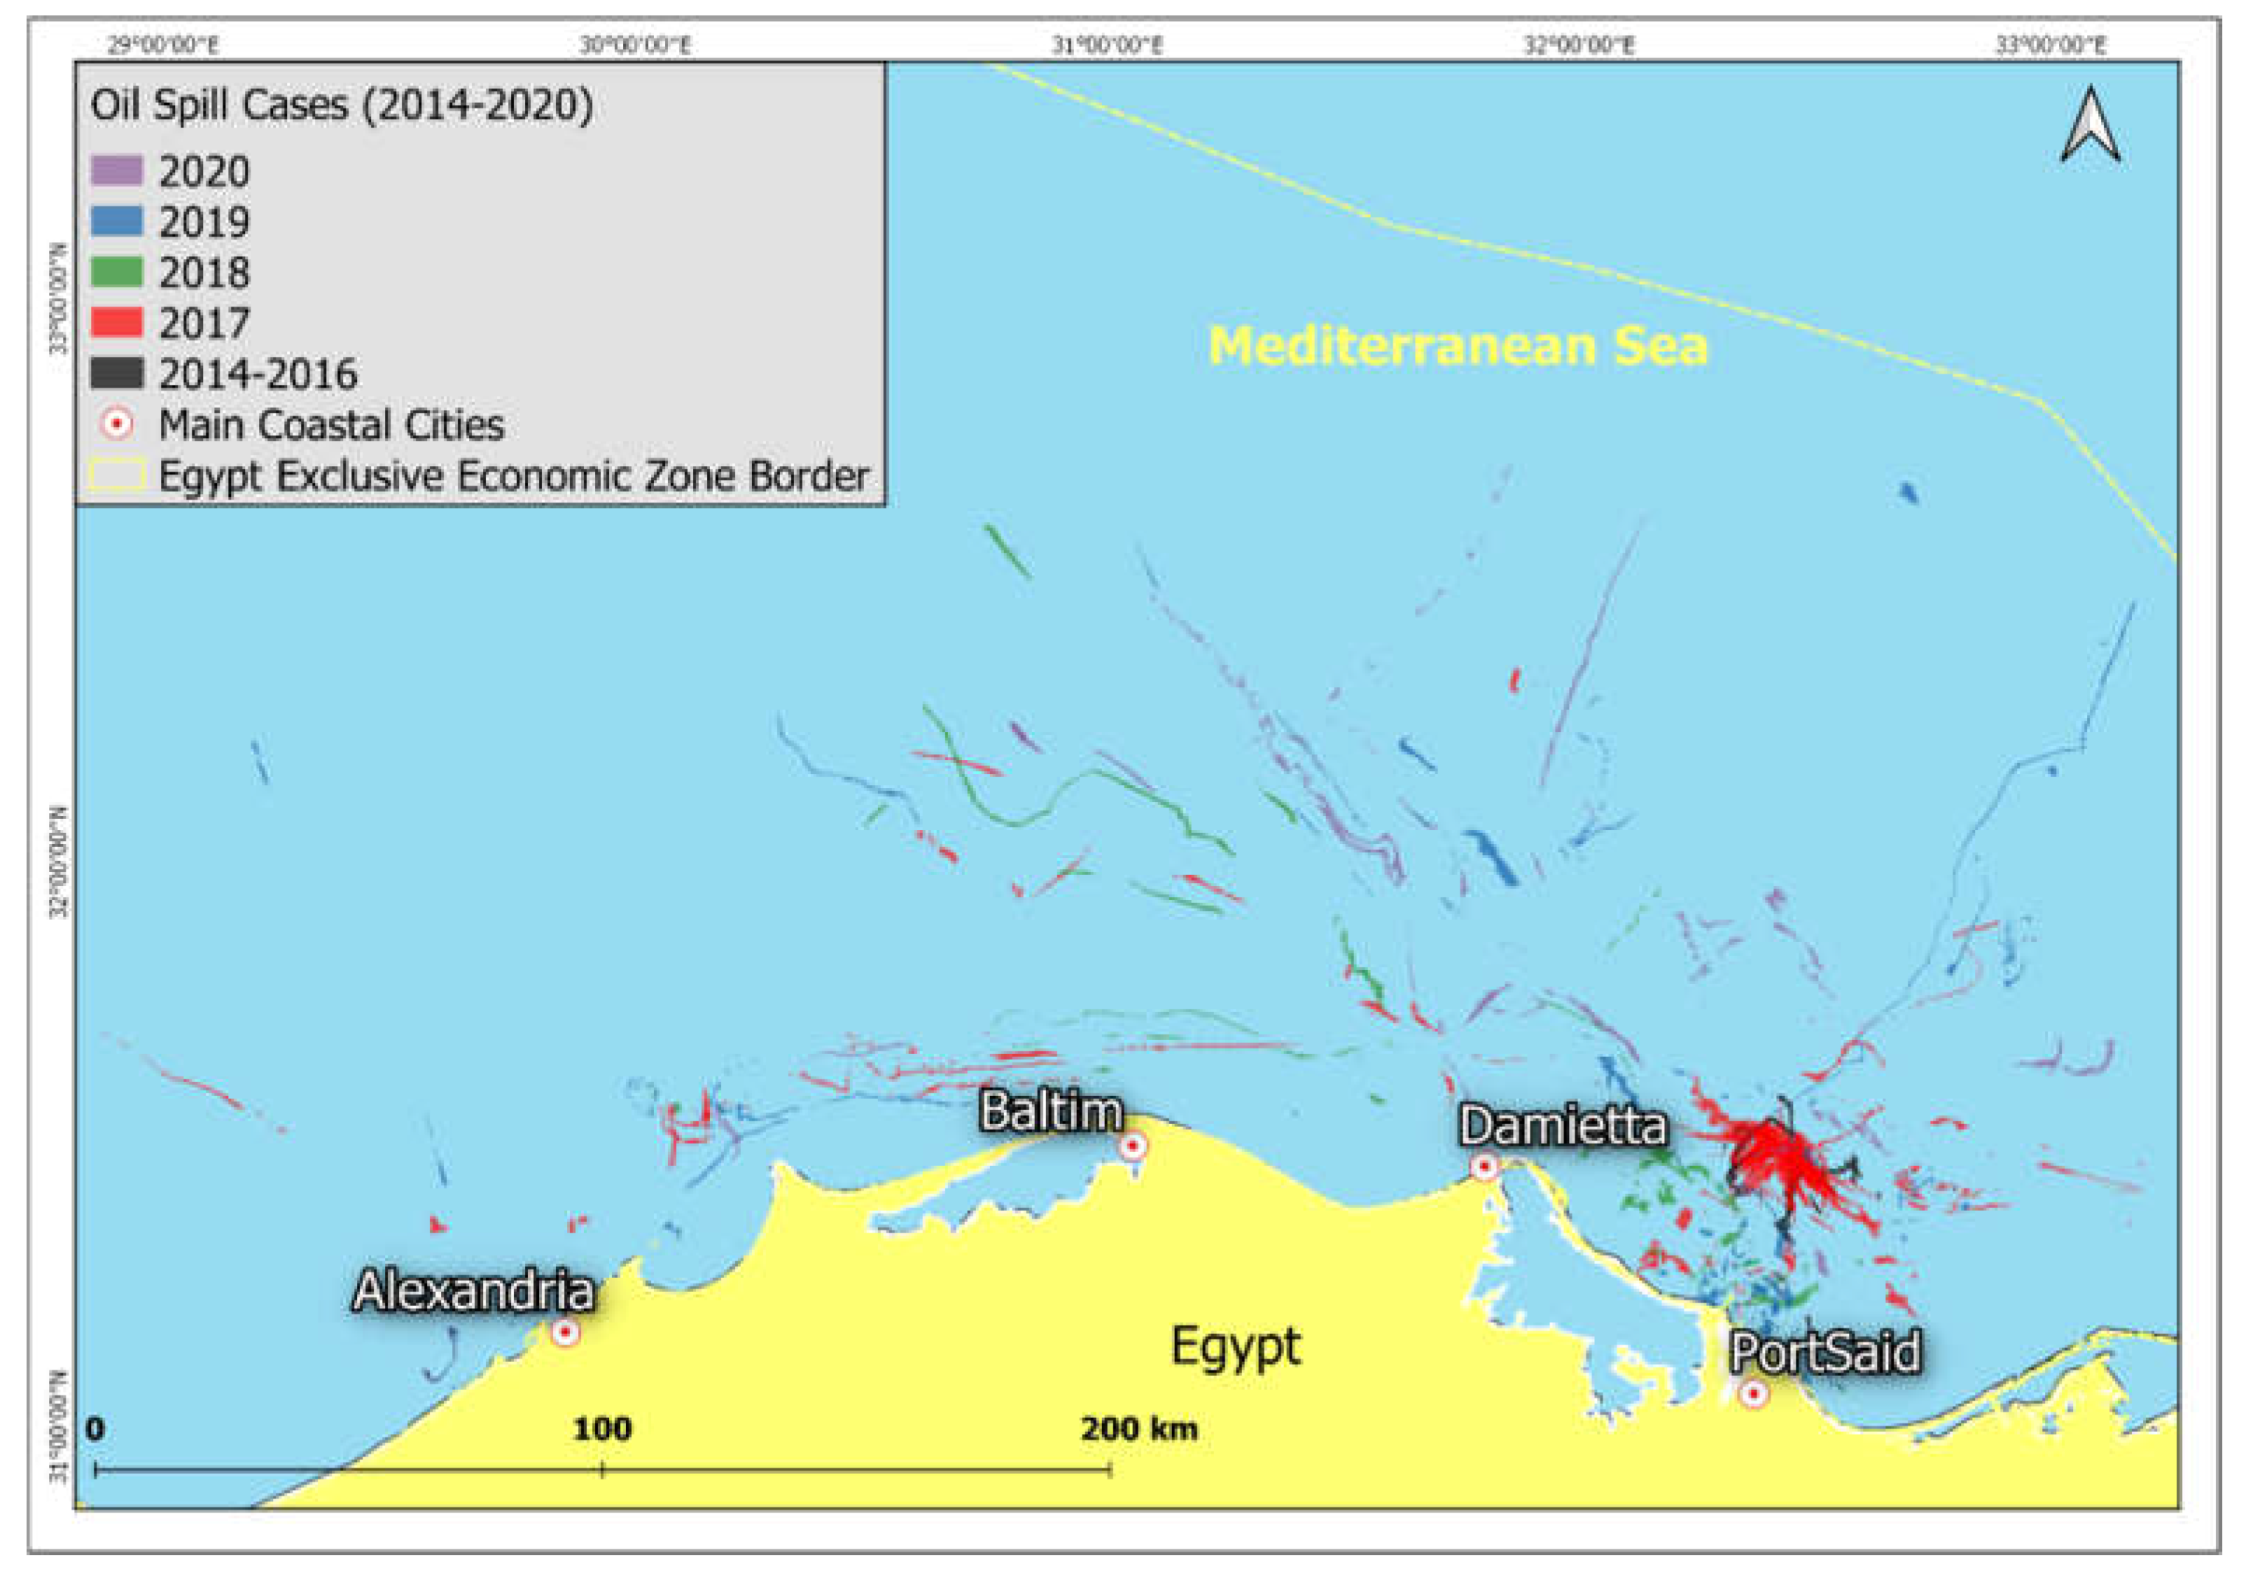
2.1. Study Area
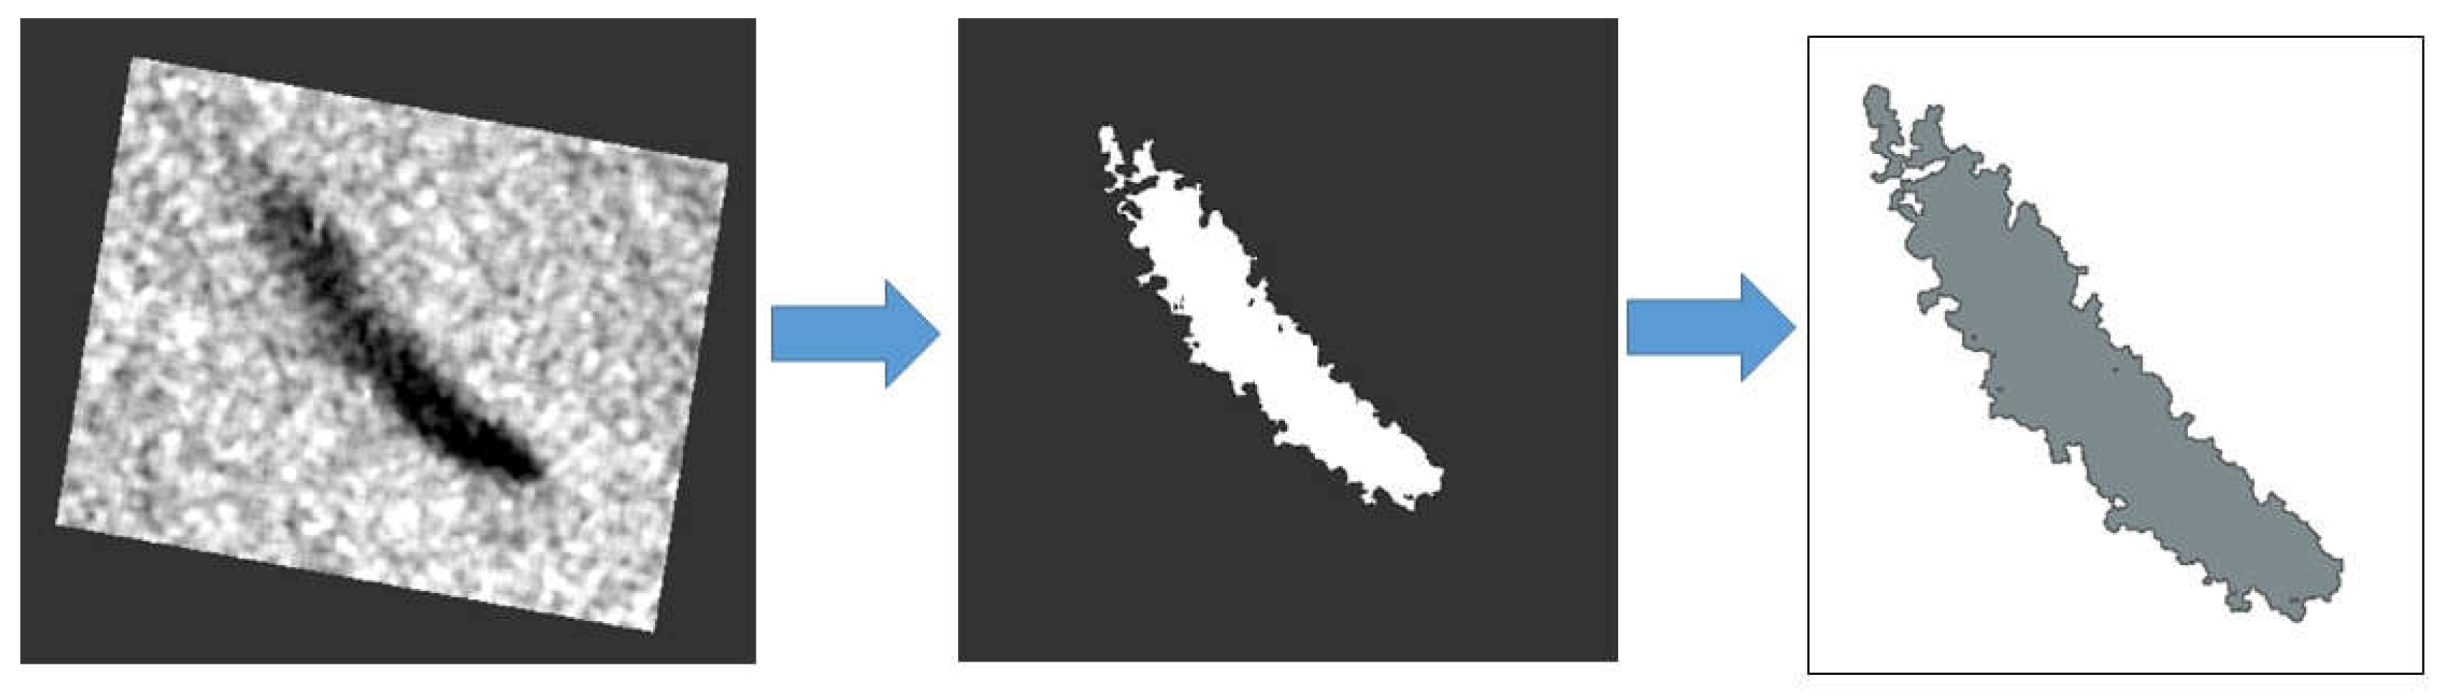
2.2. Methodology
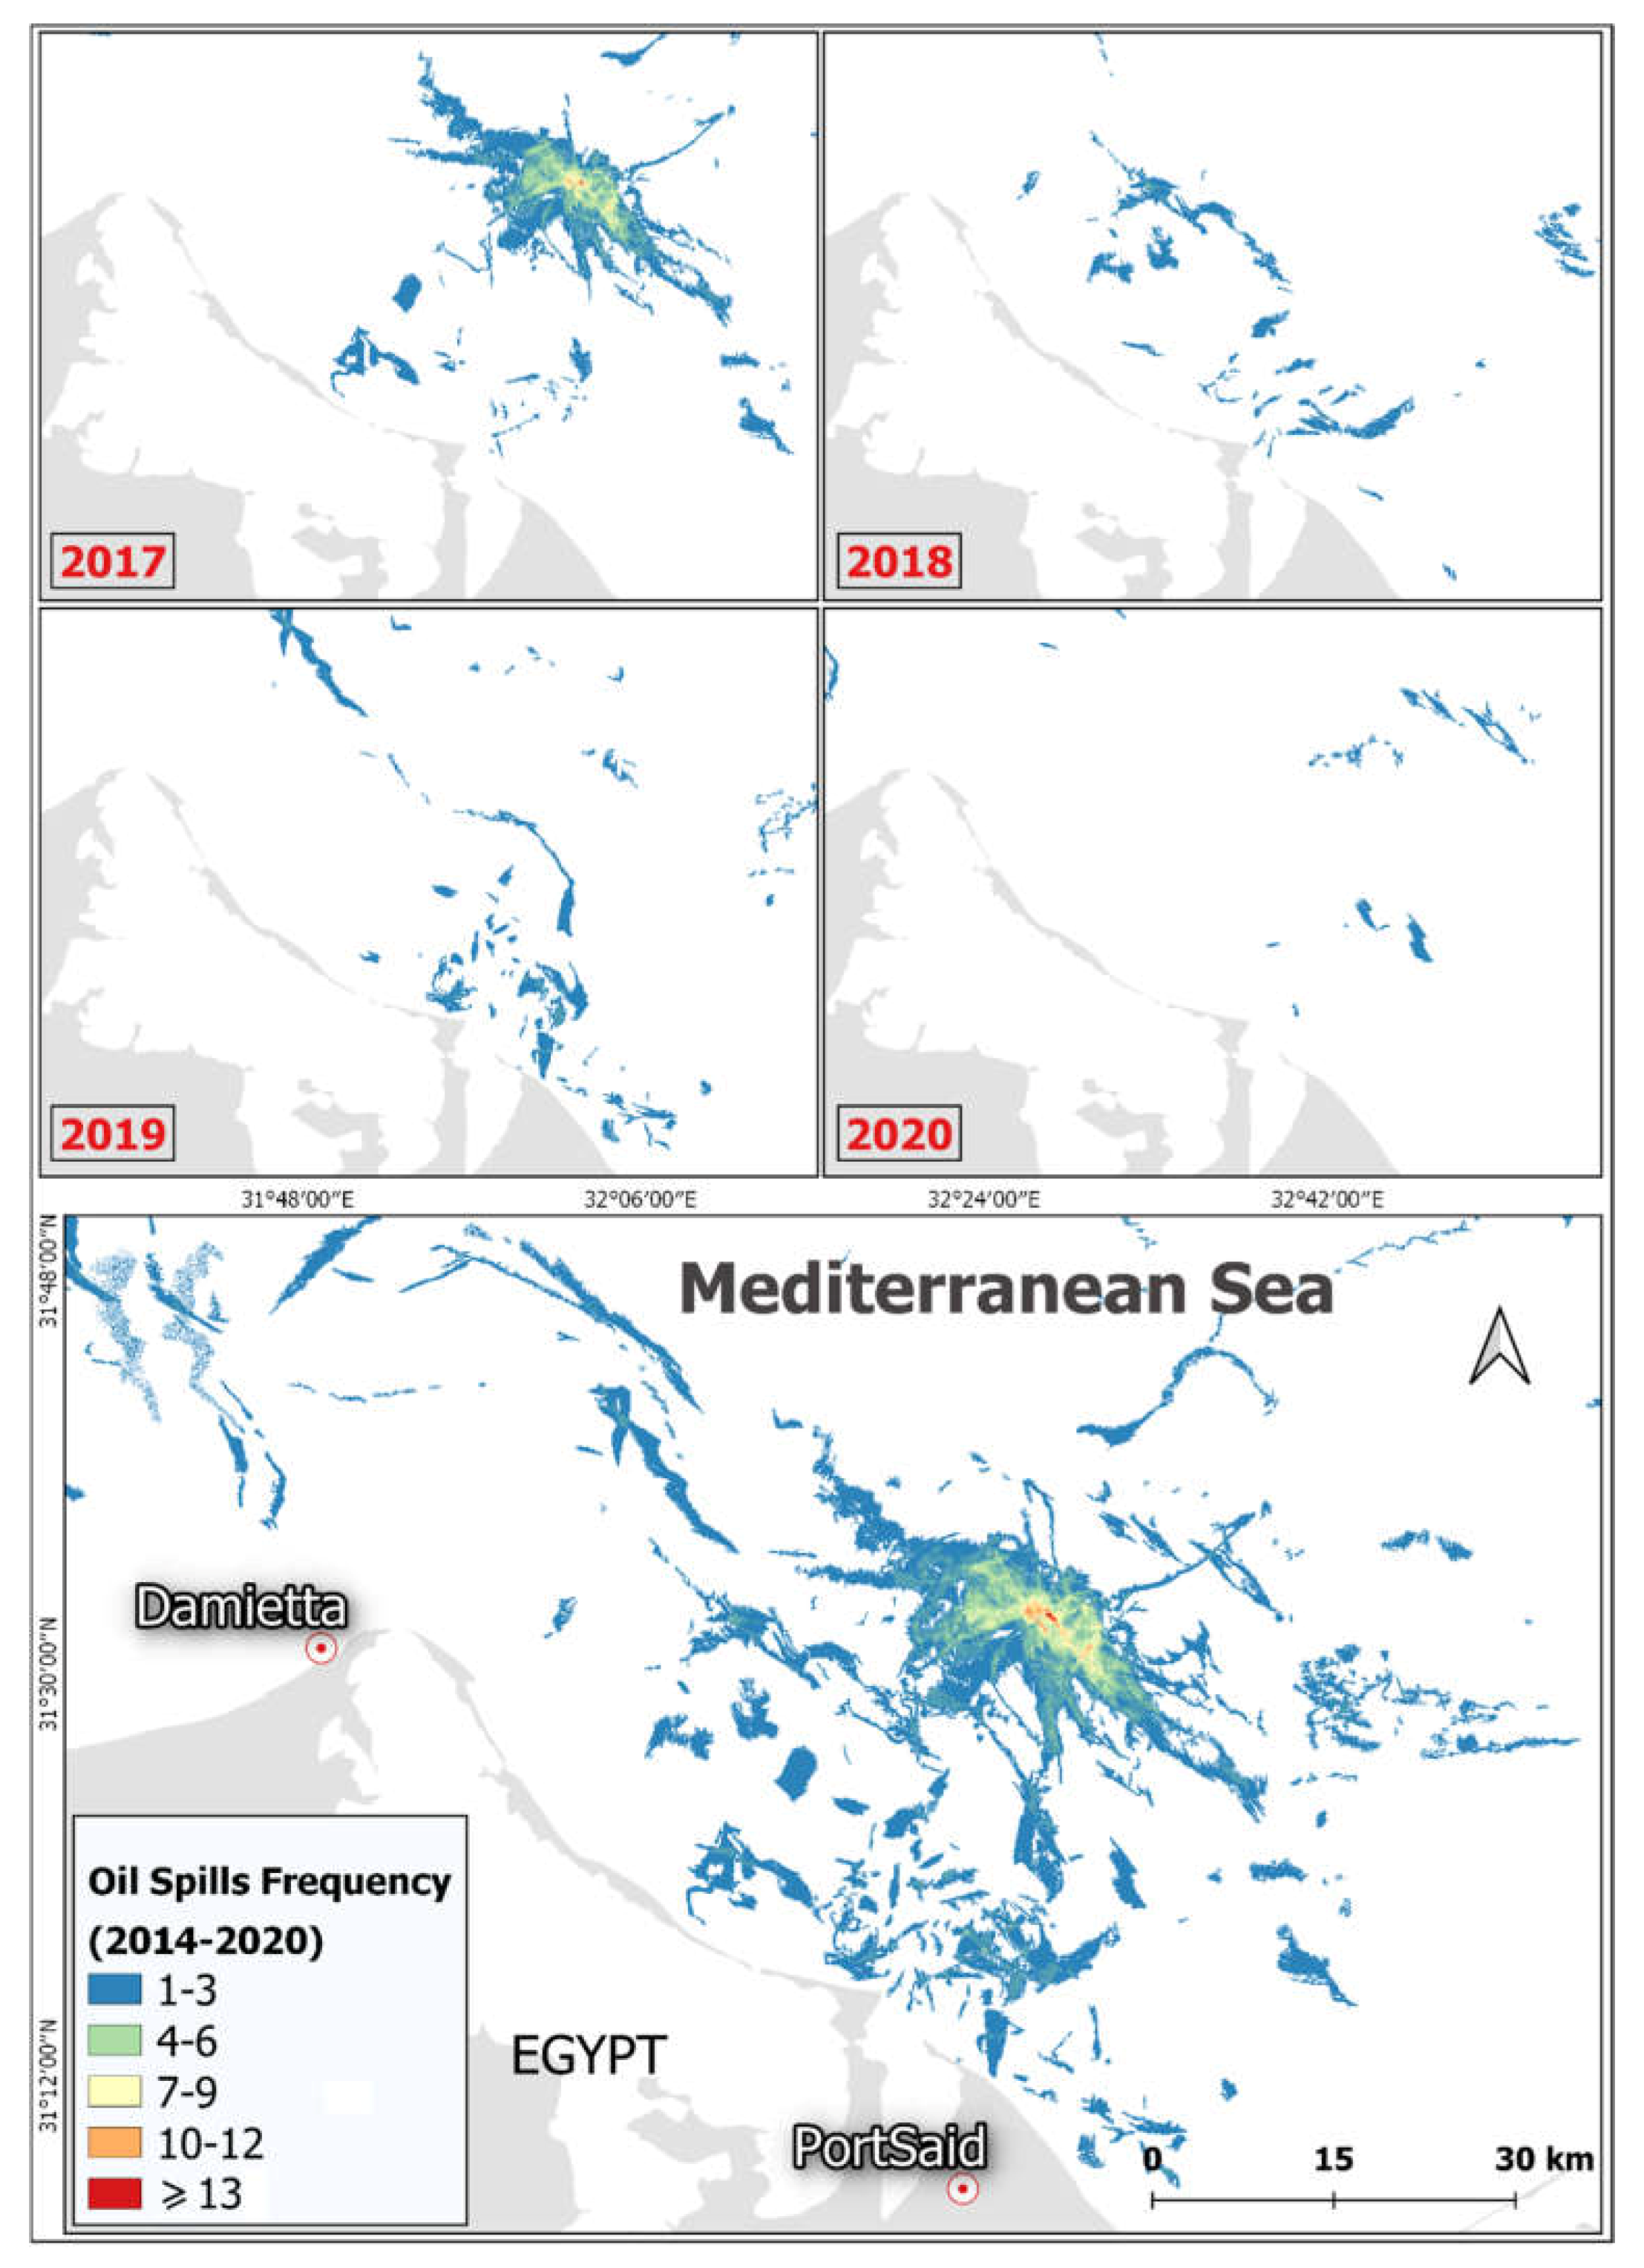
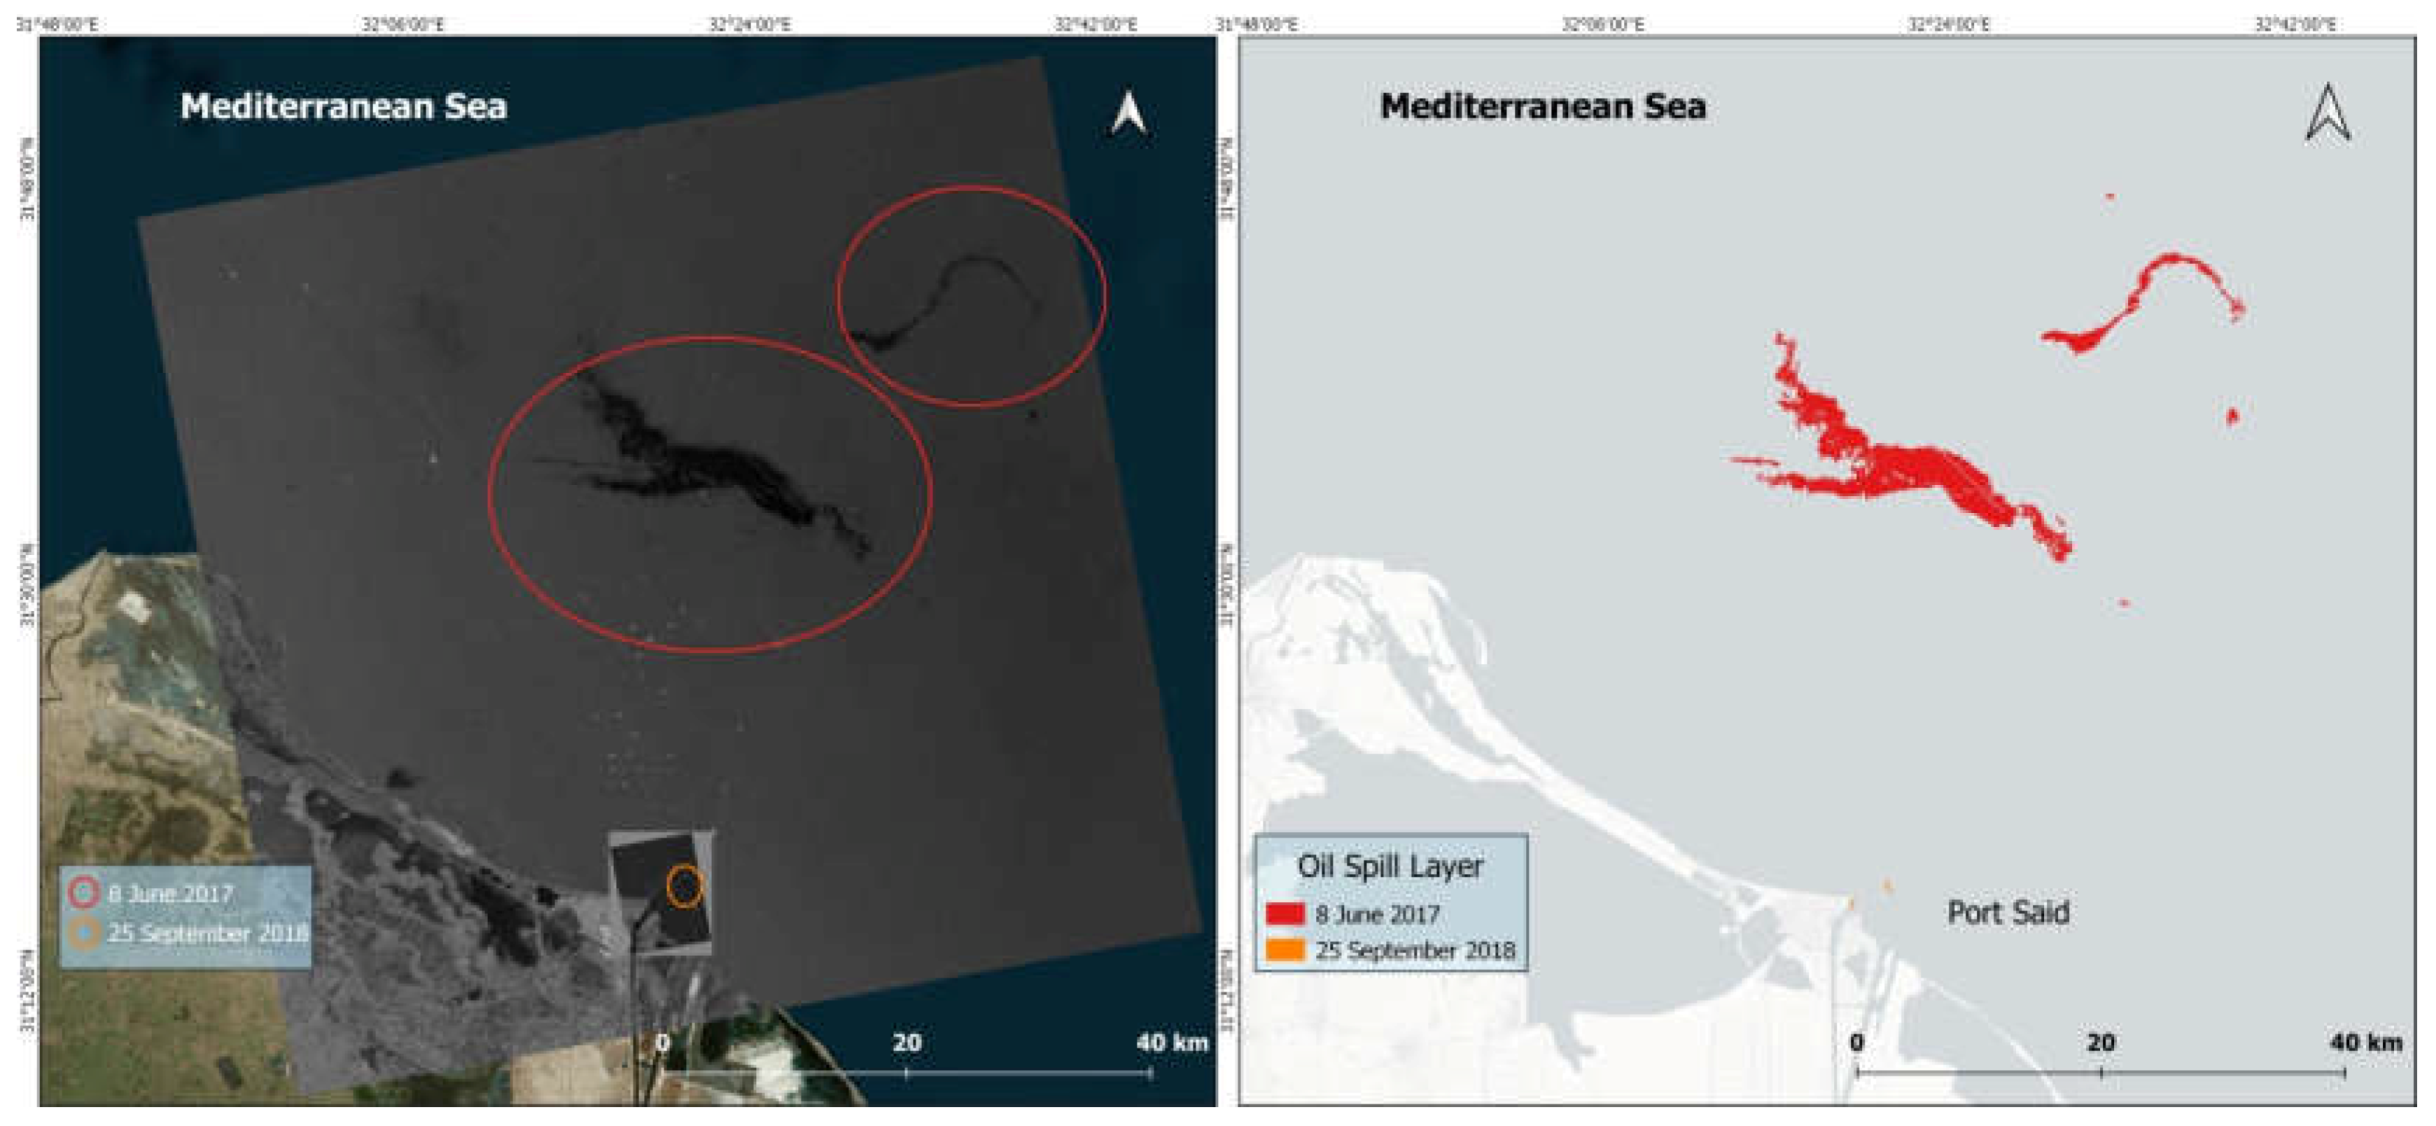
3. Results
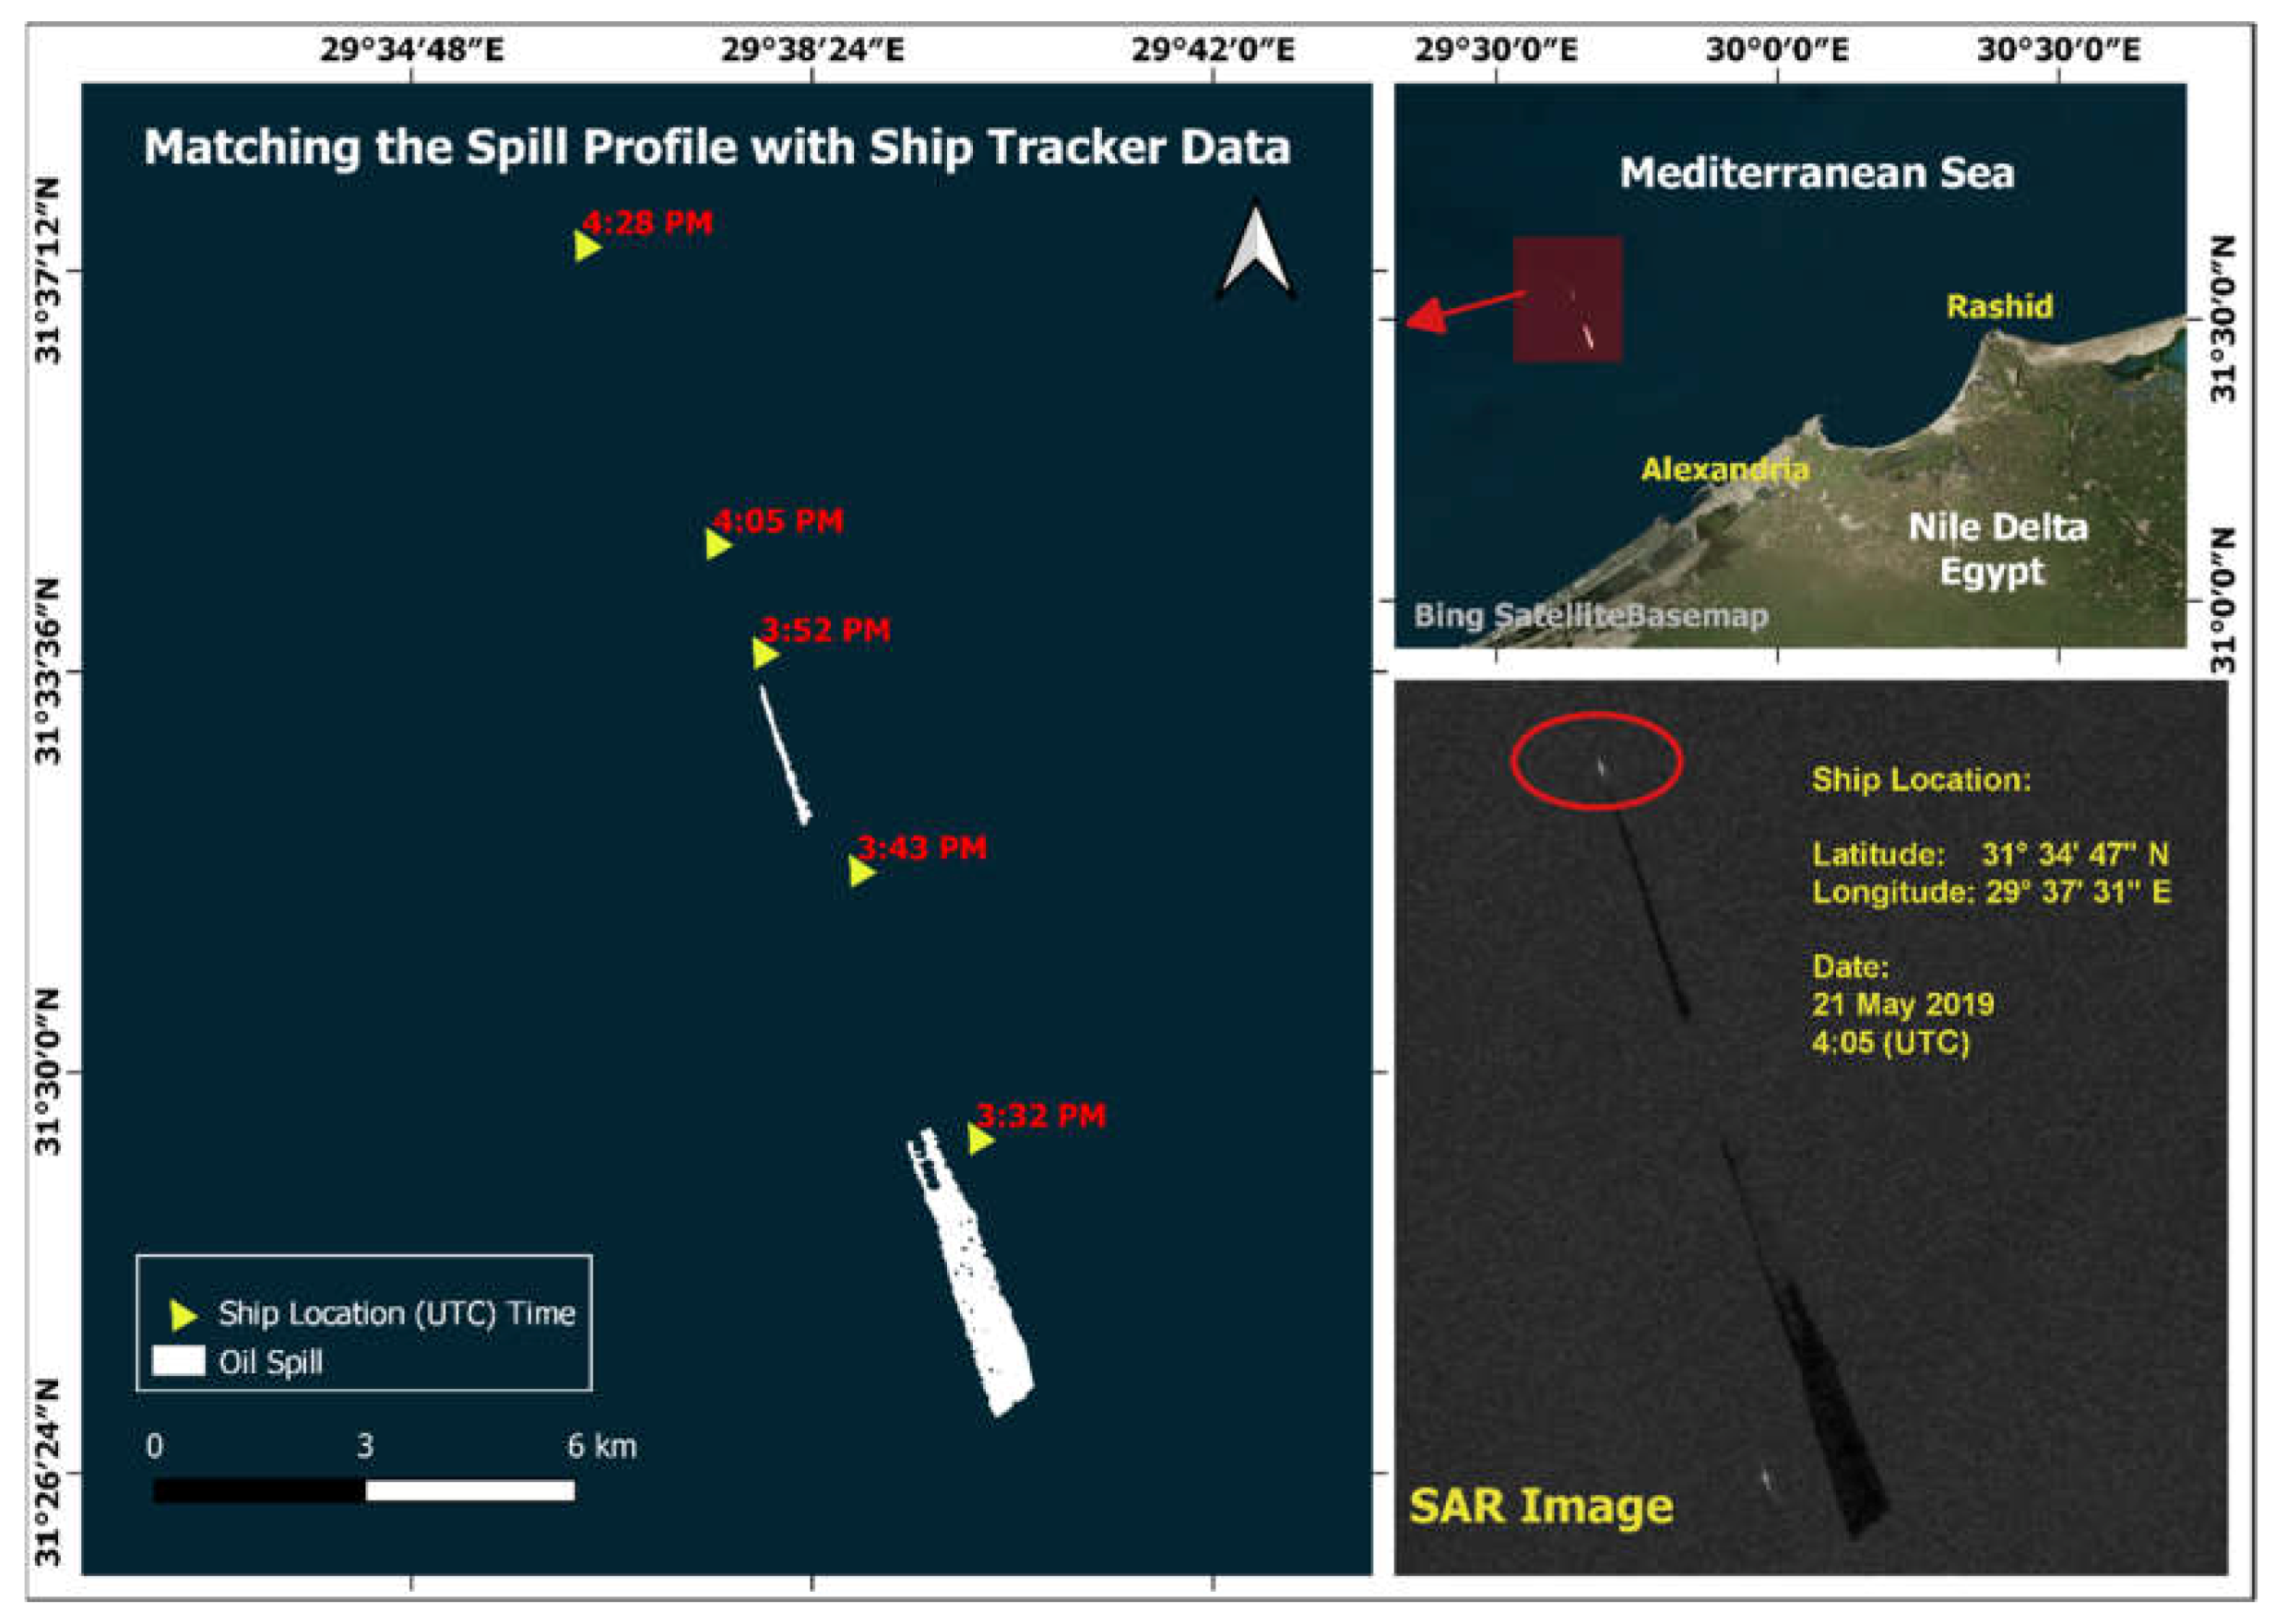
4. Validation
5. Discussion
6. Conclusions
Author Contributions
Funding
Institutional Review Board Statement
Informed Consent Statement
Acknowledgments
Conflicts of Interest
Appendix A

| ID | Date | Nearest City | Area (km2) | Frequency | Data Source |
|---|---|---|---|---|---|
| 1 | 4 October 2014 | Port Said | 26.41 | 1 | Sentinel-1 |
| 2 | 2 April 2015 | Port Said | 4.01 | 1 | Sentinel-1 |
| 3 | 19 April 2015 | Port Said | 24.15 | 1 | Sentinel-1 |
| 4 | 26 April 2015 | Port Said | 11.33 | 1 | Sentinel-1 |
| 5 | 19 July 2015 | Port Said | 6.22 | 1 | Sentinel-1 |
| 6 | 6 August 2016 | Port Said | 17.6 | 1 | Sentinel-1 |
| 7 | 3 January 2017 | Port Said | 7.83 | 1 | Sentinel-1 |
| 8 | 16 January 2017 | Baltim | 8.22 | 3 | Sentinel-1 |
| 9 | 20 January 2017 | Baltim | 25.02 | 2 | Sentinel-1 |
| 10 | 21 January 2017 | Port Said | 4.24 | 1 | Sentinel-1 |
| 11 | 2 February 2017 | Port Said | 13.01 | 1 | Sentinel-1 |
| 12 | 6 February 2017 | Alexandria | 6.95 | 1 | Sentinel-1 |
| 13 | 7 February 2017 | Port Said | 1.11 | 1 | Sentinel-1 |
| 14 | 8 February 2017 | Port Said | 2.51 | 1 | Sentinel-1 |
| 15 | 9 February 2017 | Port Said | 5.14 | 1 | Sentinel-1 |
| 16 | 19 February 2017 | Rasheed | 58.69 | 3 | Sentinel-1 |
| 17 | 20 February 2017 | Port Said | 2.67 | 1 | Sentinel-1 |
| 18 | 26 February 2017 | Port Said | 2.29 | 1 | Sentinel-1 |
| 19 | 4 March 2017 | Port Said | 12.35 | 3 | Sentinel-1 |
| 20 | 10 March 2017 | Port Said | 5.91 | 2 | Sentinel-1 |
| 21 | 29 March 2017 | Port Said | 10.89 | 1 | Sentinel-1 |
| 22 | 3 April 2017 | Port Said | 16.73 | 3 | Sentinel-1 |
| 23 | 8 April 2017 | Port Said | 26.19 | 2 | Sentinel-1 |
| 24 | 9 April 2017 | Port Said | 12.42 | 2 | Sentinel-1 |
| 25 | 15 April 2017 | Baltim | 10.05 | 1 | Sentinel-1 |
| 26 | 21 April 2017 | Port Said | 30.28 | 1 | Sentinel-1 |
| 27 | 22 April 2017 | Port Said | 17.12 | 3 | Sentinel-1 |
| 28 | 27 April 2017 | Port Said | 12.09 | 2 | Sentinel-1 |
| 29 | 2 May 2017 | Rasheed | 12.04 | 2 | Sentinel-1 |
| 30 | 3 May 2017 | Port Said | 19.88 | 1 | Sentinel-1 |
| 31 | 9 May 2017 | Port Said | 79.32 | 1 | Sentinel-1 |
| 32 | 16 May 2017 | Port Said | 64.65 | 3 | Sentinel-1 |
| 33 | 21 May 2017 | Port Said | 39.75 | 1 | Sentinel-1 |
| 34 | 26 May 2017 | Port Said | 28.22 | 1 | Sentinel-1 |
| 35 | 27 May 2017 | Port Said | 16.96 | 2 | Sentinel-1 |
| 36 | 1 June 2017 | Damietta | 22.53 | 2 | Sentinel-1 |
| 37 | 2 June 2017 | Port Said | 7.83 | 1 | Sentinel-1 |
| 38 | 8 June 2017 | Port Said | 93.98 | 2 | Sentinel-1 |
| 39 | 8 July 2017 | Port Said | 18.01 | 1 | Sentinel-1 |
| 40 | 9 July 2017 | Port Said | 5.11 | 1 | Sentinel-1 |
| 41 | 15 July 2017 | Port Said | 38.27 | 2 | Sentinel-1 |
| 42 | 20 July 2017 | Port Said | 21.16 | 1 | Sentinel-1 |
| 43 | 25 July 2017 | Baltim | 16.86 | 2 | Sentinel-1 |
| 44 | 26 July 2017 | Baltim | 12.28 | 1 | Sentinel-1 |
| 45 | 13 August 2017 | Baltim | 15.08 | 1 | Sentinel-1 |
| 46 | 26 August 2017 | Damietta | 6.56 | 2 | Sentinel-1 |
| 47 | 13 September 2017 | Baltim | 13.16 | 1 | Sentinel-1 |
| 48 | 29 September 2017 | Rasheed | 6.5 | 1 | Sentinel-1 |
| 49 | 1 October 2017 | Port Said | 3.71 | 3 | Sentinel-1 |
| 50 | 15 November 2017 | Alexandria | 19.53 | 2 | Sentinel-1 |
| 51 | 30 December 2017 | Port Said | 29.87 | 2 | Sentinel-1 |
| 52 | 9 January 2018 | Damietta | 45.22 | 3 | Sentinel-1 |
| 53 | 10 January 2018 | Port Said | 9.08 | 3 | Sentinel-1 |
| 54 | 28 January 2018 | Port Said | 20.73 | 3 | Sentinel-1 |
| 55 | 15 February 2018 | Baltim | 49.68 | 1 | Sentinel-1 |
| 56 | 28 February 2018 | Baltim | 18.06 | 3 | Sentinel-1 |
| 57 | 5 March 2018 | Port Said | 9.71 | 1 | Sentinel-1 |
| 58 | 17 March 2018 | Port Said | 3.36 | 3 | Sentinel-1 |
| 59 | 18 March 2018 | Port Said | 2.36 | 1 | Sentinel-1 |
| 60 | 23 March 2018 | Rasheed | 3.43 | 1 | Sentinel-1 |
| 61 | 28 April 2018 | Baltim | 16.3 | 2 | Sentinel-1 |
| 62 | 3 May 2018 | Port Said | 22 | 5 | Sentinel-1 |
| 63 | 21 May 2018 | Rasheed | 7.05 | 3 | Sentinel-1 |
| 64 | 22 May 2018 | Port Said | 7.59 | 3 | Sentinel-1 |
| 65 | 3 July 2018 | Port Said | 8.63 | 1 | Sentinel-1 |
| 66 | 27 August 2018 | Damietta | 11.25 | 2 | Sentinel-1 |
| 67 | 19 September 2018 | Baltim | 12.53 | 2 | Sentinel-1 |
| 68 | 20 September 2018 | Port Said | 1.8 | 2 | Sentinel-1 |
| 69 | 25 September 2018 | Port Said | 0.3 | 2 | Sentinel-1 |
| 70 | 18 November 2018 | Port Said | 3.42 | 3 | Sentinel-1 |
| 71 | 19 November 2018 | Port Said | 18.01 | 1 | Sentinel-1 |
| 72 | 10 January 2019 | Port Said | 2.46 | 1 | Sentinel-1 |
| 73 | 6 February 2019 | Alexandria | 20.46 | 3 | Sentinel-1 |
| 74 | 23 February 2019 | Port Said | 27.42 | 4 | Sentinel-1 |
| 75 | 18 March 2019 | Port Said | 4.61 | 1 | Sentinel-1 |
| 76 | 4 April 2019 | Rasheed | 21.02 | 1 | Sentinel-1 |
| 77 | 5 April 2019 | Port Said | 4.68 | 1 | Sentinel-1 |
| 78 | 6 April 2019 | Port Said | 4.42 | 2 | Sentinel-1 |
| 79 | 11 April 2019 | Port Said | 2.16 | 1 | Sentinel-1 |
| 80 | 18 May 2019 | Port Said | 2.05 | 1 | Sentinel-1 |
| 81 | 21 May 2019 | Alexandria | 4.64 | 1 | Sentinel-1 |
| 82 | 22 May 2019 | Port Said | 1.31 | 3 | Sentinel-1 |
| 83 | 23 May 2019 | Port Said | 19.86 | 2 | Sentinel-1 |
| 84 | 16 June 2019 | Rasheed | 6.08 | 2 | Sentinel-1 |
| 85 | 4 July 2019 | Port Said | 1.06 | 2 | Sentinel-1 |
| 86 | 11 July 2019 | Port Said | 12.12 | 3 | Sentinel-1 |
| 87 | 23 July 2019 | Port Said | 7.06 | 4 | Sentinel-1 |
| 88 | 4 August 2019 | Port Said | 19.28 | 2 | Sentinel-1 |
| 89 | 10 August 2019 | Port Said | 9.24 | 2 | Sentinel-1 |
| 90 | 21 August 2019 | Port Said | 24.92 | 4 | Sentinel-1 |
| 91 | 22 August 2019 | Damietta | 31.35 | 5 | Sentinel-1 |
| 92 | 27 August 2019 | Port Said | 1.83 | 2 | Sentinel-1 |
| 93 | 27 August 2019 | Alexandria | 7.79 | 2 | Sentinel-1 |
| 94 | 28 August 2019 | Damietta | 51.64 | 2 | Sentinel-1 |
| 95 | 21 September 2019 | Port Said | 41.33 | 1 | Sentinel-1 |
| 96 | 1 October 2019 | Rasheed | 15.88 | 4 | Sentinel-1 |
| 97 | 2 October 2019 | Port Said | 12.02 | 5 | Sentinel-1 |
| 98 | 8 October 2019 | Damietta | 17.73 | 2 | Sentinel-1 |
| 99 | 20 October 2019 | Port Said | 1.79 | 3 | Sentinel-1 |
| 100 | 1 November 2019 | Rasheed | 16.93 | 2 | Sentinel-1 |
| 101 | 7 November 2019 | Port Said | 0.69 | 1 | Sentinel-1 |
| 102 | 24 March 2020 | Damietta | 29.55 | 1 | Sentinel-1 |
| 103 | 30 March 2020 | Baltim | 8.11 | 1 | Sentinel-1 |
| 104 | 22 April 2020 | Alexandria | 12.16 | 2 | Sentinel-1 |
| 105 | 24 April 2020 | Damietta | 7.11 | 4 | Sentinel-1 |
| 106 | 29 May 2020 | Baltim | 8.05 | 1 | Sentinel-1 |
| 107 | 12 June 2020 | Baltim | 8.05 | 1 | Sentinel-1 |
| 108 | 17 June 2020 | Damietta | 9.1 | 1 | Sentinel-1 |
| 109 | 5 July 2020 | Baltim | 7.62 | 1 | Sentinel-1 |
| 110 | 28 July 2020 | Damietta | 19.05 | 1 | Sentinel-1 |
| 111 | 20 August 2020 | Marsa Matruh | 12.68 | 1 | Sentinel-1 |
| 112 | 26 August 2020 | Rasheed | 10.24 | 1 | Sentinel-1 |
| 113 | 27 September 2020 | Damietta | 69.42 | 1 | Sentinel-1 |
| 114 | 21 October 2020 | Damietta | 65.33 | 1 | Sentinel-1 |
| 115 | 26 October 2020 | Port said | 21.16 | 3 | Sentinel-1 |
| 116 | 27 October 2020 | Port Said | 39.59 | 5 | Sentinel-1 |
| Sum | 116 Dates | 1964 km2 | 218 Spill |
References
- Abou El-Magd, I.; Zakzouk, M.; Abdulaziz, A.M.; Ali, E.M. The Potentiality of Operational Mapping of Oil Pollution in the Mediterranean Sea near the Entrance of the Suez Canal Using Sentinel-1 SAR Data. Remote Sens. 2020, 12, 1352. [Google Scholar] [CrossRef] [Green Version]
- Fingas, M.F.; Charles, J. The Basics of Oil Spill Cleanup; Lewis Publishers: Boca Raton, FL, USA, 2001; ISBN 1566705371 9781566705370 9781420032598 1420032593. [Google Scholar]
- Becker, R. MARPOL 73/78: An Overview in International Environmental Enforcement. Geo. Int’l Envtl. L. Rev. 1997, 10, 625. [Google Scholar]
- Fingas, M.; Brown, C.E. A Review of Oil Spill Remote Sensing. Sensors 2018, 18, 91. [Google Scholar] [CrossRef] [PubMed] [Green Version]
- Simonett, D.S. Remote Sensing with Imaging Radar: A Review; Springer: Berlin/Heidelberg, Germany, 1970; Volume 2. [Google Scholar]
- Egypt’s Oil Spill Preparedness | Egypt Oil & Gas-Part 9968. Available online: https://egyptoil-gas.com/features/egypts-oil-spill-preparedness/9968/ (accessed on 28 March 2020).
- Kostianoy, A.G.; Carpenter, A. History, sources and volumes of oil pollution in the Mediterranean Sea. In Oil Pollution in the Mediterranean Sea: Part I; Springer: Berlin/Heidelberg, Germany, 2018; pp. 9–31. [Google Scholar]
- REMPEC-MEDESS-4MS. Available online: https://medgismar.rempec.org/# (accessed on 18 April 2020).
- Satellite Based Services-CleanSeaNet Service-EMSA-European Maritime Safety Agency. Available online: http://www.emsa.europa.eu/csn-menu.html (accessed on 10 June 2021).
- Ferraro, G.; Bernardini, A.; David, M.; Meyer-Roux, S.; Muellenhoff, O.; Perkovic, M.; Tarchi, D.; Topouzelis, K. Towards an operational use of space imagery for oil pollution monitoring in the Mediterranean basin: A demonstration in the Adriatic Sea. Mar. Pollut. Bull. 2007, 54, 403–422. [Google Scholar] [CrossRef] [PubMed]
- Zodiatis, G.; Coppini, G.; Perivoliotis, L.; Lardner, R.; Alves, T.; Pinardi, N.; Liubartseva, S.; De Dominicis, M.; Bourma, E.; Sepp Neves, A.A. Numerical modeling of oil pollution in the eastern mediterranean sea. In Handbook of Environmental Chemistry; Springer: Berlin/Heidelberg, Germany, 2018; Volume 83, pp. 215–254. [Google Scholar]
- Mediterranean 2017 Quality Status Report. Available online: https://www.medqsr.org/background-ci19 (accessed on 30 December 2020).
- Nunziata, F.; Gambardella, A.; Migliaccio, M. On the Mueller scattering matrix for SAR sea oil slick observation. IEEE Geosci. Remote Sens. Lett. 2008, 5, 691–695. [Google Scholar] [CrossRef]
- Gens, R. Oceanographic applications of SAR remote sensing. GIScience Remote Sens. 2008, 45, 275–305. [Google Scholar] [CrossRef]
- Richards, J.A. Remote Sensing with Imaging Radar; Springer: Berlin/Heidelberg, Germany, 2009; Volume 1, ISBN 9783642020193. [Google Scholar]
- El-Magd, I.A.; El Kafrawy, S.; Farag, I. Detecting oil spill contamination using airborne hyperspectral data in the River Nile, Egypt. Open J. Mar. Sci. 2014, 4, 140. [Google Scholar] [CrossRef] [Green Version]
- Kostianoy, A.G.; Carpenter, A. Oil and gas exploration and production in the mediterranean sea. In Handbook of Environmental Chemistry; Springer: Berlin/Heidelberg, Germany, 2018; Volume 83, pp. 53–77. [Google Scholar]
- Kostianaia, E.A.; Kostianoy, A.; Lavrova, O.Y.; Soloviev, D.M. Oil pollution in the Northern Red Sea: A threat to the marine environment and tourism development. In Environmental Remote Sensing in Egypt; Springer: Berlin/Heidelberg, Germany, 2020; pp. 329–362. [Google Scholar]


| Date | Location | Accident Type | Pollution Size | Ship Name, Type |
|---|---|---|---|---|
| 1 September 1982 | Alexandria | Grounding | 0 | NORTRANS ENTERPRISE, Bulk carrier |
| 31 May 1987 | Sidi Kerir term. | Cargo transfer failure | 60 | VERGO, Oil tanker |
| 8 August 1987 | Suez Canal | Grounding | <7 | PEACEVENTURE L., Oil tanker |
| 30 March 1989 | Sidi Kerir | Cargo transfer failure | 300 | ESSO PICARDIE, Oil tanker |
| 14 April 1992 | Sidi Kerir | Cargo transfer failure | 200 | OLYMPIC STAR, Oil tanker |
| 27 October 1992 | Port Said | Collision | 350 | SOHEIR, Oil tanker |
| 9 November 1992 | Sidi Kerir | Other | <7 | ROSARIO DEL MAR, Oil tanker |
| 21 February 1993 | Off Sidi Kerir | Engine breakdown | <7 | CARLOVA, Oil tanker |
| 2 July 1994 | Alexandria | Grounding | <7 | SEAOATH, Oil tanker |
| 30 October 1995 | Alexandria | Grounding | <7 | CAPO ARGENTO, LPG carrier |
| 18 October 1997 | Off Port Said | Other | <7 | IRVING GALLOWAY, Oil tanker |
| 6 May 2000 | Abo-Qir bay,6 km from Alexandria | Sinking | 322 | DALIA S., General cargo |
| 17 June 2000 | Alexandria port | Other | <7 | CAPTAIN FOUAD, General cargo |
| 21 June 2013 | Port Said | Contact | 0 | MSC PERLE, Container carrier |
| 10 May 2013 | Port said | Other | 0 | CMA CGM ONYX, Container carrier |
| 13 September 2013 | Alexandria | Other | 1 | AHMAD-M, General cargo |
| 26 April 2017 | Alexandria, Egypt | Fire or explosion | RINELLA M, Oil tanker | |
| 10 October 2014 | 2.4 nautical miles from El Dakheila | Grounding | 0 | LONG BRIGHT |
| 21 May 2017 | Idku, Egypt | Grounding | SCHILLPLATE, General cargo | |
| 19 May 2016 | 140.389 off Alexandria | Other | 1 | Oil/bulk/ore Tug boat |
| 6 March 2015 | 11.5 miles south-west of the island of Kythira | Engine or machinery breakdown | 0 | FT ODIN, Any other type |
| 12 June 2015 | Alexandria Port | Other | 1 | ALEX |
| 12 March 2014 | Alexandria (EGY) inner anchor | Engine or machinery breakdown | 0 | GENCO RELIANCE |
| 16 March 2014 | Alexandria | Hull structural failure | 0 | CEYLAN |
| City | Number of Processed Scenes | Total Pollution Area (km2) | Number of Pollution Cases |
|---|---|---|---|
| Port Said | 71 | 1107 | 136 |
| Damietta | 13 | 386 | 27 |
| Baltim | 15 | 229 | 23 |
| Rasheed | 10 | 158 | 20 |
| Alexandria | 6 | 71 | 11 |
| Marsa Matruh | 1 | 13 | 1 |
| Total | 116 | 1964 | 218 |
Publisher’s Note: MDPI stays neutral with regard to jurisdictional claims in published maps and institutional affiliations. |
© 2021 by the authors. Licensee MDPI, Basel, Switzerland. This article is an open access article distributed under the terms and conditions of the Creative Commons Attribution (CC BY) license (https://creativecommons.org/licenses/by/4.0/).
Share and Cite
El-Magd, I.A.; Zakzouk, M.; Ali, E.M.; Abdulaziz, A.M. An Open Source Approach for Near-Real Time Mapping of Oil Spills along the Mediterranean Coast of Egypt. Remote Sens. 2021, 13, 2733. https://doi.org/10.3390/rs13142733
El-Magd IA, Zakzouk M, Ali EM, Abdulaziz AM. An Open Source Approach for Near-Real Time Mapping of Oil Spills along the Mediterranean Coast of Egypt. Remote Sensing. 2021; 13(14):2733. https://doi.org/10.3390/rs13142733
Chicago/Turabian StyleEl-Magd, Islam Abou, Mohamed Zakzouk, Elham M. Ali, and Abdulaziz M. Abdulaziz. 2021. "An Open Source Approach for Near-Real Time Mapping of Oil Spills along the Mediterranean Coast of Egypt" Remote Sensing 13, no. 14: 2733. https://doi.org/10.3390/rs13142733
APA StyleEl-Magd, I. A., Zakzouk, M., Ali, E. M., & Abdulaziz, A. M. (2021). An Open Source Approach for Near-Real Time Mapping of Oil Spills along the Mediterranean Coast of Egypt. Remote Sensing, 13(14), 2733. https://doi.org/10.3390/rs13142733